

Submitted:
29 March 2026
Posted:
30 March 2026
You are already at the latest version
Abstract
After several critical reports by the Federal Audit Office on the implementation of the energy transition followed a cost estimation of €13.3 trillion by the Scientific Service of the German Bundestag. Political “lack of alternatives” and needed CO2 reduction led to an uncoordinated activism. The resulting promotion of state-funded NGOs and their lobbying pressure ultimately prevented a clear and stringent program management. The lack of scientific understanding regarding the importance of thermodynamic potential for demand-oriented supply failed to recognize a needed energy storage. Nature’s carbon cycle and the potential generation from CO2 and H2O to hydrocarbons were ignored, however this is the solution. The foreseeable financial collapse of the entire concept lies in the thermodynamically superfluous mandatory energy savings and the infrastructure rebuilding to avoid CO2 emissions. However, the use of renewable gaseous hydrocarbons as energy storage enables the continued use of the existing natural gas infrastructure and only requires recirculation of the raw material CO2 without further investments. The results already available today for the renewable feed-in proof the advantages of a solar-powered carbon cycle economy by the rising high costs of thCost Efficient e extensive regulatory measures for stabilizing the European grid. Finally the carbon cycle economy could save around €10 trillion and operating costs comparable to LNG.
Keywords:
carbon cycle economy
; energy storage
; cost estimation
1. Introduction
The current situation of the German energy transition is clearly described by the Federal Audit Office in its statement [1] “The federal government is investing billions in climate protection. However, it does not know how successful its investments are and whether they are worthwhile. It lacks a procedure for measuring the effectiveness and efficiency of its climate protection measures.” This statement by this respected independent government institution is very worrying. It shows that there is an urgent need for action to completely restructure the entire German energy transition program, as there are more examples like this as [2,3]. The political demand for Germany to take on a moral and scientific leadership role served the purpose of obtaining substantial budgets, but neglected the technological risks [4]. This lack of technological interest was accompanied by a complete overestimation of the relevance of the statements made by one-sidedly ecologically oriented economists. At the same time, the financial world has seized the monopoly on solutions through the CO2 price, but is now hastily abandoning the ESG rules it formulated itself. The industry’s dwindling confidence in Germany as a business location today urgently requires a thorough review of what has been neglected. The latest cost estimate by the German Bundestag’s scientific service [5] for the energy transition, at €13.3 trillion, makes it imperative to focus on technological and economic feasibility. The urgent need for a complete review from the outset is illustrated in Figure 1, which compares project phases, responsibilities, and costs.
The timeline of each project shows that the main responsibility for content and thus costs lies at the very beginning, while the costs incurred only become apparent much later after these decisions have been made. The warnings issued by the German Federal Audit Office are therefore serious and clearly directed at politicians. The following remarks are intended to identify solutions for ensuring affordability through a new system approach while at the same time guaranteeing the reliability and resilience of the renewable energy system.
Since the procedures for such large-scale technology projects are largely unknown to the public, the basic approach will first be presented and compared with the processes of the energy transition to date. This analysis is based on the results of our own studies [6,7,8,9,10,11] on a carbon cycle economy, its economic efficiency, and the application of these results to the goals of the energy transition, as presented in the following sections.
2. The Maneuverability of Renewable Energy Supply as a Basis for Planning
The availability of fossil fuels provided the necessary thermodynamic potential to power 19th-century machines with a just-in-time energy supply and was the basis for the rise of industrialized society.
Renewable feed-in is electrical work that turns into waste heat if it is not used immediately or converted into a storable thermodynamic potential such as a synthetic fuel. It therefore makes sense to use the creation of fossil fuels as a blueprint for the production of renewable synthetic fuels [12]. Figure 2 illustrates this idea.
Similar to the formation of fossil fuels, the natural carbon cycle can be replicated at high process speeds using solar cells, CO2, H2O, and a gas generator to produce synthesis gas (CH4, C2H4, etc.), resulting in a closed carbon cycle using the existing natural gas network. The advantage of this concept is that the current fossil fuel-based infrastructure can continue to be used with relatively little effort. The focus of the considerations is therefore on the synthesis of methane (CH4) and ethylene (C2H4).
The policy of “decarbonization” in conjunction with the promotion of a seemingly inexhaustible potential for renewable energies, which only needed to be used appropriately [13], led to a focus on the development of renewable electricity generators based on solar and wind energy, as well as on the statutory increase in energy efficiency for all consumers [4]. The effects of the enormous uncertainty of feed-in, especially from wind turbines, were neglected, and energy storage did not become a priority. Obviously, no one was aware of the thermodynamic consequences of failing to take thermodynamic potentials into account, as there still seemed to be enough power plants available for security. As a result, this issue did not attract public attention.
The first professional step in the decision-making process is to define the most important technical specifications of one’s own goals step by step and to check the basic feasibility. In short, this requires the following steps to define the framework, initially at the current status.
- The estimated future annual primary energy consumption, including raw material supply, is 3,400 TWh and final energy is 2,380 TWh based on energy data from the German Federal Ministry of Economics (BMWi) [14].
- According to [14], the estimated required output of the solar or alternative wind power plants to be built, with 1,000 full-load hours (FLh) for solar plants, results in an installation requirement of 3.4 GW, or alternatively, with 2,000 FLh, an installation requirement of 1.7 GW for wind power plants, based on the average values from [14] for the years 2015 to 2020 for wind power with 1,897 FLh and for photovoltaics with 959 FLh and their projection from the year 2050.
- The calculation of the space required for solar installations is based on the yield value of 0.2 kW/m² [8]. No reliable design data could be determined for wind turbines [8]. Since wind power is the significantly more expensive technology, whose maturity in terms of planning values lags behind that of solar energy and for which, in contrast to solar energy, no reliable reference values for the annual feed-in curve can be specified, no argument for this technology in Germany was found from a purely technical point of view. However, this does not rule it out entirely.
- A comparison of the land area required for solar power plants with already sealed areas in Germany shows that approximately 35% of the sealed areas are sufficient to ensure a complete solar supply without further land consumption [8].
- With its storage facilities, natural gas supply already provides an initial benchmark for the storage requirements needed to achieve a secure energy supply. The capacity of German natural gas storage facilities covers 27.6% of demand, while the European average is 33.5%. Demand coverage is the ratio of storage capacity to annual demand. With an annual primary energy consumption of 3400 TWh and the above-mentioned demand coverage, between 938.4 and 1139 TWh must be stored [8].
For comparison with the current planning, no realistic and detailed total cost estimates were available for the entire “target architecture of the German energy transition.” However, the Agora Energiewende studies on the costs of the electricity system [15], and additional estimates of our own provide an initial impression. This scenario is referred to here as “Agora,” while our own scenario of a solar-based carbon cycle economy is referred to as “Solar100.” The cost estimate for the plants used in Agora [15] based on the year 2050 is also used in Solar100 to ensure the same base values.
Agora assumes a primary energy demand of 3,647 TWh as the starting point (based on 2018) and a target value for 2050 of 1,848 TWh. The primary energy demand is thus to be reduced to 50.7% of the baseline value. Final energy demand must fall from 2,490 TWh to 1,584 TWh in 2050. Primary energy utilization is to increase from 68% to 86%. Although primary energy demand is mentioned in the overall data, the interesting area of “renewable energies” is only specified in general terms as 1,474.3 TWh, without further details. End customers’ electricity demand is specified as 706.2 TWh in the overall scenario. The Agora scenario only covers electricity supply with 873 TWh. A reserve supply with hydrogen power plants and batteries is planned with a storage capacity of 84.6 TWh. Although primary energy demand and targets are specified, there is no overview of implementation and total costs. For this reason, only Agora’s electricity generation sector has been taken into account below, which is sufficient for understanding purposes.
The closed carbon cycle (CCC) as the technical basis of the carbon cycle economy consists of an electrochemical gas generator, which is supplied from CO2 storage facilities and, if necessary, H2O storage facilities, and delivers CH4/ C2H4 and O2 as products, as well as downstream consumers. If the downstream consumers are fuel cells, air can be supplied as an oxidizing agent due to internal separation processes; in combustion processes in thermal plants, these must also be supplied with O2. Both processes produce CO2 and, if not supplied externally, H2O as reactants to the storage facility, as shown in Figure 3.
When there is a surplus of renewable energy available in the grid as excess electricity, CH4/C2H4 and O2 are produced and stored. If the renewable electricity feed-in does not reach the required grid load, the downstream consumers are supplied from the CH4/C2H4 storage facility for the generation of electricity and heat. In purely thermal processes, O2 is burned in plants with oxyfuel burners and, as with fuel cells, a CO2-H2O mixture is produced as exhaust gas. The combination of gas production and gas utilization in the same cycle provides O2 as a by-product of gas production, eliminating the need for expensive O2 procurement. The currently relatively low efficiency can be improved clearly. Figure 4 provides a brief overview of proposed solutions for significantly increasing efficiency.
The current low efficiency is due to deficiencies in thermal design, system integration, and energy recovery [16,17]. The most important problem to be solved is the intrinsic loss of 15% caused by the use of electricity to evaporate the supplied water, which can only used in the gas phase to produce H2. H2O electrolysis is the first process stage and the synthesis reactor for CH4/ C2H4 production is the second stage. A further reduction in efficiency in the synthesis of CH4/ C2H4 occurs during O2 removal in this stage. The right-hand side of the image refers to gas synthesis for the production of CH4 as an example (the synthesis of C2H4 is similar). According to the basic reaction equation:
4𝐻2+𝐶𝑂2=𝐶𝐻4+2𝐻2𝑂
2 H2 must be supplied to synthesize CH4, and an additional 2 H2 to form 2 H2O with O2 to prevent reverse reactions. The H2O formed in this way is condensed and CH4 is released. The condenser can be used as a heat source to partially recover the condensation heat with heat pumps.
In addition, electrochemical recovery of the additional separation work at the reactor inlet is possible. The additional H2 supply can be halved by upstream CO2 electrolysis. Finally, electrochemical O2 removal from the synthesis reactor is another way to largely avoid the additional H2 supply and the associated losses [8,16,17]. The use of electricity should be limited to electrochemical conversion, and the necessary heat should be supplied by low-exergy sources in combination with heat recovery and, if necessary, heat pumps.
3. Energy Storage Options and Synthesis Gases
Since around 2020, the lack of energy storage facilities in Germany has become apparent, and batteries and hydrogen are seen as interesting solutions. Figure 5 provides an overview of the possible use of various fuel gases in the German gas storage facilities currently available.
The figure clearly shows that the use of H2 reduces energy storage capacity by about four times compared to natural gas, while ethylene (ethen) increases it by about four times. Since the European natural gas supply is functioning reliably, its operating experience is important in determining the extent to which the various synthetic gases could meet requirements. In any case, as already noted, the German demand coverage value of 27.6% was sufficient for a high level of supply security. Therefore, the proposed planning is based on a demand coverage of 30%. The storage gases natural gas (calculated as methane CH4), hydrogen H2, and ethylene C2H4, as shown in Figure 5, are listed in Table 1, showing how the possible storage gases meet Germany’s demand coverage in the two scenarios.
It is immediately apparent that, based on the above values, H2 cannot meet demand sufficiently in any scenario. The Agora scenario achieves sufficient demand coverage in existing storage facilities with CH4 and C2H4 and Solar100 with C2H4. In photovoltaic systems, batteries are used both for peak power in the range of up to several MW and for residential systems with several kW for electricity storage. Lithium-ion batteries are mainly used here. Table 2 shows an estimate of the required storage capacity.
While the investment costs for storage in Solar 100 with gas production of 1000 TWh and electricity generation capacity of 150 GW are €700 billion, the battery costs for 100 TWh are €8 trillion. Although these costs disqualify batteries as the strategic energy storage solution of choice, they remain viable options for storing electricity in other applications. Table 3 shows the advantages and disadvantages of batteries, hydrogen, and carbon cycles for various applications.
Neither batteries nor hydrogen are suitable for strategic energy storage to provide storage capacities in the range of several 100 TWh physically and at reasonable cost [22]. With batteries, there is some uncertainty regarding the security of supply of lithium and the possibilities for economical lithium recycling. The carbon cycle is still in the development phase. The possibilities for improving overall efficiency through system integration are limited in the case of batteries, whereas in the case of hydrogen and a carbon cycle economy, they correspond to today’s energy supply with fossil fuels. In the case of batteries, the fire hazard must be taken into account, particularly in plant design and operation; otherwise, compliance with the usual plant safety requirements is sufficient. Today’s electric vehicles are based on battery technology, but with successful further development, hydrogen vehicles with nanocarbon storage could become interesting for both fuel cell and motor-driven vehicles. Hydrogen-powered space propulsion systems are standard, and applications in aviation are under development. However, a carbon cycle economy is likely to remain limited to marine propulsion. As shown in Figure 6, doubling the annual full-load hours would halve the investment costs for gas generators. In [21], options were presented for achieving this through large-scale electrical networking of solar power systems and the use of batteries as short-term storage. Storage gases are hydrogen (H2), methane (CH4), and ethylene (C2H4), or similar hydrocarbons. H2 is not very suitable for stationary applications, while CH4, the main component of natural gas, and especially C2H4 are the storage gases of choice, as shown in Figure 5 [18,19].
4. Advantages of an Integrated Gas Economy in Renewable Energy Supply
The use of the carbon cycle economy for strategic energy storage enables the economically viable implementation of the energy transition without drastic changes. The widespread use of natural gas as an energy and raw material source for industry greatly facilitates the future use of synthetic hydrocarbon gases. At the same time, the use of natural gas pipelines offers a cost-effective way to transport large amounts of energy over long distances. The current approach to the energy transition has focused on small local technologies in the kW and low MW range, which can only be connected via the power grid.
In contrast to this isolated renewable power generation, a carbon cycle economy enables additional extensive integration options. Figure 7 shows the basic structure of the energy supply and the associated connecting pipelines. The O2 demand can be met at any time by gas production. The associated supply system is structured analogously to the gas supply, but is not always necessary and is therefore not shown here. With its thermodynamic potential available at all times, the carbon cycle economy enables a secure and resilient supply of electricity and heat, additionally supplies industry with renewable hydrocarbons as raw materials, and enables the energy and material recycling of plastics.
Further options include the production of renewable fuels using CO₂ from the exhaust gases of bioenergy plants or through the integration of a hydrogen economy. The supply of renewable CH₄ and C₂H₄ enables the continued use of existing combustion plants with minor modifications required for CO₂ recirculation to the gas generators. The possibility of integrating a heat economy creates the option of a particularly efficient solution for reconversion into electricity with combined heat and power. The innovation of a carbon cycle economy thus enables the development of a sustainable infrastructure at the lowest possible cost. As the structure in Figure 7 shows, a carbon cycle economy is also an option if the required electricity is generated from nuclear energy [9]. However, it is still too early to assess the scope and electricity mix of this option today.
The much broader supply options of a carbon cycle economy compared to a world powered exclusively by electricity are in line with the existing infrastructure, and an increase in electricity use is also expected in the future. While an electricity grid is thermodynamically equivalent to a mechanical drive system, a gas grid is a transport and storage system of thermodynamic potential, which is of great importance for the resilience of the energy supply.
Heat is required in various applications such as space heating, water heating, and process heat in industry, households, and commerce. Figure 8 shows the respective requirements required for the planning of future energy systems.
The left side shows the distribution of the various heat demands in the period from 2008 to 2020 [14], and the right side shows the average monthly demand distribution between 2018 and 2021 for industry, households, and commerce [24]. On average, heat consumption is constant at around 54% of final energy, with the main consumption segments being space heating, hot water, and process heat. The seasonal fluctuation range of monthly demand is between 5 and 13% of annual demand for industry and between 2 and 16% for households and commerce. A large number of industrial plants cover their energy needs through combined heat and power (CHP). Figure 9 shows the possible electricity generation potential through CHP for various heat requirements at different electrical efficiencies with an overall efficiency of 95%.
The estimated future demand is based on final energy consumption of 2,400 TWh in accordance with the Solar 100 scenario, with the average utilization rate between 2008 and 2021.The electrical efficiency of CHP directly influences the potential electricity generation capacity because the waste heat must always cover the heat demand. Space and process heating are the most important applications with an annual electricity generation potential of 487 and 374 TWh, respectively, at an electrical efficiency of 40%, and 1147 and 881 TWh, respectively, at 60%. Undoubtedly, the Dutch “Warmte-Kracht” program, which continues to enjoy tax advantages [25] and has been at the heart of Dutch energy policy since the 1980s, could provide useful experience for Germany in this regard.
Another advantage of a gas infrastructure is its transport and storage capacity for thermodynamic potential parallel to the power lines. This offers additional transport capacity for the distribution of high local overproduction of renewable electricity using existing infrastructure. Figure 10 provides an overview.
For simplicity’s sake, the lower heating value LHV commonly used in the gas industry was used to determine the transport capacity in comparison to electricity grids. This differs only slightly from the actual correct potential work of the combustion reaction, and the difference is insignificant in terms of magnitude.
Assuming an operating time of 8000 h/a, this results in a natural gas transport capacity of > 1 GW per billion m³/a of gas transport. In fact, the capacities of long-distance pipelines in Germany are significantly higher. Statistics from the Stralsund Mining Authority [26] give the following values for pipelines: EUGAL 51.5 billion m³/a, NEL 25.5 billion m³/a, Nordstream 27.5 billion m³/a per strand, and OPAL 36 billion m³/a. For high-performance high-voltage lines, [27] values of 3.6 GW for a high-voltage direct current (HVDC) transmission line in China. The transport capacity of C₂H₄ is about four times higher than that of natural gas, so that the aforementioned pipeline capacities could achieve a transport capacity of 100 to 200 GW through the use of C₂H₄. This demonstrates the importance of the potential of the existing natural gas infrastructure for the energy transition and its security of supply. The evolutionary concept of a carbon cycle economy enables a relatively smooth and organic transition from a fossil fuel to a renewable energy supply due to the relatively simple adaptation options of very similar components.
At the same time, it is relatively easy to take appropriate measures to meet the above-mentioned security of supply requirements of the renewable supply concept. To do this, however, consideration must first be given to how security of supply could be jeopardized in the future. Our study [7] described the topic of resilience and identified the three main areas of necessary measures: concepts for ensuring cybersecurity, concepts for system resilience against EMP in the event of solar storms or nuclear explosions, and concepts for minimizing damage in the event of terrorist attacks or war. Cybersecurity is now of great importance in many sectors of the economy, with similar approaches to plant security, while the other two aspects are specifically relevant here. In [7], the possible consequences of EMP and war for aggregates and the possibilities for damage repair were described, as shown here in Table 4 and Table 5 from this source.
Recently, the danger posed by supervolcanoes and large meteorite impacts, comparable to limited nuclear wars, has also been discussed as a real possibility. Although local damage would then be irreversible, the global effects of these events are relevant to system resilience, which is referred to as “nuclear winter.” For a renewable energy system, this means that a prolonged period of “dark doldrums” is to be expected, which cannot be overcome by any storage technology alone. A carbon cycle economy can also be powered by natural gas, sometimes with adjustments, as shown in Figure 11. In the future development of energy supply, this necessary option for the resilience of renewable but vulnerable energy supply must be seriously considered.
5. Costs and Economic Efficiency of the Agora and Solar100 Scenarios
The basic data used for the economic analysis of the scenarios is summarized in the following tables. Table 6 provides an overview of the parameters used for both scenarios. The cost data used is that adopted by Agora in order to use a comparable cost basis.
The total output of the renewable electricity producers specified in both scenarios is summarized in Table 7. Multiplying this by the specific costs of the producers allows the total costs of the electricity producers to be calculated, as shown in Table 6.
According to Agora, the annual electricity supply of 873 TWh requires an investment of €363 billion. Solar100 requires an investment of €1,020 billion for an annual supply of 3,400 TWh. In the Agora scenario, €416 million/TWh must therefore be invested, and in the Solar100 scenario, €300 million/TWh. The upper part of Table 8 shows the data on electricity storage. The investment in gas generators is necessary for storage in order to utilize the existing natural gas infrastructure. The annual full-load hours of electricity feed-in are required to determine the required capacity and thus the investment. The batteries require new infrastructure. These costs are shown in the upper part of Table 8 and are used in the lower part to determine the total costs with the values from Table 7.
For Solar100, investment costs of between €1.3 and €1.7 trillion are expected, while according to Agora, the power supply alone will cost up to €2.2 trillion. This high cost increase due to batteries once again demonstrates the advantage of synthetic gas for storage. The lowest costs for gas generators due to high operating times were achieved for nuclear power plants (NPPs). The costs for renewable electricity generators rise significantly due to their significantly lower full-load hours. Investment costs have a significant impact on electricity costs and thus on the costs of synthetic gas, which replaces fuel costs. Operating costs are very low for solar and wind energy and low for nuclear power plants compared to the impact of investment costs. Figure 12 shows the impact of investment on the price of electricity, which depends on full-load hours and the depreciation period.
Solar and nuclear energy offer clear cost advantages. However, it should be noted that a nuclear power plant can supply electricity directly, while solar cells can only supply electricity for a limited time and must be integrated into systems to ensure a reliable power supply. Photovoltaic systems in Germany typically only achieve around 1,000 full-load hours per year, but investment costs have fallen significantly in recent years and continue to decline.
The most important cost advantage of a carbon cycle economy is the consistent and structured collection and use of the CO2 produced. The choice of the boundary of the system is therefore a very important aspect, as Figure 13 shows.
The system boundary around gas production shows that the CO2 emissions of the entire supply area depend solely on the renewable energy supply. On the consumer side, there are no measures that could further reduce CO2 emissions. Consequently, further legitimate legal requirements to improve the situation on the consumer side are not possible in order to reduce emissions for climate protection. Improvements to the infrastructure can therefore only be made for economic reasons without government intervention. Even without this, continuous energy improvements of the infrastructure will take place in accordance with the rules of the market economy in order to optimize costs or carry out necessary repairs.
The implementation of the Solar100 scenario to meet the requirements of the energy transition has no impact on the existing infrastructure, with the exception of the measures required to recover CO2. This means that the total costs for Solar 100 cover the total investment. The total investment for the energy transition according to the Agora scenario includes additional costs for the renovation of 22 million buildings and the renewal of the entire industrial and municipal infrastructure. Additional renovation costs of €80,000 to €200,000 per property result in total costs of €1.76 to €4.4 trillion. The additional energy renovation costs for the infrastructure are estimated to be at least of the same order of magnitude. While the investments for a carbon circular economy should amount to less than €2 trillion, the above estimate of the current concept according to Agora for the energy transition shows a maximum value of around €11 trillion. The Scientific Service of the German Bundestag reports estimates of €13.3 trillion [5].
Figure 14 shows the costs of the two different strategies and the amount of potential savings.
Implementing the Solar100 scenario would therefore enable cost savings of about €10 trillion, considering usual additional cost as well.
6. Verification of the Feasibility of the Scenarios
The current status of the German energy transition already provides performance data and costs that can be used to evaluate its progress using real data instead of forecasts. The most important assessment for the Solar100 scenario is a review of its performance in the critical months of November, December, January, and February, according to data from the Federal Network Agency (Bundesnetzagentur) [28]. The installed peak capacity of 3400 GW (calculated 3400 TWh) was examined in terms of its ability to cover a total grid demand of 173.07 TWh during this period as a reference for an annual electricity consumption of around 500 TWh. The current feed-in of the installed solar peak capacity of 47.8 GW was used as a reference for the feed-in of the examined peak capacity of PV with 3400 GW. The reference period is from November 1, 2020, to February 28, 2021.
Figure 15 shows the results. A storage capacity of 24 TWh was assumed as the starting value, which roughly corresponds to the design value of the battery storage requirement in Agora [15]. The storage associated with an installed solar peak output of 47.8 GW was empty on November 18, 2020, and the storage associated with a capacity of 500 GW was empty on November 28, 2020. The negative sign of the storage indicates the additional external feed-in required for grid stability during the period. The feed-in from Solar100 with a peak capacity of 3400 GW is delivered in three different phases: a feed-in period until November 30, 2020, followed by a phase of near equilibrium until February 1, 2021, and then a feed-in period until February 28, 2021.
The most important aspect is that the feed-in of solar energy with a peak capacity of 3,400 GW was sufficient for the average power supply at all times, even during the critical phase, and that storage remained almost stable. This indicates that the design of Solar100 should have the necessary reserves to deliver the planned final energy of 2,380 TWh, where this calculation is a principal estimation. Table 9 delivers an overview.
The rapid increase in the installation of wind and solar generators and the decommissioning of nuclear and coal-fired power plants in recent years have led to a major problem for grid stability, followed by high costs for imported electricity and low revenues for exported electricity. April 2025 was the first month in which the feed-in of solar power led to a chargeable export of surplus electricity. Electricity prices adjust over time depending on demand. While short-term fluctuations in grids with controllable power plants only occur in special cases, this is the norm for solar and especially wind power when there is insufficient storage capacity to absorb surpluses and compensate for shortages. Figure 16 shows the trend in electricity exports and the price paid for electricity at the beginning of April 2025 from 00:00 on April 2, 2025, to 16:00 on April 10, 2025, according to data from the Federal Network Agency [28].
Electricity exports from the joint electricity grid of Germany and Luxembourg to neighboring European countries are represented by the red curve, and the resulting electricity price is marked in blue. Electricity exports are generally a service for which a corresponding price must be paid. Accordingly, a market price must be paid for imports, the amount of which is indicated by a positive electricity price, which in the event of electricity shortages with peak values of -10,000 MWh leads to electricity prices of over €150/MWh. The red arrows indicate very large unregulated feed-ins from solar plants at midday in the order of +7,000 MWh, which are difficult to absorb. However, this reduction for grid stabilization must be paid for and leads to negative electricity prices, in this case up to over -100 €/MWh. The cumulative values for the period mentioned are summarized as net values in Table 10.
At €25.24/MWh, the average electricity prices for surplus solar power are significantly below the net price on the electricity exchange of €128.94/MWh. This is because only once during the period under review was a maximum price of €114.57/MWh payable, due to early April. Net imports amounted to 538.31 GWh, and at an average price of €128.94/MWh, €69.4 million had to be paid. Solar peaks reached a total volume of 153.76 GWh at a total cost of €3.9 million. This is sufficient to highlight the increasingly urgent need to improve the system integration of renewable energies (RE).
The cost difference between the redispatch costs for renewable energies (RE) and conventional power plants between July 2022 and December 2024 alone is reported at €2.9 billion [29]. This could finance gas generators with a total capacity of 6 GW, covering about 0.6% of demand. Any expansion of renewable energies without the simultaneous construction of gas generators for CH4/C2H4 and their feed-in to the natural gas grid will inevitably drive up redispatch costs further. Assuming that the “surplus electricity” would be provided free of charge, the gas generators could also refinance themselves depending on the selling price. Figure 17 summarizes the underlying data.
Assuming thermodynamically optimized gas generators, an efficiency of 90% can be expected, and with a total output of 6 GW, 5,400 GWh of gas could be generated. Depending on the achievable gas price for LNG (approx. €50/MWh) or from pipelines (€20/MWh), revenues of €280 million or €112 million could then be generated. Assuming costs of 20%, the profit would be €224 million or €89.6 million. However, better utilization of gas generators over time, as explained in [31], could also enable significantly better results.
In addition to the continued use of existing power and heat generation plants, a secure supply of synthetic gas can be used to implement more energy-efficient processes in line with the economic benefits of a carbon cycle economy. This could be achieved through fuel cell heating devices, which could relieve the load on power plants in winter, or through heat pumps in the household sector or integrated high-efficiency fuel cell concepts (SOFC-GT) [32], which have already been developed as design studies for power generation and enable very high efficiencies of 80%. With an expected improvement in the efficiency of gas production to 90% [7,17], efficiencies for reconversion into electricity comparable to those of current pumped storage power plants can be expected.
The excerpt presented here from the operating results and compensation payments already available clearly shows the importance of generating, storing, and utilizing thermodynamic potential, for example in the form of synthetic gases, in order to guarantee grid stability and supply security. While the German energy transition has led to considerable and unnecessary cost increases, no blackouts have occurred in Germany in this context to date. However, blackouts related to the feed-in of renewable electricity have already occurred on the Iberian Peninsula and in the USA, as described in [33,34,35,36], for example.
7. Conclusions and Recommendations
Current policy is based, among other things, on a hydrogen economy, without specifying how sufficient energy can be stored in existing gas storage facilities, how long-distance transport can be made cost-effective, and how production costs can be reduced.
Recent reports by the Federal Audit Office [37] and the European Court of Auditors [38], which expresses serious doubts about the success of the hydrogen strategy, has again failed to elicit any political response. At present, however, there is no change in policy regarding a new strategic approach, yet the entire economy is suffering from high energy prices, and confidence and economic power are declining dramatically.
The clear economic advantage of a carbon circular economy, in which existing industrial facilities do not need to be replaced but only adapted to achieve the targets, is not really recognized by policymakers, who are focusing on legal pressure rather than innovation. This classification is a consequence of the studies presented here, which clearly show that H2 would not satisfactorily meet any of the requirements for energy storage and transport and would incur significant additional costs. H2 cannot be used as a strategic energy storage medium in this way, but there could be future applications in transportation, from aerospace to the automotive industry where nano-carbon could become an option [39,40] and some industrial pilot projects are described in [41,42], or specific local applications where CO2 recovery is not economically viable locally. The decision to introduce a carbon circular economy as the standard system for supplying renewable energy does not conflict with the future use of hydrogen. The carbon circular economy makes it possible to separate the technical use of H2 from its storage and transport, as shown again in Figure 18.
This makes it possible to continue to exploit the advantages of hydrocarbons for transport and storage and to produce H2 as before through reforming. This does not rule out local H2 production through economically viable electrolysis, but rather expands the technical options for end users. The significant improvement for future gas generators for CH4/C2H4 can also be used to improve H2 production. The thermodynamic and economic analysis clearly shows that the political requirements regarding the simultaneous implementation of a CO2-free energy supply and a drastic increase in energy efficiency based on climate protection are not only uneconomical but also disproportionate. The carbon cycle economy presented here makes it possible to achieve climate targets with as little effort as possible and, with appropriate fact-based political support, to give the German economy the necessary upswing and long-term innovation boost. In particular, this leads to the following recommendations, which should be taken into account.
7.1. Separation of CO2 Reduction and Increase in Energy Efficiency
The decision made in [4] to link the avoidance of CO2 emissions and the increase in energy efficiency by law is understandable in the case of a fossile energy supply. However, in the case of an increasingly affordable renewable primary energy supply in a carbon cycle economy, it contradicts economic reason and is strategically wrong. The mandatory legal link between CO2 emissions and energy efficiency needs to be ended immediately before it further accelerates the decline of Germany’s industrial infrastructure.
7.2. Primary Energy Supply from Solar and Nuclear Energy
Various analyses in [6,7,9,10,43] compared to the data in [44] showed very clear cost advantages of solar power generation over wind energy in Germany. In addition to the investments, there are also lower costs for maintenance and repair, as well as the additional advantage of greater reliability in the event of major events such as storms, etc. [6]. Since about one-third of the existing sealed areas in Germany are sufficient to enable an annual electricity generation of 3400 TWh to cover primary energy demand, this supply option is particularly environmentally friendly. This can be achieved without destroying natural and agricultural landscapes or disturbing or even endangering citizens through microplastics, infrasound, noise, or shading, and without incurring high costs. Across Europe, nuclear energy will have to be accepted as the second CO2-free primary energy source for electricity generation.
7.3. Carbon Cycle Economy with Integrated Hydrogen Economy
Studies on storage requirements [7,9,44] showed that, contrary to the widespread narrative about the alleged energy storage of the power grid, etc. (“storage galore”) and despite the strategically necessary carbon cycle in open processes, hydrogen is a possible solution for the transport sector and special cases.
7.4. Sustainable Raw Material Management and Plastics Recycling
In addition to its role as an energy storage medium, synthetic C2H4 or CH4 can be used as a renewable raw material in industry. Furthermore, the field of application of the carbon cycle economy is expanding to include plastics recycling, also in connection with thermal utilization. Further developments are foreseeable here if CO2 from bio-process exhaust gases is used as a raw material for the fuel industry, thus enabling renewable fuel to be produced synthetically within the carbon cycle economy.
7.5. Industrial and Research Policy Tasks
The expansion of the German solar industry, which has been neglected for 20 years, has led to considerable damage due to a lack of positioning in a growth market. This is particularly true in connection with a secure energy storage system for a secure, sustainable energy supply. The development of highly efficient synthesis gas generators and highly efficient combined fuel cell power plants are further important aspects for reducing system costs and improving the technical and economic quality of the system.
In the field of basic research, the further in-depth application of quantum theory appears to be an important topic for both photovoltaics and catalysis, whereby the economic efficiency of future production processes must also be taken into account from the outset, supplemented by robotics, micro-process engineering, and AI. With regard to the use of hydrogen, the storage of hydrogen in nanostructured carbon appears to be an interesting option that should be pursued in collaboration with the automotive industry.
7.6. Strategic and Fiscal Policy Tasks
The implementation of the energy transition must be restructured with clear program management and clear responsibilities, for example as a program for clearly managed large-scale projects with their own budget and clearly defined milestone plans in line with the program’s progress.
7.7. Improvement of Quality Assurance
It is necessary to draw on the extensive experience of the Federal Audit Office, which was the only body to clearly point out the problems of the energy transition at an early stage, and to involve it in quality assurance. The necessary technical recommendations must also be developed in a more structured manner, without assuming that there are no alternatives. For example, expert committees must have practical industrial implementation experience, and a culture of discussion, which is currently virtually non-existent, must be improved because it is absolutely essential for achieving the goals. Effective, independent, transparent, and professional quality assurance without political interference is necessary so that citizens can regain the trust in political decisions based on it that is necessary for social cohesion.
References
- Bundesministerium der Finanzen (BMF). Einzelplan 08) Bundesministerium für Wirtschaft und Klimaschutz (BMWK) (Einzelplan 09)23 Bundesregierung muss wissen, was Klimaschutz kostet und wie er wirkt. Bundesrechnungshof Bonn. 2023. Available online: https://www.bundesrechnungshof.de/SharedDocs/Downloads/DE/Berichte/2023/ergaenzungsband-2022/bemerkung-23.pdf?__blob=publicationFile&v=2.
- Bericht nach § 99 BHO zur Umsetzung der Energiewende im Hinblick auf die Versorgungssicherheit, Bezahlbarkeit und Umweltverträglichkeit der Stromversorgung. Bundesrechnungshof Bonn. 2024. Available online: https://www.bundesrechnungshof.de/SharedDocs/Downloads/DE/Berichte/2024/energiewende-volltext.pdf?__blob=publicationFile&v=4.
- Federal Ministry for Economic Affairs and Climate Protection (BMWK) (Section 09) BMWK allocates €500 million annually largely “blind” to energy research. energy research. Date 05.04.2022 Comments 2021 Supplementary Volume No. 44. Available online: https://www.bundesrechnungshof.de/SharedDocs/Downloads/DE/Berichte/2022/bmwk-energieforschung-volltext.pdf?__blob=publicationFile&v=.
- Entwurf des integrierten nationalen Energie- und Klimaplans. Available online: https://www.bmwi.de/Redaktion/DE/Downloads/E/entwurf-des-integrierten-nationalen-energie-und-klimaplans.pdf?__blob=publicationFile&v=61.
- Brief information: Calculating the investment costs for the energy transition. WD 5-3000-135/24 (September 16, 2024) Scientific Service of the German German Bundestag Department WD 5 (Economy, Energy, and Environment). Available online: https://www.bundestag.de/resource/blob/1019134/59b54bba98e93b9fecf43013668d86b3/WD-5-135-24-pdf.pdf.
- Winkler, W.G.; Sauer, G. W. Energiewende -Chance und Risiken für Deutschland / Energy transition—opportunities and risks for Germany. November 2021. Available online: https://www.researchgate.net/publication/355978760_Energiewende_-Chance_und_Risiken_fur_DeutschlandEnergy_transition_-_opportunities_and_risks_for_Germany. [CrossRef]
- Winkler, W. G. Bedarfsdeckung mit einer integrierten CO2 emissionsfreien Kohlenstoffkreislaufwirtschaft. August 2023 DOI: 10.13140/RG.2.2.14548.78720 published as: Wolfgang G. Winkler: Bedarfsdeckung mit einer integrierten CO2 emissionsfreien Kohlenstoffkreislaufwirtschaft—Zukunftschance einer unsicheren Energiewende. In Jahrbuch Wissenschaftsfreiheit; Duncker & Humblot: 12165 Berlin, 2024; Volume 1, pp. 261–296. [Google Scholar]
- Winkler, W. G. Energy Efficient Design of Power-to-Gas Generation Systems for Circular Economy. New Energy Exploitation and Application 2025, 4(2), 124–143. [Google Scholar] [CrossRef]
- Winkler, W. G. Circular Economy for Carbon based on Power-to-Gas. 2023. [Google Scholar] [CrossRef]
- Winkler, Wolfgang G.; Gustav, W. Sauer: Das Narrativ, die Energiewende und die Industriebrache? Notwendige wirtschaftliche Gesundung mit KreislaufwirtschaftTechnical Report. 2023. [Google Scholar] [CrossRef]
- Winkler, W.G. Programmanalyse „Energiewende” und Lösungsvorschlag. March 2024. Available online: https://www.researchgate.net/publication/379144345_Programmanalyse_Energiewende_und_Losungsvorschlag. [CrossRef]
- Wolfgang Winkler: Rethinking the energy transition-“Save carbon and the climate”. Technical Report 2025. [CrossRef]
- 13. Gregor Czisch: Scenarios for future electricity supply Cost-optimized variations for supplying Europe and its neighbors with electricity from renewable. Dissertation at the Department of Electrical Engineering / Computer Science at the University of Kassel 2005. Available online: https://kobra.bibliothek.uni-kassel.de/bitstream/urn:nbn:de:hebis:34-200604119596/1/DissVersion0502.pdf.
- Energiedaten und -szenarien. Publikation: Gesamtausgabe der Energiedatfen—Datensammlung des BMWi. This extensive collection of data is no longer available on the BMWK website as a reliable source for interested citizens: https://www.bmwi.de/Redaktion/DE/Artikel/Energie/energiedatengesamtausgabe. html. Alternatively, archive.org is currently still available: https://web.archive.org/web/20220307151236/https://www.bmwi.de/Redaktion/DE/Binaer/Energiedaten/e nergiedaten-gesamt-xls.xlsx?__blob=publicationFile&v=133.
- Prognos, Öko-Institut, Wuppertal-Institut (2020): Klimaneutrales Deutschland. Studie im Auftrag von Agora Energiewende, Agora Verkehrswende und Stiftung Klimaneutralität. https://www.agoraenergiewende. de/veroeffentlichungen/klimaneutrales-deutschland/mit Klimaneutrales Deutschland 2050 Dateianhang https://www.agora-energiewende.de/veroeffentlichungen/klimaneutrales-deutschlanddatenanhang/ .
- W. Winkler: Power-to-Gas, Chances, Challenges, and Engineering Options. November 2020. Available online: https://www.researchgate.net/publication/346399261_Power-to-Gas_Chances_Challenges_and_Engineering_Options.
- W. Winkler: Power-to-Gas, Chances, Challenges, and Opportunities. November 2020. Available online: https://www.researchgate.net/publication/345178242_Power_to_Gas_Chances_Challenges_and_Options-1#fullTextFileContent.
- DVGW: Füllstände der Gasspeicher für Deutschland mit Reichweitenprognose. Available online: https://www.dvgw.de/themen/sicherheit/versorgungssicherheit-gas/fuellstaende-der-gasspeichhttps://gisanddata.maps.arcgis.com/apps/dashboards/bda7594740fd40299423467b48e9ecf6er-fuer-deutschland-mit-reichweitenprognose#/2023-04-11.
- Available online: :https://energien-speichern.de/erdgasspeicher/gasspeicherkapazitaeten/.
- Gas Infrastructure Europe-Storage Database. Available online: https://www.gie.eu/transparency/databases/ (accessed on 5 June 2025).
- Wolfgang Georg Winkler: The Energy Transition Needs to be Fixed. Technical Report. Researchgate April 2025. DOI:10.13140/RG.2.2.36364.83841https://www.researchgate.net/publication/390542496_Sanierungsfall_Energie wend.
- Robert Idle: Levelized System Cost of Electricity; Rice University Houston, TX, February 2021; Available online: https://iaee2021online.org/download/contribution/fullpaper/1145/1145%5C_fullpaper%5C_20210326%5C_222336.pdf.
- Wolfgang Georg Winkler: Theory and Application of Carbon Circular Economy on Energy Transition. Researchgate. July 2024. Available online: https://www.researchgate.net/publication/382236409_Theory_and_Application_of_Carbon_Circular_Economy_on_Energy_Transition. [CrossRef]
- Available online: http://www.bundesnetzagentur.de/DE/Gasversorgung/aktuelle_gasversorgung/_svg/GasverbrauchRLM_monatlich/Gasverbrauch_RLM_M_2023.html.
- WKK Splitsingsmethodes. REPORT. HASKONINGDHV NEDERLAND B.V.. Client: Ministry of Finance. Reference: BI8296IBRP001F01. Status: Definitive/01 Date. 11 14 2022. Available online: https://www.eerstekamer.nl/overig/20221216/onderzoeksrapport_wkk/document.
- Available online: https://www.bergamt-mv.de/themen/gashochdruckleitungen/.
- Günter Brauner: High-voltage direct current transmission as a connection in transmission grids. ETG Journal 2018, vol. 2, 66–69. Available online: https://www.vde.com/resource/blob/1788186/f911c3bb5e031a63e6518d65cfd229e5/brauner-hvdc-final-data.pdf.
- SMARD Power Generation. Available online: https://www.smard.de/page/home/wiki-article/522/636.
- Redispatch—Kosten pro MWh und Redispatchgesamtkosten seit Juli 2022. Available online: https://www.smard.de/page/home/topic-article/46/215340.
- Winkler, Wolfgang. .Technical Report. Sanierungsoption der Energiewende 10.13140/RG.2.2.34115.11046. ResearchGate. May 2025D. Available online: https://www.researchgate.net/publication/392268422_Sanierungsoption_der_Energiewende.
- Wolfgang Georg Winkler: The Energy Transition Needs to be Fixed. Technical Report. April 2025. Available online: https://www.researchgate.net/publication/390542496_Sanierung. [CrossRef]
- W. Winkler: SOFC-Integrated Power Plants for Natural Gas. Proceedings First EUROPEAN SOLID OXIDE FUEL CELL FORUM 1, Lucerne, 1994; p. 821. Available online: https://www.researchgate.net/publication/272489415_SOFC-Integrated_Power_Plants_for_Natural_Gas.
- Extreme winter weather is disrupting energy supply and demand, particularly in Texas. Today in Energy; U.S. Energy Information Administration, 19 February 2021. Available online: https://www.eia.gov/todayinenergy/detail.php?id=46836.
- Everhart, K. G. Molnar: Severe power cuts in Texas highlight energy security risks related to extreme weather events. Commentary — 18 February 2021. iea. Org. Available online: https://www.iea.org/commentaries/severe-power-cuts-in-texas-highlight-energy-security-risks-related-to-extreme-weather-events.
- Blackout in the Spanish Peninsular Electrical System the 28th of April 2025 18/06/2025. System Operation Division. red electrica, June 2025. Available online: https://d1n1o4zeyfu21r.cloudfront.net/WEB_Incident_%2028A_SpanishPeninsularElectricalSystem_18june25.pdf.
- Península—Seguimiento de la demanda de energía eléctrica. Available online: https://demanda.ree.es/visiona/peninsula/demandaau/acumulada/2025-04-28.
- Bericht nach § 99 BHO Umsetzung der Wasserstoffstrategie des BundesBundesrechnungshof Bonn. 28 October 2025. Available online: https://www.bundesrechnungshof.de/SharedDocs/Downloads/DE/Berichte/2025/wasserstoffstrategie-volltext.pdf?__blob=publicationFile&v=2.
- Security of the supply of gas in the EU. EU’s framework helped member states respond to the crisis but impact of some crisis-response measures cannot be demonstrated Special Report of the European Court of Auditors pursuant to Article 287(2) 4(2) TFEU. European Union. 2024. Available online: https://www.eca.europa.eu/ECAPublications/SR-2024-09/SR-2024-09_EN.pdf.
- Halder, P.; Babaie, M.; Salek, F.; Haque, N.; Savage, R.; Stevanovic, S.; Bodisco, T. A. Zare: Advancements in hydrogen production, storage, distribution and refuelling for a sustainable transport sector: Hydrogen fuel cell vehicles. International Journal of Hydrogen Energy 2024, Volume 52, Pages 973–1004. [Google Scholar] [CrossRef]
- Aliya Farook Badiuddin: Carbon Nanotubes: Revolutionizing Hydrogen Storage Technology. 23 Apr 2024. Available online: https://www.azonano.com/article.aspx?ArticleID=6723.
- Alice, Y. Ping: Hydrogen Storage for Automotive Applications: A Comparison. Posted. The Research Archive of Rising Scholars. Pre-print, 18 08 2024; DOI. [CrossRef]
- 8 Vehicle Manufacturers Working on Hydrogen Fuel Cell Cars Hydrogen’s Promising Impact on Local Communities / August 31, 2025. Available online: https://www.fastechus.com/blog/vehicle-manufacturers-working-on-hydrogen-fuel-cell-vehicles.
- Winkler, Wolfgang G.; Sauer, Gustav W.; Mark, C. Williams: Renewable storage evaluation and grid resilience. July 2021. Available online: https://www.researchgate.net/publication/352983209_Renewable_storage_evaluation_and_grid_resilience. [CrossRef]
- Deutscher Bundestag Wissenschaftlicher Dienst: Gestehungskosten von Strom im Vergleich. Aktenzeichen: WD 5-3000-005/22. Abschluss der Arbeit: 17.02.2022 Fachbereich: WD 5: Wirtschaft und Verkehr, Ernährung und Landwirtschaft DOI 10.5281/zenodo.6326972. Available online: https://www.bundestag.de/resource/blob/887090/1867659c1d4edcc0e32cb093ab073767/WD-5-005-22-pdf-data.pdf.
Figure 1.
Chain of responsibility for costs and reliability in the life cycle of a project.
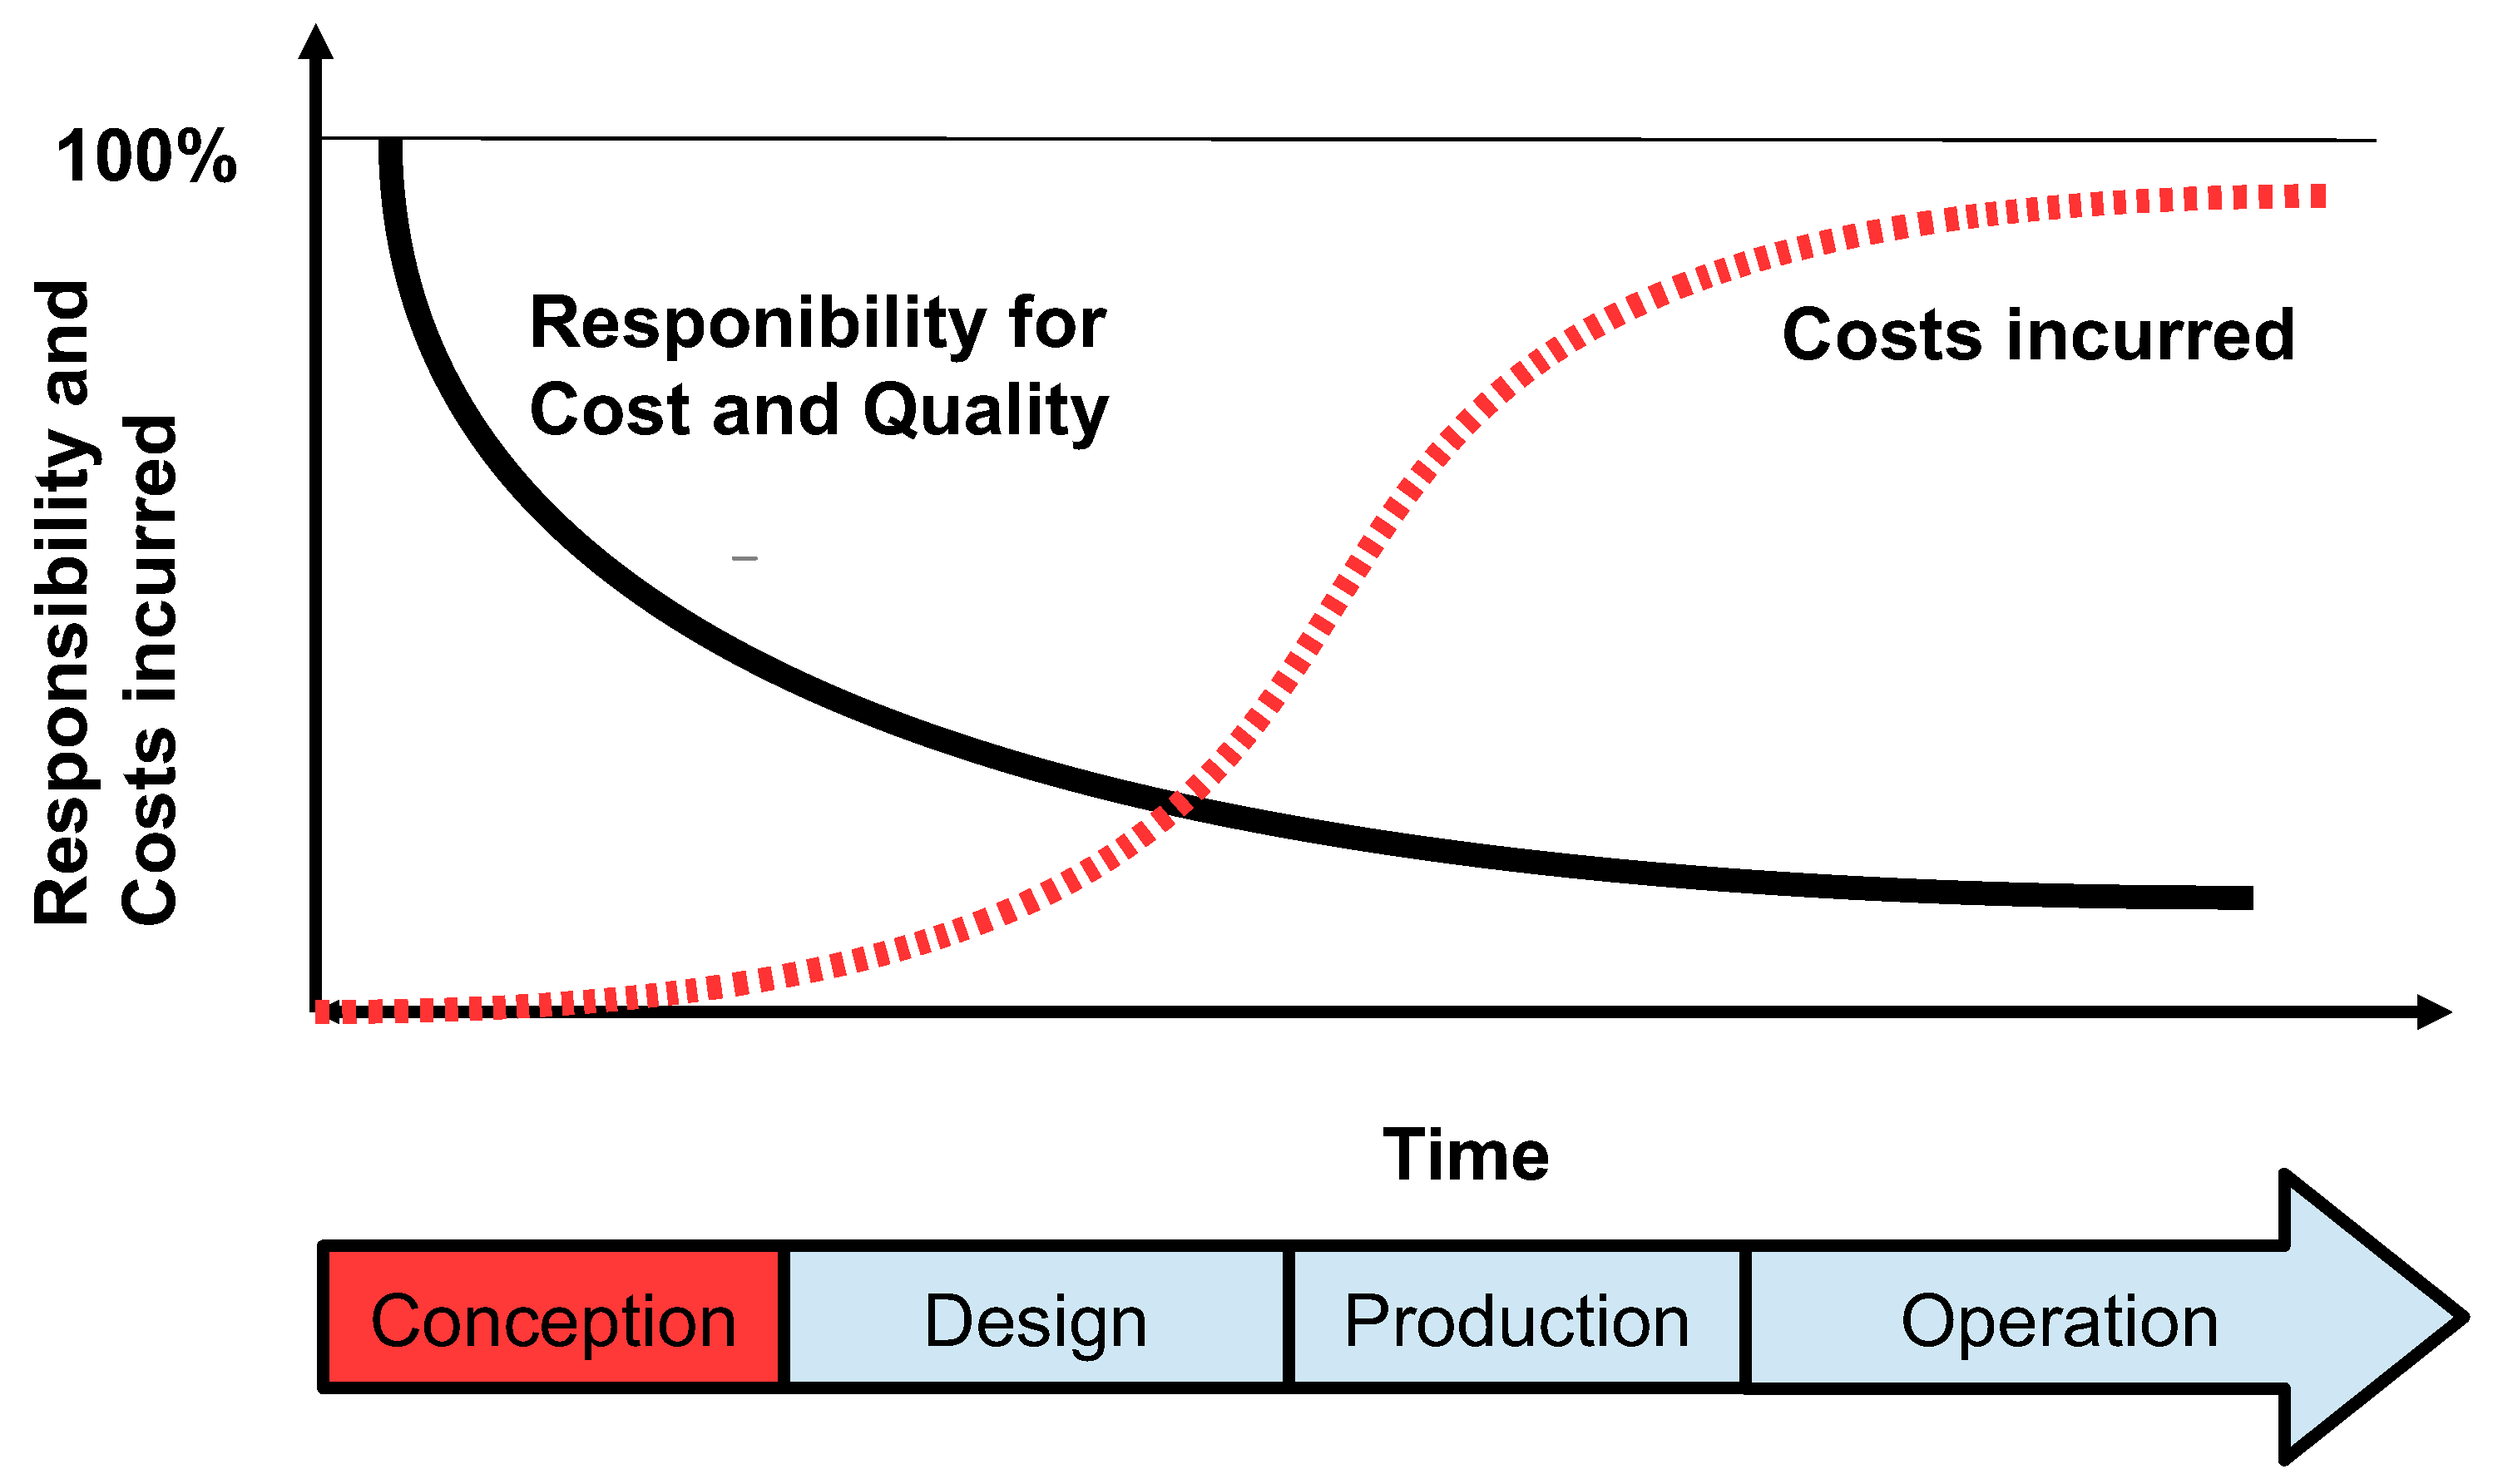
Figure 2.
From coal mine to renewable hydrocarbon production.
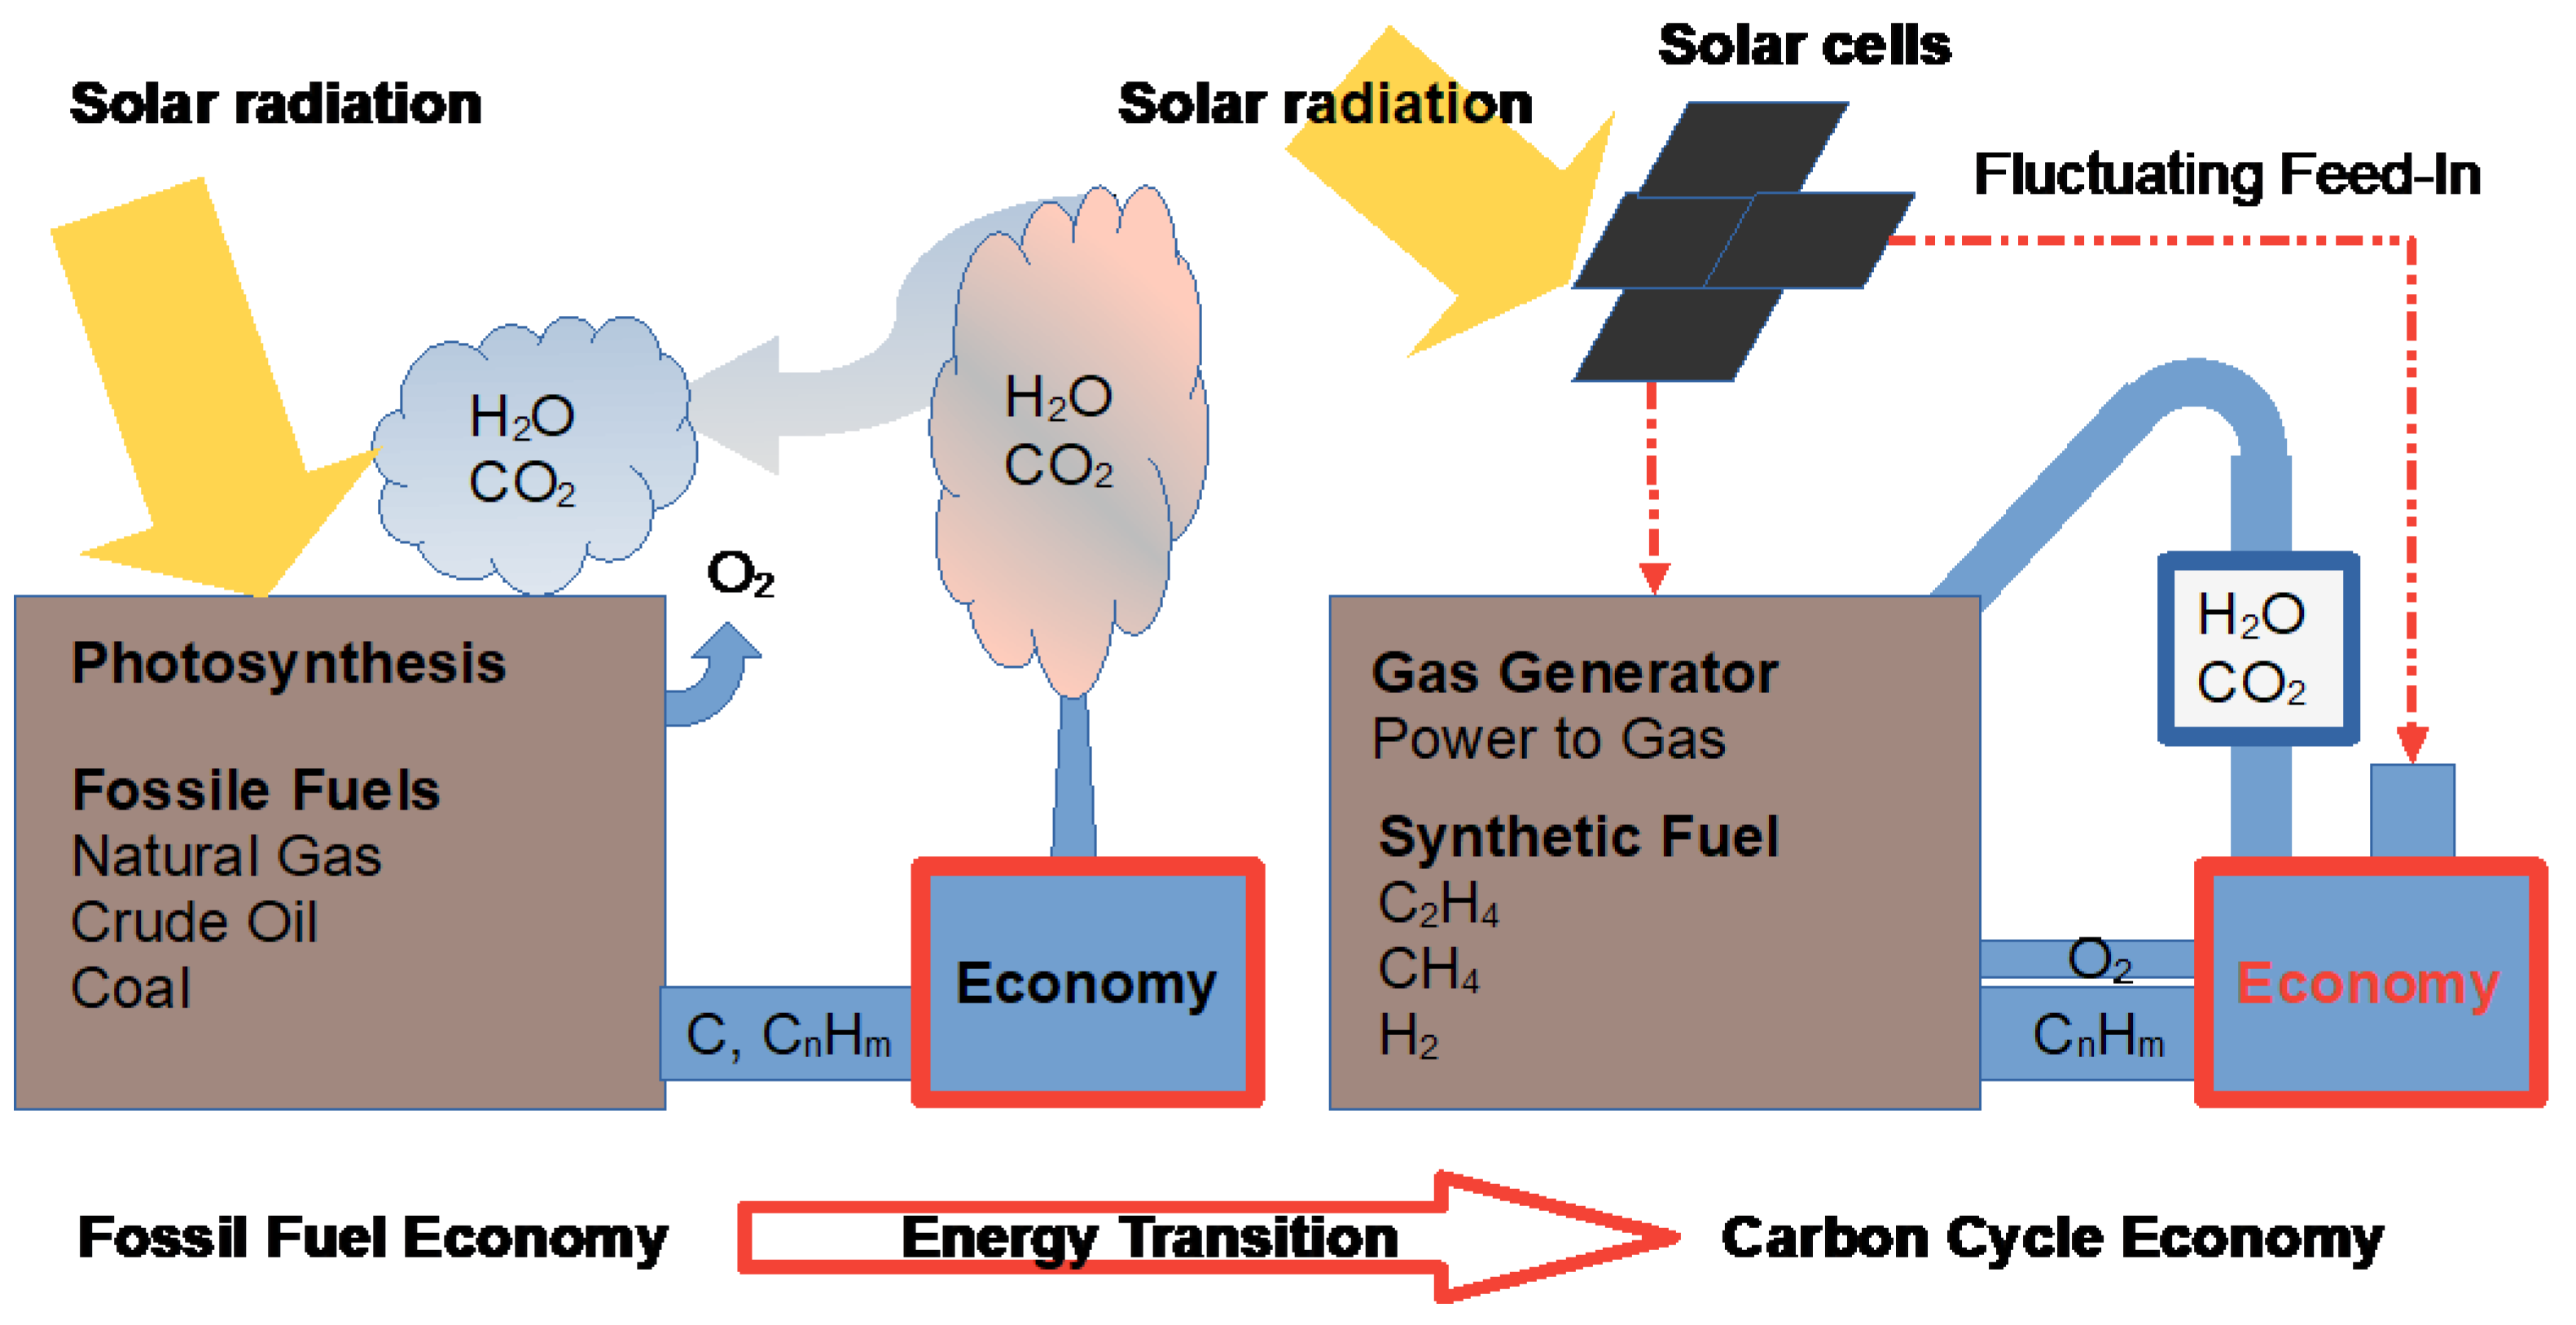
Figure 3.
The operation modes of Closed Carbon Cycles [8].
Figure 3.
The operation modes of Closed Carbon Cycles [8].
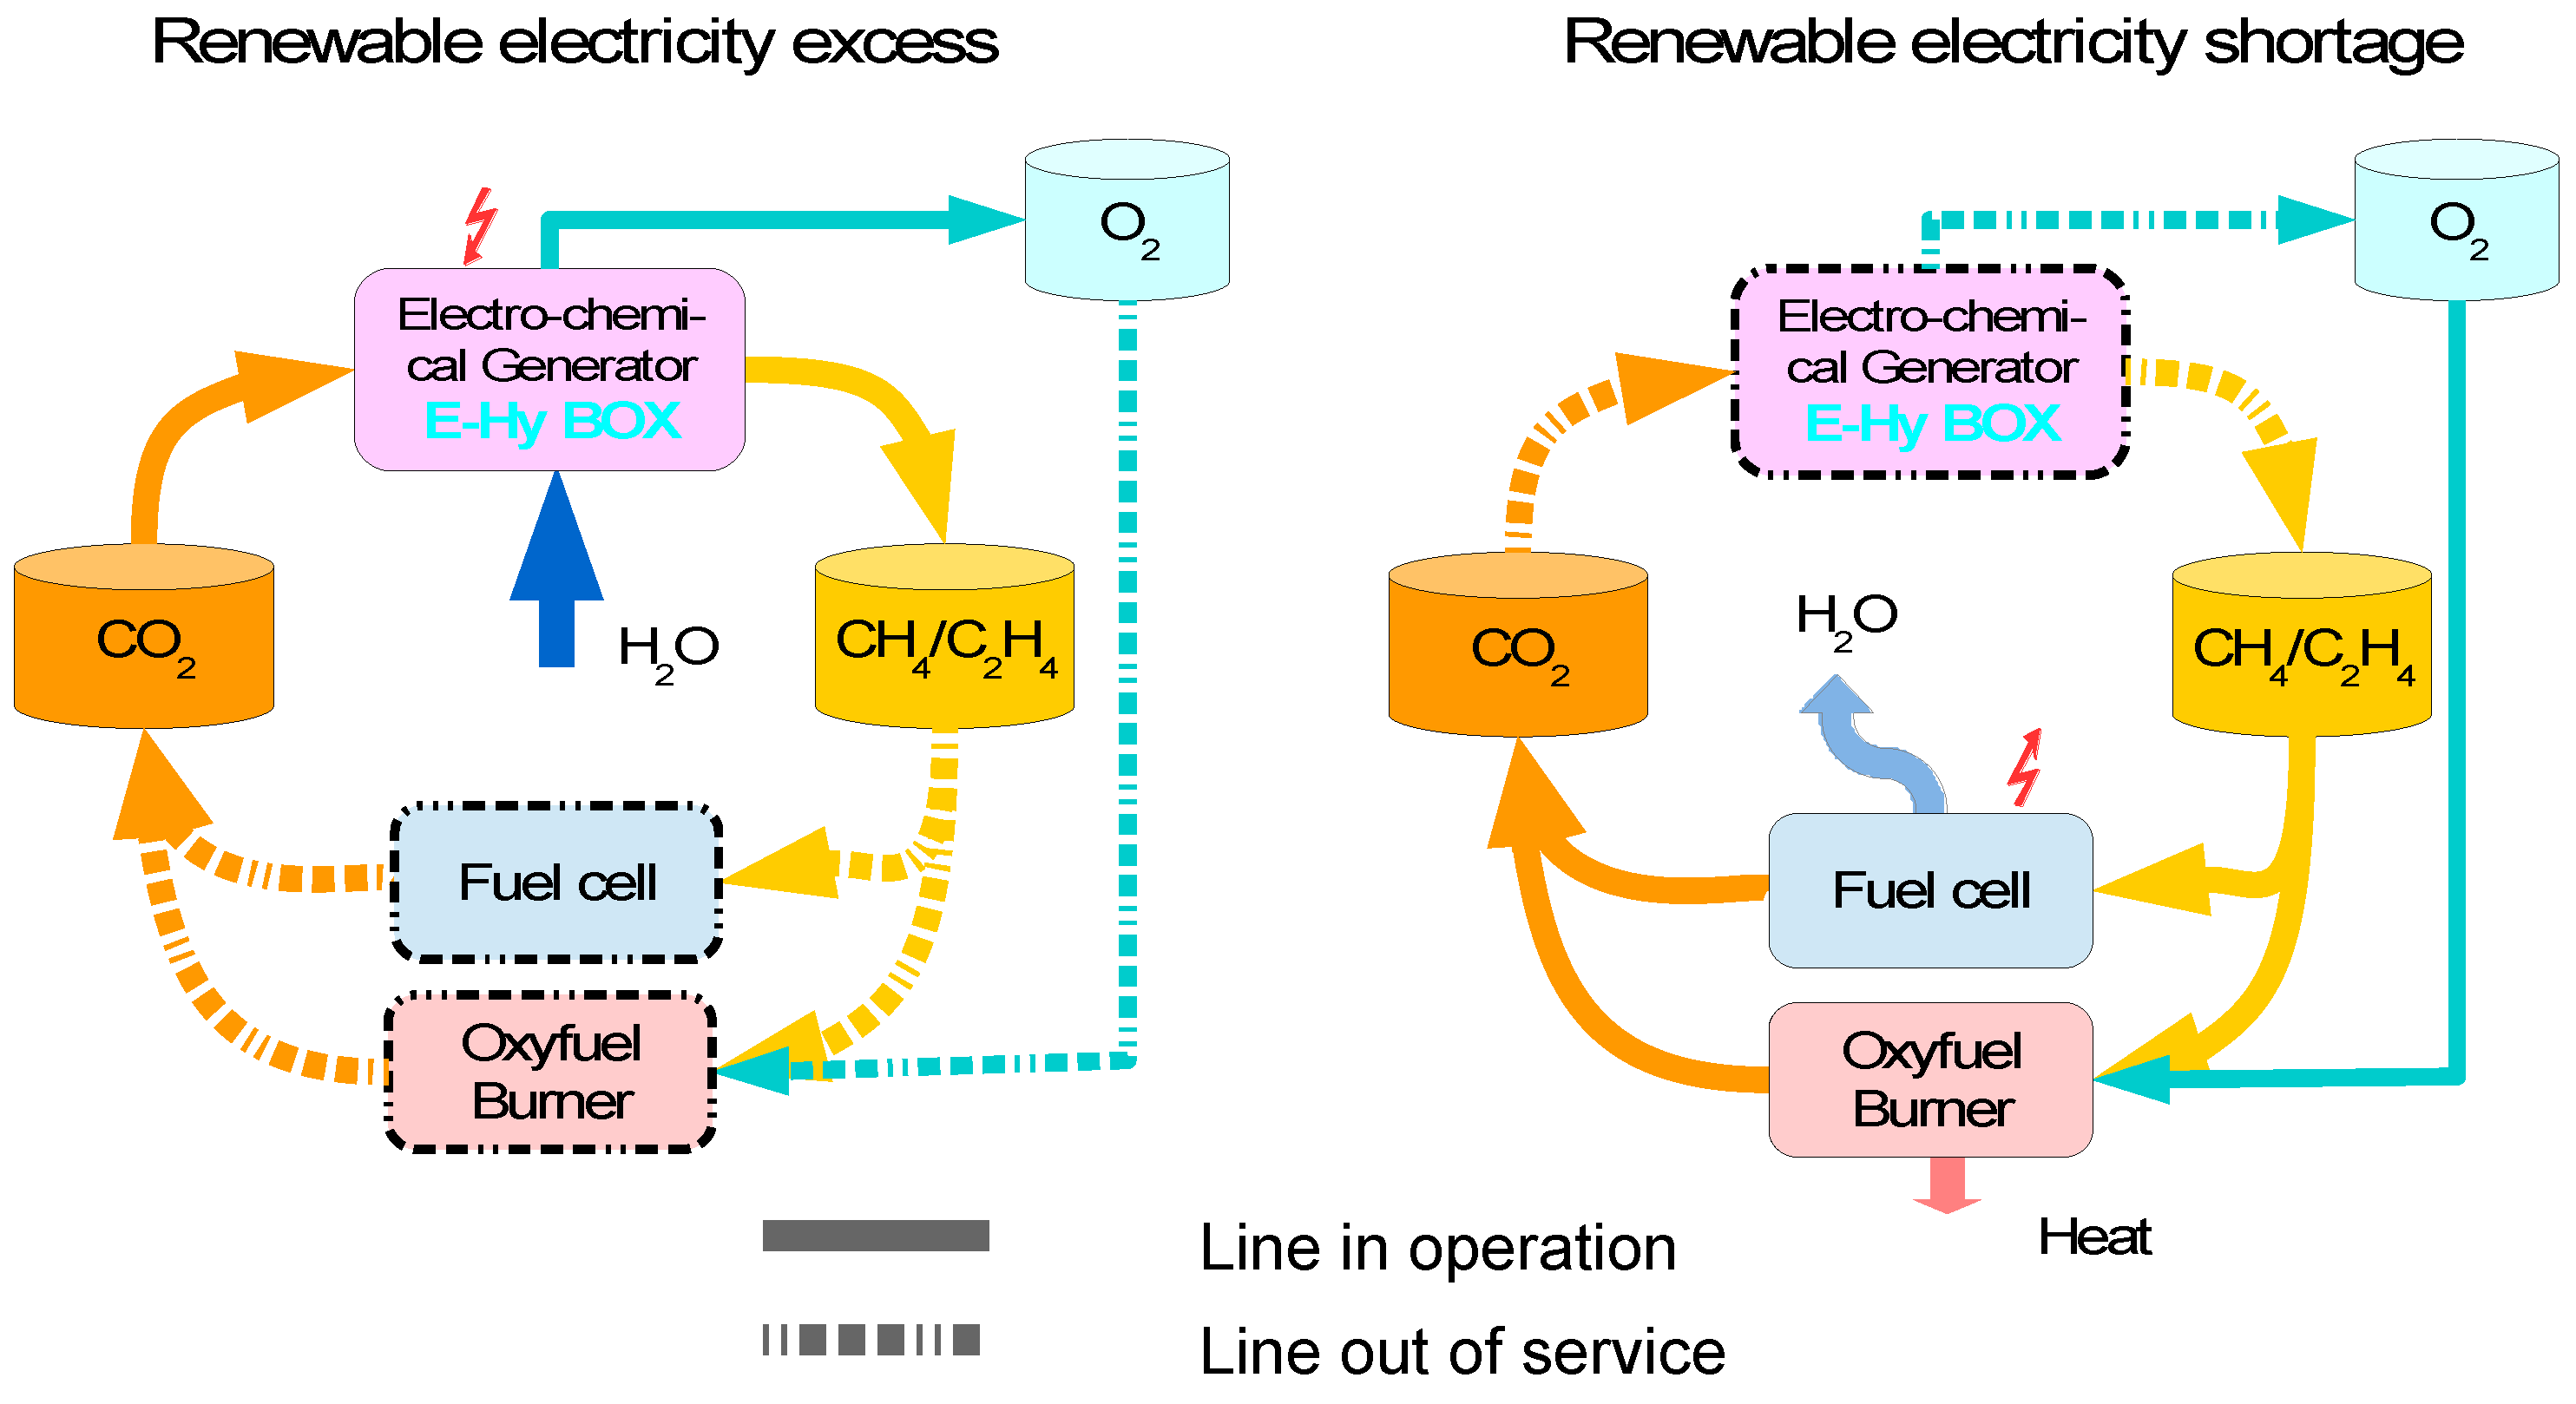
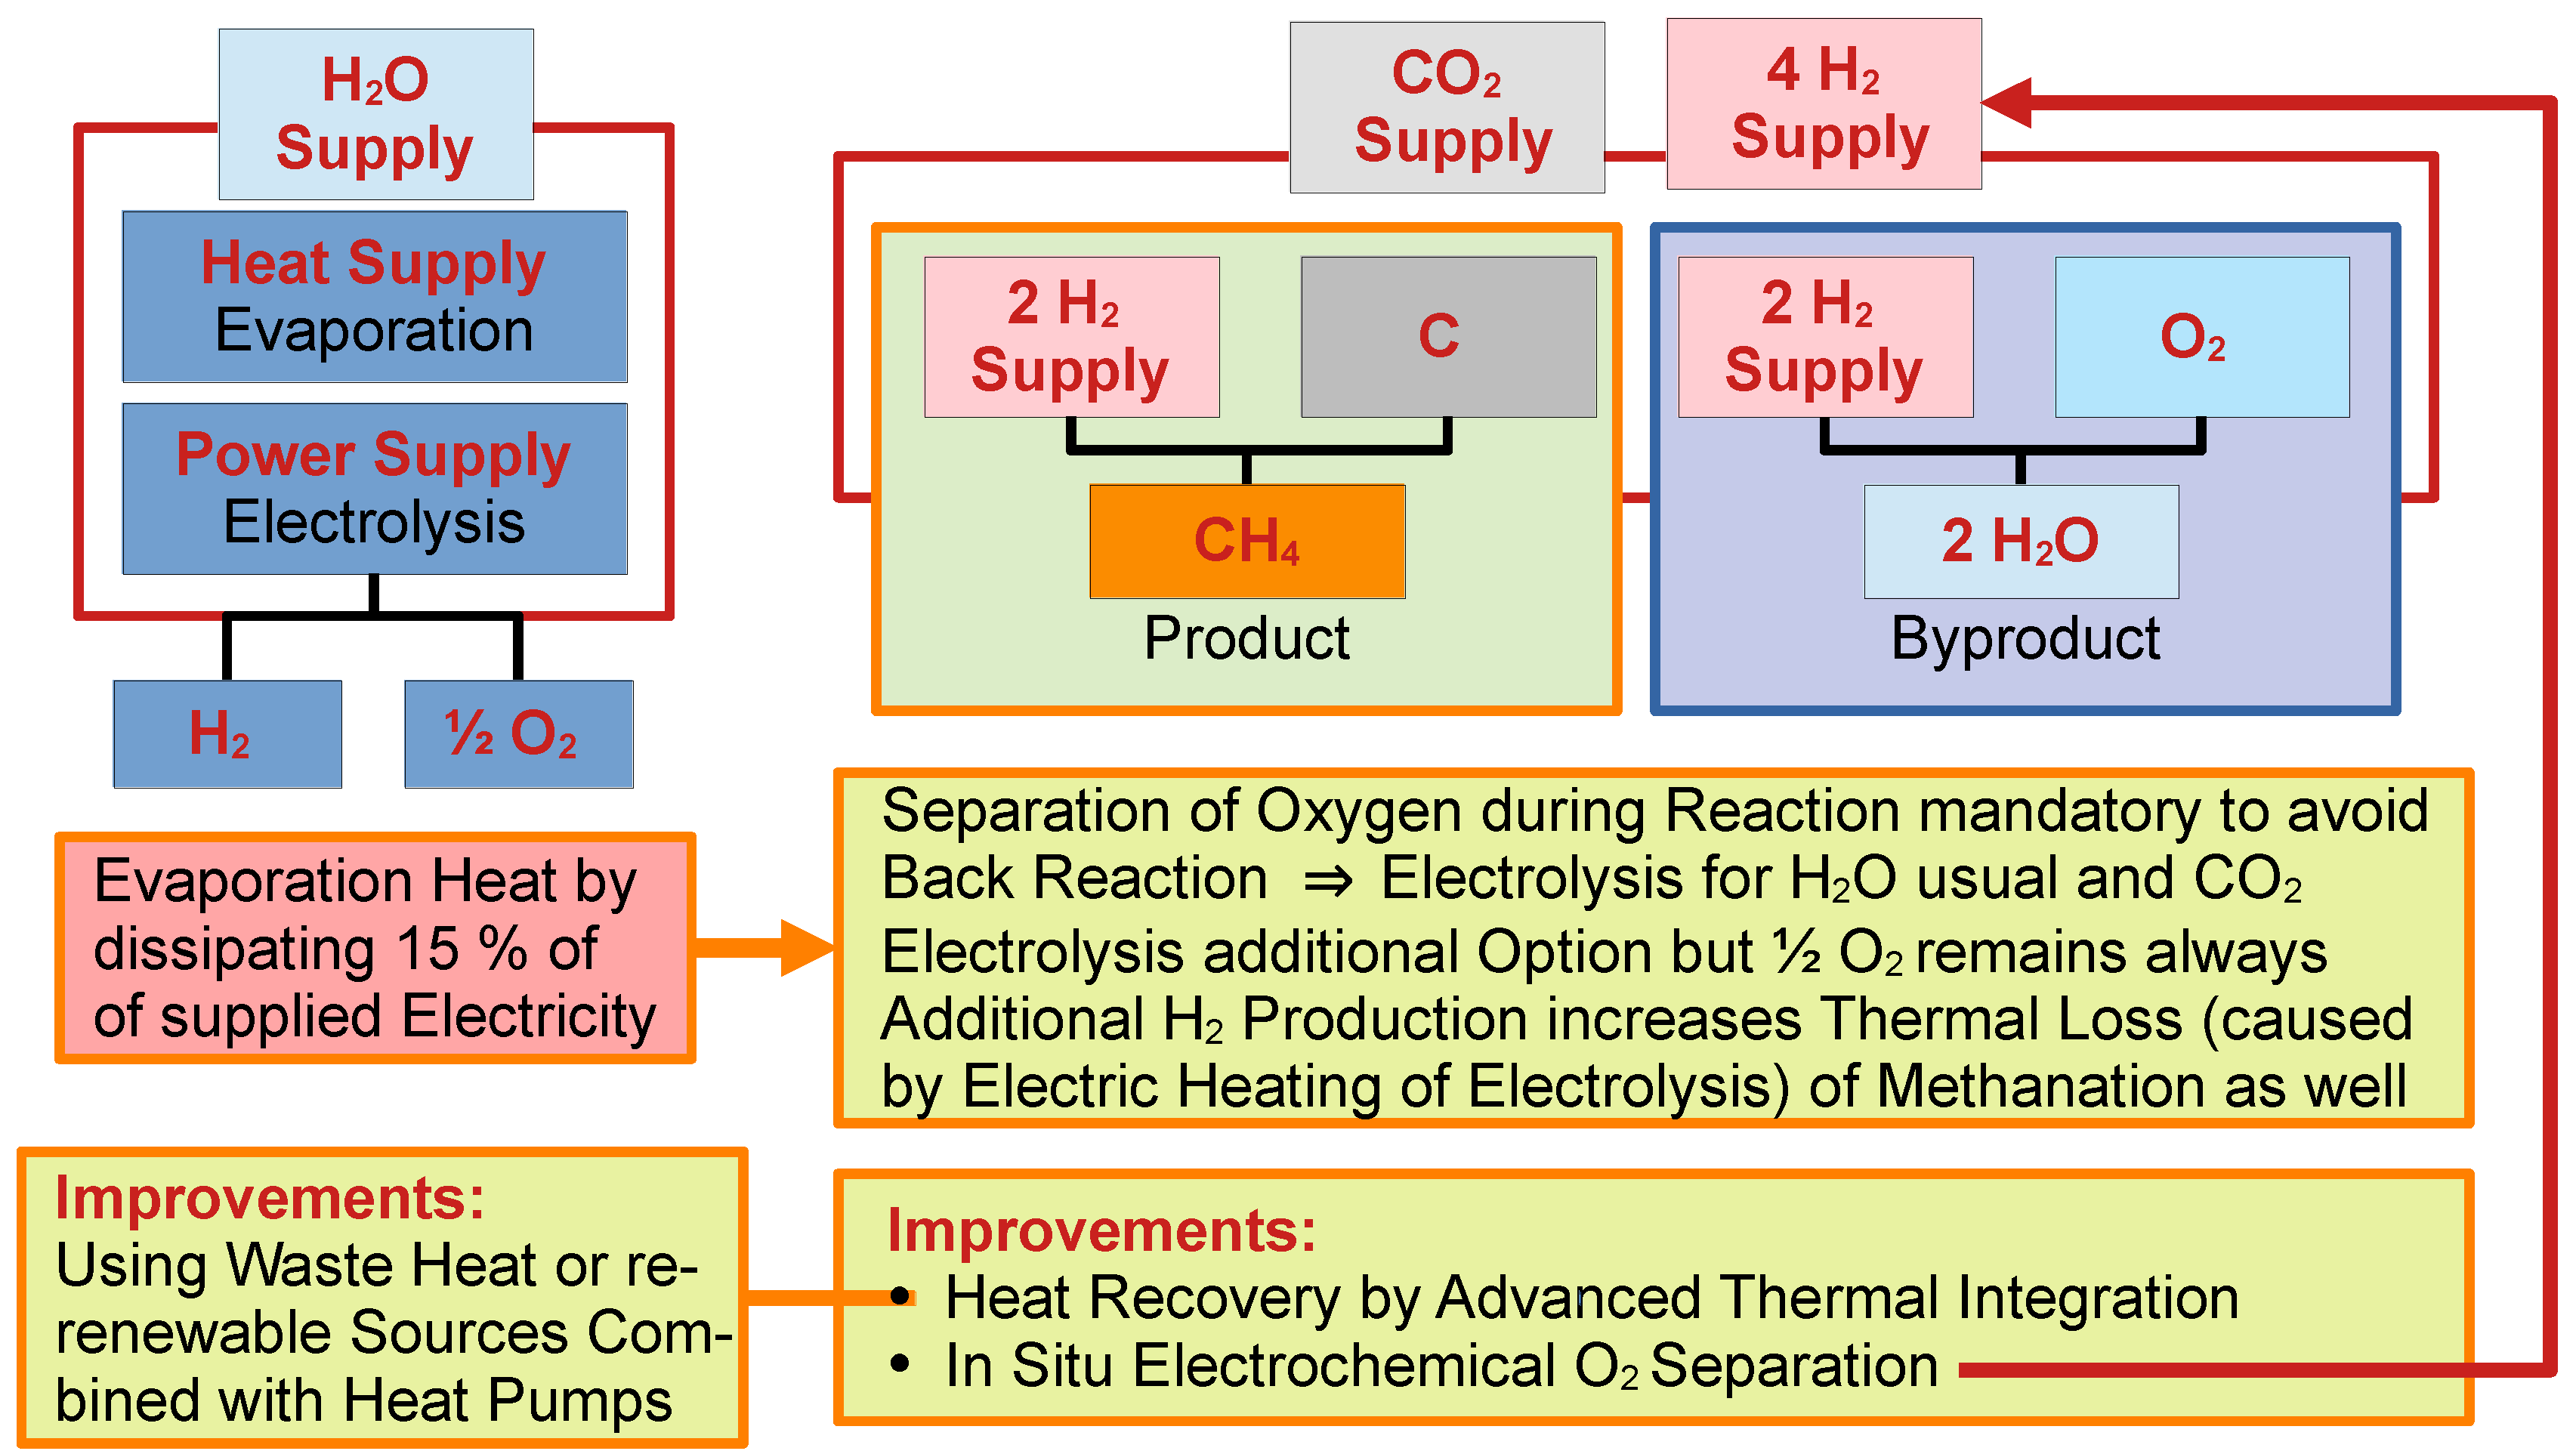
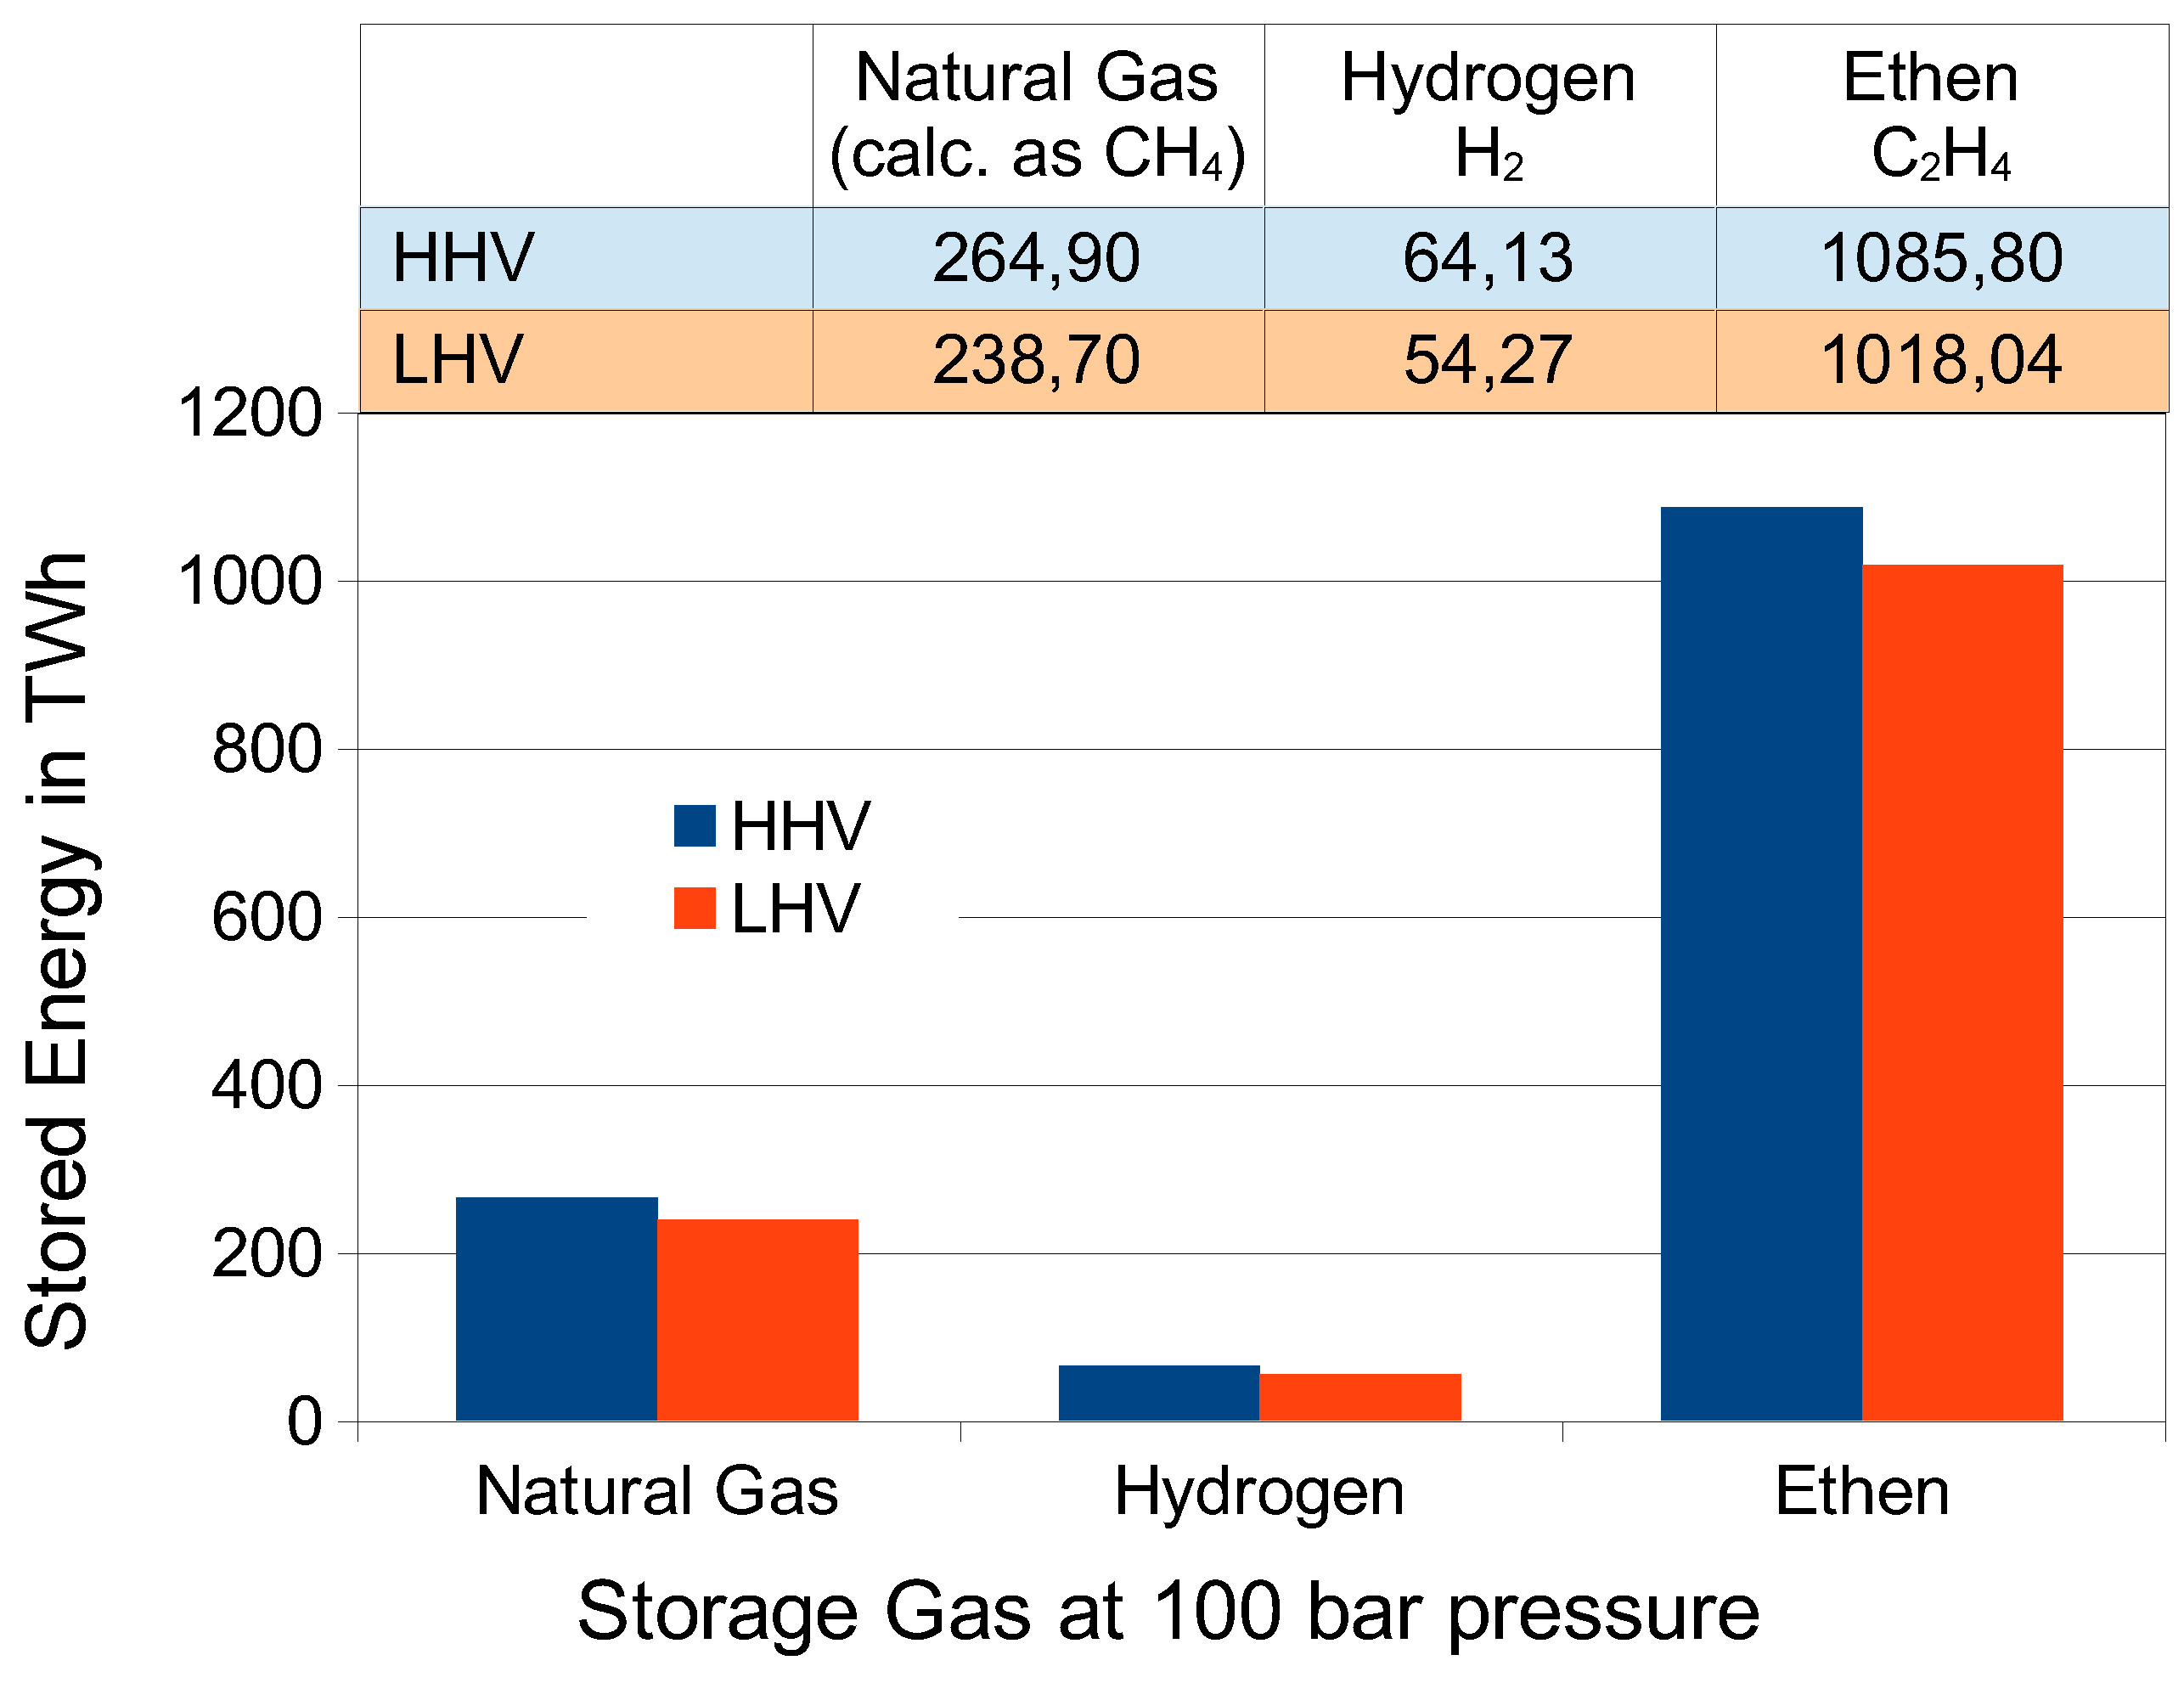
Figure 6.
Comparison of investment costs for the different storage concepts.
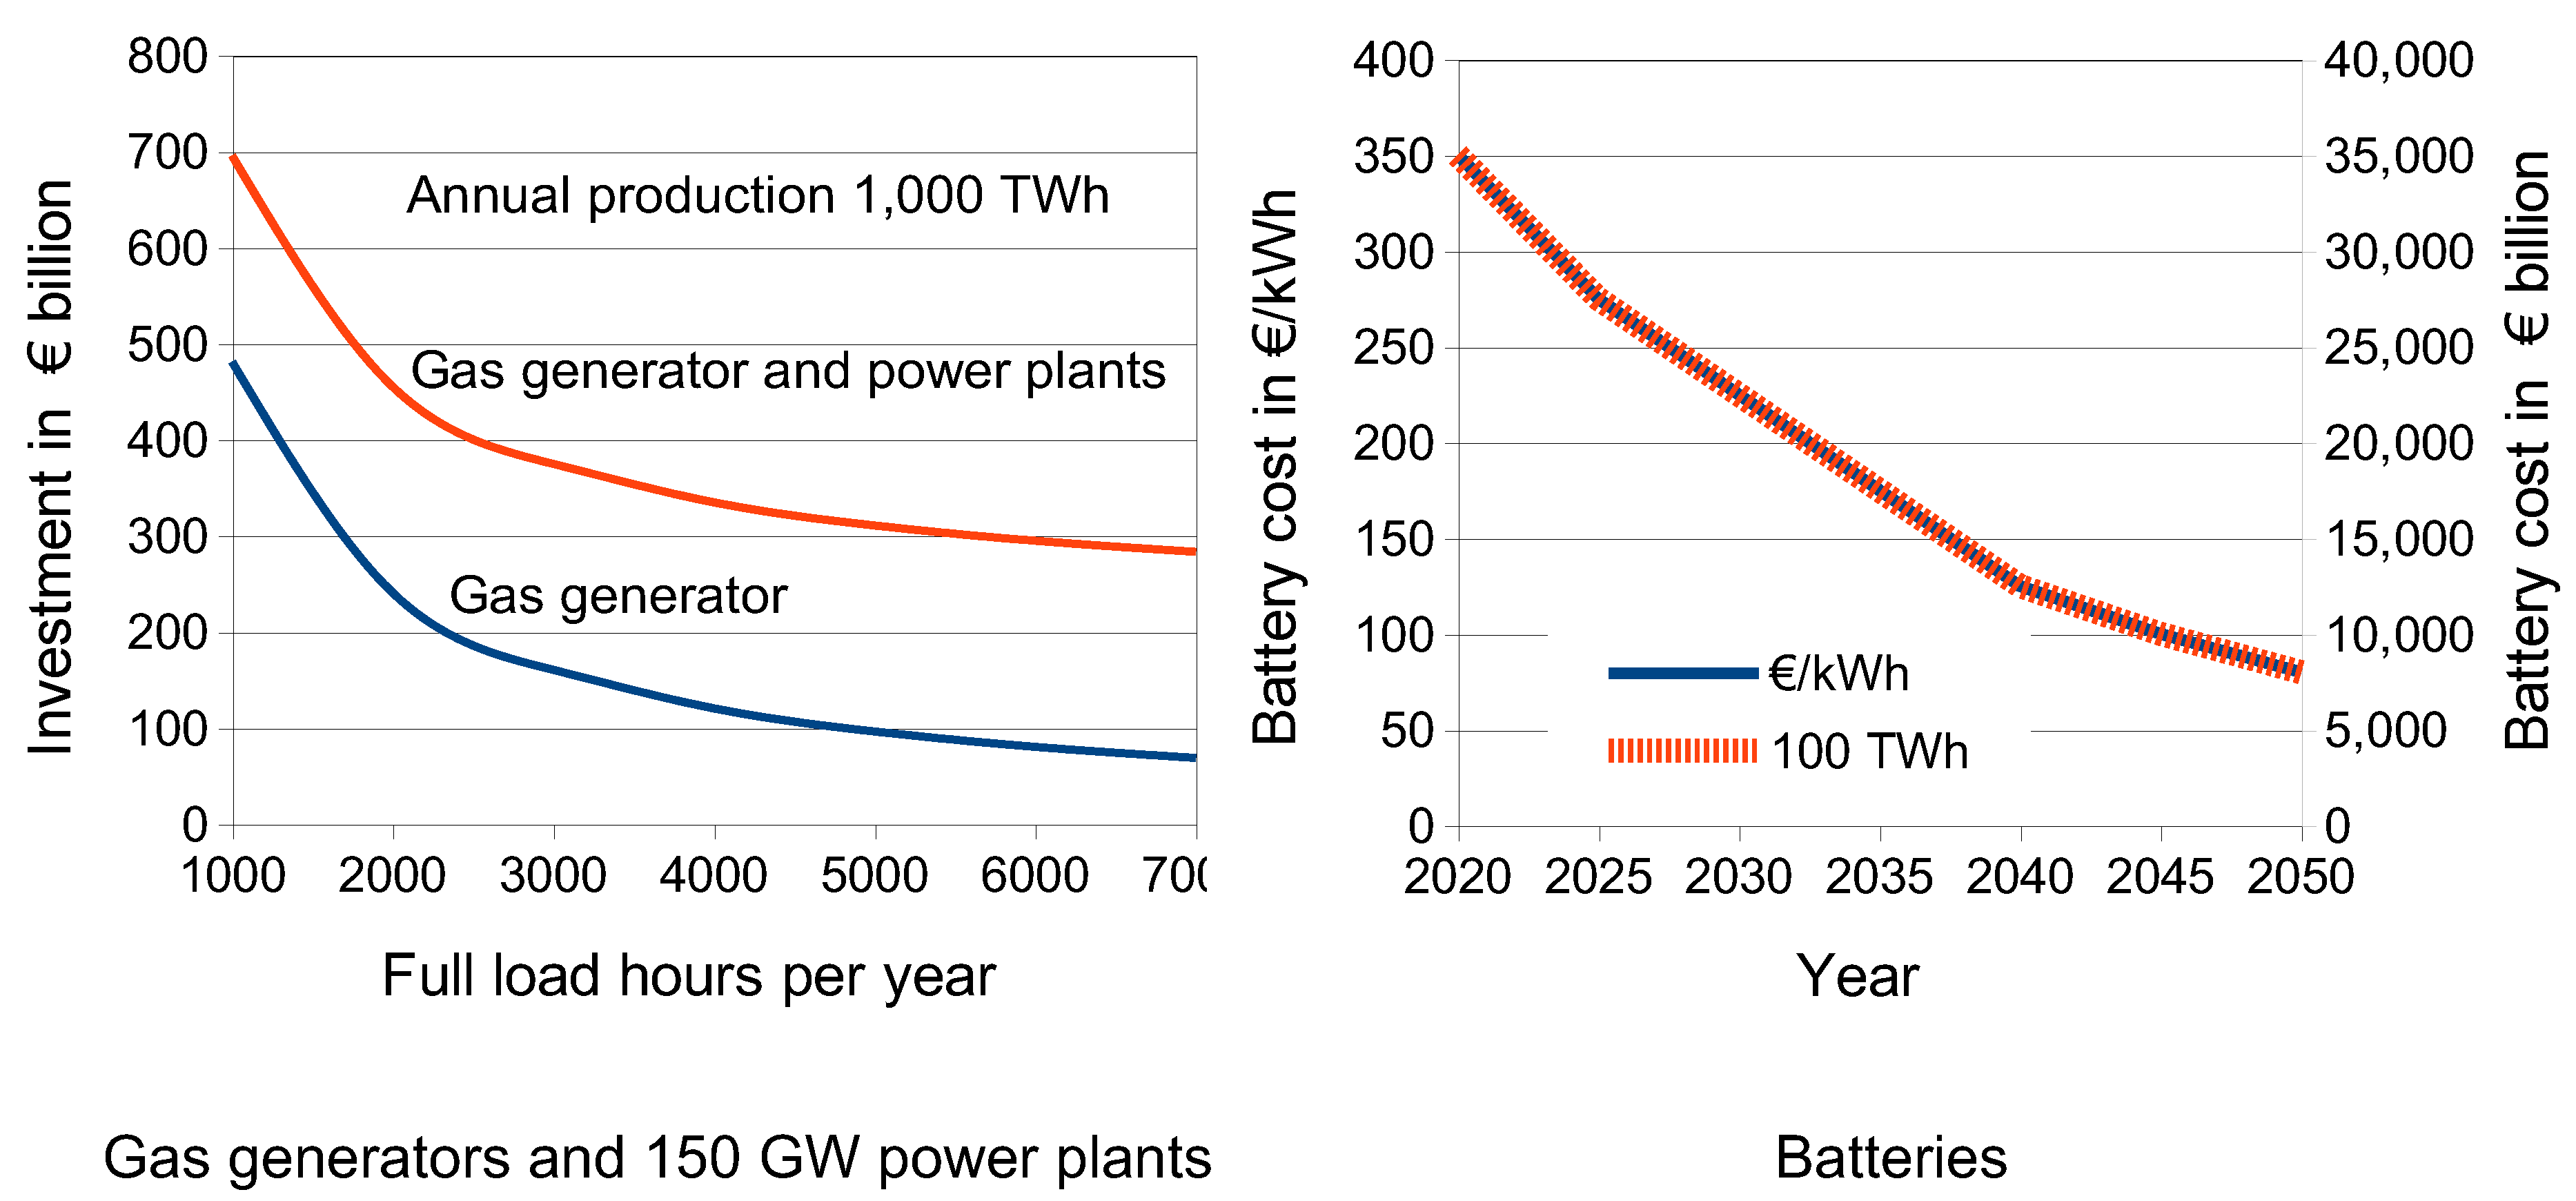
Figure 7.
Process overview of a carbon cycle economy [23].
Figure 7.
Process overview of a carbon cycle economy [23].
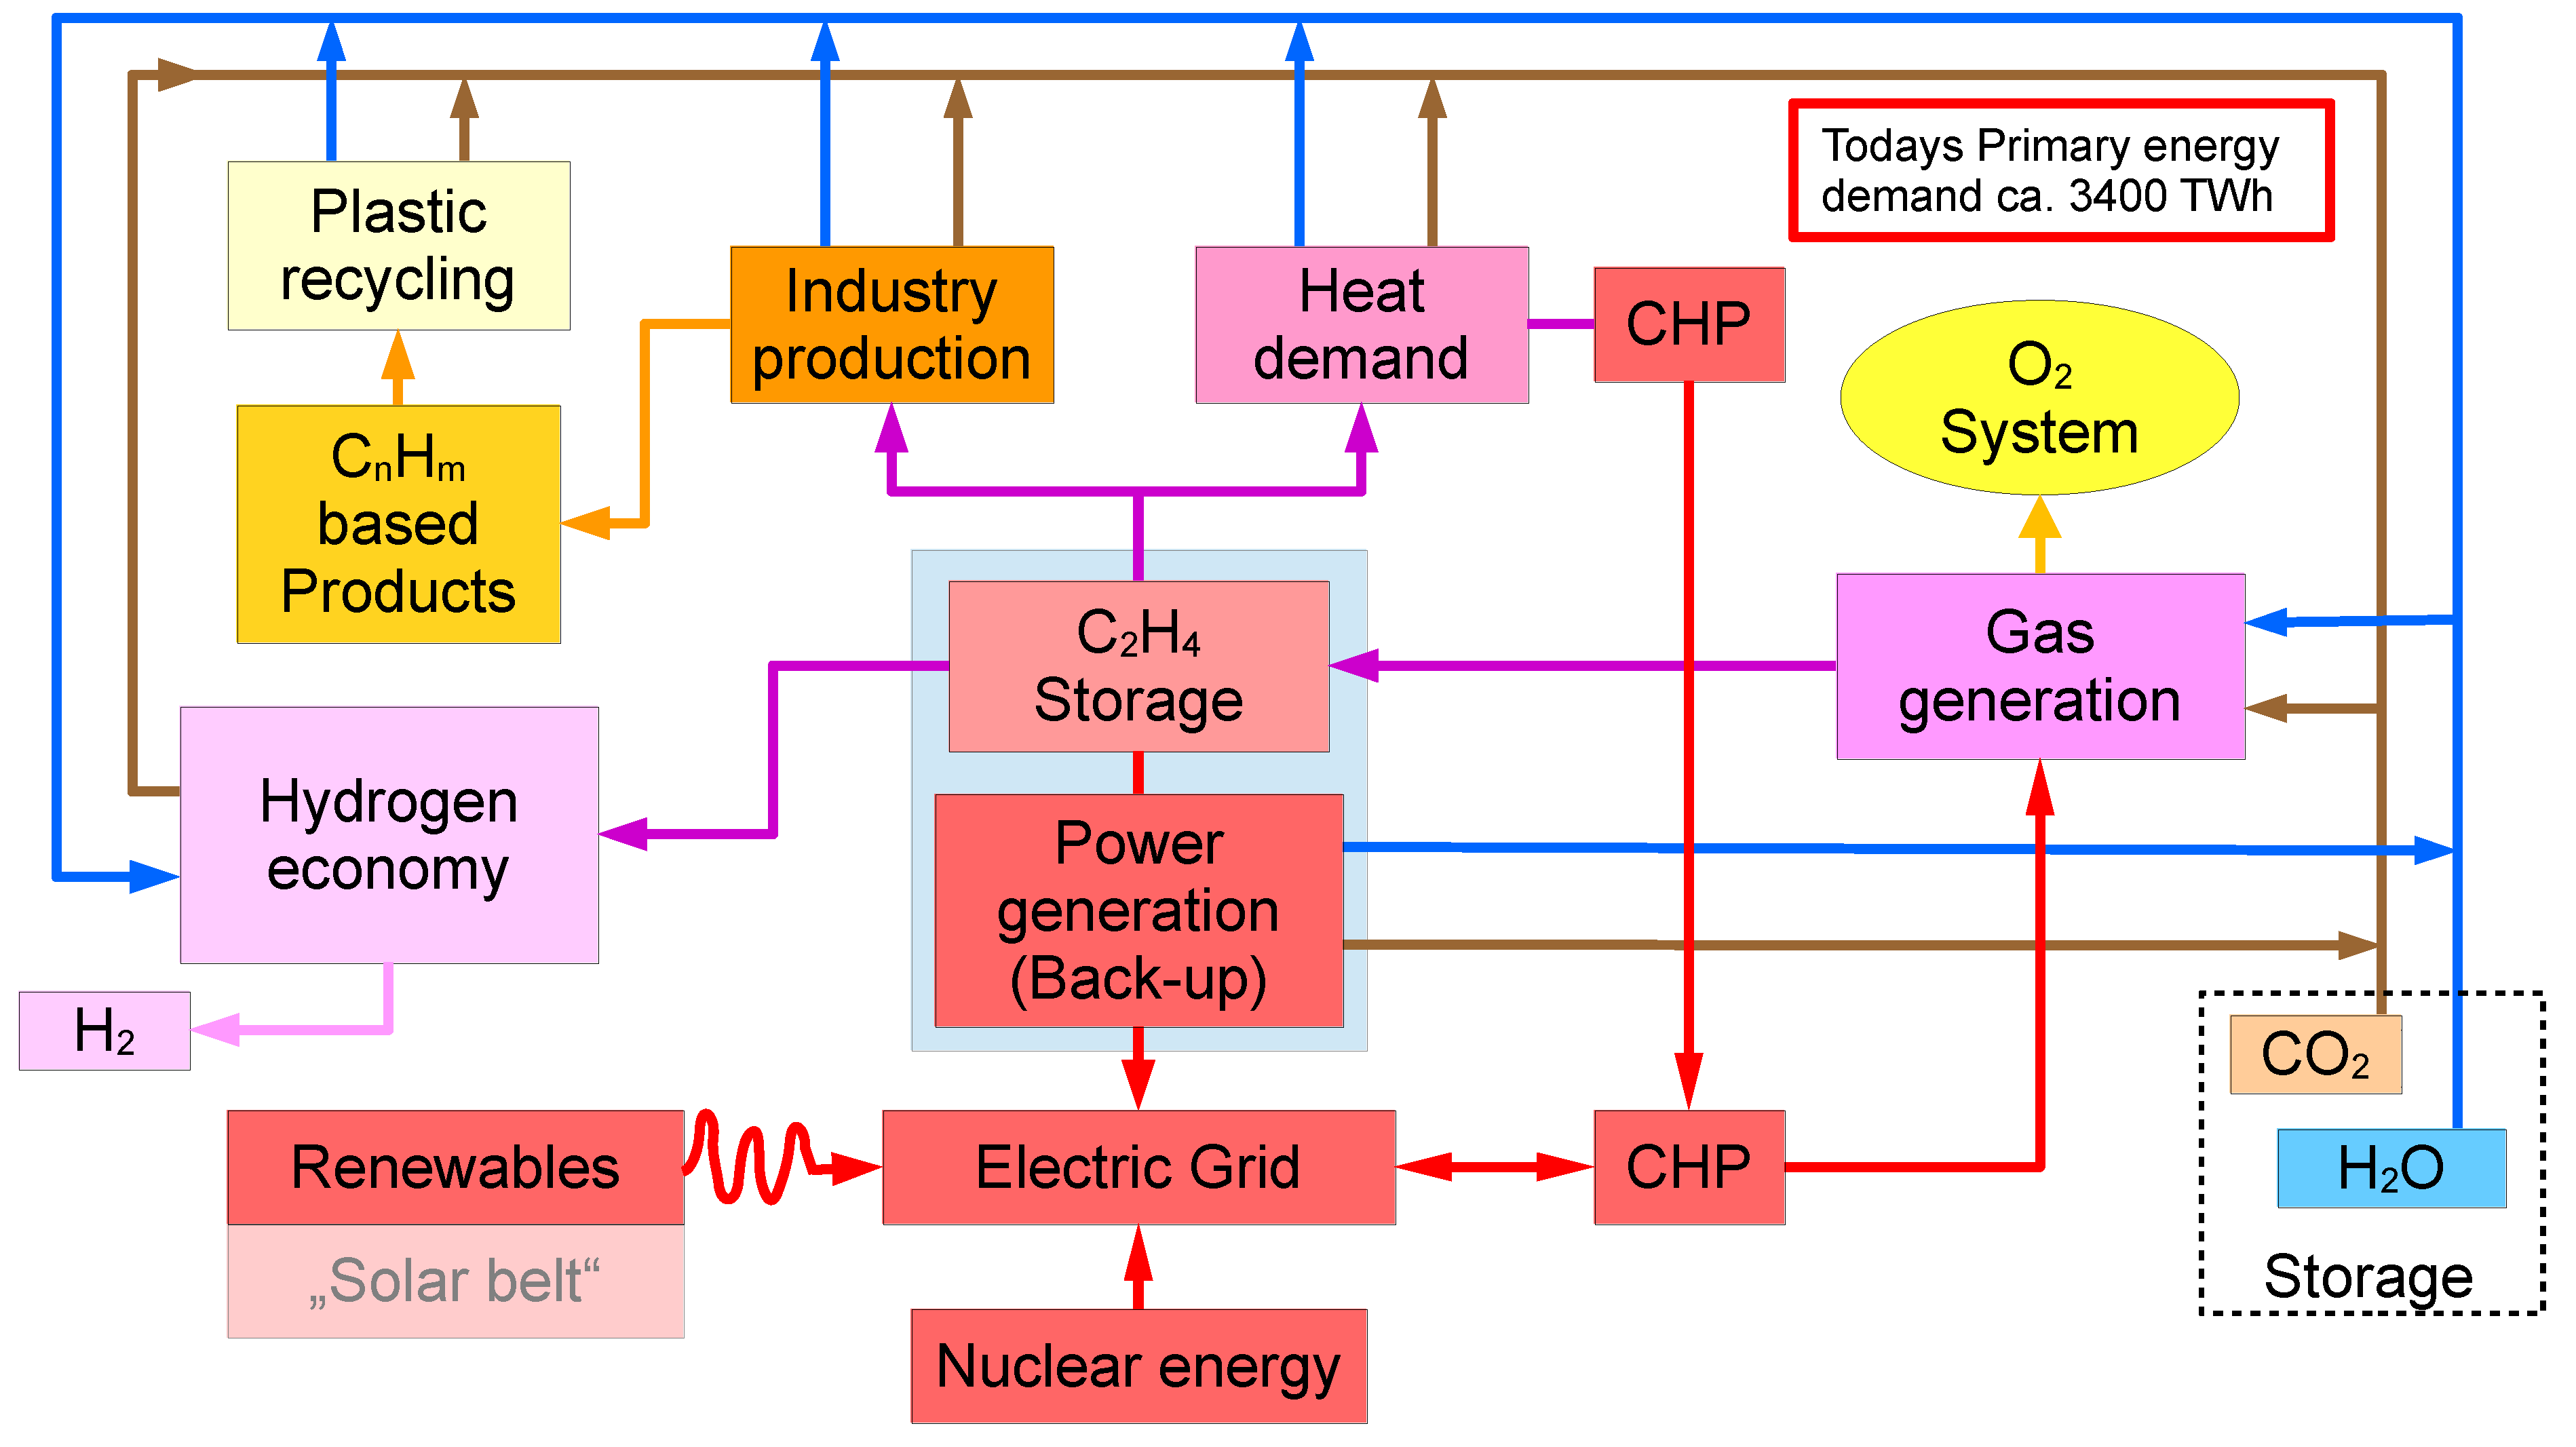
Figure 8.
Overview of the economic impact of heat utilization [21].
Figure 8.
Overview of the economic impact of heat utilization [21].
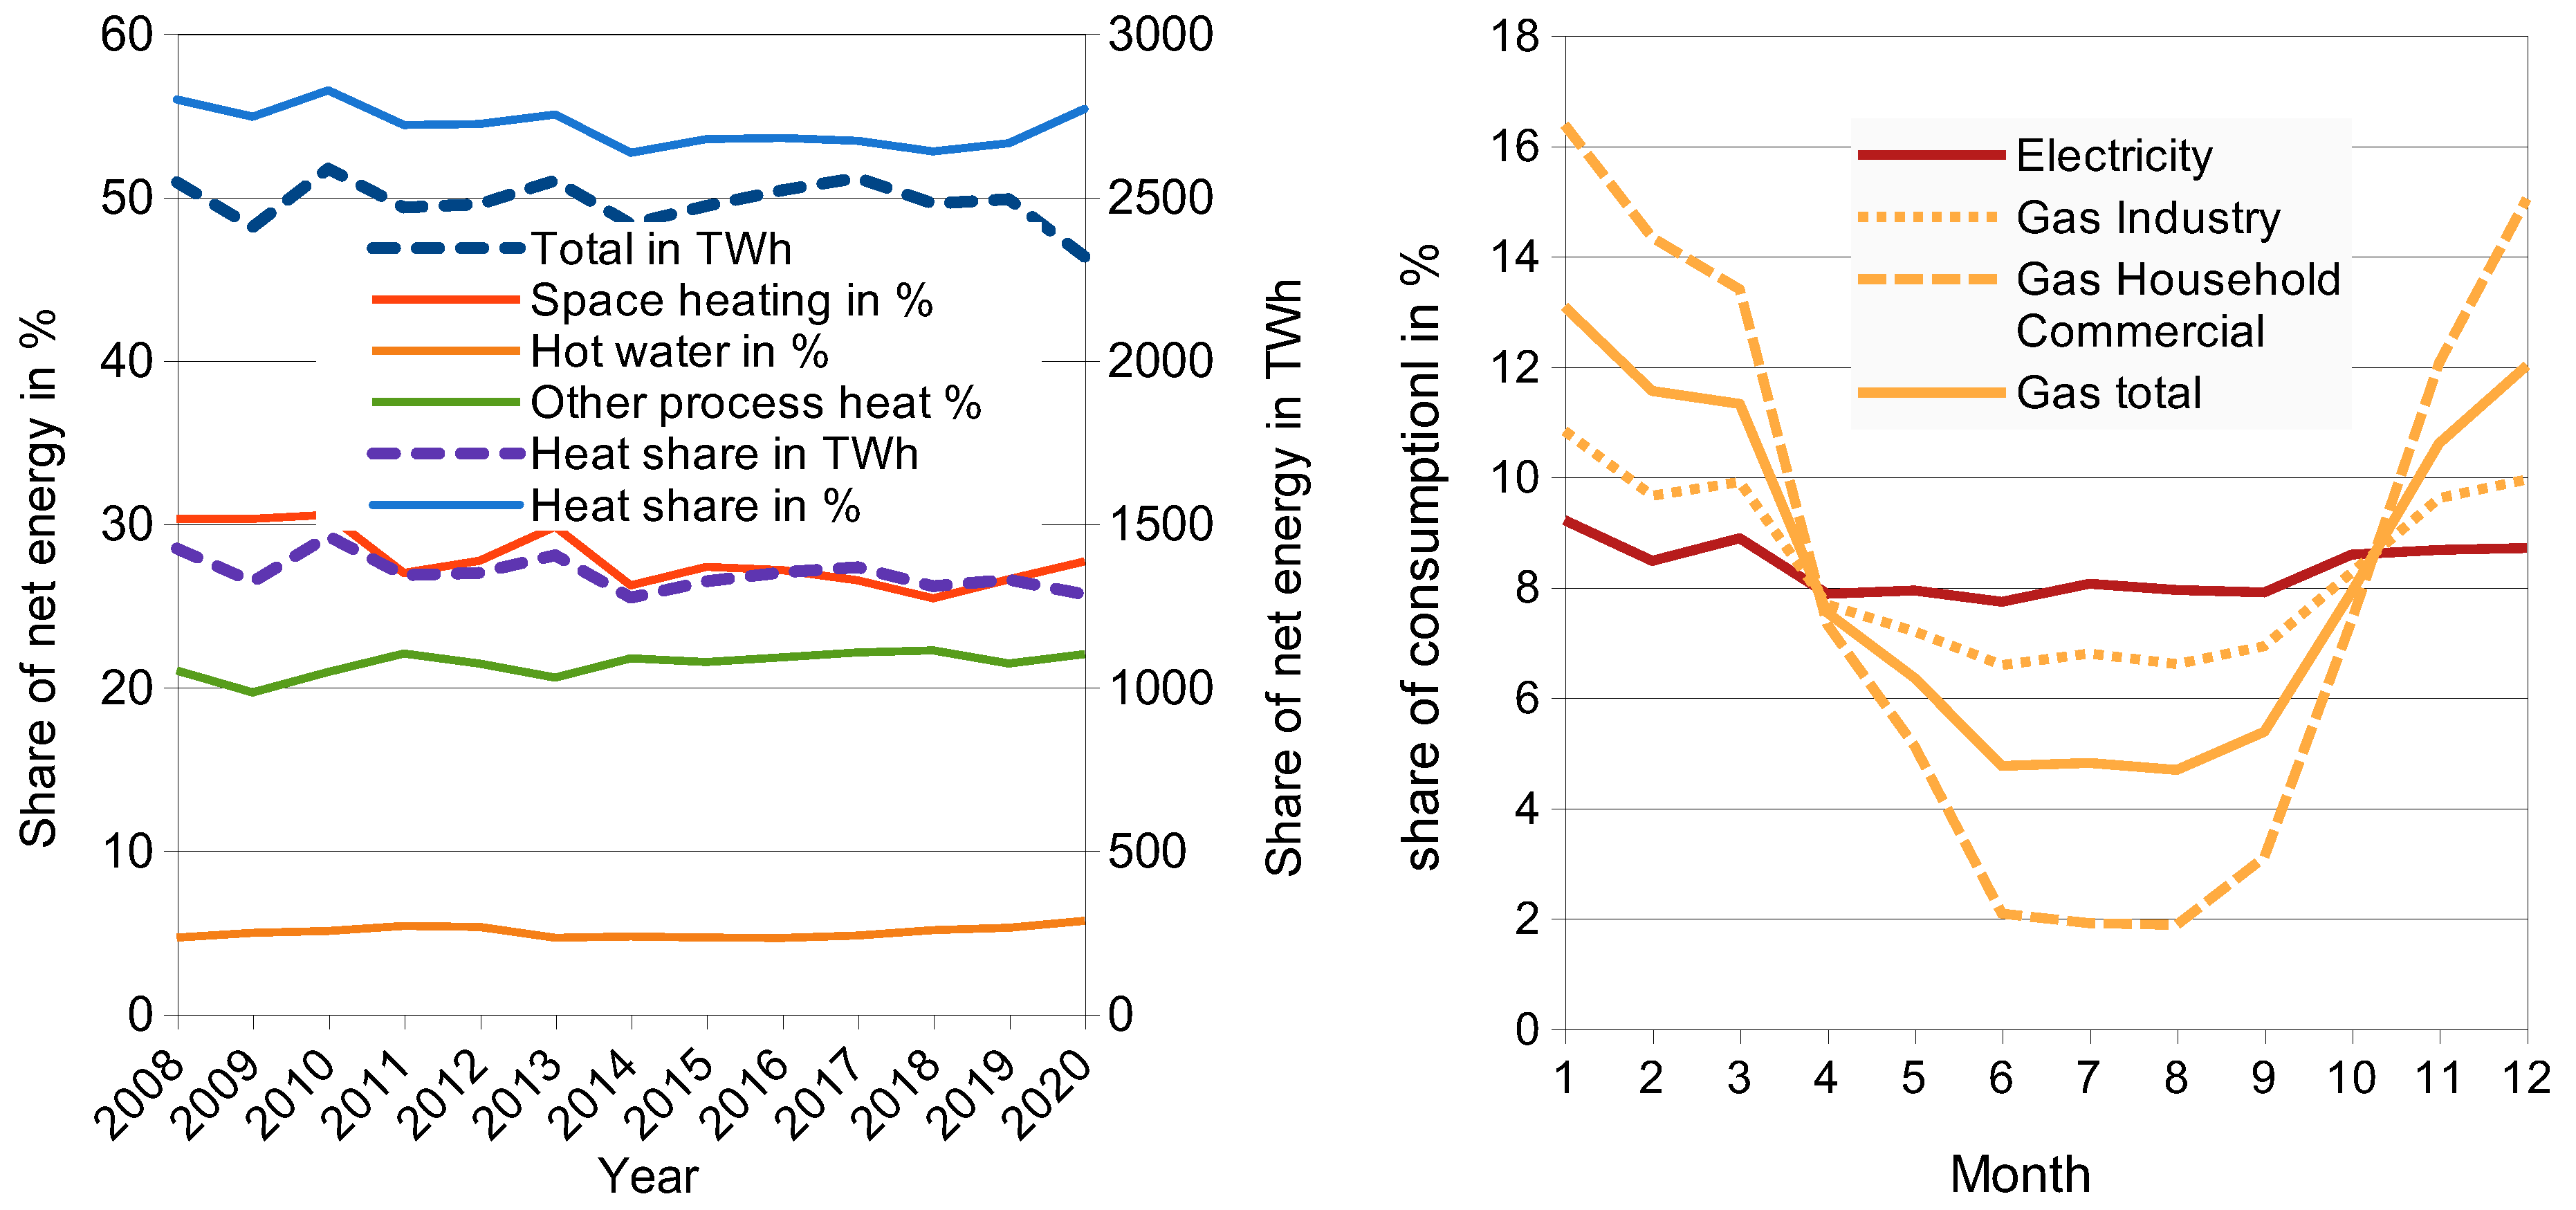
Figure 9.
Heat demand and optional electricity generation [21].
Figure 9.
Heat demand and optional electricity generation [21].
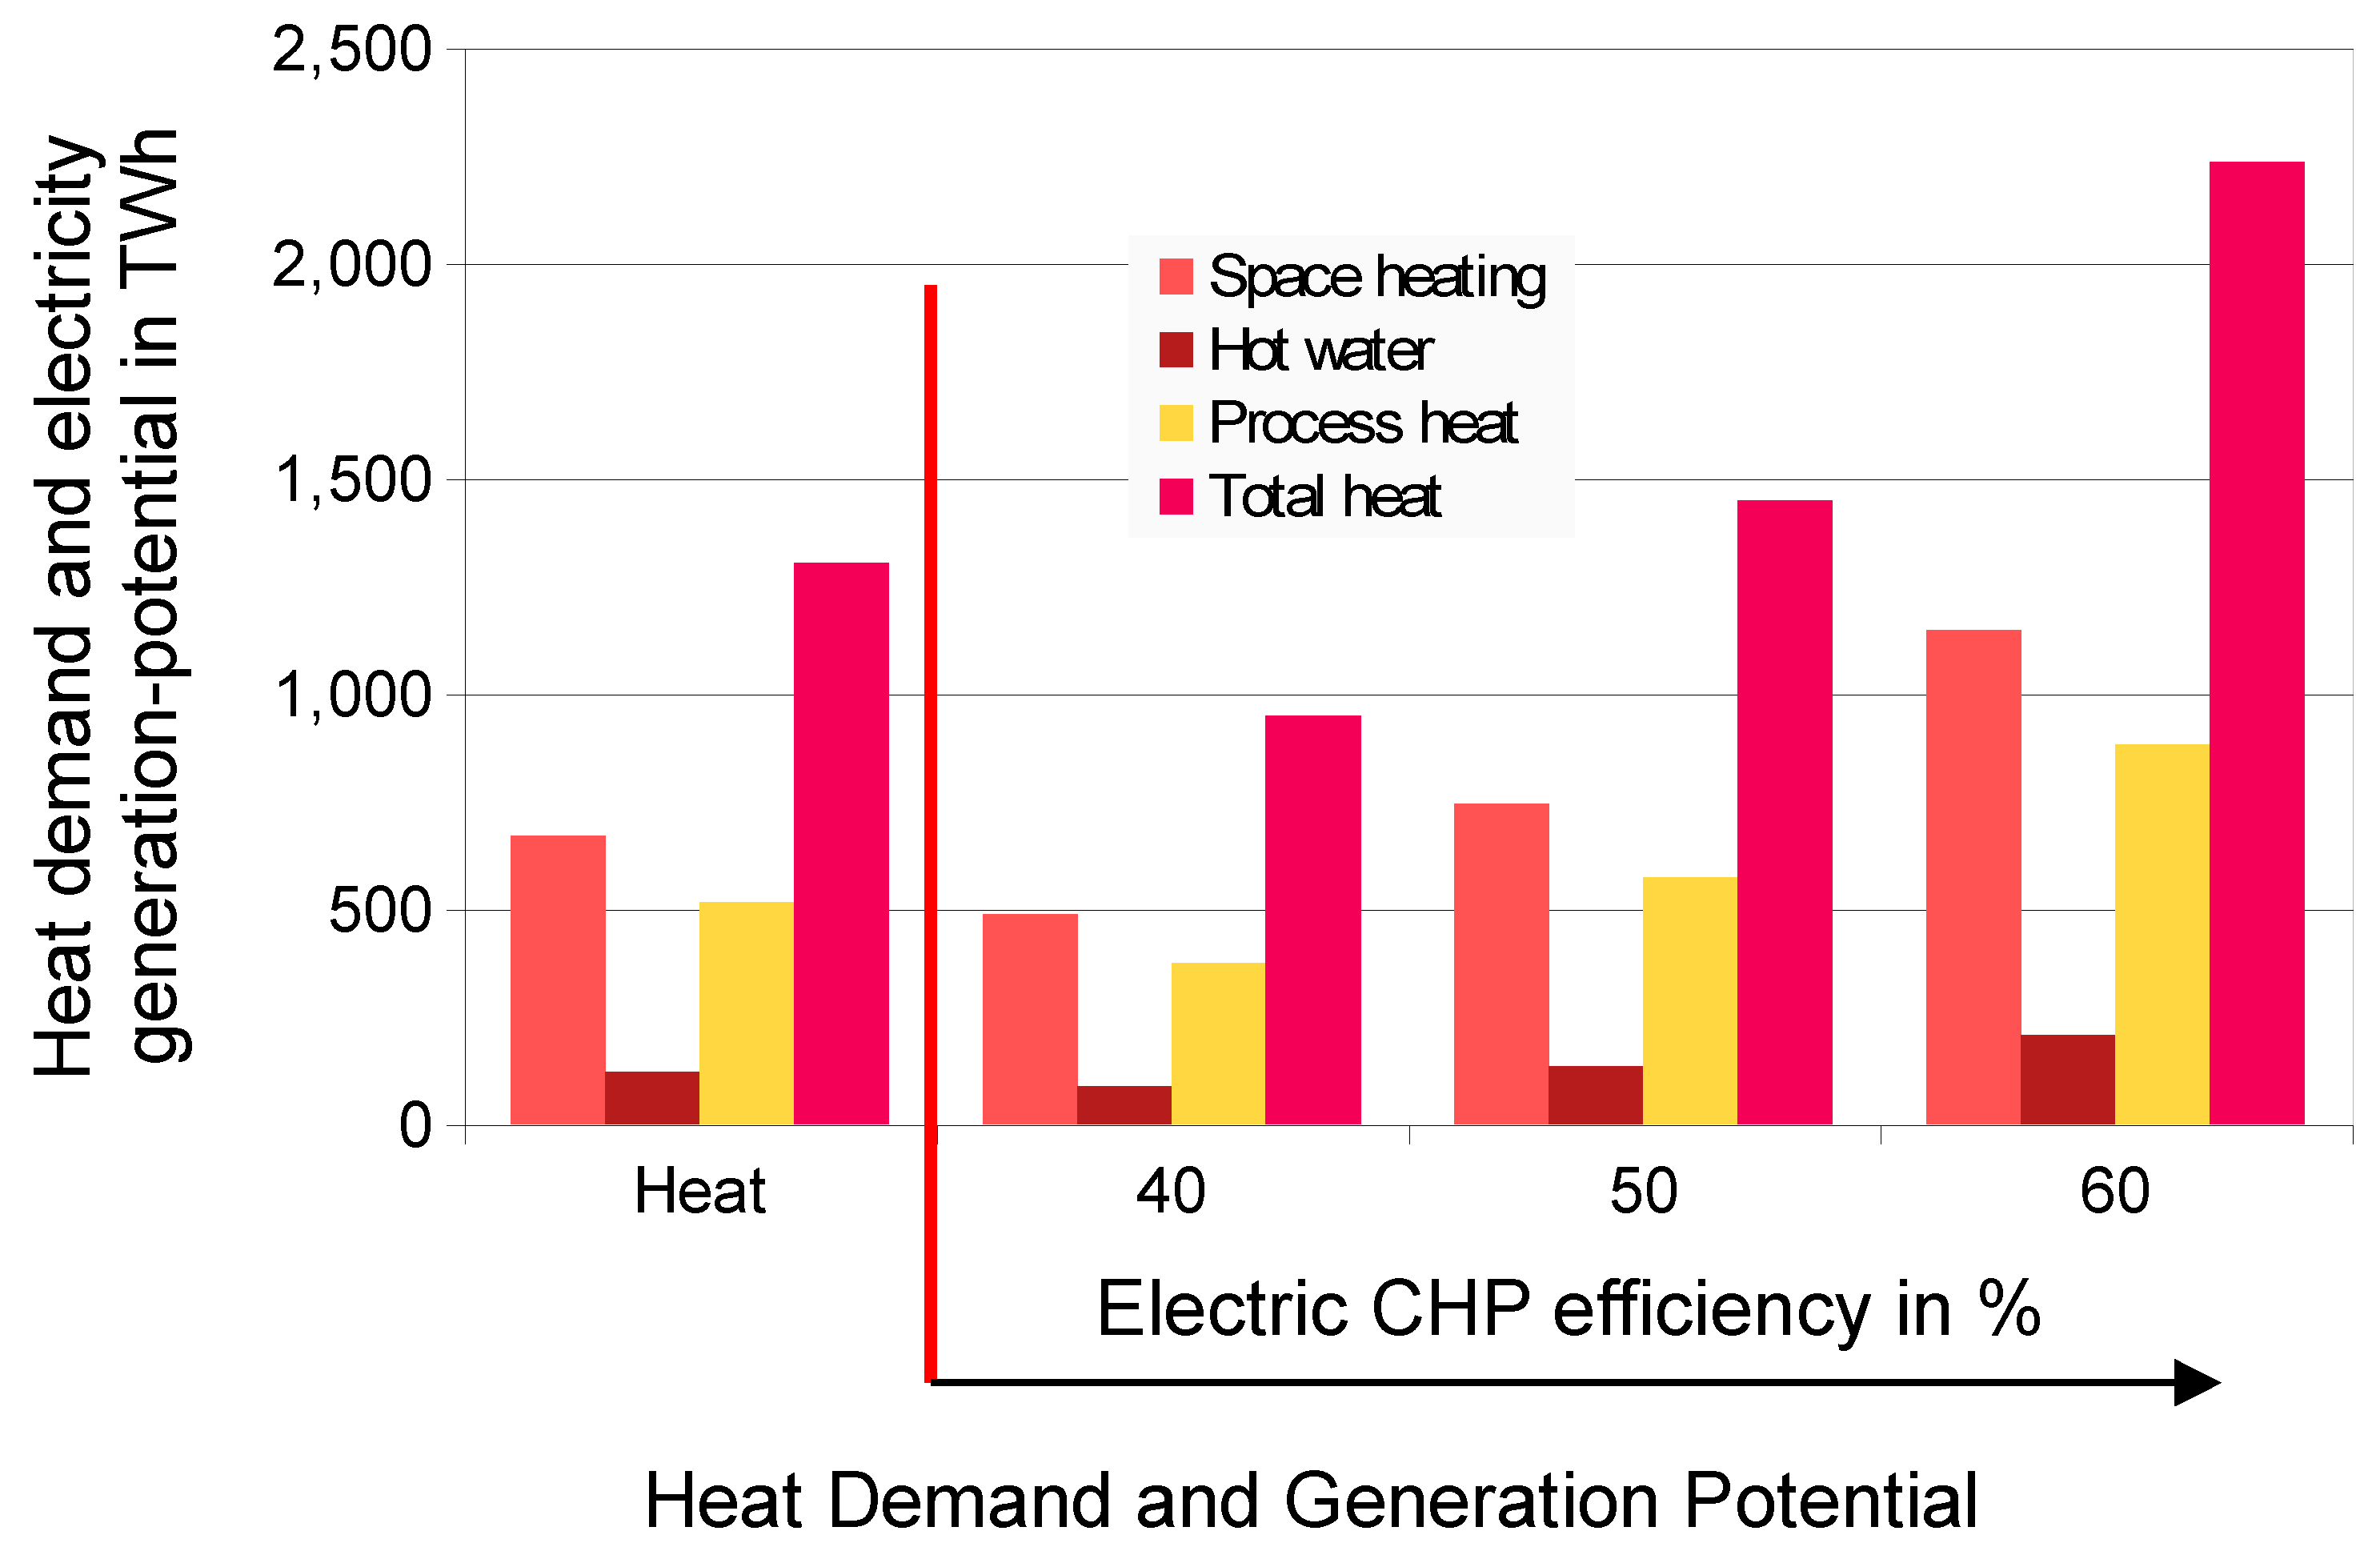
Figure 10.
The gas network as a potential storage and transport infrastructure.
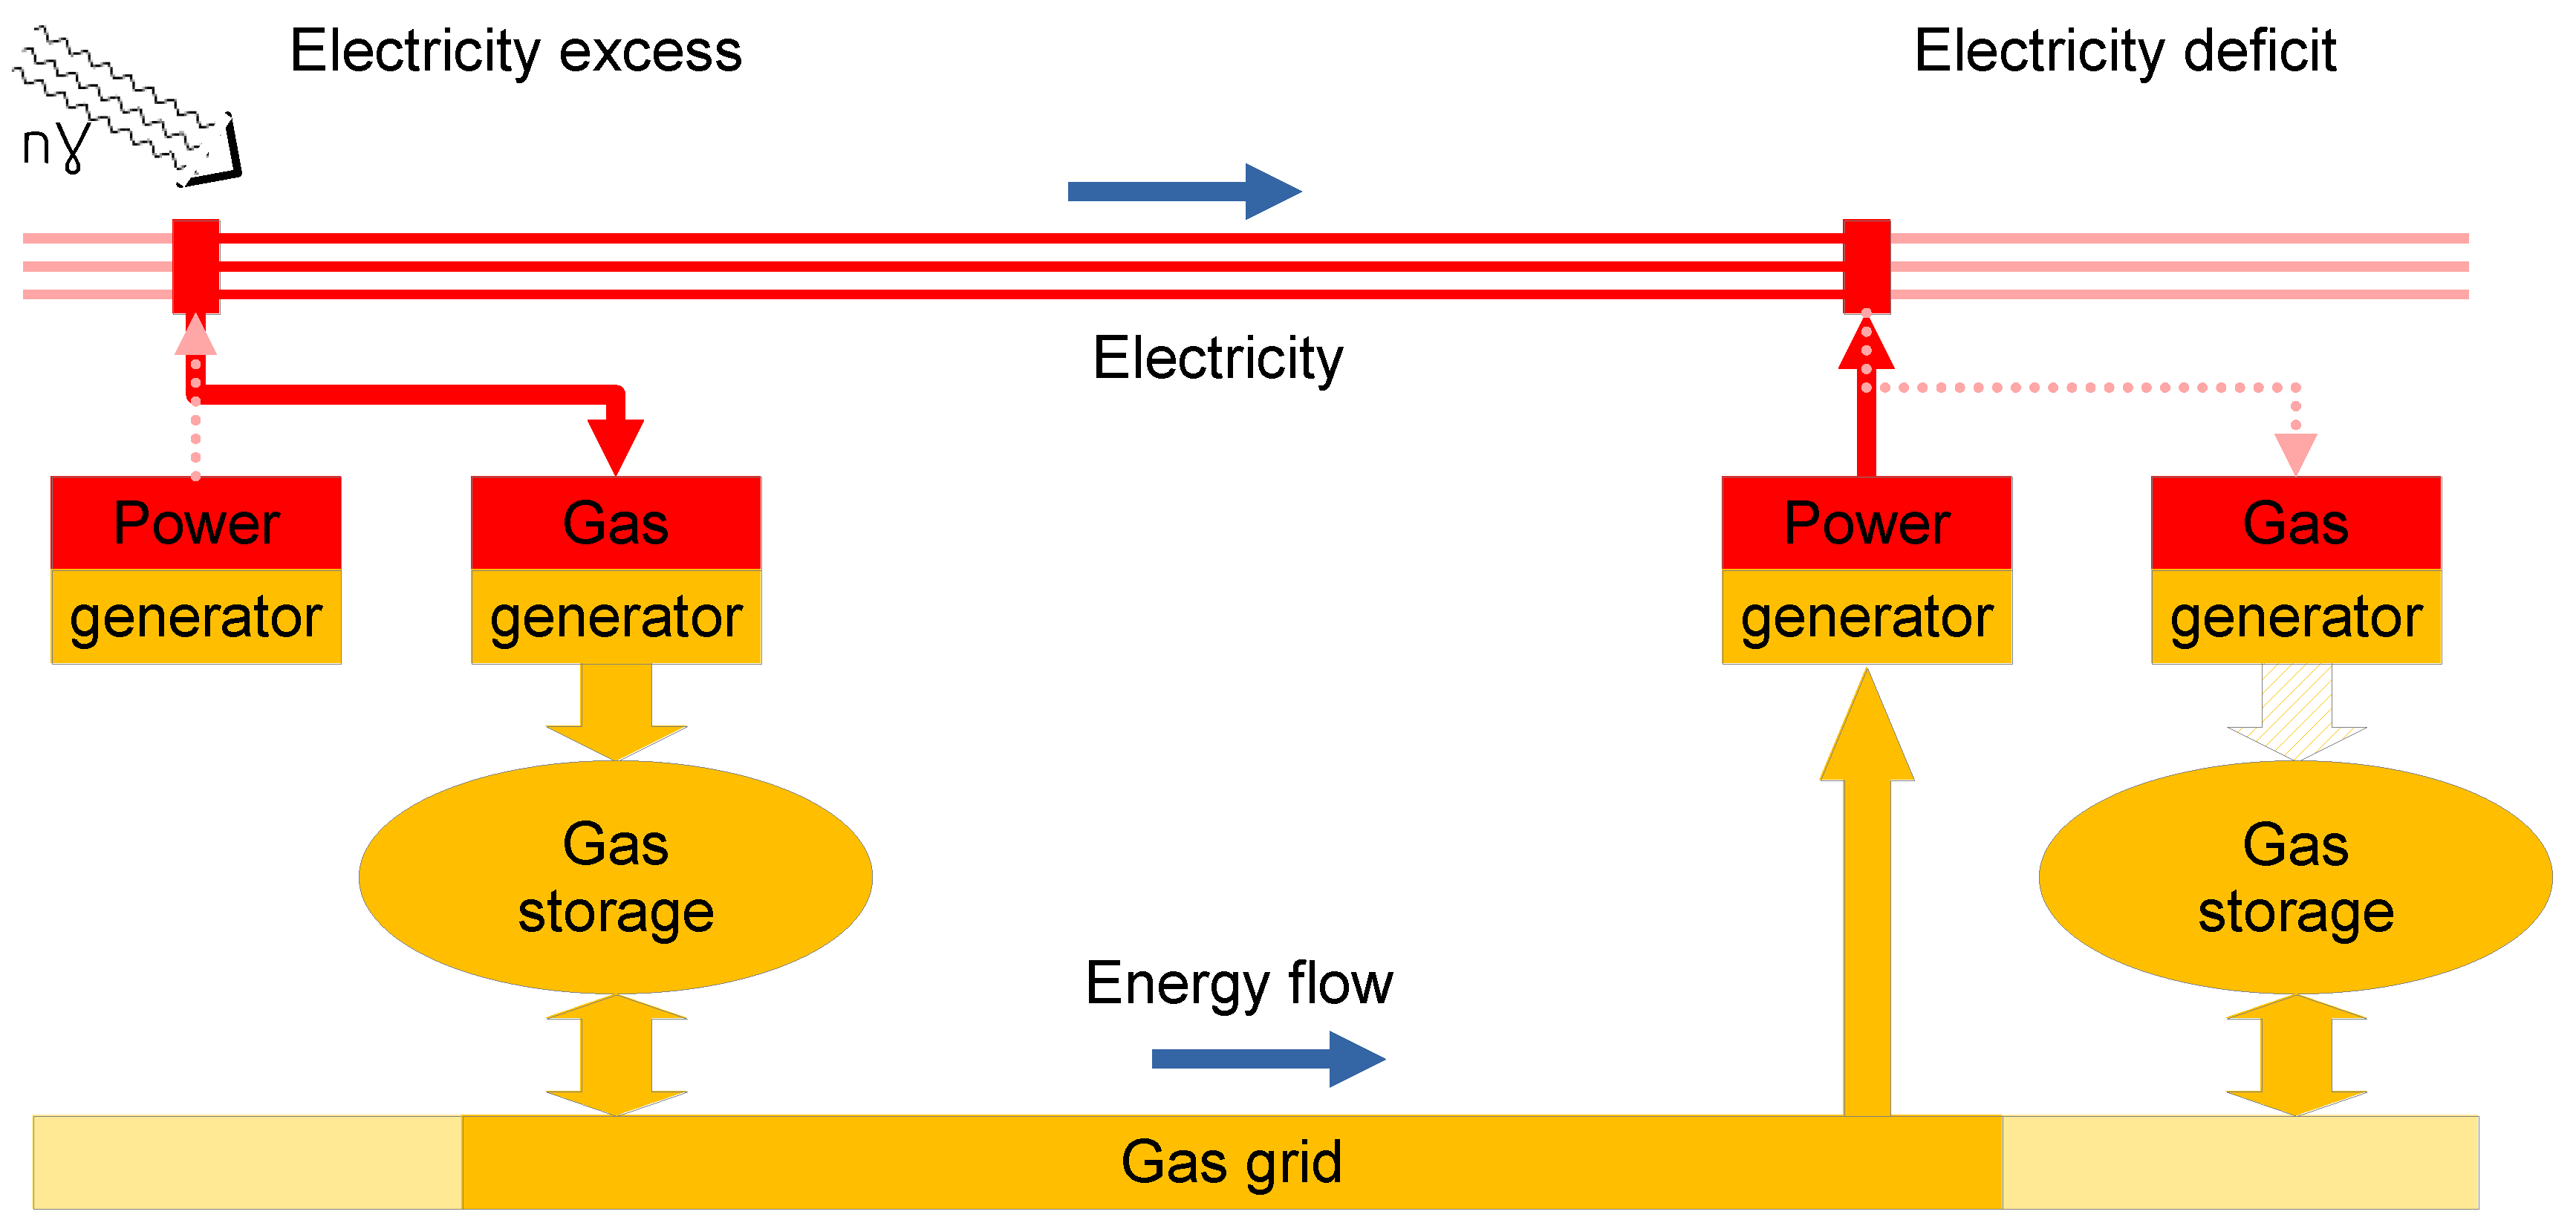
Figure 11.
Possible resilience strategy within the framework of a carbon cycle economy.
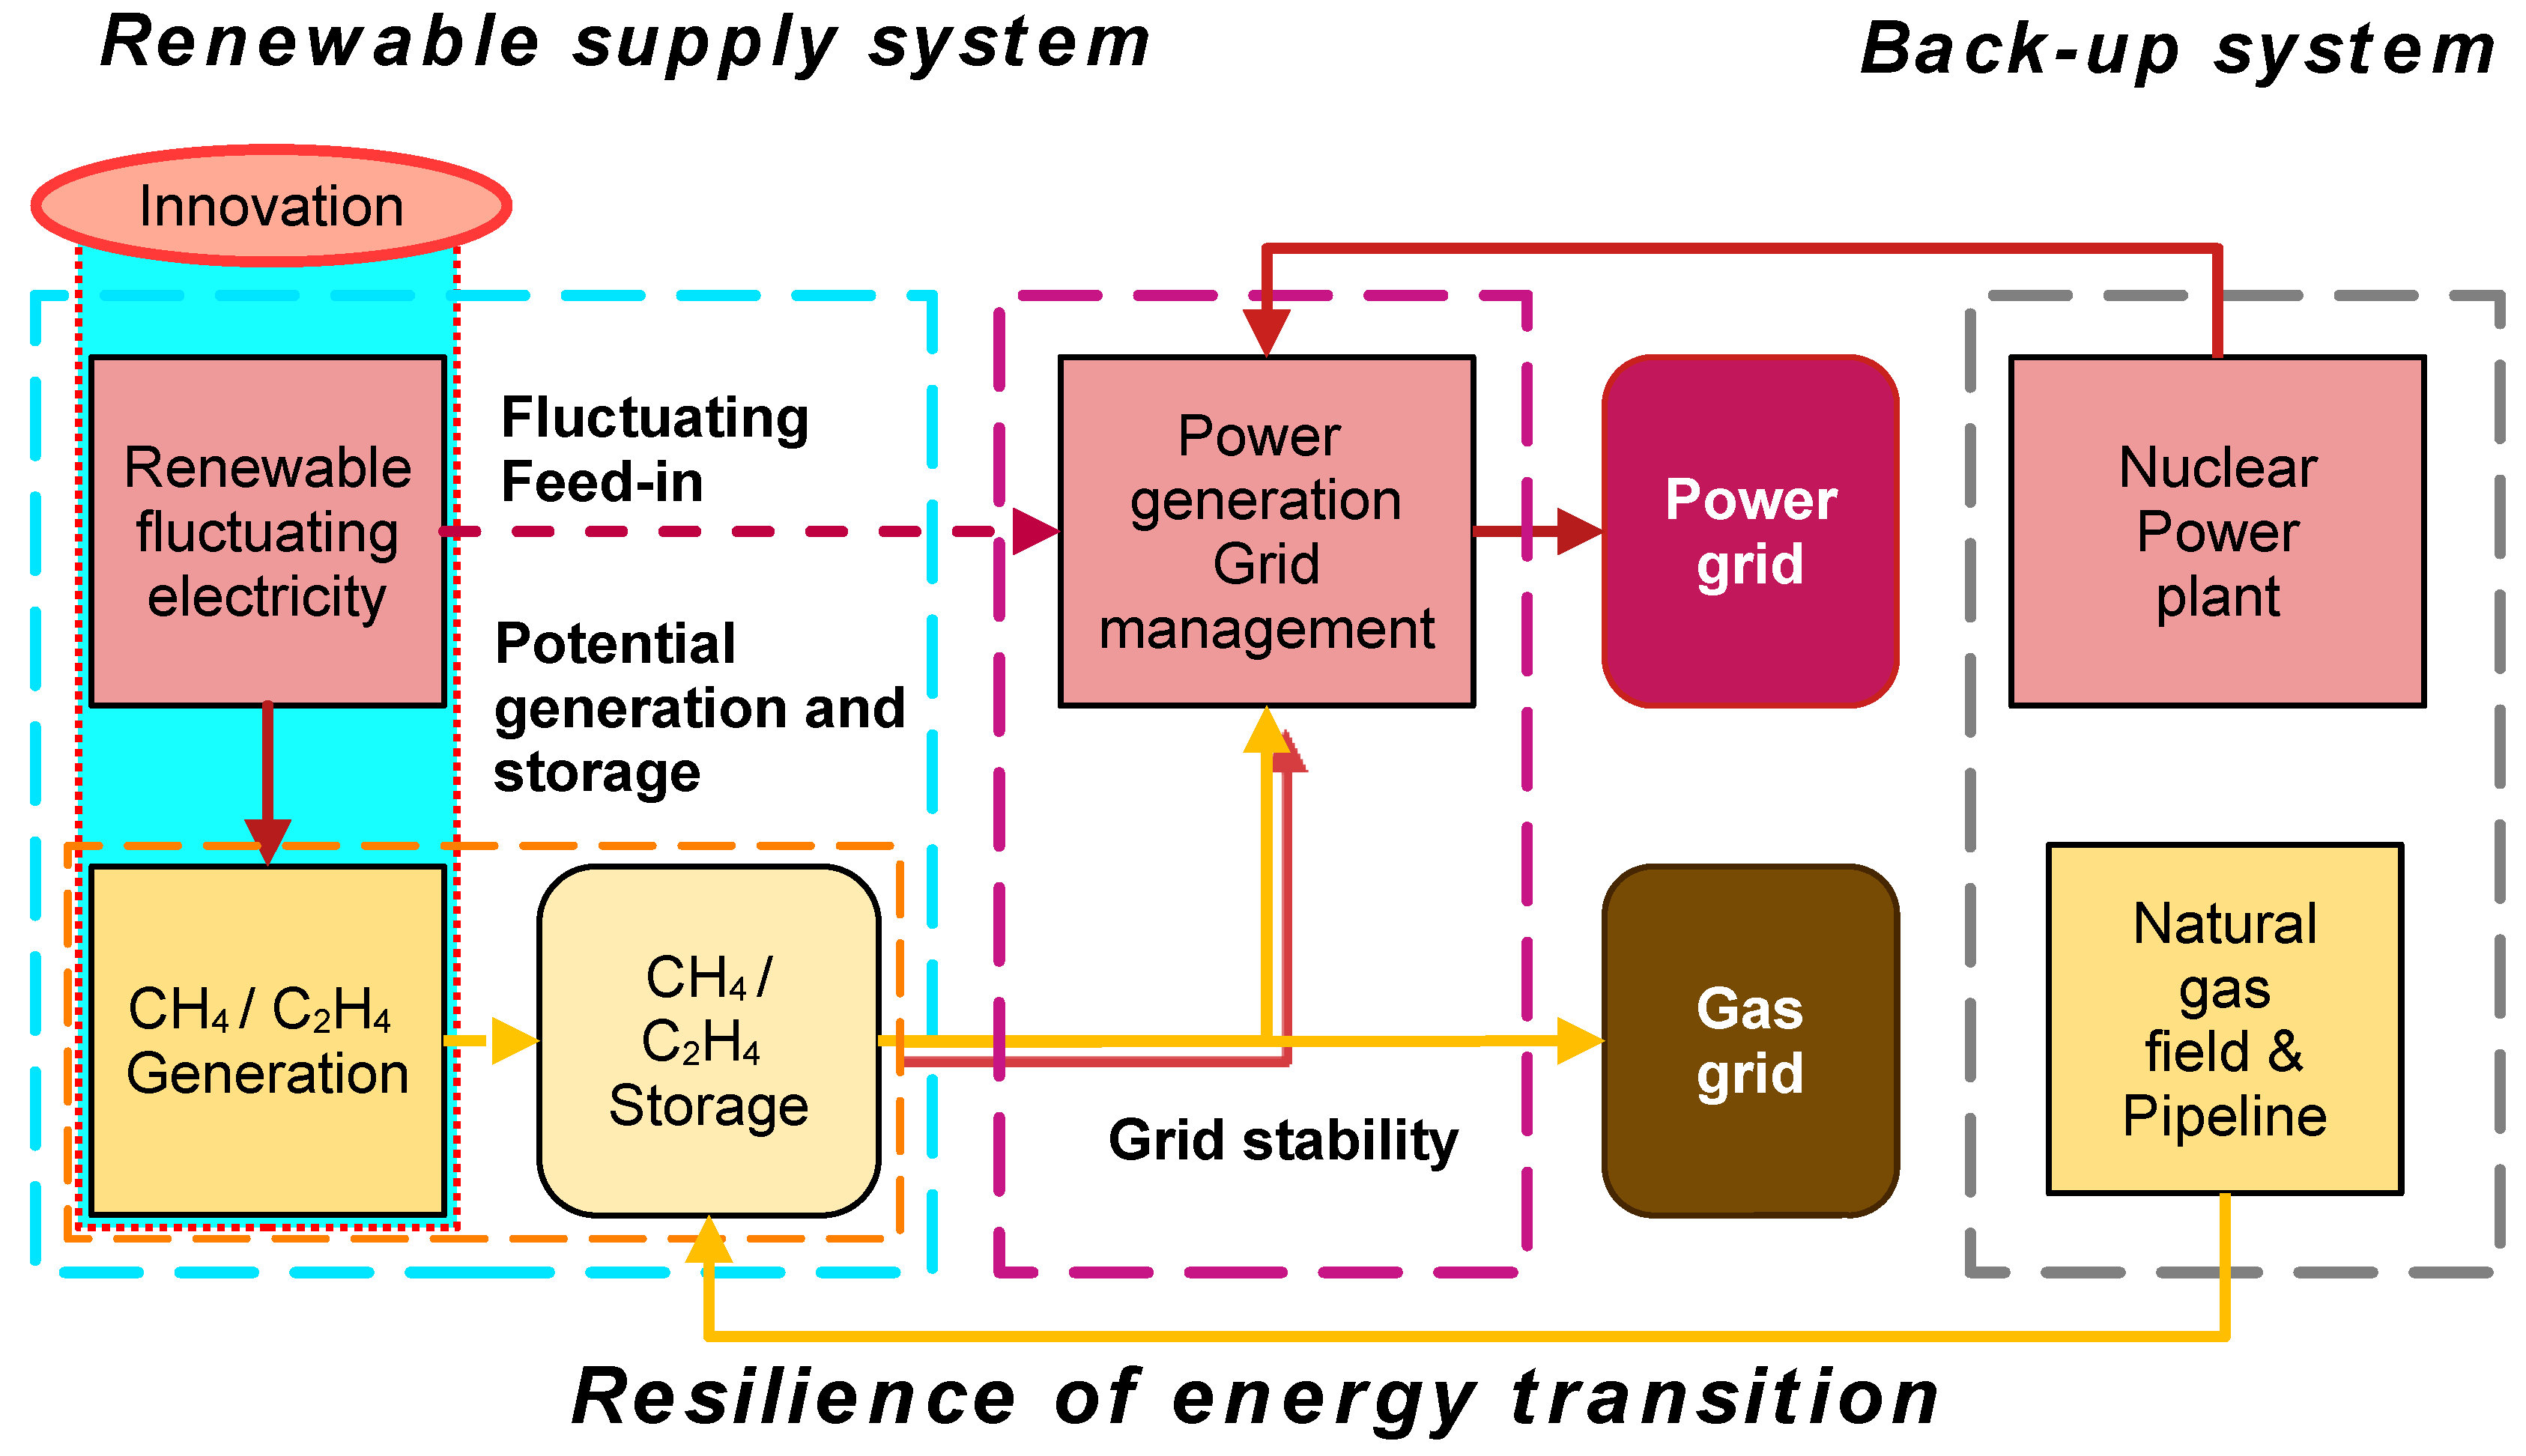
Figure 12.
Electricity cost share of investments in solar, wind, and nuclear energy.
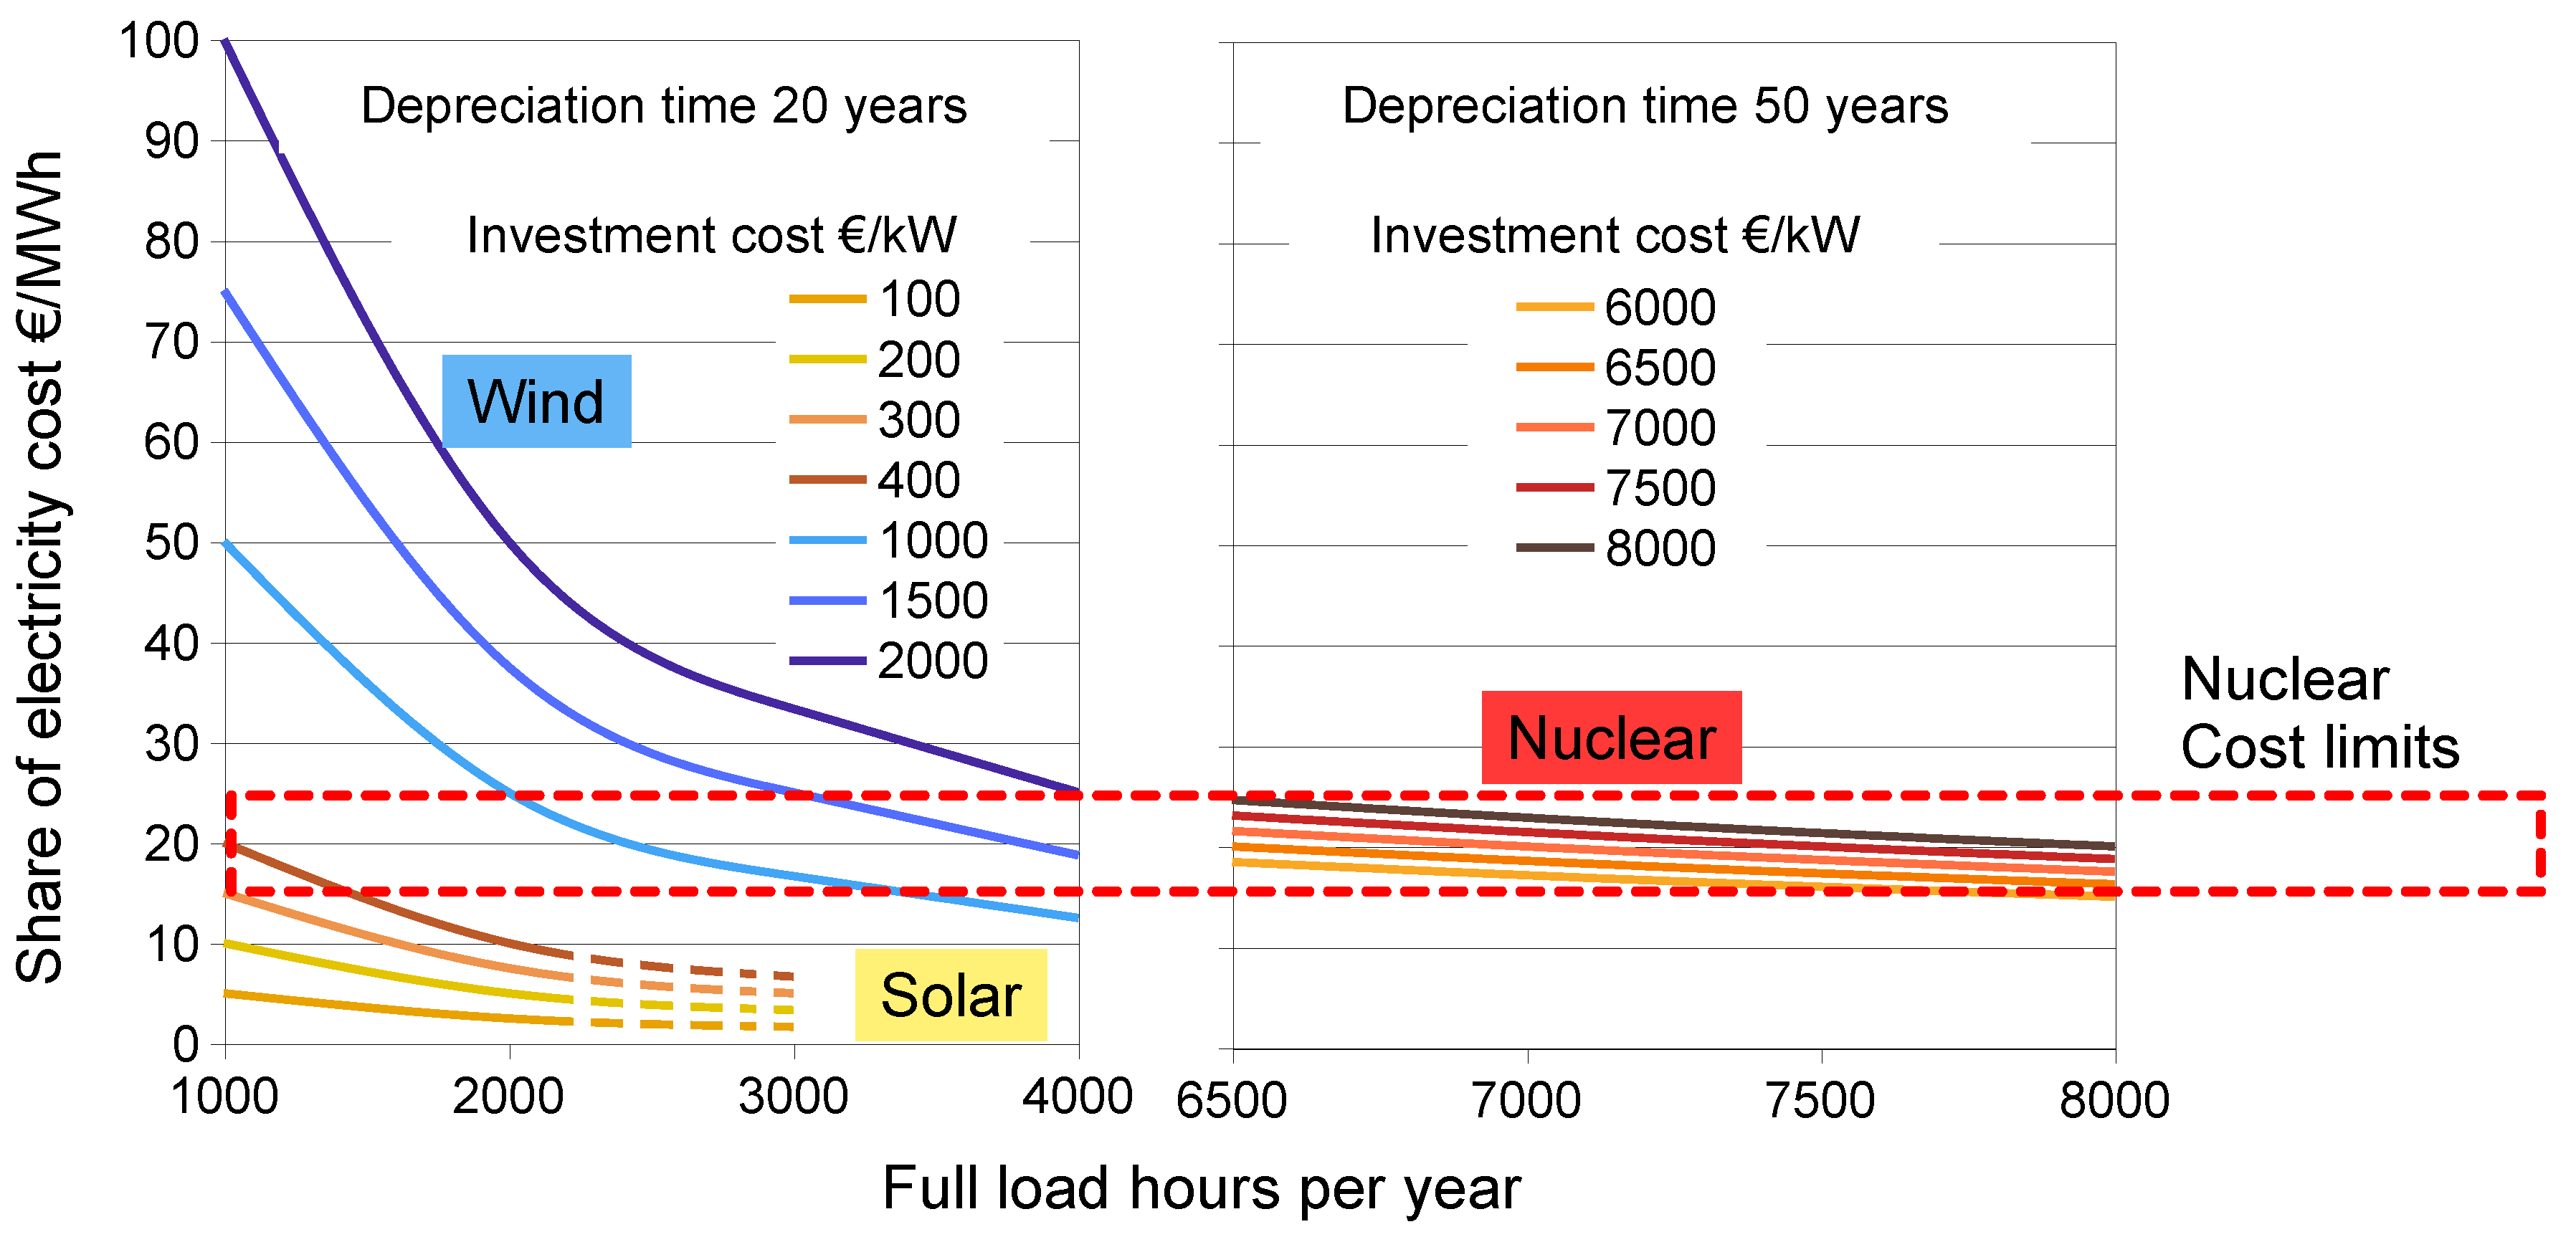
Figure 13.
Shift in responsibility for CO2 emissions [11].
Figure 13.
Shift in responsibility for CO2 emissions [11].
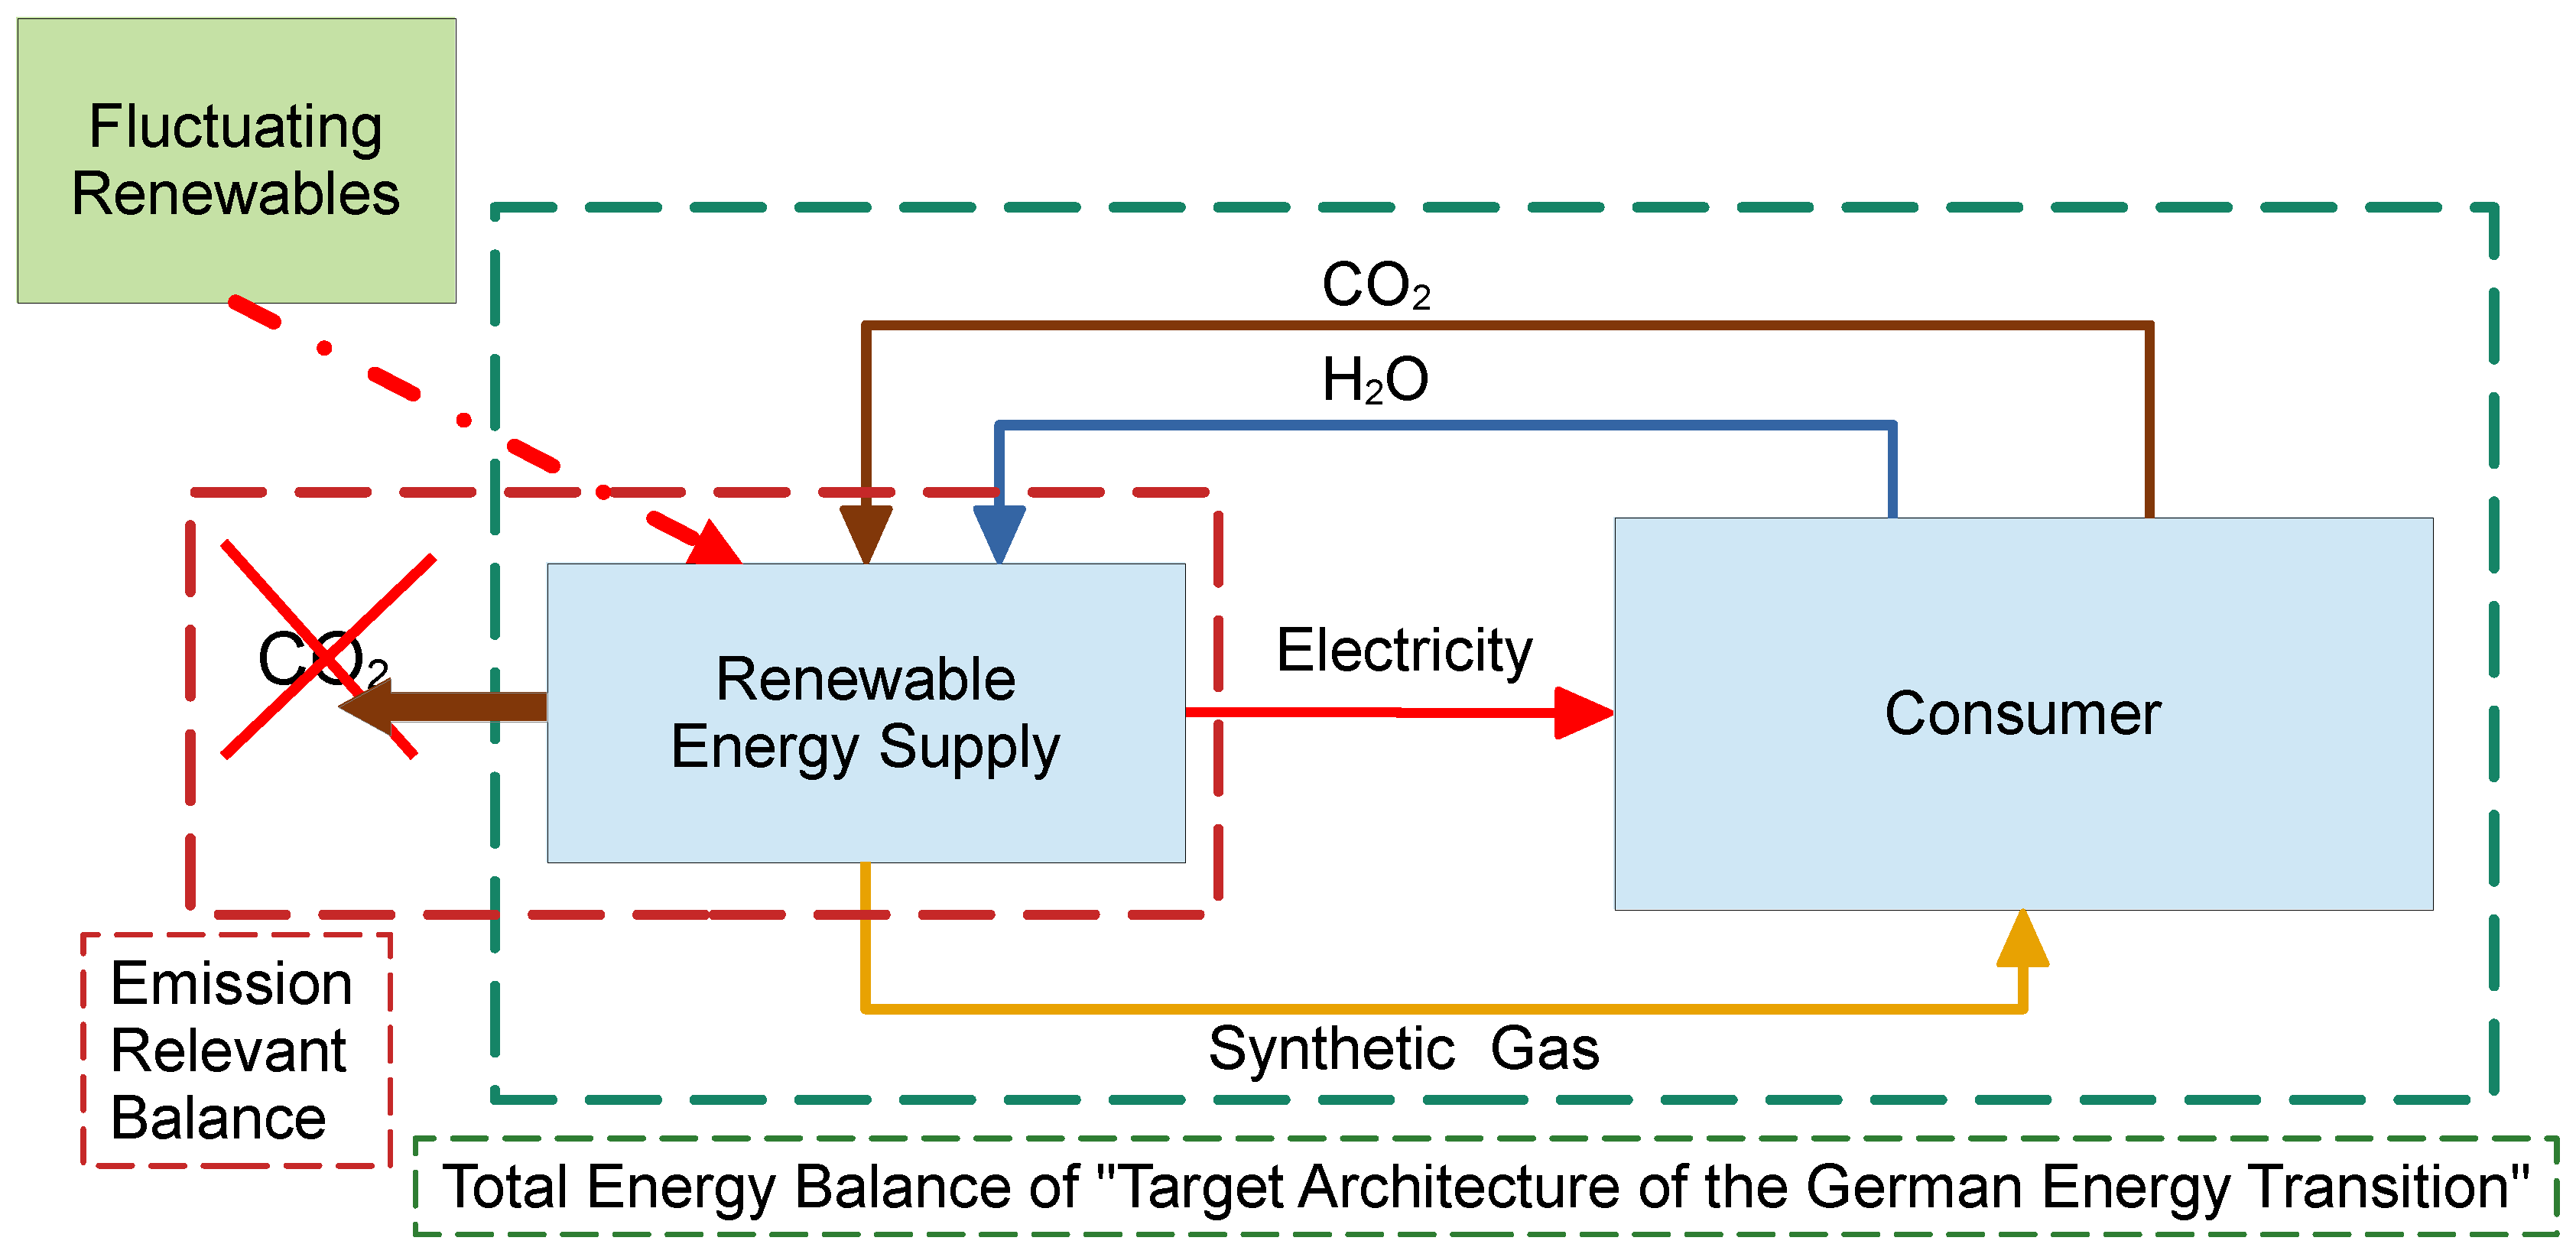
Figure 14.
Cost differences between the Solar100 and Agora strategies.
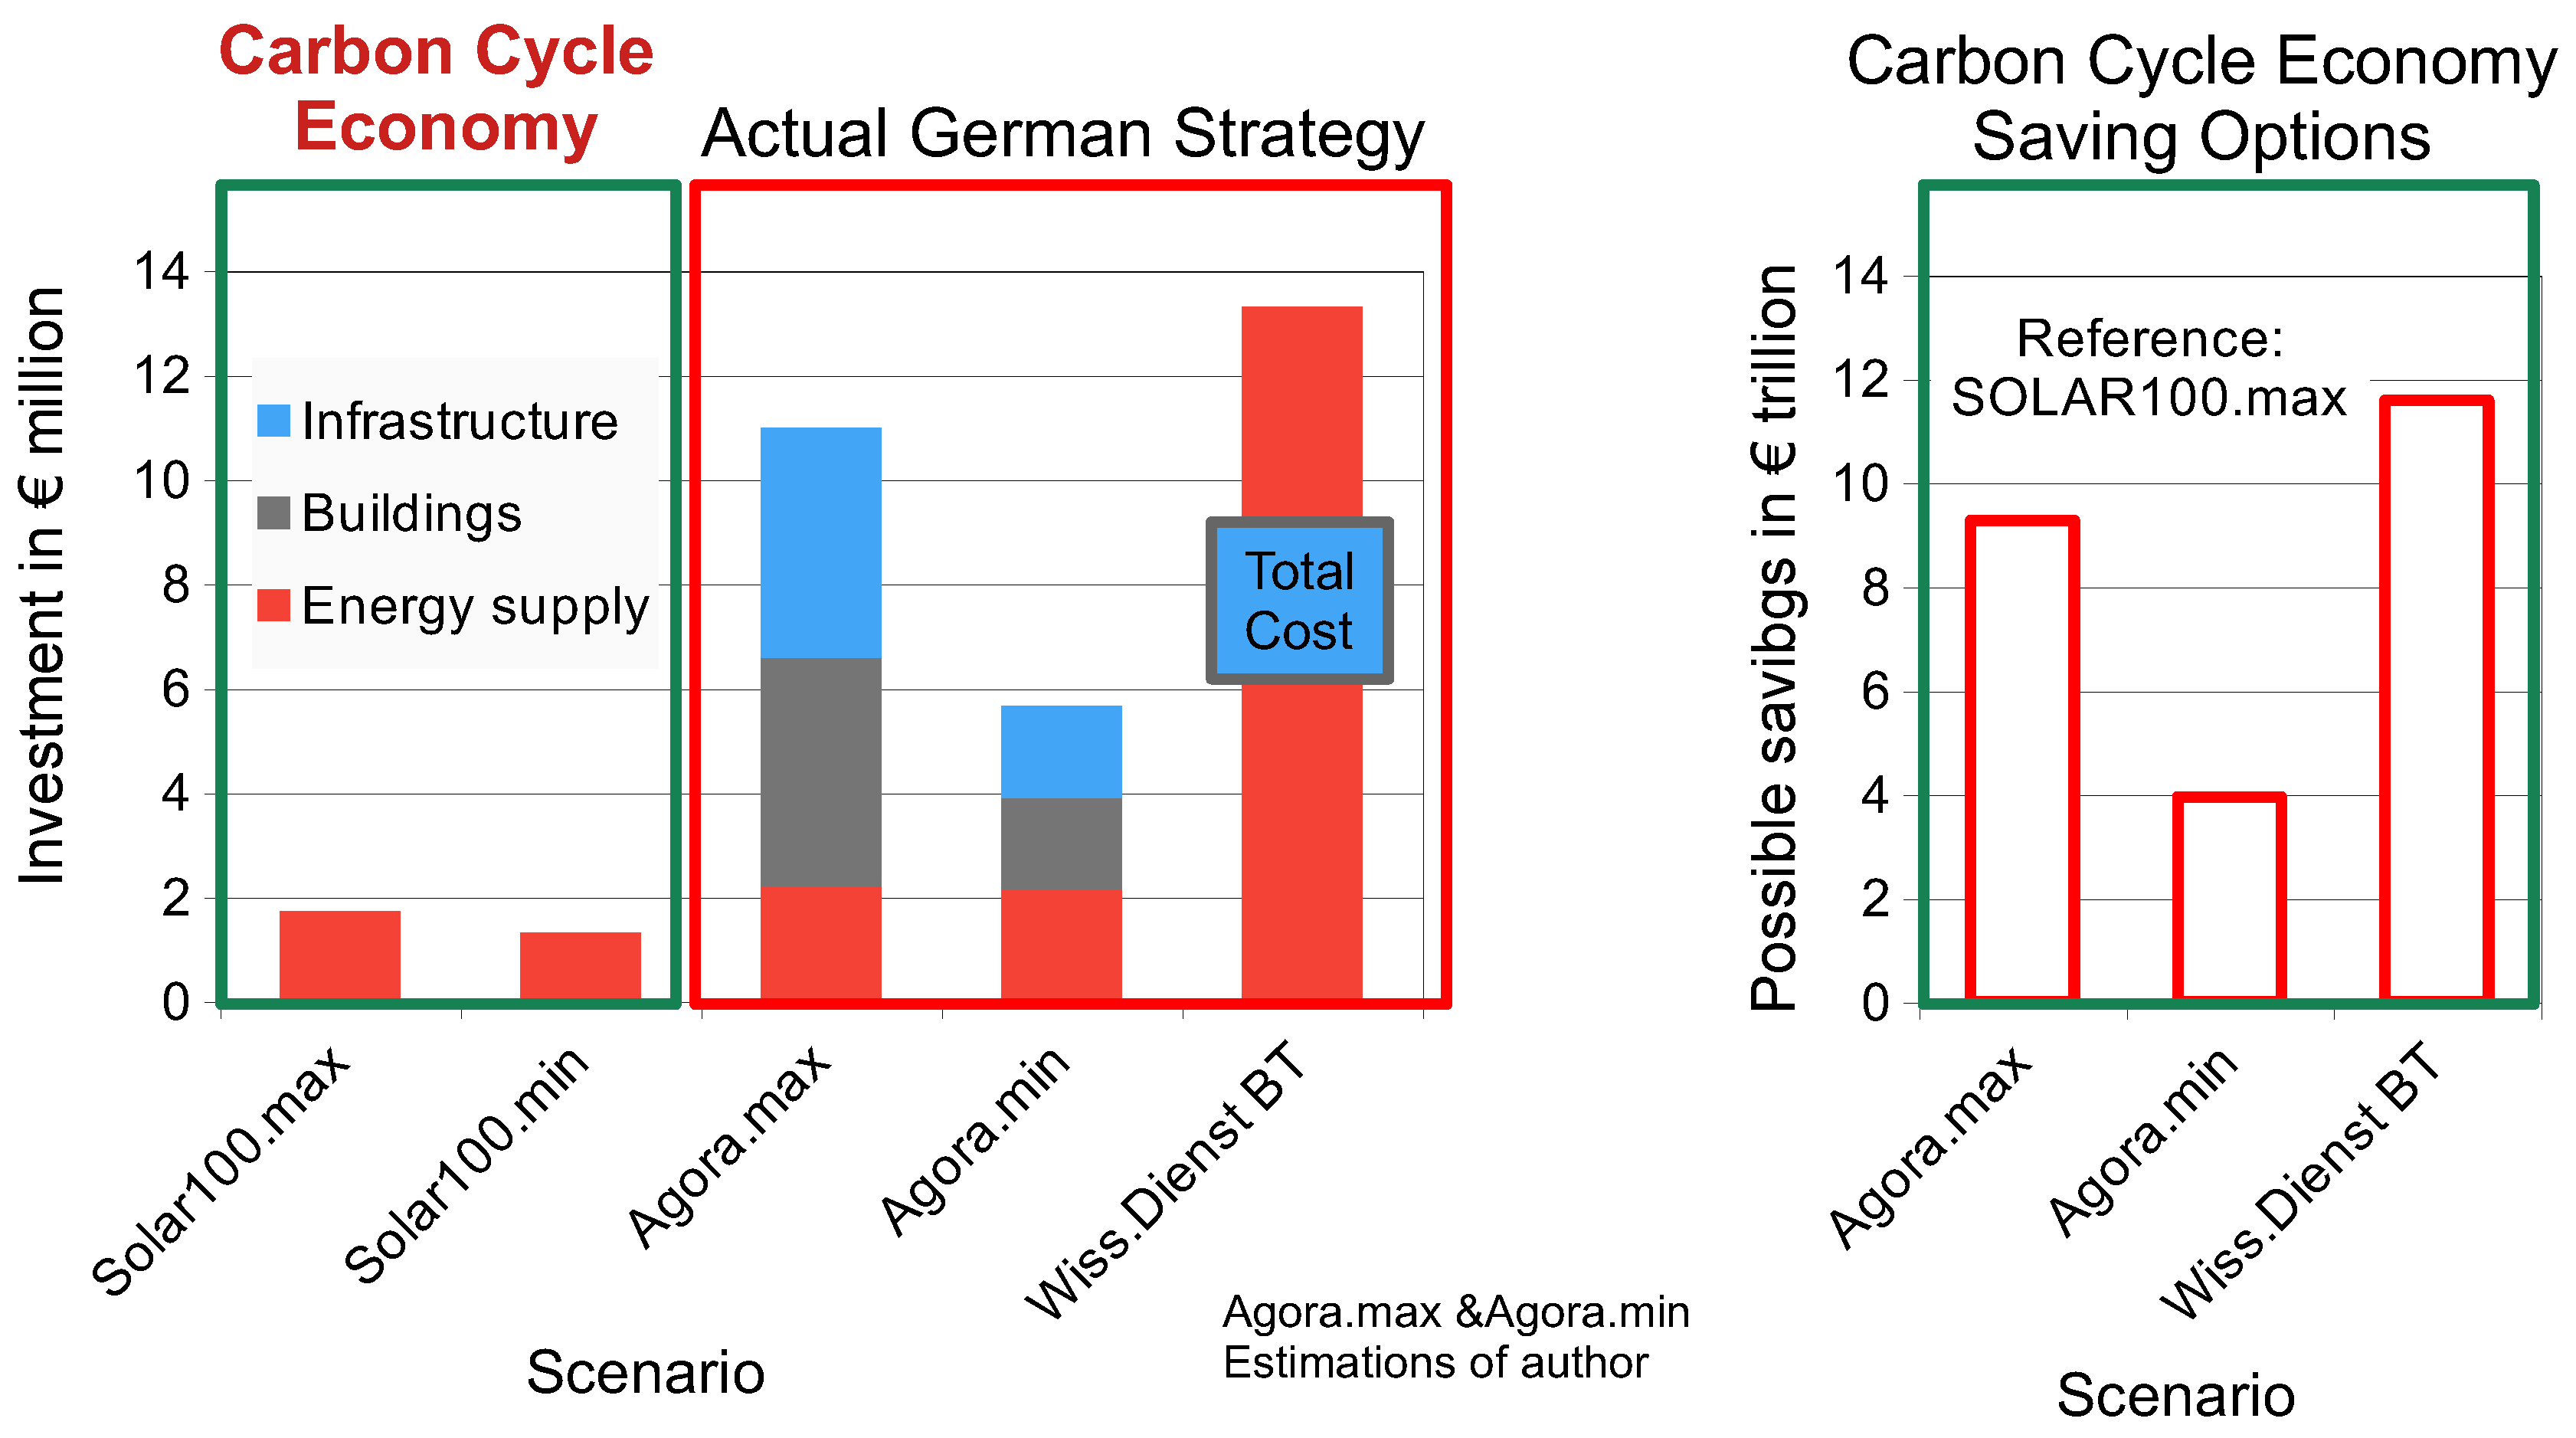
Figure 15.
Effects of an increase in PV capacity in winter based on [28].
Figure 15.
Effects of an increase in PV capacity in winter based on [28].
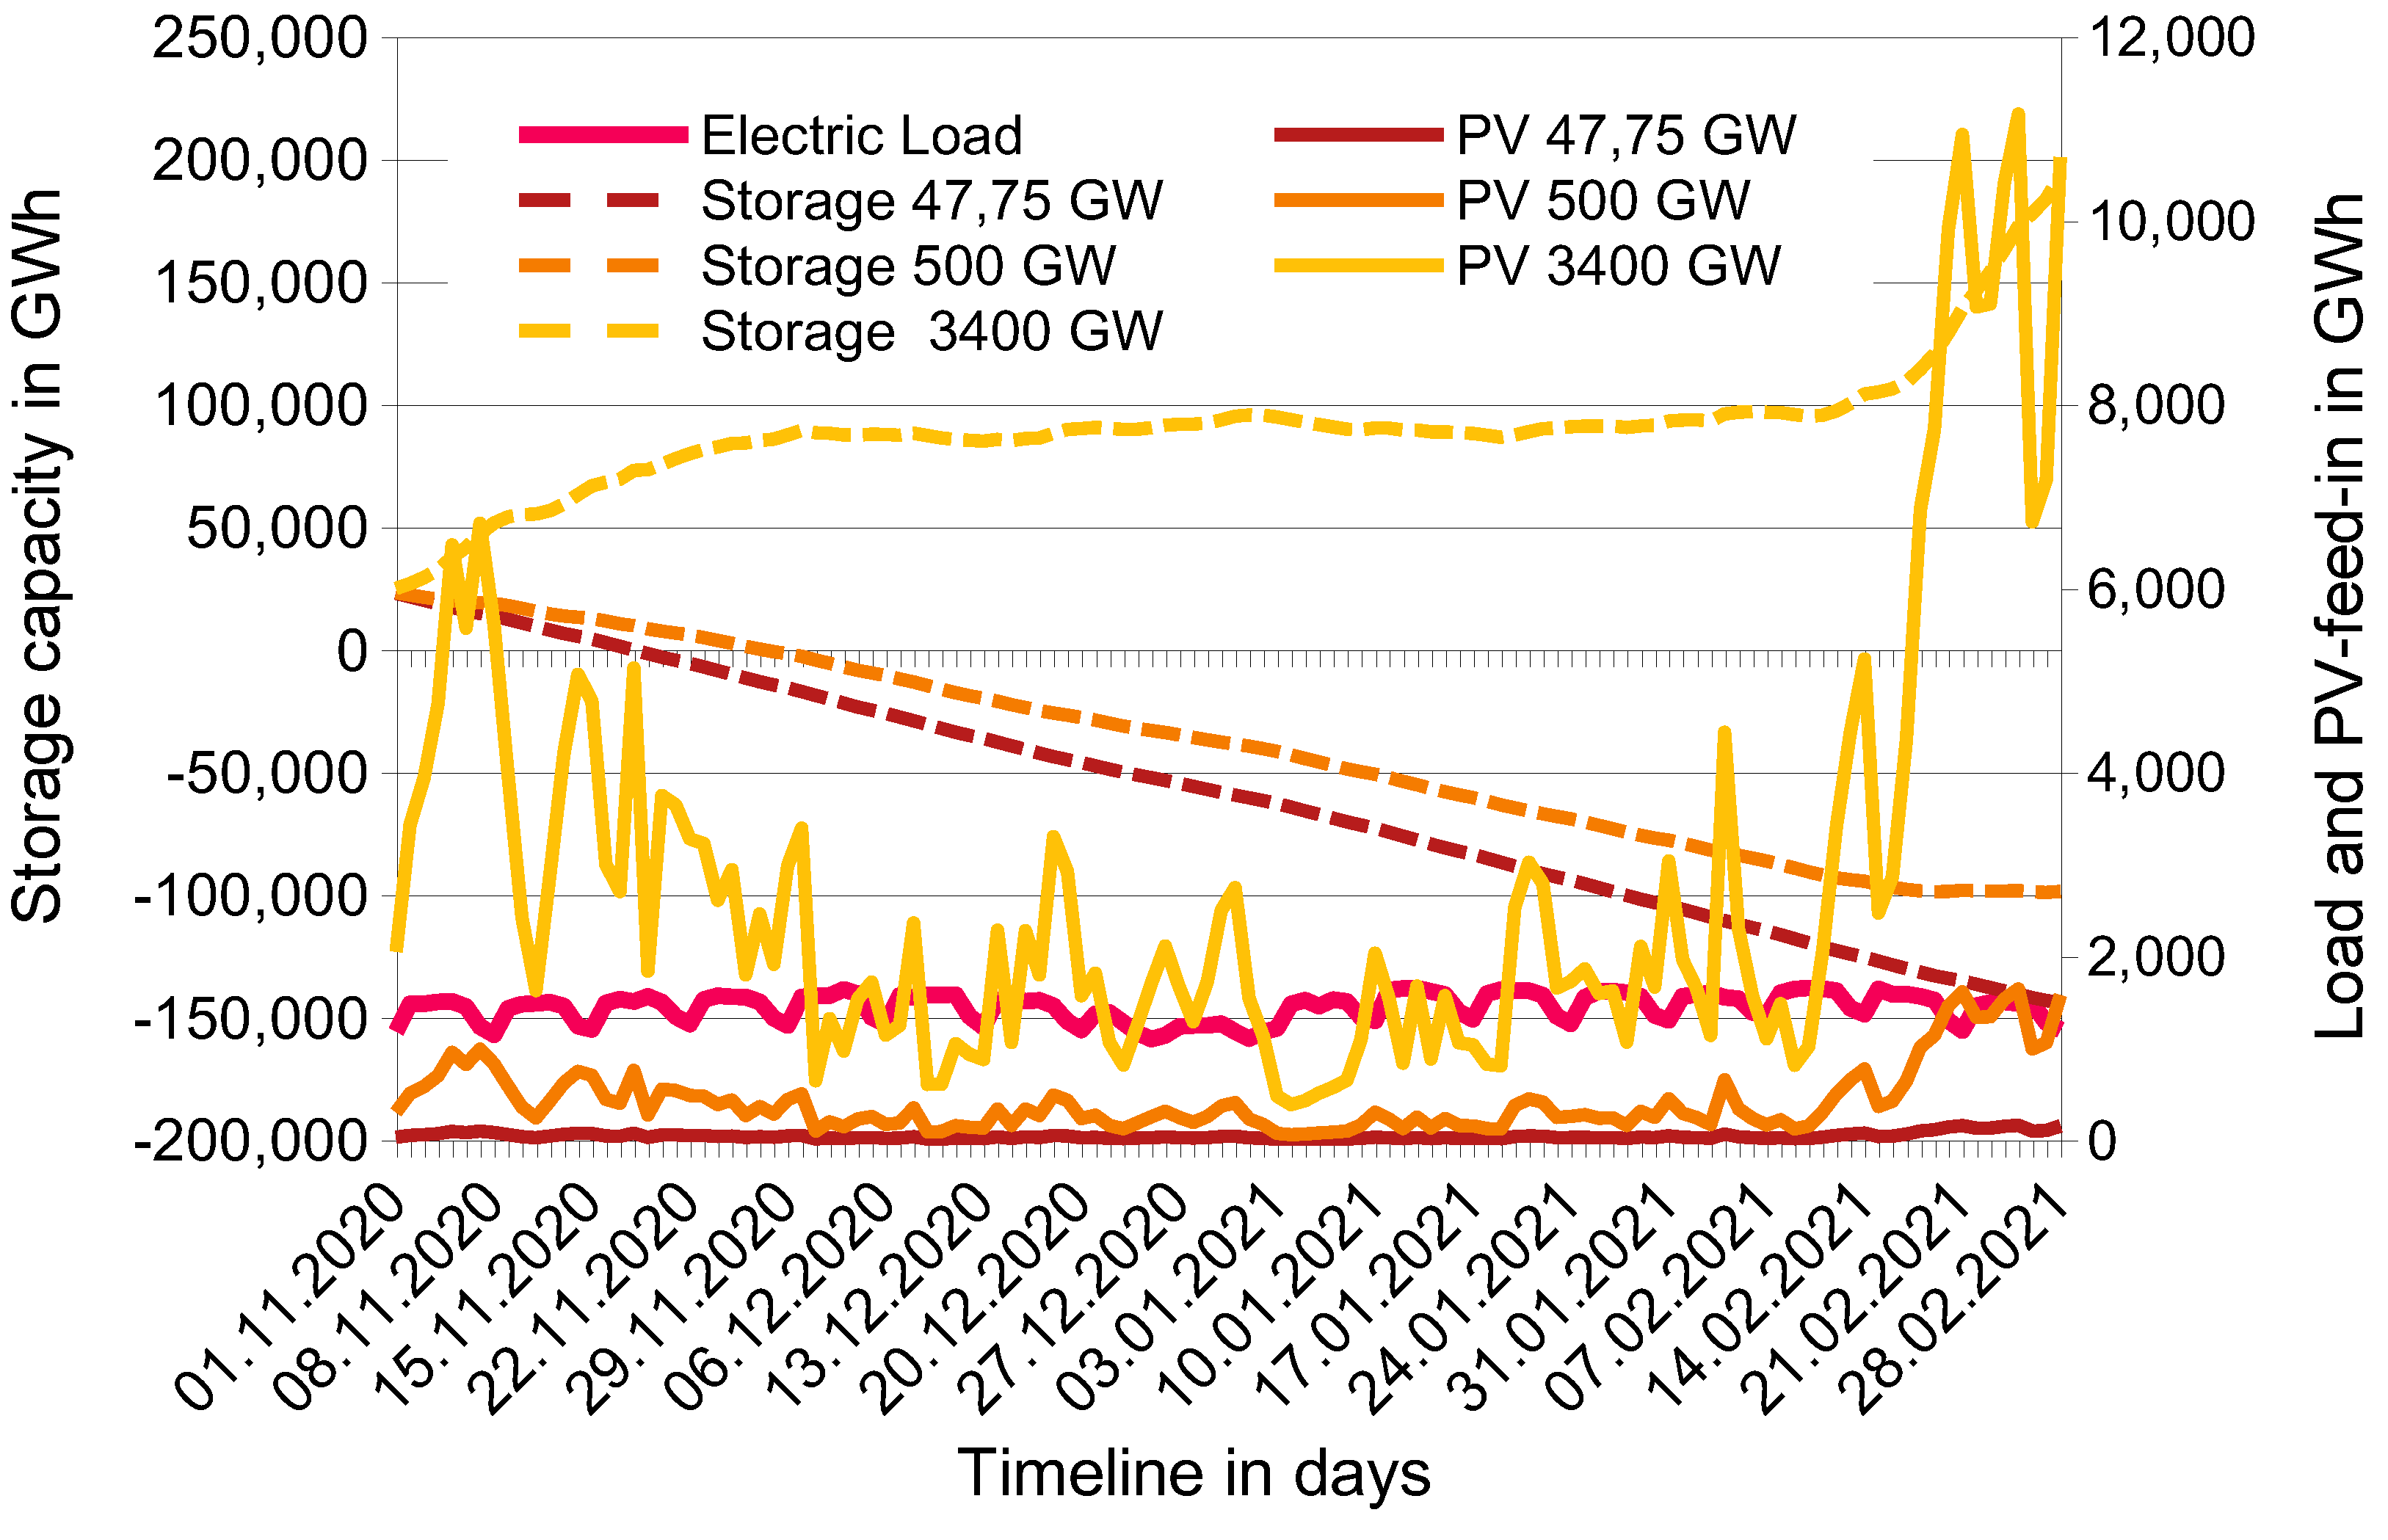
Figure 16.
Electricity exports and electricity prices paid at early April 2025 [28].
Figure 16.
Electricity exports and electricity prices paid at early April 2025 [28].
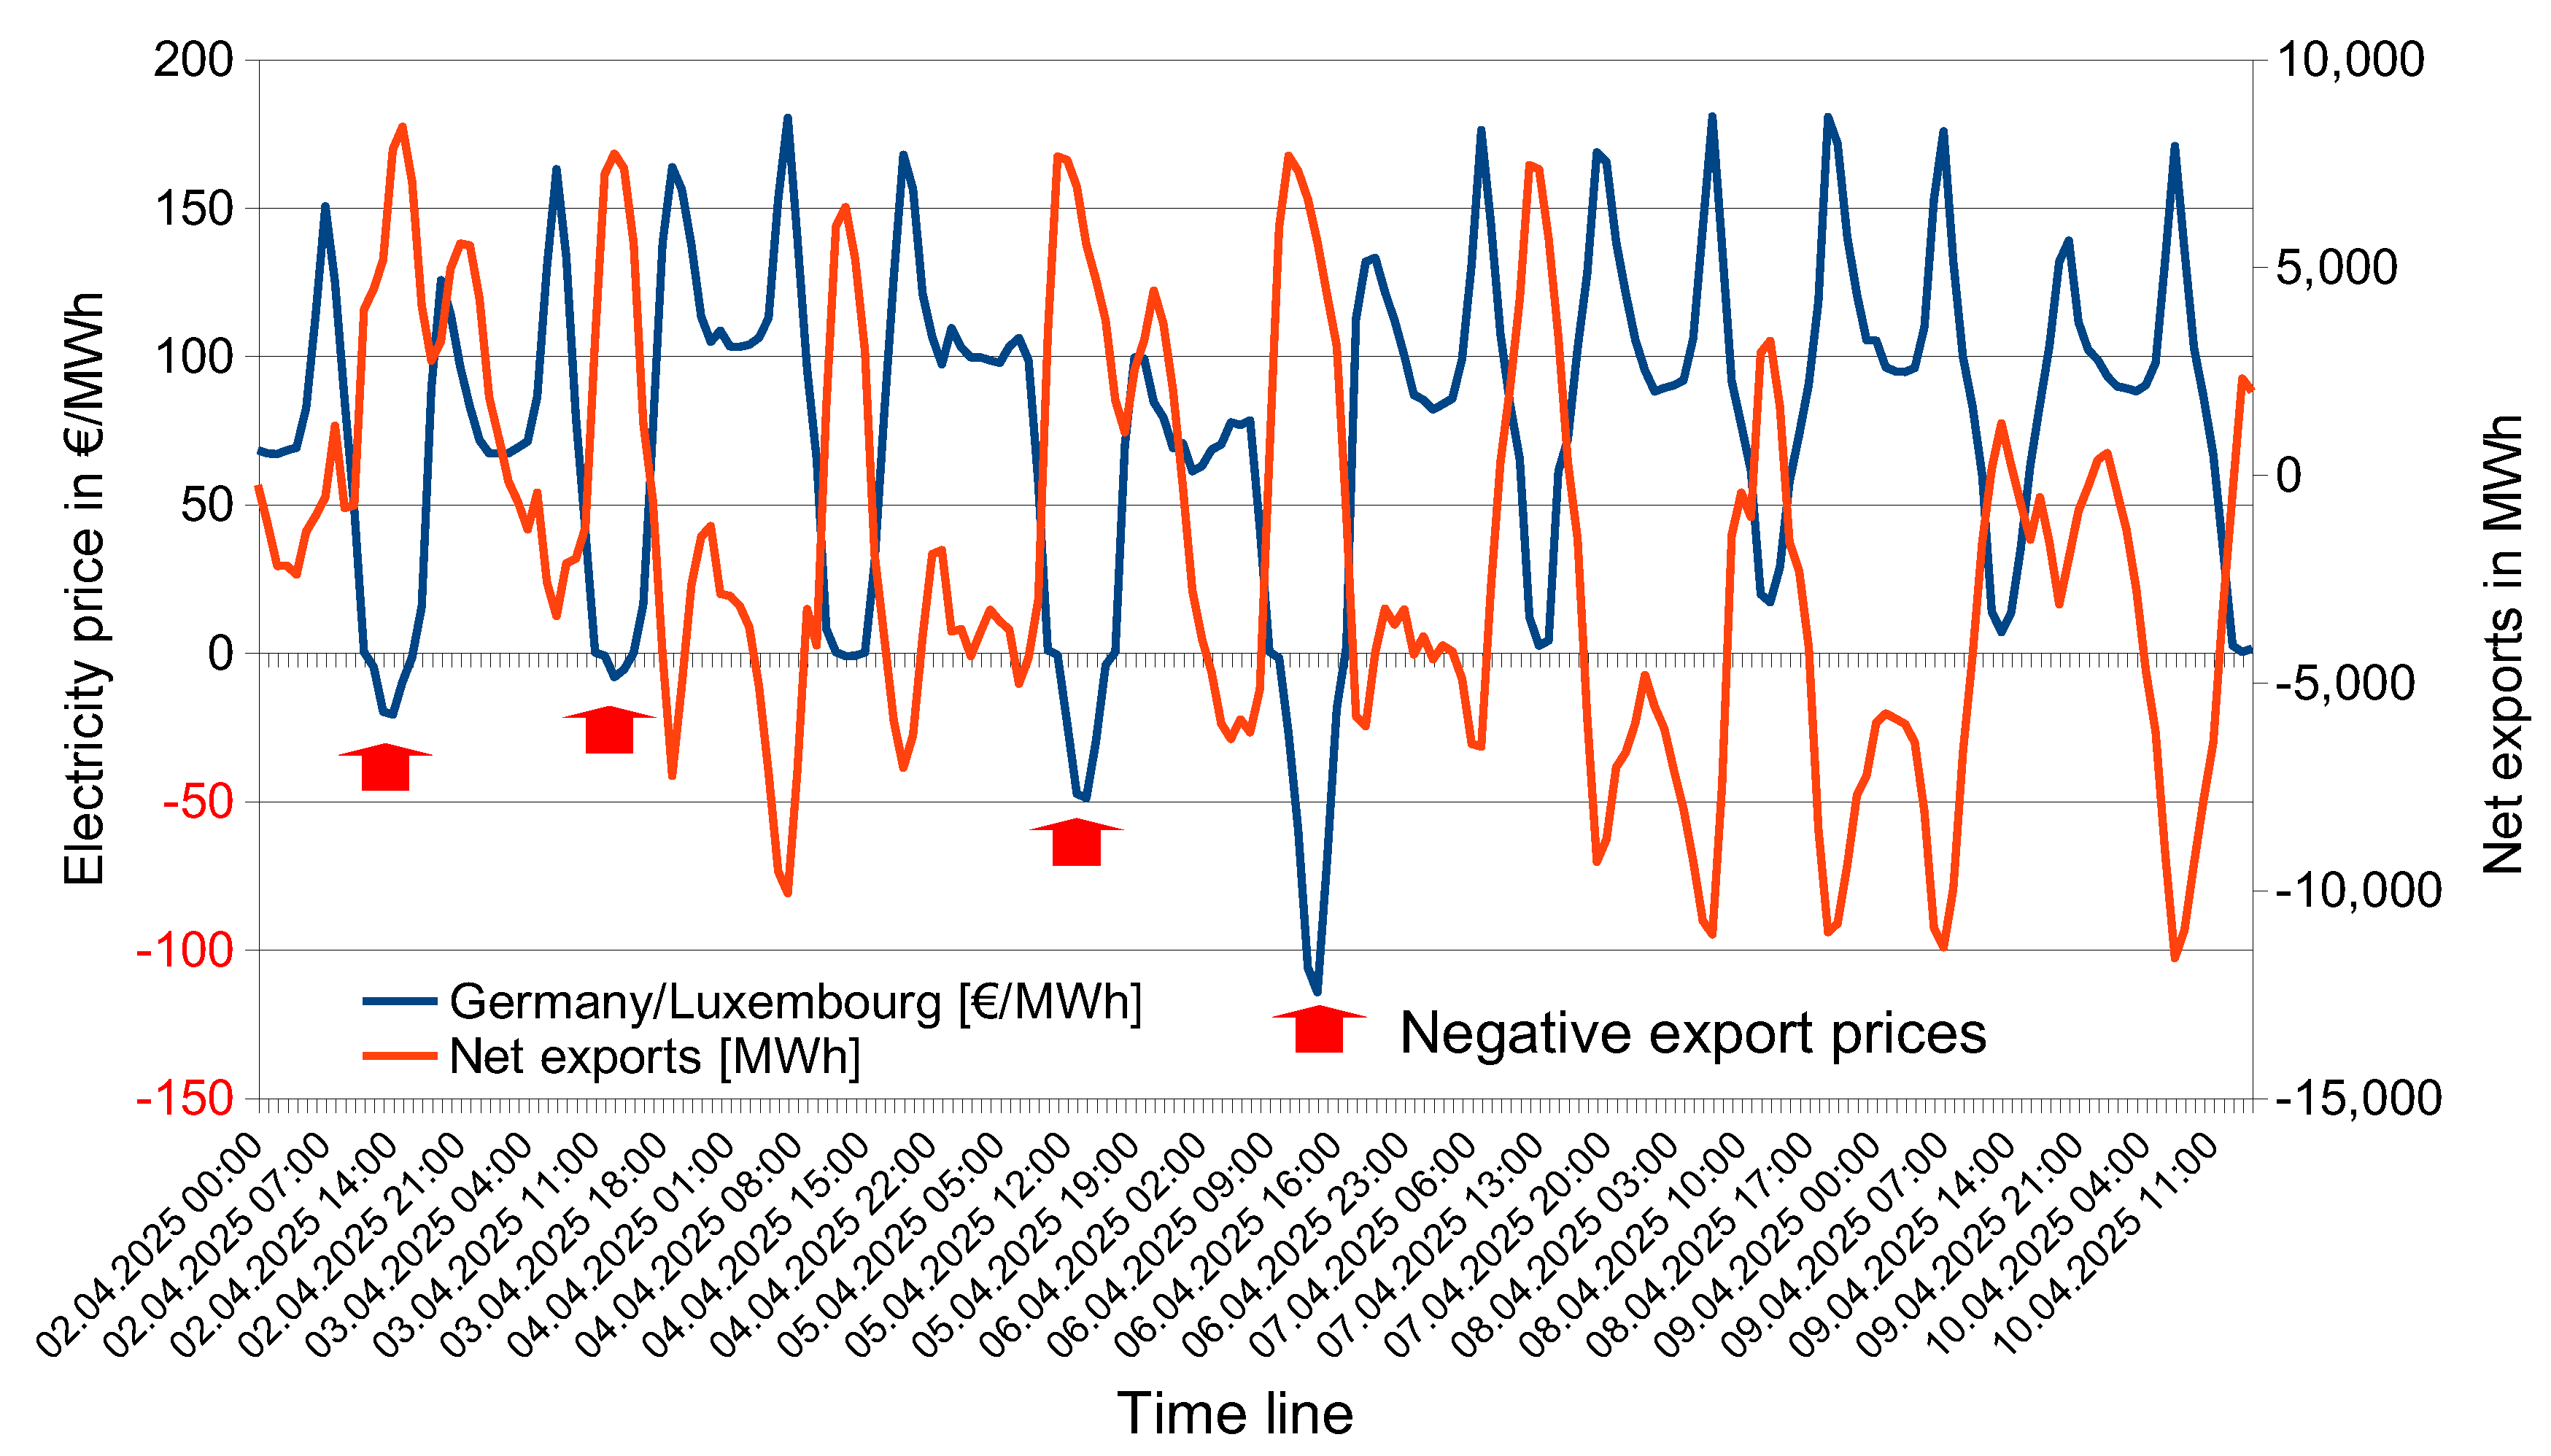
Figure 17.
Technical data and potential revenues for gas generators [30].
Figure 17.
Technical data and potential revenues for gas generators [30].
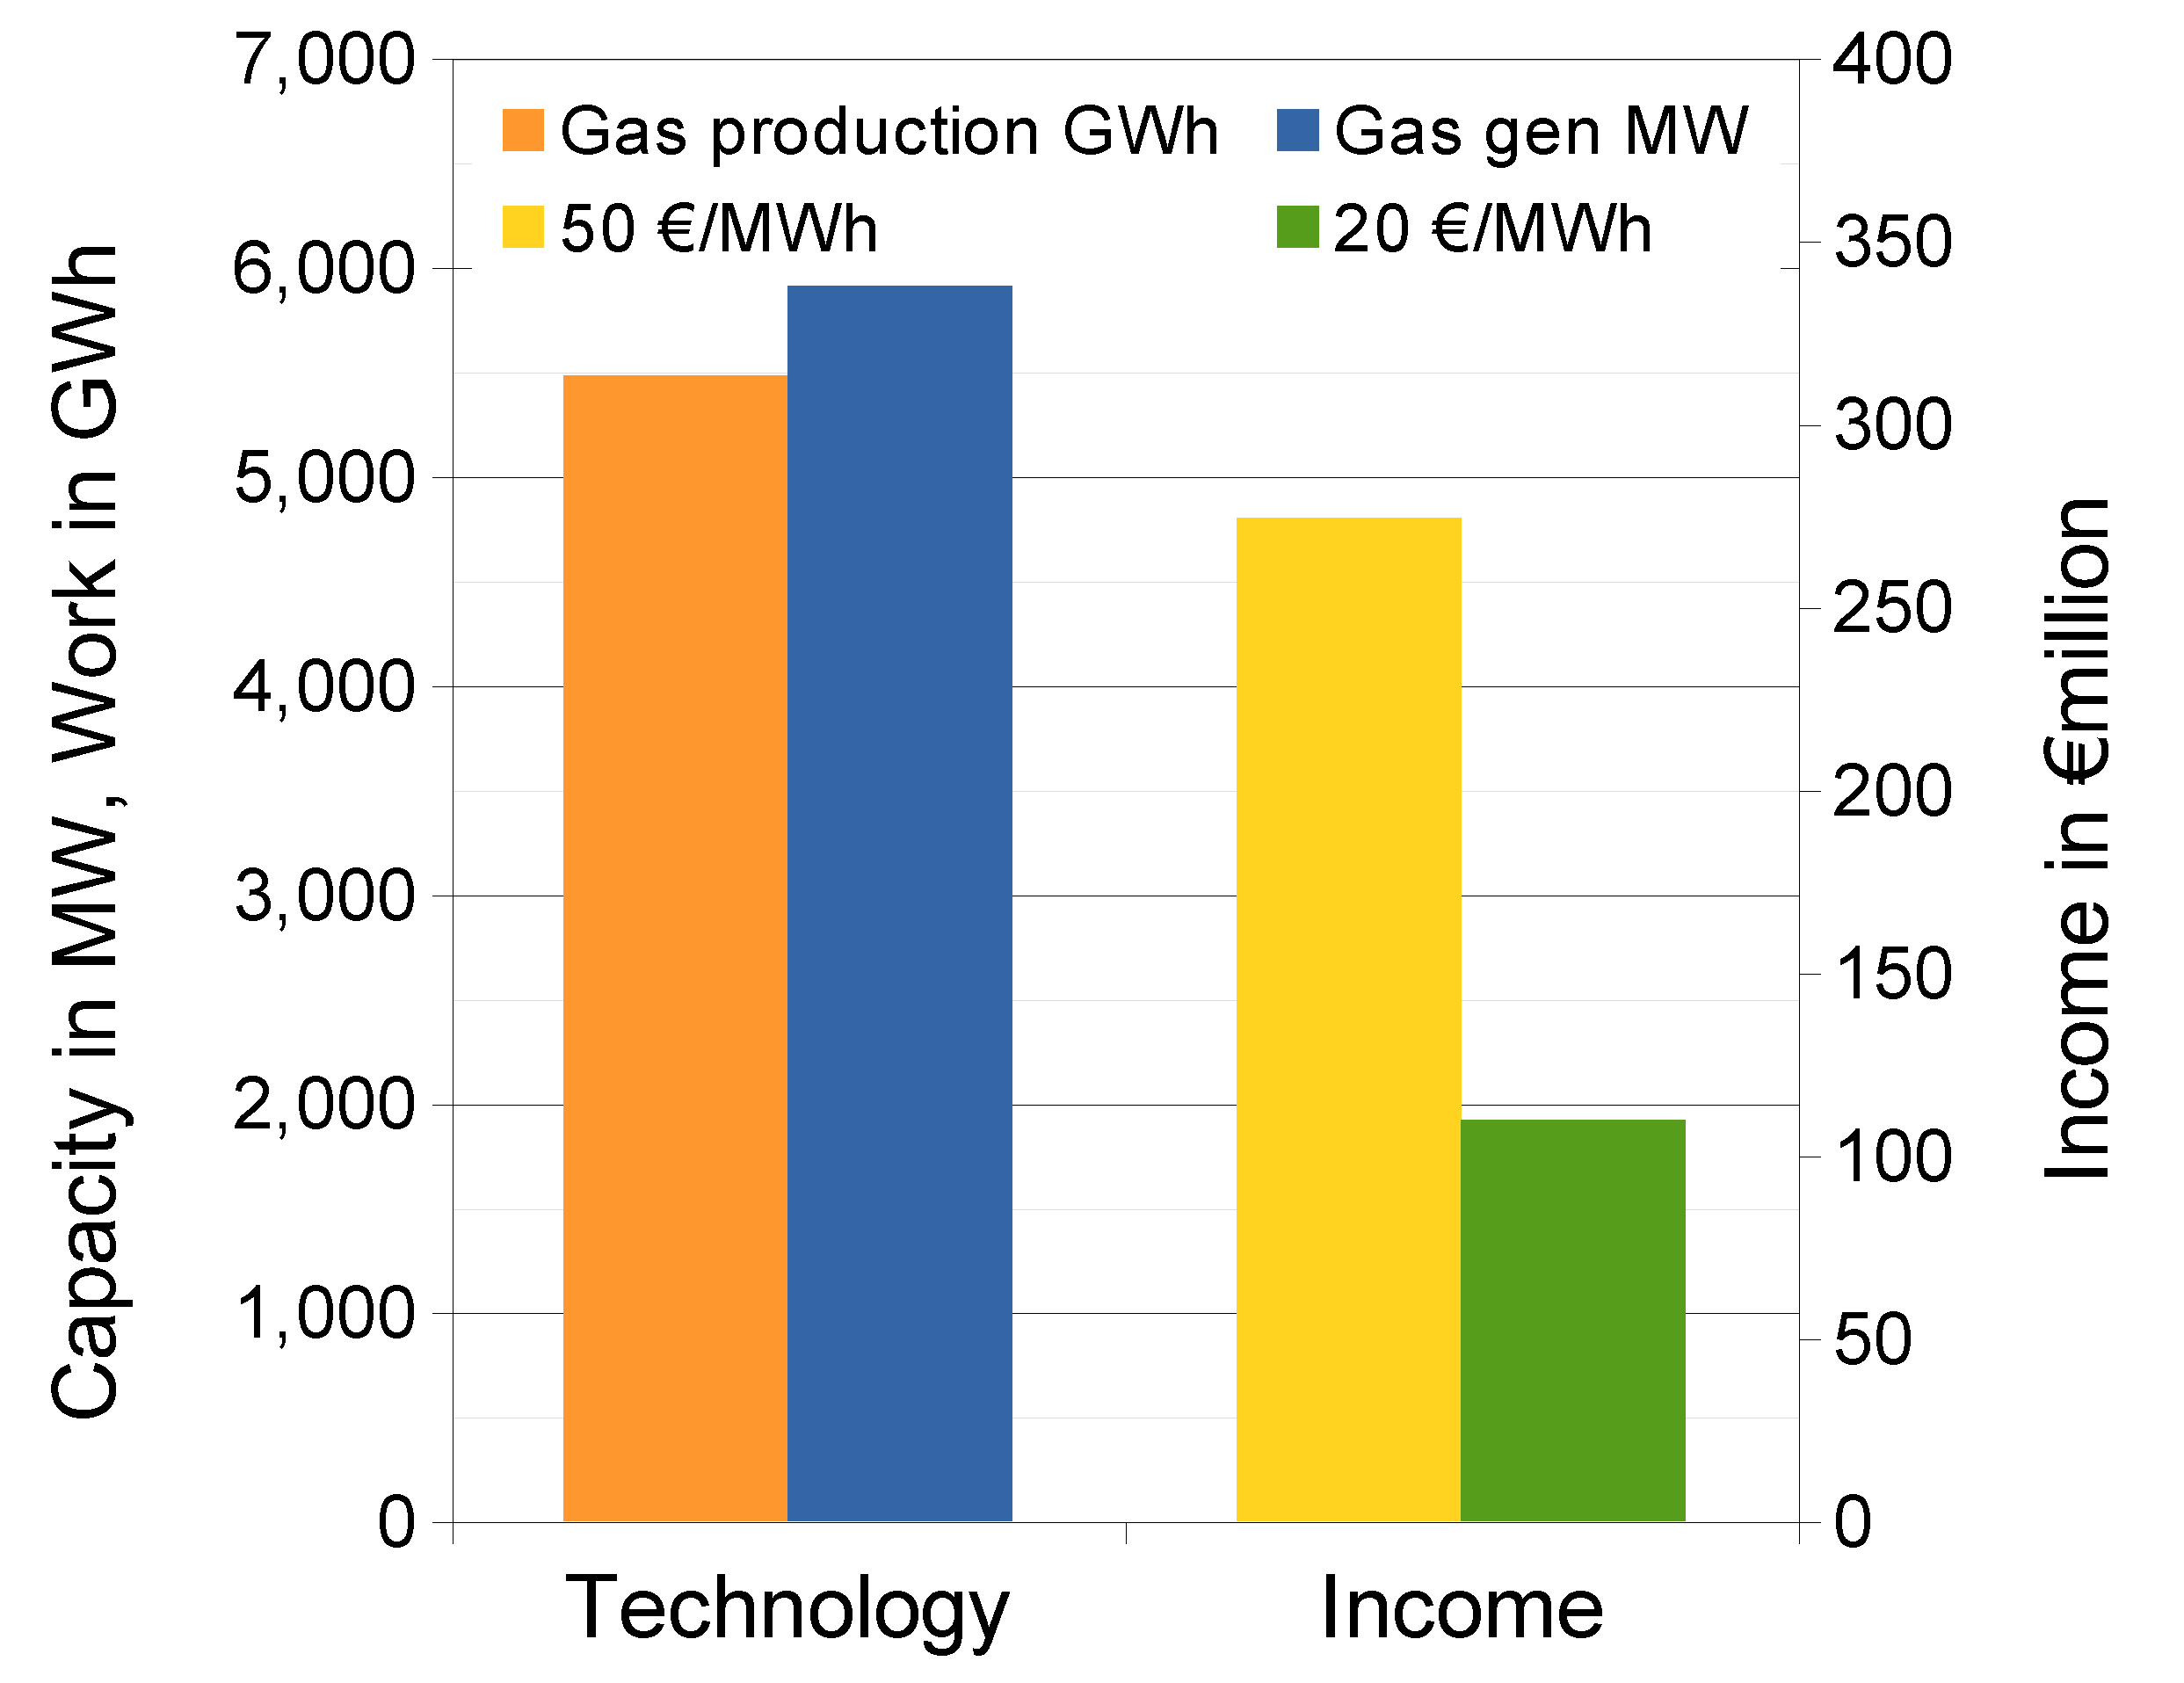
Figure 18.
Connection between the carbon cycle economy and the hydrogen economy.
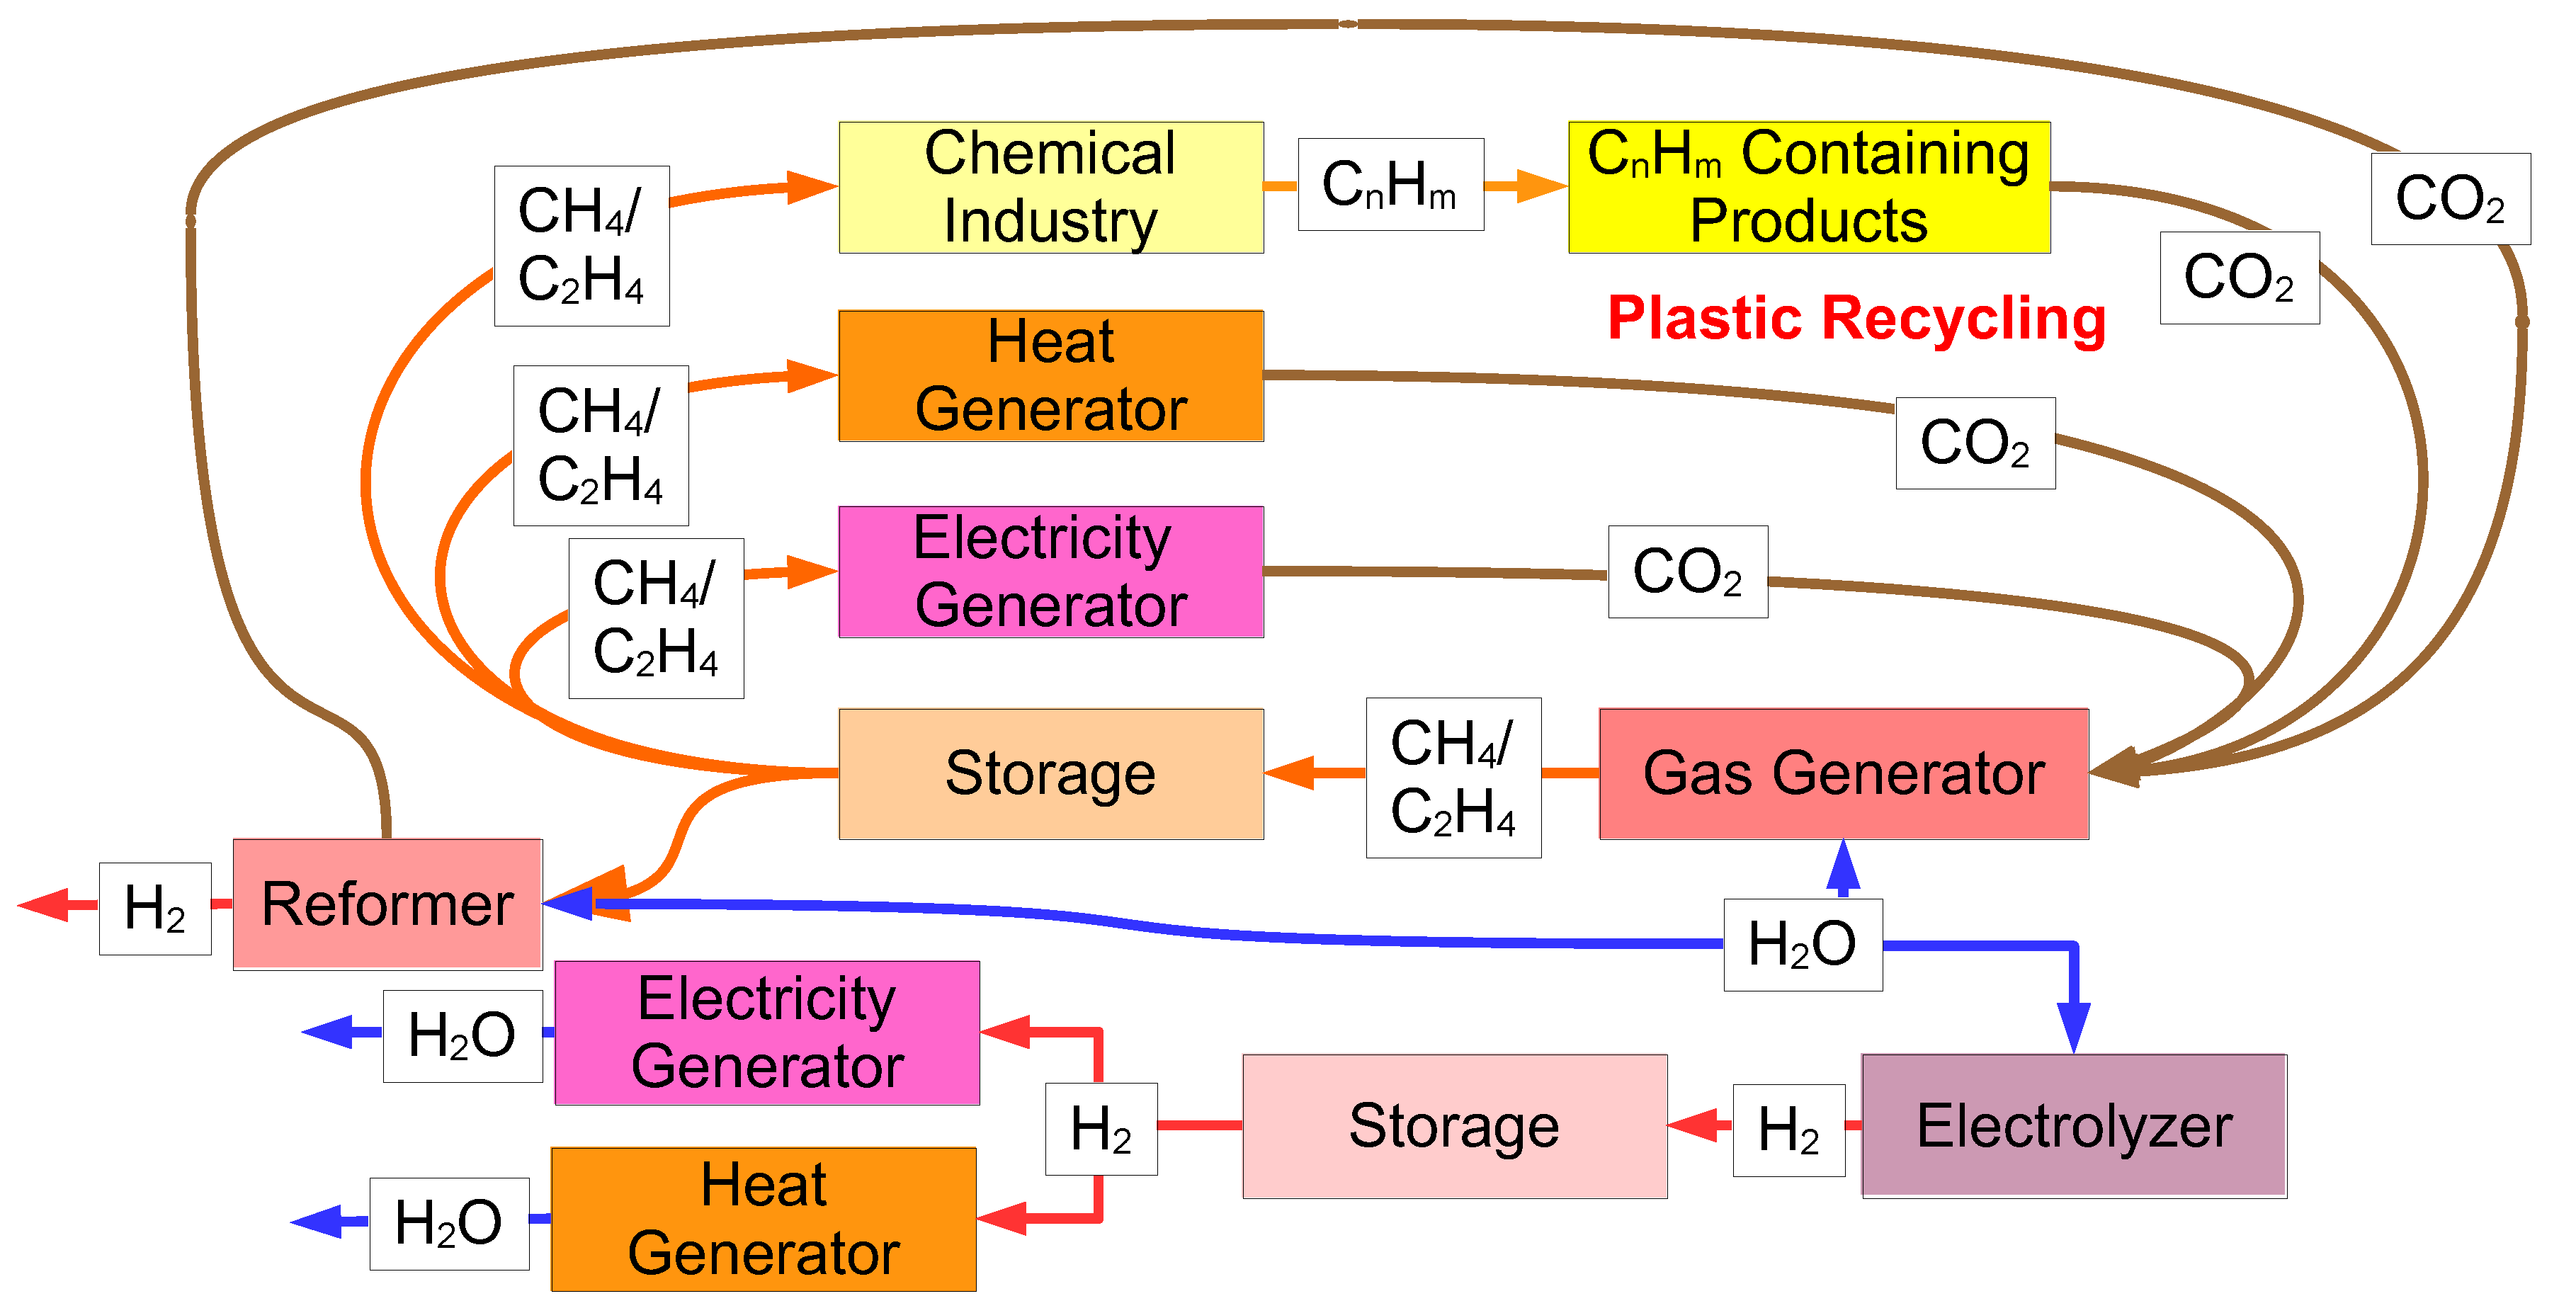

Table 1.
Demand coverage of the scenarios for different storage gases.
| Scenario | Agora | Solar100 |
|---|---|---|
| Annual feed-in in TWh | 873 | 3.400 |
| Demand coverage CH4 in % | 27,34 | 7,02 |
| Demand coverage H2 in % | 6,22 | 1,60 |
| Demand coverage C2H4 in % | 116,61 | 29,94 |
Table 2.
Comparison of key figures for Agora and Solar100 [19].
Table 2.
Comparison of key figures for Agora and Solar100 [19].
| Consumption in TWh | Agora | Solar100 |
|---|---|---|
| Primary energy EP | 1,848 | 3,400 |
| Final energy EE | 1,584 | 2,380 |
| EE / EP | 0.86 | 0.7 |
| Storage requirement approx. 30% | 554.4 | 1,020 |
Table 3.
Overview of the properties of energy storage solutions.
| Batteries | Hydrogen | Carbon Cycle | |
|---|---|---|---|
| Sufficient capacity | Lithium supply? | Insufficient volumetric energy density | Possible C2H4, CH4with restrictions |
| Efficiency during reconversion | ca. 85% | Pumped storage power plant cf. [7] | Pumped storage power plant cf. [7] |
| System integration | Few options | Various CHP options | Various CHP options |
| Safety | Fires difficult to extinguish | Standard safety of plant technology | Standard safety of plant technology |
| Mobility | Possible | Option Nano carbon storage | Possible ship propulsion |
| Storage application | Short storage times | CO2 free exhaust gas | High-capacity long-term storage |
Table 4.
Assessment of possible EMP damage and repair options [7].
Table 4.
Assessment of possible EMP damage and repair options [7].
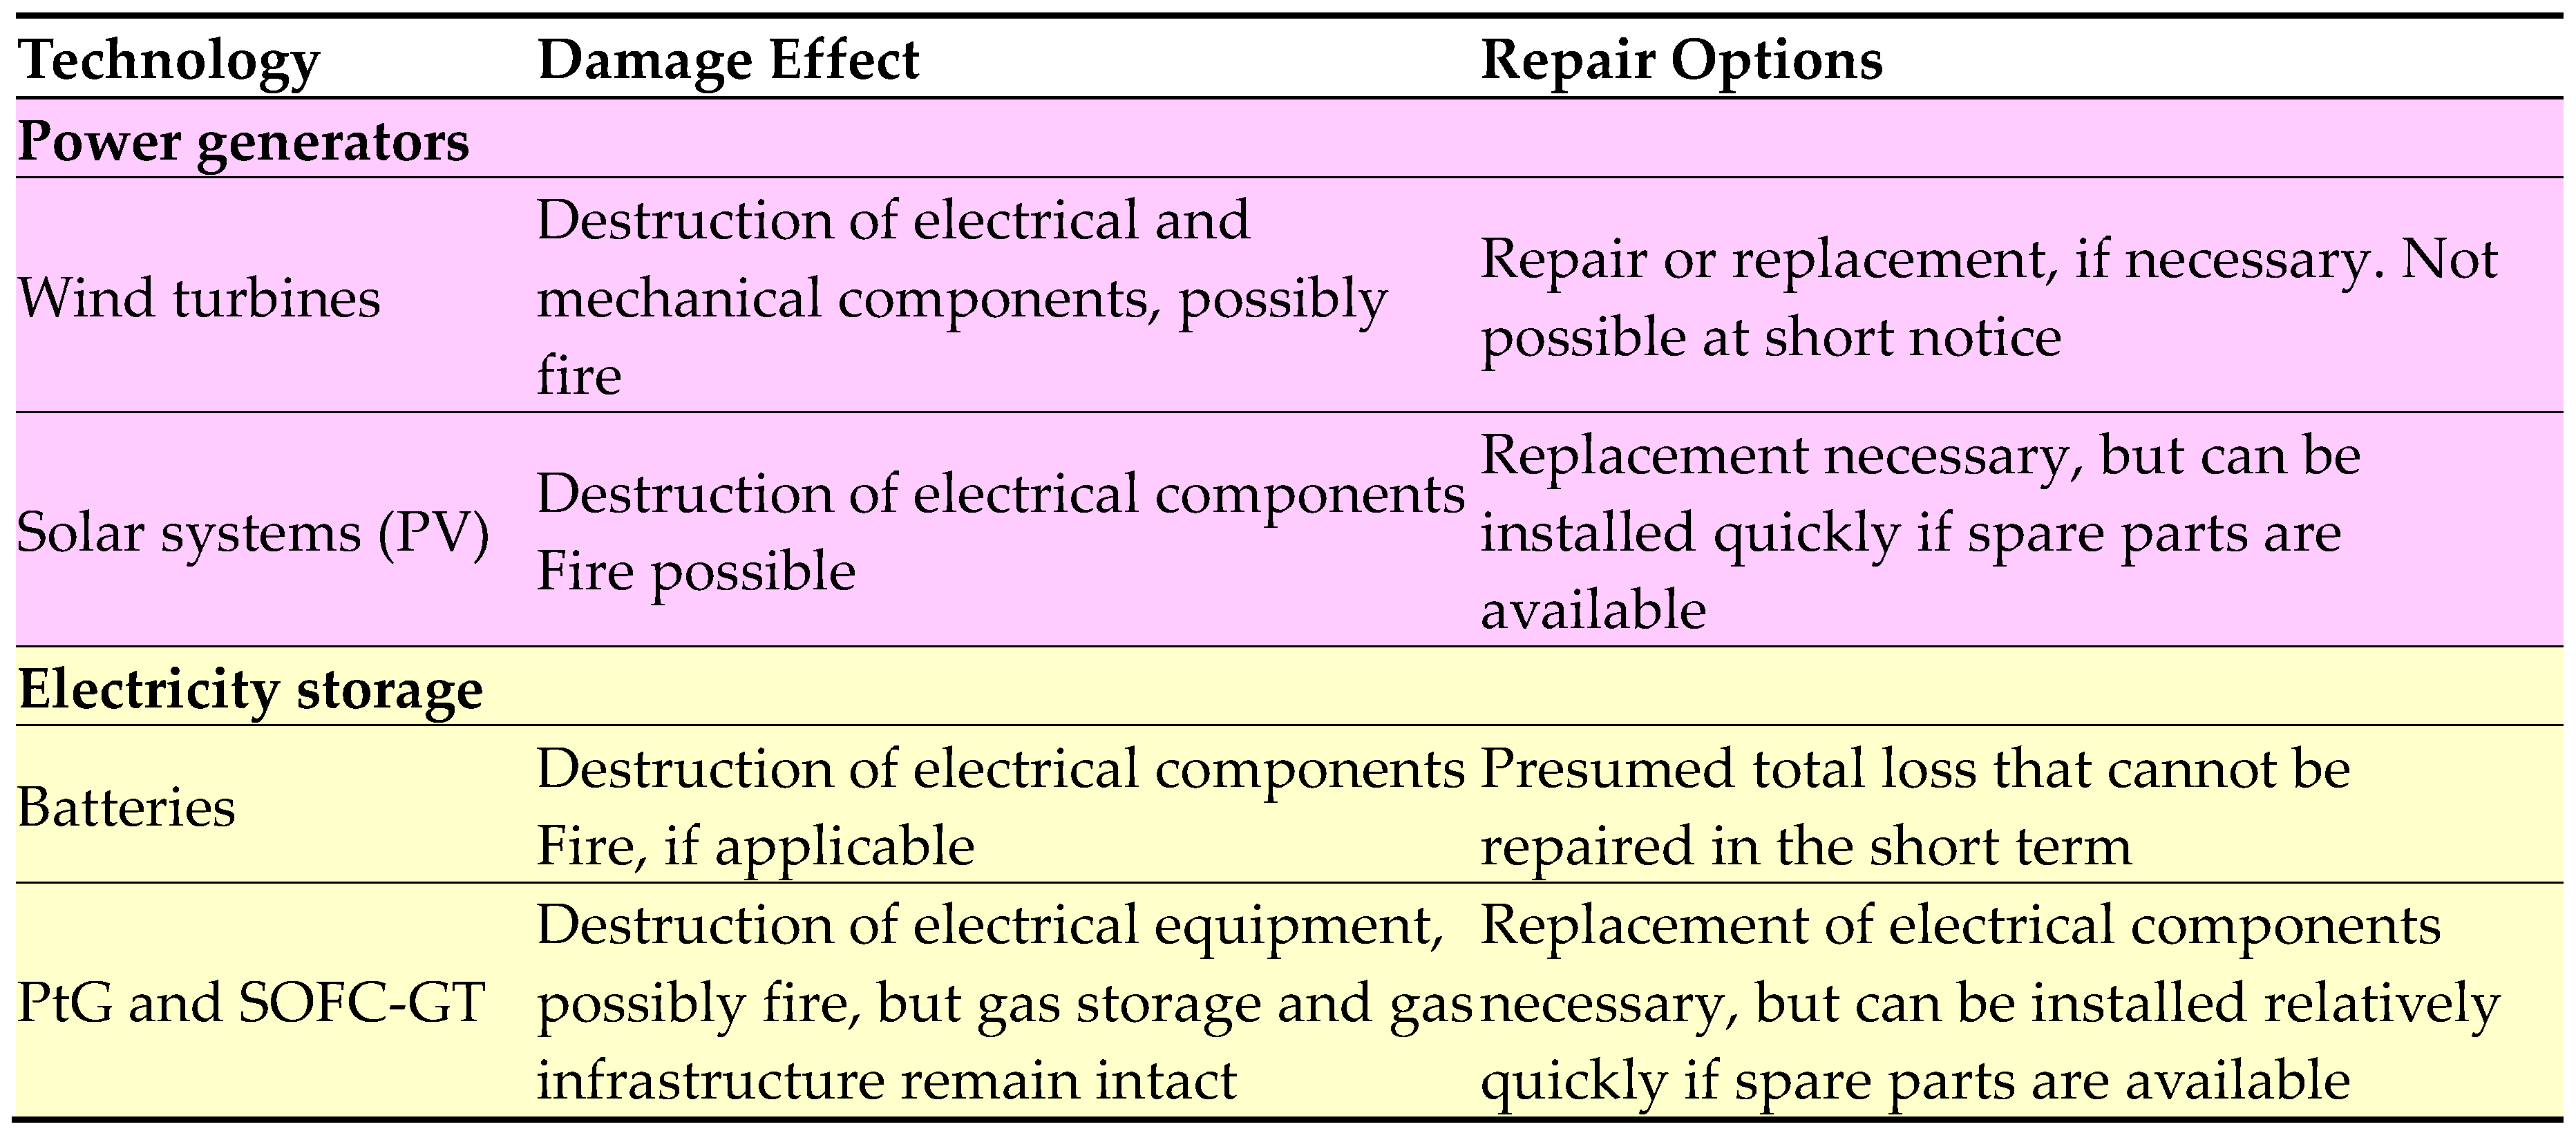 |
Table 5.
Estimation of possible war/terrorism damage and maintenance options [7].
Table 5.
Estimation of possible war/terrorism damage and maintenance options [7].
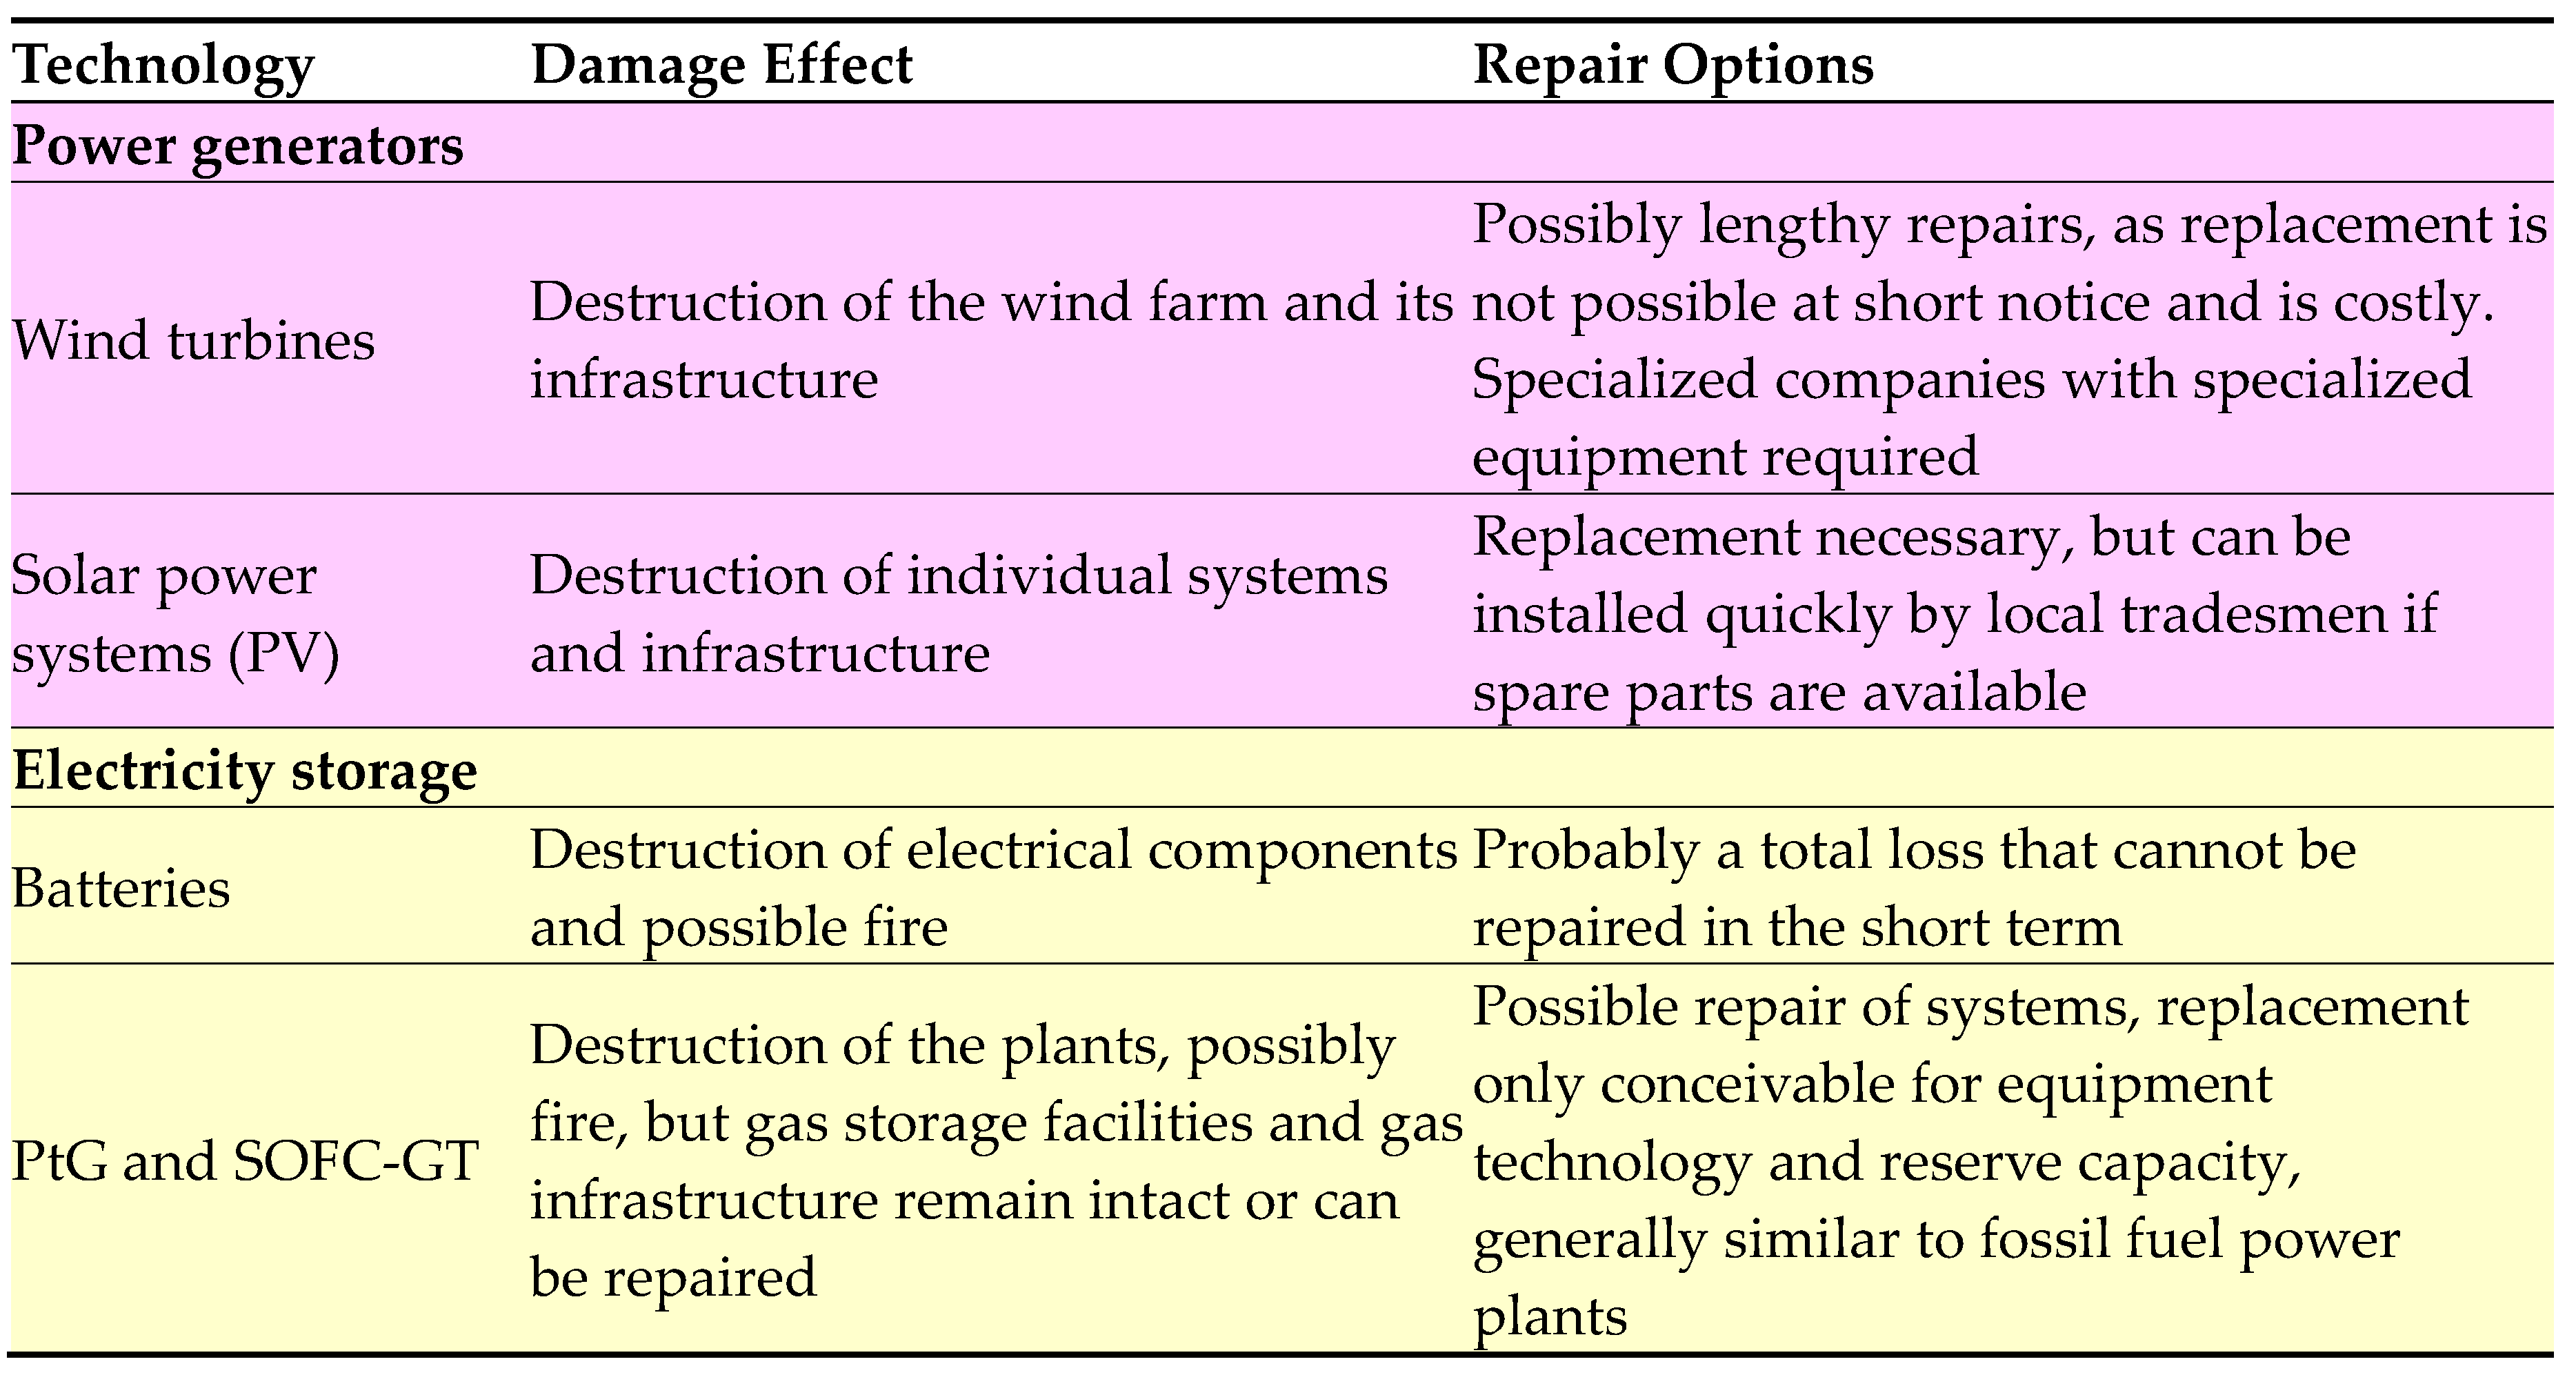 |
Table 6.
Projected system parameters for the year 2050 [15].
Table 6.
Projected system parameters for the year 2050 [15].
| Investment Costs | Fixed Operat. Costs | Service Life | Investm.Battery | |
|---|---|---|---|---|
| €kW | €/(kW/a) | Years [a] | EUR/kWh | |
| Natural gas—CCGT | 1000 | 20 | 40 | -- |
| Wind onshore | 1000 | 24 | 25 | -- |
| Wind offshore | 1800 | 60 | 25 | -- |
| Photovoltaic open space | 300 | 12 | 25 | -- |
| Battery storage | -- | 4 | 20 | 80 |
| Renewable hydrogen | 400 | 16 | 25 | -- |
| PtG (synthesis plants) | 481 | 17 | 30 | -- |
| Scenario | Solar100 | Agora | Solar100 | Agora |
|---|---|---|---|---|
| Installed capacity | Investment costs | |||
| GW | GW | Mio € | Mio € | |
| Wind onshore | 0 | 130 | 0 | 130.300 |
| Wind offshore | 0 | 70 | 0 | 125.820 |
| Photovoltaics | 3.400 | 355 | 1.020.000 | 106.620 |
| Total electricity generators | 3.400 | 556 | 1.020.000 | 362.740 |
Table 8.
Comparison of investments in storage and power supply.
| Scenario | Solar100 | Agora | Solar100 | Agora | |
|---|---|---|---|---|---|
| Installed capacity | Investment costs | ||||
| Gas generation with | FLh | GW | GW/TWh1) | million € | million € |
| Photovoltaics | 1.000 | 1.000 | 130,7 | 481.000 | 52.280 |
| Wind energy | 2.000 | 500 | 65,4 | 240.500 | 26.140 |
| Solar band EU | 4.000 | 250 | 32,7 | 120.250 | 13.070 |
| Nuclear power plant (NPP) | 7.000 | 143 | 18,7 | 68.714 | 7.469 |
| Power plants | 150 | 72,6 | 214.500 | 79.860 | |
| Battery storage | 0 | 0 | 50,0/21,21) | 0 | 1.692.000 |
| 1) The TWh figure for the battery storage system is required to determine the costs, see Table 6 | |||||
| Total electricity supply | |||||
| Total electricity generators | 3400 | 555,6 | 1.020.000 | 362.740 | |
| Gas generators FLh | 1.000 | 4550 | 808,9 | 1.715.500 | 2.186.880 |
| 2.000 | 4050 | 743,6 | 1.475.000 | 2.160.740 | |
| 4.000 | 3800 | 710,9 | 1.354.750 | 2.147.670 | |
| 7.000 | 3.693 | 696,9 | 1.303.214 | 2.142.069 | |
Table 9.
Grid demand and solar feed-in at 3,400 GW peak capacity.
| Period |
Grid Demand TWh |
Solar Feed-in TWh |
Storage Feed-in TWh |
|---|---|---|---|
| 01.11.20–30.11.20 | 42,72 | 108,01 | 65,29 |
| 01.12.20–31.01.21 | 88,59 | 92,41 | 3,82 |
| 01.02.21–28.02.21 | 41,76 | 141,93 | 100,17 |
| 01.11.20–28.02.21 | 173,07 | 342,35 | 169,29 |
Table 10.
Volume and prices of electricity exchange with neighboring countries [28].
Table 10.
Volume and prices of electricity exchange with neighboring countries [28].
| 04/02/25–04/10/2025 | MWh | € | €/MWh |
|---|---|---|---|
| Power shortage | 538,314.50 | 69,409,558.83 | 128.94 |
| Solar peak | 153,760.88 | 3,880,782.27 | 25.24 |
| without remuneration | 11,709.75 | 0 | 0 |
| 703,785.13 | 73,290,341.09 | -- |
Disclaimer/Publisher’s Note: The statements, opinions and data contained in all publications are solely those of the individual author(s) and contributor(s) and not of MDPI and/or the editor(s). MDPI and/or the editor(s) disclaim responsibility for any injury to people or property resulting from any ideas, methods, instructions or products referred to in the content. |
© 2026 by the authors. Licensee MDPI, Basel, Switzerland. This article is an open access article distributed under the terms and conditions of the Creative Commons Attribution (CC BY) license (http://creativecommons.org/licenses/by/4.0/).
Copyright: This open access article is published under a Creative Commons CC BY 4.0 license, which permit the free download, distribution, and reuse, provided that the author and preprint are cited in any reuse.


