

Submitted:
24 March 2026
Posted:
26 March 2026
You are already at the latest version
Abstract
Plain 3D printed concrete (3DPC) suffers from inherent brittleness and anisotropic behavior that limit its structural applications. This study aims to investigate sprayed strain-hardening cementitious composite (SHCC) as a thin overlay to reinforce 3DPC. In particular, this paper investigated the effects of sprayed SHCC overlay thickness (10, 20, and 30 mm) on the flexural performance of reinforced 3DPC. Four-point bending tests were conducted on specimens with two cutting orientations, namely parallel (H) and perpendicular (V) to printing direction, and three loading directions (X, Y, and Z). The digital image correlation (DIC) technique was used to monitor strain distributions and interfacial behavior. The 3DPC reinforced with the 10 mm-thick overlay still showed brittle behavior but with reduced anisotropy. For reinforced 3DPC with a 20 mm-thick overlay, the flexural capacity increased by 35%–970% depending on loading direction, with the ultimate deflection enhanced by over 400% in all directions. The 30 mm-thick overlay further improved flexural strength by 155%–1200% and ultimate deflection by 350%–533% relative to plain 3DPC. DIC analysis revealed brittle fracture via a single crack in the composite with the 10mm-thick overlay, while the specimens with thicker overlays exhibited multiple cracks, and no shear slip was observed at the interface between the 3DPC substrate and S-SHCC overlay. An anisotropy-modified plane-section model was developed to predict structural behavior, with elastic stage deviations within 28% in the X-direction and 30% in the Y- and Z-directions. The peak load predictions showed 30% deviation in the X-direction and less than 15% spread in the Y- and Z-directions. These findings provide guidelines for designing 3DPC structures reinforced with sprayed SHCC overlay.
Keywords:
3D printed concrete
; sprayed SHCC
; reinforcement
; flexural behavior
1. Introduction
Three-dimensional printed concrete (3DPC) is a digitally manufactured concrete produced through an extrusion process, wherein concrete is extruded layer by layer through a nozzle to form structures [1]. This transformative technology eliminates formwork requirements, providing geometric freedom and reducing the cost and time of construction compared to the conventional casting approach [2]. However, without formwork support, 3DPC must rapidly gain strength to support subsequent layer loads before hardening, which is critical for buildability [3]. Additionally, the layer-by-layer construction process creates directional anisotropy and weak interlayer bonds, resulting in reduced mechanical performance in unreinforced (plain) 3DPC [4]. The mechanical properties of plain 3DPC structures present significant challenges for load-bearing applications. Studies have demonstrated that printed elements exhibit compressive strengths 25% lower than conventionally cast concrete when loaded perpendicular to the printed layers, with pronounced porosity observed between adjacent filaments due to the printing process [5]. The absence of continuous reinforcement exacerbates these limitations, resulting in insufficient flexural and tensile capacities and brittle failure [6].
Current reinforcement methods for 3DPC include the inclusion of short fibers in the fresh mixture, placing reinforcement mesh during printing, inserting micro cables in the printed filaments, or inserting reinforcing bars during printing, or post-tensioning with prestressed tendons [7,8]. Alonso et al. [9] reported that incorporating fibers into 3DPC enhanced flexural strength, with basalt and PVA fibers achieving increases in flexural strength of up to 30% and 23%, respectively, relative to plain 3DPC. Yiming et al. [10] showed that textile reinforcement increased the ultimate deflection and flexural toughness of 3DPC by 118% and 117%, respectively, relative to plain 3DPC. Li et al. [7] reported 260% flexural strength improvement in flexural performance by using co-extruded micro-cables, transforming the 3DPC failure from brittle to ductile mode. While post-tensioning provides continuous reinforcement without disrupting printing, it requires reserved ducts and manual grouting. As a result, the full automation benefits of 3DPC are not fully exploited with post-tensioned reinforcement, as the placement of additional reinforcement limits its potential [11,12]. Despite various reinforcement methods for 3DPC, most approaches can compromise either the automation benefits of 3DPC or the geometric flexibility of the printing process [13].
Strain-hardening cementitious composite (SHCC), with its strain-hardening characteristics, exceptional ductility, and multiple micro-cracking behavior, represents a promising reinforcement approach for 3DPC structures. The combination of spray/shotcrete technology with SHCC enables efficient application of this high-performance material as an overlay system onto 3DPC elements. Van et al. [14] employed sprayed SHCC (S-SHCC) to reinforce load-bearing masonry walls, significantly enhancing their shear resistance capacity. Lin et al. [15] applied 30-mm-thick S-SHCC overlays to masonry walls, achieving 12 times higher out-of-plane tensile strength under lateral loading tests. S-SHCC also demonstrates superior crack control in reinforced concrete due to its strain-hardening and multiple micro-cracking behaviors. He et al. [16] showed that SHCC overlays on concrete beams restricted average crack widths to under 0.1 mm while generating 10 times more cracks than conventional concrete. Han et al. [17] retrofitted reinforced concrete structures using S-SHCC, demonstrating that the SHCC overlay enhanced seismic performance through stress redistribution and superior energy absorption capacity.
The preceding review shows that several approaches have been proposed for reinforcing 3DPC, while S-SHCC has been successfully employed for strengthening conventional concrete and masonry structures, where S-SHCC overlays are reported to enhance load-bearing capacity, crack control, and durability. Among the design parameters, overlay thickness plays a critical role in determining the strengthening effectiveness. Shan et al. [16] found that a 10 mm SHCC overlay increased the load-bearing capacity of the strengthened beam at a crack width of 0.3 mm from 32.5 to 53.3 kN. Zhang et al. [18] strengthened reinforced concrete members with SHCC overlays of 10, 30, and 50 mm in thickness, and found that increasing the overlay thickness enhanced the flexural load-bearing capacity of the composite structure while reducing its ultimate deflection. Van et al. [14] found that when reinforcing shear walls with S-SHCC, a 10 mm overlay promoted multiple cracking behavior, while a 30 mm overlay resulted in surface spalling of the composite structure. Paul [19] demonstrated that a 25 mm thick SHCC strengthening layer is the critical thickness requirement for preventing chloride penetration. Therefore, the thickness of the S-SHCC overlay should be carefully selected to meet the specific requirements of the application, ensuring a balanced structural performance. However, to date, there has been no systematic study on using S-SHCC overlays for reinforcing 3DPC, which is the main goal of this study. This gap is particularly critical because 3DPC exhibits pronounced process-induced anisotropy in stiffness, strength, and fracture response due to filament orientation, layer interfaces, and interlayer bonding [20,21]. Consequently, the conclusions and empirical insights derived from S-SHCC overlays in conventional concrete or masonry structures may not be directly extrapolated to 3DPC.
This study investigates the flexural behavior of 3DPC beam and wall elements reinforced with sprayed S-SHCC overlays under out-of-plane bending. A hybrid fabrication concept is adopted, where thin-shell 3DPC serves as the printed core, and S-SHCC provides the primary tensile resistance. The 3DPC thickness was kept constant, with only the overlay thickness varied to isolate its effect as a design parameter. Comprehensive experimental programs were conducted, including four-point bending tests on specimens with two cutting orientations (parallel and perpendicular to the printing direction) and three loading directions (X, Y, and Z) to account for the anisotropic nature of 3DPC. The investigation focused on determining failure modes, cracking patterns, load-deflection responses, ductility, and energy absorption while evaluating the influence of overlay thickness and 3DPC anisotropy on structural performance. Advanced 2D and 3D digital image correlation (DIC) techniques were employed to monitor load-shear strain responses and interfacial slip behavior between the S-SHCC overlay and 3DPC. Considering the anisotropies of 3DPC, a modified plane-section assumption was further proposed to predict the cracking load, peak flexural load, and failure modes of reinforced 3DPC. The findings of this research provide valuable insights into the design of S-SHCC-reinforced 3DPC structures, offering a promising approach to enhance the ductility and structural performance of 3DPC.
2. Experimental Program
2.1. Mixtures Design and Materials
The mixture proportions of the 3DPC substrate and the S-SHCC overlay are shown in Table 1. The cementitious materials used in this study included ordinary portland cement (OPC, CEM I 52.5 N), Class F fly ash (FA), and silica fume (SF). The chemical compositions of the cementitious materials are shown in Table 2. Graded silica sands with two ranges of particle sizes, denoted as finer and coarser sands, were used. The particle size distributions of the raw materials are shown in Figure 1.
A polycarboxylate ether (PCE)-based superplasticizer (SP) and a consistency retention admixture (CRA) were employed to reduce the water content and maintain consistency over time, respectively. Nano-clay (NC) was used to improve the viscosity and thixotropy of the 3DPC mixture. Polypropylene (PP) fiber was used in the 3DPC mixture to mitigate shrinkage-induced early-age cracking, while polyvinyl alcohol (PVA) fiber was incorporated in the S-SHCC mixture. The physical properties of PP and PVA fibers, as reported by the suppliers, are shown in Table 3.
2.2. Mixtures Preparation Procedure
For the 3DPC mixture, the cementitious binder and sands were first dry mixed at low speed for 1 min. Then 80 wt.% of the required water was added and mixed at low speed for 2 min. The remaining water, pre-mixed with the SP and CRA, was then added and mixed at low speed for 4 min, followed by medium-speed mixing for 1 min. Subsequently, the PP fiber was added in one batch and mixed at low speed for 3 min. Finally, the NC was added and mixed at low speed for 2 min. The S-SHCC mixture followed the same batching and mixing sequence up to this point, except that PVA fiber was used instead of PP fiber, and no NC was added. For the final mixing stage of the S-SHCC mixture, the PVA fiber was gradually added while mixing at low speed for 6 min, followed by medium-speed mixing at 1 min to ensure uniform fiber dispersion.
2.3. Printing and Spraying Procedures
The fresh 3DPC mixture was printed using a custom-made gantry printer equipped with an auger extruder with a 25 mm round nozzle, with a feed rate of 800 mm/min and an extrusion auger speed of 20 rpm. The wall panels shown in Figure 2 were printed, composed of two different configurations for different specimen types. For prism specimens, three wall panels measuring 370 mm in height, 400 mm in length, and 130 mm in thickness were printed, as shown in Figure 2 (a)-(b). For cube specimens, a separate wall panel measuring 260 mm in length, 220 mm in height, and 60 mm in thickness was printed by extruding two continuous 30 mm thick layers side by side, as shown in Figure 2 (c)-(d). The layer’s height and width were 10 and 30 mm, respectively, for both configurations. The triple-wall panel configuration shown in Figure 2 (a)-(b) was designed to avoid possible failure due to elastic buckling during the printing process and to allow for the efficient production of multiple wall panels simultaneously. For the triple wall panel configuration, about 2.5 h after completion of the printing process, the connected wall panels were separated by cutting through the connecting sections using a mini hacksaw blade while the material was still in its fresh (unhardened) state to achieve three individual wall panels (see cutting lines in Figure 2(b)). All printed geometries were covered with a plastic sheet to avoid excessive moisture loss and kept in the laboratory environment (20 ± 5 °C) for 24 h. Subsequently, all wall panels were placed in a water tank at a temperature of 20 ± 2 °C to cure for 28 days.
After 28 days of water curing, the wall panels were removed from the water tank and prepared for spraying. Substrates with overly dry surfaces can over-absorb moisture from the overlay, resulting in weaker bonding properties in the interfacial zone. Studies have shown that interfacial bonding properties can be enhanced when the substrate surface moisture is in a saturated surface dry condition [22,23]. Therefore, before spraying the S-SHCC mixture, the 3DPC substrates were conditioned inside the laboratory environment until a saturated surface dry condition was achieved. Spraying was performed using a spray gun with a 15 mm diameter nozzle at an air pressure of 620 KPa (90 psi), maintaining a standoff distance of 0.5 m from the substrate surface. After spraying, the reinforced wall panels were cured in the water tank for 21 days before being cut into appropriate sizes for testing. Considering the anisotropy of 3DPC, two cutting orientations (H: parallel to printing direction; V: perpendicular to printing direction), and three testing directions (X, Y, and Z) were adopted, as shown in Figure 3. Following the cutting process, the cut specimens were returned to the water tank for an additional 7 days, reaching a total curing age of 28 days before testing.
2.4. Testing Procedures
2.4.1. Compressive Strength Test
The compressive strengths of cast SHCC, S-SHCC, plain 3DPC, and reinforced 3DPC sprayed with S-SHCC specimens were measured. Table 4 presents details of the specimens prepared to evaluate mechanical properties. Cubic specimens with different dimensions were prepared to test the compressive strength at a loading rate of 0.6 MPa/s. Figure 4 illustrates the schematic configuration of plain 3DPC cubes and reinforced 3DPC cubes with S-SHCC overlay. The plain 3DPC (control) specimen was a 40 mm cube. However, the overall dimensions of the reinforced 3DPC specimens varied depending on the S-SHCC overlay thickness. The cast SHCC and S-SHCC specimens were 50 mm cubes.
2.4.2. Flexural Performance Test
The flexural performance of the S-SHCC, plain 3DPC, and reinforced 3DPC specimens were evaluated using a four-point bending test setup at a displacement rate of 0.5 mm/min. The flexural toughness was determined following ASTM C1609 [24]. Details of the specimens prepared are given in Table 4. The length of all specimens was 350 mm with a middle span of 100 mm. For the cast SHCC and S-SHCC specimens, the cross-sectional dimensions were 60 mm in width and 13 mm in depth. However, the cross-sectional dimensions of the plain 3DPC specimens were 40 mm in width and 20 mm in depth. The overall depth and width of reinforced 3DPC specimens varied depending on the thickness of the S-SHCC overlay and the loading direction, as shown in Figure 5. For clarity, specimens with overlay thicknesses of 10, 20, and 30 mm are hereafter denoted as T10, T20, and T30, respectively.
Strain fields and crack development during the flexural tests were monitored using both two-dimensional (2D) and three-dimensional (3D) DIC techniques. In 2D measurements, a single high-resolution camera was aligned perpendicular to the specimen surface to capture longitudinal and shear strain profiles along the section height. For selected critical specimens, 3D analysis was employed using a calibrated stereo camera system to record out-of-plane displacement and provide complete 3D deformation fields. The DIC setup was calibrated prior to each test using a 14 × 9 dot standard calibration panel, with calibration deviation maintained below 0.05 pixels for each specimen. Both optical systems were operated in synchronization with the mechanical testing apparatus, ensuring that strain data could be directly related to the load-deflection response over the entire loading history. The captured images were processed using commercial software VIC-3D and VIC-2D to compute displacement and strain fields.
3. Experimental Results and Discussion
3.1. Properties of S-SHCC Overlay and Cast SHCC
Table 5 summarizes the properties of cast SHCC and S-SHCC overlay mixtures. The S-SHCC mixture achieved a compressive strength of 79.5 MPa and a modulus of rupture of 10.8 MPa, comparable to the 10.2 MPa for the cast SHCC mixture. However, as shown in Figure 6, cast SHCC mixture demonstrated significantly superior deformation capacity with a deflection at peak flexural load of 27.2 mm versus 9.9 mm for the S-SHCC mixture. This reduction in deflection capacity of the S-SHCC mixture was mainly due to changes in fiber orientation and insufficient compaction during the spraying process. Similar results were reported by Zhang et al. [25] and Kim et al. [26]. Both S-SHCC and cast SHCC exhibited deflection-hardening behavior with multiple cracking. Despite the reduced deflection capacity, the mechanical properties of S-SHCC confirm their suitability as a reinforcement overlay for 3DPC structures.
3.2. Compressive Strength Results
Figure 7 presents the compressive strength of plain and reinforced 3DPC specimens having different thicknesses of S-SHCC overlay and tested in different loading directions. As expected, the plain 3DPC specimens exhibited anisotropic behavior depending on the testing direction. The highest compressive strength was obtained in the Y-direction (i.e., parallel to the printing direction, see Figure 4), followed by the Z- and X-directions. This pattern is consistent with the existing literature [21,27].
The compressive strength of the reinforced 3DPC specimens exhibited different anisotropic behavior depending on the overlay thickness and testing direction. In the X-direction, where the load is perpendicular to the plane of the substrate, the reinforced 3DPC specimens exhibited the lowest and most stable compressive strength (approximately 60 MPa). In the X-direction, the compressive strength of the reinforced 3DPC specimens was only 4%–12% higher than the plain 3DPC specimen, depending on the thickness of the overlay. These results indicate that the compressive strength in the X-direction was mainly governed by the intrinsic lower compressive strength of the plain 3DPC (55.8 MPa) rather than the higher compressive strength of the S-SHCC overlay (79.5 MPa, see Table 5).
Conversely, in the Y-direction (parallel to the printing direction) and the Z-direction (printed layer stacking direction), the compressive strength of the reinforced 3DPC specimens was 0–18% and 49%–57%, respectively, higher compared to the plain 3DPC specimen, depending on the thickness of the overlay. This trend can be explained by the different baseline strengths of plain 3DPC in each direction. In the Y direction, plain 3DPC already exhibits high compressive strength that approaches that of the S-SHCC overlay, so the overlay provides limited additional strengthening. However, the lower compressive strength of the plain 3DPC specimens in the Z direction enables the S-SHCC overlay to substantially contribute to the overall load-bearing capacity. The hybrid cube results for overlay thicknesses of 10, 20, and 30 mm are presented as comparative indicators under nominally concentric compression, rather than as a direct basis for structural design, where eccentricity and potential interface delamination may govern failure. Within this test configuration, the maximum enhancement in compressive performance was observed at an overlay thickness of 20 mm (Figure 8). This phenomenon may be attributed to the fact that, as the overlay thickness increases, defects inherent to the sprayed material become increasingly pronounced and emerge as the dominant controlling factor, thereby offsetting the benefit conferred by the greater volume fraction of the higher strength overlay.
The damage patterns of the specimens are illustrated in Figure 9. Under axial loading, distinct failure modes were observed in the X-, Y-, and Z-directions, which are influenced by the single-sided placement of the S-SHCC overlay. In the X-direction, where the S-SHCC overlay was located at the bottom of the specimen, the failure primarily occurred within the 3DPC section rather than the S-SHCC overlay. Cracks initiated in the 3DPC and propagated downward along the specimen height toward the interface, eventually propagating through the S-SHCC overlay, as shown in Figure 9(a). This behavior is attributed to the confinement provided by the bottom S-SHCC overlay, which restrains transverse crack opening in the 3DPC at the tension face during early loading.
In the Y- and Z-directions, where the S-SHCC overlay was located on the right side of the specimens, the overlay provided a lateral confinement zone to 3DPC, thereby restricting the lateral expansion of 3DPC to the right side. The free expansion of 3DPC toward the left side resulted in eccentric compression within the cross-section. This led to two distinct cracking patterns: interfacial delamination between the 3DPC substrate and the S-SHCC overlay in the Y-direction, and cracks mainly within the 3DPC substrate in the Z-direction, as shown in Figure 9(b) and Figure 9(c).
3.3. Load-Deflection Responses Under Bending
3.3.1. General Response
Figure 10 shows the distinct flexural load vs. mid-span deflection responses of specimens made with plain 3DPC, cast SHCC, S-SHCC, and reinforced 3DPC with S-SHCC overlay. The plain 3DPC showed brittle failure with linear load-deflection behavior until peak load at point A, followed by sudden failure through single crack formation [28], as shown in Figure 10(a). In Figure 10(b)-(d), point A represents the first cracking and fiber bridging activation, point B corresponds to the modulus of rupture (MOR), while point C corresponds to the point at which the load decreases to 80% of the MOR [29]. The shaded area under the curve represents the absorbed energy from first cracking to ultimate deflection (i.e., corresponding deflection at point C), governed by matrix microcracking, slip in the interface transition zone, and fiber bridging, followed by pull-out or rupture.
Both cast SHCC and S-SHCC exhibited three-stage flexural responses encompassing linear elastic, deflection-hardening, and deflection-softening stages, as shown in Figure 10(b) and (c). Compared to the cast SHCC, the S-SHCC exhibited pronounced peak-valley serrations, whereas the cast SHCC curve rose more smoothly in the deflection-hardening stage, as shown in Figure 10(c). This difference reflected that S-SHCC specimens had larger crack spacing and more irregular local load transfer, indicating less uniform stress redistribution during progressive cracking. The irregular serrations suggested that crack formation and fiber bridging occurred in a discontinuous manner. This is due to the uneven fiber distribution caused by airflow-induced fiber orientation during spraying, leading to reduced fiber bridging capacity in S-SHCC compared to cast SHCC [30,31].
The load-deflection curve of reinforced 3DPC with S-SHCC overlay combined characteristics of both plain 3DPC and S-SHCC (see Figure 10(d)), presenting a transition from brittle to pseudo-ductile behavior. Following the first crack at point A, a deflection-hardening segment between points A and B developed due to the contribution of the S-SHCC overlay. The energy absorption and deflection-hardening capacities in this stage fell between those of plain 3DPC and S-SHCC overlay, reflecting their synergistic interaction until the ultimate load was reached.
3.3.2. Effect of Overlay Thickness and Testing Direction on Flexural capacity and Stiffness
Figure 11 presents the representative flexural load vs. mid-span deflection curves of plain and reinforced 3DPC with different overlay thicknesses tested in different directions. The results highlight two governing factors: overlay thickness and printing-induced anisotropy. As shown in Figure 11(a), plain 3DPC specimens exhibited brittle failure with sudden load drops after reaching peak flexural loads. The peak flexural loads and corresponding deflections ranged from 0.3–1.7 kN and 0.3–0.6 mm, respectively, depending on the testing directions. The order of flexural performance was as follows: H-Z > H-X > V-Y > V-X. This reflects the well-established anisotropic characteristics of 3DPC.
While the flexural performance of reinforced 3DPC specimens was superior to the plain 3DPC specimens, their performance depended on the thickness of the S-SHCC overlay. Unlike the brittle failure of plain 3DPC, all reinforced 3DPC specimens with a 10 mm thick overlay (T10) exhibited deflection-softening behavior in all testing directions, as shown in Figure 11(b). This behavior resulted from the multiple cracking mechanisms of the S-SHCC overlay, where fiber bridging restrains crack growth and redistributes stresses [31]. In these specimens, the PMOR and corresponding deflection (δMOR) ranged from 1.2–1.7 kN and 0.4–1.1 mm, respectively, depending on the testing directions. This confirms the higher absorption capacity of reinforced 3DPC-T10 specimens compared to the plain 3DPC specimens.
As shown in Figure 11(c) and (d), the reinforced 3DPC specimens with a 20 mm thick overlay (T20) and 30 mm thick overlay (T30) exhibited superior flexural performance to the T10 specimens. The specimens tested in the H-X, V-X, and V-Y directions showed deflection-hardening behavior, while the specimen tested in the H-Z direction showed deflection-softening behavior. This is because the contribution of the SHCC overlay varies significantly with loading configuration. In the H-X and V-X directions, the SHCC overlay is positioned at the bottom tensile zone, providing maximum contribution to resist tensile stress and enabling pronounced deflection-hardening. In the V-Y direction, although the overlay is on the side with parallel load-sharing, the load acts parallel to the printing layers, where 3DPC exhibits better tensile resistance, allowing sufficient stress transfer to the SHCC overlay for hardening behavior. While in the H-Z direction, the 3DPC substrate and SHCC overlay work in parallel under loading, with the stress acting perpendicular to both the printing direction and the weak interlayer interfaces of 3DPC. In this orientation, the tensile zone within the 3DPC material was relatively thin and traversed the weak interlayer regions. As a result, a single dominant crack rapidly initiated and propagated through the 3DPC substrate, thus suppressing the development of multiple cracking and effective fiber bridging in the S-SHCC overlay. The reinforced 3DPC-T20 specimens, achieved values of PMOR and corresponding deflection (δMOR) ranging from 1.5–2.7 kN and 0.6–3.3 mm, respectively, depending on the testing directions, and exhibited higher absorption capacity than the plain 3DPC specimens. The reinforced 3DPC-T30 specimens achieved the best flexural performance, with the PMOR and corresponding deflection (δMOR) ranging from 1.7–4.0 kN and 0.8–2.7 mm, respectively, depending on the testing directions. Therefore, it can be concluded that as the thickness of the S-SHCC overlay increased from 10 to 30 mm, the overlay gradually became the dominant load-bearing component, with the flexural performance of specimens exhibiting a non-linear growth relationship with overlay thickness.
Figure 12 presents the representative flexural performance of reinforced 3DPC under four different loading directions (H-X, H-Z, V-X, V-Y). As expected, increasing the overlay thickness enhanced the flexural capacity of reinforced 3DPC regardless of S-SHCC overlay location. Among all loading configurations, the specimens in the H-X loading direction exhibited optimal overall performance, with all reinforced specimens demonstrating deflection-hardening behavior under flexural load. As shown in Figure 12(a), the T30-H-X composite achieved the highest peak flexural load of 4 kN, translating to 319% increase in the peak flexural load compared to the plain 3DPC. This superior performance is because the H-X loading direction applies flexural load within continuous printing layers rather than at interlayer interfaces. Although loading is perpendicular to the printing path, cutting along the printing direction (H) maintains layer continuity in the length direction, enabling effective flexural load resistance. Conversely, as shown in Figure 12(b), all specimens tested in the H-Z direction exhibited deflection-softening behavior. In this orientation, the specimen height remains constant, with only the width varying. Since width is less influential than height in governing flexural capacity, the S-SHCC overlay cannot provide sufficient enhancement to induce deflection-hardening. For the same reason, the peak flexural load of the T30-H-Z specimen (about 3.2 kN) was lower than that of the T30-H-X specimen (4 kN), with a rapid load decline after peak.
In the V-X direction, cutting is perpendicular to the wall (printing) direction, with the X-direction loading causing bending stress perpendicular to the 3DPC interlayer interfaces. Under this configuration, the T30-V-X specimen achieved a peak flexural load of approximately 3.8 kN, approaching the optimal performance of H-X, as shown in Figure 12(c). This performance similarity is attributed to the identical specimen dimensions and loading configurations in both cases. The V-Y direction exhibited the most complex stress state. Since the V cutting is perpendicular to the printing direction, bending stresses during Y-axis loading must pass through multiple interlayer interfaces between the 3DPC and the interface between the 3DPC substrate and the overlay. Consequently, the T30-V-Y specimen achieved the lowest peak load among T30 specimens with a peak flexural load of 2.4 kN, which is still demonstrating a 167% improvement over plain 3DPC (about 0.9 kN), as shown in Figure 12(d).
Notably, flexural loads in both the H-Z and V-Y directions act directly on the interface between the 3DPC substrate and S-SHCC overlay. The H-Z specimens exhibited a high flexural strength but low ductility response, whereas the V-Y specimens showed the opposite trend of low flexural strength but high ductility. In the H-Z direction, the 3DPC layer in the compression zone effectively carries compressive stresses, while the S-SHCC overlay provides continuous compression and tension zones at the top and bottom of the specimen. This configuration enables effective load transfer in the initial stage, thereby enhancing peak flexural load capacity. However, the tensile strength of the S-SHCC overlay is insufficient to resist flexural loading in the Z direction, where the tensile strength of 3DPC exceeds that of the S-SHCC overlay. As a result, most of the load is carried by the 3DPC material, and once the load-bearing capacity of 3DPC is reached, the capacity dropped sharply, and brittle failure occurred.
In the case of the V-Y direction, loads must be transmitted across multiple interlayer interfaces, causing progressive cracking at different interfaces rather than simultaneous failure. After local failure at different interfaces, load transfer to other regions, forming multiple peak points in the load-deflection curve. Although the S-SHCC overlay can provide additional load-carrying capacity, interlayer delamination between the S-SHCC overlay and 3DPC was the primary cause of insufficient ductility of reinforced 3DPC.
Figure 13 illustrates the relationship between S-SHCC overlay thickness and initial flexural stiffness for different loading directions. The initial flexural stiffness was determined as the slope of the linear portion of the load-deflection curve up to 30% of the first cracking load PLOP. The plain 3DPC specimens (with no overlay) exhibited significant anisotropic behavior with initial flexural stiffness values ranging from 1.0 kN/mm in the V-X direction to 3.4 kN/mm in the H-Z direction. Notably, H-X and V-X directions showed similar behavior, both starting with lower initial flexural stiffness and increasing steadily with the increase of overlay thickness. Similarly, the H-Z and V-Y directions followed comparable patterns, initially showing higher stiffness but experiencing a reduction with the 10 mm thick overlay before recovering. The reduction at the 10 mm-thick overlay suggests insufficient contribution of the thin overlay to the overall moment of inertia of the specimen. As overlay thickness increased to 20–30 mm, all testing directions showed substantial improvement and convergence to an initial flexural stiffness of 3–4 kN/mm, effectively homogenizing the anisotropic behavior. The similarity between the H-X and V-X directions, as well as between the H-Z and V-Y directions, reflects the influence of loading orientation relative to the printing layers, with thicker overlays successfully mitigating directional weaknesses inherent to 3DPC.
3.3.3. Effect of Overlay Thickness and Testing Direction on Ductility and Energy Absorption
According to ASTM C1018 [32], the pre-cracking behavior of composites can be characterized by the initial cracking point, where the load value PLOP and corresponding deflection δLOP represent the cracking load capacity and deformation capability at initial damage, respectively. The load PMOR and corresponding deflection δMOR in the deflection-hardening stage reflect the ability of reinforced 3DPC to continue bearing loads through fiber bridging after first cracking. The ultimate deflection is defined as the deflection corresponding to a 20% reduction from the PMOR [29], which serves as a quantitative measure of the maximum deformation capacity of the composite in the post-cracking stage.
Ductility and energy absorption are evaluated through two parameters: the toughness indices (I5 and I10) and the residual strength factor (R5,10). The toughness indices represent the stiffness after first-crack up to particular end point deflections, calculated as the ratios of the area under the load-deflection curve up to 3δLOP and 5.5δLOP to that up to δLOP, respectively [33]. The residual strength factors quantify the average post-cracking load within a specified deflection range, expressed as a percentage of the first-cracking load, obtained by calculating the values of 20 (I10 - I5), as shown in Figure 14. For plain concrete, the R5,10 equals zero. A value of 100 indicates ideal elastic-plastic behavior with sustained post-cracking load. Values exceeding 100 demonstrate deflection-hardening characteristics in materials [33]. Following prior work [34,35], this study adopted δMOR/δLOP and δu/δLOP as ductility indices, representing the ratios of peak deflection to first cracking deflection and ultimate deflection to first cracking deflection, respectively.
Table 6 presents the characteristic parameters for plain and reinforced specimens at cracking, strain-hardening, and ultimate stages. Overall, the results indicate a clear transition from brittle to ductile behavior of the reinforced 3DPC specimens with increasing overlay thickness. Plain 3DPC specimens exhibited abrupt post-cracking failure characterized by immediate load drop without exhibiting strain-hardening capacity. Results show limited ductility for reinforced 3DPC specimens with 10 mm S-SHCC overlays, whereas 20 and 30 mm S-SHCC overlays transformed the brittle failure into ductile composite systems with 100%–350% peak flexural load improvement and 250%–650% ultimate deflection enhancement across all directions. This trend aligns with previous findings on S-SHCC overlays used in structural retrofitting, where increasing overlay thickness was shown to improve flexural capacity and ductility through enhanced fiber bridging and crack control mechanisms [36].
Table 7 further provides a quantitative assessment of ductility and energy absorption. Notably, toughness indices and residual strength factors for T10 specimens could not be calculated because specimens failed before reaching the ASTM C1018 specified deflections. This indicates that the 10 mm overlay was insufficient to provide sustained post-cracking deformation capacity. Therefore, specimens exhibiting deflection-hardening behavior are primarily those with 20 and 30 mm overlay thicknesses in the H-X, V-X, and V-Y directions, achieving I5 and I10 values exceeding benchmark criteria (5.0 and 10.0, respectively), indicating significant crack bridging and energy absorption capacity [37]. Furthermore, T20 specimens under the H-X and V-X loading directions, along with T30 specimens under the V-Y loading direction, demonstrated residual strength factors R5,10 exceeding 130, with T30-V-Y achieving the highest value of 152.4, well above ideal plastic behavior (R=100). This indicates pronounced deflection-hardening and high post-cracking load retention capability. The ductility indices δMOR/δLOP and δu/δLOP reveal optimal performance in the T20-H-X specimen, where both peak and ultimate deflections exceed 6 times the first cracking deflection. This demonstrates that the 20 mm overlay thickness achieved an optimal balance between crack resistance and deformation capacity.
3.4. DIC Strain Fields and Crack-Opening Evolution Under Bending
To verify that no interfacial sliding occurs between the 3DPC and S-SHCC overlay during four-point bending, DIC analysis was performed on the interface region between the two materials. Figure 15 presents the longitudinal strain distributions along the specimen height (Figure 15(a)) along with the full field strain distribution within the constant bending moment zone (Figure 15(b)) for three composite beams with different overlay thicknesses (T30-H-X, T20-H-X, and T10-H-X specimens) at their respective peak flexural loads in the X-direction. The horizontal axis in Figure 15(a) represents the vertical position along the cross-section located at midspan. The results show that the longitudinal strain varies linearly with specimen height, with a coefficient of determination R2 greater than 0.97 in all cases, hence confirming the validity of the plane-section assumption. Under bending loads, the bottom region dominated by S-SHCC overlay experiences tension while the upper region dominated by 3DPC experiences compression, resulting in maximum longitudinal strain (εxx) at the bottom (y=0).
Figure 16 presents the interfacial shear strain (εxy) distribution for T30-H-X specimens at peak flexural load and 75% of peak flexural load, where the dashed line indicates the 3DPC-S-SHCC interface. DIC measurements indicate that S-SHCC-3DPC interfacial shear strain remains relatively small and uniformly distributed at both 75% peak flexural load and peak flexural load stages, with maximum values of 0.49% and 0.12%, respectively. Although local strain concentration occurs near the main crack at peak flexural load, it does not extend extensively along the interface. As shown in Figure 17, relative horizontal displacement (Δx=x3DPC-xoverlay) between paired points across the 3DPC-SHCC interface was monitored at three critical locations along the T30-H-X specimen: left loading point, mid-span, and right loading point. This measurement aimed to detect potential interfacial shear slip during loading. The measured Δx remained small throughout the loading history, generally within 0.01 mm, with a gradual increase followed by a quasi-steady response, indicating negligible interfacial slip at the interface. The mid-span location exhibited the largest displacement magnitude, whereas the two loading-point traces were smaller. This distribution corresponds with four-point bending mechanics, where the mid-span region exhibits maximum curvature and differential axial strain. These observations conclusively confirm effective interfacial bonding between the 3DPC substrate and S-SHCC overlay.
Figure 18 shows the maximum principal strain fields (ε1) and crack propagation for T20 specimens under X-, Y-, and Z-loading directions. The images were captured at four loading stages corresponding to 25%, 50%, 75%, and 100% of the ultimate maximum principal strain, with the corresponding mid-span displacement (δ) indicated for each stage. The maximum principal strain was selected as the descriptor because it enables identification of potential crack locations and visualization of progressive crack development, consistent with previous studies on DIC-based crack characterization in cementitious materials [38]. Results demonstrate that failure cracks primarily concentrate within the S-SHCC overlay. Under X-direction loading (T20-H-X, Figure 18 (b)), at the 25% ultimate strain stage (δ = 0.55 mm), initial microcracks are observed with a local maximum principal strain (ε₁) of 0.9% captured in the crack zone. New localized cracks appear at mid-span upon reaching 100% maximum principal strain (ε1 of 3.6%). As shown in Figure 18 (c), in Y-direction loading, both the 3DPC and S-SHCC overlay were subjected to tension and compression, with the loading direction parallel to the printing path. Specimens exhibited higher maximum principal strain than the X-direction loading, developing multiple cracks at mid-span at 75% maximum principal strain (ε1=5.3%) with notably wider crack widths than the X-direction specimens. Similarly to Y-direction loading, Z-direction loads act on the S-SHCC-3DPC interface but perpendicular to the printing direction. Initial cracking occurs only at 25% maximum principal strain (ε1=2.5%), presenting as a single crack continuously penetrating the 3DPC (Figure 18 (d)). As loading continues, additional development occurs near the mid-span when the strain reaches 100% maximum principal strain (ε1=10%). The Z-direction exhibited the highest ultimate strain (10.0%), potentially attributed to perpendicular-to-layer loading causing gradual interlayer debonding that provides additional deformation capacity.
4. Flexural Capacity Prediction Model
Based on the DIC analysis in Section 4.3, confirming strain compatibility and no interlaminar slip at the 3DPC-S-SHCC interface, a modified plane-section approach is proposed. Unlike conventional section analysis, this model accounts for the anisotropic behavior of 3DPC arising from the layer-to-layer printing process and accommodates the variable positioning of sprayed SHCC overlay within the composite cross-section under four-point bending.
4.1. Flexural Capacity Prediction in the X-Direction
4.1.1. Elastic Stage
The experimental results above demonstrate that increasing the thickness of the S-SHCC overlay can lead to notable improvements in both the flexural strength and deformation capacity of reinforced 3DPC under four-point bending. However, the incremental benefits from increased overlay thickness showed a gradually diminishing trend. This trend is closely governed by the migration of the neutral axis through the composite specimen. Under X-direction loading, as the S-SHCC overlay becomes thicker, the neutral axis shifts downward toward the tensile region, which enlarges the internal lever arm and consequently enhances the overall flexural resistance. Consequently, as the overlay thickness continues to increase, the compression zone height gradually increases, as shown in Figure 19. This reduction in compression zone height weakens the marginal effect of lever arm growth, resulting in a decelerated improvement in the flexural capacity of specimens.
Considering the anisotropy of plain 3DPC, which results in significant variations in its mechanical properties under different loading directions [39,40,41], together with the strain-hardening behavior of the S-SHCC overlay and the shear transfer across the interface. This section proposes a predictive model that simultaneously considers material anisotropy, neutral-axis migration, and interfacial effects to quantify the flexural capacity of a composite under four-point bending. Figure 19 shows the stress distribution at the S-SHCC overlay-3DPC interface and neutral axis variation after S-SHCC overlay application.
In flexural testing, the position of the neutral axis is determined by sectional force equilibrium, where compressive and tensile resultant forces are equal [34]. Based on the Euler--Bernoulli beam theory, strain distributes linearly across the section height, enabling neutral axis calculation through force balance between the concrete compression and tensile area [42]. The analysis further assumes: (1) linear elastic material behavior for both 3DPC and SHCC before cracking; (2) the transformed section method is applicable for analyzing the composite cross-section; and (3) full strain compatibility at the 3DPC/S-SHCC interface, as validated by the experimental results in Section 4.3. For 3DPC in the elastic stage, the cross-section remains uncracked, which allows the cracking load capacity to be calculated using Eq. (1)-(3).
where Eshcc and E3dpc is the elastic modulus of SHCC and 3DPC (GPa), respectively, yshcc and y3dpc are the centroid of SHCC and 3DPC (mm), respectively, h is the total height of the specimen (mm), EI is the equivalent flexural rigidity (N·mm²), L is the distance from the support to the loading point (mm), Mcr is the cracking moment (N·mm), Pcr is the cracking load capacity in elastic stage (kN), and is the equivalent tensile strength of SHCC (MPa).
4.1.2. Peak-Load Stage
When the reinforced 3DPC specimen reaches peak load, failure occurs when either the 3DPC material attains its maximum compressive stress or the S-SHCC reaches its maximum tensile stress, depending on which material reaches its capacity first. The model assumes elastic-perfectly plastic behavior with rectangular stress blocks, which is consistent with established approaches for analyzing composite beam sections [43]. The tensile contribution of 3DPC is neglected due to its relatively low tensile strength and early cracking tendency. Based on strain compatibility conditions, the tensile force in the S-SHCC overlay (Tshcc) is in equilibrium with the compressive forces. The force equilibrium for two cases depending on the neutral axis position is expressed in Eq. (4), with the corresponding neutral axis depth given in Eq. (5). The peak moment capacity is calculated using Eq. (6), and the peak load capacity under four-point bending is determined by Eq. (7).
where Tshcc is tensile force in the S-SHCC overlay (N), C3dpc and Cshcc are the compressive forces in the 3DPC and S-SHCC overlay, respectively (N), t3dpc and tshcc are the thicknesses of the 3DPC and S-SHCC layers, respectively (mm), h is the total height of the composite specimen (mm), σt is the equivalent tensile strength of S-SHCC (MPa), fc,3dpc and fc,shcc are the compressive strengths of 3DPC and S-SHCC, respectively (MPa), y3dpc and yshcc are the centroid of the 3DPC compression zone and S-SHCC tension zone, respectively (mm), yshcc,t and yshcc,c are the centroids of the S-SHCC tension and compression zones when the neutral axis lies within the S-SHCC layer, respectively (mm), Mpeak is the peak moment capacity (N·mm), L is the distance from the support to the loading point (mm) and Ppeak is the peak load capacity of the composite (kN).
The equivalent tensile properties of S-SHCC overlay under four-point bending are determined using a reverse calculation method based on sectional mechanics [44,45,46]. Table 8 compares the predicted flexural capacity of 3DPC with S-SHCC overlay to the experimental results. The results show that in the elastic stage, the predicted cracking loads are reasonably close to the measured values, with deviations controlled within the range of 28%. At the peak load stage, for both equivalent tensile stress and peak load, the differences between predicted and measured values generally fluctuate within 30% as the thickness varies. As the overlay thickness increases, the gap between predicted and measured values gradually decreases, and for T30 specimens, the prediction nearly coincides with the experiment. This indicates that a thicker overlay produces a tensile stress closer to the uniform state assumed in the model, thereby validating the model assumption. In contrast, thinner overlays are more sensitive to interfacial effects and local heterogeneity, causing larger prediction errors.
For different thicknesses, the predicted cracking and peak loads remain consistent across H and V cutting directions because predictions depend only on geometric parameters, elastic modulus, and material strengths, which are independent of cutting direction. This independence explains the similar X-direction flexural performance observed between the H and V specimens under the same overlay thickness.
4.2. Flexural Capacity Prediction in the Y- and Z-Directions
4.2.1. Elastic Stage
When composite specimens are subjected to bending loads in the Y- or Z-directions, the side-by-side arrangement of 3DPC and S-SHCC overlay differs significantly from conventional layered composite beams. In this configuration, the 3DPC substrate and S-SHCC overlay are arranged in parallel, and the loading direction is perpendicular to the interface. The same assumptions as stated in Section 4.1.1 are adopted for the Y- and Z-direction loading: (1) linear elastic material behavior for both 3DPC and SHCC before cracking; and (2) the transformed section method is applicable for analyzing the composite cross-section. The DIC testing confirms that no significant shear slip occurs between the S-SHCC overlay and 3DPC, with both maintaining approximately identical deflections and rotations at the interface (Figure 16).
During the elastic stage, both constituents contribute to the flexural resistance under the assumptions of perfect bond and plane sections remaining plane, resulting in strain compatibility and stiffness-dependent stress distribution across the composite section. Due to the higher tensile strain capacity of S-SHCC, the overlay restrains the brittle deformation of 3DPC, thereby enhancing the overall deformability of the composite system. To identify initial cracking, the cracking strain of each material is calculated using Eq. (8). Comparison shows that 3DPC reaches its cracking strain first, thus governing composite cracking. Since 3DPC controls the initial cracking, the cracking stress of the 3DPC substrate is calculated from the plain 3DPC specimen using linear elastic section, as shown in Eq. (9). The composite cracking load is obtained by converting the plain 3DPC cracking condition to the composite section using linear-elastic sectional analysis, accounting for stiffness redistribution between the 3DPC core and the S-SHCC overlay in Eq. (10).
where is the cracking moment of 3DPC (N·mm), and are neutral axis depth (mm) and moment of inertia (mm4) of 3DPC, respectively, Eshcc and E3dpc is the elastic modulus of S-SHCC and 3DPC (GPa), respectively, is the cracking load of …plain 3DPC (kN), which can be obtained from four-point bending tests, and are the thicknesses of 3DPC and S-SHCC overlay in composite (mm), respectively, and is the thickness of plain 3DPC (mm).
4.2.2. Peak-Load Stage
Figure 20 shows the prediction process for flexural capacity of the composite in the Y- and Z-directions. Due to the side-by-side arrangement of 3DPC and S-SHCC in these loading directions, the failure mode depends on whether the S-SHCC overlay can effectively redistribute stresses after initial cracking occurs. When stress redistribution occurs, the specimen exhibits ductile behavior, and the peak flexural load is calculated through force equilibrium and moment analysis. Otherwise, brittle failure occurs, and the cracking load equals the peak flexural load. Initial cracking location is determined by comparing the cracking strains of both materials using Eq. (8). Given the significant difference in elastic modules between 3DPC and S-SHCC, cracking strain rather than strength is used as the criterion for determining initial cracking. After initial cracking occurs in 3DPC, part of the tensile force originally carried by 3DPC is transferred to the S-SHCC layer through interfacial bonding. The post-cracking behavior depends on whether the S-SHCC overlay has sufficient residual capacity to carry this additional load. The flexural-equivalent tensile strength (feq) is defined as the maximum tensile stress at the extreme fiber under bending, representing the flexural tensile capacity of each material. When 3DPC cracks, the stress level in the composite has reached the flexural-equivalent tensile strength of 3DPC (feq,3DPC). If the flexural-equivalent tensile strength of S-SHCC overlay (feq,SHCC) is lower than feq,3DPC, the S-SHCC overlay provides insufficient tensile capacity to sustain the redistributed tensile demand after first cracking, resulting in a brittle post-cracking response. Conversely, when feq,3DPC is lower than feq,SHCC, the S-SHCC overlay provides sufficient reserve capacity to sustain the redistributed tensile demand, promoting multiple cracking and strain hardening and thereby leading to a ductile response. These predictions are consistent with experimental observations.
Following initial cracking and subsequent load transfer to the S-SHCC overlay, the post-cracking mechanical behavior under Y- and Z-direction bending can be analyzed using a modified stress distribution model in Figure 21, where the tensile resistance is provided entirely by the S-SHCC overlay. Similar to the X-direction analysis, the model assumes perfectly plastic material behavior with uniform stress distribution, resulting in rectangular stress blocks for both tension and compression zones [43]. Above the neutral axis, both S-SHCC overlay and 3DPC contribute to compression resistance, while below the neutral axis, cracked 3DPC becomes ineffective and only S-SHCC carries loads. Eqs. (11)-(14) present the procedure for calculating the peak flexural load-bearing capacity of the composite in the ductile failure stage.
Table 9 and Table 10 compare the experimental and predicted values for elastic stage and peak flexural load performance under the Y- and Z-directions, respectively. As shown in Table 9, the predicted elastic cracking loads (PLOP) exhibited good agreement with the experimental results, with most deviations within 20%. The model successfully predicts the failure modes, identifying ductile failure for Y-direction specimens and brittle failure for Z-direction specimens, which generally agree with the experimental results. Furthermore, the peak-load comparison in Table 10 demonstrates reasonable accuracy with spreads of 13.9% and 2.1% for the T20-V-Y and T30-V-Y specimens, respectively. This validates the proposed analytical framework for reliably capturing the post-cracking behavior in the composite under different loading directions. Figure 22 presents the correlation between the predicted and experimental results for both LOP and MOR loads across different loading directions. The material properties used in the predictions were obtained from independent material tests rather than back-calculated from the flexural test results of the composite specimens. The regression analysis yielded a strong correlation (R² = 0.92) with the fitted line equation. The data points cluster closely around the diagonal reference line, demonstrating good predictive accuracy of the analytical model across all testing configurations. Further validation is recommended for other material combinations or geometric configurations.
5. Conclusions
This study investigated the flexural performance of 3DPC reinforced with S-SHCC overlays of different thicknesses. Four-point bending tests combined with DIC were employed to examine flexural behavior and interfacial performance. A modified plane-section model accounting for overlay thickness and loading direction was developed. The main conclusions are as follows.
- (1)
- The compressive strength of the reinforced 3DPC exhibited a pronounced anisotropic response in the X-, Y-, and Z-directions. Compared with the plain 3DPC, the reinforced specimens showed a modest increase of 4%–12% in the X-direction, whereas the compressive strength gains in the Y- and Z-directions were 0–18% and 49%–57% respectively. Among the three overlay thicknesses tested (10, 20, and 30 mm), the 20 mm overlay demonstrated the optimal overall compressive performance.
- (2)
- Under four-point bending, as the S-SHCC overlay thickness increased from 10 to 30 mm, the overlay gradually became the dominant load-bearing component, with flexural performance exhibiting a non-linear relationship with overlay thickness. For T30 specimens, the H-X loading direction led to an optimal overall performance, achieving a 319% increase in peak flexural load compared to plain 3DPC specimens, while the V-Y direction exhibited the lowest peak flexural load among T30 specimens, with a 167% improvement in peak flexural load.
- (3)
- Ductility analysis revealed that specimens prepared with 10 mm S-SHCC overlays exhibited limited ductility, as this thickness was insufficient to provide sustained post-cracking deformation capacity. However, 20 and 30 mm overlays effectively transformed the brittle failure of plain 3DPC specimens into ductile composite systems, with peak flexural load improvements of 100%–350% and ultimate deflection enhancements of 250%–650% across all directions compared to plain 3DPC. Deflection-hardening behavior was primarily exhibited by specimens with 20 and 30 mm overlays in the H-X, V-X, and V-Y directions. Considering overall performance, the 20 mm overlay thickness represented an optimal balance between crack resistance and deformation capacity.
- (4)
- DIC measurements demonstrated that longitudinal strain varied linearly with specimen height, achieving R² greater than 0.97 in all cases, thereby validating the plane-section assumption for the reinforced 3DPC composite system. Effective interfacial bonding was confirmed by the small and uniformly distributed shear strain (0.49% and 0.12% at 75% peak flexural load and 100% peak flexural load, respectively) and minimal interfacial slip throughout loading. Principal strain field analysis further indicated that failure cracks were predominantly concentrated within the S-SHCC overlay.
- (5)
- The anisotropy-modified plane-section assumption model accurately predicted structural behavior across different loading directions. Under the X-direction four-point bending test, predicted cracking loads deviated less than 28% from measured values in the elastic stage, while peak load predictions remained within 30% deviation. For Y- and Z-direction loading, the model achieved better accuracy with cracking load deviations mostly within 20% and peak flexural load spreads of 13.9% and 2.1% for T20 and T30 samples, respectively, successfully capturing failure modes across all configurations.
Acknowledgments
The authors greatly acknowledge the Engineering and Physical Sciences Research Council (EPSRC), the University of Sheffield, and COBOD International for the award of the PhD studentship (EP/W524360/1) titled “Thin overlays to replace the need for conventional reinforcement in additively manufactured concrete structures”, which is funded through the EPSRC DTP CASE Conversion scheme in collaboration with industry partner COBOD International. The authors also gratefully acknowledge the technical staff at Materials and Structures Laboratories for their support.
References
- Mechtcherine, V.; Bos, F.P.; Perrot, A.; da Silva, W.R.L.; Nerella, V.N.; Fataei, S.; Wolfs, R.J.M.; Sonebi, M.; Roussel, N. Extrusion-based additive manufacturing with cement-based materials – Production steps, processes, and their underlying physics: A review. Cem Concr Res 2020, 132, 106037. [Google Scholar] [CrossRef]
- Zhang, J.; Wang, J.; Dong, S.; Yu, X.; Han, B. A review of the current progress and application of 3D printed concrete. Composites Part A 2019, 125, 105533. [Google Scholar] [CrossRef]
- Xiao, J.; Ji, G.; Zhang, Y.; Ma, G.; Mechtcherine, V.; Pan, J.; Wang, L.; Ding, T.; Duan, Z.; Du, S. Large-scale 3D printing concrete technology: Current status and future opportunities. Cem Concr Compos 2021, 122, 104115. [Google Scholar] [CrossRef]
- Zhang, Y.; Ren, Q.; Van Tittelboom, K.; De Schutter, G.; Jiang, Z. Layer interface in 3D printed cement-based materials: Heterogeneous phase distribution and new insights into formation mechanism. Cem Concr Compos 2026, 165, 106337. [Google Scholar] [CrossRef]
- Le, T.T.; Austin, S.A.; Lim, S.; Buswell, R.A.; Law, R.; Gibb, A.G.F.; Thorpe, T. Hardened properties of high-performance printing concrete. Cem Concr Res 2012, 42, 558–566. [Google Scholar] [CrossRef]
- Asprone, D.; Menna, C.; Bos, F.P.; Salet, T.A.M.; Mata-Falcón, J.; Kaufmann, W. Rethinking reinforcement for digital fabrication with concrete. Cem Concr Res 2018, 112, 111–121. [Google Scholar] [CrossRef]
- Li, Z.; Wang, L.; Ma, G.; Sanjayan, J.; Feng, D. Strength and ductility enhancement of 3D printing structure reinforced by embedding continuous micro-cables. Constr Build Mater 2020, 264, 120196. [Google Scholar] [CrossRef]
- L. Gebhard, J. Mata-Falcón, A. Anton, J. Burger, E. Lloret-Fritschi, L. Reiter, B. Dillenburger, F. Gramazio, M. Kohler, R. Flatt, W. Kaufmann, Aligned Interlayer Fibre Reinforcement and Post-tensioning as a Reinforcement Strategy for Digital Fabrication, in: F.P. Bos, S.S. Lucas, R.J.M. Wolfs, T.A.M. Salet (Eds.) Second RILEM International Conference on Concrete and Digital Fabrication, Springer International Publishing, Cham, 2020, pp. 622-631.
- Alonso-Canon, S.; Blanco-Fernandez, E.; Castro-Fresno, D.; Yoris-Nobile, A.I.; Castañon-Jano, L. Reinforcements in 3D printing concrete structures. Arch Civ Mech Eng 2022, 23, 25. [Google Scholar] [CrossRef]
- Yao, Y.; Bu, D.; Yu, J.; Shao, L.; Feng, P.; Lu, C.; Wang, J. Flexural behavior of textile reinforced 3D printed concrete under quasi-static and dynamic impact loads. Case Stud Constr Mater 2024, 21, e03645. [Google Scholar] [CrossRef]
- Mechtcherine, V.; Buswell, R.; Kloft, H.; Bos, F.P.; Hack, N.; Wolfs, R.; Sanjayan, J.; Nematollahi, B.; Ivaniuk, E.; Neef, T. Integrating reinforcement in digital fabrication with concrete: A review and classification framework. Cem Concr Compos 2021, 119, 103964. [Google Scholar] [CrossRef]
- Soltan, D.G.; Li, V.C. A self-reinforced cementitious composite for building-scale 3D printing. Cem Concr Compos 2018, 90, 1–13. [Google Scholar] [CrossRef]
- Lloret-Fritschi, E.; Wangler, T.; Gebhard, L.; Mata-Falcón, J.; Mantellato, S.; Scotto, F.; Burger, J.; Szabo, A.; Ruffray, N.; Reiter, L.; et al. From Smart Dynamic Casting to a growing family of Digital Casting Systems. Cem Concr Res 2020, 134, 106071. [Google Scholar] [CrossRef]
- van Zijl, G.P.; de Beer, L. Sprayed strain-hardening cement-based composite overlay for shear strengthening of unreinforced load-bearing masonry. Adv. Struct. Eng 2019, 22, 1121–1135. [Google Scholar] [CrossRef]
- Lin, Y.; Lawley, D.; Wotherspoon, L.; Ingham, J.M. Out-of-plane testing of unreinforced masonry walls strengthened using ECC shotcrete. Structures 2016, 7, 33–42. [Google Scholar] [CrossRef]
- He, S.; Mustafa, S.; Chang, Z.; Liang, M.; Schlangen, E.; Luković, M. Ultra-thin strain hardening cementitious composite (SHCC) layer in reinforced concrete cover zone for crack width control. Eng Struct 2023, 292, 116584. [Google Scholar] [CrossRef]
- Han, S.J.; Yun, H.D. Flexural toughness of sprayable strain-hardening cement composite (SHCC) for seismic retrofit of non-ductile reinforced concrete frames. Adv. Mater. Res 2013, 658, 34–37. [Google Scholar] [CrossRef]
- Zhang, Y. Flexural Behavior Investigation of Reinforced Concrete Member with Strengthening Using Strain Hardening Cementitious Composite. Int J Civ Eng 2018, 16, 837–843. [Google Scholar] [CrossRef]
- Paul, S.C. The role of cracks and chlorides in corrosion of reinforced strain hardening cement-based composite (R/SHCC); Stellenbosch University: Stellenbosch, South Africa, 2015. [Google Scholar]
- Buswell, R.A.; Leal de Silva, W.R.; Jones, S.Z.; Dirrenberger, J. 3D printing using concrete extrusion: A roadmap for research. Cem Concr Res 2018, 112, 37–49. [Google Scholar] [CrossRef]
- Ma, G.; Li, Z.; Wang, L.; Wang, F.; Sanjayan, J. Mechanical anisotropy of aligned fiber reinforced composite for extrusion-based 3D printing. Constr Build Mater 2019, 202, 770–783. [Google Scholar] [CrossRef]
- Beushausen, H.; Höhlig, B.; Talotti, M. The influence of substrate moisture preparation on bond strength of concrete overlays and the microstructure of the OTZ. Cem Concr Res 2017, 92, 84–91. [Google Scholar] [CrossRef]
- Tao, Y.; Lesage, K.; Van Tittelboom, K.; Yuan, Y.; De Schutter, G. Influence of substrate surface roughness and moisture content on tensile adhesion performance of 3D printable concrete. Cem Concr Compos 2022, 126, 104350. [Google Scholar] [CrossRef]
- A.S.f.T.a.M. International, ASTM C1609/C1609M: Standard test method for flexural performance of fiber-reinforced concrete (using beam with third-point loading), West Conshohocken, PA, USA, 2012.
- Zhang, Q.; Li, V.C. Development of durable spray-applied fire-resistive Engineered Cementitious Composites (SFR-ECC). Cem Concr Compos 2015, 60, 10–16. [Google Scholar] [CrossRef]
- Kim, Y.Y.; Fischer, G.; Lim, Y.M.; Li, V.C. Mechanical performance of sprayed engineered cementitious composite using wet-mix shotcreting process for repair applications. Materials Journal 2004, 101, 42–49. [Google Scholar]
- van den Heever, M.; du Plessis, A.; Kruger, J.; van Zijl, G. Evaluating the effects of porosity on the mechanical properties of extrusion-based 3D printed concrete. Cem Concr Res 2022, 153, 106695. [Google Scholar] [CrossRef]
- Ibrahim, K.; van Zijl, G.; Babafemi, A.J. Time-dependent behaviour of 3D printed fibre-reinforced limestone calcined clay cement concrete under sustained loadings. Constr Build Mater 2024, 446, 138001. [Google Scholar] [CrossRef]
- Hadi, M.N.S.; Elbasha, N. Effects of tensile reinforcement ratio and compressive strength on the behaviour of over-reinforced helically confined HSC beams. Constr Build Mater 2007, 21, 269–276. [Google Scholar] [CrossRef]
- Zhu, H.; Yu, K.; Li, V.C. Sprayable engineered cementitious composites (ECC) using calcined clay limestone cement (LC3) and PP fiber. Cem Concr Compos 2021, 115, 103868. [Google Scholar] [CrossRef]
- Hung, C.C.; Do, T.D.D. Sprayed high-strength strain-hardening cementitious composite: Anisotropic mechanical properties and fiber distribution characteristics. Constr Build Mater 2024, 412, 134862. [Google Scholar] [CrossRef]
- C.J.A.S.o.T.M. Astm, USA, 1018:‘standard test method for flexural toughness and first-crack strength of fiber-reinforced concrete (using beam with third-point loading), (1997).
- Nematollahi, B.; Sanjayan, J.; Shaikh, F.U.A. Comparative deflection hardening behavior of short fiber reinforced geopolymer composites. Constr Build Mater 2014, 70, 54–64. [Google Scholar] [CrossRef]
- Teng, L.; Khayat, K.H. Effect of overlay thickness, fiber volume, and shrinkage mitigation on flexural behavior of thin bonded ultra-high-performance concrete overlay slab. Cem Concr Compos 2022, 134, 104752. [Google Scholar] [CrossRef]
- Feng, Y.; Qi, J.; Wang, J.; Liu, J.; Liu, J. Flexural Behavior of the Innovative CA-UHPC Slabs with High and Low Reinforcement Ratios. Adv Mater Sci Eng 2019, 2019, 6027341. [Google Scholar] [CrossRef]
- Van Zijl, G.P.A.G.; Beer, L.J.d. An SHCC overlay retrofitting strategy for unreinforced load bearing masonry. Procedia Eng. 2016, 143, 670–677. [Google Scholar]
- Li, Y.; Zhao, C.; Li, H.; Liu, W. Study on the toughness and microstructure of UHPC with a high steel fiber content. Constr Build Mater 2025, 460, 139810. [Google Scholar] [CrossRef]
- Huang, B.-T.; Weng, K.-F.; Zhu, J.-X.; Xiang, Y.; Dai, J.-G.; Li, V.C. Engineered/strain-hardening cementitious composites (ECC/SHCC) with an ultra-high compressive strength over 210 MPa. Compos Commun 2021, 26, 100775. [Google Scholar] [CrossRef]
- Sun, B.; Li, P.; Wang, D.; Ye, J.; Liu, G.; Zhao, W. Evaluation of mechanical properties and anisotropy of 3D printed concrete at different temperatures. Structures 2023, 51, 391–401. [Google Scholar] [CrossRef]
- Ding, T.; Xiao, J.; Zou, S.; Zhou, X. Anisotropic behavior in bending of 3D printed concrete reinforced with fibers. Compos Struct 2020, 254, 112808. [Google Scholar] [CrossRef]
- Zhang, K.; Lin, W.; Zhang, Q.; Wang, D.; Luo, S. Evaluation of anisotropy and statistical parameters of compressive strength for 3D printed concrete. Constr Build Mater 2024, 440, 137417. [Google Scholar] [CrossRef]
- A.J.A.C.I.F.H. ACI, MI, USA, 318-19 & ACI 318R-19: Building code requirements for structural concrete and commentary, (2019).
- Fan, J.; Gou, S.; Ding, R.; Zhang, J.; Shi, Z. Experimental and analytical research on the flexural behaviour of steel–ECC composite beams under negative bending moments. Eng Struct 2020, 210, 110309. [Google Scholar] [CrossRef]
- Qian, S.; Li, V.C. Simplified Inverse Method for Determining the Tensile Properties of Strain Hardening Cementitious Composites (SHCC). J Adv Concr Technol 2008, 6, 353–363. [Google Scholar] [CrossRef]
- Kanakubo, T. Tensile Characteristics Evaluation Method for Ductile Fiber-Reinforced Cementitious Composites. J Adv Concr Technol 2006, 4, 3–17. [Google Scholar] [CrossRef]
- Mosallam, A.S. Out-of-plane flexural behavior of unreinforced red brick walls strengthened with FRP composites. Composites Part B 2007, 38, 559–574. [Google Scholar] [CrossRef]
Figure 1.
Particle size distributions of raw materials.
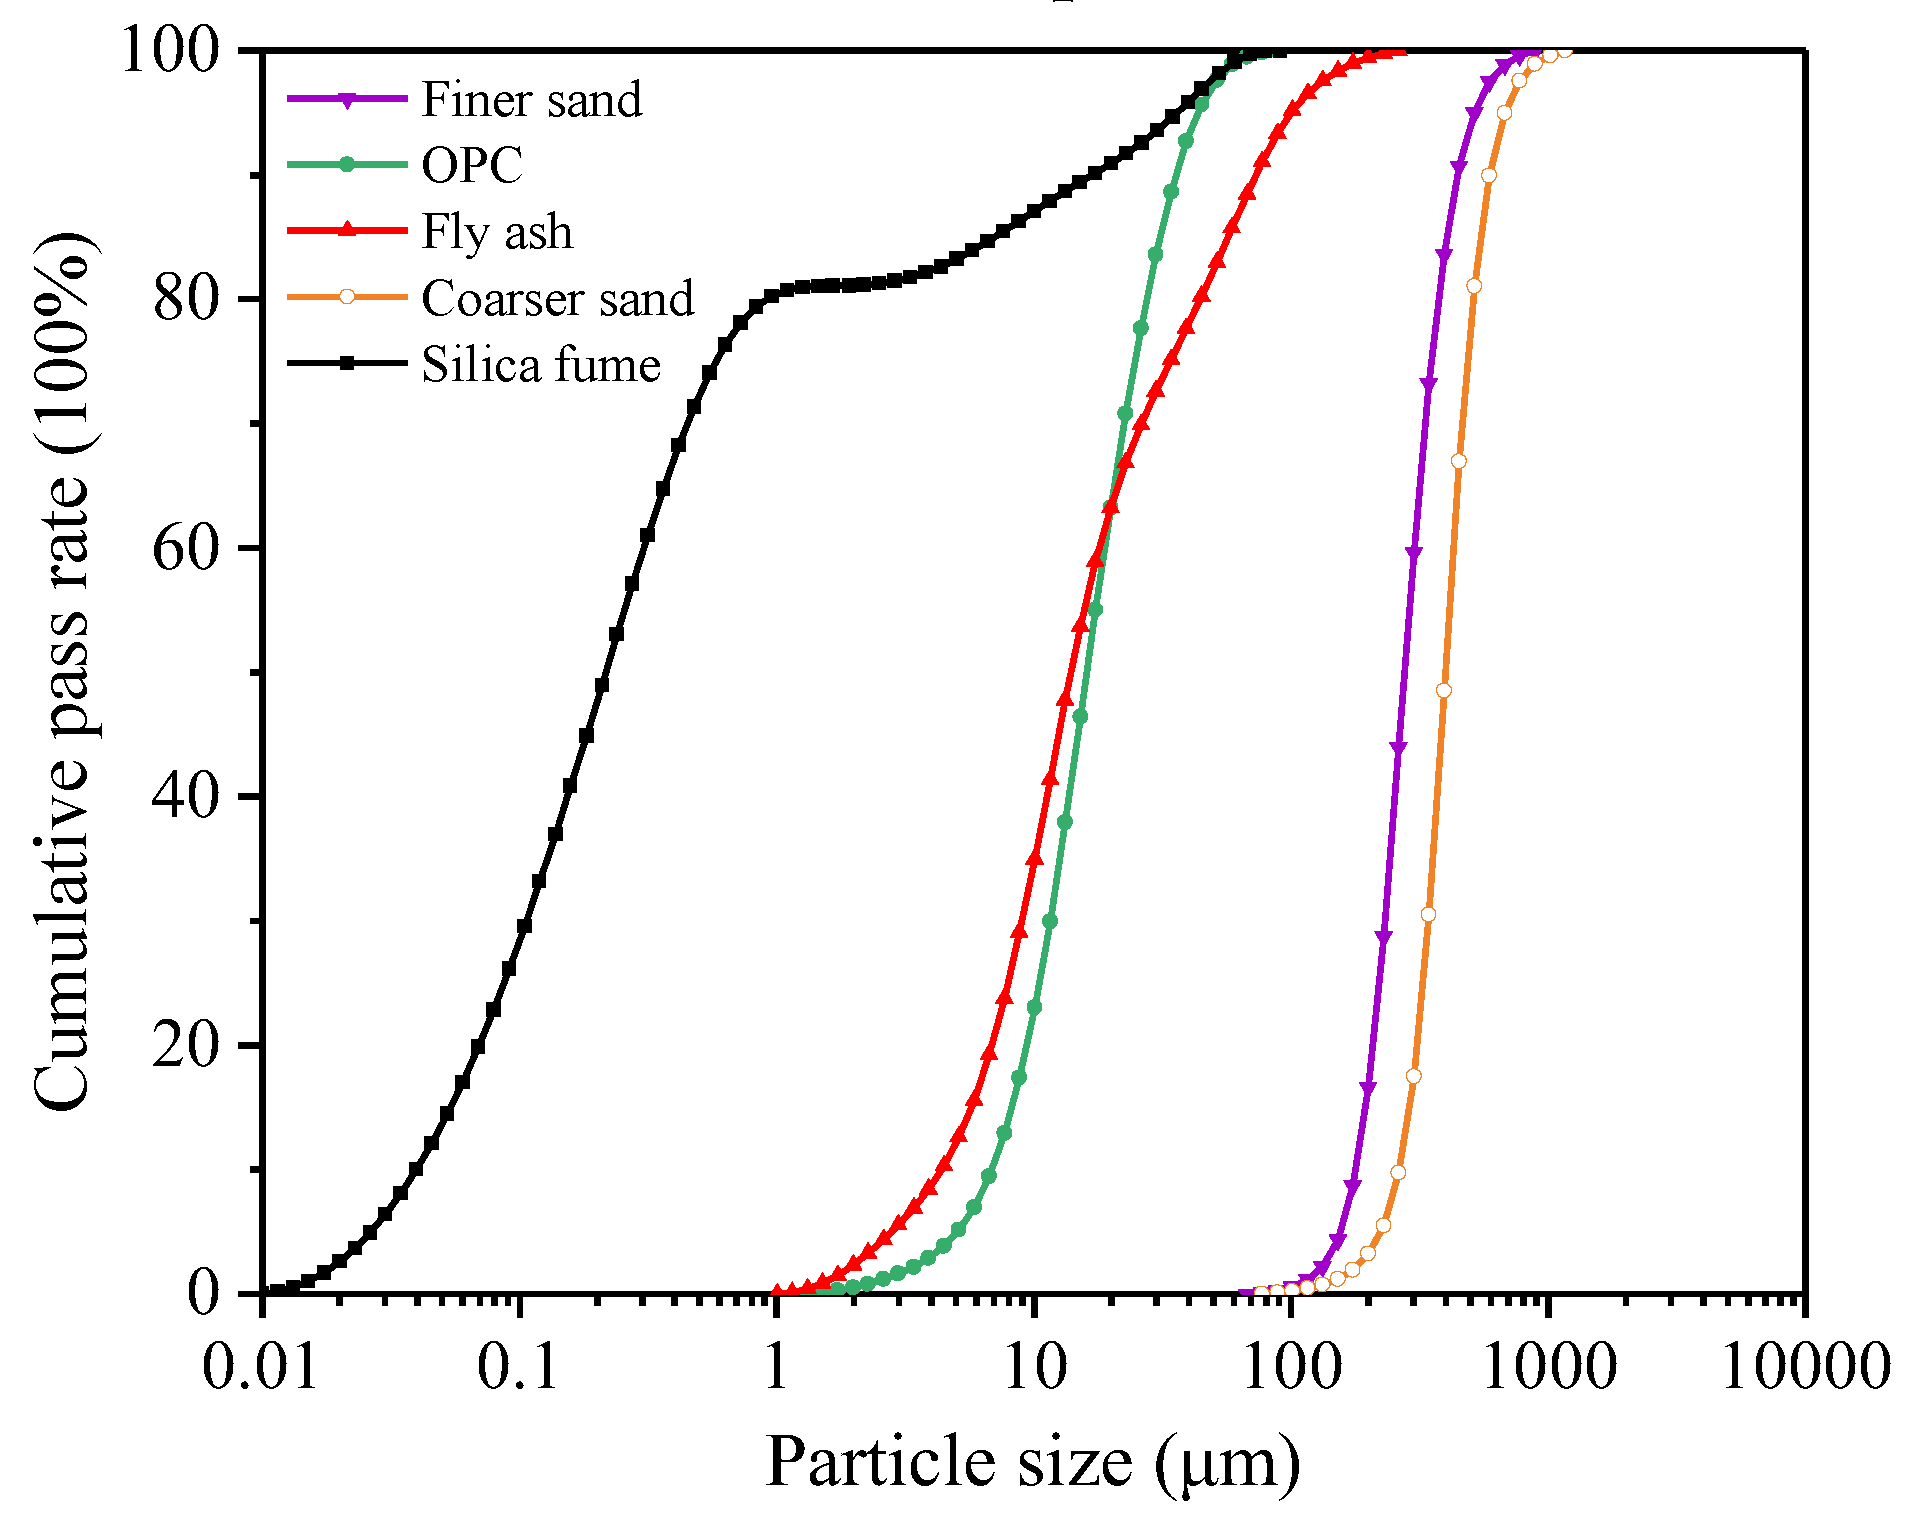
Figure 2.
3DPC substrate wall panels: (a) front view for prism samples; (b) top view for prism samples; (c) front view for cube samples; (d) top view for cube samples.
Figure 2.
3DPC substrate wall panels: (a) front view for prism samples; (b) top view for prism samples; (c) front view for cube samples; (d) top view for cube samples.
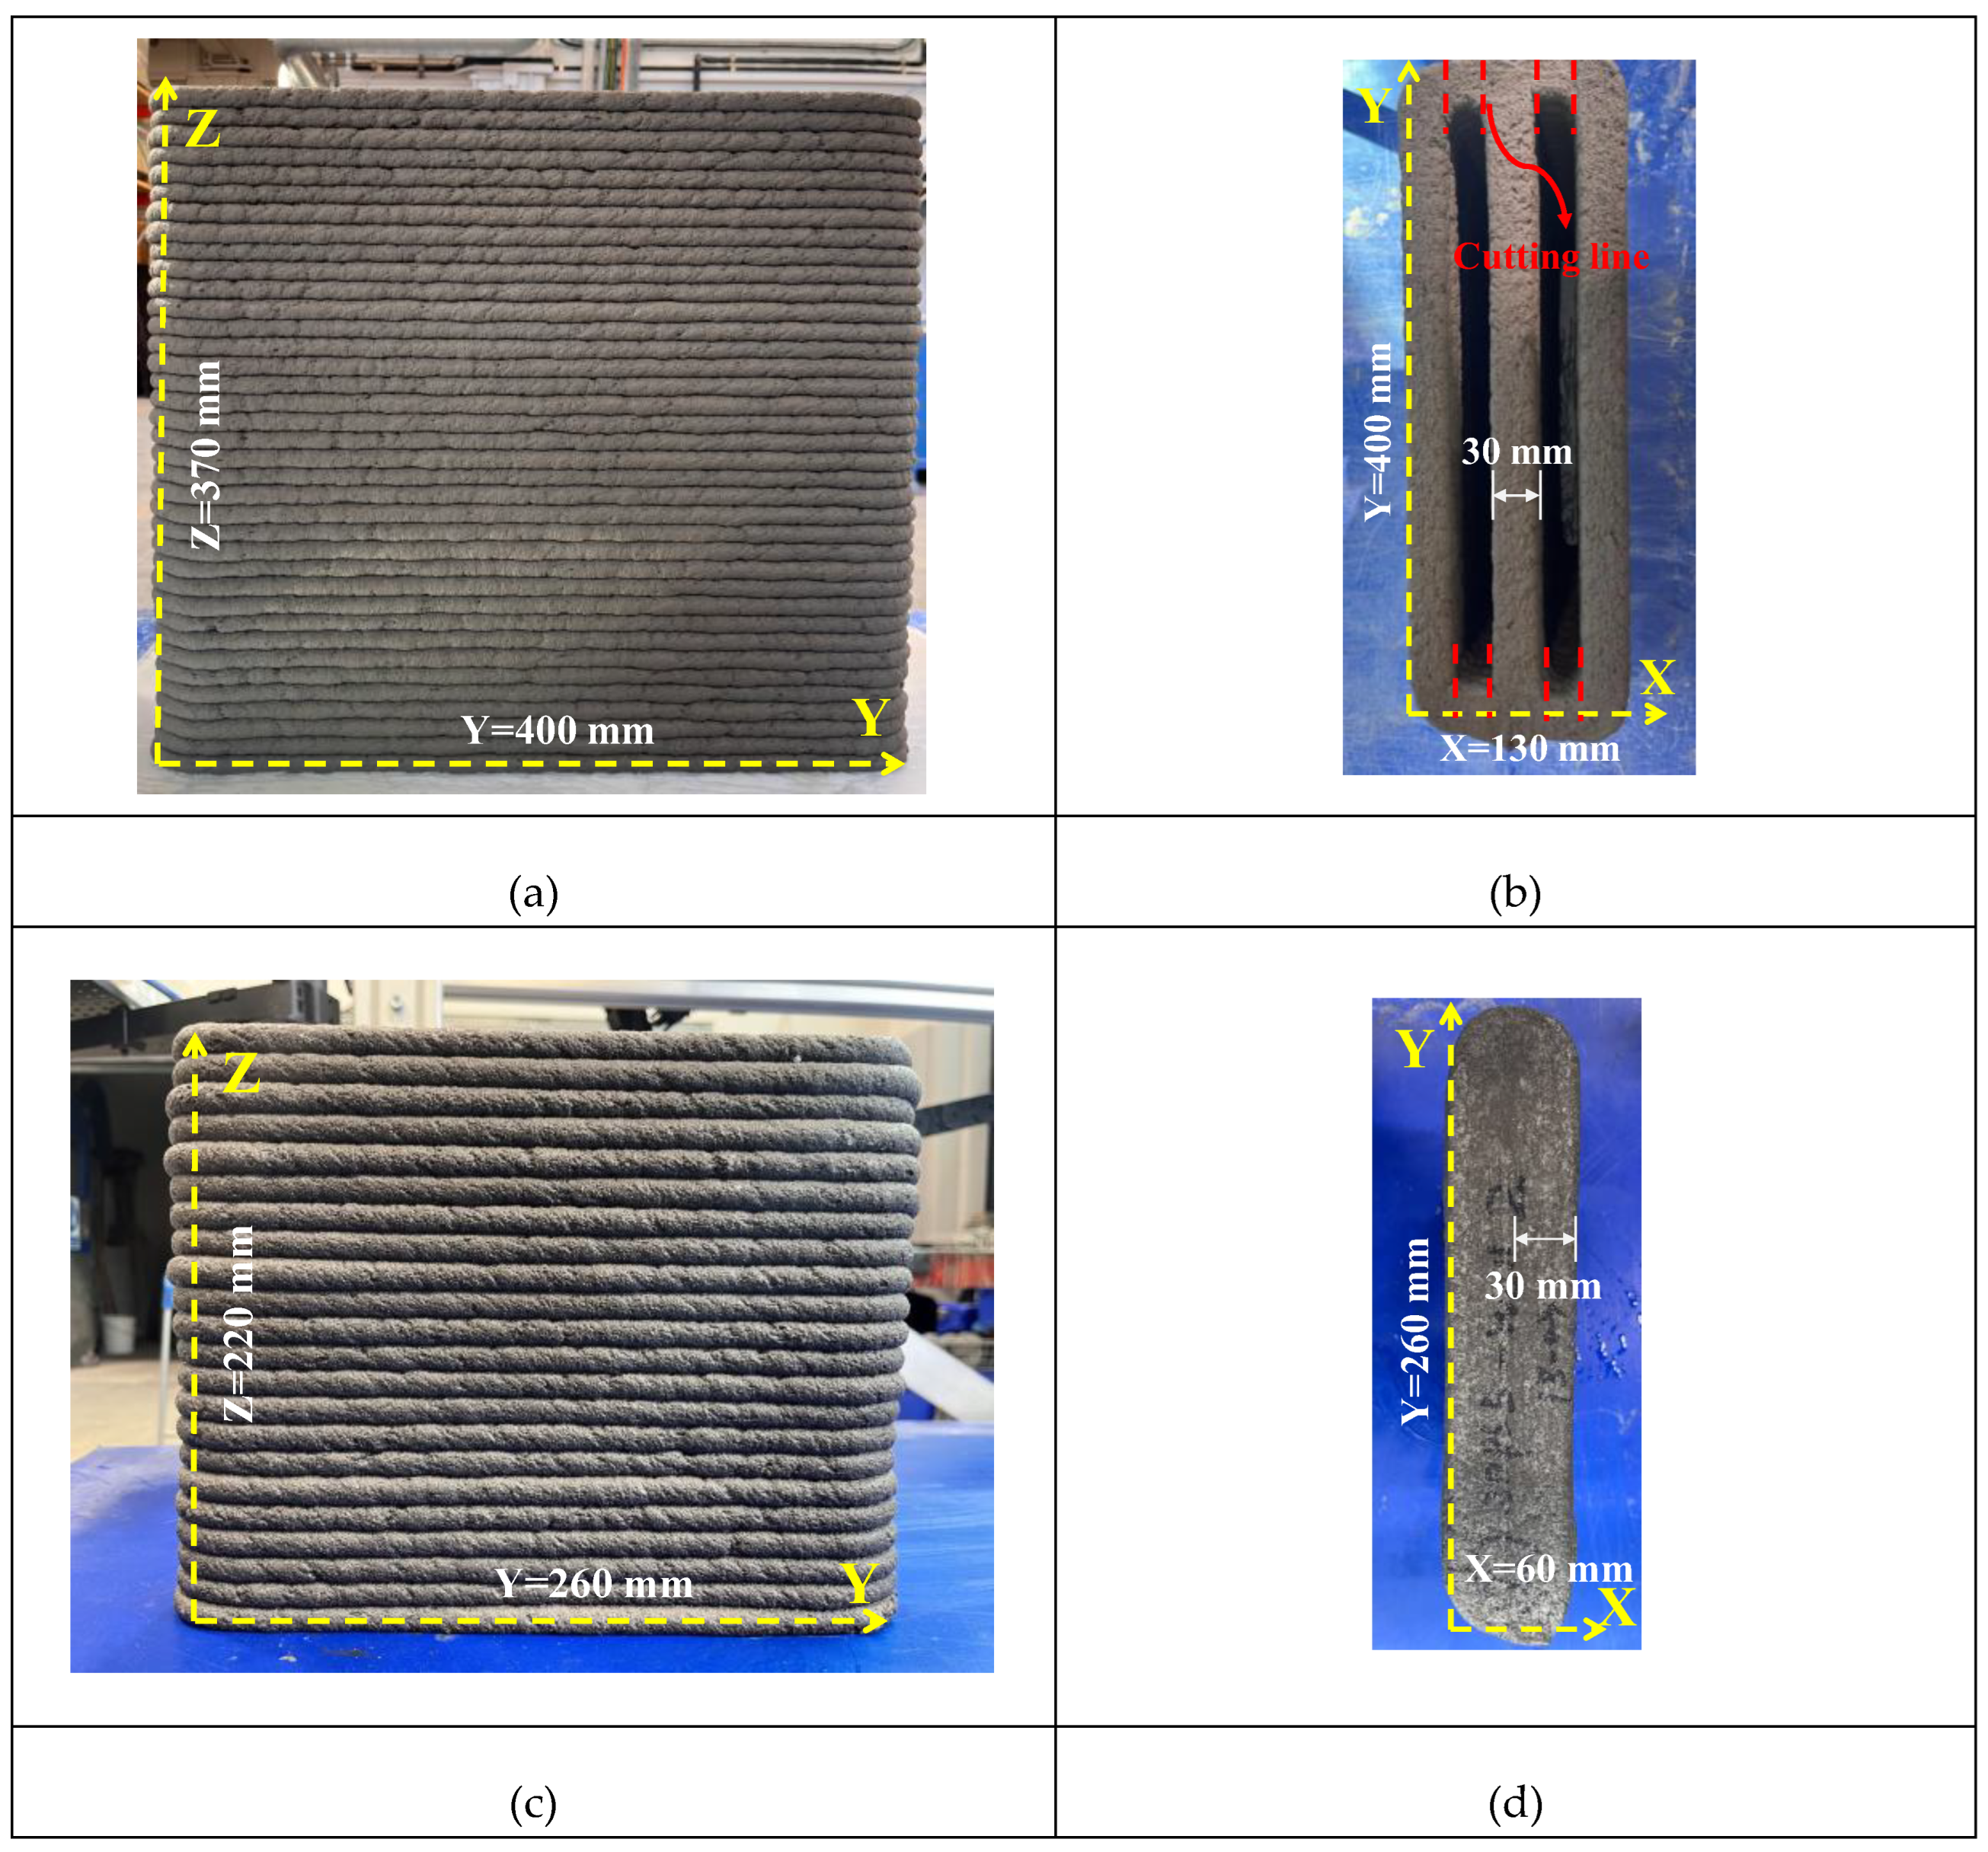
Figure 3.
Schematic illustration of cutting orientations and testing directions for 3DPC substrate reinforced with S-SHCC overlay.
Figure 3.
Schematic illustration of cutting orientations and testing directions for 3DPC substrate reinforced with S-SHCC overlay.
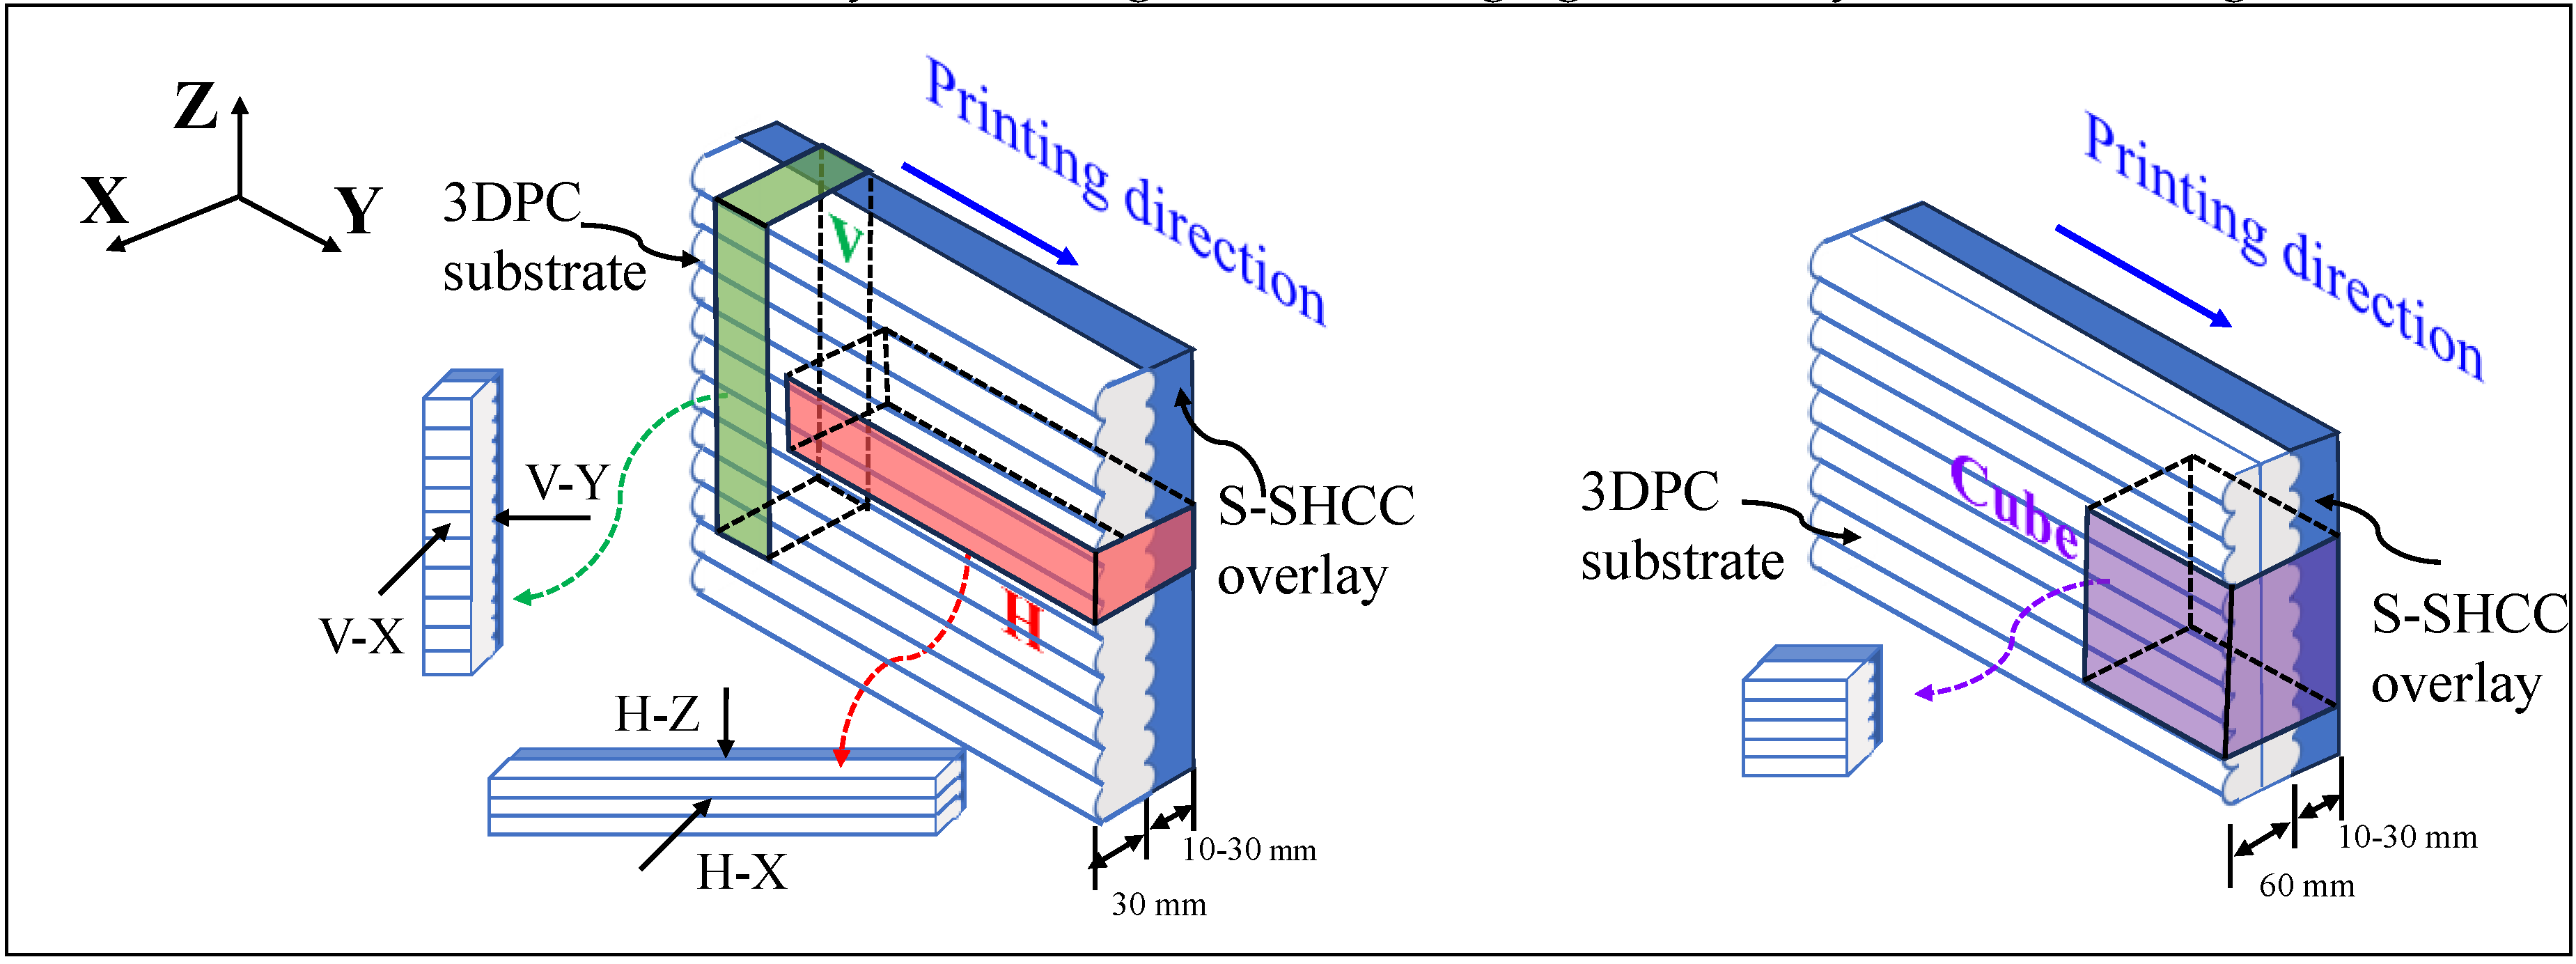
Figure 4.
Schematic illustration of plain and reinforced 3DPC cubes with different thicknesses of S-SHCC overlay.
Figure 4.
Schematic illustration of plain and reinforced 3DPC cubes with different thicknesses of S-SHCC overlay.
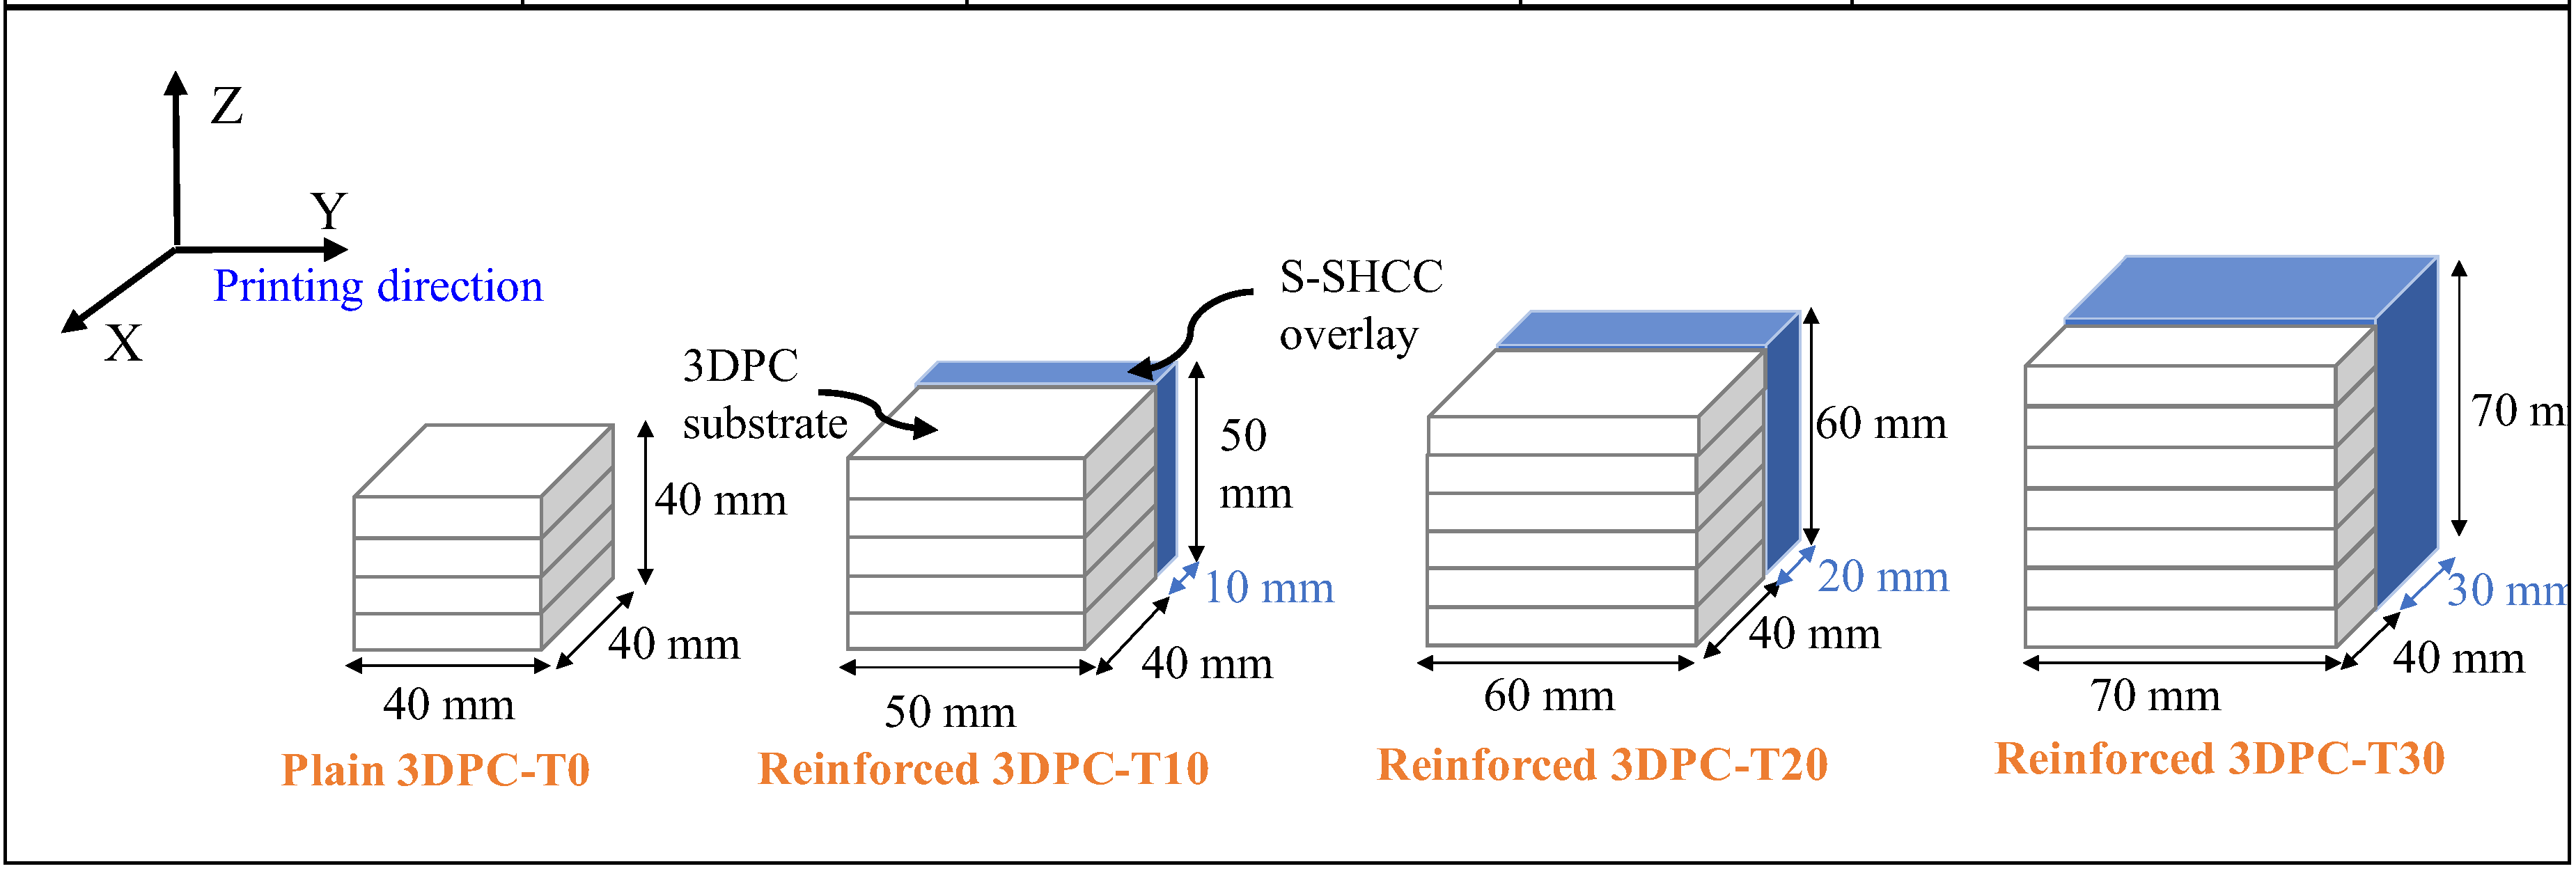
Figure 5.
Schematic illustration of four-point flexural testing of reinforced 3DPC specimens: (a) H-X direction; (b) H-Z direction; (c) V-X direction; (d) V-Y direction.
Figure 5.
Schematic illustration of four-point flexural testing of reinforced 3DPC specimens: (a) H-X direction; (b) H-Z direction; (c) V-X direction; (d) V-Y direction.
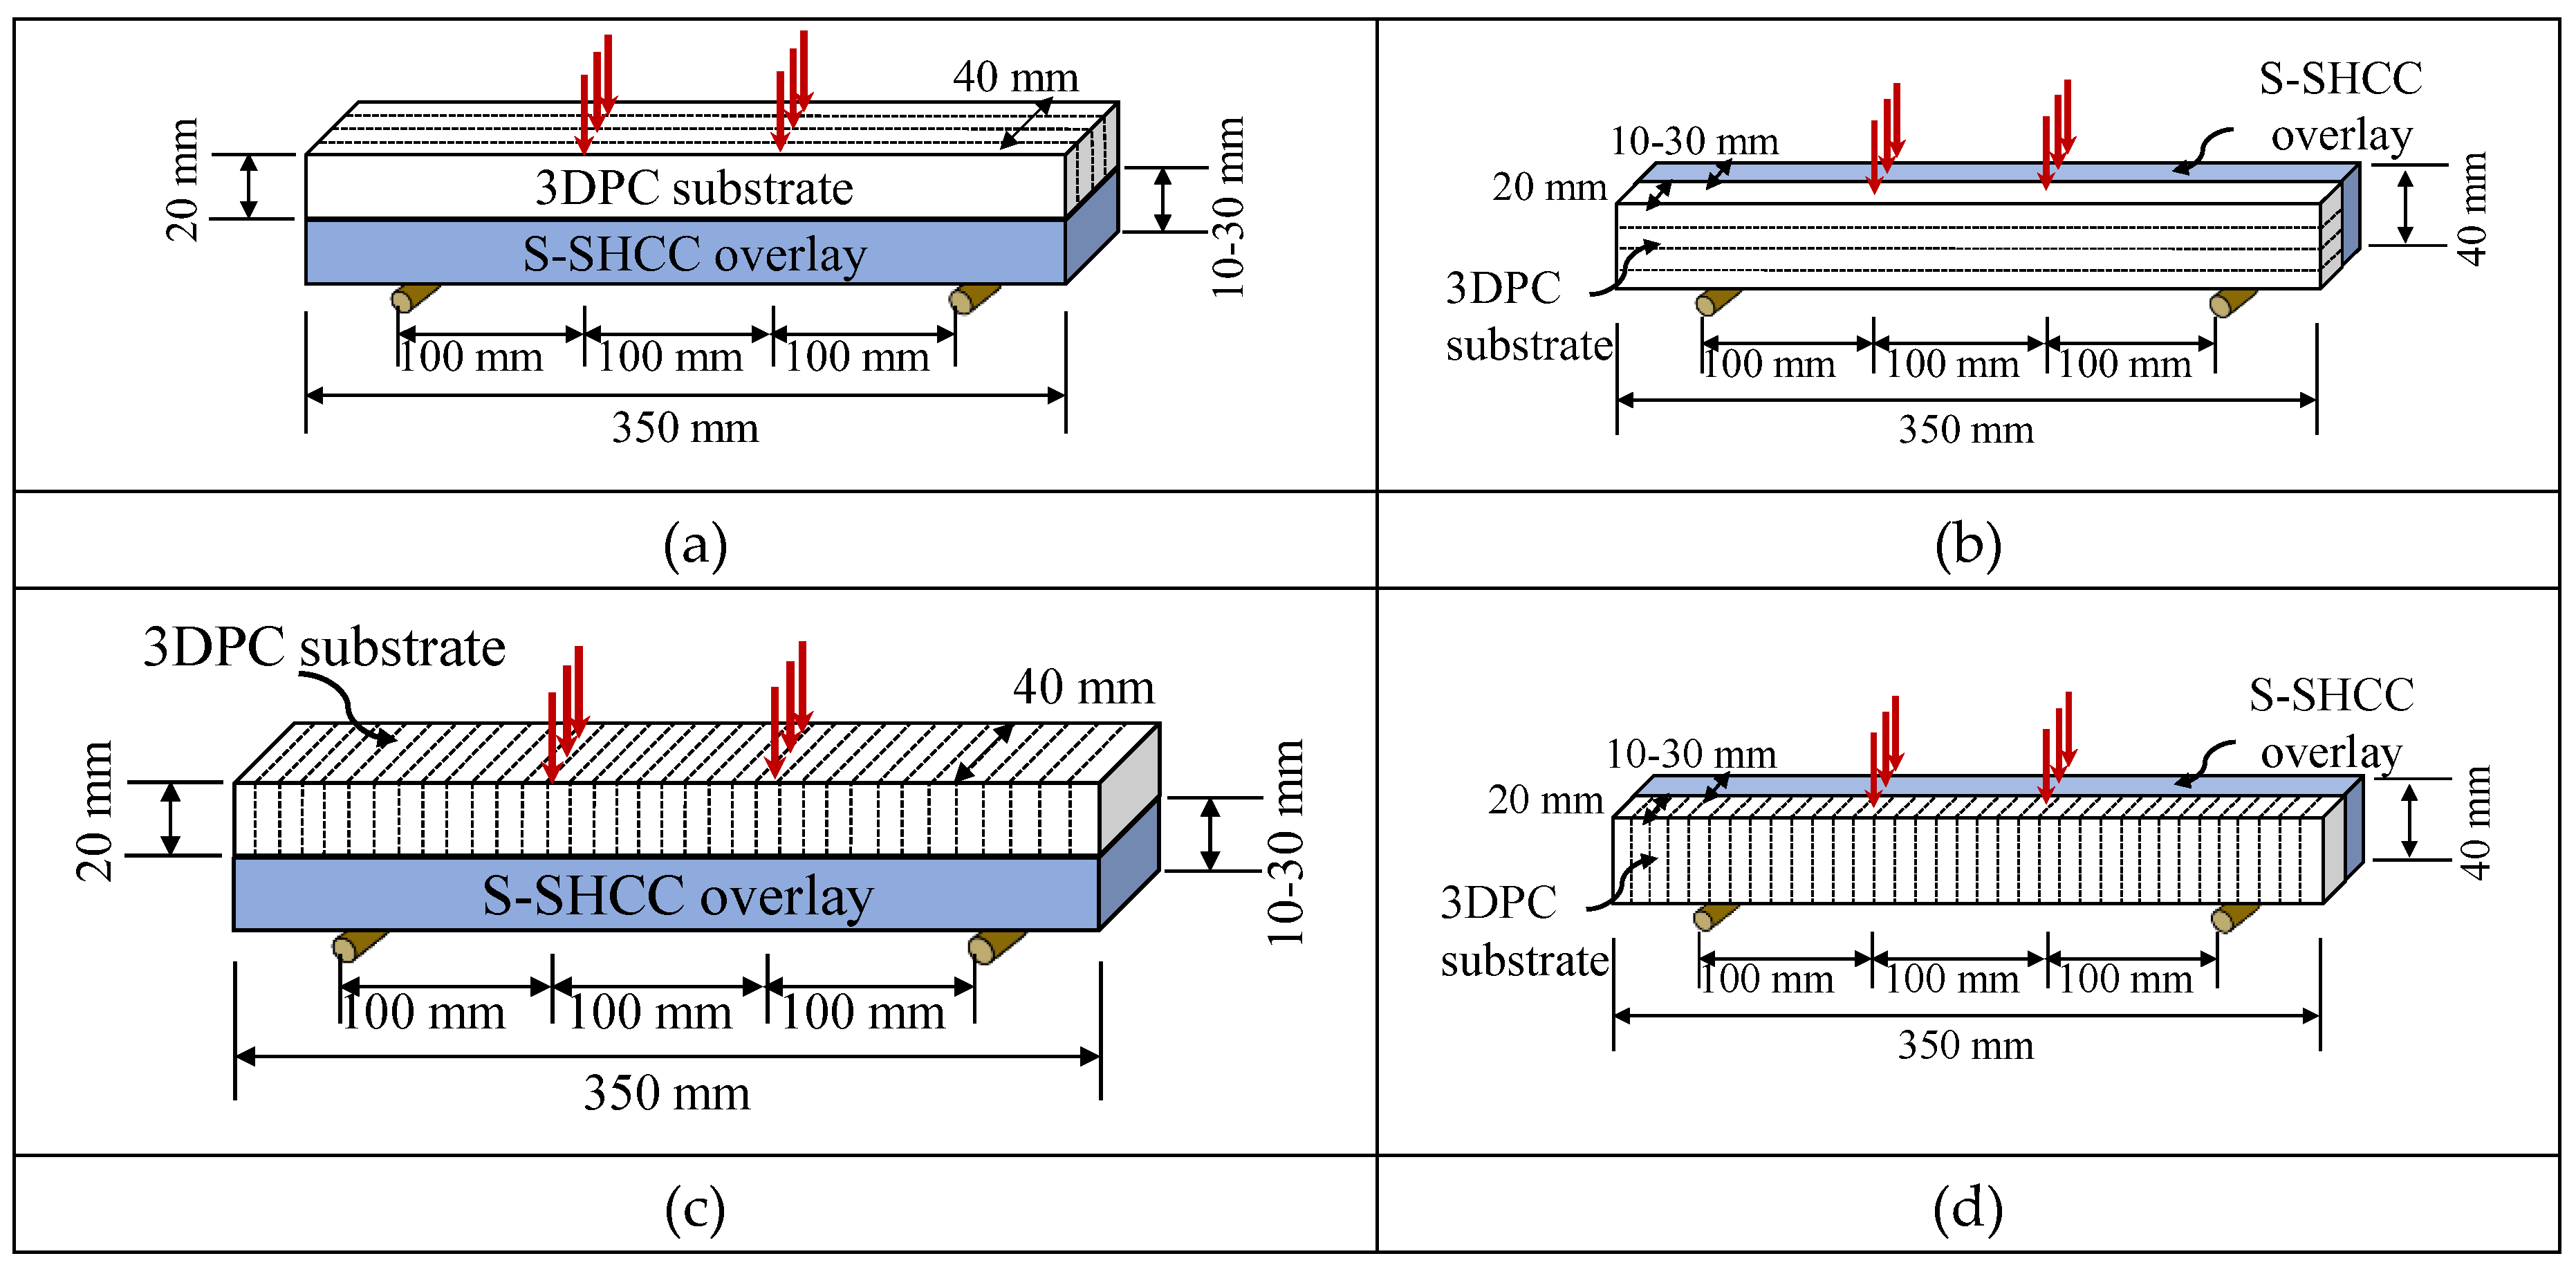
Figure 6.
Flexural stress vs. mid-span deflection curves of S-SHCC and cast SHCC mixtures.
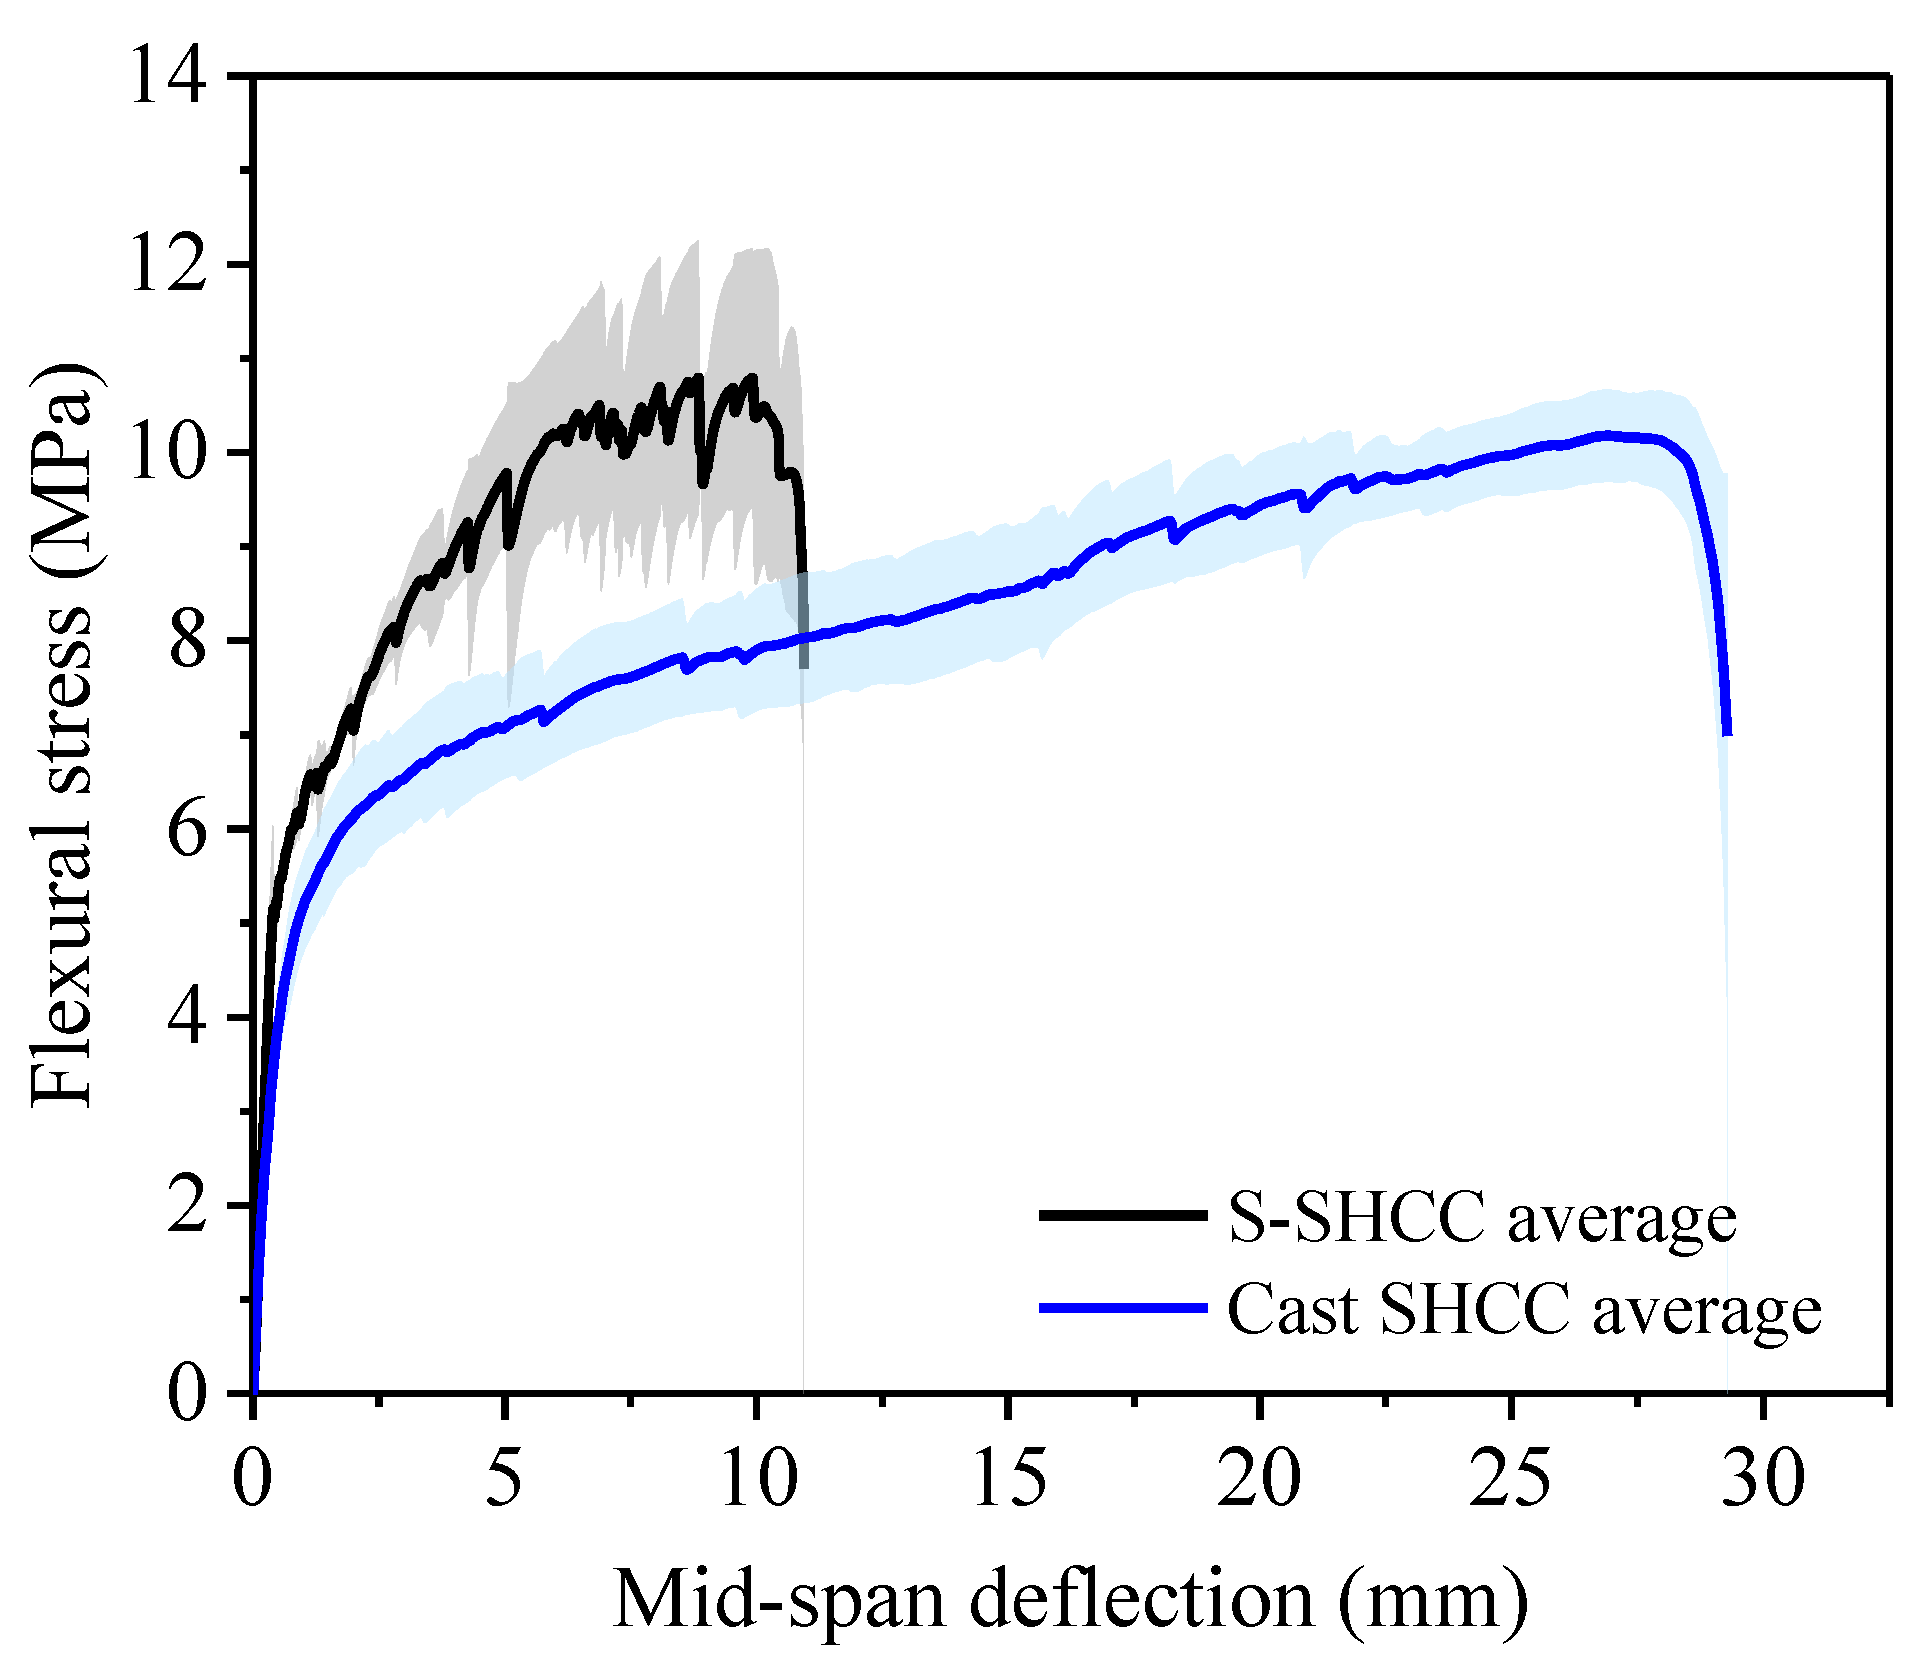
Figure 7.
Compressive strength of plain and reinforced 3DPC specimens reinforced with different thicknesses of S-SHCC overlay and tested in different directions.
Figure 7.
Compressive strength of plain and reinforced 3DPC specimens reinforced with different thicknesses of S-SHCC overlay and tested in different directions.
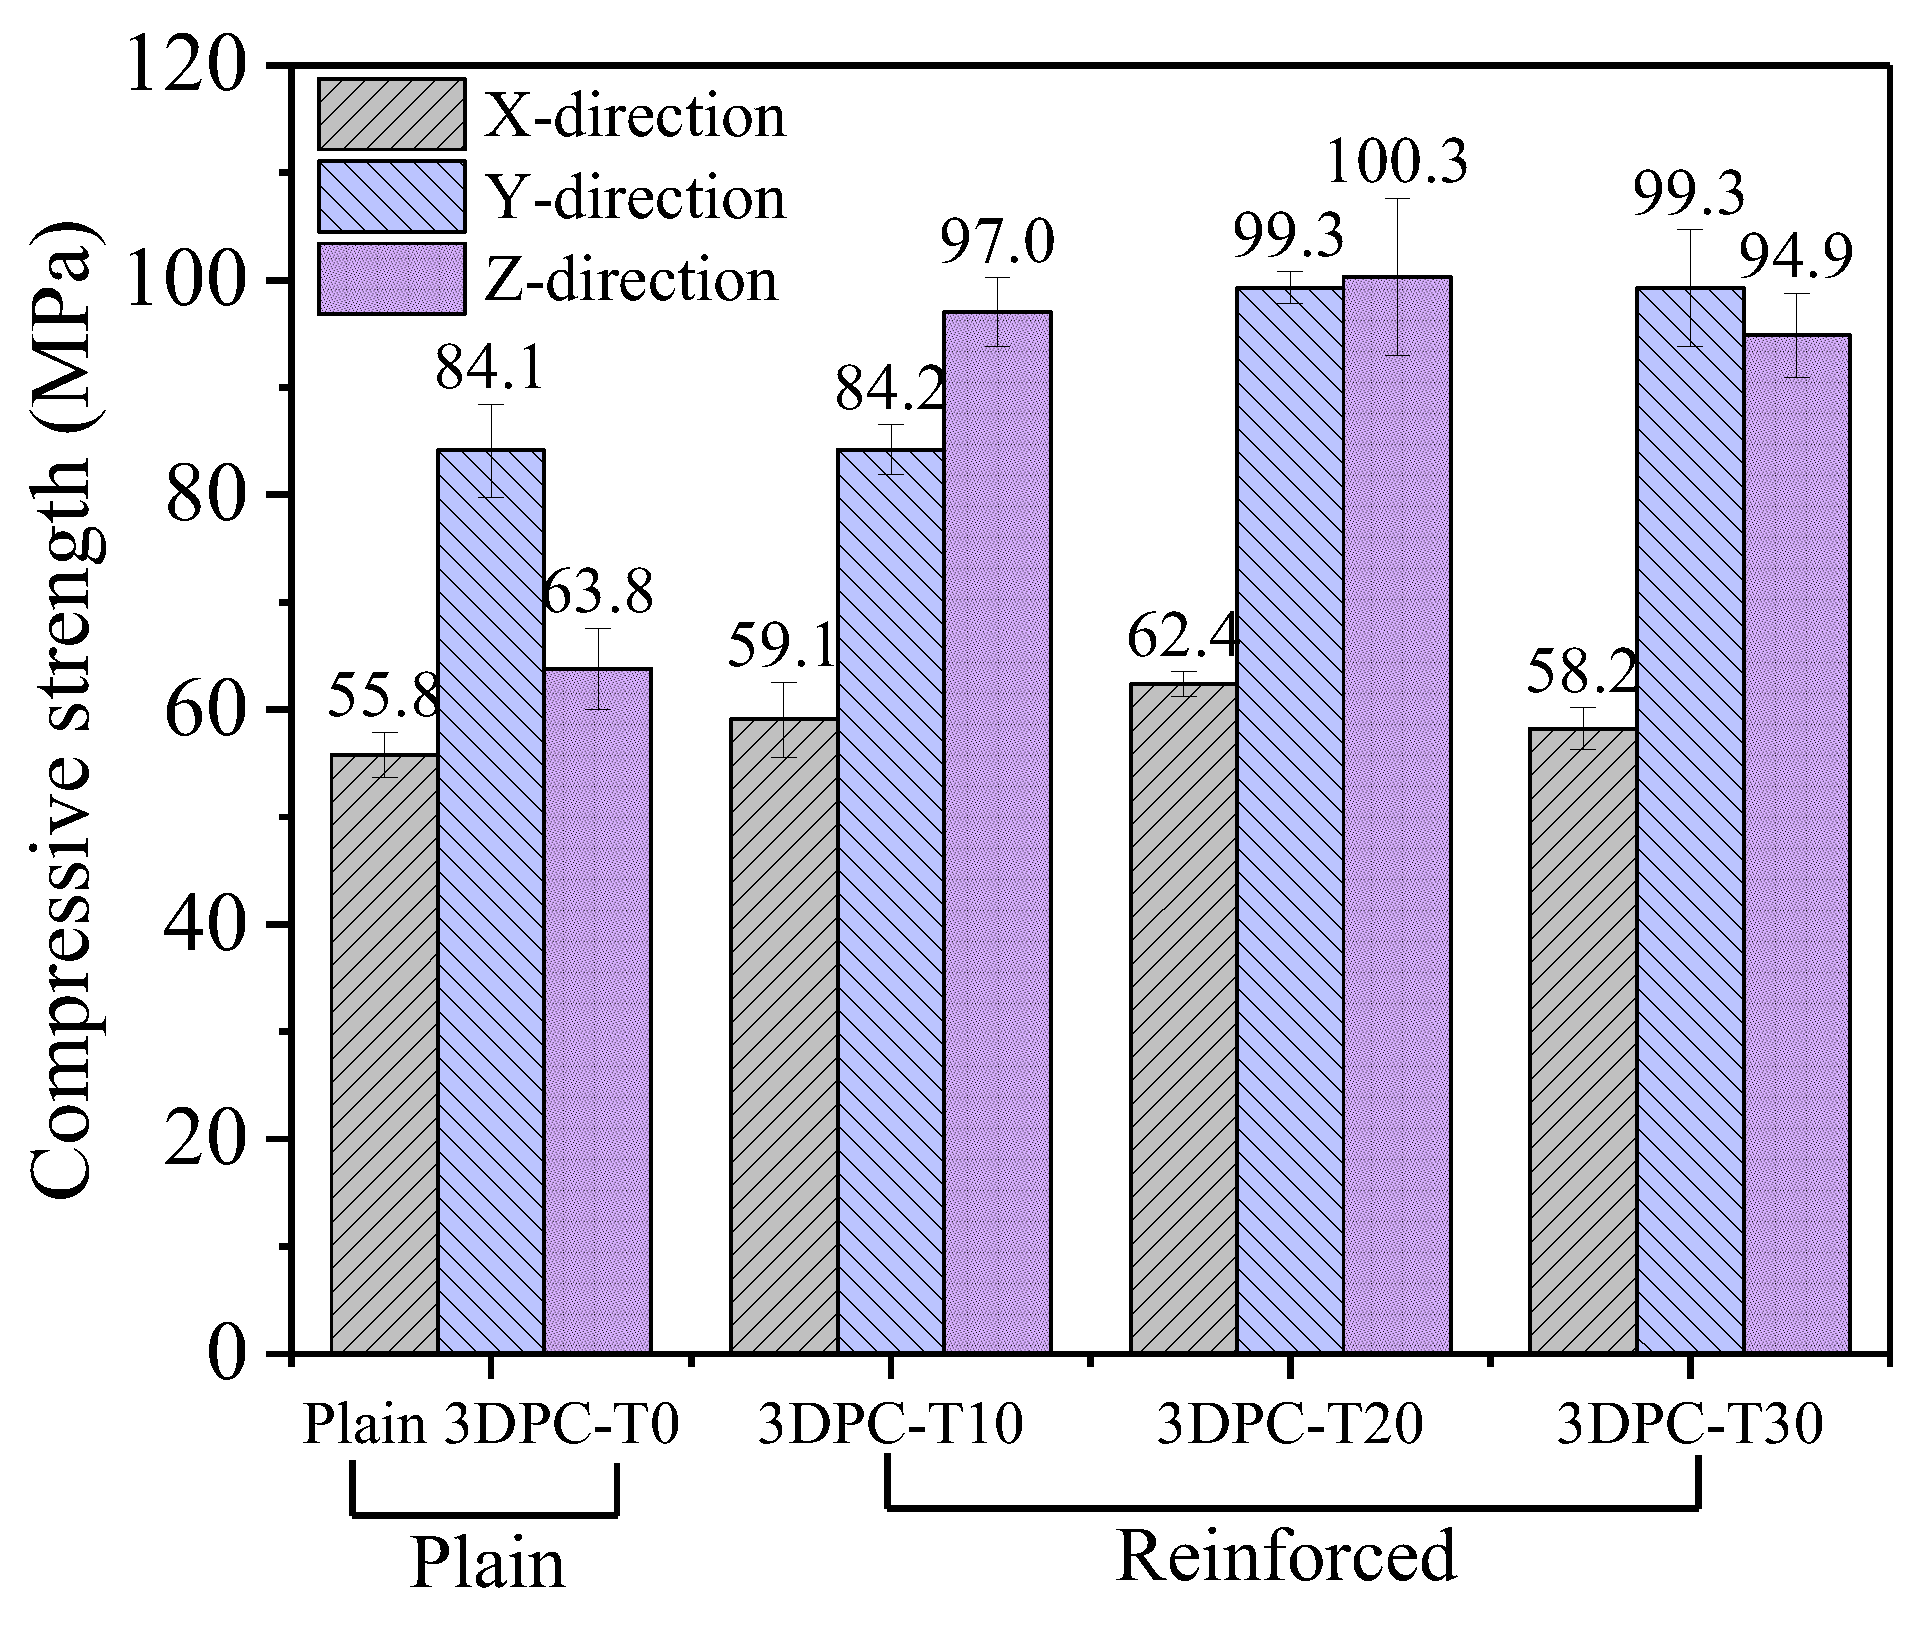
Figure 8.
Effect of overlay thickness on compressive strength of reinforced 3DPC specimens.
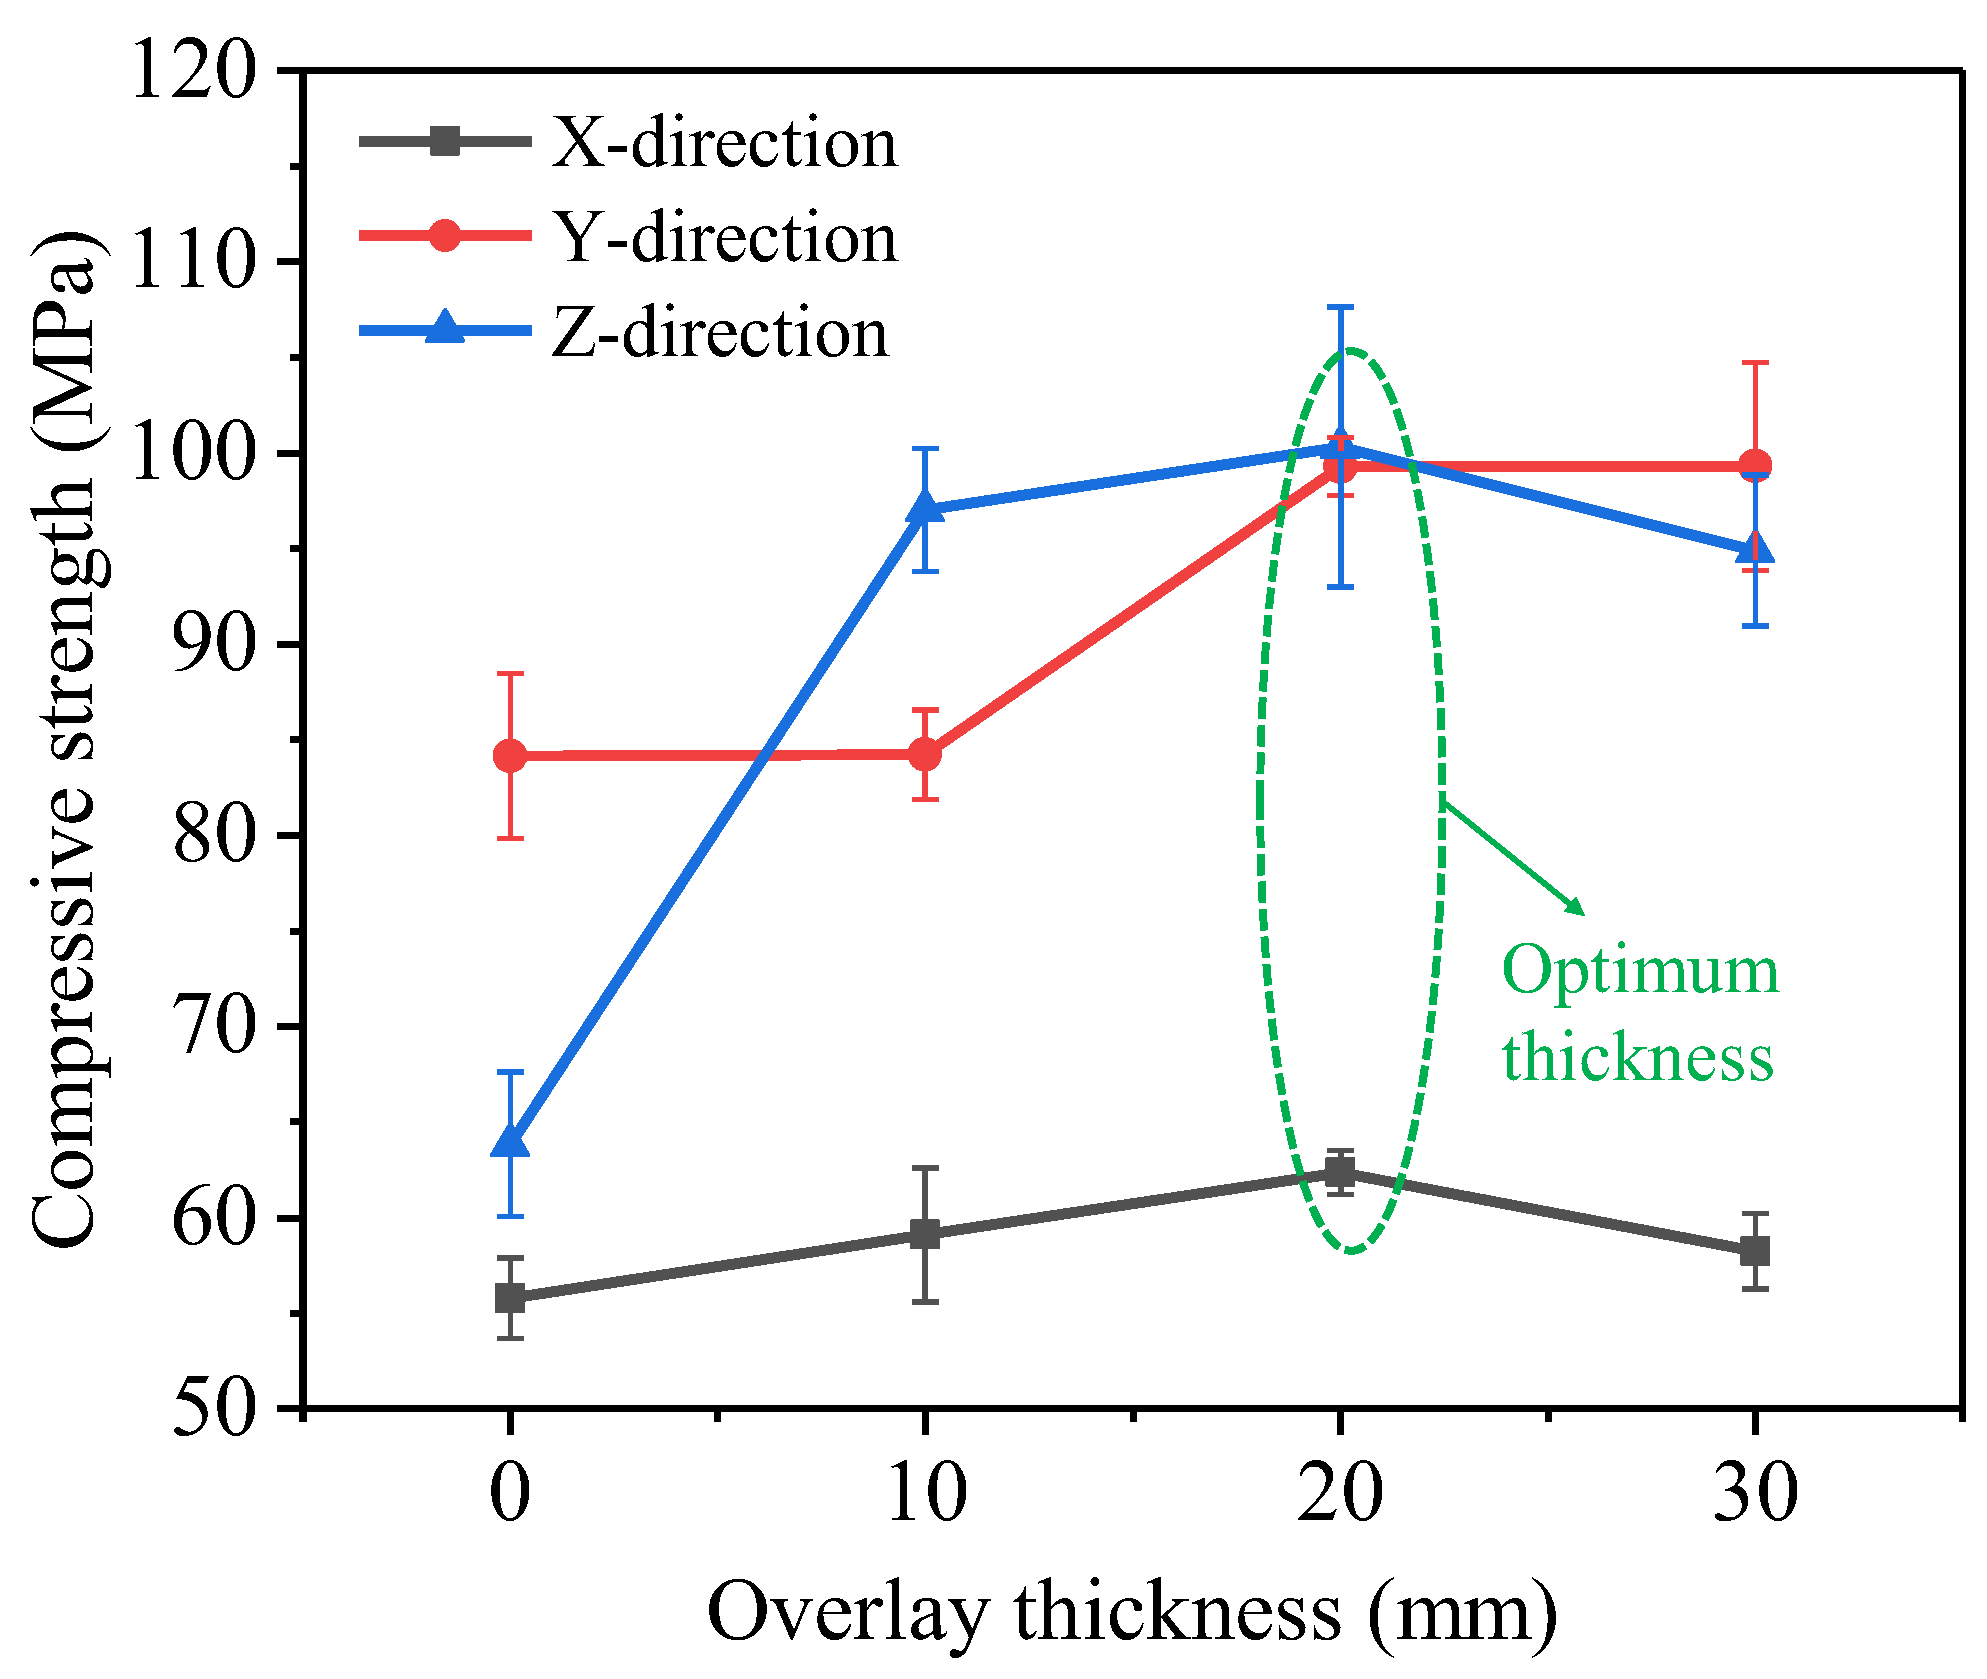
Figure 9.
Damage patterns of reinforced 3DPC specimens in different testing directions: (a) X-direction; (b) Y-direction; (c) Z-direction.
Figure 9.
Damage patterns of reinforced 3DPC specimens in different testing directions: (a) X-direction; (b) Y-direction; (c) Z-direction.
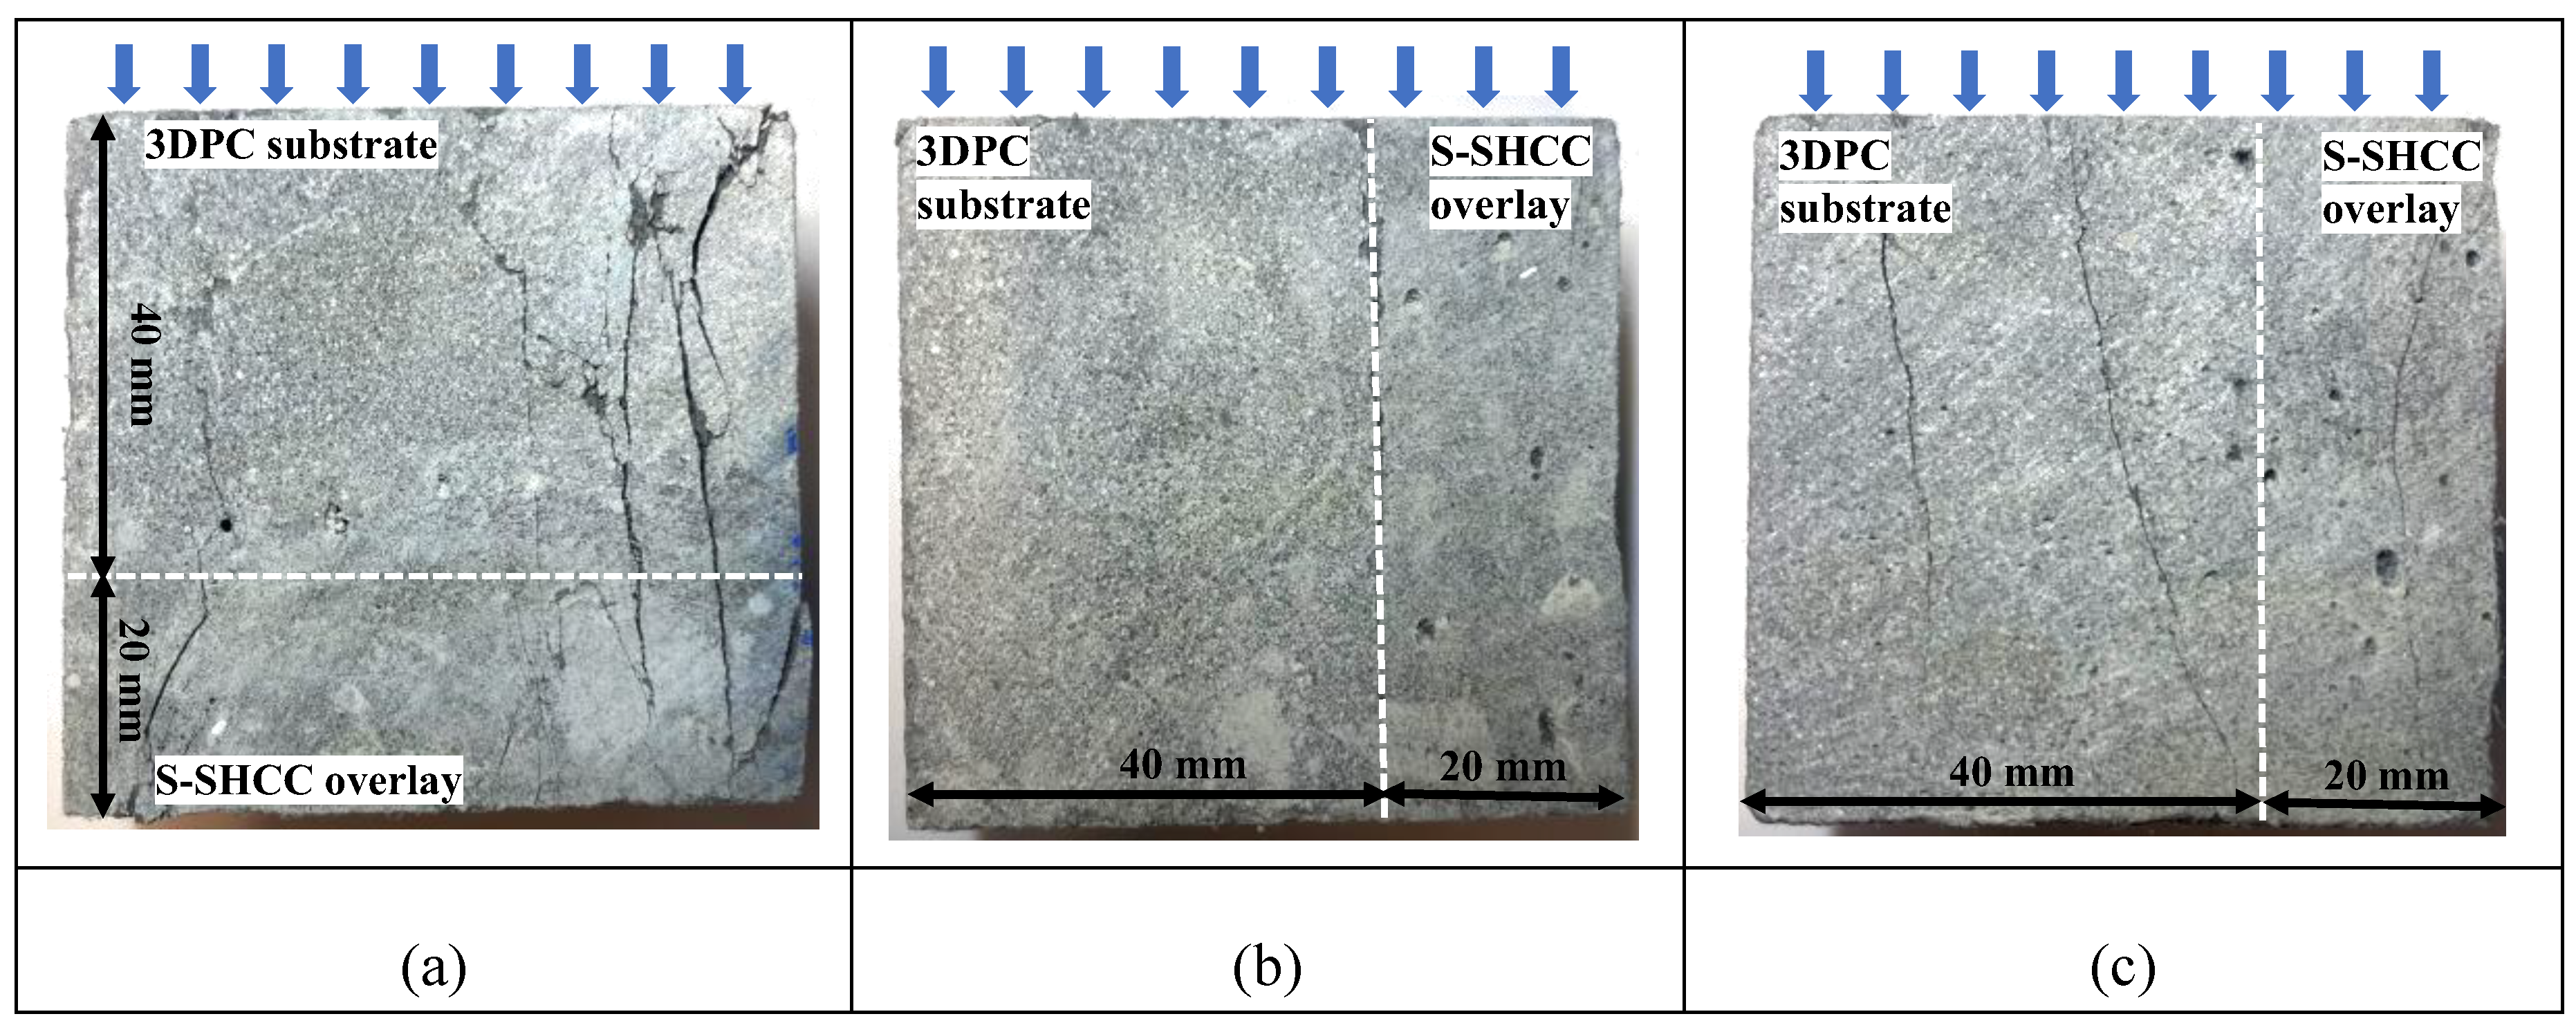
Figure 10.
Typical load-deflection responses under four-point bending: (a) plain 3DPC; (b) cast SHCC; (c) S-SHCC; (d) reinforced 3DPC with S-SHCC overlay specimens.
Figure 10.
Typical load-deflection responses under four-point bending: (a) plain 3DPC; (b) cast SHCC; (c) S-SHCC; (d) reinforced 3DPC with S-SHCC overlay specimens.
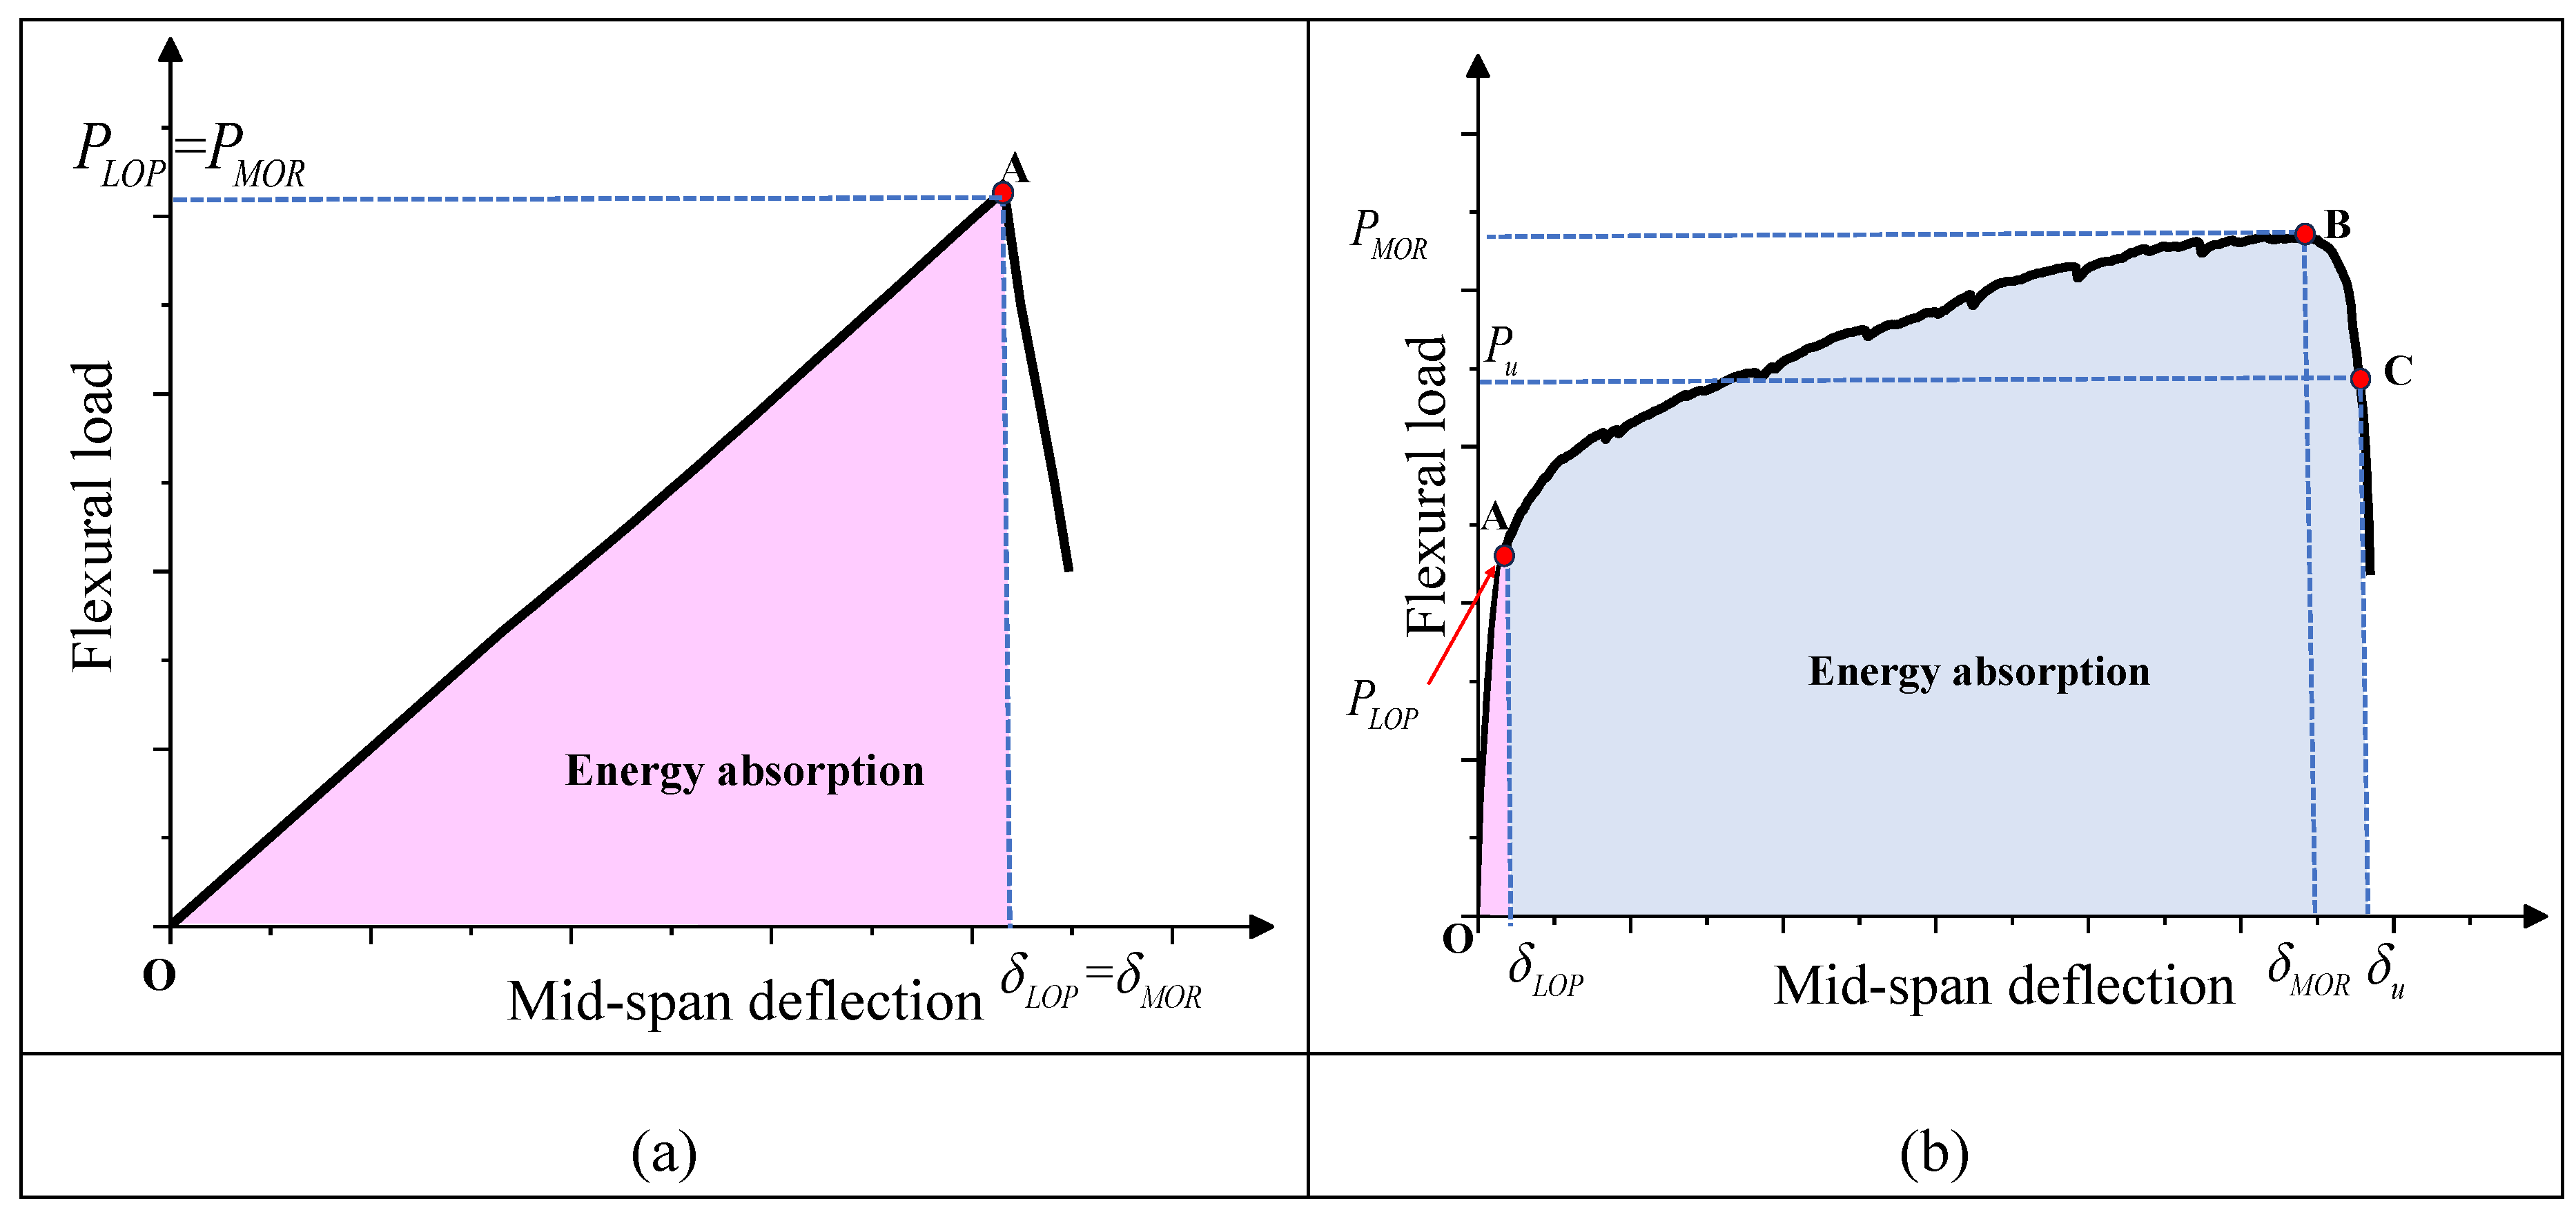
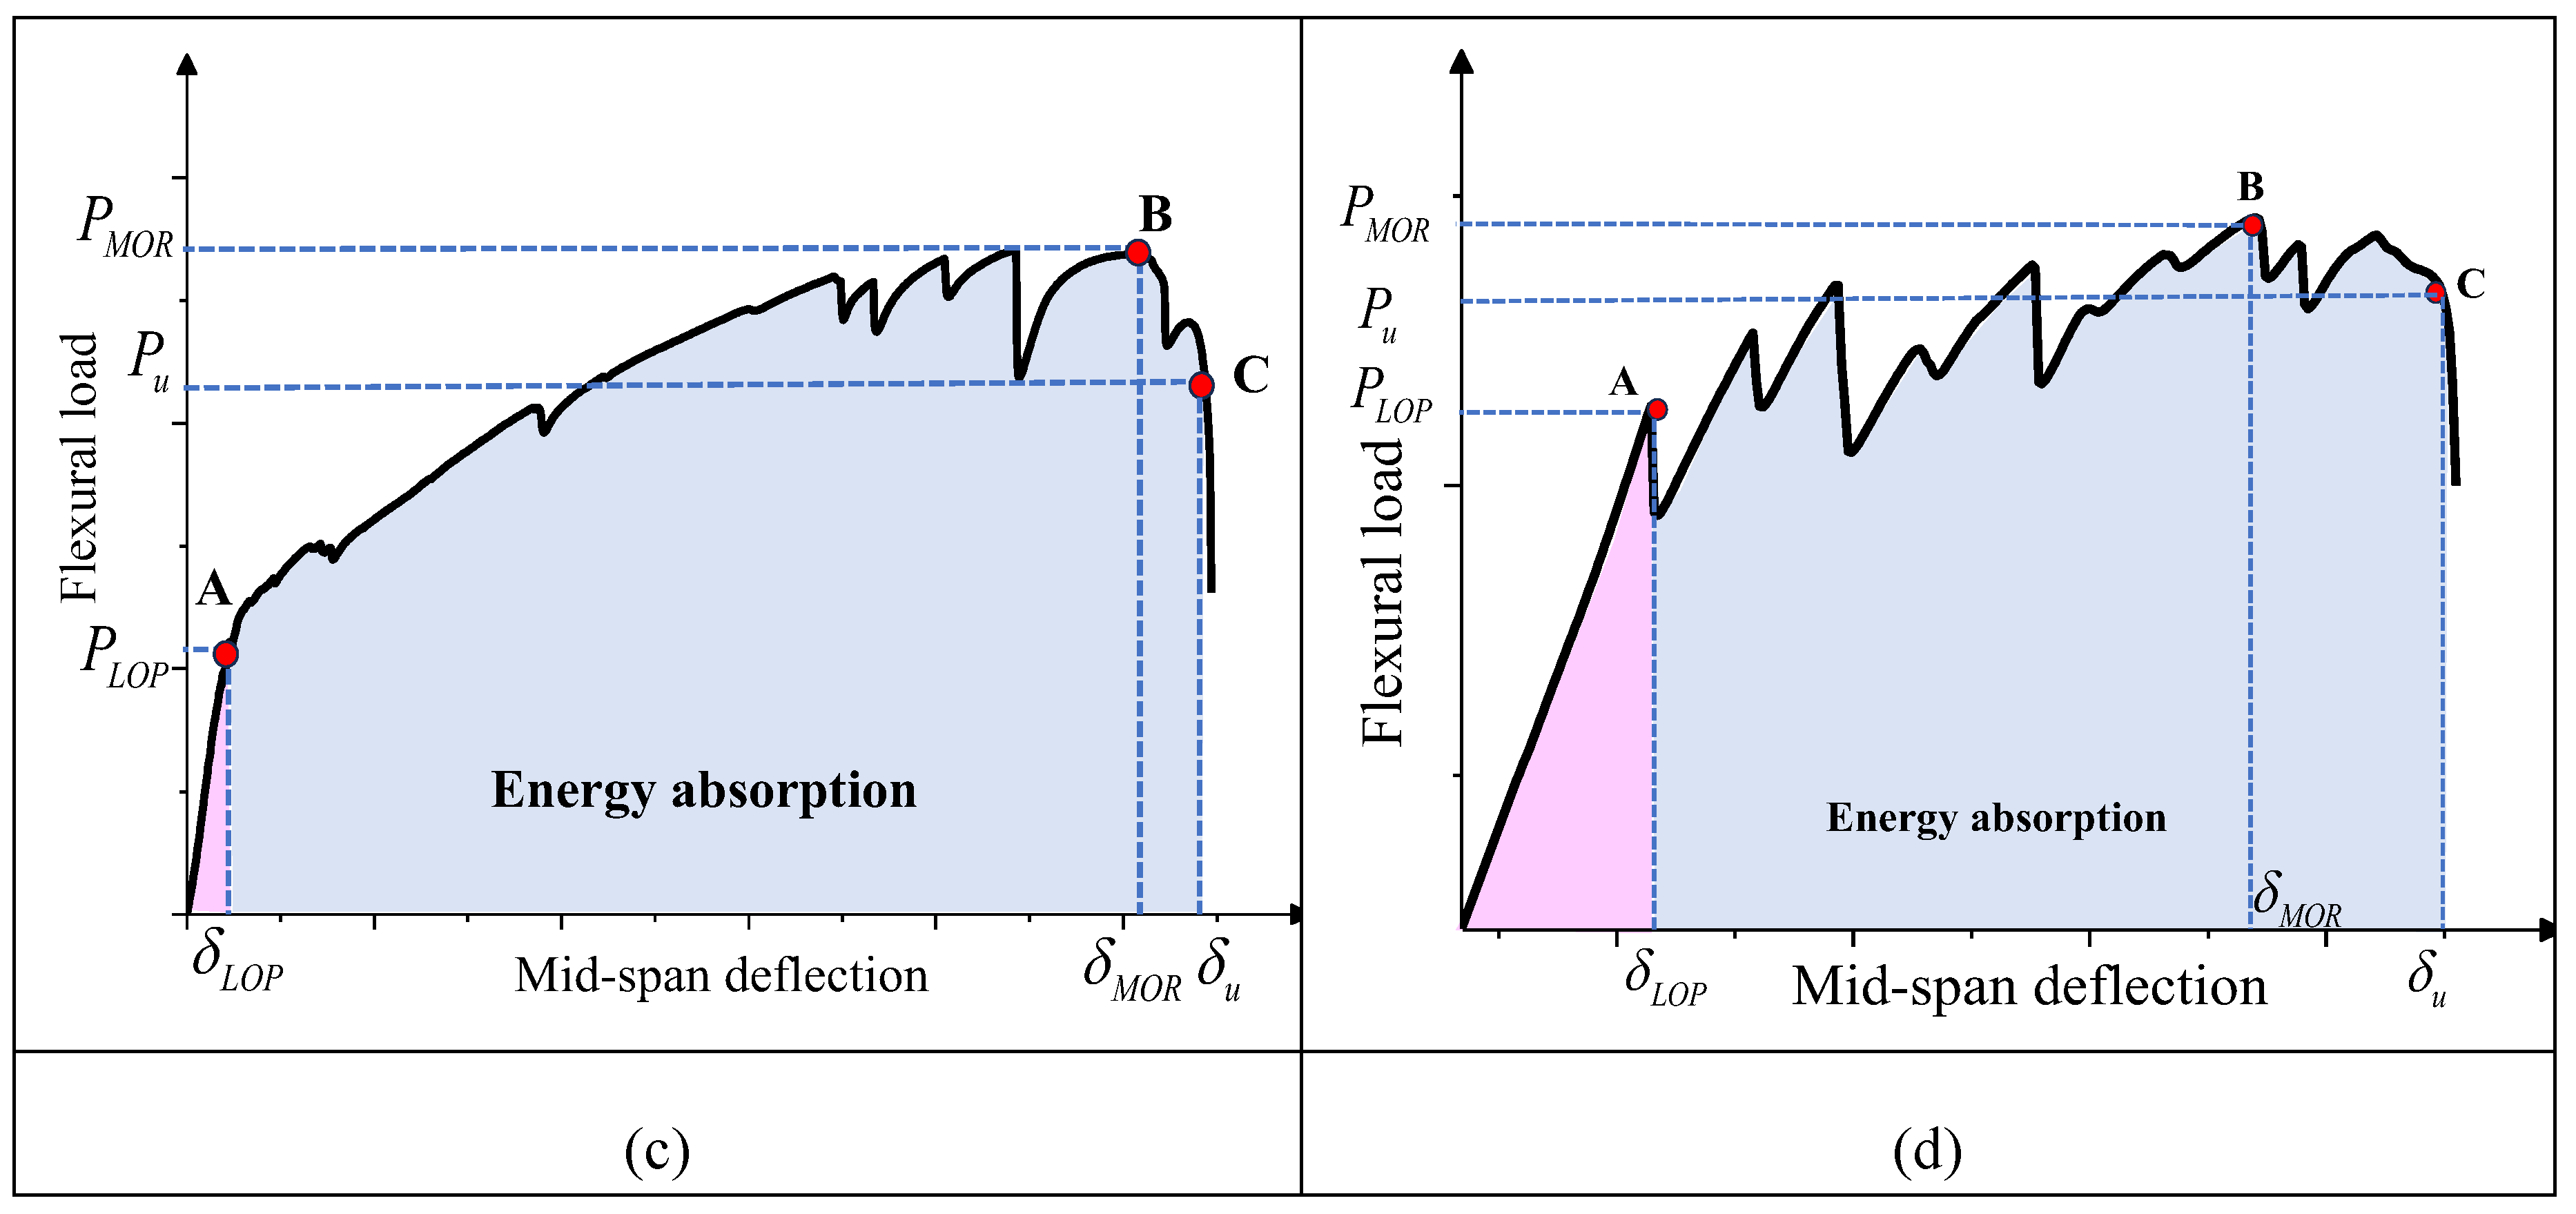
Figure 11.
Typical flexural load-deflection curves of plain and reinforced 3DPC specimens prepared with different S-SHCC overlay thicknesses: (a) plain 3DPC-T0; (b) reinforced 3DPC-T10; (c) reinforced 3DPC-T20; (d) reinforced 3DPC-T30.
Figure 11.
Typical flexural load-deflection curves of plain and reinforced 3DPC specimens prepared with different S-SHCC overlay thicknesses: (a) plain 3DPC-T0; (b) reinforced 3DPC-T10; (c) reinforced 3DPC-T20; (d) reinforced 3DPC-T30.
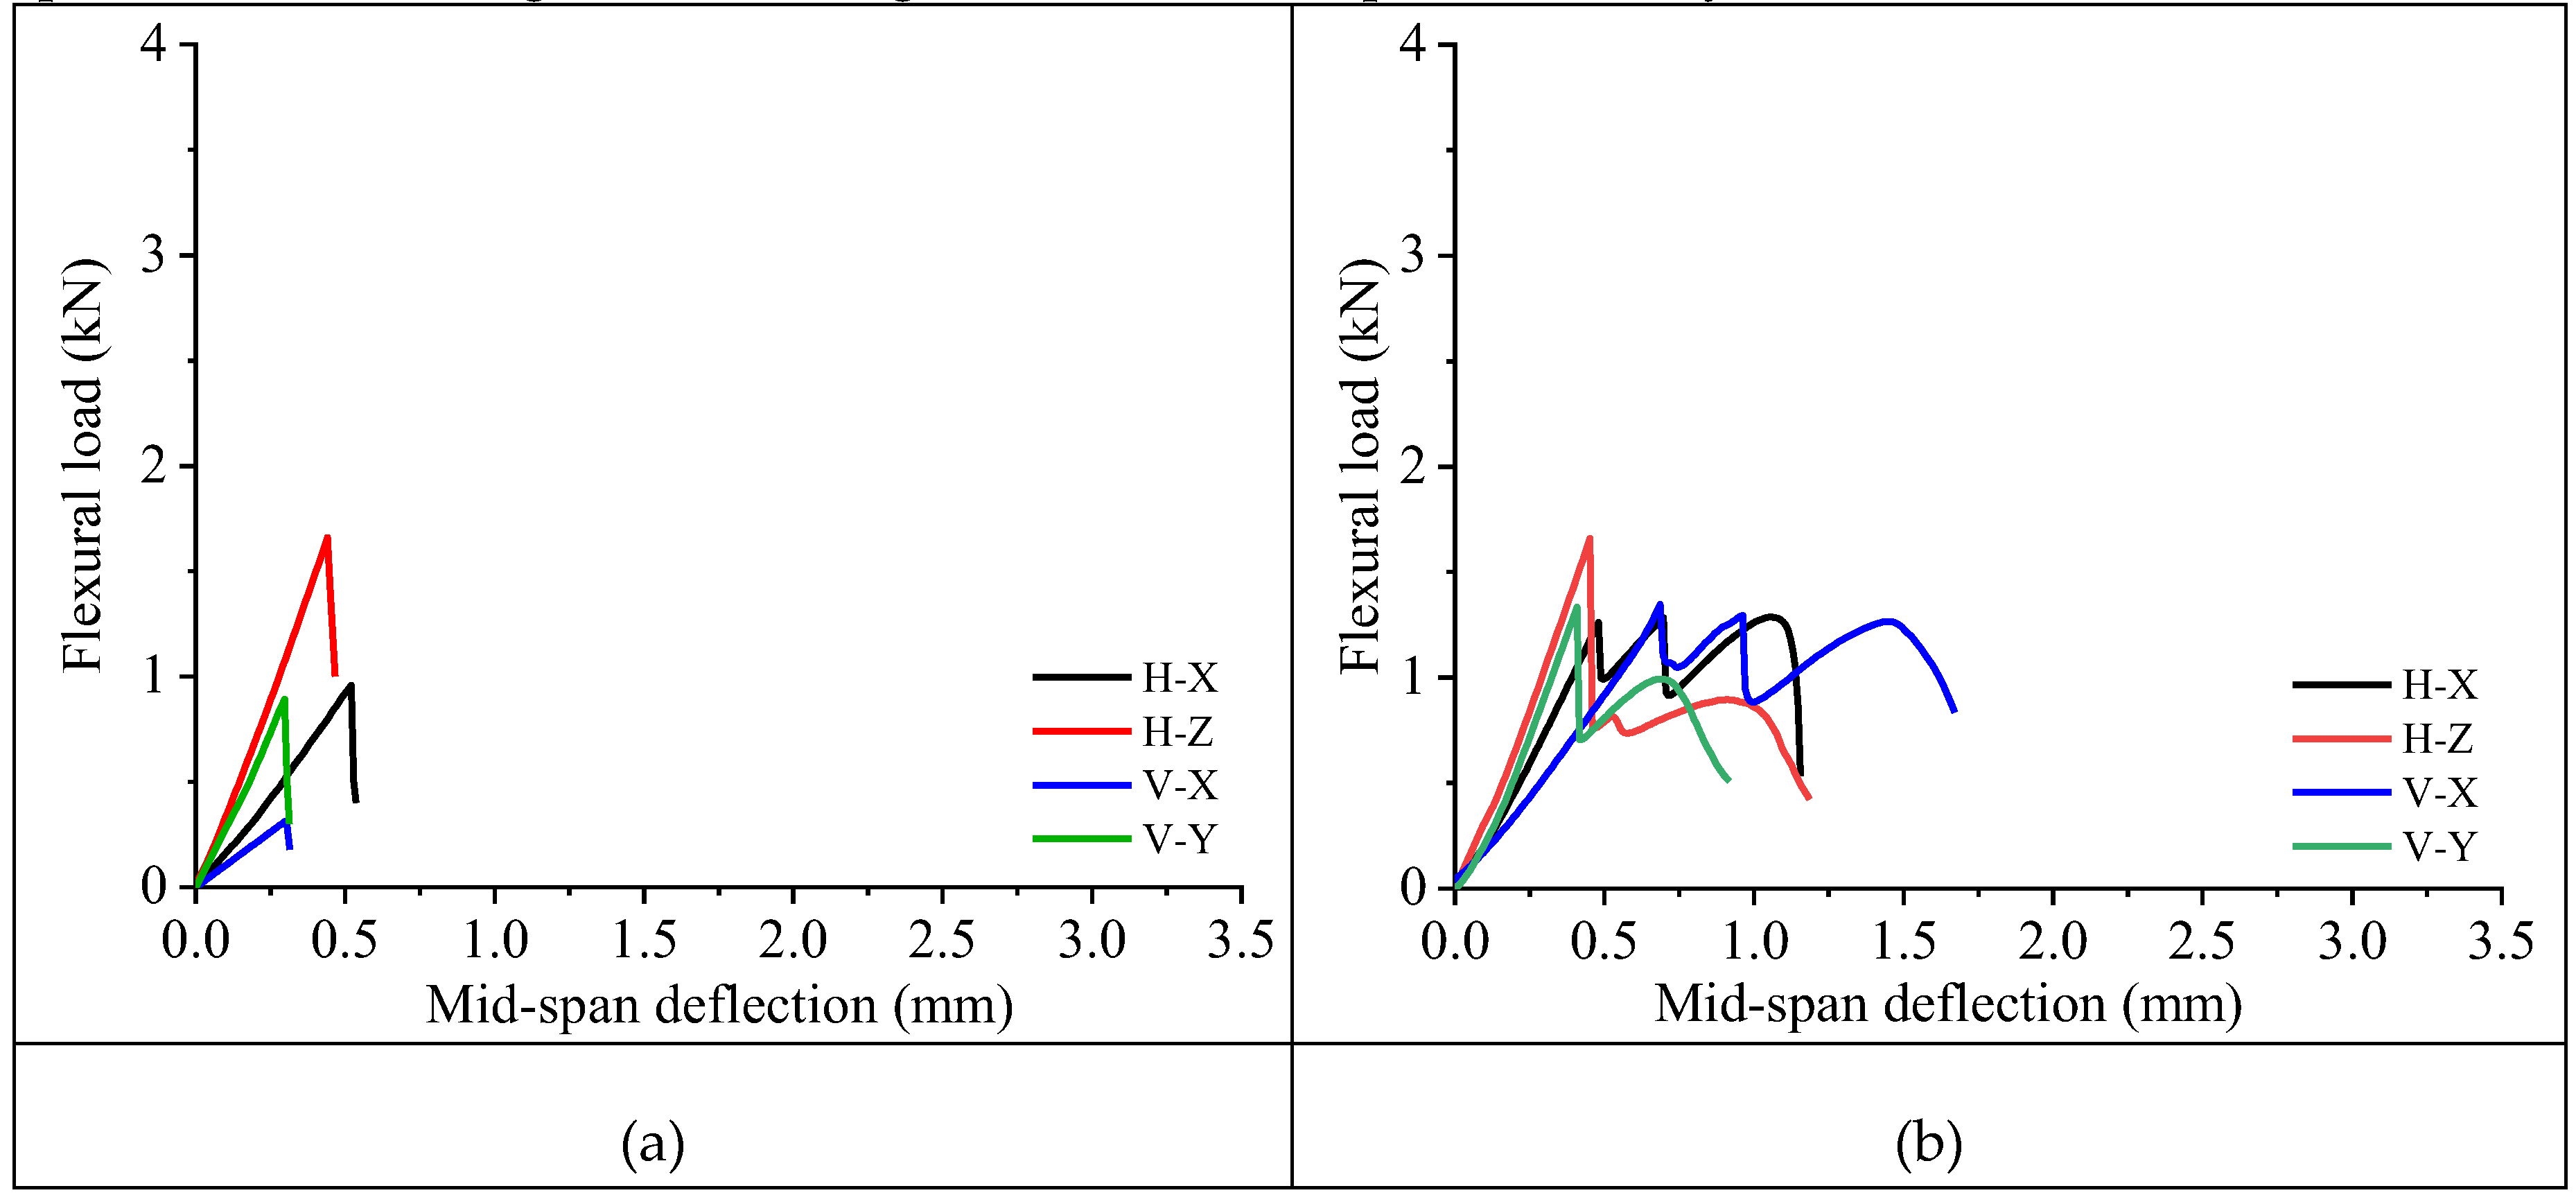
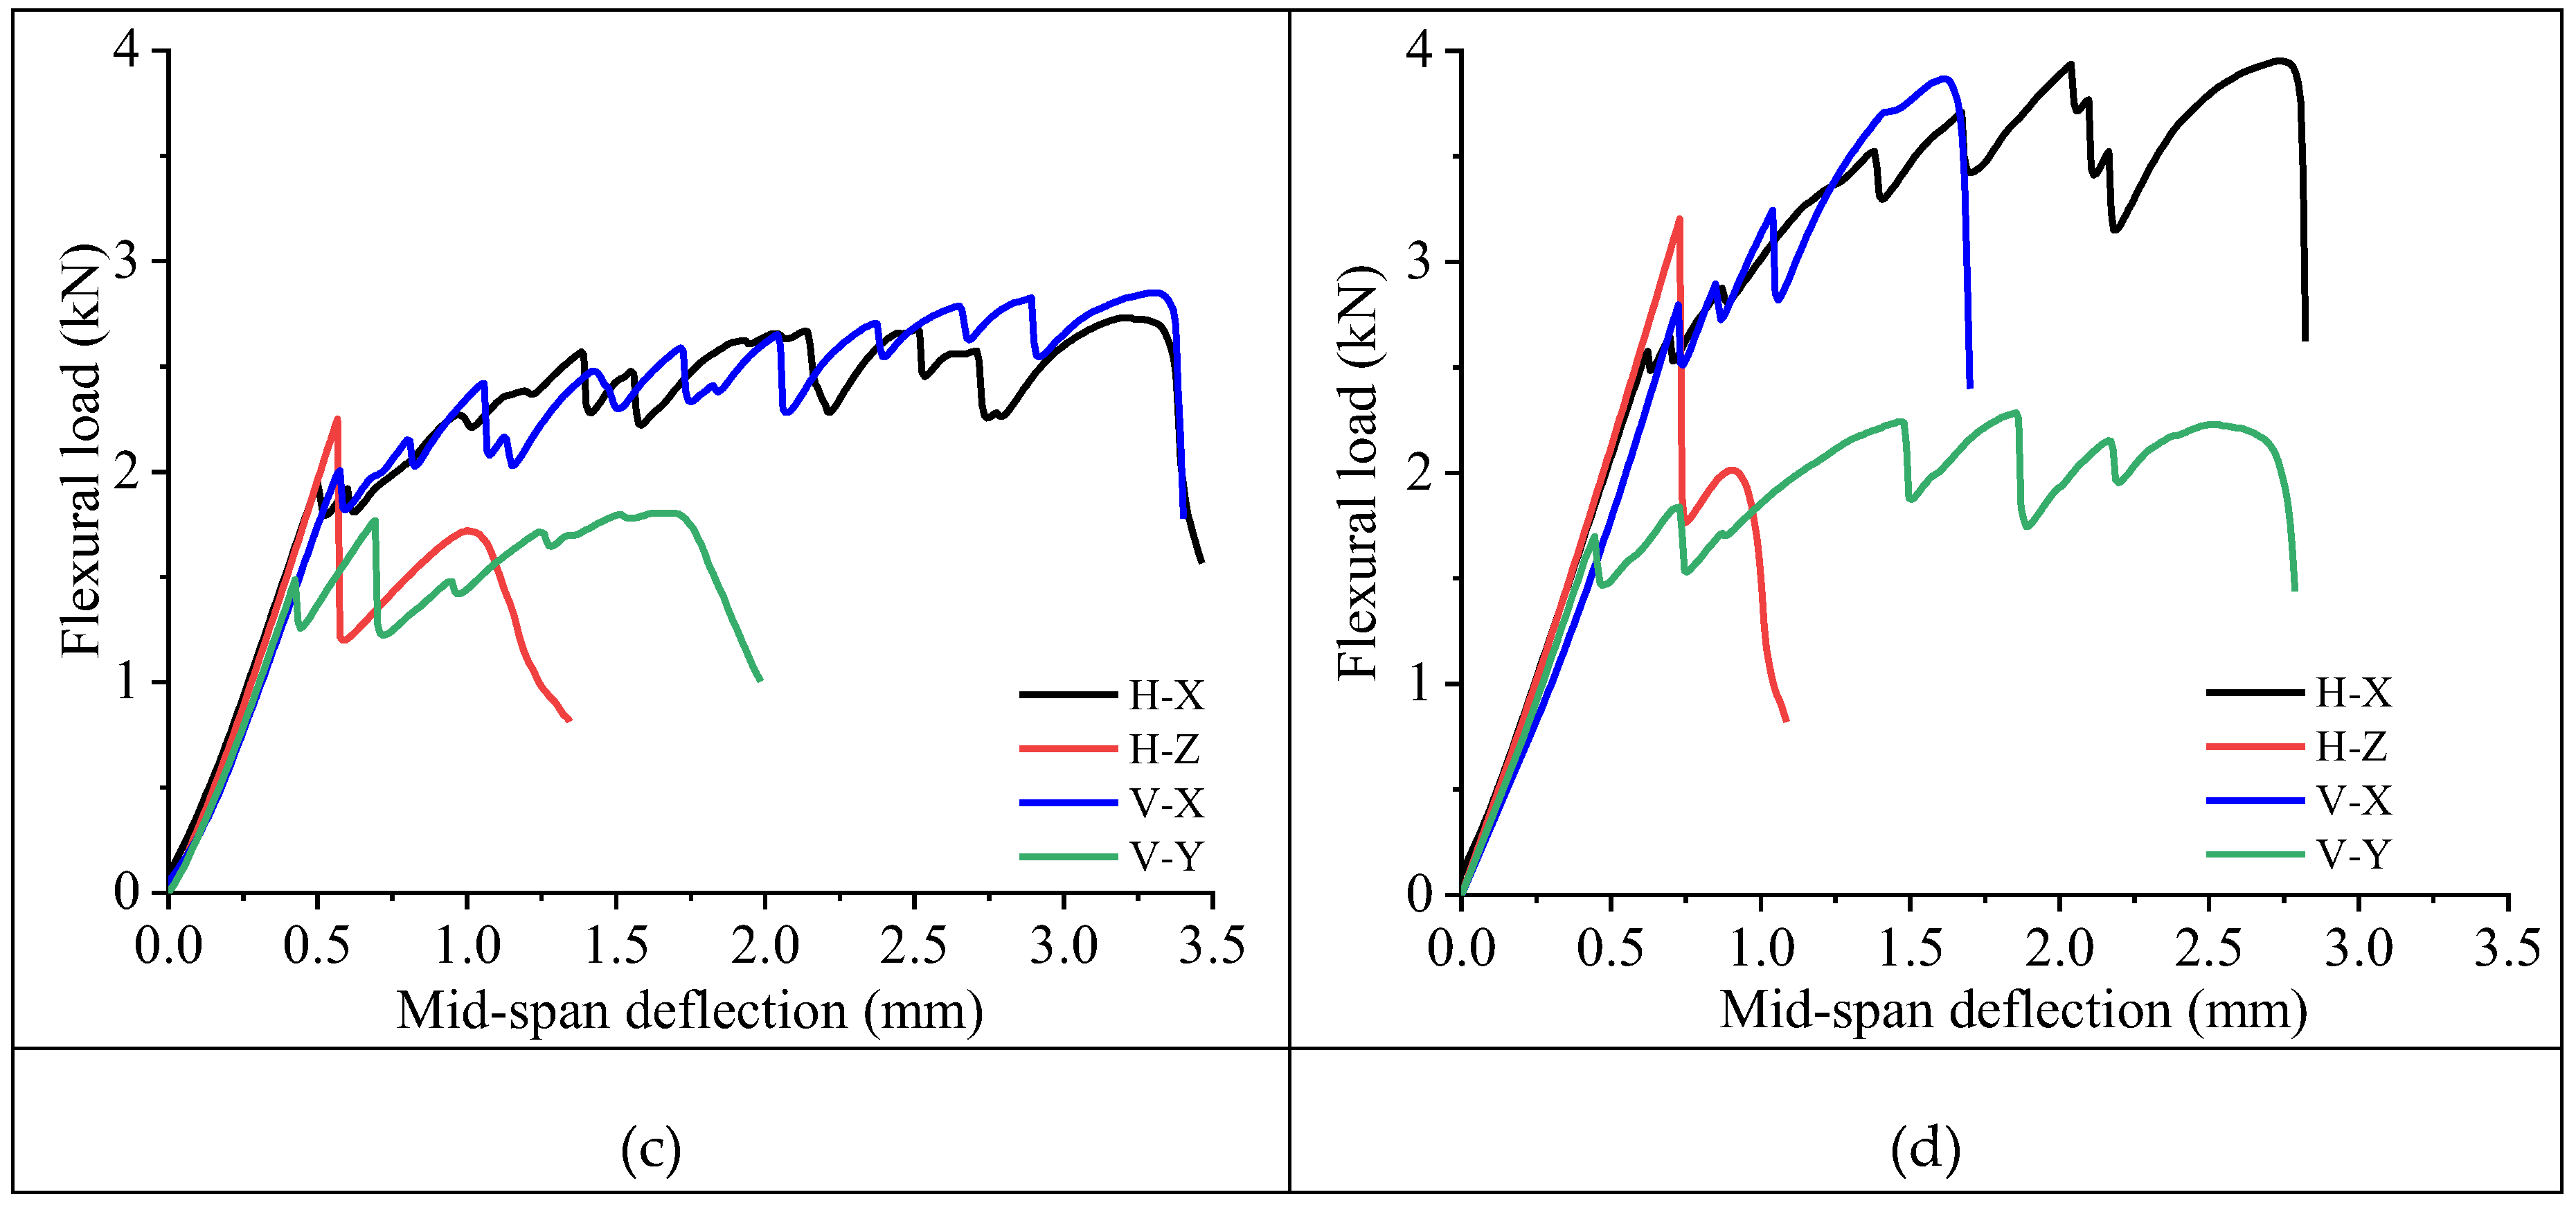
Figure 12.
Typical flexural load-deflection curves of plain and reinforced 3DPC specimens under different testing directions: (a) H-X; (b) H-Z; (c) V-X; (d) V-Y.
Figure 12.
Typical flexural load-deflection curves of plain and reinforced 3DPC specimens under different testing directions: (a) H-X; (b) H-Z; (c) V-X; (d) V-Y.
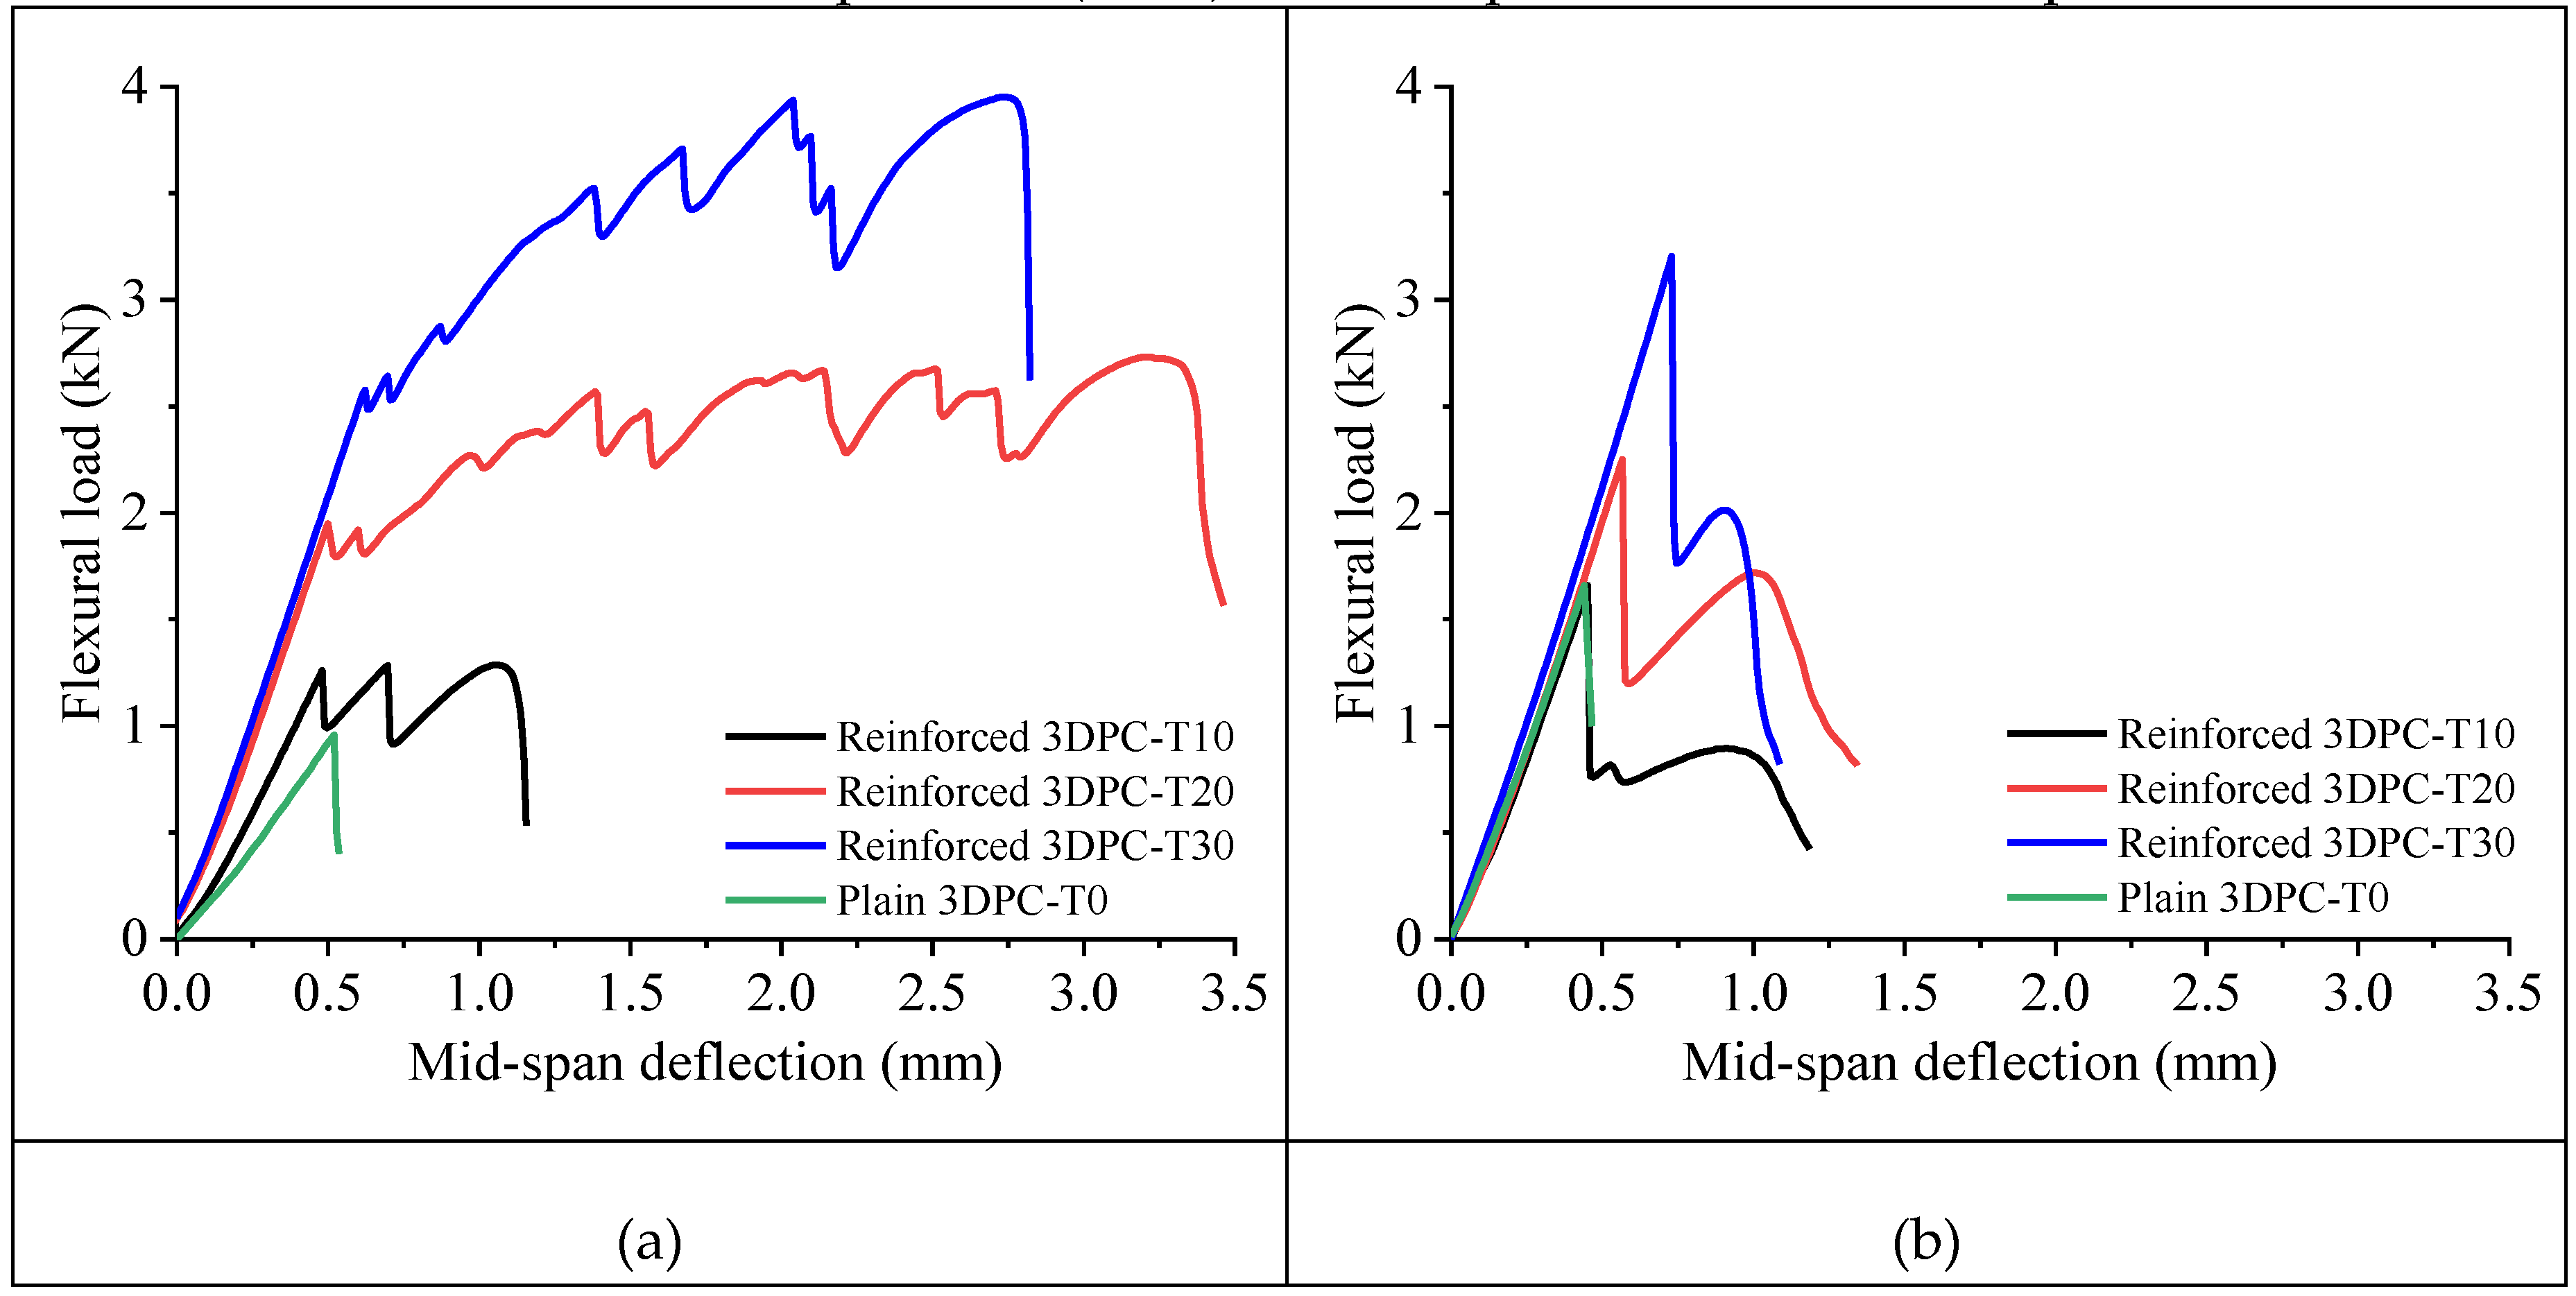
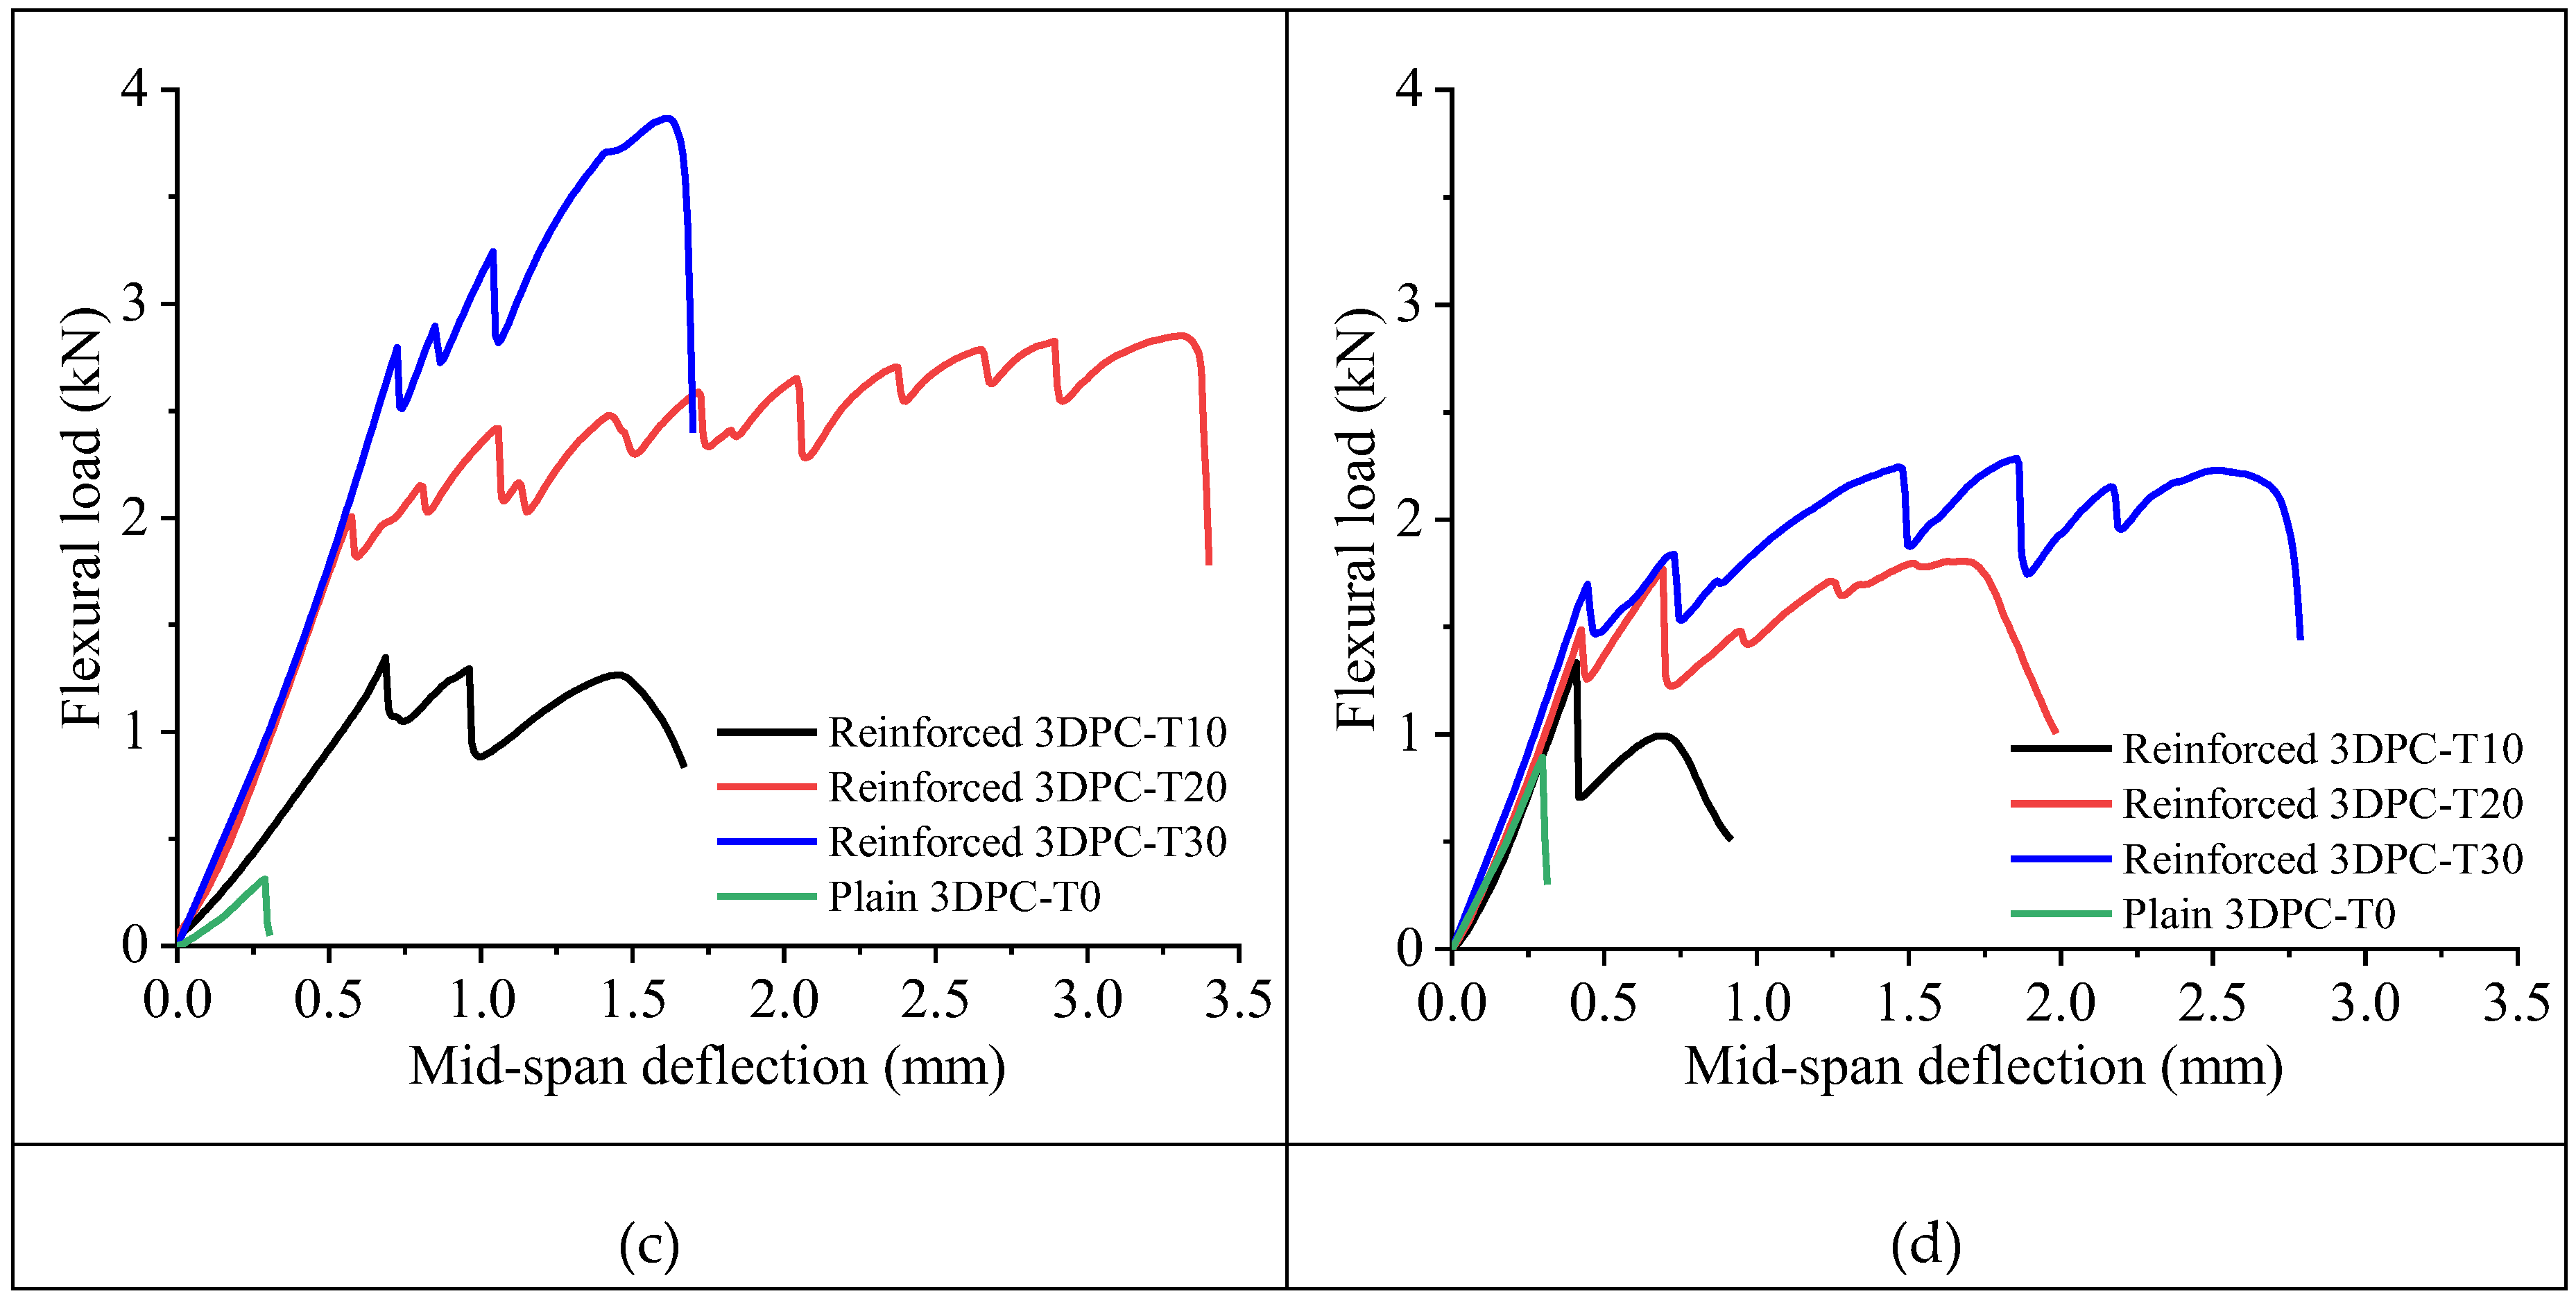
Figure 13.
Effect of overlay thickness and testing direction on the initial flexural stiffness of specimens.
Figure 13.
Effect of overlay thickness and testing direction on the initial flexural stiffness of specimens.
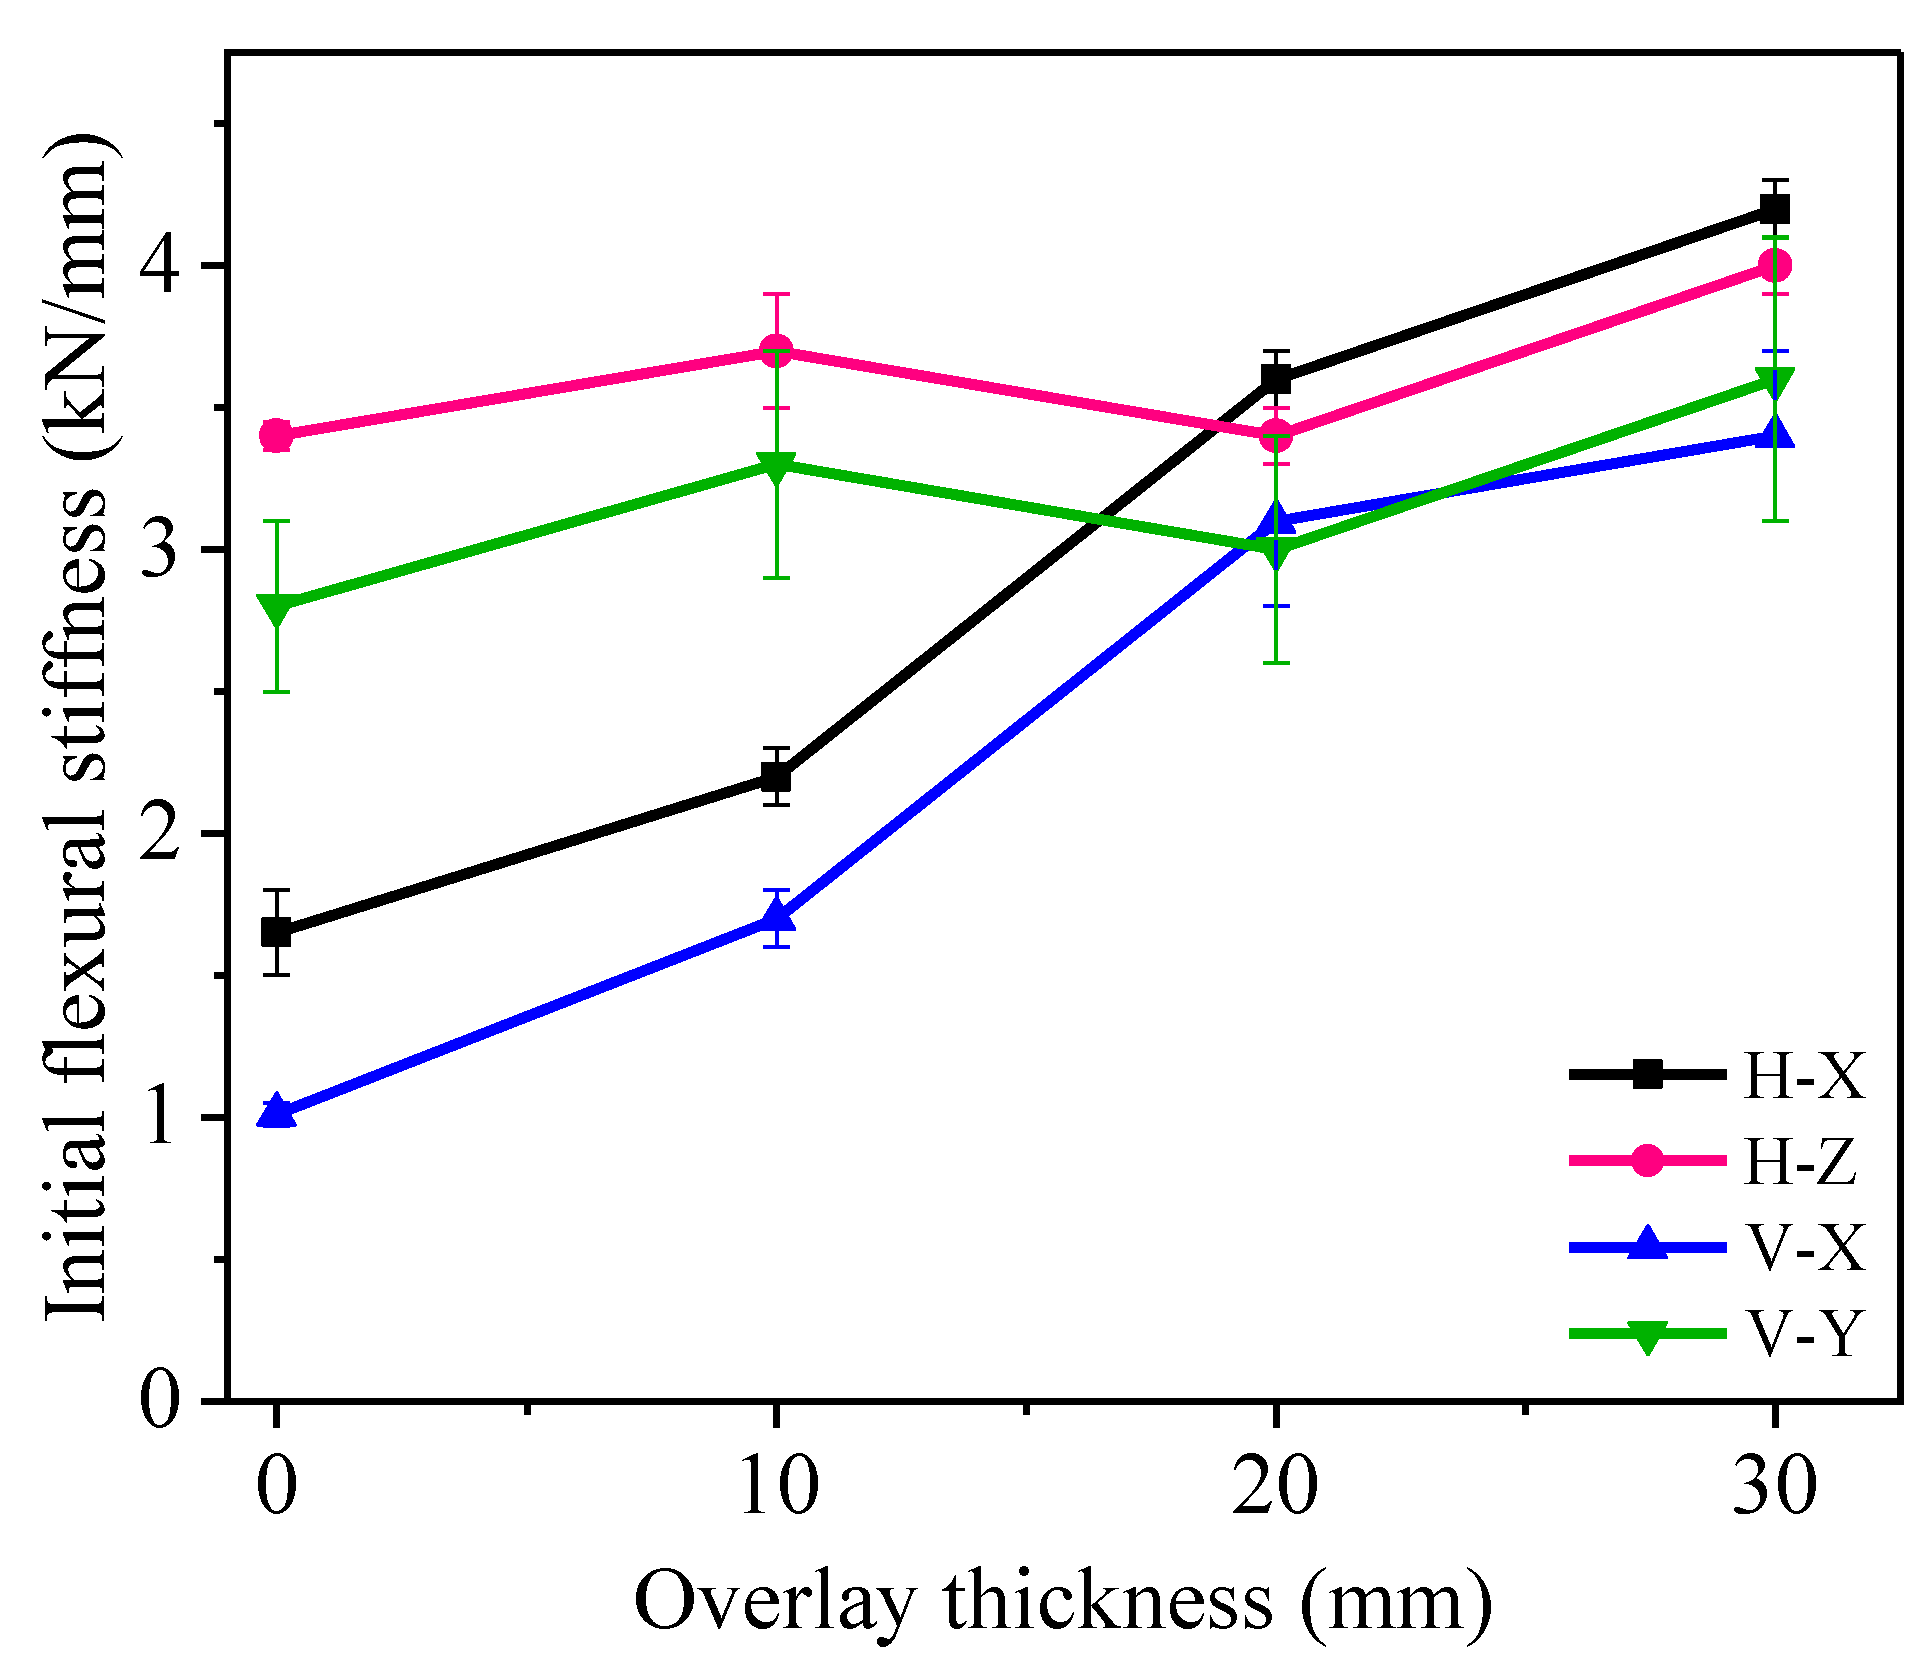
Figure 14.
Definition of toughness indices and residual strength factors (adapted from [33]).
Figure 14.
Definition of toughness indices and residual strength factors (adapted from [33]).
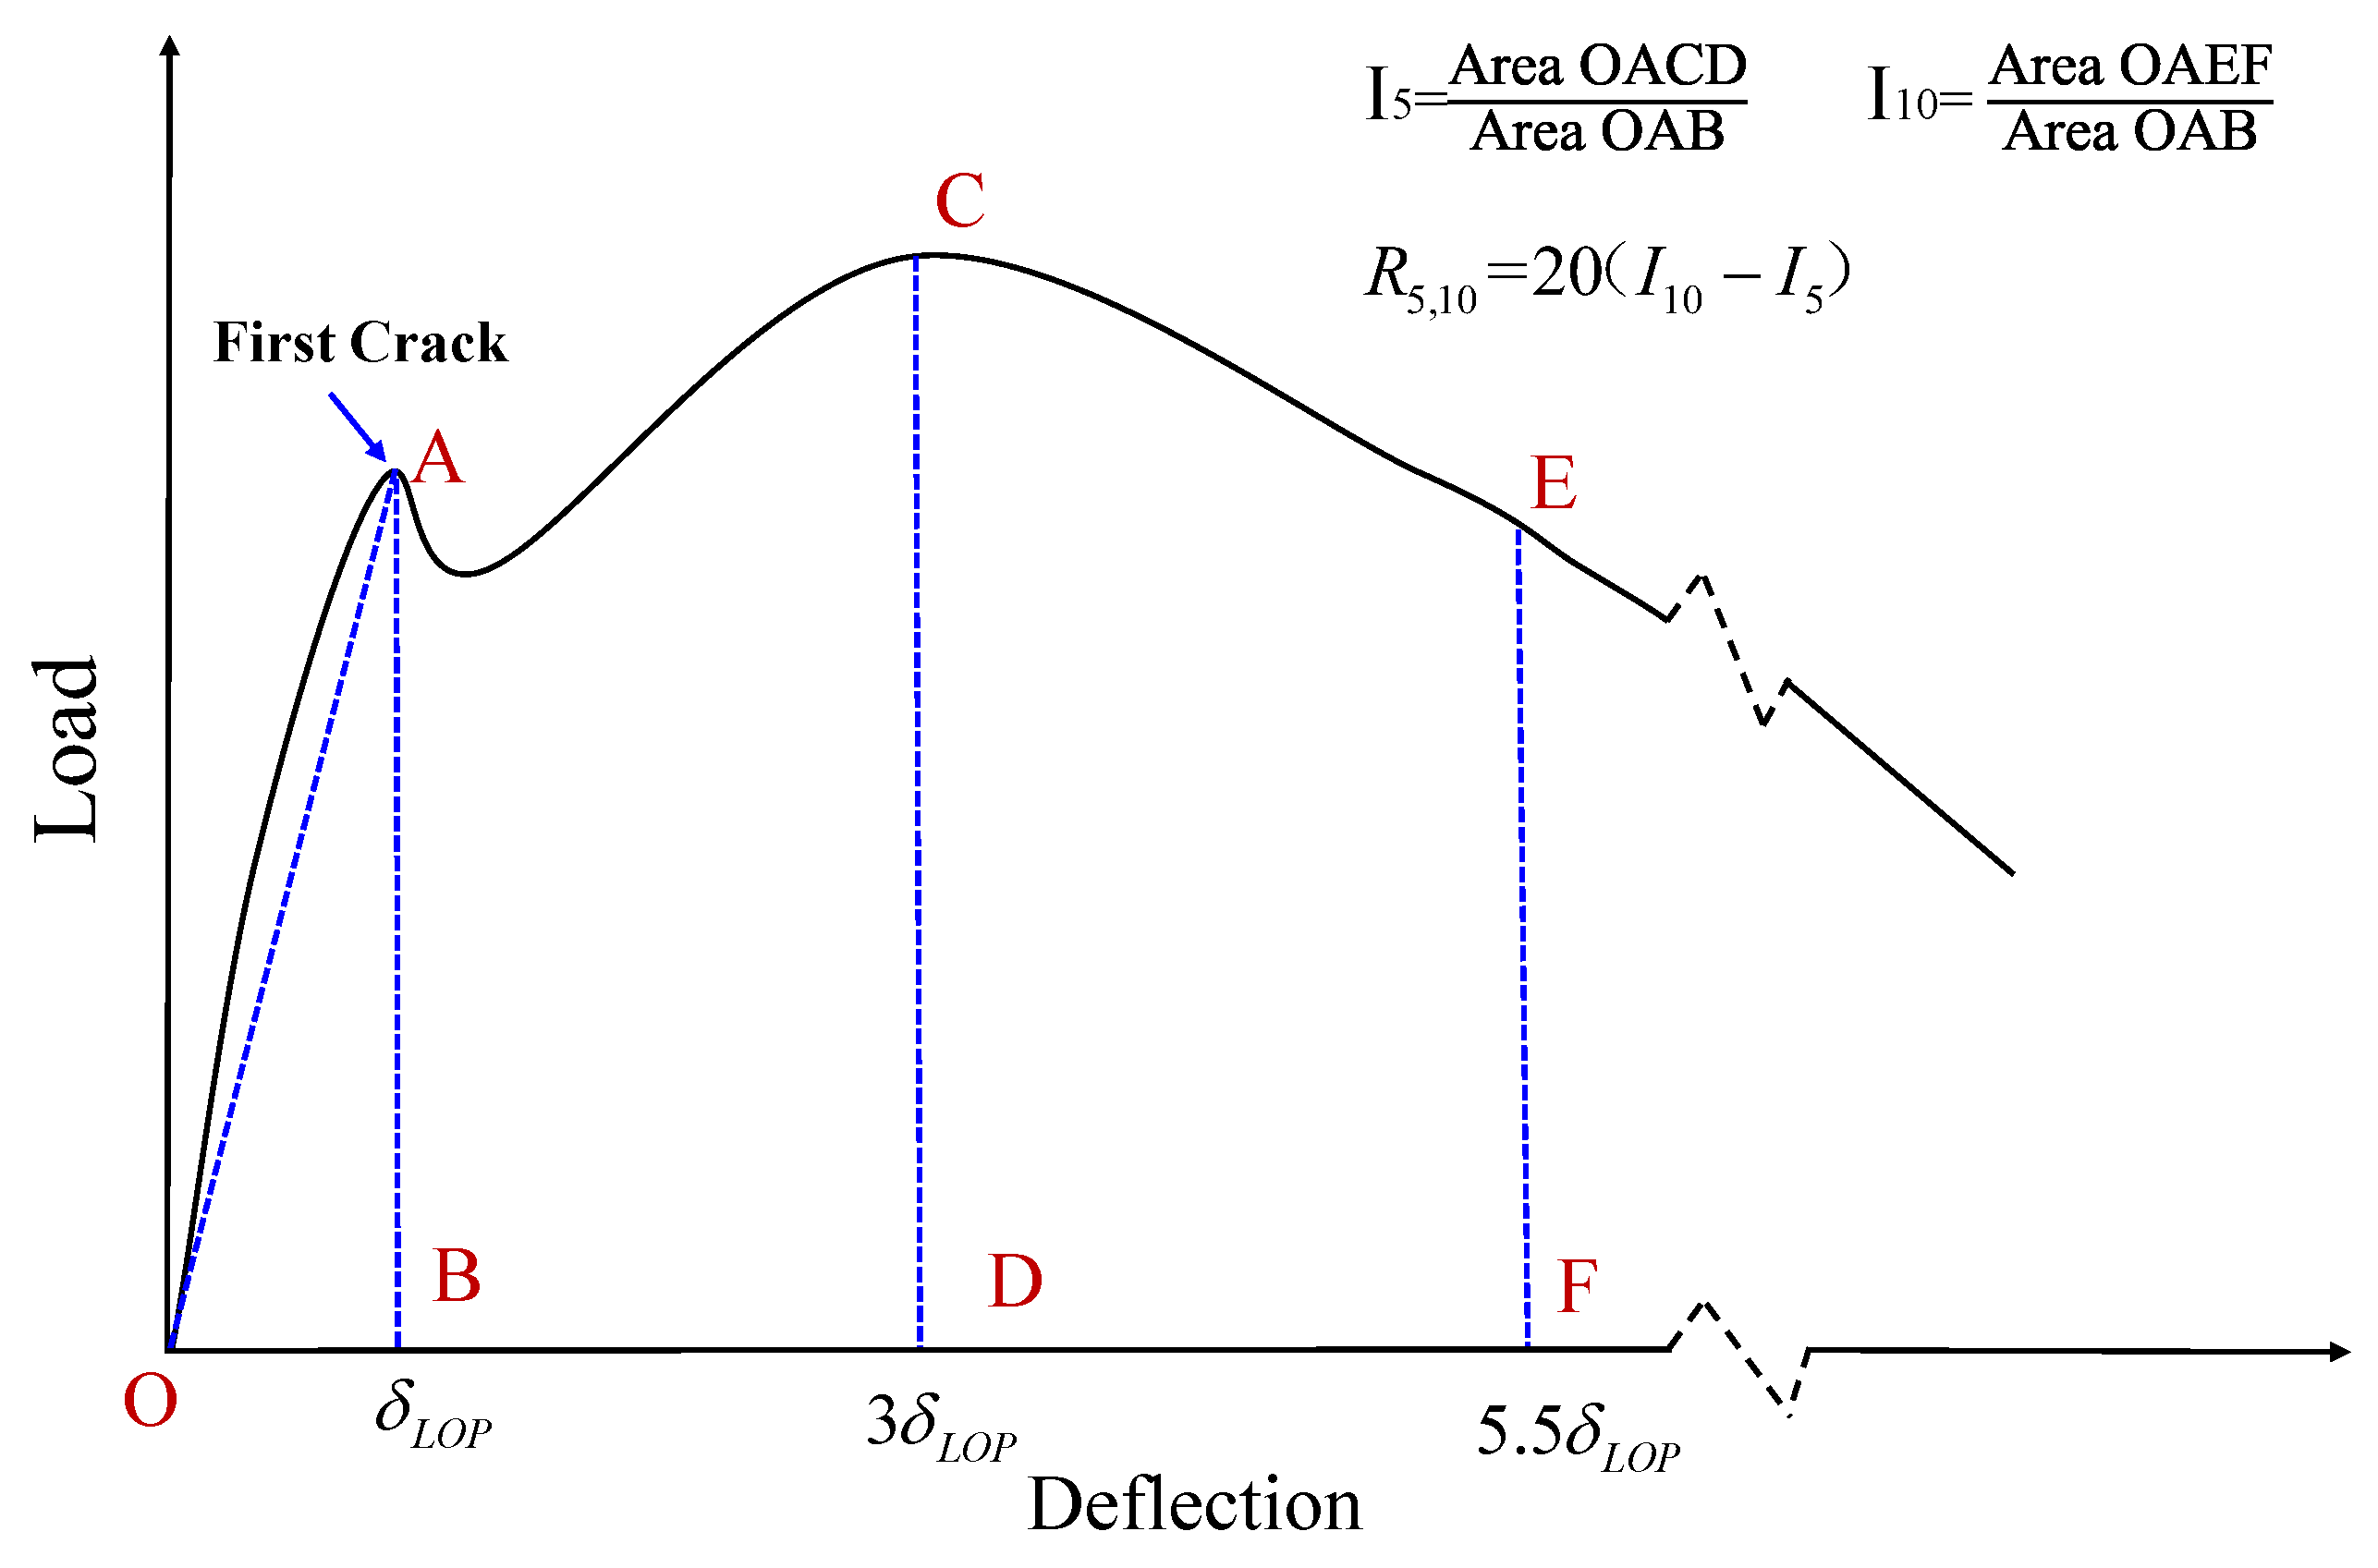
Figure 15.
Strain response at the S-SHCC/3DPC interface in the X-direction: (a) longitudinal strain along the height of the cross-section; (b) full-field strain contour within the mid-span region of specimens at PLOP (the white dashed lines identify the position of the interface).
Figure 15.
Strain response at the S-SHCC/3DPC interface in the X-direction: (a) longitudinal strain along the height of the cross-section; (b) full-field strain contour within the mid-span region of specimens at PLOP (the white dashed lines identify the position of the interface).
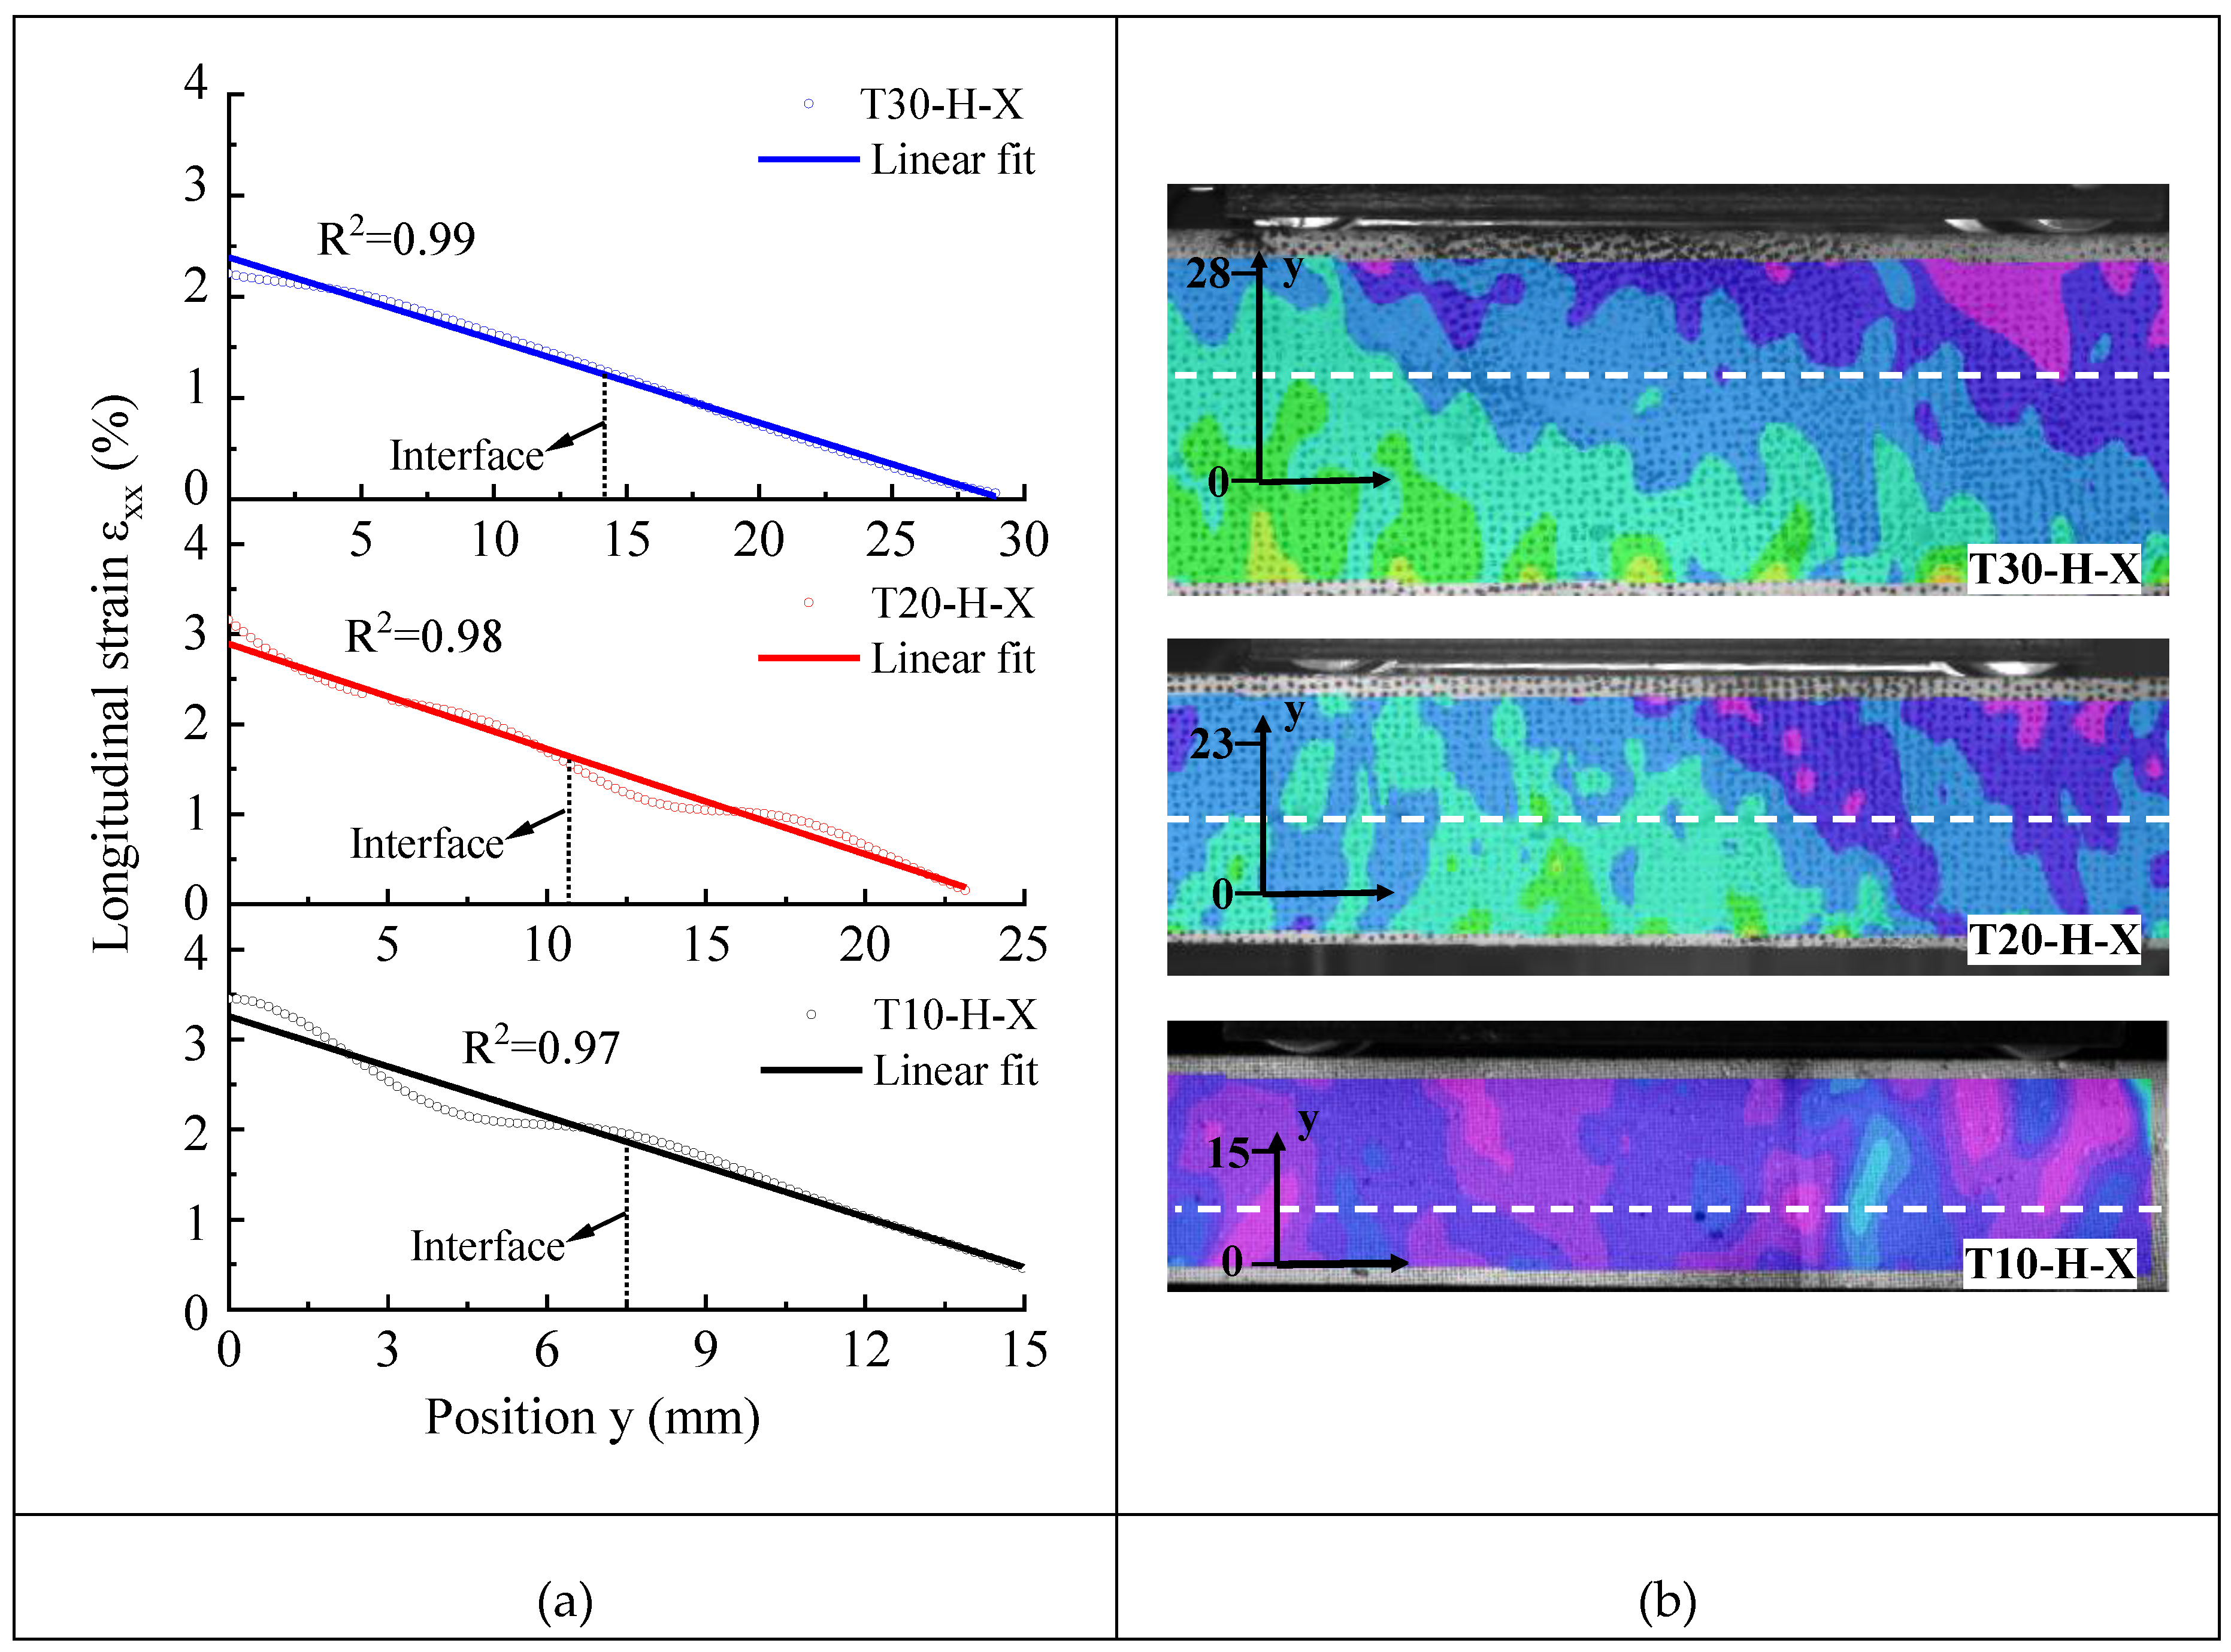
Figure 16.
Evolution of interfacial shear strain (εxy) of T30-H-X specimen: (a) 75% peak load; (b) peak load (the black dashed lines indicate the position of the interface).
Figure 16.
Evolution of interfacial shear strain (εxy) of T30-H-X specimen: (a) 75% peak load; (b) peak load (the black dashed lines indicate the position of the interface).
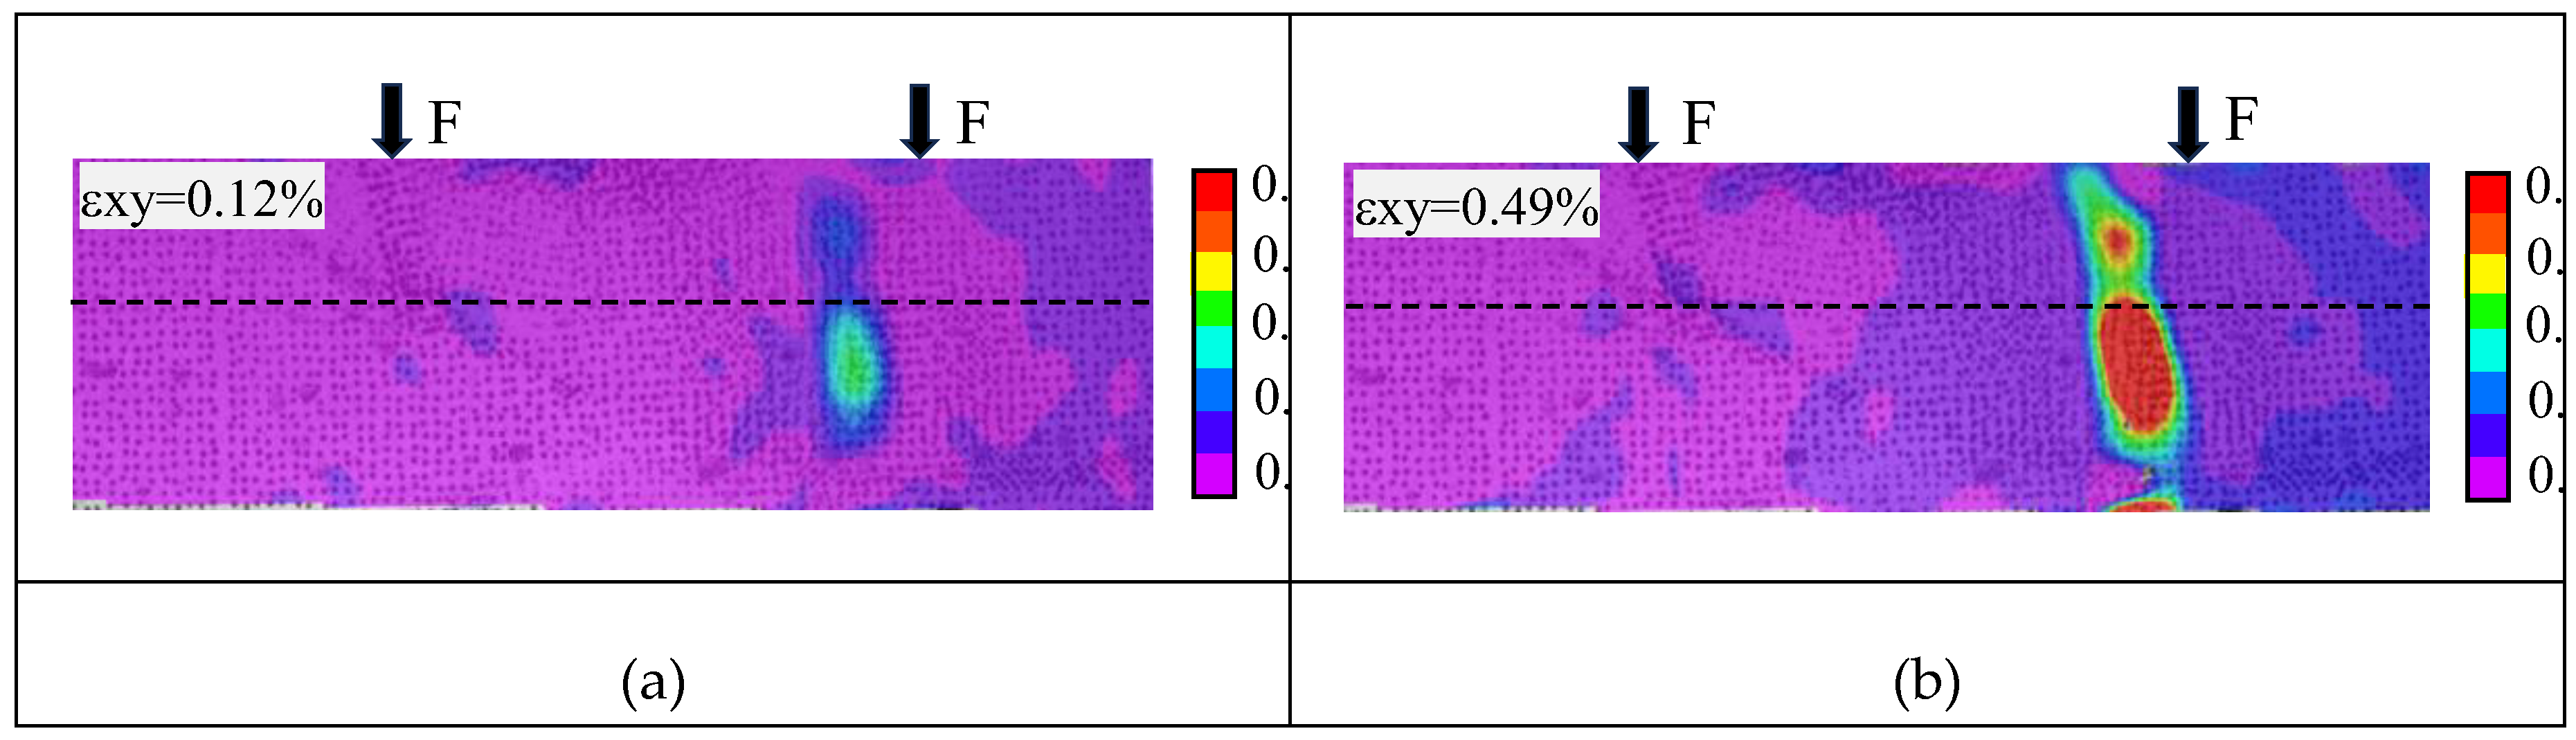
Figure 17.
Evolution of relative horizontal displacement across the 3DPC/S-SHCC interface at different locations for T30-H-X specimen: (a) relative horizontal displacement evolution; (b) extraction point locations.
Figure 17.
Evolution of relative horizontal displacement across the 3DPC/S-SHCC interface at different locations for T30-H-X specimen: (a) relative horizontal displacement evolution; (b) extraction point locations.
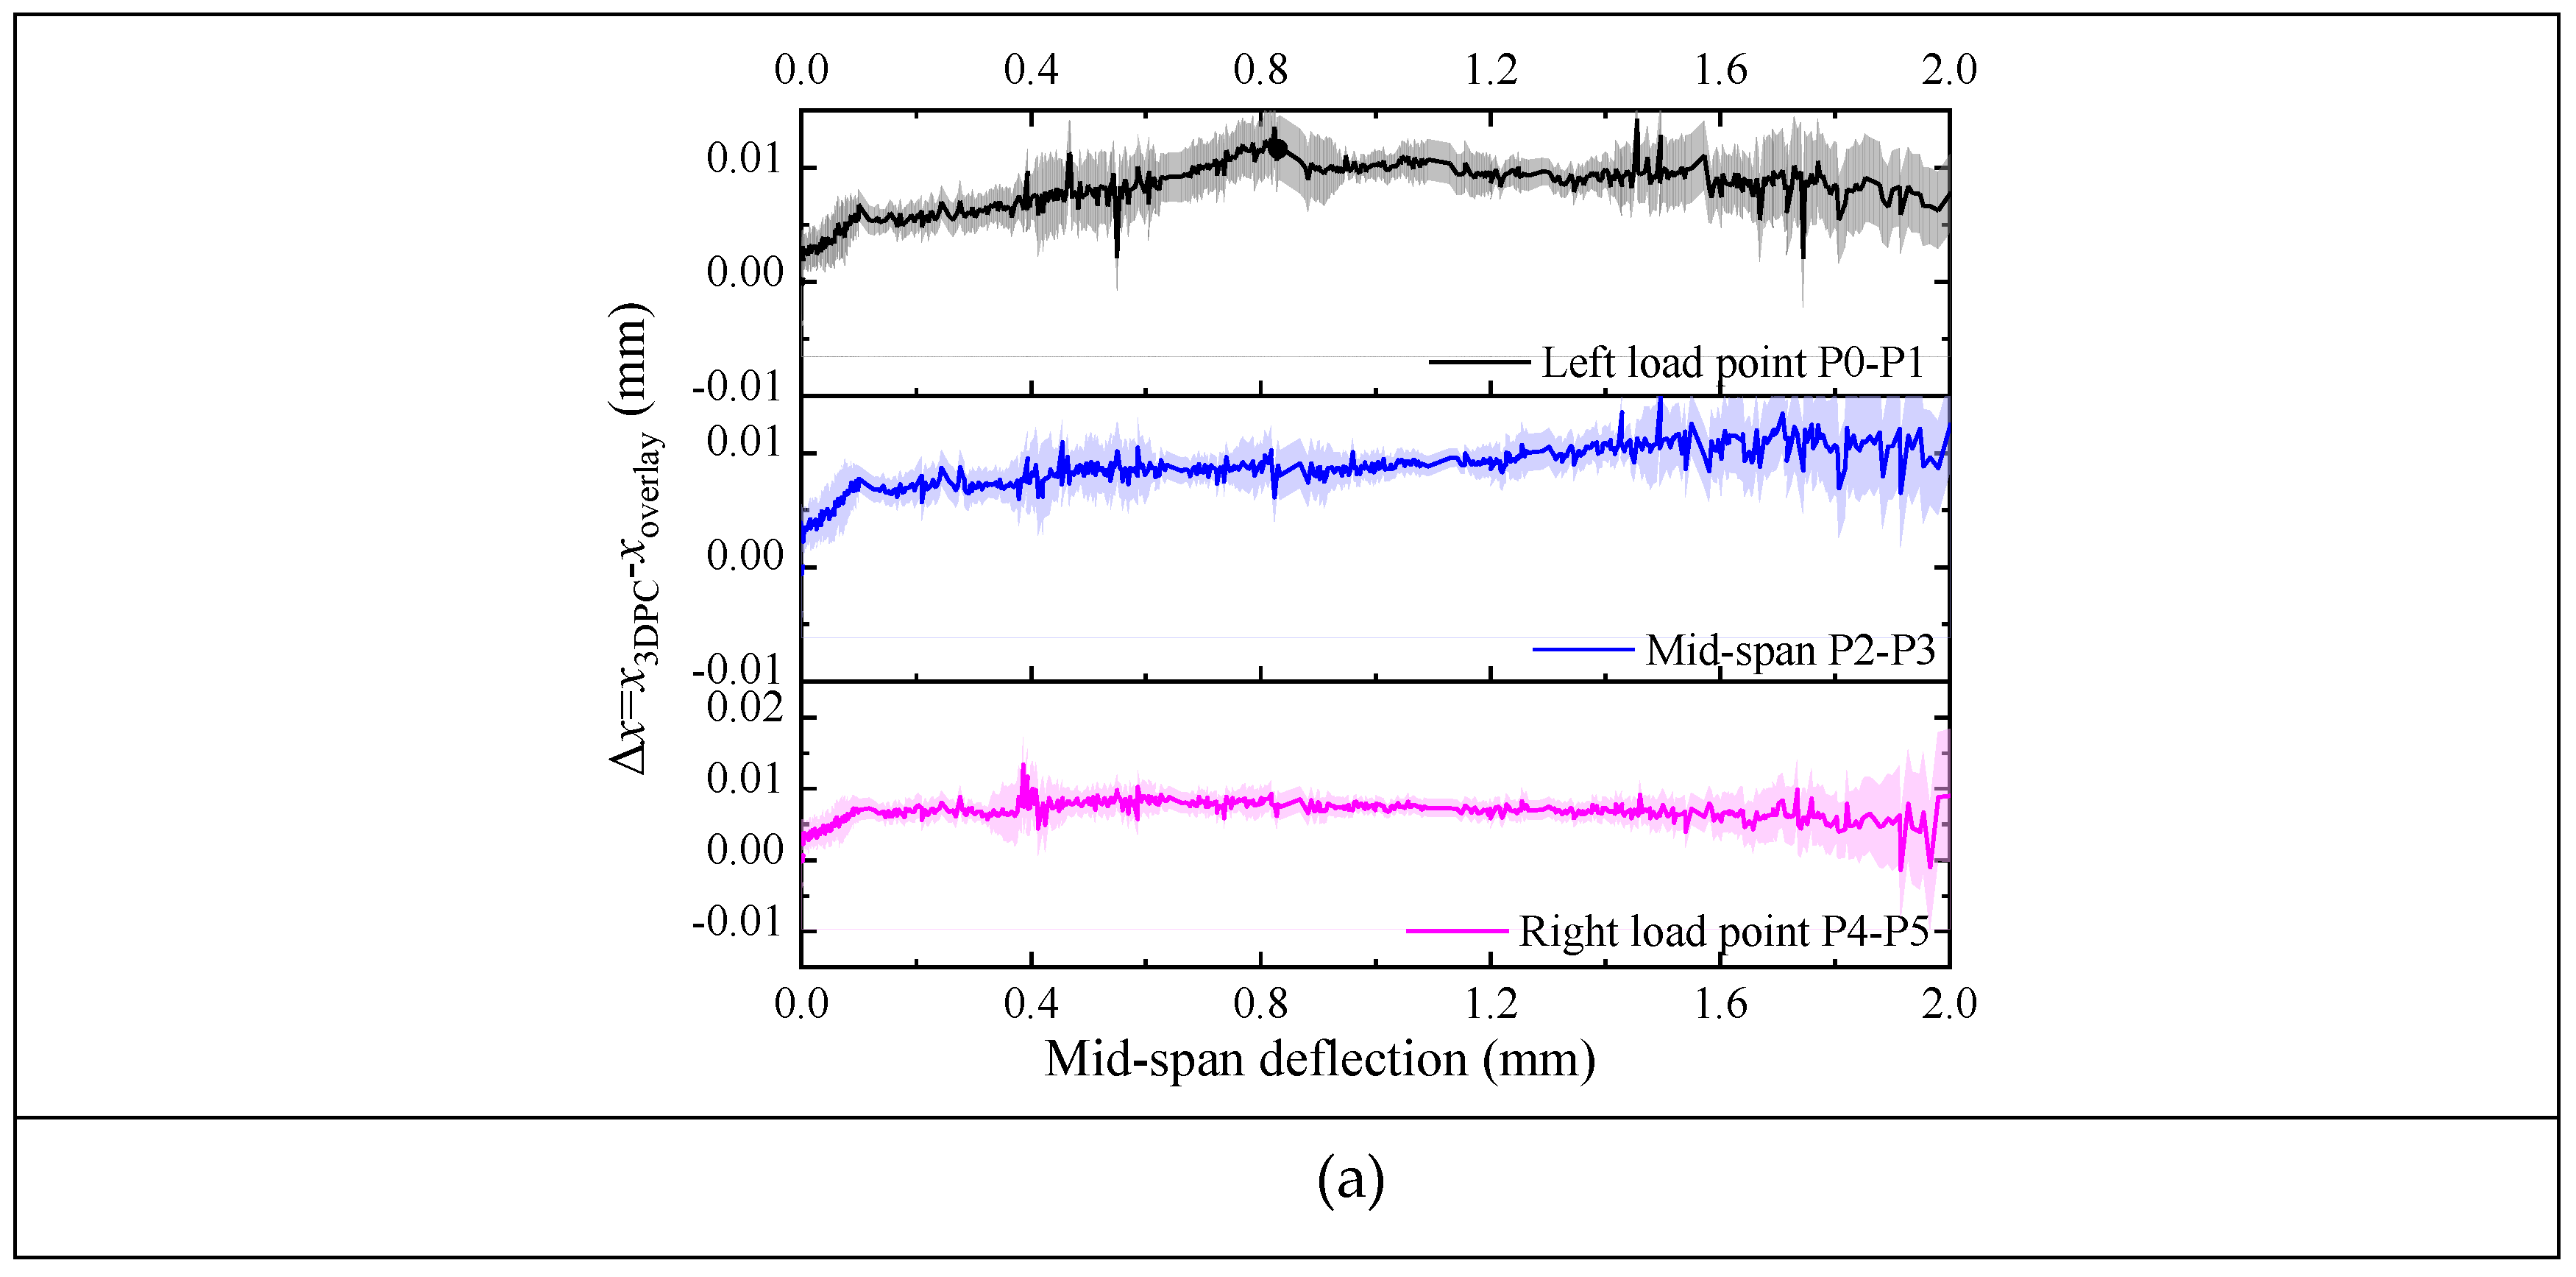
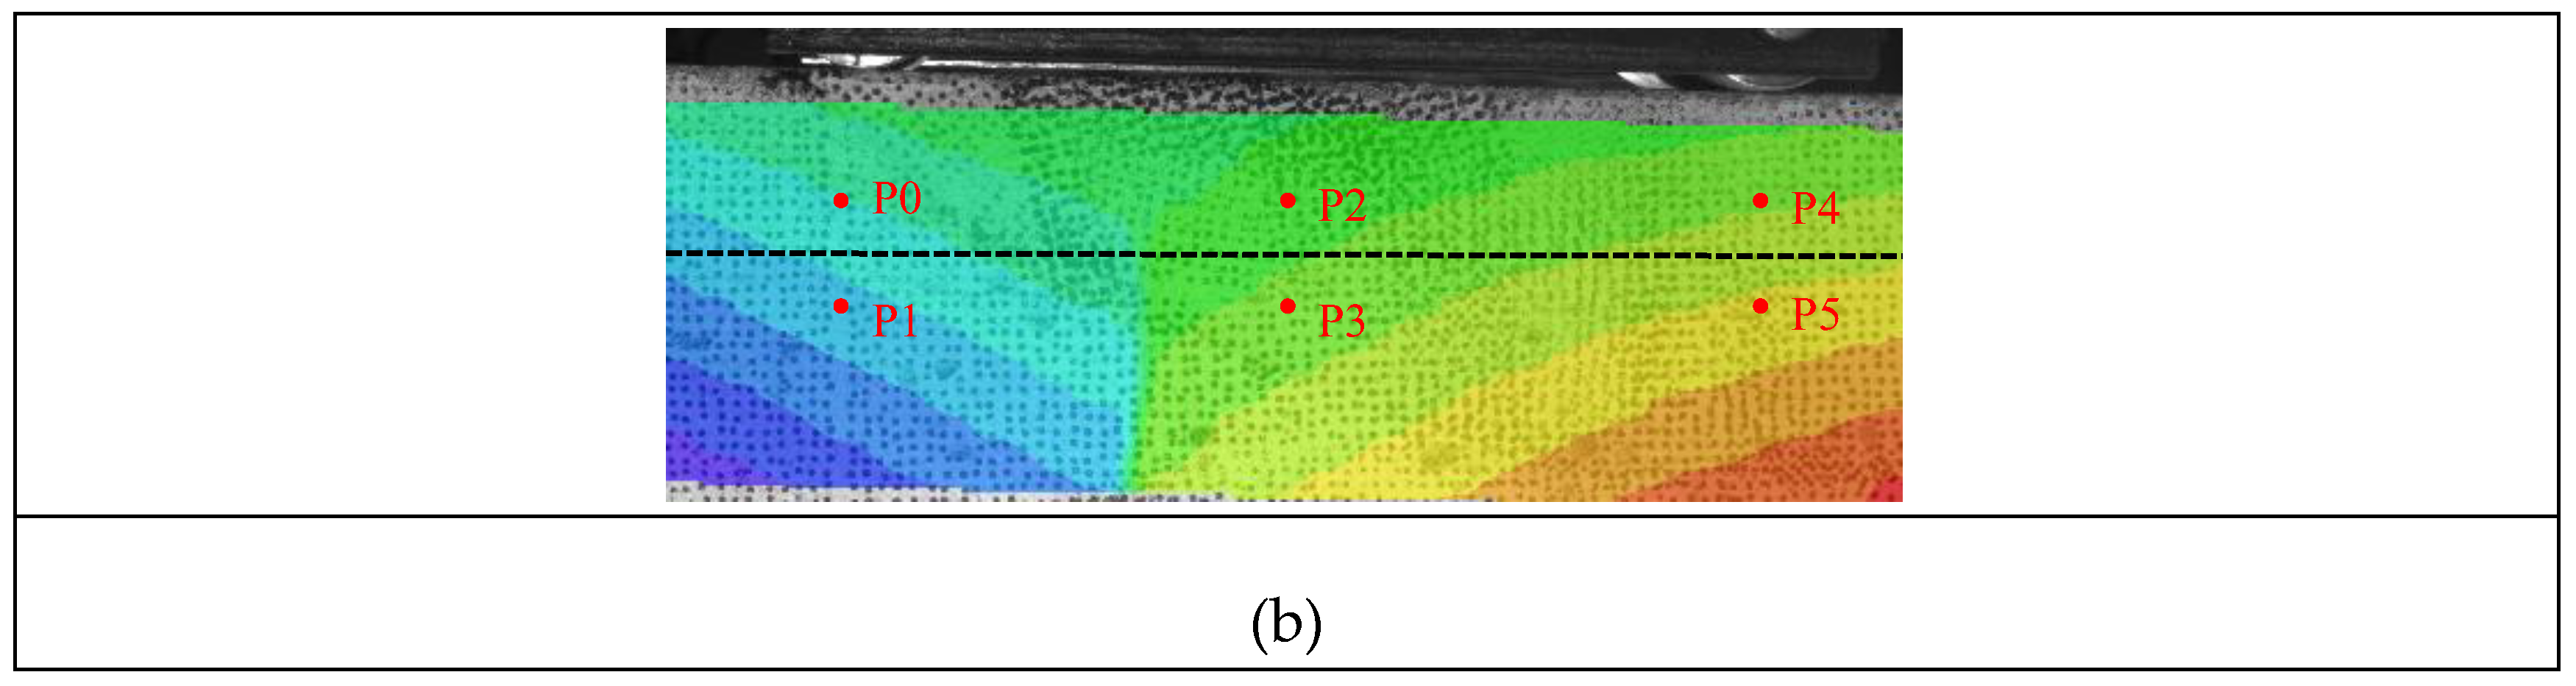
Figure 18.
Maximum principal strain (ε₁) distribution and crack evolution of T20 specimens in different testing directions (δ: mid-span deflection, mm): (a) region of interest (ROI) for DIC analysis; (b) H-X; (c) V-Y; (d) H-Z.
Figure 18.
Maximum principal strain (ε₁) distribution and crack evolution of T20 specimens in different testing directions (δ: mid-span deflection, mm): (a) region of interest (ROI) for DIC analysis; (b) H-X; (c) V-Y; (d) H-Z.
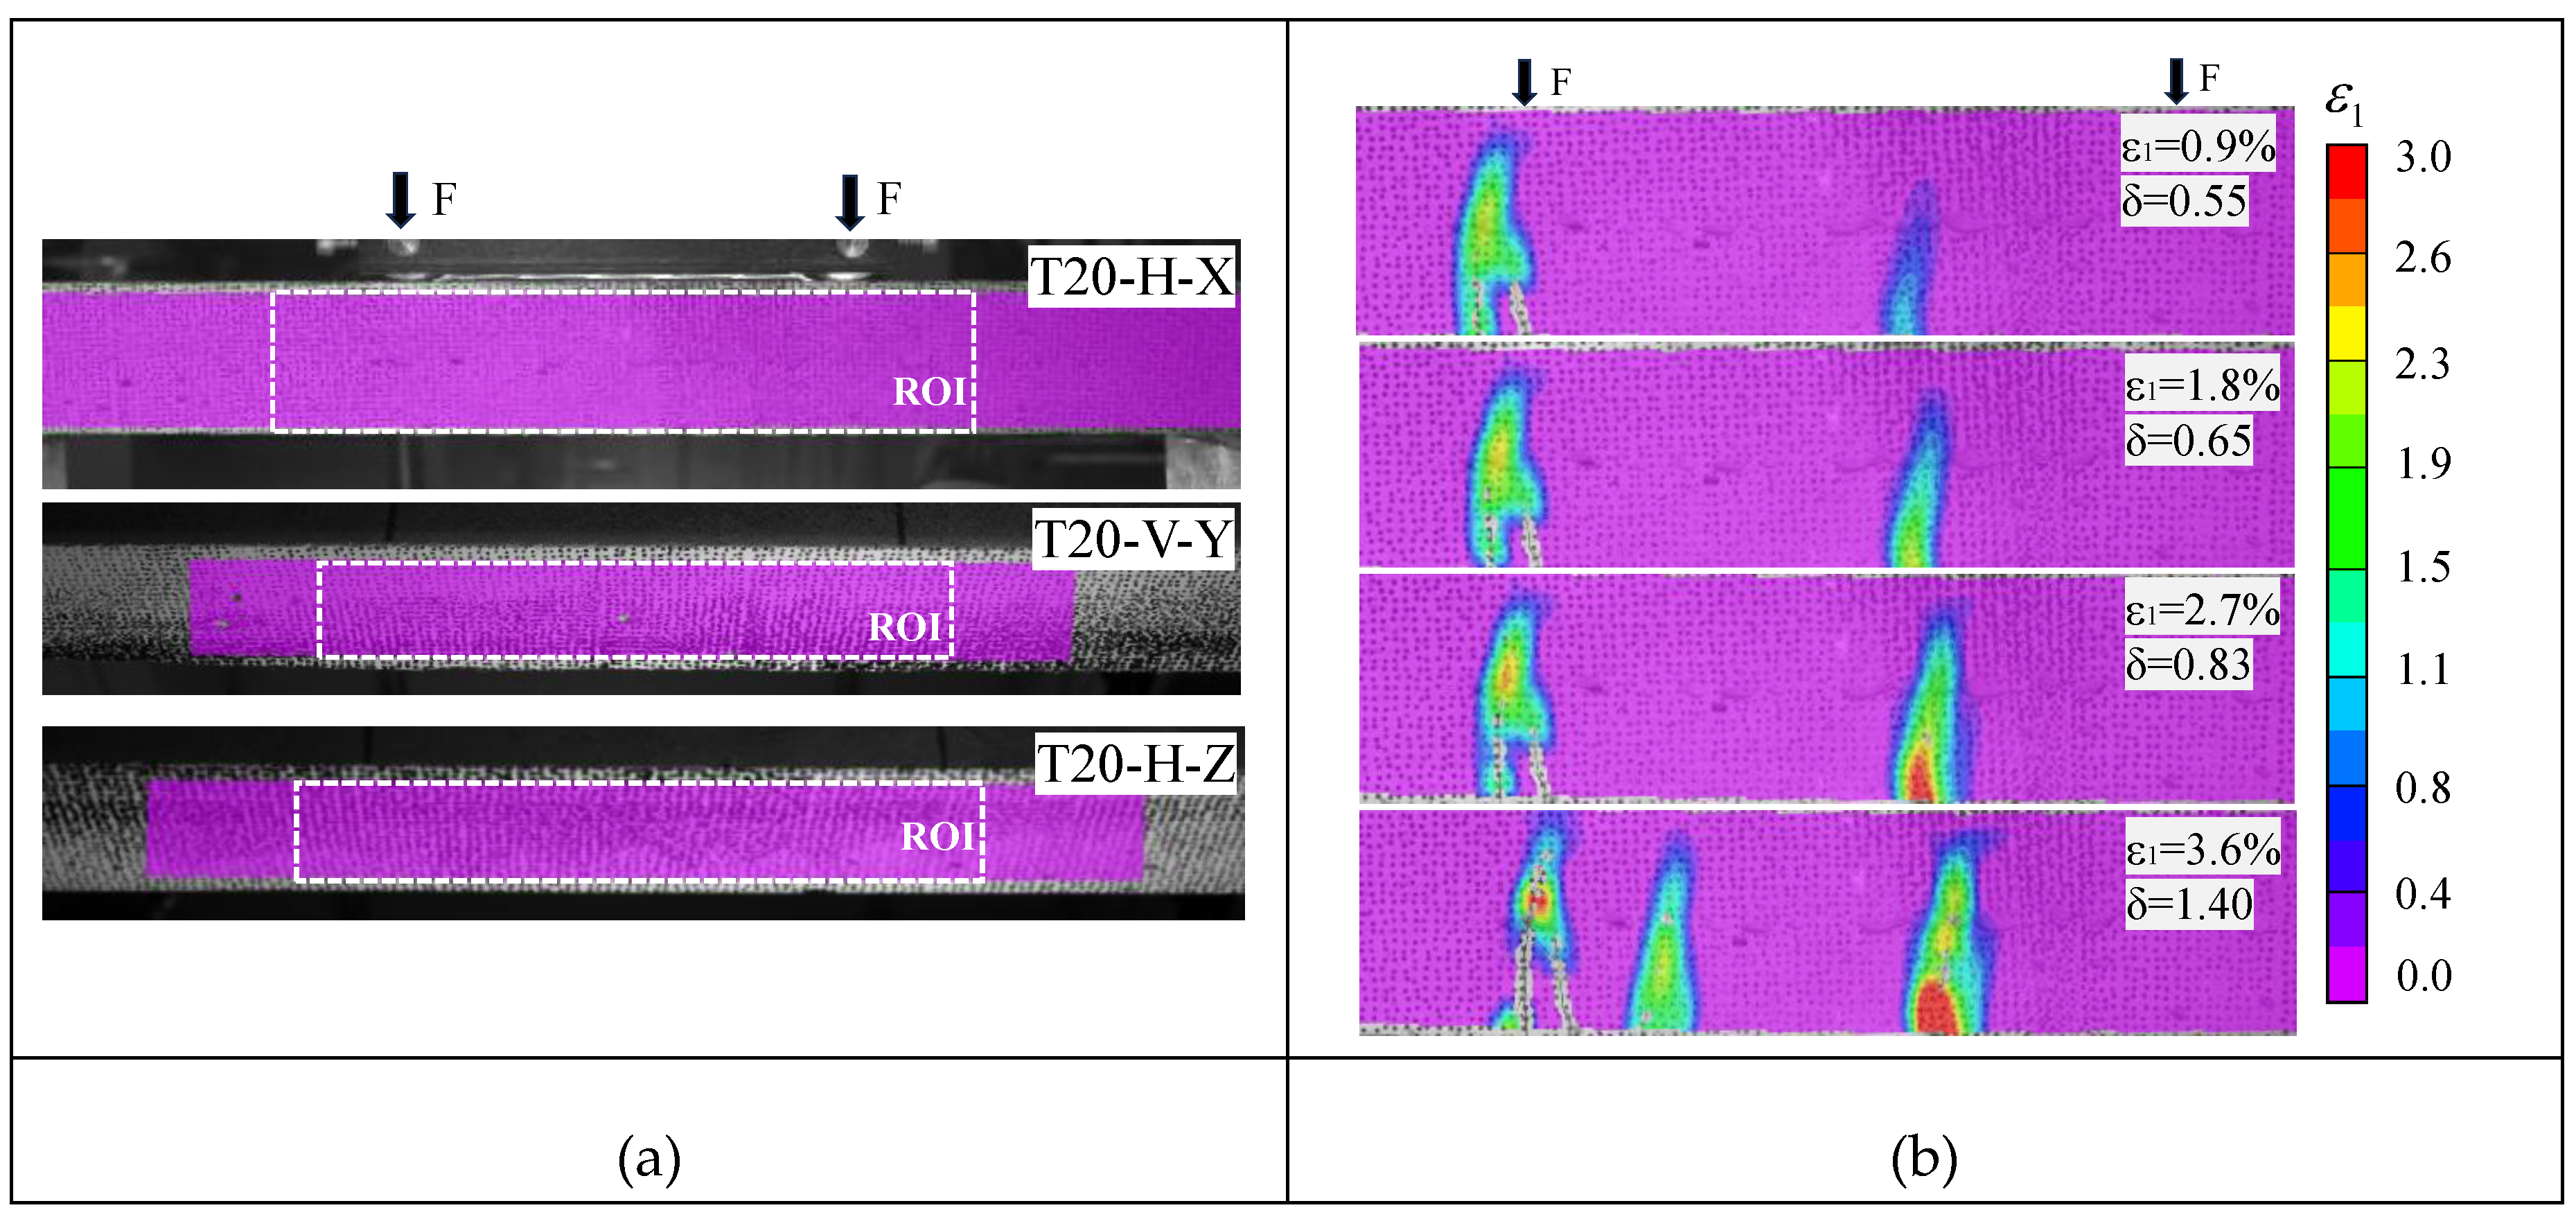
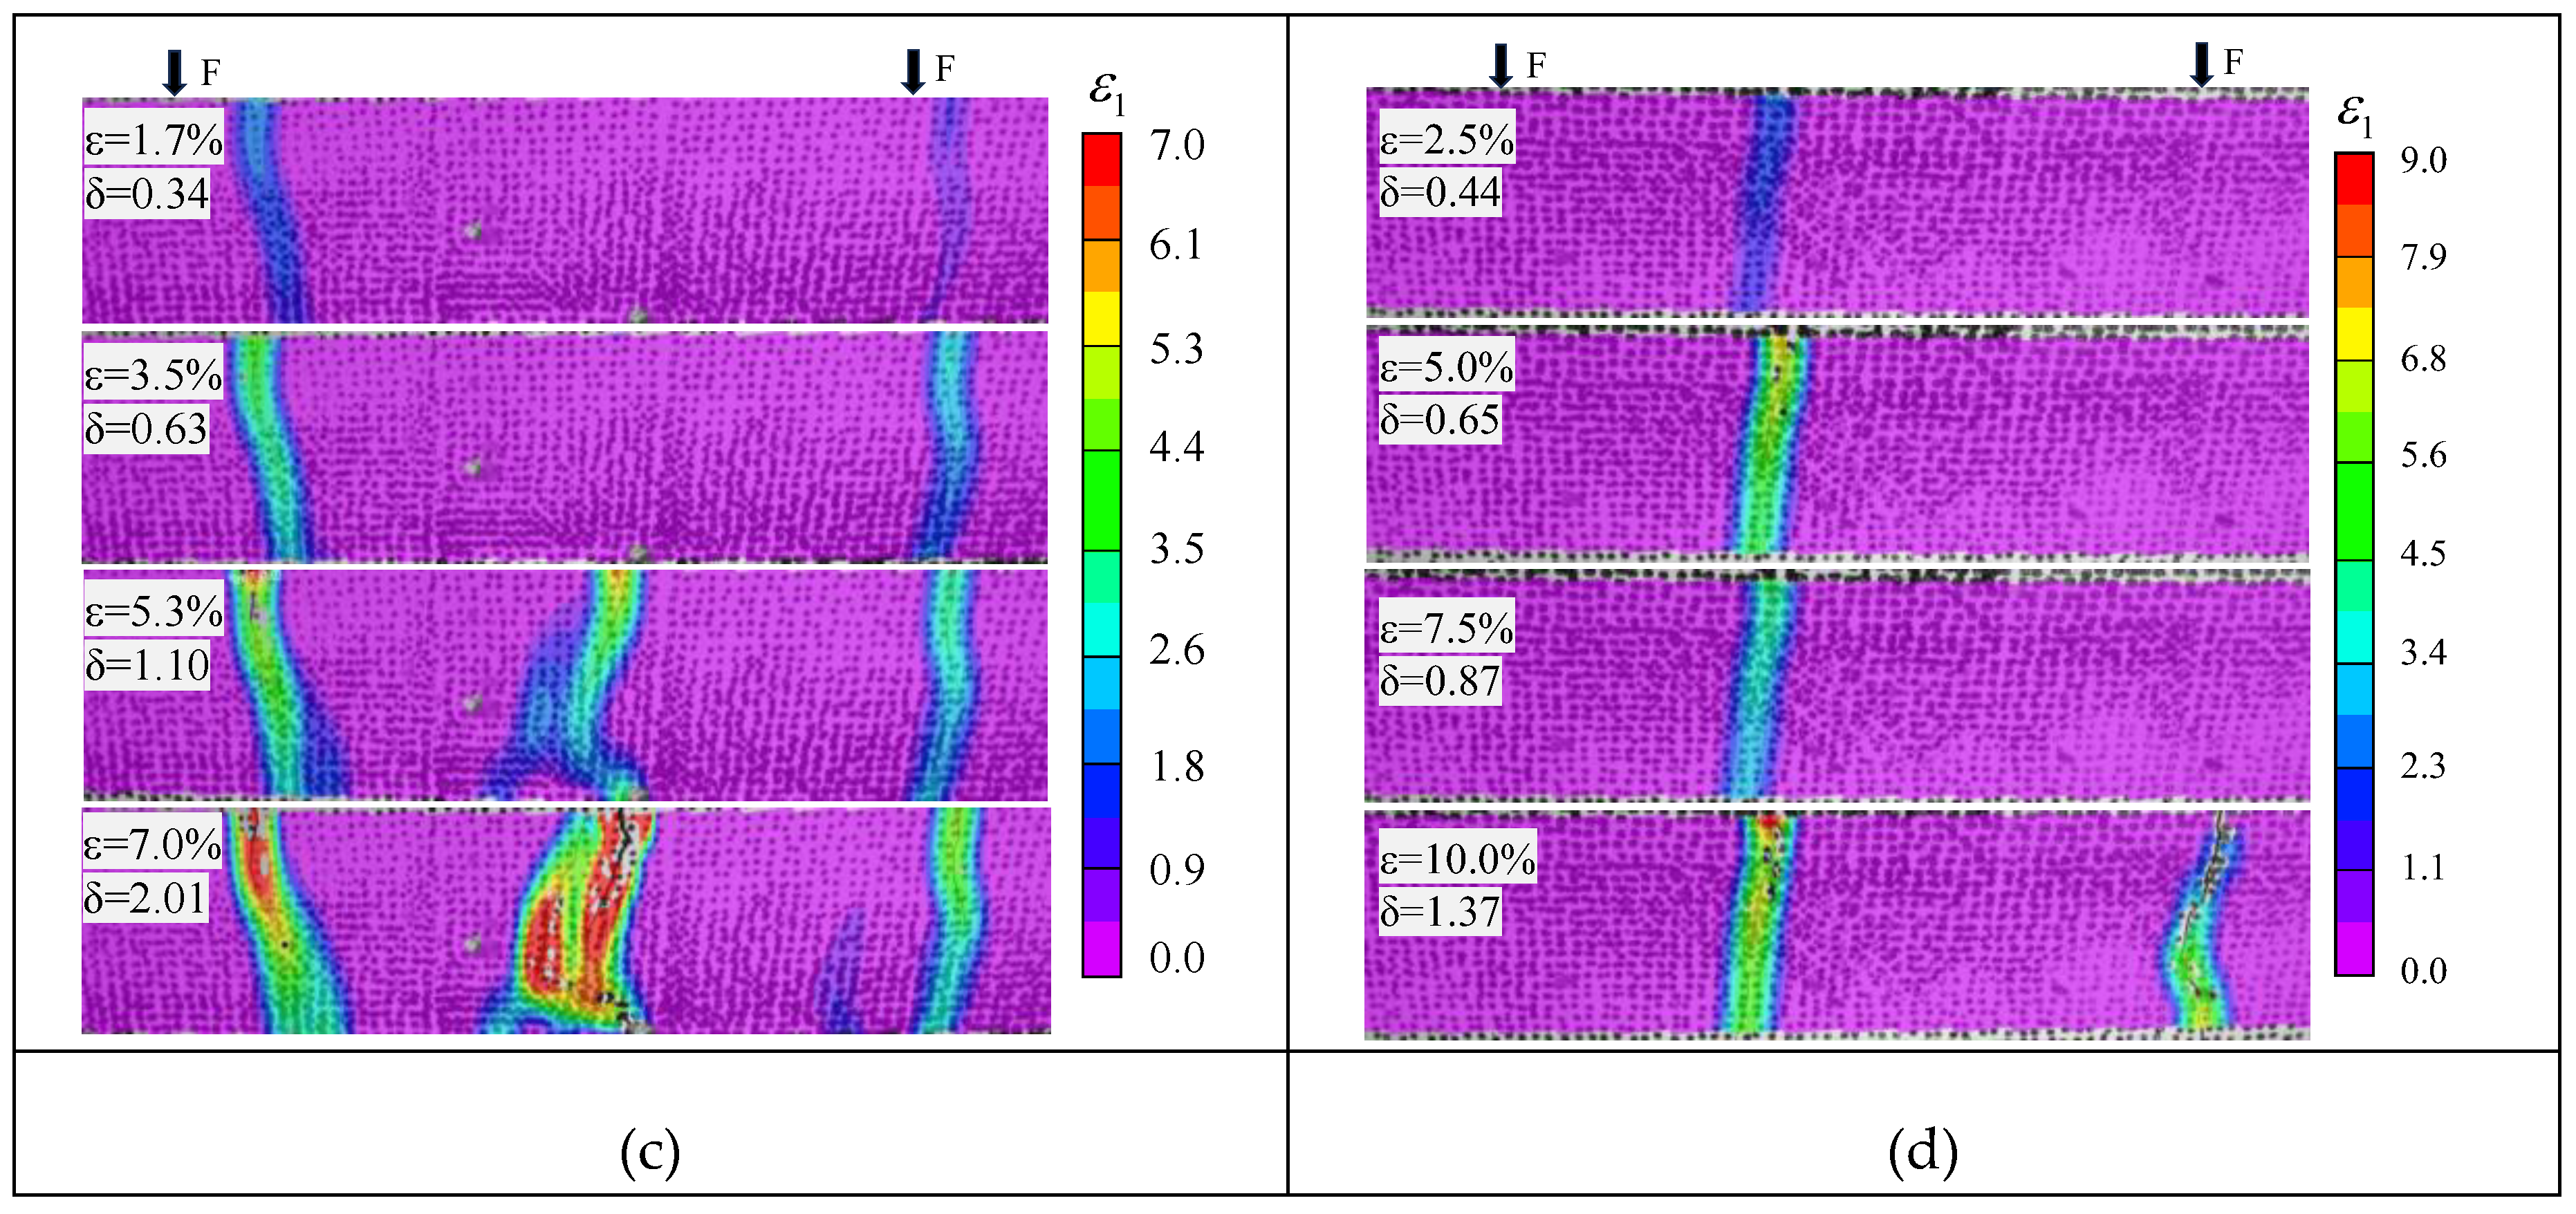
Figure 19.
Cross-sectional stress distribution at peak stage after reinforcing 3DPC with S-SHCC overlay.
Figure 19.
Cross-sectional stress distribution at peak stage after reinforcing 3DPC with S-SHCC overlay.
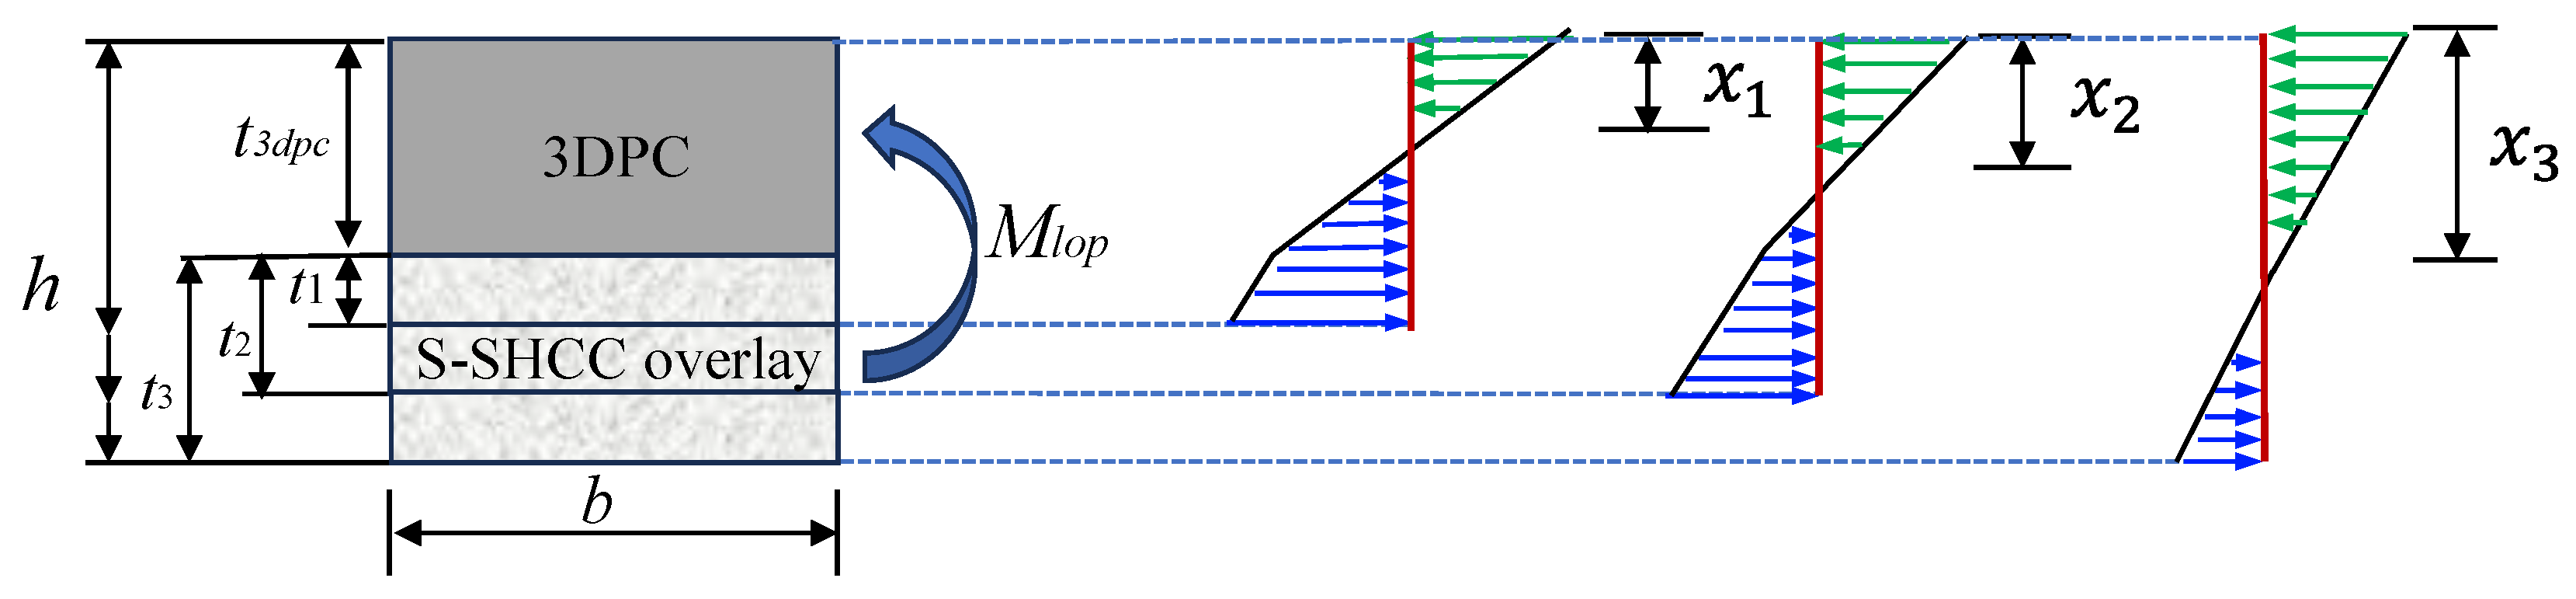
Figure 20.
Prediction process for flexural capacity of the composite in the Y- and Z-directions.
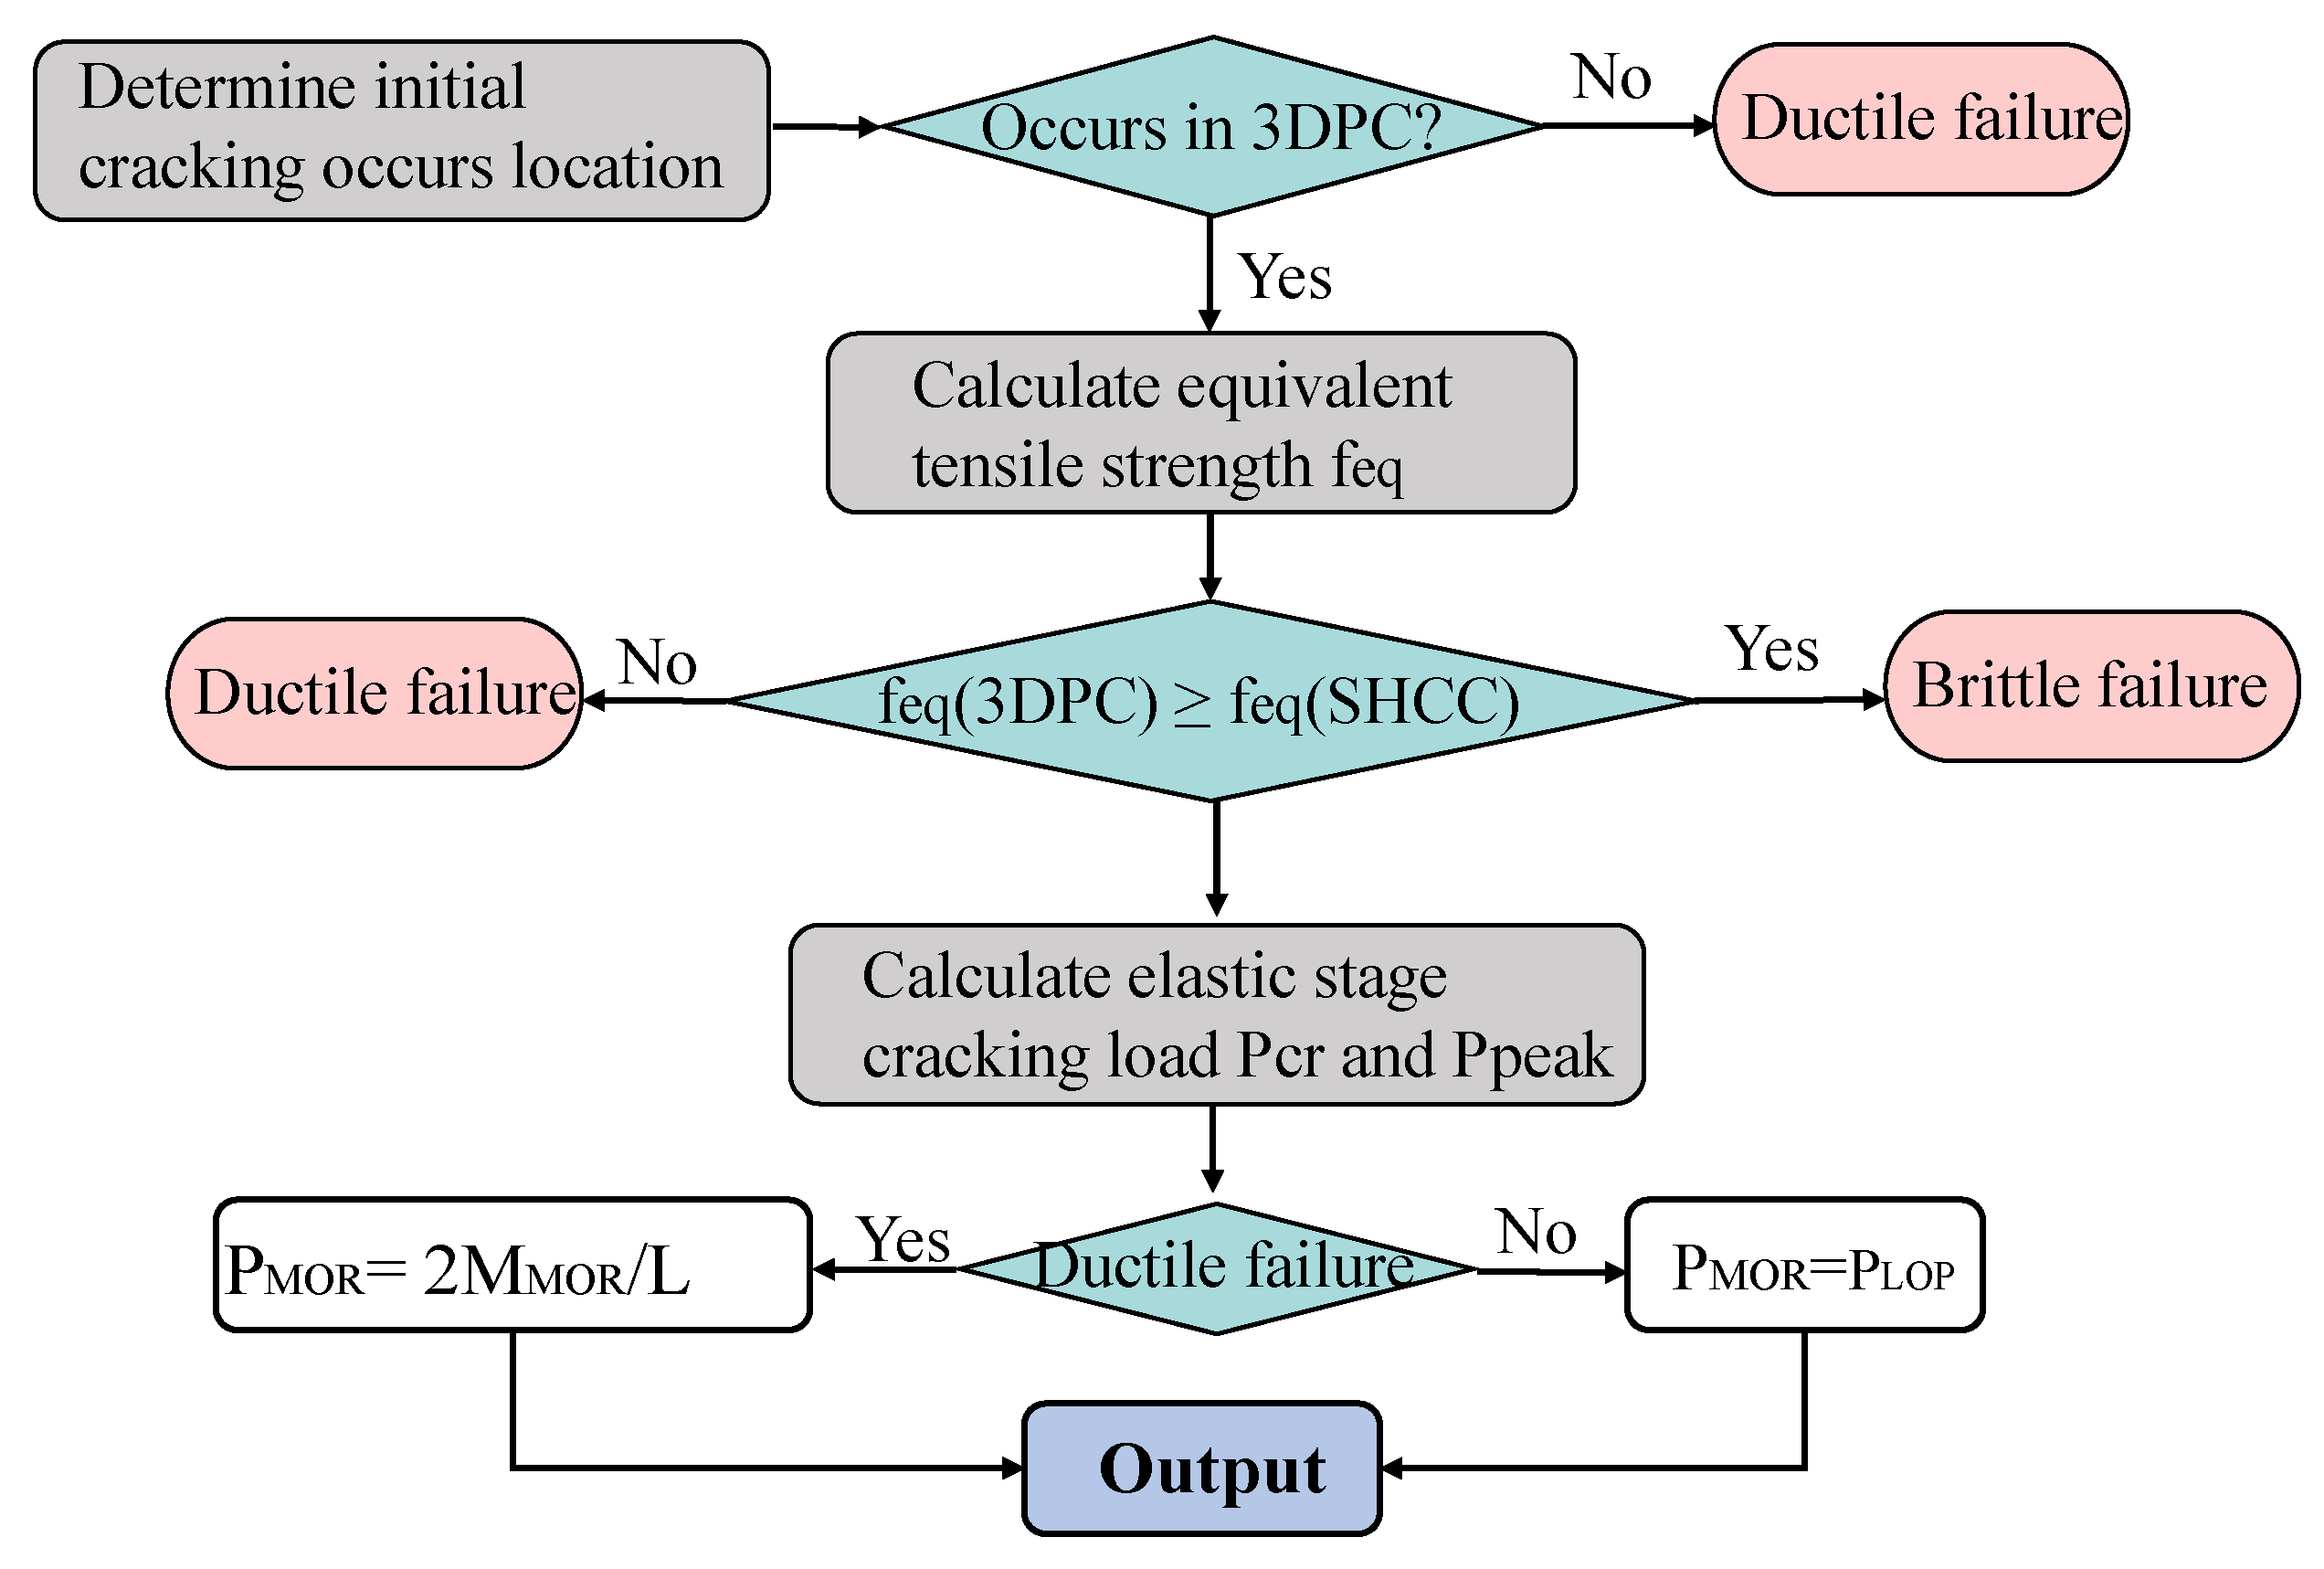
Figure 21.
Stress zones in composite sections under bending loads in the Y- and Z-directions.
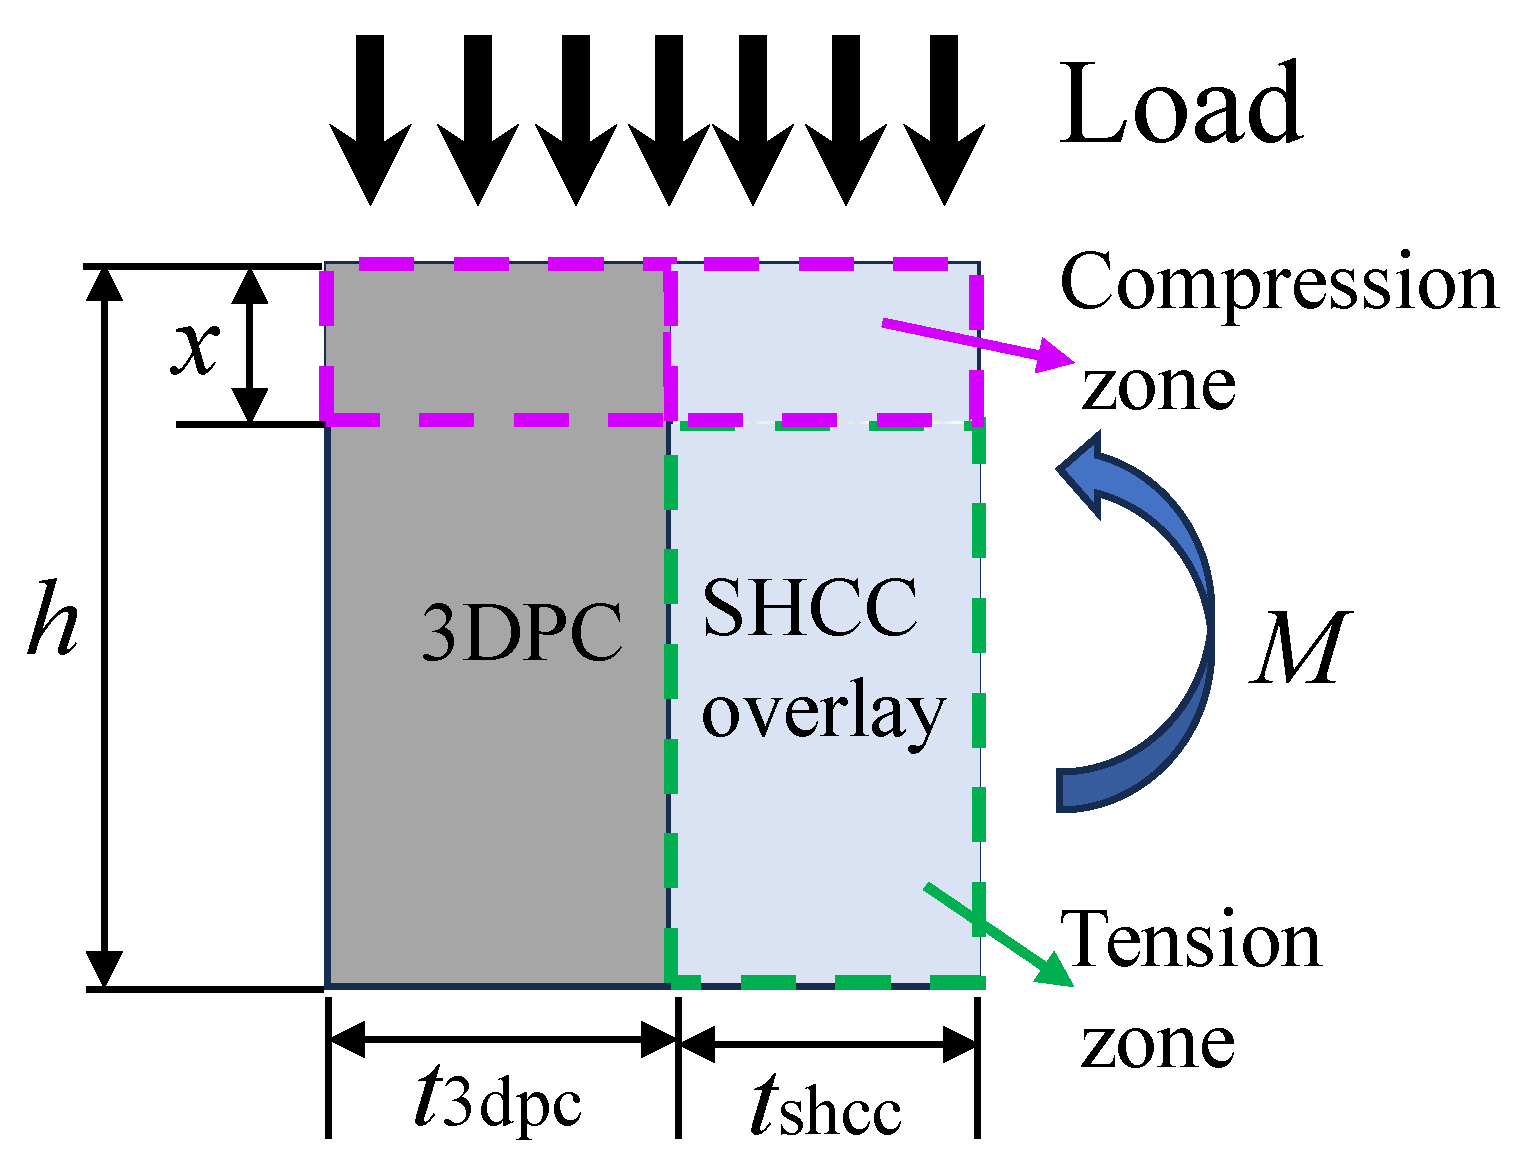
Figure 22.
Predicted versus experimental values of PLOP and PMOR with regression analysis.
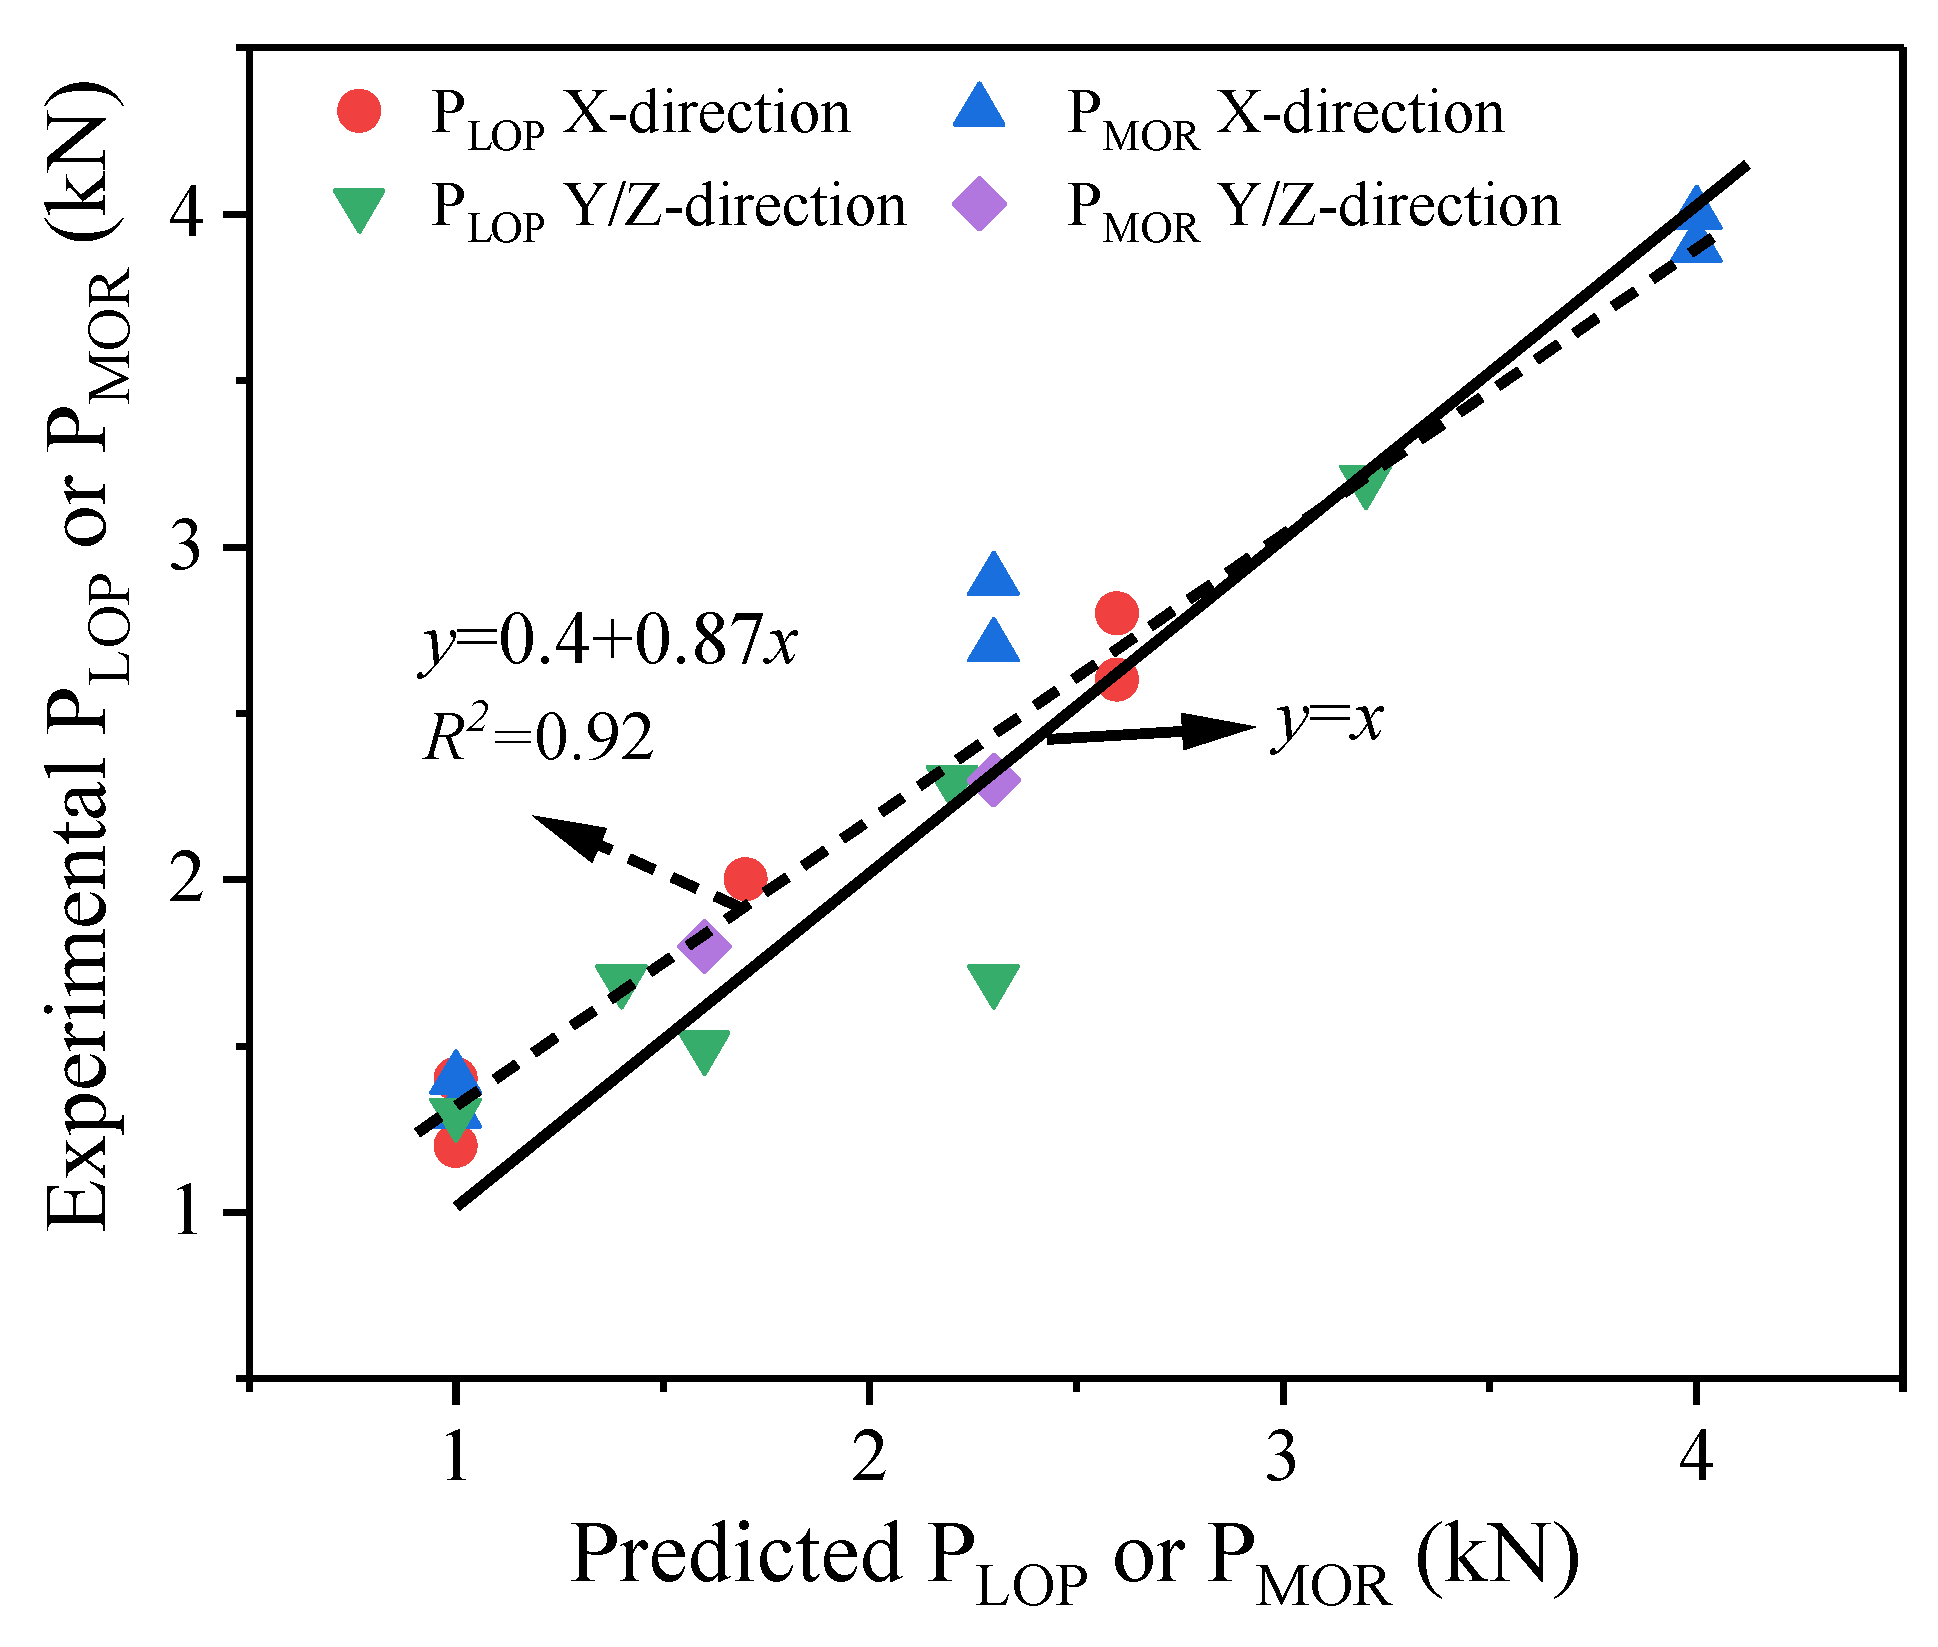

Table 1.
Mixture proportions of 3DPC substrate and S-SHCC overlay.
| Mixture | Cementitious binder | Sand | NC | W/B | SP | CRA | Fiber | ||||
| OPC | FA | SF | Finer sand | Coarser sand | |||||||
| 3DPC | 0.7 | 0.2 | 0.1 | 0.75 | 0.75 | 0.65% | 0.34 | 0.75% | 0.3% | 0.1% | |
| S-SHCC | 0.43 | 0.5 | 0.07 | 0.35 | 0 | 0 | 0.26 | 1% | 0 | 2% | |
Note: All values are mass ratios of the cementitious binder mass, except the fiber content (volume fraction).
Table 2.
Chemical compositions of cementitious materials (wt.%).
| Materials | CaO | SiO2 | MgO | Al2O3 | Fe2O3 | Na2O | K₂O | SO3 | LOI |
| OPC | 63.32 | 20.58 | 2.01 | 5.03 | 3.38 | 0.55 | - | 2.06 | 3.72 |
| SF | 0.16 | 95.53 | 0.18 | 0.60 | 0.24 | - | 1.92 | 0.16 | 0.47 |
| FA | 6.22 | 53.36 | 1.69 | 22.54 | 8.80 | - | 3.00 | 0.45 | 1.96 |
Table 3.
Physical properties of fibers.
| Type | Diameter (μm) | Length (mm) | Tensile strength (MPa) | Elastic modulus (GPa) | Density (kg/m3) | Elongation (%) |
| PP | 17 | 6 | 850 | 8 | 910 | 11.2 |
| PVA | 38 | 6 | 1508 | 42.8 | 1300 | 6.5 |
Table 4.
Details of specimens prepared for mechanical testing.
| Specimen type | Test method | Specimen size (L×W×H mm3) |
No. of specimens | No. of test directions |
| S-SHCC | Compression | 50×50×50 | 4 | 1 |
| Bending | 350×60×13 | 4 | 1 | |
| Cast SHCC | Compression | 50×50×50 | 4 | 1 |
| Bending | 350×60×13 | 4 | 1 | |
| Plain 3DPC | Compression | 40×40×40 | 4 | 3 (X, Y, Z) |
| Bending | 350×40×30 | 4 | 4 (H-X, H-Z, V-X, V-Y) | |
| Reinforced 3DPC | Compression | Varied depending on S-SHCC overlay thickness (see Figure 4 and Figure 5) | 4 | 3 (X, Y, Z) |
| Bending | 4 | 4 (H-X, H-Z, V-X, V-Y) |
Table 5.
Properties of S-SHCC overlay and cast SHCC mixtures.
| Specimens | S-SHCC | Cast SHCC |
| Compressive strength (MPa) | 79.5 ± 1.1 | 85.5 ± 1.1 |
| Modulus of rupture (MPa) | 10.8 ± 1.0 | 10.2 ± 0.4 |
| Deflection at peak flexural load (mm) | 9.9 ± 1.2 | 27.2 ± 1.0 |
| Flexural modulus (GPa) | 25.4 ± 2.2 | 30.8 ± 0.9 |
Table 6.
Load and deflection values of plain and reinforced 3DPC at different stages.
| Samples | Cracking stage | Deflection-hardening stage | Ultimate stage | ||||
| (kN) | (mm) | (kN) | (mm) | (kN) | (mm) | ||
| Plain 3DPC-T0 | H-X | 1.0±0.1 | 0.6±0.05 | — | — | — | — |
| H-Z | 1.7±0.1 | 0.4±0.01 | — | — | — | — | |
| V-X | 0.3±0.01 | 0.3±0.01 | — | — | — | — | |
| V-Y | 0.9±0.2 | 0.3±0.1 | — | — | — | — | |
| Reinforced 3DPC-T10 | H-X | 1.2±0.1 | 0.5±0.1 | 1.4±0.2 | 1.1±0.1 | 1.0±0.2 | 1.1±0.1 |
| H-Z | 1.9±0.2 | 0.5±0.1 | — | — | — | — | |
| V-X | 1.4±0.1 | 0.7±0.2 | — | — | — | — | |
| V-Y | 1.3±0.2 | 0.4±0.05 | — | — | — | — | |
| Reinforced 3DPC-T20 | H-X | 2.0±0.2 | 0.5±0.1 | 2.7±0.2 | 3.2±0.5 | 2.2±0.2 | 3.4±0.5 |
| H-Z | 2.3±0.2 | 0.6±0.1 | — | — | — | — | |
| V-X | 2.0±0.2 | 0.6±0.1 | 2.9±0.2 | 3.3±0.6 | 2.3±0.2 | 3.4±0.6 | |
| V-Y | 1.5±0.1 | 0.4±0.1 | 1.8±0.3 | 1.7±0.4 | 1.4±0.3 | 1.9±0.4 | |
| Reinforced 3DPC-T30 | H-X | 2.6±0.1 | 0.6±0.1 | 4.0±0.3 | 2.7±0.3 | 3.2±0.3 | 2.8±0.3 |
| H-Z | 3.2±0.4 | 0.8±0.1 | — | — | — | — | |
| V-X | 2.8±0.3 | 0.8±0.2 | 3.9±0.1 | 1.7±0.1 | 3.1±0.1 | 1.9±0.1 | |
| V-Y | 1.7±0.1 | 0.5±0.02 | 2.3±0.1 | 1.9±0.2 | 1.9±0.1 | 2.0±0.2 | |
Table 7.
Ductility index of composite structures with deflection-hardening properties.
| Samples | Toughness indices | Residual strength factors | Ductility indices | |||
| I5 | I10 | R5,10 | δMOR/δLOP | δu/δLOP | ||
| Reinforced 3DPC-T10 | H-X | — | — | — | 1.9±0.5 | 2.0±0.5 |
| Reinforced 3DPC-T20 | H-X | 5.6±0.1 | 12.4±0.3 | 134.5±4.4 | 6.5±0.1 | 7.0±0.3 |
| V-X | 5.5±0.2 | 12.0±0.6 | 129.7±7.0 | 5.7±0.1 | 5.8±0.1 | |
| V-Y | 4.5±0.8 | — | — | 2.9±0.8 | 3.2±0.7 | |
| Reinforced 3DPC-T30 | H-X | 5.9±0.1 | — | — | 3.9±0.4 | 3.9±0.5 |
| V-X | — | — | — | 2.5±0.5 | 2.4±0.3 | |
| V-Y | 5.9±0.5 | 12.7±1.2 | 146.4±6.0 | 3.3±0.6 | 3.4±0.6 | |
Table 8.
Comparison between experimental and predicted flexural capacity in X-direction.
| Specimen | Elastic stage (kN) | Peak-load stage (kN) | Spread (%) | ||||
| Exp. (PLOP) | Predict. (PLOP) | Exp. (PMOR) | Predict. (PMOR) | PLOP | PMOR | ||
| Reinforced 3DPC-T10 | H-X | 1.2±0.1 | 1.0 | 1.4±0.2 | 1.0 | 16.7 | 23.1 |
| V-X | 1.4±0.1 | 1.4±0.1 | 28.5 | 28.5 | |||
| Reinforced 3DPC-T20 | H-X | 2.0±0.2 | 1.7 | 2.7±0.2 | 2.3 | 15.0 | 14.8 |
| V-X | 2.0±0.2 | 2.9±0.2 | 15.0 | 20.7 | |||
| Reinforced 3DPC-T30 | H-X | 2.6±0.1 | 2.6 | 4.0±0.3 | 4.0 | 0 | 0 |
| V-X | 2.8±0.3 | 3.9±0.1 | 7.1 | 2.6 | |||
Table 9.
Elastic bending performance comparison under Y- and Z-directions loading.
| Specimen | ft,eq (MPa) | Elastic stage (kN) | Predict failure mode | |||
| ft,eq,3DPC | ft,eq,SHCC | Exp. (PLOP) | Predict. (PLOP) | Spread (%) | ||
| T10-V-Y | 5.6 | 7.2 | 1.3±0.2 | 1.0 | 23.1 | Brittle |
| T20-V-Y | 1.5±0.1 | 1.6 | 6.7 | Ductile | ||
| T30-V-Y | 1.7±0.1 | 2.3 | 29.4 | Ductile | ||
| T10-H-Z | 7.8 | 7.2 | 1.9±0.2 | 1.5 | 28.4 | Brittle |
| T20-H-Z | 2.3±0.2 | 2.2 | 4.3 | Brittle | ||
| T30-H-Z | 3.2±0.4 | 3.2 | 0 | Brittle | ||
Table 10.
Bending performance comparison at peak flexural load under Y- and Z-directions loading.
| Specimen | Peak-load stage (kN) | ||
| Exp. (PMOR) | Predict. (PMOR) | Spread (%) | |
| T20-V-Y | 1.8±0.3 | 1.6 | 13.9 |
| T30-V-Y | 2.3±0.1 | 2.3 | 2.1 |
Disclaimer/Publisher’s Note: The statements, opinions and data contained in all publications are solely those of the individual author(s) and contributor(s) and not of MDPI and/or the editor(s). MDPI and/or the editor(s) disclaim responsibility for any injury to people or property resulting from any ideas, methods, instructions or products referred to in the content. |
© 2026 by the authors. Licensee MDPI, Basel, Switzerland. This article is an open access article distributed under the terms and conditions of the Creative Commons Attribution (CC BY) license.
Copyright: This open access article is published under a Creative Commons CC BY 4.0 license, which permit the free download, distribution, and reuse, provided that the author and preprint are cited in any reuse.