

Submitted:
23 March 2026
Posted:
24 March 2026
You are already at the latest version
Abstract
Large-scale population surveys provide valuable information for studying child well-being, yet their structure often limits direct application of machine learning methods. The National Survey of Children’s Health (NSCH) is one of the most comprehensive datasets for monitoring children’s health and development in the United States, but the raw survey files contain skip patterns, categorical variables, and complex survey design elements that require substantial preprocessing before predictive analysis can be performed. This study presents a curated machine-learning-ready dataset derived from the 2023 NSCH survey together with a fully reproducible computational pipeline for studying child flourishing. The pipeline constructs a binary flourishing indicator based on four survey items capturing curiosity, persistence, emotional regulation, and engagement in learning. After removing skip codes and missing responses, 1,978 valid observations were retained from the original dataset of more than 55,000 records. Feature selection using mutual information was applied to produce a reduced set of interpretable predictors suitable for benchmarking and educational use. Baseline experiments using logistic regression and random forest models show moderate predictive performance, suggesting that child flourishing cannot be accurately predicted using demographic and household variables alone. A methodological comparison between weighted and unweighted models further shows that incorporating survey weights consistently reduces predictive performance. By releasing both the curated dataset and the reproducible pipeline, this study provides a reusable resource for machine learning research on child well-being.
Keywords:
child flourishing
; National Survey of Children’s Health
; machine-learning-ready dataset
; reproducible research
; survey data
; survey weighting
; interpretable machine learning
; feature selection
; public health data
1. Introduction
Understanding the factors that influence child well-being has become an important research priority in public health, developmental psychology, and social policy. Beyond traditional measures of physical health, recent research has increasingly emphasized the concept of child flourishing, which captures positive developmental outcomes such as curiosity, persistence, emotional regulation, and engagement in learning activities. Flourishing indicators aim to measure whether children are developing the social, emotional, and behavioral capacities necessary for long-term well-being and successful life trajectories [1,2].
Large-scale population surveys provide a valuable source of information for studying child well-being. One of the most comprehensive data sources in the United States is the National Survey of Children’s Health (NSCH), which collects nationally representative information about children’s physical health, emotional development, family environments, and access to healthcare services. The survey is conducted annually by the U.S. Census Bureau and funded by the Health Resources and Services Administration (HRSA), and it has been widely used in research on child health disparities and developmental outcomes [3].
Although surveys such as the NSCH contain rich information about children’s lives, they are primarily designed for epidemiological and policy research rather than for machine learning applications. Raw survey datasets typically include skip codes, complex sampling structures, and large numbers of categorical variables that require extensive preprocessing before predictive modeling can be performed. As a result, applying machine learning methods to survey data often requires substantial data preparation and methodological decisions that are rarely documented in detail.
At the same time, the increasing availability of large-scale social datasets has created new opportunities for applying machine learning techniques to the study of human development and well-being. Machine learning methods have been widely used for predictive modeling across a variety of domains, including healthcare, education, and social sciences [4]. However, their application to survey-based datasets raises several methodological challenges. In particular, researchers must decide how to handle survey weights, how to construct predictive outcomes from survey items, and how to transform complex survey structures into machine-learning-compatible datasets.
Another important challenge concerns reproducibility. In recent years, concerns about reproducibility have become increasingly prominent in computational science and data-driven research. Reproducible research practices require that datasets, analytical pipelines, and computational procedures be transparently documented so that other researchers can replicate the results of a study [5,6]. Despite the growing importance of reproducibility, many studies using large survey datasets provide limited documentation of the data preparation steps required to obtain analytical datasets suitable for machine learning.
The present study addresses these challenges by constructing a machine-learning-ready dataset derived from the 2023 National Survey of Children’s Health and by providing a fully reproducible pipeline for generating the dataset and performing baseline predictive analyses. The study focuses specifically on the construction and prediction of a child flourishing indicator derived from four survey items measuring curiosity, persistence, emotional regulation, and engagement in learning.
In contrast to studies that focus primarily on developing new predictive algorithms, this work emphasizes the creation of reproducible data resources for computational research. Transforming complex survey datasets into machine-learning-ready formats can substantially reduce the barriers faced by researchers who wish to apply data-driven methods to questions related to child well-being.
More specifically, this study makes three main contributions.
- 1.
- Reproducible construction of a child flourishing indicator.
- 2.
- Release of a machine-learning-ready dataset.
- 3.
- A curated subset of predictive variables suitable for interpretable machine learning and benchmarking.
In addition to these contributions, the curated dataset preserves geographic identifiers that allow descriptive exploration of regional variation in child flourishing across U.S. states. Although the geographic analysis presented in this study is exploratory, it illustrates the analytical flexibility enabled by the released dataset.
The remainder of the paper is organized as follows. Section II describes the methodological framework used to construct the dataset and implement the reproducible pipeline. Section III provides a detailed description of the curated dataset and the construction of the flourishing indicator. Section IV presents the results of the baseline machine learning experiments and the methodological comparison between weighted and unweighted models. Section V discusses the implications of the findings for research on child well-being and machine learning applied to survey data. Finally, Section VI concludes the paper and outlines directions for future research.
2. Methodology
This study develops a reproducible machine-learning framework for analyzing child flourishing using the 2023 National Survey of Children’s Health (NSCH). The methodological pipeline includes dataset construction, feature selection, predictive modeling, and additional geographic enrichment. All steps were implemented through a reproducible computational workflow that transforms the original survey data into a machine-learning-ready dataset and automatically generates the tables and figures used in the article.
2.1. Data Source
The data used in this study come from the publicly available National Survey of Children’s Health (NSCH) 2023 dataset. The dataset was downloaded from the Child and Adolescent Health Measurement Initiative (CAHMI) Data Resource Center for Child and Adolescent Health website (https://www.childhealthdata.org), which provides public access to NSCH survey data and documentation. The specific file used in this study was NSCH_2023e_Topical_CAHMI_DRC.csv, obtained from the CAHMI Data Resource Center portal.
The empirical analysis is based on the 2023 wave of the National Survey of Children’s Health (NSCH), a nationally representative survey conducted annually in the United States to monitor multiple dimensions of child health and well-being. The NSCH is administered by the U.S. Census Bureau and funded by the Health Resources and Services Administration (HRSA). The survey collects information from parents or guardians about children aged 0–17 years and includes variables related to health status, emotional well-being, family characteristics, healthcare access, and social context [3,7].
The original dataset contains more than 55,000 observations. However, several survey items are only asked for specific age groups, and certain responses correspond to skip codes or missing values. As a result, careful filtering is required before constructing analytical variables derived from these items.
2.2. Construction of the Child Flourishing Indicator
Child flourishing was operationalized using four survey questions commonly used in the NSCH literature to capture positive aspects of child well-being. These items correspond to variables K2Q35A, K2Q35B, K2Q35C, and K2Q35D, which measure behaviors related to curiosity, persistence, emotional regulation, and engagement in learning activities.
Following established approaches in the literature on child well-being measurement [1,2], we constructed a binary indicator called flourishing_all4. The indicator takes the value 1 when the child is reported as responding “Always” or “Usually” to all four items, and 0 otherwise. This operationalization captures children who consistently display positive developmental behaviors across multiple domains.
After removing skip codes and missing responses (coded as 95 and 99 in the survey), 1,978 valid observations remained for constructing the flourishing indicator. Among these observations, 914 children satisfied the flourishing condition while 1,064 did not. The resulting dataset is therefore relatively balanced, which is advantageous for machine learning classification tasks (see Table 2).
2.3. Dataset Preparation and Filtering
The dataset preparation process involved several stages designed to ensure analytical consistency and reproducibility. First, raw NSCH data were cleaned to remove observations with invalid responses for the flourishing items. Second, categorical survey variables were encoded into machine-learning-compatible representations. Third, a curated subset of explanatory variables describing household characteristics, socioeconomic conditions, and demographic attributes was selected.
Although the original NSCH dataset contains thousands of variables, many are redundant, highly sparse, or not suitable for predictive modeling. Reducing the dimensionality of the dataset improves interpretability and reduces the risk of overfitting in predictive models [4].
The final analytical dataset therefore represents a curated subset of variables selected for their relevance to child well-being and their suitability for reproducible machine-learning analysis.
2.4. Feature Selection and Interpretable Dataset Construction
To facilitate interpretable machine learning experiments, we constructed a reduced dataset containing only the most informative variables. Feature relevance was evaluated using mutual information, a nonparametric measure of statistical dependency that quantifies the information shared between predictor variables and the target outcome [8].
Mutual information has been widely used in feature selection for classification problems because it captures both linear and nonlinear relationships between variables. Variables with the highest mutual information scores with respect to the flourishing indicator were retained to construct a curated dataset suitable for interpretable modeling.
This reduced dataset allows researchers to reproduce the results of this study using a smaller and more interpretable set of predictors, facilitating future benchmarking studies and educational applications.
To evaluate potential multicollinearity among the selected predictors, we computed a correlation matrix for the variables included in the strict feature subset and visualized it using a correlation heatmap (Figure 1).
The heatmap shows that most pairwise correlations between predictors are relatively low, with only a small number of moderate associations. This result indicates that the reduced dataset does not contain highly redundant variables and therefore provides a suitable feature set for interpretable machine learning models such as logistic regression. Reducing multicollinearity is important because strongly correlated predictors can destabilize model coefficients and complicate interpretation [9].
The reduced feature subset therefore provides a compact yet informative representation of the survey data suitable for benchmarking interpretable machine learning models.
2.5. Machine Learning Models
Two baseline machine learning models were implemented to evaluate the predictability of the flourishing indicator: logistic regression and random forest classifiers.
Logistic regression is a widely used statistical learning method for binary classification and provides interpretable coefficients describing the relationship between predictors and the outcome variable [10]. Random forests are ensemble learning methods that combine multiple decision trees to improve predictive performance and robustness against overfitting [11].
The models were evaluated using standard classification metrics, including accuracy, F1-score, and the area under the receiver operating characteristic curve (ROC-AUC). These metrics provide complementary perspectives on model performance and are commonly used in machine learning evaluations [12].
2.6. Survey Weighting Experiment
A key methodological question addressed in this study concerns the role of survey weights in machine learning models trained on complex survey data. Survey weights are designed to ensure that statistical estimates are representative of the underlying population by correcting for sampling design and nonresponse bias [13].
However, the objectives of predictive modeling differ from those of population inference. While survey weights improve population representativeness, they may introduce additional variance that reduces predictive performance when used in machine learning models.
To examine this issue empirically, we trained both logistic regression and random forest models under two conditions: with and without survey weights. The results provide an empirical comparison of weighted and unweighted machine learning approaches when applied to large-scale population surveys.
2.7. Geographic Enrichment of the Dataset
The curated dataset preserves the variable FIPSST, which identifies the U.S. state associated with each observation. Retaining this geographic identifier allows for descriptive analyses of spatial heterogeneity in child flourishing rates across states.
Although the sample size within individual states becomes limited after filtering the dataset to valid flourishing responses, the inclusion of geographic information enhances the analytical flexibility of the dataset and enables exploratory analyses of regional patterns in child well-being.
2.8. Reproducible Research Pipeline
All data preparation, feature selection, model training, and table generation procedures were implemented through a structured Python pipeline composed of modular scripts. The pipeline automatically performs dataset cleaning, feature selection, model evaluation, and LaTeX export of tables and figures.
Reproducibility is a fundamental principle of modern computational research. Providing transparent and reproducible data processing workflows improves scientific reliability and facilitates the reuse of research outputs by other scholars [5,6]. The automated pipeline developed in this study ensures that the results reported in the paper can be regenerated directly from the original dataset using the provided scripts.
3. Data Description
This study is based on the 2023 wave of the National Survey of Children’s Health (NSCH), a large-scale nationally representative survey designed to monitor the health and well-being of children in the United States. The NSCH collects information from parents or guardians regarding children’s physical health, mental health, social environment, and family characteristics. The survey is conducted annually by the U.S. Census Bureau and sponsored by the Health Resources and Services Administration (HRSA) [3,7].
The original NSCH 2023 dataset contains 55,162 observations and several hundred variables covering demographic, socioeconomic, healthcare, and behavioral aspects of children’s lives. However, the survey was designed primarily for epidemiological and population health research rather than machine learning applications. As a consequence, the dataset contains skip codes, complex survey design variables, and large numbers of categorical variables that require preprocessing before predictive modeling can be performed.
3.1. Construction of the Flourishing Outcome
A central objective of this study is the reproducible construction of a child flourishing indicator derived from the NSCH questionnaire. The indicator is based on four survey items measuring positive developmental behaviors:
- K2Q35A: Shows interest and curiosity in learning new things
- K2Q35B: Works to finish tasks that he or she starts
- K2Q35C: Stays calm and in control when faced with challenges
- K2Q35D: Shows interest in doing well in school
These items have been widely used in previous studies to operationalize aspects of positive child development and flourishing [1,2]. Following established practices in the literature, we constructed a binary outcome variable called flourishing_all4. A child is classified as flourishing if the responses to all four items are reported as either “Always” or “Usually.”
Because the NSCH questionnaire uses numeric codes for nonresponse and skip patterns, responses coded as 95 (skip) or 99 (missing) were removed prior to constructing the indicator. After applying this filtering step, 1,978 valid observations remained for constructing the flourishing outcome.
Within this filtered subset, 914 children satisfied the flourishing condition while 1,064 did not. The resulting dataset is therefore moderately balanced, which is advantageous for machine learning classification tasks.
3.2. Dataset Reduction and Cleaning
Although the original NSCH dataset contains a large number of variables, many of them are not directly suitable for machine learning analysis. In particular, the dataset includes highly sparse variables, survey routing variables, and features with limited analytical relevance.
To address these challenges, we constructed a curated dataset through a systematic preprocessing pipeline. The pipeline performs the following steps:
- 1.
- Removal of observations with invalid responses for the flourishing items.
- 2.
- Encoding of categorical variables into machine-learning-compatible representations.
- 3.
- Retention of variables related to demographic, household, and socioeconomic characteristics.
- 4.
- Preservation of complex survey design variables for potential methodological analyses.
Through this process, the dataset was reduced from the original 55,162 observations to a filtered analytical subset of 1,978 children with valid flourishing responses. At the same time, the number of variables was reduced to a set suitable for machine learning analysis while maintaining relevant contextual information.
The final curated dataset contains demographic variables, household characteristics, survey design variables, and the derived flourishing indicator. This transformation converts a complex epidemiological survey into a dataset suitable for reproducible machine learning experiments.
3.3. Machine-Learning-Ready Dataset
One of the primary contributions of this work is the release of a machine-learning-ready dataset derived from the NSCH survey. The dataset is exported as:
nsch_2023_flourishing_ml_ready.csv
This dataset includes the following key variables:
- child_id: unique identifier for each observation
- flourishing_all4: binary flourishing outcome
- FWC: survey sampling weight
- STRATUM: survey stratification variable
- FIPSST: state-level geographic identifier
- demographic and household predictor variables
Providing a machine-learning-ready dataset substantially lowers the barrier for researchers interested in applying predictive models to child well-being data. In contrast to the raw NSCH survey files, which require extensive preprocessing, the curated dataset can be used directly for statistical modeling and machine learning experiments.
3.4. Geographic Information
The dataset preserves the variable FIPSST, which identifies the U.S. state associated with each observation. Although geographic analysis is not the primary objective of the present study, retaining this variable enables descriptive exploration of spatial heterogeneity in child flourishing.
Preserving geographic identifiers increases the analytical flexibility of the dataset and allows future studies to examine regional patterns in child well-being, social determinants of health, and policy differences across states.
3.5. Dataset Availability and Reproducibility
Another key contribution of this work is the development of a fully reproducible data preparation pipeline. The curated dataset is not produced manually; instead, it is generated automatically through a sequence of Python scripts that perform dataset preparation, feature selection, model training, and table generation.
Reproducibility is increasingly recognized as a fundamental requirement in computational science and data-driven research [5,6]. By releasing both the processed dataset and the scripts used to generate it, this work enables other researchers to reproduce the entire data preparation workflow and extend the analysis in future studies.
The curated dataset and the complete reproducible pipeline used in this study are publicly available in the project repository: https://github.com/miguelarcosa/NSCH-CuratedDataSet. The repository contains the scripts used for dataset preparation, feature selection, machine learning experiments, and automatic generation of tables and figures reported in this article. Providing the full computational workflow together with the processed dataset enables other researchers to reproduce the analytical pipeline and extend the experiments presented in this study.
Taken together, the curated dataset and reproducible pipeline transform the NSCH survey into a resource that can be directly used for machine learning research on child flourishing and well-being.
4. Results
This section presents the empirical results obtained from the curated NSCH-derived dataset and the reproducible machine learning pipeline described in the previous sections. The results are organized into four main components: (i) descriptive characteristics of the curated dataset, (ii) baseline machine learning performance for predicting child flourishing, (iii) methodological comparison between weighted and unweighted models, and (iv) geographic descriptive enrichment of the dataset.
4.1. Dataset Characteristics
The dataset construction pipeline transformed the original NSCH 2023 dataset into a curated analytical dataset suitable for machine learning applications. Figure 2 illustrates the filtering and preparation process that produced the final machine-learning-ready dataset.
The original NSCH dataset contains 55,162 observations. However, the flourishing items are only asked for specific age groups, and responses include skip codes and missing values that must be removed prior to analysis. After filtering invalid responses for the four flourishing items, 1,978 valid observations remained. These observations constitute the analytical dataset used in the predictive modeling experiments.
Within this filtered subset, 914 children satisfied the flourishing condition and 1,064 did not. This moderate class balance is beneficial for classification tasks because it reduces the risk of extreme class imbalance affecting model performance.
Table 1 summarizes the key characteristics of the curated dataset used in this study.

Table 1.
Descriptive statistics of key variables in the selected dataset.
| statistic | flourishing_all4 | FWC | STRATUM | FIPSST |
|---|---|---|---|---|
| count | 1978.0000 | 1978.0000 | 1978.0000 | 1978.0000 |
| mean | 0.4621 | 1275.6532 | 1.0440 | 26.9853 |
| std | 0.4987 | 2337.4438 | 0.2051 | 15.6405 |
| min | 0.0000 | 20.0381 | 1.0000 | 1.0000 |
| max | 1.0000 | 53312.8662 | 2.0000 | 56.0000 |
Table 2.
Distribution of the target variable flourishing_all4.
| flourishing_all4 | count | proportion |
|---|---|---|
| 0 | 1064 | 0.5379 |
| 1 | 914 | 0.4621 |
Although the original NSCH dataset contains hundreds of variables, only a subset of predictors relevant to household characteristics, demographic attributes, and contextual conditions was retained for machine learning analysis. This reduction improves interpretability while preserving the core contextual variables associated with child well-being.
4.2. Feature Selection Results
To construct an interpretable machine learning dataset, feature relevance was evaluated using mutual information scores between candidate predictors and the flourishing outcome variable. Mutual information measures statistical dependency between variables and can capture both linear and nonlinear relationships [8].
Table 3 presents the variables selected through this procedure.
The selected features include demographic characteristics, family context indicators, and socioeconomic variables. These predictors align with existing research showing that child well-being is influenced by a combination of household, social, and environmental factors rather than by purely medical variables [1,2].
The feature selection step produces a reduced dataset that is more suitable for interpretable machine learning experiments and reproducible benchmarking.
4.3. Baseline Machine Learning Performance
To evaluate the predictive potential of the curated dataset, two baseline machine learning models were implemented: logistic regression and random forest classifiers. These models were selected because they represent widely used baseline approaches in predictive modeling and provide complementary perspectives on model performance [4,11].
Table 4 reports the performance of the models using accuracy, F1-score, and ROC-AUC metrics.
The results indicate moderate predictive performance for both models. Logistic regression achieved an ROC-AUC of 0.628 when trained without survey weights, while the random forest model achieved an ROC-AUC of 0.571 under the same conditions.
Interestingly, the simpler logistic regression model slightly outperformed the more complex random forest model. This suggests that the relationship between the available predictors and the flourishing outcome may be relatively linear or that the predictive signal contained in the household variables is inherently limited.
From a substantive perspective, these results indicate that child flourishing is difficult to predict using demographic and household variables alone. Flourishing is a multidimensional concept influenced by emotional, social, educational, and environmental factors [1]. Consequently, moderate predictive performance is consistent with the complex nature of the underlying phenomenon.
4.4. Effect of Survey Weighting on Predictive Performance
A central methodological contribution of this study is the comparison between weighted and unweighted machine learning models trained on complex survey data. Survey weights are typically used in statistical analysis to ensure population representativeness and correct for sampling design and nonresponse bias [13].
However, predictive modeling and population inference pursue different objectives. While survey weights improve the representativeness of statistical estimates, they may introduce additional variance that can negatively affect predictive optimization in machine learning models.
Table 5 presents the comparison between weighted and unweighted models.
Across all experiments, models trained without survey weights achieved higher predictive performance. For example, logistic regression obtained an ROC-AUC of 0.628 without weights, compared with 0.567 when survey weights were incorporated. A similar pattern was observed for the random forest model.
These results provide empirical evidence that incorporating survey weights can reduce predictive performance in machine learning models trained on complex survey data. This phenomenon has been observed in previous studies comparing predictive modeling and design-based inference approaches [13].
The findings highlight an important methodological distinction: while survey weights improve population representativeness, they may reduce classification accuracy in machine learning tasks. Researchers applying machine learning methods to survey datasets must therefore carefully consider the trade-off between predictive performance and population representativeness.
4.5. Geographic Variation in Child Flourishing
The curated dataset preserves the state-level geographic identifier FIPSST, enabling exploratory analysis of spatial variation in child flourishing. Table 6 reports the ten states with the highest flourishing rates observed in the filtered analytical sample.
The highest flourishing rates were observed in Virginia (0.6333), Tennessee (0.6316), and Alaska (0.6296). Other states with comparatively high rates include Oregon, Hawaii, Massachusetts, North Dakota, Washington, New Jersey, and Alabama.
These results suggest that child flourishing is not uniformly distributed across geographic contexts. Even within the reduced subset of valid observations, meaningful variation across states can be observed.
Nevertheless, these geographic results should be interpreted as descriptive rather than causal. Because the analytical sample includes only observations with valid flourishing responses, the number of observations per state is relatively small in several cases. The geographic analysis is therefore intended to illustrate the additional analytical potential of preserving state identifiers in the curated dataset rather than to support strong causal conclusions.
Overall, the geographic enrichment demonstrates how the released dataset can support additional exploratory analyses beyond the baseline predictive experiments presented in this study.
5. Discussion
The objective of this study was not to introduce a new machine learning algorithm, but rather to construct a reproducible dataset and analytical pipeline for studying child flourishing using the 2023 National Survey of Children’s Health (NSCH). The results presented in the previous sections provide several insights regarding the predictability of child flourishing, the methodological implications of applying machine learning to survey data, and the value of releasing curated datasets for computational research.
5.1. Predictability of Child Flourishing
One of the most notable findings of this study is the moderate predictive performance achieved by the baseline models. Logistic regression achieved a maximum ROC-AUC of 0.628, while the random forest model achieved a slightly lower performance.
From a purely predictive perspective, these values indicate that child flourishing cannot be accurately predicted using the demographic and household variables available in the dataset. However, this result is not unexpected. Child flourishing is widely understood as a multidimensional construct influenced by emotional development, family environment, educational context, and broader social conditions [1,2,14].
Many of these factors are not fully captured by household-level survey variables. As a consequence, even well-established machine learning models are limited in their ability to predict flourishing outcomes. The moderate predictive performance observed in this study therefore reinforces the idea that child well-being is a complex phenomenon that cannot be reduced to a small set of demographic predictors.
5.2. Machine Learning and Survey Data
A second important contribution of this study concerns the interaction between machine learning models and complex survey data. The NSCH survey was designed for population-level statistical inference rather than predictive modeling [3].
The results show that incorporating survey weights consistently reduced predictive performance across all models evaluated in this study. Logistic regression experienced a decrease in ROC-AUC from 0.628 to 0.567 when weights were applied, while similar reductions were observed for random forest models.
This result highlights an important methodological distinction between two analytical objectives. In survey statistics, weights are used to ensure that estimates are representative of the underlying population. In predictive modeling, however, the objective is to optimize classification accuracy rather than to estimate population parameters.
Because survey weights introduce additional variance into the estimation process, they may reduce predictive performance when used in machine learning models. Similar methodological tensions between design-based inference and predictive modeling have been discussed in the literature on survey methodology and applied statistics [13,16].
The empirical comparison presented in this study therefore contributes to a growing discussion on how machine learning methods should be applied to large-scale population surveys.
5.3. Value of a Machine-Learning-Ready Survey Dataset
A central contribution of this work is the release of a curated machine-learning-ready dataset derived from the NSCH survey. Although the original NSCH dataset is a valuable resource for epidemiological research, its structure is not optimized for machine learning applications.
Transforming complex datasets into reusable research resources is increasingly recognized as a key contribution in data-driven science [5]. The dataset released in this study addresses several practical challenges commonly encountered when applying machine learning to survey data, including the presence of skip codes, the need for preprocessing of categorical variables, and the absence of predefined predictive outcomes.
By documenting the construction of the flourishing indicator and releasing the processed dataset together with a reproducible pipeline, this study transforms a complex epidemiological survey into a resource that can be directly used in machine learning research.
Reproducibility has become an increasingly important principle in computational science, particularly in fields that rely on large-scale data analysis [5,6]. Providing both the processed dataset and the scripts used to generate it enables other researchers to reproduce the results of this study and extend the analysis in future work.
5.4. Geographic Variation in Child Flourishing
The descriptive geographic analysis conducted in this study illustrates an additional advantage of preserving contextual variables within the curated dataset. Even after filtering the dataset to observations with valid flourishing responses, meaningful variation across U.S. states remains visible.
Previous research has shown that child health and developmental outcomes vary substantially across geographic contexts due to differences in socioeconomic conditions, healthcare access, and educational environments [17,18].
Although the sample size within individual states is relatively small, the geographic variation observed in the results suggests that child flourishing may be influenced not only by household characteristics but also by broader contextual factors such as educational environments, community resources, and socioeconomic conditions.
The inclusion of the FIPSST variable therefore increases the analytical flexibility of the dataset and opens opportunities for future research exploring regional disparities in child well-being.
5.5. Limitations
Several limitations should be considered when interpreting the results of this study. First, the analytical dataset contains only 1,978 observations after filtering the flourishing items. Although this filtering step follows the survey design and is consistent with previous NSCH-based studies [3], it reduces the available sample size for predictive modeling.
Second, the predictor variables used in this study are limited to demographic and household characteristics available in the survey. Important determinants of child flourishing, such as school environment, peer relationships, and psychological factors, are not fully captured by these variables.
Third, the geographic analysis presented in this study is descriptive rather than inferential. Because the number of observations per state is limited, the results should not be interpreted as evidence of causal differences in flourishing rates across regions.
5.6. Future Research
The dataset and reproducible pipeline introduced in this study open several avenues for future research. First, researchers may apply additional machine learning models, including gradient boosting methods or neural networks, to evaluate whether more complex algorithms improve predictive performance [4].
Second, future studies could integrate additional contextual datasets, such as regional socioeconomic indicators or education statistics, in order to better capture the environmental determinants of child flourishing.
Finally, the dataset may serve as a benchmark for interpretable machine learning research in the domain of child well-being. Because the flourishing indicator is derived from well-established survey items and the dataset includes a manageable number of predictors, it provides a suitable testbed for evaluating interpretable predictive models.
6. Conclusions
This study presents a reproducible machine-learning-ready dataset derived from the 2023 National Survey of Children’s Health (NSCH) together with a transparent computational pipeline for studying child flourishing. The work addresses an important gap between large-scale population surveys and machine learning research by transforming a complex epidemiological dataset into a format that can be directly used for predictive modeling and computational analysis.
A key contribution of the study is the reproducible construction of a child flourishing indicator derived from four survey items measuring curiosity, persistence, emotional regulation, and engagement in learning. Because the NSCH dataset was originally designed for population health monitoring rather than machine learning applications, constructing a predictive outcome requires careful treatment of survey-specific response codes and filtering procedures. By documenting these steps and providing a standardized definition of the flourishing indicator, this work facilitates consistent future analyses of child well-being using NSCH data.
The study also releases a curated machine-learning-ready dataset that includes the flourishing outcome, relevant demographic and household predictors, and key survey design variables. Converting a complex survey dataset into a machine-learning-ready resource substantially reduces the barriers faced by researchers who wish to apply predictive models to child well-being data. In addition, the curated dataset preserves geographic identifiers that enable exploratory analyses of regional variation in flourishing outcomes.
Another contribution of the study is the development of a fully reproducible computational pipeline that performs dataset preparation, feature selection, model training, and automatic export of tables and figures used in the paper. Reproducibility is increasingly recognized as a fundamental requirement for reliable computational research [5,6]. By releasing both the processed dataset and the scripts required to regenerate the analytical results, this study supports transparent and replicable research practices.
The baseline machine learning experiments reported in this study show that child flourishing is difficult to predict using demographic and household variables alone. The moderate predictive performance obtained by the evaluated models suggests that flourishing is a multidimensional phenomenon influenced by a wide range of social, emotional, and environmental factors. These findings are consistent with existing research emphasizing the complexity of child well-being and the limitations of purely demographic predictors [1,2].
The methodological comparison between weighted and unweighted models provides an additional insight into the interaction between machine learning methods and complex survey data. The results indicate that incorporating survey weights consistently reduced predictive performance across the evaluated models. This finding highlights an important methodological distinction between predictive modeling and design-based statistical inference. While survey weights improve population representativeness, they may negatively affect classification accuracy in machine learning tasks.
Taken together, the curated dataset, reproducible pipeline, and baseline modeling results presented in this study provide a foundation for future computational research on child flourishing. The released dataset can serve as a benchmark for evaluating predictive models, exploring interpretable machine learning approaches, and integrating additional contextual datasets related to education, health, and socioeconomic conditions.
Future work may extend this research in several directions. Researchers may explore additional machine learning algorithms, incorporate external contextual datasets, or investigate causal relationships between household conditions and flourishing outcomes. The dataset may also support interdisciplinary research combining public health, social science, and machine learning methods.
By transforming the NSCH survey into a machine-learning-ready resource and documenting the full analytical workflow, this study contributes to the development of open and reproducible data resources for studying child well-being.
Author Contributions
Methodology, validation, investigation, and data curation, M.A.-A. and R.B.; conceptualization, writing—original draft preparation, F.P and K.N.-A. All authors have read and agreed to the published version of the manuscript.
Funding
This research was funded and supported by Universidad Politécnica Salesiana.
Data Availability Statement
The raw data used in this study are publicly available from the National Survey of Children’s Health (NSCH) repository. The processed machine-learning-ready dataset generated in this study is available in the project repository. The curated dataset and the complete reproducible pipeline used in this study are publicly available in the project repository: https://github.com/miguelarcosa/NSCH-CuratedDataSet.
Conflicts of Interest
The authors declare no conflicts of interest.
References
- Moore, K.A.; Lippman, L.H. Indicators of Child Well-Being: The State of the Field. Child Indicators Research 2015, 8, 1–13. [Google Scholar] [CrossRef]
- Bethell, C.D.; Gombojav, N.; Whitaker, R.C. Positive Childhood Experiences and Adult Mental Health. JAMA Pediatrics 2019, 173, e193007. [Google Scholar] [CrossRef] [PubMed]
- Ghandour, R.M.; Sherman, L.J.; Vladutiu, C.J.; Ali, M.M.; Lynch, S.E.; Bitsko, H.B.; Blumberg, S.J. Prevalence and Treatment of Depression, Anxiety, and Conduct Problems in US Children. The Journal of Pediatrics 2019, 206, 256–267.e3. [Google Scholar] [CrossRef] [PubMed]
- Hastie, T.; Tibshirani, R.; Friedman, J. The Elements of Statistical Learning: Data Mining, Inference, and Prediction, second ed.; Springer: New York, NY, 2009. [Google Scholar]
- Peng, R.D. Reproducible Research in Computational Science. Science 2011, 334, 1226–1227. [Google Scholar] [CrossRef] [PubMed]
- Sandve, G.K.; Nekrutenko, A.; Taylor, J.; Hovig, E. Ten Simple Rules for Reproducible Computational Research. PLoS Computational Biology 2013, 9, e1003285. [Google Scholar] [CrossRef] [PubMed]
- U.S. Department of Health and Human Services; Health Resources and Services Administration (HRSA); Maternal and Child Health Bureau. National Survey of Children’s Health (NSCH) 2023. Data Resource Center for Child and Adolescent Health, 2023. Data Resource Center for Child and Adolescent Health. Available online: https://www.childhealthdata.org.
- Cover, T.M.; Thomas, J.A. Elements of Information Theory, 2 ed.; Wiley-Interscience: Hoboken, NJ, 2006. [Google Scholar] [CrossRef]
- James, G.; Witten, D.; Hastie, T.; Tibshirani, R. An Introduction to Statistical Learning; Springer, 2013. [Google Scholar]
- Hosmer, D.W.; Lemeshow, S.; Sturdivant, R.X. Applied Logistic Regression, 3 ed.; Wiley: Hoboken, NJ, 2013. [Google Scholar]
- Breiman, L. Random Forests. Machine Learning 2001, 45, 5–32. [Google Scholar] [CrossRef]
- Fawcett, T. An introduction to ROC analysis. Pattern Recognition Letters 2006, 27, 861–874. [Google Scholar] [CrossRef]
- Heeringa, S.G.; West, B.T.; Berglund, P.A. Applied Survey Data Analysis, second ed.; CRC Press: Boca Raton, FL, 2017. [Google Scholar]
- Lippman, L.H.; Moore, K.A.; McIntosh, H. Flourishing Children: Defining and Testing Indicators of Positive Development; Springer: New York, NY, 2014. [Google Scholar] [CrossRef]
- Mullainathan, S.; Spiess, J. Machine Learning: An Applied Econometric Approach. Journal of Economic Perspectives 2017, 31, 87–106. [Google Scholar] [CrossRef]
- Little, R.J. In Praise of Simplicity, Not Mathematical Obscurity: Ten Simple Rules for Survey Synthesis. Journal of Survey Statistics and Methodology 2013, 1, 6–25. [Google Scholar] [CrossRef]
- Currie, J. Inequality at Birth: Some Causes and Consequences. American Economic Review 2011, 101, 1–22. [Google Scholar] [CrossRef]
- Chetty, R.; Stepner, M.; Abraham, S.; Lin, S.; Scuderi, B.; Turner, N.; Bergeron, A.; Cutler, D. The Association Between In00come and Life Expectancy in the United States, 2001-2014. JAMA 2016, 315, 1750–1766. [Google Scholar] [CrossRef] [PubMed]
Figure 1.
Correlation heatmap of the strict feature subset selected using mutual information. The visualization shows pairwise Pearson correlations among the predictors included in the interpretable dataset nsch_2023_ml_ready_strict.csv. The absence of strong correlations among most predictors indicates that the selected variables do not exhibit severe multicollinearity, supporting their suitability for interpretable machine learning models.
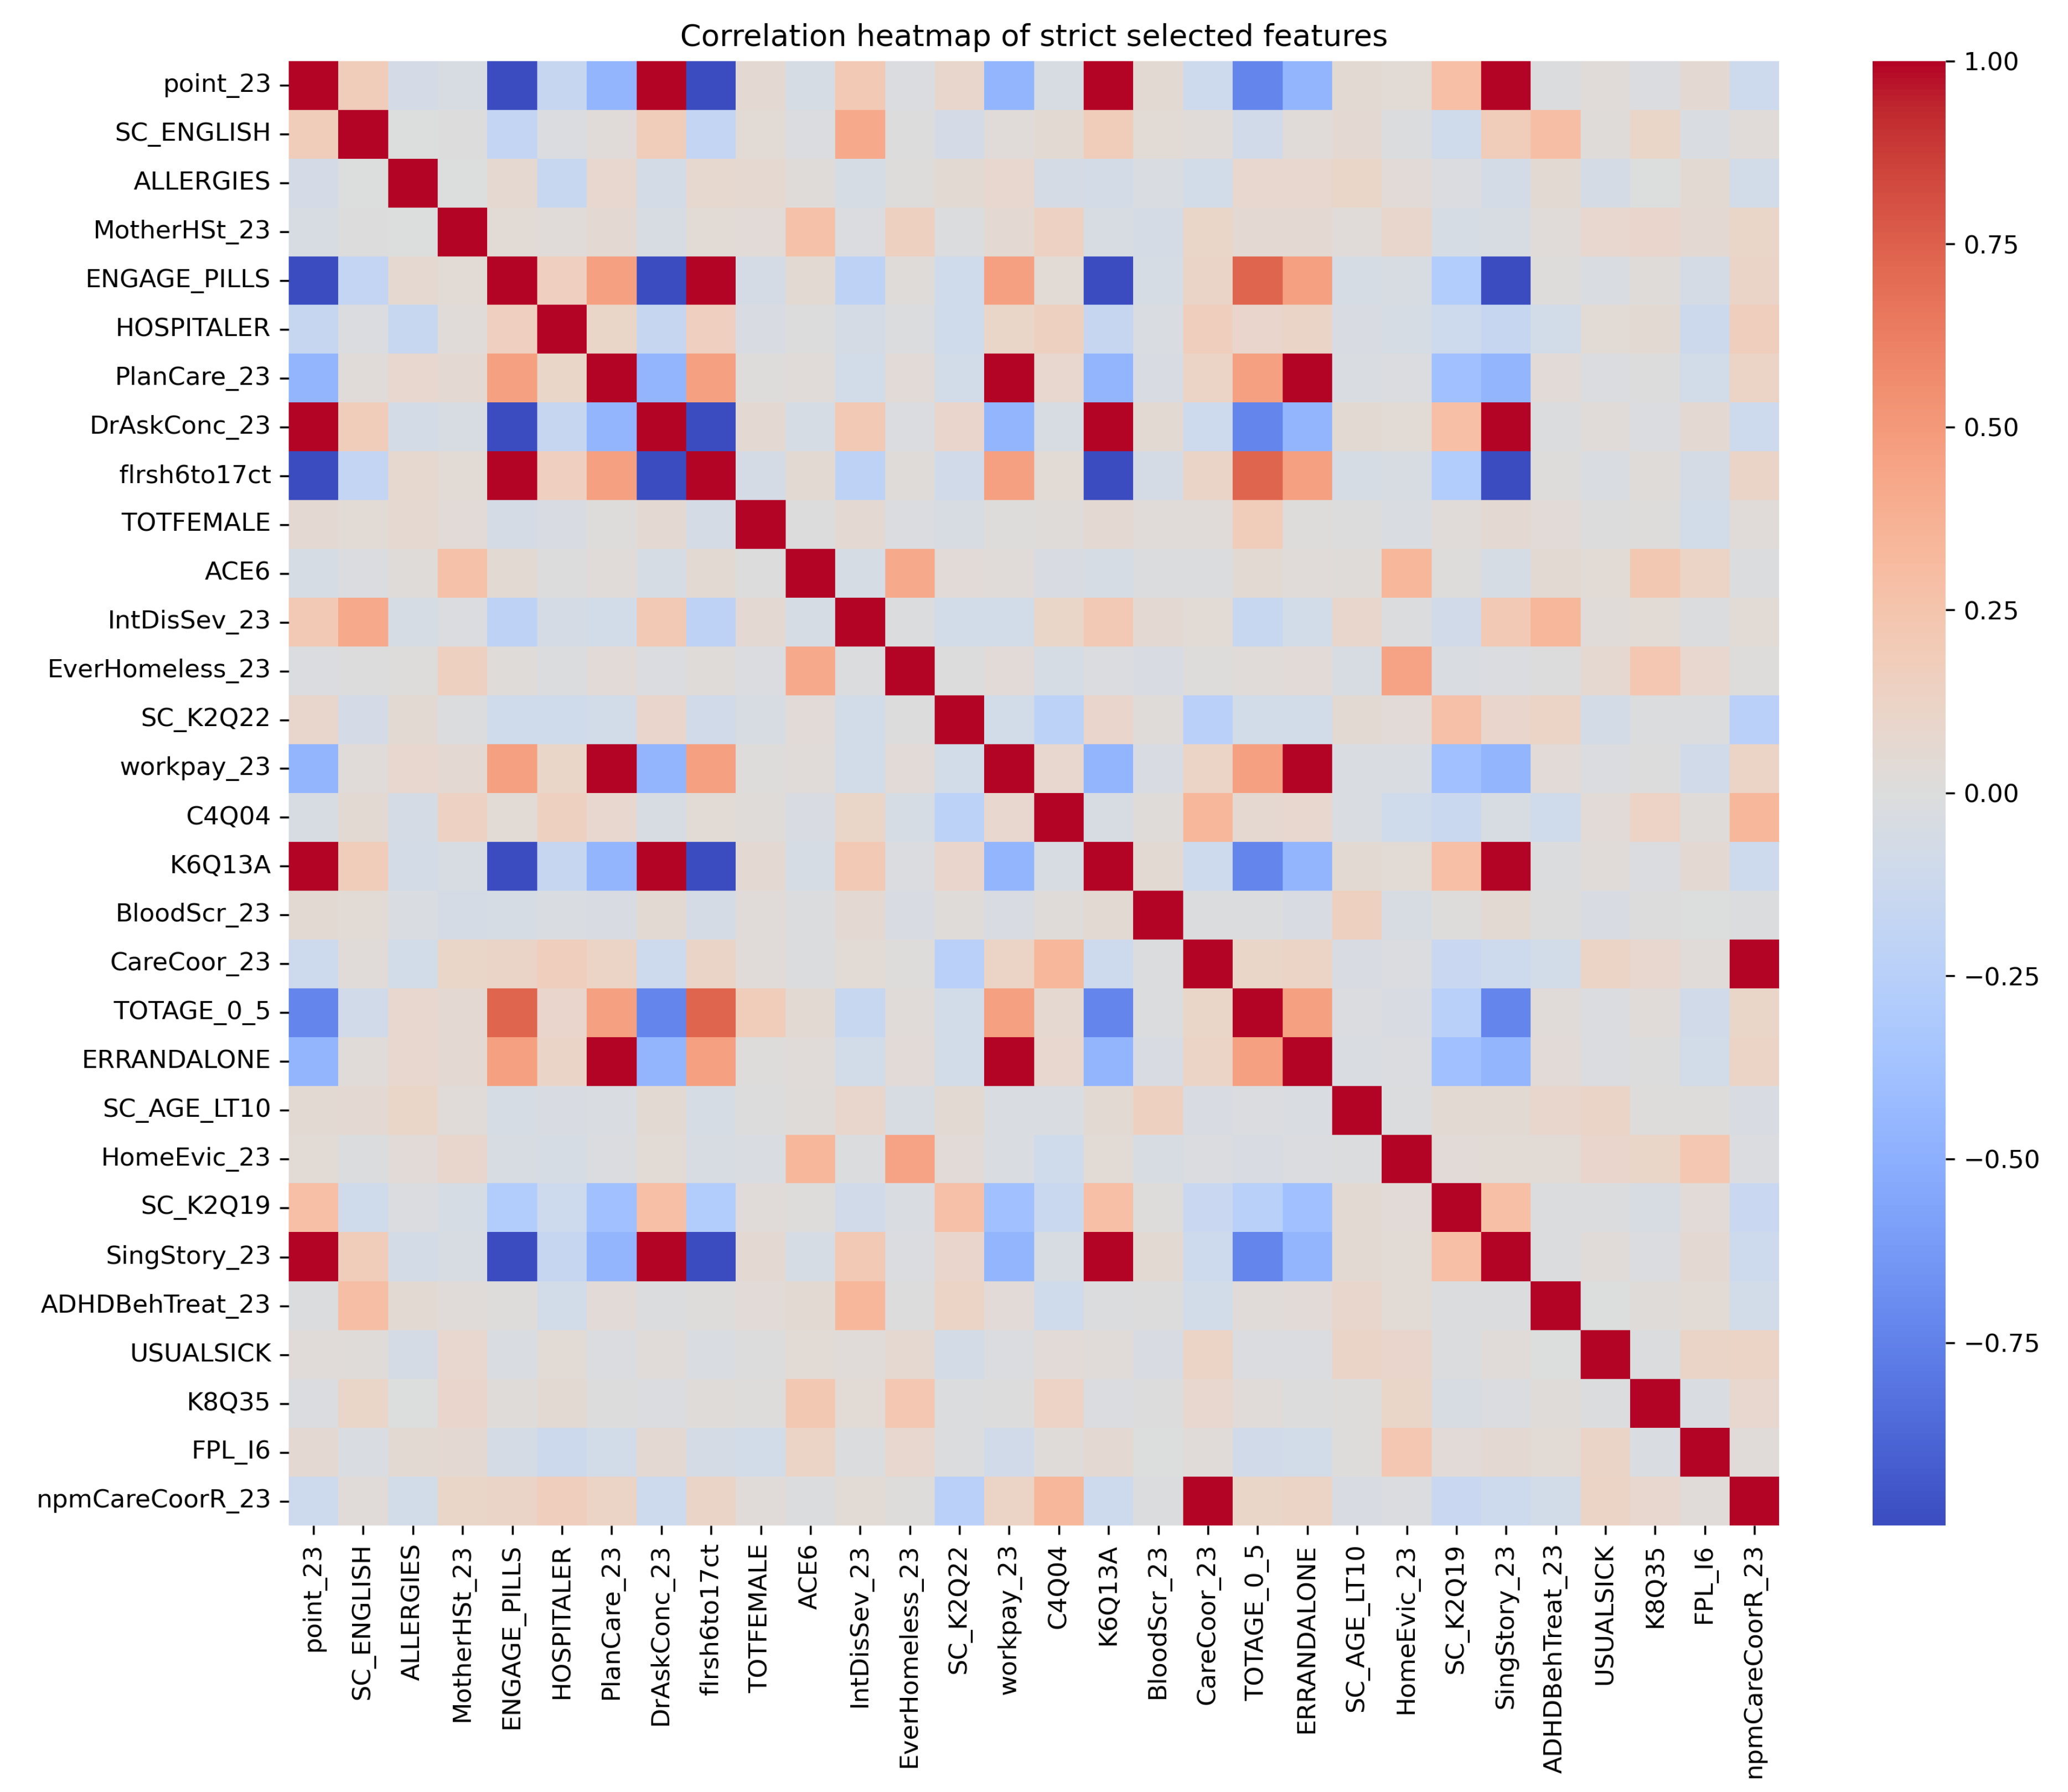
Figure 2.
Dataset construction flow from the original NSCH 2023 file to the final machine-learning-ready flourishing dataset.
Figure 2.
Dataset construction flow from the original NSCH 2023 file to the final machine-learning-ready flourishing dataset.
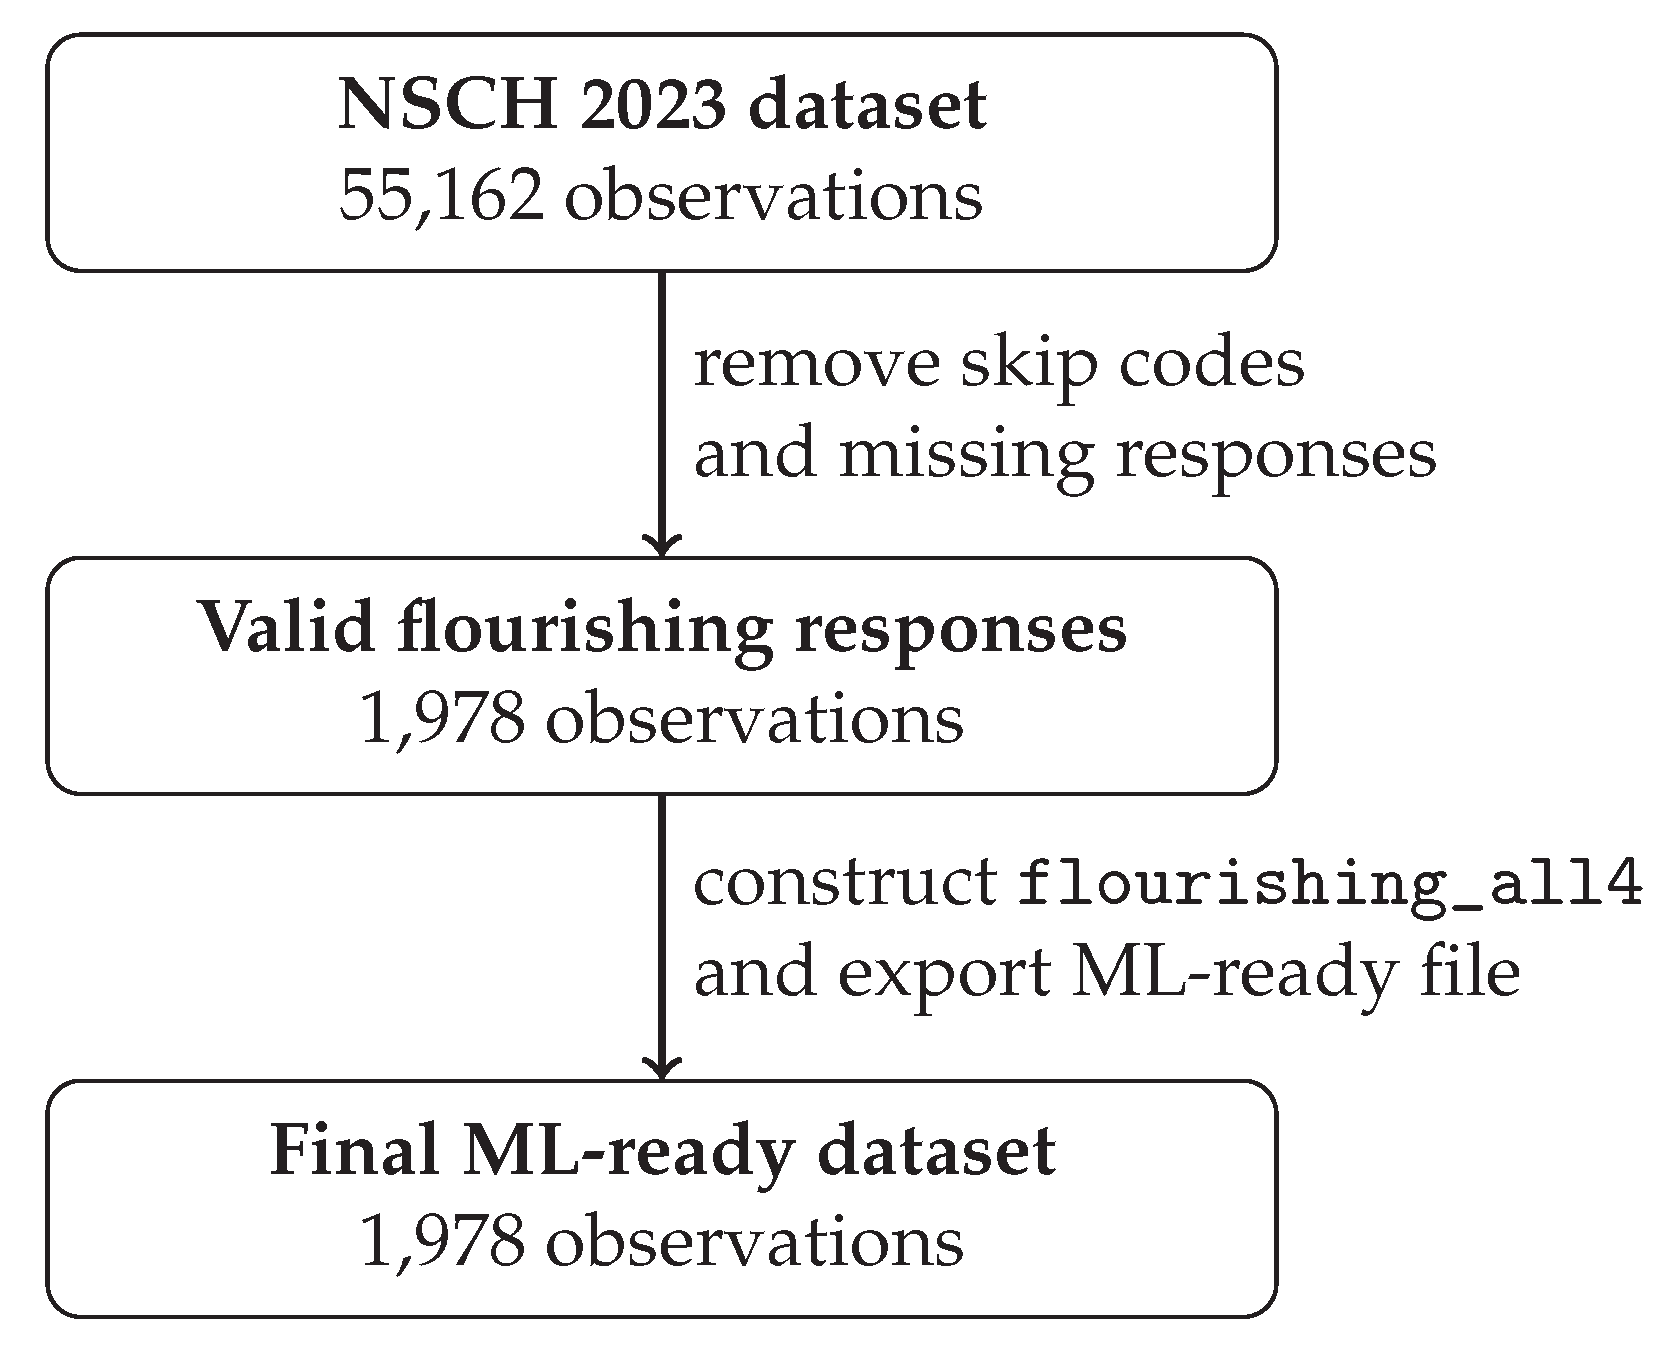
Table 3.
Top 15 variables ranked by mutual information.
| variable | mutual_information |
|---|---|
| ASDDrType_23 | 0.440597 |
| point_23 | 0.034262 |
| SC_ENGLISH | 0.033420 |
| ALLERGIES | 0.031238 |
| MotherHSt_23 | 0.030284 |
| ENGAGE_PILLS | 0.029332 |
| BehavSev_23 | 0.027013 |
| HOSPITALER | 0.026502 |
| PlanCare_23 | 0.026372 |
| DrAskConc_23 | 0.025861 |
| flrsh6to17ct | 0.025509 |
| TOTFEMALE | 0.025140 |
| ACE6 | 0.024724 |
| IntDisSev_23 | 0.024626 |
| EverHomeless_23 | 0.023753 |
Table 4.
Performance of baseline models on the strict selected dataset.
| model | accuracy | f1 | roc_auc |
|---|---|---|---|
| logistic_unweighted | 0.5909 | 0.5188 | 0.6277 |
| logistic_weighted | 0.5488 | 0.4962 | 0.5666 |
| random_forest | 0.5808 | 0.5069 | 0.5710 |
Table 5.
Comparison of weighted and unweighted machine learning models.
| Model | Weighting | Accuracy | F1 | ROC-AUC |
|---|---|---|---|---|
| Logistic Regression | Unweighted | 0.591 | 0.519 | 0.628 |
| Logistic Regression | Weighted | 0.549 | 0.496 | 0.567 |
| Random Forest | Unweighted | 0.581 | 0.507 | 0.571 |
| Random Forest | Weighted | 0.571 | 0.491 | 0.557 |
Table 6.
Top 10 state-level flourishing rates in the NSCH 2023 derived dataset.
| State | Flourishing rate | Sample size |
|---|---|---|
| Virginia | 0.6333 | 30 |
| Tennessee | 0.6316 | 38 |
| Alaska | 0.6296 | 27 |
| Oregon | 0.6000 | 35 |
| Hawaii | 0.6000 | 25 |
| Massachusetts | 0.5789 | 38 |
| North Dakota | 0.5789 | 19 |
| Washington | 0.5769 | 26 |
| New Jersey | 0.5758 | 33 |
| Alabama | 0.5556 | 36 |
Disclaimer/Publisher’s Note: The statements, opinions and data contained in all publications are solely those of the individual author(s) and contributor(s) and not of MDPI and/or the editor(s). MDPI and/or the editor(s) disclaim responsibility for any injury to people or property resulting from any ideas, methods, instructions or products referred to in the content. |
© 2026 by the authors. Licensee MDPI, Basel, Switzerland. This article is an open access article distributed under the terms and conditions of the Creative Commons Attribution (CC BY) license (http://creativecommons.org/licenses/by/4.0/).
Copyright: This open access article is published under a Creative Commons CC BY 4.0 license, which permit the free download, distribution, and reuse, provided that the author and preprint are cited in any reuse.