

Submitted:
13 March 2026
Posted:
19 March 2026
You are already at the latest version
Abstract
As global food security challenges intensify, edible crickets are increasingly recognized as a sustainable alternative protein source; however, genomic resources for commercially important species remain limited, restricting evolutionary inference and the development of robust tools for farm management. In this study, we sequenced and assembled new complete mitochondrial genomes of Gryllus bimaculatus and Teleogryllus mitratus from commercial farms in Thailand using high-throughput Illumina sequencing, achieving high coverage depths of 32,391× and 63,258×, respectively. The circular mitochondrial genomes were 15,955 bp and 16,046 bp in length and exhibited the typical insect mitochondrial gene complement of 37 genes (13 protein-coding genes, 22 tRNAs, and 2 rRNAs), with strong AT bias. Selective pressure analyses indicated pervasive purifying selection across all mitochondrial PCGs (ω < 1), while episodic diversifying selection was detected in cox1, cox3, cytb, and nad5, while atp8 displayed a comparatively elevated ω. Codon usage analyses revealed a strong preference for AT-ending codons, with leucine codons showing the highest bias. Phylogenetic analyses using concatenated protein-coding and ribosomal RNA genes recovered well-supported relationships within Gryllidae. Collectively, these farm-derived mitogenomes provide practical foundations for molecular species authentication, population monitoring, and comparative analyses relevant to breeding and traceability, and they nominate candidate mitochondrial genes for future work on environmental adaptation and performance under farming conditions.
Keywords:
Gryllus bimaculatus
; Teleogryllus mitratus
; mitochondrial genome
; edible insects
; cricket evolution
1. Introduction
Edible insects are increasingly recognized as sustainable alternatives to conventional livestock due to their high nutritional value, efficient feed conversion, and lower environmental footprint [1,2]. In Thailand, cricket farming has expanded rapidly and is now a major component of the edible insect industry, providing income for rural communities while supplying domestic and export markets. Two important species, the two-spotted cricket Gryllus bimaculatus and Teleogryllus mitratus, are widely reared and traded, but reliable genetic resources remain limited despite their commercial importance [3,4,5,6,7] Because farm populations can experience founder effects, selective propagation, and mixing of stocks, genetic reference data are essential for accurate species authentication, monitoring of maternal lineages, and improvement of breeding and traceability across production chains [8].
Even with their commercial importance, comprehensive genomic resources for these cricket species remain surprisingly limited. This gap in molecular data constrains our understanding of their evolutionary history, population genetics, and the genetic foundations of traits crucial for farming optimization and environmental adaptation. Previous phylogenetic studies have relied primarily on partial mitochondrial markers or nuclear genes, approaches that often yield inconsistent results or lack the resolution needed for robust evolutionary inferences [9,10]. Mitogenomes are widely used for phylogenetic inference, population structure analyses, and molecular identification due to their relatively conserved gene content, maternal inheritance, and comparatively rapid mutation rate [11,12].
The mitochondrial genome (mitogenome) is a circular DNA molecule typically ranging from 14 to 20 kb in animals and encodes 13 PCGs involved in oxidative phosphorylation (OXPHOS), 22 tRNAs, two rRNAs, and a non-coding control region that participates in replication and transcription [13,14,15]. In insects, mitogenome sequencing has also contributed to resolving taxonomic ambiguities and understanding evolutionary relationships across diverse lineages [16,17]. For edible insects and farmed species, complete mitogenomes can provide standardized markers for traceability, detection of mislabeling or contamination, and comparative analyses of mitochondrial function relevant to metabolic performance under rearing conditions [18,19,20].
Despite the growing economic significance of edible crickets, mitogenome resources remain limited for several species used in commercial farming in Southeast Asia. Previous studies have reported mitogenomes for selected Gryllidae species, but farm-derived reference genomes for Thai production systems are still scarce. Moreover, mitochondrial gene evolution, codon usage bias, and selective pressures have not been sufficiently explored in these farmed crickets, especially in relation to their metabolic genes underlying OXPHOS. As farm environments can impose distinct thermal, dietary, and density-related conditions compared to the wild, mitochondrial function may be an important component of physiological adaptation and performance, although direct evidence requires integration with ecological and nuclear-genomic data [21].
In this study, we sequenced and annotated the complete mitochondrial genomes of G. bimaculatus and T. mitratus collected from commercial farms in Thailand. We characterized genome organization, nucleotide composition, codon usage patterns, and tRNA structures. We also assessed selective pressures acting on mitochondrial PCGs using codon-based evolutionary models, and reconstructed phylogenetic relationships within Gryllidae using concatenated mitochondrial genes. By focusing on farm-derived stocks, this work provides baseline genetic references for commercially important edible crickets in Thailand and supports future efforts in traceability, genetic monitoring, and integrative breeding research.
2. Materials and Methods
2.1. Sample Collection and DNA Extraction
Cricket specimens of G. bimaculatus and T. mitratus were obtained from commercial farms in Phitsanulok and Phayao provinces, Thailand. Fresh specimens were immediately placed in labeled plastic containers and transported to the laboratory, where they were anesthetized before being stored at −20°C until processing. Total genomic DNA was extracted using the standard phenol-chloroform method [22], following established protocols for arthropod tissue. DNA quality and concentration were assessed using spectrophotometry and gel electrophoresis before submission to Macrogen, Inc. (South Korea) for library preparation and high-throughput sequencing.
2.2. Genome Sequencing and Assembly
Paired-end DNA libraries were prepared using the Illumina TruSeq™ Nano DNA Prep Kit and sequenced on an Illumina platform to generate 151 bp paired-end reads. Raw sequencing reads were evaluated for quality using FastQC v0.11.9 [23]. The adapters and low-quality bases were trimmed from raw reads using Trimmomatic v0.39 [24], with the following parameters: LEADING:3, TRAILING:3, SLIDINGWINDOW:4:20, and MINLEN:20. Post-trimming quality was reassessed to ensure successful preprocessing.
High-quality trimmed reads were assembled using NOVOplasty v4.3.1 [25], a de novo organellar genome assembler. We used partial sequences of the cytochrome c oxidase subunit I (cox1) gene from closely related cricket species as seed sequences to initiate the assembly process. Critically, k-mer length was optimized post-hoc through preliminary assembly trials: we selected k = 29 for G. bimaculatus and k = 19 for T. mitratus, reflecting species-specific sequence complexity and GC content that modulate optimal k-mer sizing. The expected genome size of 15-16 kb, informed by comparative analysis of published Gryllidae mitogenomes, further constrained the assembly search space, reducing erroneous contig formation while accelerating convergence.
Complete mitochondrial genomes were annotated using MITOS v1.1.5 [26] with default settings for invertebrate mitochondrial genetic code. Protein-coding genes, ribosomal RNA genes, transfer RNA genes, and control regions were identified and their boundaries refined manually. We validated annotations by comparing predicted sequences against the NCBI nucleotide database using BLAST [27]. The annotated mitochondrion sequences of G. bimaculatus and T. mitratus were submitted into NCBI databases. The GenBank files obtained from NCBI databases were utilized to visualize gene organization and arrangement via Organellar Genome DRAW (OGDRAW) v1.3.1 [28]. The base composition, codon usage and relative synonymous codon usage (RSCU) of protein-coding genes (PCGs) were analyzed using PhyloSuite v1.2.3 [29]. The non-synonymous/synonymous substitution ratios (Ka/Ks, ω) were calculated using HyPhy (Datamonkey) using the Single-Likelihood Ancestor Counting (SLAC) model to characterize selective pressures, while using the Branch-site Unrestricted Statistical Test for Episodic Diversification (BUSTED) model to detect gene-wide positive selection [30,31,32,33,34,35,36]. The secondary structures of tRNAs were interfered using the MITOS v1.1.1 on GALAXY server [26].
2.3. Phylogenetics Analysis
To investigate evolutionary relationships within Gryllidae, we compiled a dataset including our two sequenced mitochondrial genomes and 23 previously published Gryllidae mitogenomes retrieved from GenBank, while Ceuthophilus sp. (accession no. OR551732) and Gryllotalpa henana (accession no. NC_071757) served as outgroups based on their established phylogenetic position as sister groups to Gryllidae. (See Supplementary Table S1).
For phylogenetic reconstruction, thirteen protein-coding genes (PCGs) and two ribosomal RNA genes (12S and 16S rRNA) were extracted from each mitochondrial genome. The sequences were aligned, trimmed, and concatenated using PhyloSuite v1.2.3 [29], with individual alignments of each PCG and rRNA performed in MAFFT v7 [37]. Maximum Likelihood (ML) analyses were performed in IQ-TREE v2.2.0 [38], with model selection determined by PartitionFinder2 v2.1.1 [39] under the AIC criterion using the greedy search algorithm, and nodal support assessed with 1,000 ultrafast bootstrap replicates. Bayesian Inference (BI) was performed in MrBayes v3.2.7 [40] using two independent Markov Chain Monte Carlo (MCMC) runs of 1,000,000 generations, sampling every 100 generations and discarding the first 25% as burn-in. The resulting phylogenetic trees were visualized and edited in iTOL v7.2.1. [41].
3. Results
Assembly of high-depth sequencing reads yielded complete, circular mitochondrial genomes for both species, with coverage depths (32,391× and 63,258× for G. bimaculatus and T. mitratus, respectively) substantially exceeding thresholds required for confident base-calling and variant detection (GenBank accessions: PP230540 and PP297527). The resulting genomes, at 15,955 bp and 16,046 bp respectively, align with the expected size distribution for Gryllidae mitogenomes (typically 14–17 kb), suggesting successful capture of complete mitochondrial DNA with minimal loss of genetic material during extraction and sequencing.
As expected from the conserved nature of mitochondrial gene content across animals, both species display the canonical 37-gene architecture characteristic of insects, with composition and organization fully consistent with previously sequenced Gryllidae mitogenomes. Both mitochondrial genomes exhibit the typical insect gene organization, containing 37 genes: 13 protein-coding genes (PCGs), 22 transfer RNA (tRNA) genes, and 2 ribosomal RNA (rRNA) genes, plus a control region, consistent with the metazoan mitochondrial genetic code (Figure 1).
These two mitochondrial genomes exhibit the typical insect gene content and organization, consisting of 13 protein-coding genes (PCGs) atp6, atp8, cytb, cox1, cox2, cox3, nad1, nad2, nad3, nad4, nad4l, nad5, and nad6 along with 22 transfer RNA (tRNA) genes, including two copies each of tRNALeu and tRNASer, and two ribosomal RNA (rRNA) genes (rrnS and rrnL).
Gene organization adheres to the asymmetric strand distribution typical of insects, with both species encoding 4 PCGs and 11 tRNAs on the minority (N) strand alongside both rRNAs, while 9 PCGs and 11 tRNAs occupy the majority (J) strand. This division reflects underlying constraints related to concurrent transcription and replication, wherein genes on opposite strands experience different mutational pressures [42]. At the codon level, most PCGs initiate with standard ATN start codons; however, cox1 and nad1 deviate from this pattern, employing alternative start codons (CAA and TTG in G. bimaculatus; CGA and TTG in T. mitratus). Such non-canonical initiation codons, increasingly documented in Orthoptera [42,43], likely reflect the permissive nature of mitochondrial translation systems and may reduce ribosome stalling relative to standard AUG initiation in the AT-rich mitochondrial genome. Termination patterns showed predominant use of the complete TAA stop codon, though cox1, cox2, nad3, and nad4 in both species, plus cytb in T. mitratus, terminate with incomplete stop codons (T alone), a common feature in arthropod mitochondrial genomes [44,45] (Supplementary Table S2).
Nucleotide composition analysis revealed strong AT bias in both species, with adenine and thymine comprising 74.0% and 73.4% of total nucleotides in G. bimaculatus and T. mitratus, respectively. This AT-rich composition varied among genomic regions: protein-coding genes showed the highest AT content (73.4-74.9%), followed by rRNAs (73.5-74.9%) and tRNAs (75.5-76.0%). Strand asymmetrical analysis using AT-skew and GC-skew values revealed distinct patterns across genomic regions The complete mitochondrial genomes exhibited positive AT-skew (0.095 in G. bimaculatus, 0.082 in T. mitratus) and negative GC-skew (-0.31 and -0.28, respectively), indicating strand-specific mutational biases. Notably, PCGs displayed contrasting patterns with negative AT-skew (-0.138 to -0.141) but near-neutral GC-skew, while rRNAs showed negative AT-skew but strongly positive GC-skew (0.365-0.398). Transfer RNAs exhibited intermediate patterns with near-neutral AT-skew and moderately positive GC-skew values (Table 1).
Analysis of relative synonymous codon usage (RSCU) across all 13 PCGs revealed a strong codon bias toward A/T-ending codons in both species (Figure 2 and Supplementary Table S3). Of the 62 sense codons analyzed, both species showed a marked preference for NNU and NNA codons, with UUA (Leu2) displaying the highest RSCU values (3.97 in G. bimaculatus, 3.75 in T. mitratus) indicating that it had undergone strong selection during evolution. In contrast, the RSCU values for CUG (Leu1) which end with G and C, were relatively low. Notably, Leu2 and Ser2 consistently had the highest RSCU values in both species.
Amino acid composition analysis revealed highly conserved usage patterns between species (Figure 3 and Supplementary Table S3). Overall, both species showed highly conserved usage patterns. The most frequently used amino acid was Leucine2 (UUR codons), with counts of 438 in G. bimaculatus and 433 in T. mitratus. This was followed by Leucine1 (CUN codons) and Phenylalanine, which were also abundant (Leu1: 381 and 375; Phe: 333 and 324, respectively). In contrast, the least utilized amino acids were Cysteine (49–51) and Tryptophan (101–102). Several amino acids, including Lysine, Glycine, and Serine2, also occurred at relatively high frequencies. Minor interspecific differences were observed, with T. mitratus exhibiting slightly higher counts of Serine2 (238 vs. 226) and Glutamine (81 vs. 80), while Methionine and Proline were marginally more common in G. bimaculatus.
Differential selective pressures among mitochondrial genes have important implications for understanding metabolic evolution and identifying candidate genes for functional studies. To assess these pressures and identify genes potentially under adaptive evolution, we employed codon-based substitution rate analyses. The nonsynonymous to synonymous substitution rate ratio (Ka/Ks, ω) of mitochondrial protein-coding genes (PCGs) were exhibited that all PCGs, mean ω values were below 1, indicating that mitochondrial genes are predominantly evolving under pervasive purifying selection. Consistent with this, the BUSTED analysis detected gene-wide evidence of episodic diversifying (positive) selection in cox1, cox3, cytb, and nad5, as indicated by significant likelihood ratio tests (P < 0.05; marked by asterisks). Among the PCGs, atp8 showed a relatively elevated ω, consistent with weaker functional constraints and a faster evolutionary rate compared with other mitochondrial genes. Overall, these results demonstrate heterogeneity in selective rules among mitochondrial genes and respiratory chain complexes, with pervasive purifying selection dominating the mitochondrial genome despite episodic diversifying selection acting on specific genes. (Figure 4 and Supplementary Table S4).
All 22 mitochondrial tRNAs were successfully identified and annotated, with most displaying canonical cloverleaf secondary structures containing the acceptor stem, dihydrouridine (DHU) arm, anticodon arm, TΨC arm, and variable loop (Supplementary Figures S1 and S2). The notable exception was trnS1 (AGN), which lacks the DHU arm in both species, a characteristic feature widely observed in metazoan mitochondrial genomes that does not impair functionality (Figure 5).
Both species contain complete large and small ribosomal RNA subunits positioned in the typical arthropod arrangement: lrRNA between tRNALeu and tRNAVal, and srRNA between tRNAVal and the control region. The lrRNA genes measured 1,313 bp (G. bimaculatus) and 1,315 bp (T. mitratus), while srRNA genes spanned 762 bp and 808 bp, respectively. These size variations fall within the normal range for Gryllidae species are consistent with minor indel events in non-critical structural regions.
The phylogenetic analyses recovered well-supported clades consistent with established genera within the family Gryllidae. The phylogenetic trees generated by both ML and BI methods exhibited identical topologies (topological congruence), differing only in minor branch lengths. All three focal genera, Gryllus, Teleogryllus, and Tarbinskiellus were recovered as monophyletic groups with high statistical support (ML bootstrap ≥ 95%; BI posterior probability ≥ 0.95). The two newly sequenced species were placed firmly within their respective genera with maximum support: G. bimaculatus clustered with other Gryllus species, while T. mitratus grouped closely with T. emma and T. infernalis, confirming their evolutionary relationships. The tree was rooted using Ceuthophilus sp. and G. henana as outgroups, which were clearly separated from the ingroup taxa, providing additional confidence in the inferred topology. The congruent results from both ML and BI analyses, combined with consistently high support values, demonstrate the effectiveness of mitochondrial genome data for resolving phylogenetic relationships within edible cricket lineages (Figure 6 and Supplementary Table S5).
4. Discussion
This study presents the first complete mitochondrial genomes of G. bimaculatus and T. mitratus sourced from commercial farms in Thailand, substantially expanding genomic infrastructure for one of Southeast Asia's most economically significant edible insect industries. Beyond documenting genome sequences, our comparative analyses reveal heterogeneous evolutionary dynamics across mitochondrial genes, with implications for understanding how farmed populations may diverge genetically from wild ancestors and how mitochondrial function might be optimized through selective breeding. The overall gene content and organization of both mitogenomes conform to the conserved arthropod pattern, consistent with strong functional constraints on mitochondrial genome architecture across Gryllidae [46,47,48]. However, the presence of non-canonical start codons (e.g., CAA, CGA, TTG) and incomplete stop codons (T or TA), represents a common adaptation in insect mitochondrial genomes that likely reflects the specialized nature of mitochondrial translation systems [42,43,49,50,51].
Comparison with previously reported G. bimaculatus mitogenomes (accession number: NC_053546 and MZ440656) [47,52] confirmed overall structural conservation, with identical gene organization and comparable AT-richness across populations. However, comparing newly assembled G. bimaculatus mitogenome in present study (PP230540.1) with the published sequence MZ440656 shows a difference in the D-loop repeat array. Our assembly contains two complete 219 bp repeats in tandem followed by a 195 bp partial copy, whereas MZ440656 has one complete repeat followed by the same partial copy. The extra repeat is supported by SRA BLAST of short-read datasets DRX261895 and DRX261894 and long-read dataset DRX261898, as well as by high read depth across the region and high mitogenome coverage analysis (32,391x). In this context, the D-loop repeat polymorphism is not only a technical detail but also a potentially informative marker class for maternal-lineage tracking and intraspecific differentiation [53].
Both species exhibit pronounced AT richness, with genome-wide AT content exceeding 73–74%, consistent with broad insect patterns and Gryllidae-specific comparative work [42,54,55]. The combination of positive AT-skew and negative GC-skew indicates strand-asymmetric substitution pressures that are plausibly linked to replication and transcription associated mutational biases [56]. Importantly, this compositional landscape provides a parsimonious explanation for the observed codon-usage bias toward A/U-ending codons and the high representation of leucine and phenylalanine residues, patterns also typical of Orthopteran mitogenomes [48,57,58]. While such biases are often attributed primarily to mutational pressure, their persistence in functionally constrained OXPHOS genes underscores that selection and translational constraints may also contribute to maintaining efficient mitochondrial protein synthesis [16,17,59].
The selective pressure analyses revealed pronounced heterogeneity in evolutionary dynamics among mitochondrial protein-coding genes. Although pervasive purifying selection predominated across the mitochondrial genome, as reflected by mean ω values below one for all PCGs, several genes exhibited signatures of episodic diversifying selection. In particular, cox1, cox3, cytb, and nad5 showed significant gene-wide evidence of positive selection. This suggests that even under the overarching regime of purifying selection, certain sites in these respiratory complexes have undergone adaptive evolution, possibly in response to specific metabolic demands [60]. These genes encode key components of the oxidative phosphorylation pathway, indicating that selective fine-tuning of respiratory chain function may play an important role in mitochondrial evolution [61], suggest that the selected changes may reflect adaptation to shared environmental pressures. The intermittent nature of positive selection suggests that these pressures may be fluctuating over time rather than constant, with only certain lineages or time periods experiencing directional selection on ETC function [62]. Future work incorporating functional data on thermal tolerance, metabolic rate, and feed efficiency across natural and farmed populations could test whether positive selection signatures correlate with physiological performance differences.
In contrast, atp8 displayed a relatively elevated ω compared with other mitochondrial genes, indicating substantially weaker functional constraint and a faster evolutionary rate compared with other PCGs. This pattern, consistently observed across Orthoptera [47,63,64], likely reflects the reduced essentiality of ATP synthase subunit 8 (atp8) is a small protein (~49 amino acids in crickets) that may be partially redundant or whose sequence requirements are less stringent than larger catalytic subunits.
The elevated ω may indicate that atp8 is undergoing directional selection for altered properties (e.g., changes in membrane topology or subunit-subunit interactions) [65], though distinguishing adaptive evolution from mutation-driven relaxation of constraint requires additional functional data.
The secondary structures of mitochondrial tRNAs in both G. bimaculatus and T. mitratus conform to the classical cloverleaf model, comprising the acceptor stem, dihydrouridine (DHU) arm, anticodon arm, variable loop, and TΨC arm. The sole exception is trnS1 (AGN), which notably lacks the DHU arm a feature widely observed across metazoan mitochondrial genomes, particularly in insects [54,66,67,68]. Notably, this recurrent structural reduction is widely treated as a lineage-consistent feature of metazoan mitochondrial tRNAs rather than a loss of function, and its presence here is therefore consistent with accurate annotation and expected mitochondrial tRNA evolution [55,66].
The robust phylogenetic resolution achieved here using mitochondrial data alone represents a considerable strength for applied purposes (species authentication, population tracking) but also highlights an important limitation of mitochondrial-only phylogenetics: the single-locus nature of mtDNA means that the recovered topology, while well-supported, represents the evolutionary history of maternal lineages specifically [69,70]. In farmed populations, where animals may be crossed between diverse maternal and paternal genetic backgrounds [3,71], the mitochondrial phylogeny may not fully capture nuclear-genomic structure or the extent of admixture among populations. Nonetheless, the monophyly of Gryllus and Teleogryllus and the strong support for species-level relationships provide confidence that these genera represent genuine evolutionary lineages and not unrecognized species complexes, an important consideration given the economic value of reliable species identification.
The genomic resources presented here enable several practical innovations in cricket agriculture. First, the complete genome sequences permit design of species-specific molecular assays (real-time PCR, high-resolution melt analysis) for rapid, accurate species identification [72], a critical quality-control metric given the market premium for G. bimaculatus and T. mitratus relative to less-valued species. Second, the identification of polymorphisms in the mitochondrial D-loop (our assembly documents copy-number polymorphism in repeat arrays not present in published genomes) provides a foundation for developing population-specific markers to track maternal lineages through breeding programs, enabling better documentation of genetic management and informed selection for traits related to growth rate, feed conversion, or fecundity. Third, the genes identified under positive selection, particularly ETC genes; represent empirically informed candidate loci for future functional validation studies aimed at understanding mitochondrial contributions to physiological traits under farmer optimization. Lastly, understudied application involves quality assurance in cricket farming supply chains. Because crickets are marketed both alive and as processed products (whole-insect meals, protein powders), molecular markers enabling traceability from farm to consumer could authenticate 'origin of origin' claims and detect species substitution or contamination with wild insects or unrelated species [18,19,20]. Mitochondrial barcoding, leveraging the complete genomes presented here, offers a rapid, cost-effective pathway to implement such traceability, with particular relevance for premium markets in Thailand and the EU where food authentication and supply-chain transparency are increasingly demanded by consumers and regulators.
5. Conclusions
This study provides complete mitogenomes for G. bimaculatus and T. mitratus, characterizing the molecular adaptation of Thai farmed crickets. Our findings reveal that while purifying selection preserves OXPHOS architecture, episodic positive selection drives respiratory adaptation to farm-related stressors. These resources facilitate molecular traceability for quality assurance and provide physiological targets for selective breeding. Future research should integrate wild-population genomics and phenotypic data to develop evidence-based breeding programs, ensuring the long-term sustainability and performance of insect agriculture.
Supplementary Materials
The following supporting information can be downloaded at the website of this paper posted on Preprints.org. Figure S1: Secondary structures of 22 tRNAs found in the mitogenome of G. bimaculatus; Figure S2: Secondary structures of 22 tRNAs found in the mitogenome of T. mitratus; Table S1: GenBank accession number of species and taxonomic information for the phylogenetic analysis; Table S2: List of mitogenomes configurations of the cricket species; Table S3: Frequency and RSCU values of codon in PCGs in the mitogenomes; Table S4: Ka/Ks ratio of 13 protein-coding genes in 24 species of Gryllidae; Table S5: Results of best fit models for each alignment partition by PartitonFinder2.
Author Contributions
Conceptualization, P.U. and S.H.; methodology, P.U., S.H. and Y.M.G; validation, S.H. and Y.M.G.; formal analysis, P.U.; investigation, S.H. and Y.M.G.; data curation, P.U.; writing—original draft preparation, P.U.; writing—review and editing, S.H. and Y.M.G.; visualization, P.U.; supervision, S.H..; project administration, S.H. and Y.M.G.; funding acquisition, S.H. and Y.M.G. All authors have read and agreed to the published version of the manuscript.
Funding
This research was supported by the Department of Biology, Faculty of Science, Naresuan University, Thailand (Grant No. R2568B018) and partially supported by the Global and Frontier Research University Fund, Naresuan University (Grant No. R2566C051).
Institutional Review Board Statement
The species used in this study are not listed in the CITES Appendices and are classified as Least Concern (LC) on the IUCN Red List. Both species are widely available in local commercial markets as a common source of protein. All experimental procedures were approved by the Naresuan University Animal Care and Use Committee (NUACUC), Protocol No. 6801022, and were conducted in strict accordance with animal welfare and ethical guidelines.
Informed Consent Statement
Not applicable.
Data Availability Statement
The assembled mitochondrial genome sequence which supports this study is available at NCBI (https://www.ncbi.nlm.nih.gov/). Nucleotide sequence data reported are available in DDBJ/ENA/GenBank databases under the accession number PP230540 (G. bimaculatus) and PP297527 (T. mitratus).
Acknowledgments
The author(s) would like to express sincere gratitude to colleagues for their invaluable assistance and support throughout the course of this study. Appreciation is also extended to all members of the laboratory and the Department of Biology, Faculty of Science, Naresuan University, for their technical help, constructive comments, and encouragement that greatly contributed to the completion of this work.
Conflicts of Interest
The authors declare that there are no conflicts of interest.
References
- Sánchez-Muros, M.-J.; Barroso, F.G.; Manzano-Agugliaro, F. Insect meal as renewable source of food for animal feeding: a review. J. Clean. Prod. 2014, 65, 16–27. [Google Scholar] [CrossRef]
- Van Huis, A.; Oonincx, D.G.A.B. The environmental sustainability of insects as food and feed. A review. Agron. Sustain. Dev. 2017, 37. [Google Scholar] [CrossRef]
- Hanboonsong, Y.; Jamjanya, T.; Durst, P.B. Six-legged livestock: edible insect farming, collection and marketing in Thailand; 2013 Volume 3.
- Krongdang, S.; Venkatachalam, K.; Chitov, T.; Wangtueai, S.; Wongsa, J.; Parametthanuwat, T.; Charoenphun, N. Edible insect production in Thailand: sustainable supply chain management. Insects 2025, 16, 827. [Google Scholar] [CrossRef]
- Krongdang, S.; Phokasem, P.; Venkatachalam, K.; Charoenphun, N. Edible Insects in Thailand: An Overview of Status, Properties, Processing, and Utilization in the Food Industry. Foods 2023, 12, 2162. [Google Scholar] [CrossRef] [PubMed]
- Van Huis, A. Potential of insects as food and feed in assuring food security. Annu. Rev. Entomol. 2013, 58, 563–583. [Google Scholar] [CrossRef] [PubMed]
- Van Huis, A.; Van Itterbeeck, J.; Klunder, H.; Mertens, E.; Halloran, A.; Muir, G.; Vantomme, P. Edible insects: future prospects for food and feed security . In FAO Forestry Paper, 171 ed.; Wageningen, F.a., Ed.; Food and agriculture organization of the United Nations, 2013. [Google Scholar]
- Homchan, S.; Bhadola, P.; Gupta, Y.M. Statistical analysis of simple sequence repeats in genome sequence: a case of Acheta domesticus (Orthoptera: Gryllidae). ECS Trans. 2022, 107, 14799. [Google Scholar] [CrossRef]
- Funk, D.J.; Omland, K.E. Species-level paraphyly and polyphyly: frequency, causes, and consequences, with insights from animal mitochondrial DNA. Annu. Rev. Ecol. Evol. Syst. 2003, 34, 397–423. [Google Scholar] [CrossRef]
- Toews, D.P.; Brelsford, A. The biogeography of mitochondrial and nuclear discordance in animals. Mol. Ecol. 2012, 21, 3907–3930. [Google Scholar] [CrossRef]
- Avise, J.C.; Arnold, J.; Ball, R.M.; Bermingham, E.; Lamb, T.; Neigel, J.E.; Reeb, C.A.; Saunders, N.C. Intraspecific phylogeography: the mitochondrial DNA bridge between population genetics and systematics. Annu. Rev. Ecol. Syst. 1987, 489–522. [Google Scholar] [CrossRef]
- Unajak, S.; Meesawat, P.; Anyamaneeratch, K.; Anuwareepong, D.; Srikulnath, K.; Choowongkomon, K. Full length research paper identification of species (meat and blood samples) using nested-PCR analysis of mitochondrial DNA. Afr. J. Biotechnol. 2011, 10, 5670–5676. [Google Scholar] [CrossRef]
- Boore, J.L. Animal mitochondrial genomes. Nucleic Acids Res. 1999, 27, 1767–1780. [Google Scholar] [CrossRef]
- Clayton, D.A. Replication of animal mitochondrial DNA. Cell 1982, 28, 693–705. [Google Scholar] [CrossRef] [PubMed]
- Saraste, M. Oxidative phosphorylation at the fin de siecle. Science 1999, 283, 1488–1493. [Google Scholar] [CrossRef]
- Cameron. Insect mitochondrial genomics: implications for evolution and phylogeny. Annu. Rev. Entomol. 2014, 59, 95–117. [Google Scholar] [CrossRef]
- Mugleston, J.D.; Song, H.; Whiting, M.F. A century of paraphyly: A molecular phylogeny of katydids (Orthoptera: Tettigoniidae) supports multiple origins of leaf-like wings. Mol. Phylogenet. Evol. 2013, 69, 1120–1134. [Google Scholar] [CrossRef]
- Dawan, J.; Ahn, J. Application of DNA barcoding for ensuring food safety and quality. Food Sci. Biotechnol. 2022, 31, 1355–1364. [Google Scholar] [CrossRef] [PubMed]
- Galimberti, A.; Casiraghi, M.; Bruni, I.; Guzzetti, L.; Cortis, P.; Berterame, N.M.; Labra, M. From DNA barcoding to personalized nutrition: the evolution of food traceability. Curr. Opin. Food Sci. 2019, 28, 41–48. [Google Scholar] [CrossRef]
- Galimberti, A.; Labra, M.; Sandionigi, A.; Bruno, A.; Mezzasalma, V.; De Mattia, F. DNA barcoding for minor crops and food traceability. Adv. Agric. 2014, 2014, 831875. [Google Scholar] [CrossRef]
- Hood, W.R.; Austad, S.N.; Bize, P.; Jimenez, A.G.; Montooth, K.L.; Schulte, P.M.; Scott, G.R.; Sokolova, I.; Treberg, J.R.; Salin, K. The mitochondrial contribution to animal performance, adaptation, and life-history variation. Integr. Comp. Biol. 2018, 58, 480–485. [Google Scholar] [CrossRef] [PubMed]
- Reineke, A.; Karlovsky, P.; Zebitz, C. Preparation and purification of DNA from insects for AFLP analysis. Insect Mol. Biol. 1998, 7, 95–99. [Google Scholar] [CrossRef]
- Brown, J.; Pirrung, M.; McCue, L.A. FQC Dashboard: integrates FastQC results into a web-based, interactive, and extensible FASTQ quality control tool. Bioinformatics 2017, 33, 3137–3139. [Google Scholar] [CrossRef]
- Bolger, A.M.; Lohse, M.; Usadel, B. Trimmomatic: a flexible trimmer for Illumina sequence data. Bioinformatics 2014, 30, 2114–2120. [Google Scholar] [CrossRef] [PubMed]
- Dierckxsens, N.; Mardulyn, P.; Smits, G. NOVOPlasty: de novo assembly of organelle genomes from whole genome data. Nucleic Acids Res. 2017, 45, e18–e18. [Google Scholar] [CrossRef]
- Bernt, M.; Donath, A.; Jühling, F.; Externbrink, F.; Florentz, C.; Fritzsch, G.; Pütz, J.; Middendorf, M.; Stadler, P.F. MITOS: improved de novo metazoan mitochondrial genome annotation. Mol. Phylogenet. Evol. 2013, 69, 313–319. [Google Scholar] [CrossRef] [PubMed]
- Altschul, S.F.; Gish, W.; Miller, W.; Myers, E.W.; Lipman, D.J. Basic local alignment search tool. J. Mol. Biol. 1990, 215, 403–410. [Google Scholar] [CrossRef]
- Greiner, S.; Lehwark, P.; Bock, R. OrganellarGenomeDRAW (OGDRAW) version 1.3. 1: expanded toolkit for the graphical visualization of organellar genomes. Nucleic Acids Res. 2019, 47, W59–W64. [Google Scholar] [CrossRef]
- Zhang, D.; Gao, F.; Jakovlić, I.; Zou, H.; Zhang, J.; Li, W.X.; Wang, G.T. PhyloSuite: An integrated and scalable desktop platform for streamlined molecular sequence data management and evolutionary phylogenetics studies. Mol. Ecol. Resour. 2020, 20, 348–355. [Google Scholar] [CrossRef]
- Delport, W.; Poon, A.F.; Frost, S.D.; Kosakovsky Pond, S.L. Datamonkey 2010: a suite of phylogenetic analysis tools for evolutionary biology. Bioinformatics 2010, 26, 2455–2457. [Google Scholar] [CrossRef]
- Kosakovsky Pond, S.L.; Frost, S.D. Not so different after all: a comparison of methods for detecting amino acid sites under selection. Mol. Biol. Evol. 2005, 22, 1208–1222. [Google Scholar] [CrossRef] [PubMed]
- Kosakovsky Pond, S.L.; Poon, A.F.; Velazquez, R.; Weaver, S.; Hepler, N.L.; Murrell, B.; Shank, S.D.; Magalis, B.R.; Bouvier, D.; Nekrutenko, A. HyPhy 2.5—a customizable platform for evolutionary hypothesis testing using phylogenies. Mol. Biol. Evol. 2020, 37, 295–299. [Google Scholar] [CrossRef]
- Yoshimura, A.; Nakata, A.; Mito, T.; Noji, S. The characteristics of karyotype and telomeric satellite DNA sequences in the cricket, Gryllus bimaculatus (Orthoptera, Gryllidae). Cytogenet. Genome Res. 2006, 112, 329–336. [Google Scholar] [CrossRef]
- Pond, S.L.K.; Frost, S.D. Datamonkey: rapid detection of selective pressure on individual sites of codon alignments. Bioinformatics 2005, 21, 2531–2533. [Google Scholar] [CrossRef]
- Pond, S.L.K.; Frost, S.D.; Muse, S.V. HyPhy: hypothesis testing using phylogenies. Bioinformatics 2005, 21, 676–679. [Google Scholar] [CrossRef]
- Weaver, S.; Shank, S.D.; Spielman, S.J.; Li, M.; Muse, S.V.; Kosakovsky Pond, S.L. Datamonkey 2.0: a modern web application for characterizing selective and other evolutionary processes. Mol. Biol. Evol. 2018, 35, 773–777. [Google Scholar] [CrossRef] [PubMed]
- Katoh, K.; Standley, D.M. MAFFT multiple sequence alignment software version 7: improvements in performance and usability. Mol. Biol. Evol. 2013, 30, 772–780. [Google Scholar] [CrossRef] [PubMed]
- Nguyen, L.-T.; Schmidt, H.A.; Von Haeseler, A.; Minh, B.Q. IQ-TREE: a fast and effective stochastic algorithm for estimating maximum-likelihood phylogenies. Mol. Biol. Evol. 2015, 32, 268–274. [Google Scholar] [CrossRef] [PubMed]
- Lanfear, R.; Frandsen, P.B.; Wright, A.M.; Senfeld, T.; Calcott, B. PartitionFinder 2: new methods for selecting partitioned models of evolution for molecular and morphological phylogenetic analyses. Mol. Biol. Evol. 2017, 34, 772–773. [Google Scholar] [CrossRef] [PubMed]
- Ronquist, F.; Teslenko, M.; Van Der Mark, P.; Ayres, D.L.; Darling, A.; Höhna, S.; Larget, B.; Liu, L.; Suchard, M.A.; Huelsenbeck, J.P. MrBayes 3.2: efficient Bayesian phylogenetic inference and model choice across a large model space. Syst. Biol. 2012, 61, 539–542. [Google Scholar] [CrossRef]
- Letunic, I.; Bork, P. Interactive Tree Of Life (iTOL) v5: an online tool for phylogenetic tree display and annotation. Nucleic Acids Res. 2021, 49, W293–W296. [Google Scholar] [CrossRef]
- Dong, J.; Liu, Y.; Tan, M.K.; Wahab, R.A.; Nattier, R.; Chifflet-Belle, P.; Robillard, T. Museomics allows comparative analyses of mitochondrial genomes in the family Gryllidae (Insecta, Orthoptera) and confirms its phylogenetic relationships. PeerJ 2024, 12, e17734. [Google Scholar] [CrossRef] [PubMed]
- Niu, Y.; Shi, F.; Li, X.; Zhang, S.; Xu, Y.; Tao, J.; Li, M.; Zhao, Y.; Zong, S. Comparative mitochondrial genomic analysis of longhorn beetles (Coleoptera: Chrysomeloidea) with phylogenetic implications. Arthropod Syst. Phylogeny 2024, 82, 133–150. [Google Scholar] [CrossRef]
- Li, T.; Yang, J.; Li, Y.; Cui, Y.; Xie, Q.; Bu, W.; Hillis, D.M. A mitochondrial genome of Rhyparochromidae (Hemiptera: Heteroptera) and a comparative analysis of related mitochondrial genomes. Sci. Rep. 2016, 6, 35175. [Google Scholar] [CrossRef]
- Yin, J.; Luo, Z.-M.; Li, Y.-H.; Wang, C.-M.; Li, J.; Zhang, R.-Y.; Shan, H.-L.; Wang, X.-Y.; Chen, Y.-Q. Mitochondrial genome characteristics and phylogenetic analysis of Fulmekiola serrata (Kobus)(Thysanoptera: Thripidae). Int. J. Mol. Sci. 2024, 25, 10431. [Google Scholar] [CrossRef]
- Dong, J.; Vicente, N.; Chintauan-Marquier, I.; Ramadi, C.; Dettai, A.; Robillard, T. Complete mitochondrial genome and taxonomic revision of Cardiodactylus muiri Otte, 2007 (Gryllidae: Eneopterinae: Lebinthini). Zootaxa 2017, 4268, 101–116. [Google Scholar] [CrossRef]
- Sanno, R.; Kataoka, K.; Hayakawa, S.; Ide, K.; Nguyen, C.N.; Nguyen, T.P.; Le, B.T.; Kim, O.T.; Mineta, K.; Takeyama, H. Comparative analysis of mitochondrial genomes in Gryllidea (Insecta: Orthoptera): implications for adaptive evolution in ant-loving crickets. Genome Biol. Evol. 2021, 13, evab222. [Google Scholar] [CrossRef]
- Yu, Z.; Xie, H.; Liu, Y.; Li, K.; He, Z. The complete mitochondrial genome of cricket Sclerogryllus punctatus (Orthoptera: Gryllidae) and phylogenetic analysis. J. Asia. Pac. Entomol. 2022, 25, 101933. [Google Scholar] [CrossRef]
- Duan, M.; Lin, Z.; Wu, J.; Shi, G.; Liu, S.; Tang, S.; Jiang, D.; Zhang, Q.; Gu, W.; Yang, X. Comparative mitochondrial genome and phylogenetic analysis of malaria mosquitoes Anopheles hyrcanus and Anopheles messeae. Sci. Rep. 2025, 15, 23959. [Google Scholar] [CrossRef]
- Jin, X.; Lin, X.; Wang, S.; Fang, J. Complete Mitochondrial Genome of Chlorogomphus papilio (Odonata: Anisoptera: Chlorogomphidae) and Phylogenetic Analyses. Biology 2025, 14, 493. [Google Scholar] [CrossRef]
- Xie, B.; Zhang, X.; Yan, M.; Qu, X.; Dietrich, C.H.; Duan, Y. Mitogenomic analysis and phylogenetic implications for the Deltocephalinae (Hemiptera: Cicadellidae). Invertebr. Syst. 2025, 39, IS25032. [Google Scholar] [CrossRef]
- Park, B.; Choi, E.H.; Kim, G.; Shin, C.R.; Hwang, J.; Baek, S.Y.; Hwang, U.W. The complete mitochondrial genome of the two-spotted cricket Gryllus bimaculatus (Orthoptera: Gryllidae) from South Korea. Mitochondrial DNA Part B 2021, 6, 1144–1146. [Google Scholar] [CrossRef]
- Homchan, S.; Kutanan, W.; Gupta, Y.M. A reproducible workflow for assembling the mitochondrial genome of Acheta domesticus (Orthoptera: Gryllidae). Ecol. Evol. 2024, 14, e11696. [Google Scholar] [CrossRef]
- Wang, L.; Chen, J.; Xue, X.; Qin, G.; Gao, Y.; Li, K.; Zhang, Y.; Li, X.-J. Comparative analysis of mitogenomes among three species of grasshoppers (Orthoptera: Acridoidea: Gomphocerinae) and their phylogenetic implications. PeerJ 2023, 11, e16550. [Google Scholar] [CrossRef]
- Zhang, R.; Jiang, Y.; Zhong, M.; Wang, S.; Wang, Y. New Mitochondrial Genomes of Ithonidae (Neuroptera) and Higher Phylogenetic Implications. Insects 2024, 15, 933. [Google Scholar] [CrossRef]
- Moeckel, C.; Zaravinos, A.; Georgakopoulos-Soares, I. Strand asymmetries across genomic processes. Comput. Struct. Biotechnol. J. 2023, 21, 2036–2047. [Google Scholar] [CrossRef]
- Li, M.; Mao, C.; Li, X.; Jiang, L.; Zhang, W.; Li, M.; Liu, H.; Fang, Y.; Liu, S.; Yang, G. Edible Insects: A New Sustainable Nutritional Resource Worth Promoting. Foods 2023, 12, 4073. [Google Scholar] [CrossRef]
- Zhu, W.; Yang, L.; Long, J.; Chang, Z.; Gong, N.; Mu, Y.; Lv, S.; Chen, X. Characterizing the Complete Mitochondrial Genomes of Three Bugs (Hemiptera: Heteroptera) Harming Bamboo. Genes 2023, 14. [Google Scholar] [CrossRef] [PubMed]
- Lu, C.; Huang, X.; Deng, J. Mitochondrial genomes of soft scales (Hemiptera: Coccidae): features, structures and significance. BMC genomics 2023, 24, 37. [Google Scholar] [CrossRef]
- Yang, Y.; Xu, S.; Xu, J.; Guo, Y.; Yang, G. Adaptive evolution of mitochondrial energy metabolism genes associated with increased energy demand in flying insects. PloS one 2014, 9, e99120. [Google Scholar] [CrossRef]
- Mei, X.; Wang, X.; Wu, X.; Liu, G.; Chen, Y.; Zhou, S.; Shang, Y.; Liu, Z.; Yang, X.; Sha, W. Mitochondrial Genomic Evidence of Selective Constraints in Small-Bodied Terrestrial Cetartiodactyla. Animals 2024, 14, 1434. [Google Scholar] [CrossRef]
- Mukundan, L.; Sukumaran, S.; Raj, N.; Jose, A.; Gopalakrishnan, A. Positive selection in the mitochondrial protein coding genes of teleost regional endotherms: Evidence for adaptive evolution. J. Mar. Biol. Assoc. India 2022, 64, 10–18. [Google Scholar] [CrossRef]
- Chang, H.; Qiu, Z.; Yuan, H.; Wang, X.; Li, X.; Sun, H.; Guo, X.; Lu, Y.; Feng, X.; Majid, M. Evolutionary rates of and selective constraints on the mitochondrial genomes of Orthoptera insects with different wing types. Mol. Phylogenet. Evol. 2020, 145, 106734. [Google Scholar] [CrossRef]
- Oliveira, D.C.; Raychoudhury, R.; Lavrov, D.V.; Werren, J.H. Rapidly evolving mitochondrial genome and directional selection in mitochondrial genes in the parasitic wasp Nasonia (Hymenoptera: Pteromalidae). Mol. Biol. Evol. 2008, 25, 2167–2180. [Google Scholar] [CrossRef]
- Li, X.-D.; Jiang, G.-F.; Yan, L.-Y.; Li, R.; Mu, Y.; Deng, W.-A. Positive selection drove the adaptation of mitochondrial genes to the demands of flight and high-altitude environments in grasshoppers. Front. Genet. 2018, 9, 605. [Google Scholar] [CrossRef]
- Du, C.; Zhang, L.; Lu, T.; Ma, J.; Zeng, C.; Yue, B.; Zhang, X. Mitochondrial genomes of blister beetles (Coleoptera, Meloidae) and two large intergenic spacers in Hycleus genera. BMC genomics 2017, 18, 698. [Google Scholar] [CrossRef]
- Yi, J.; Wu, H.; Liu, J.; Li, J.; Lu, Y.; Zhang, Y.; Cheng, Y.; Guo, Y.; Li, D.; An, Y. Novel gene rearrangement in the mitochondrial genome of Anastatus fulloi (Hymenoptera Chalcidoidea) and phylogenetic implications for Chalcidoidea. Sci. Rep. 2022, 12, 1351. [Google Scholar] [CrossRef]
- Tyagi, K.; Chakraborty, R.; Cameron, S.L.; Sweet, A.D.; Chandra, K.; Kumar, V. Rearrangement and evolution of mitochondrial genomes in Thysanoptera (Insecta). Sci. Rep. 2020, 10, 695. [Google Scholar] [CrossRef]
- Ballard, J.W.O.; Whitlock, M.C. The incomplete natural history of mitochondria. Mol. Ecol. 2004, 13, 729–744. [Google Scholar] [CrossRef]
- Hurst, G.D.; Jiggins, F.M. Problems with mitochondrial DNA as a marker in population, phylogeographic and phylogenetic studies: the effects of inherited symbionts. Proc. R. Soc. B 2005, 272, 1525–1534. [Google Scholar] [CrossRef]
- Halloran, A.; Roos, N.; Flore, R.; Hanboonsong, Y. The development of the edible cricket industry in Thailand. J. Insects Food Feed 2016, 2, 91–100. [Google Scholar] [CrossRef]
- Chintauan-Marquier, I.C.; Legendre, F.; Hugel, S.; Robillard, T.; Grandcolas, P.; Nel, A.; Zuccon, D.; Desutter-Grandcolas, L. Laying the foundations of evolutionary and systematic studies in crickets (Insecta, Orthoptera): a multilocus phylogenetic analysis. Cladistics 2016, 32, 54–81. [Google Scholar] [CrossRef]
Figure 1.
Circular maps of the mitochondrial genomes of G. bimaculatus (A), T. mitratus (B). The pink, green, and yellow show PCGs, blue shows tRNAs, red shows the rRNAs, and blank shows the control region.
Figure 1.
Circular maps of the mitochondrial genomes of G. bimaculatus (A), T. mitratus (B). The pink, green, and yellow show PCGs, blue shows tRNAs, red shows the rRNAs, and blank shows the control region.
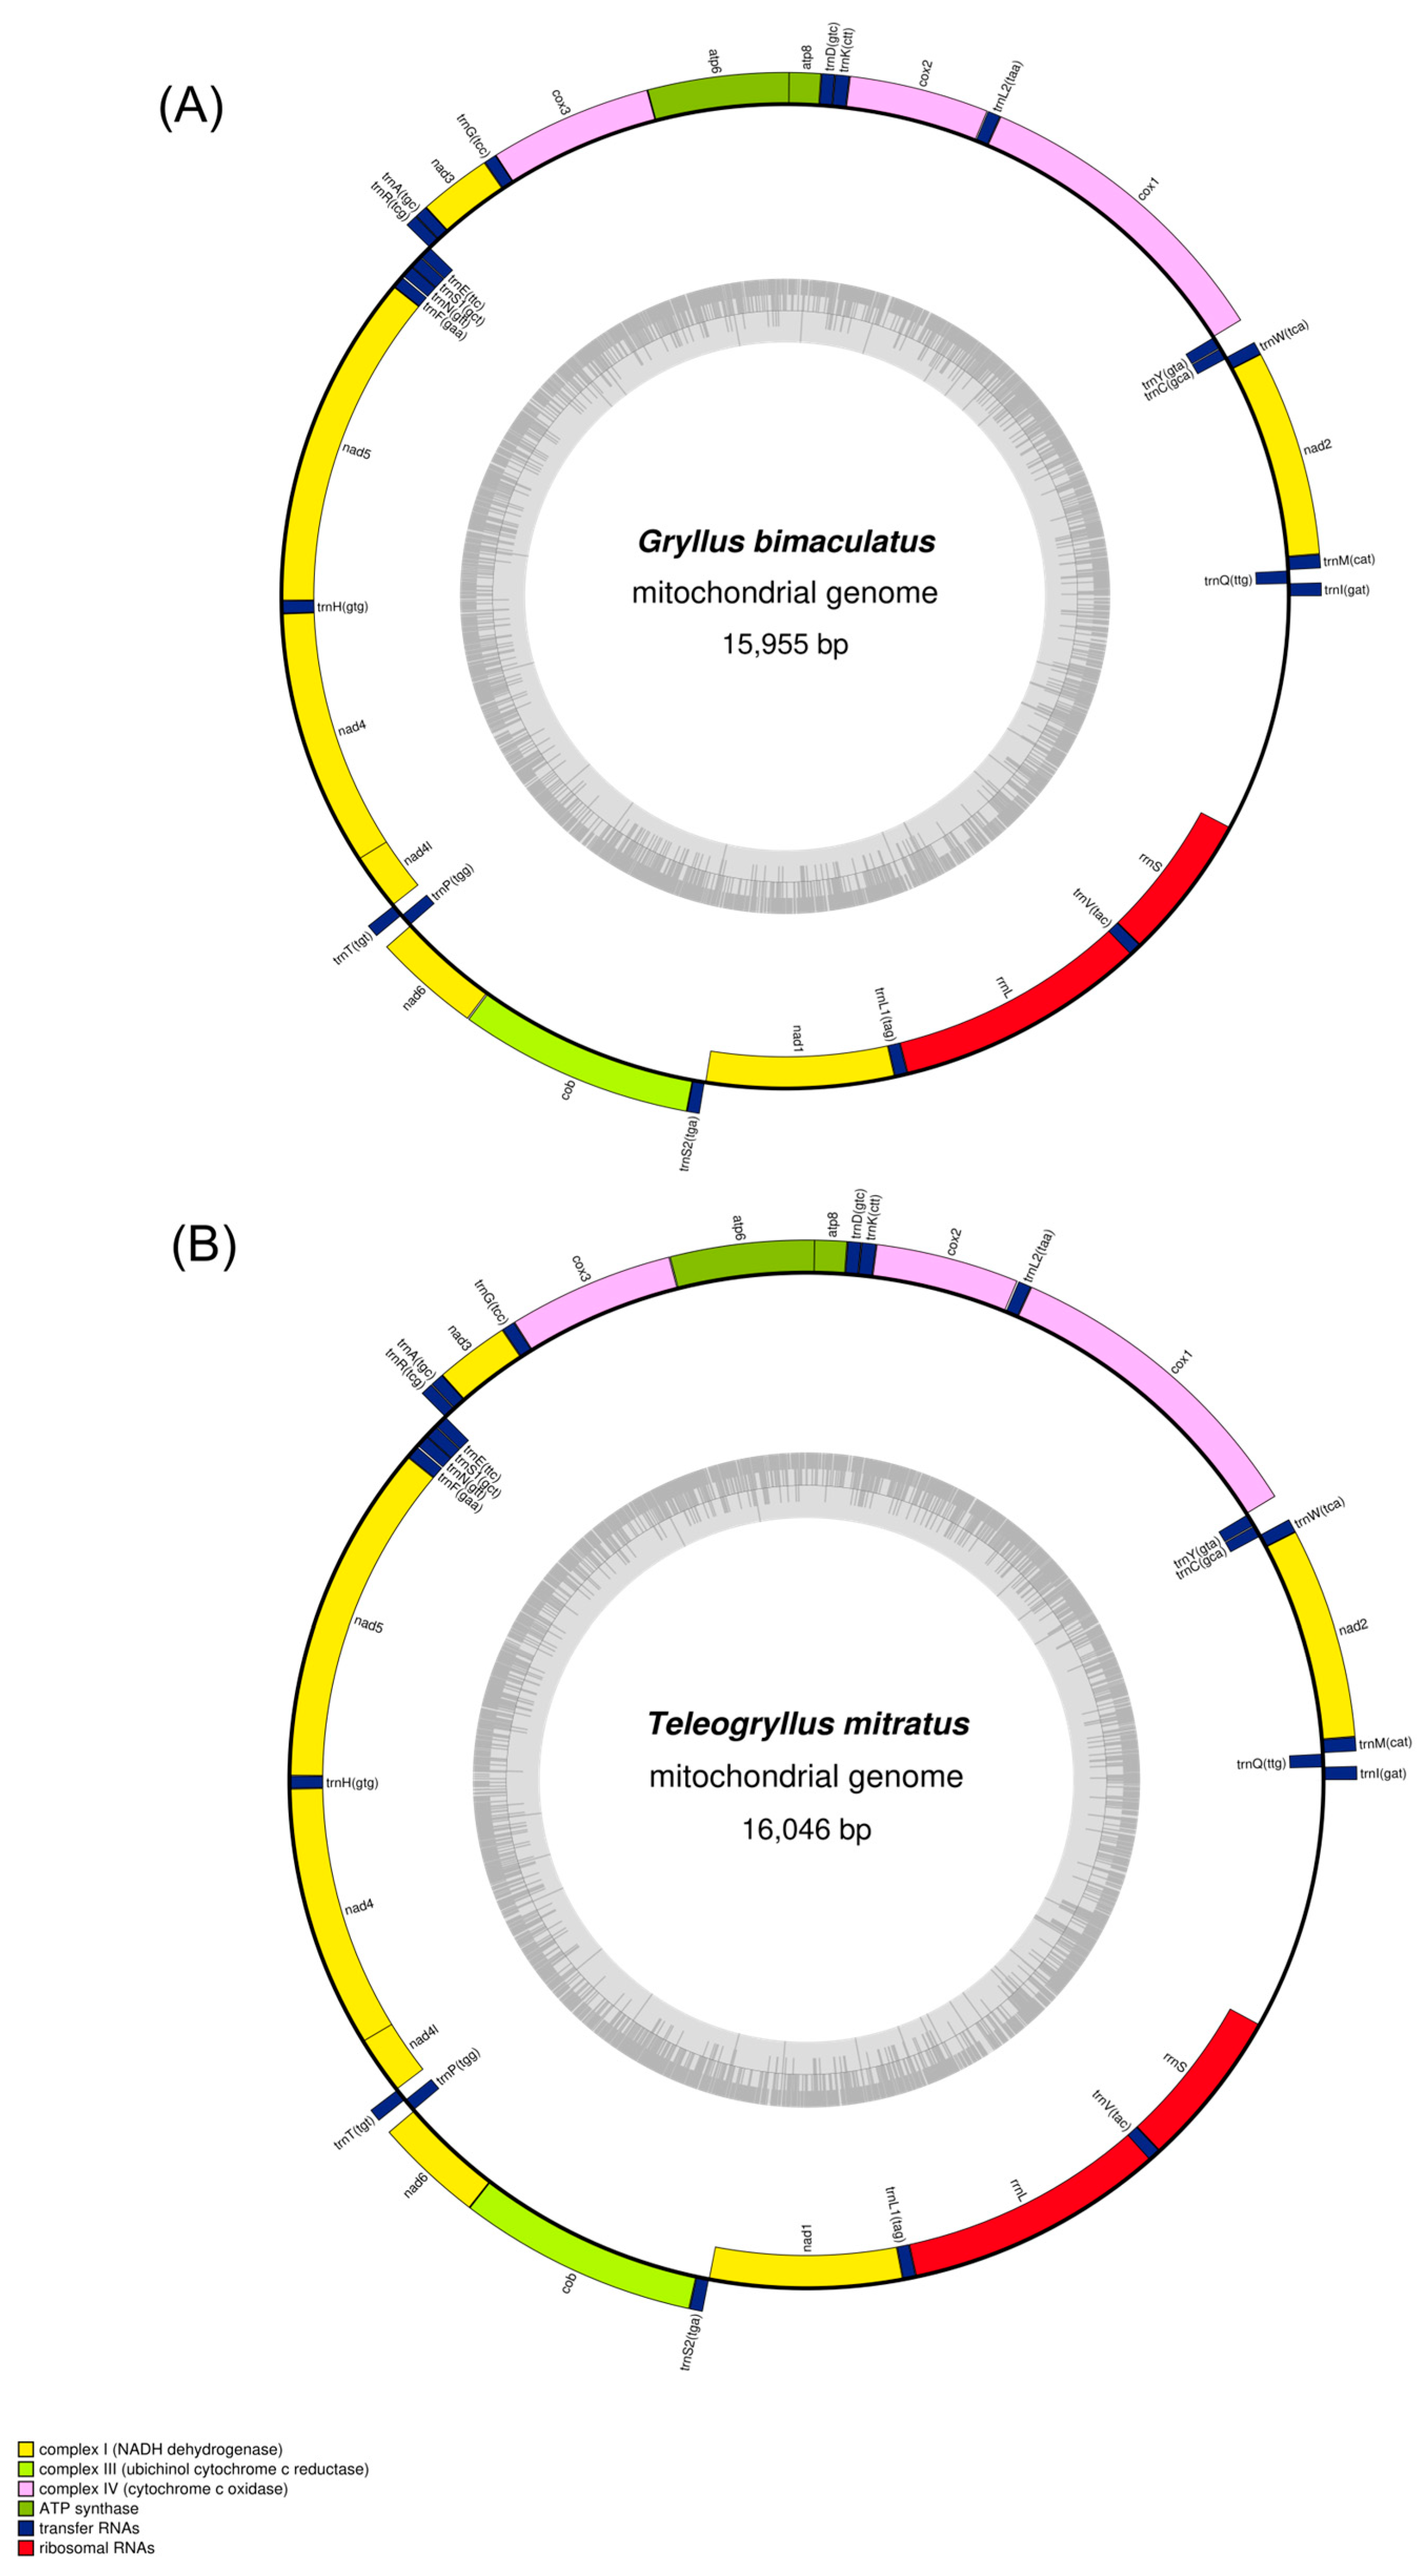
Figure 2.
Relative synonymous codon usage (RSCU) of protein-coding genes in the complete mitochondrial genome of G. bimaculatus (A) and T. mitratus (B). The RSCU values are color-coded based on the codon below the amino acid labels.
Figure 2.
Relative synonymous codon usage (RSCU) of protein-coding genes in the complete mitochondrial genome of G. bimaculatus (A) and T. mitratus (B). The RSCU values are color-coded based on the codon below the amino acid labels.
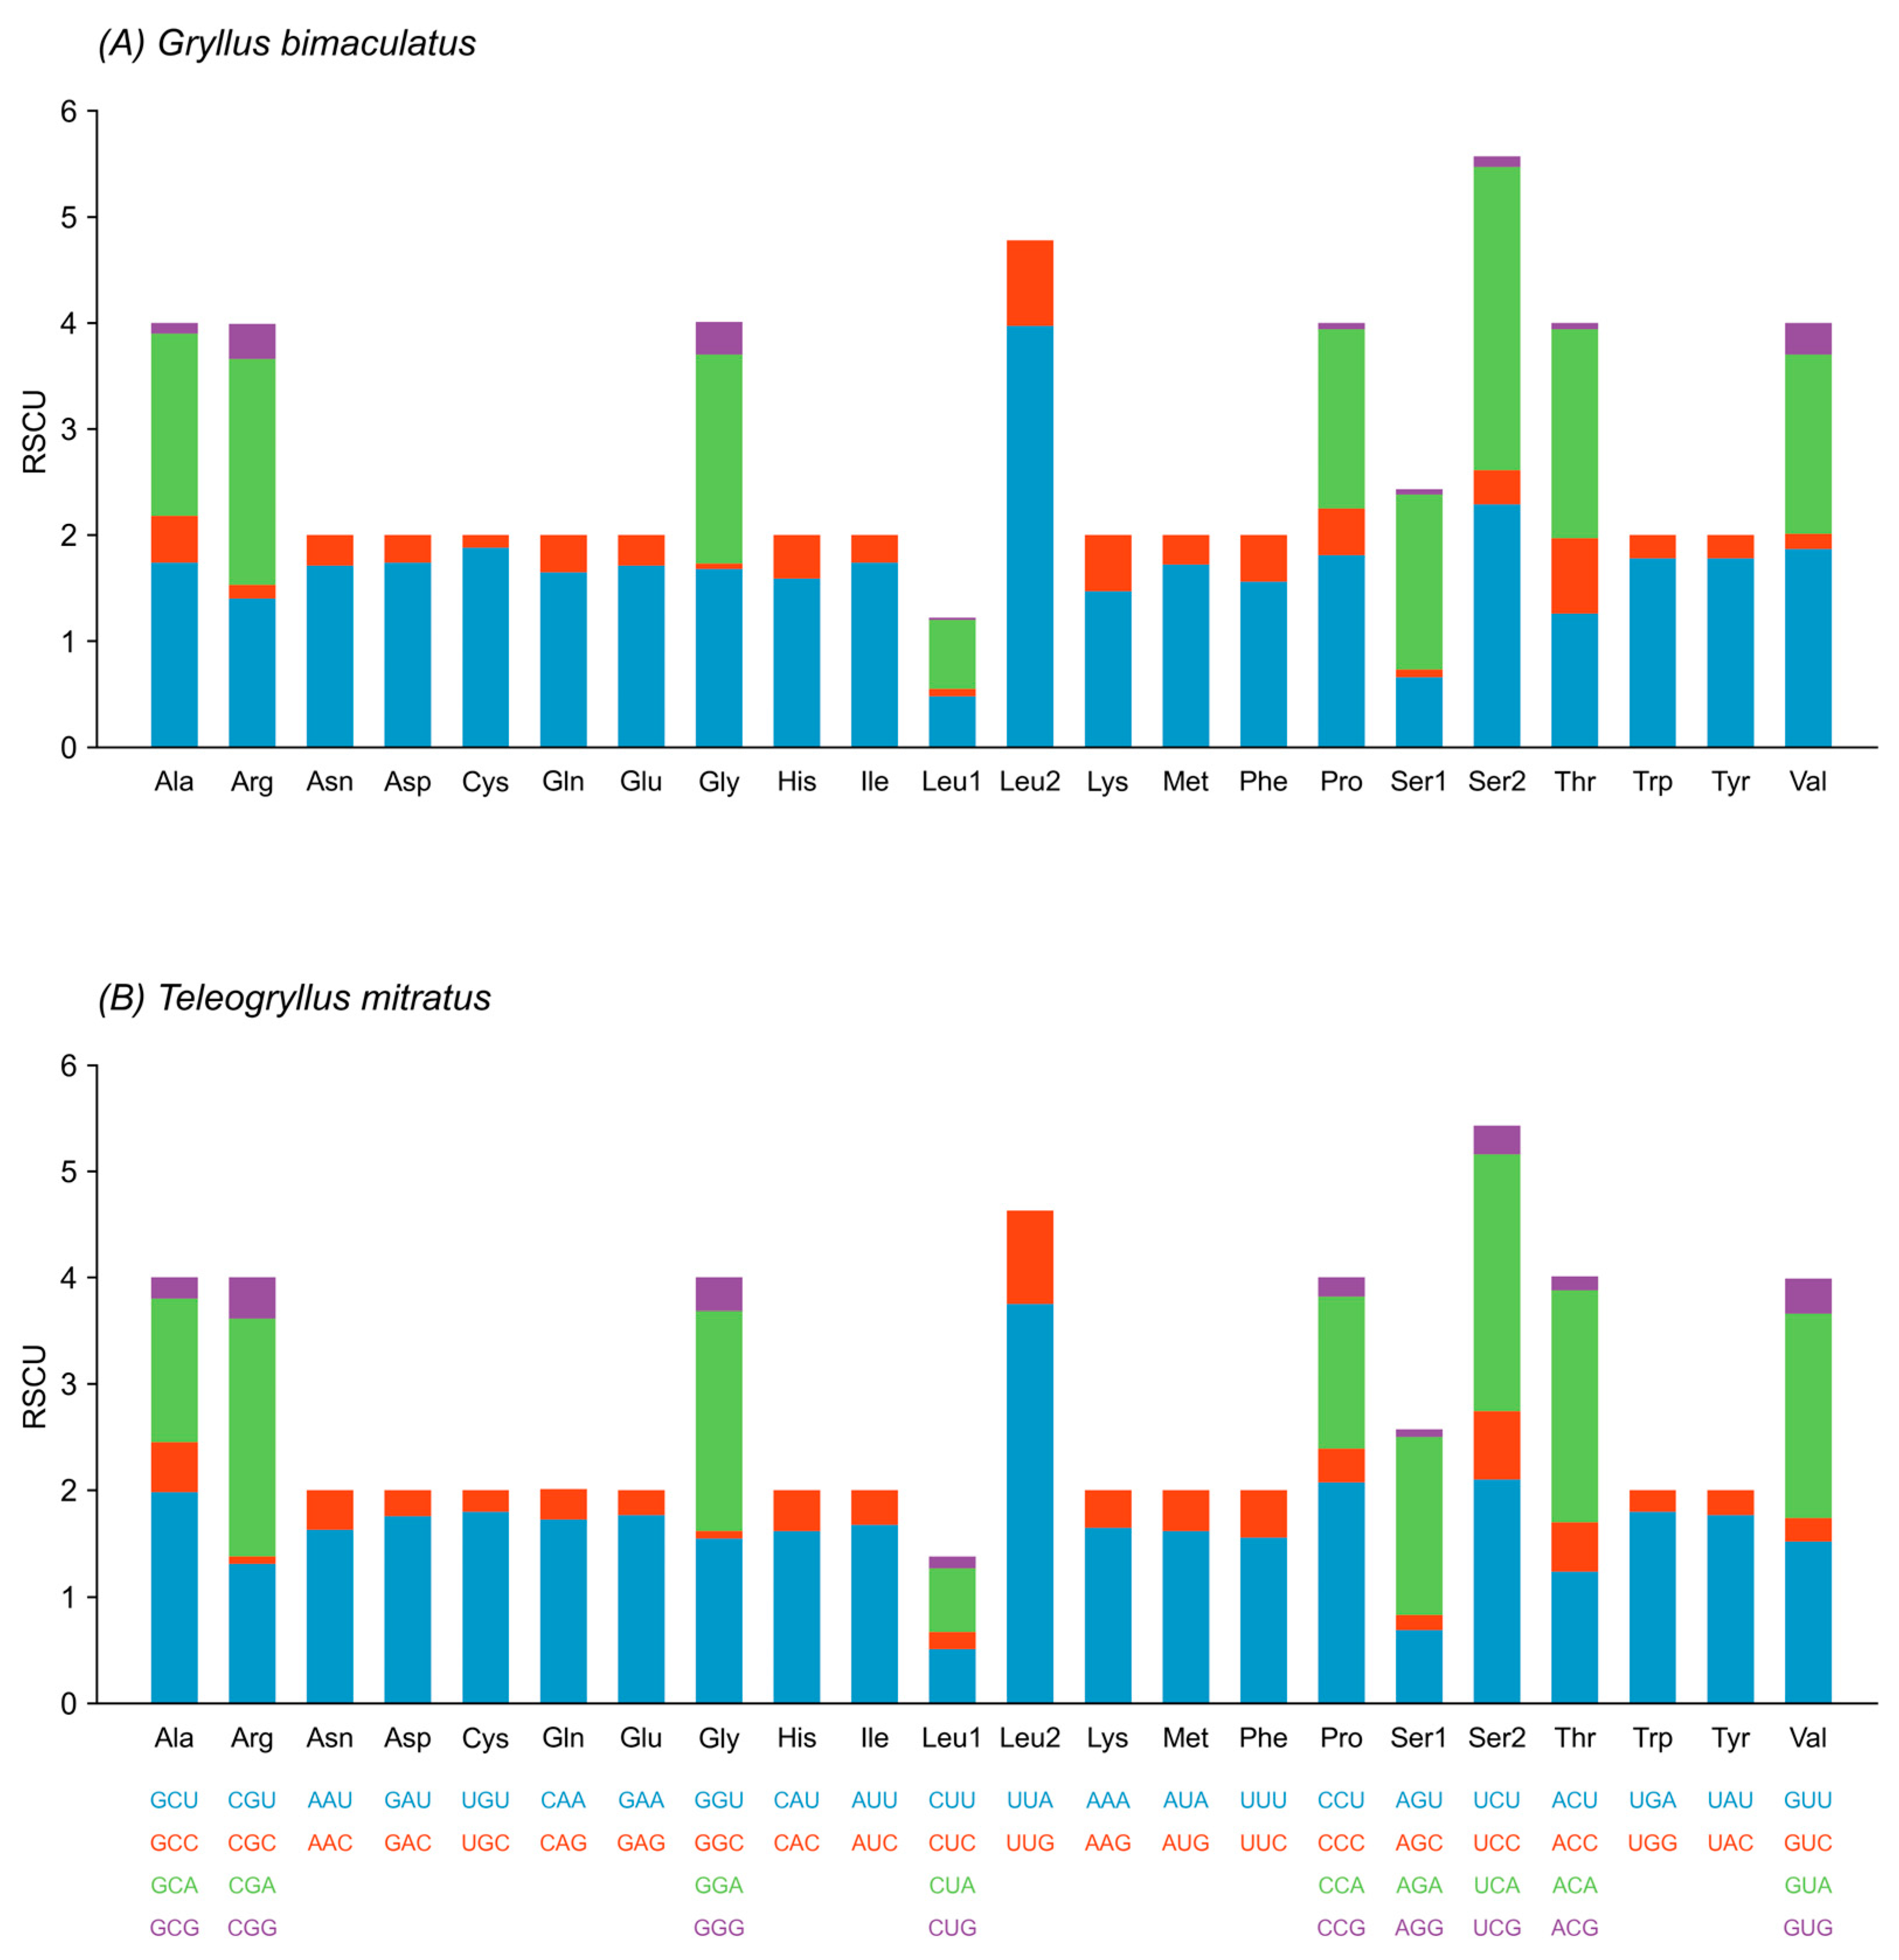
Figure 3.
Codon usage distribution and comparison in the mitochondrial genomes of G. bimaculatus and T. mitratus.
Figure 3.
Codon usage distribution and comparison in the mitochondrial genomes of G. bimaculatus and T. mitratus.
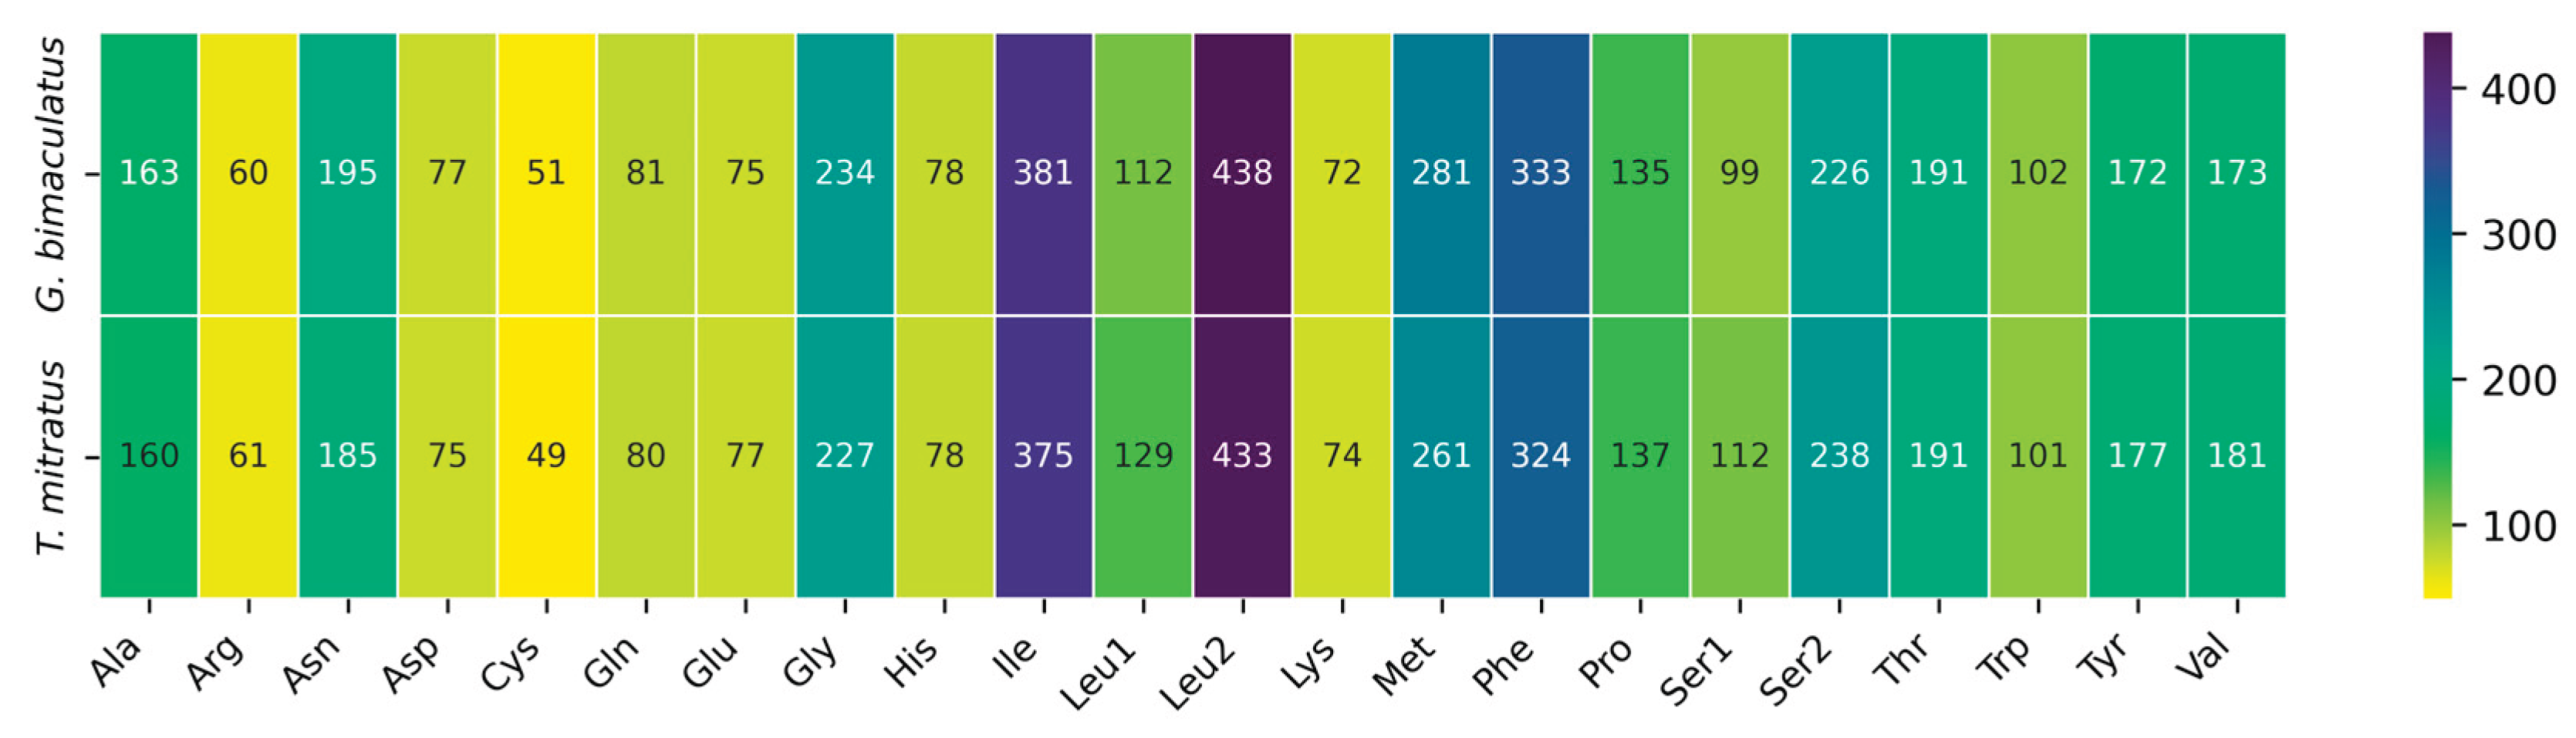
Figure 4.
The nonsynonymous to synonymous substitution rate ratio (Ka/Ks, ω) of mitochondrial protein-coding genes (PCGs).
Figure 4.
The nonsynonymous to synonymous substitution rate ratio (Ka/Ks, ω) of mitochondrial protein-coding genes (PCGs).
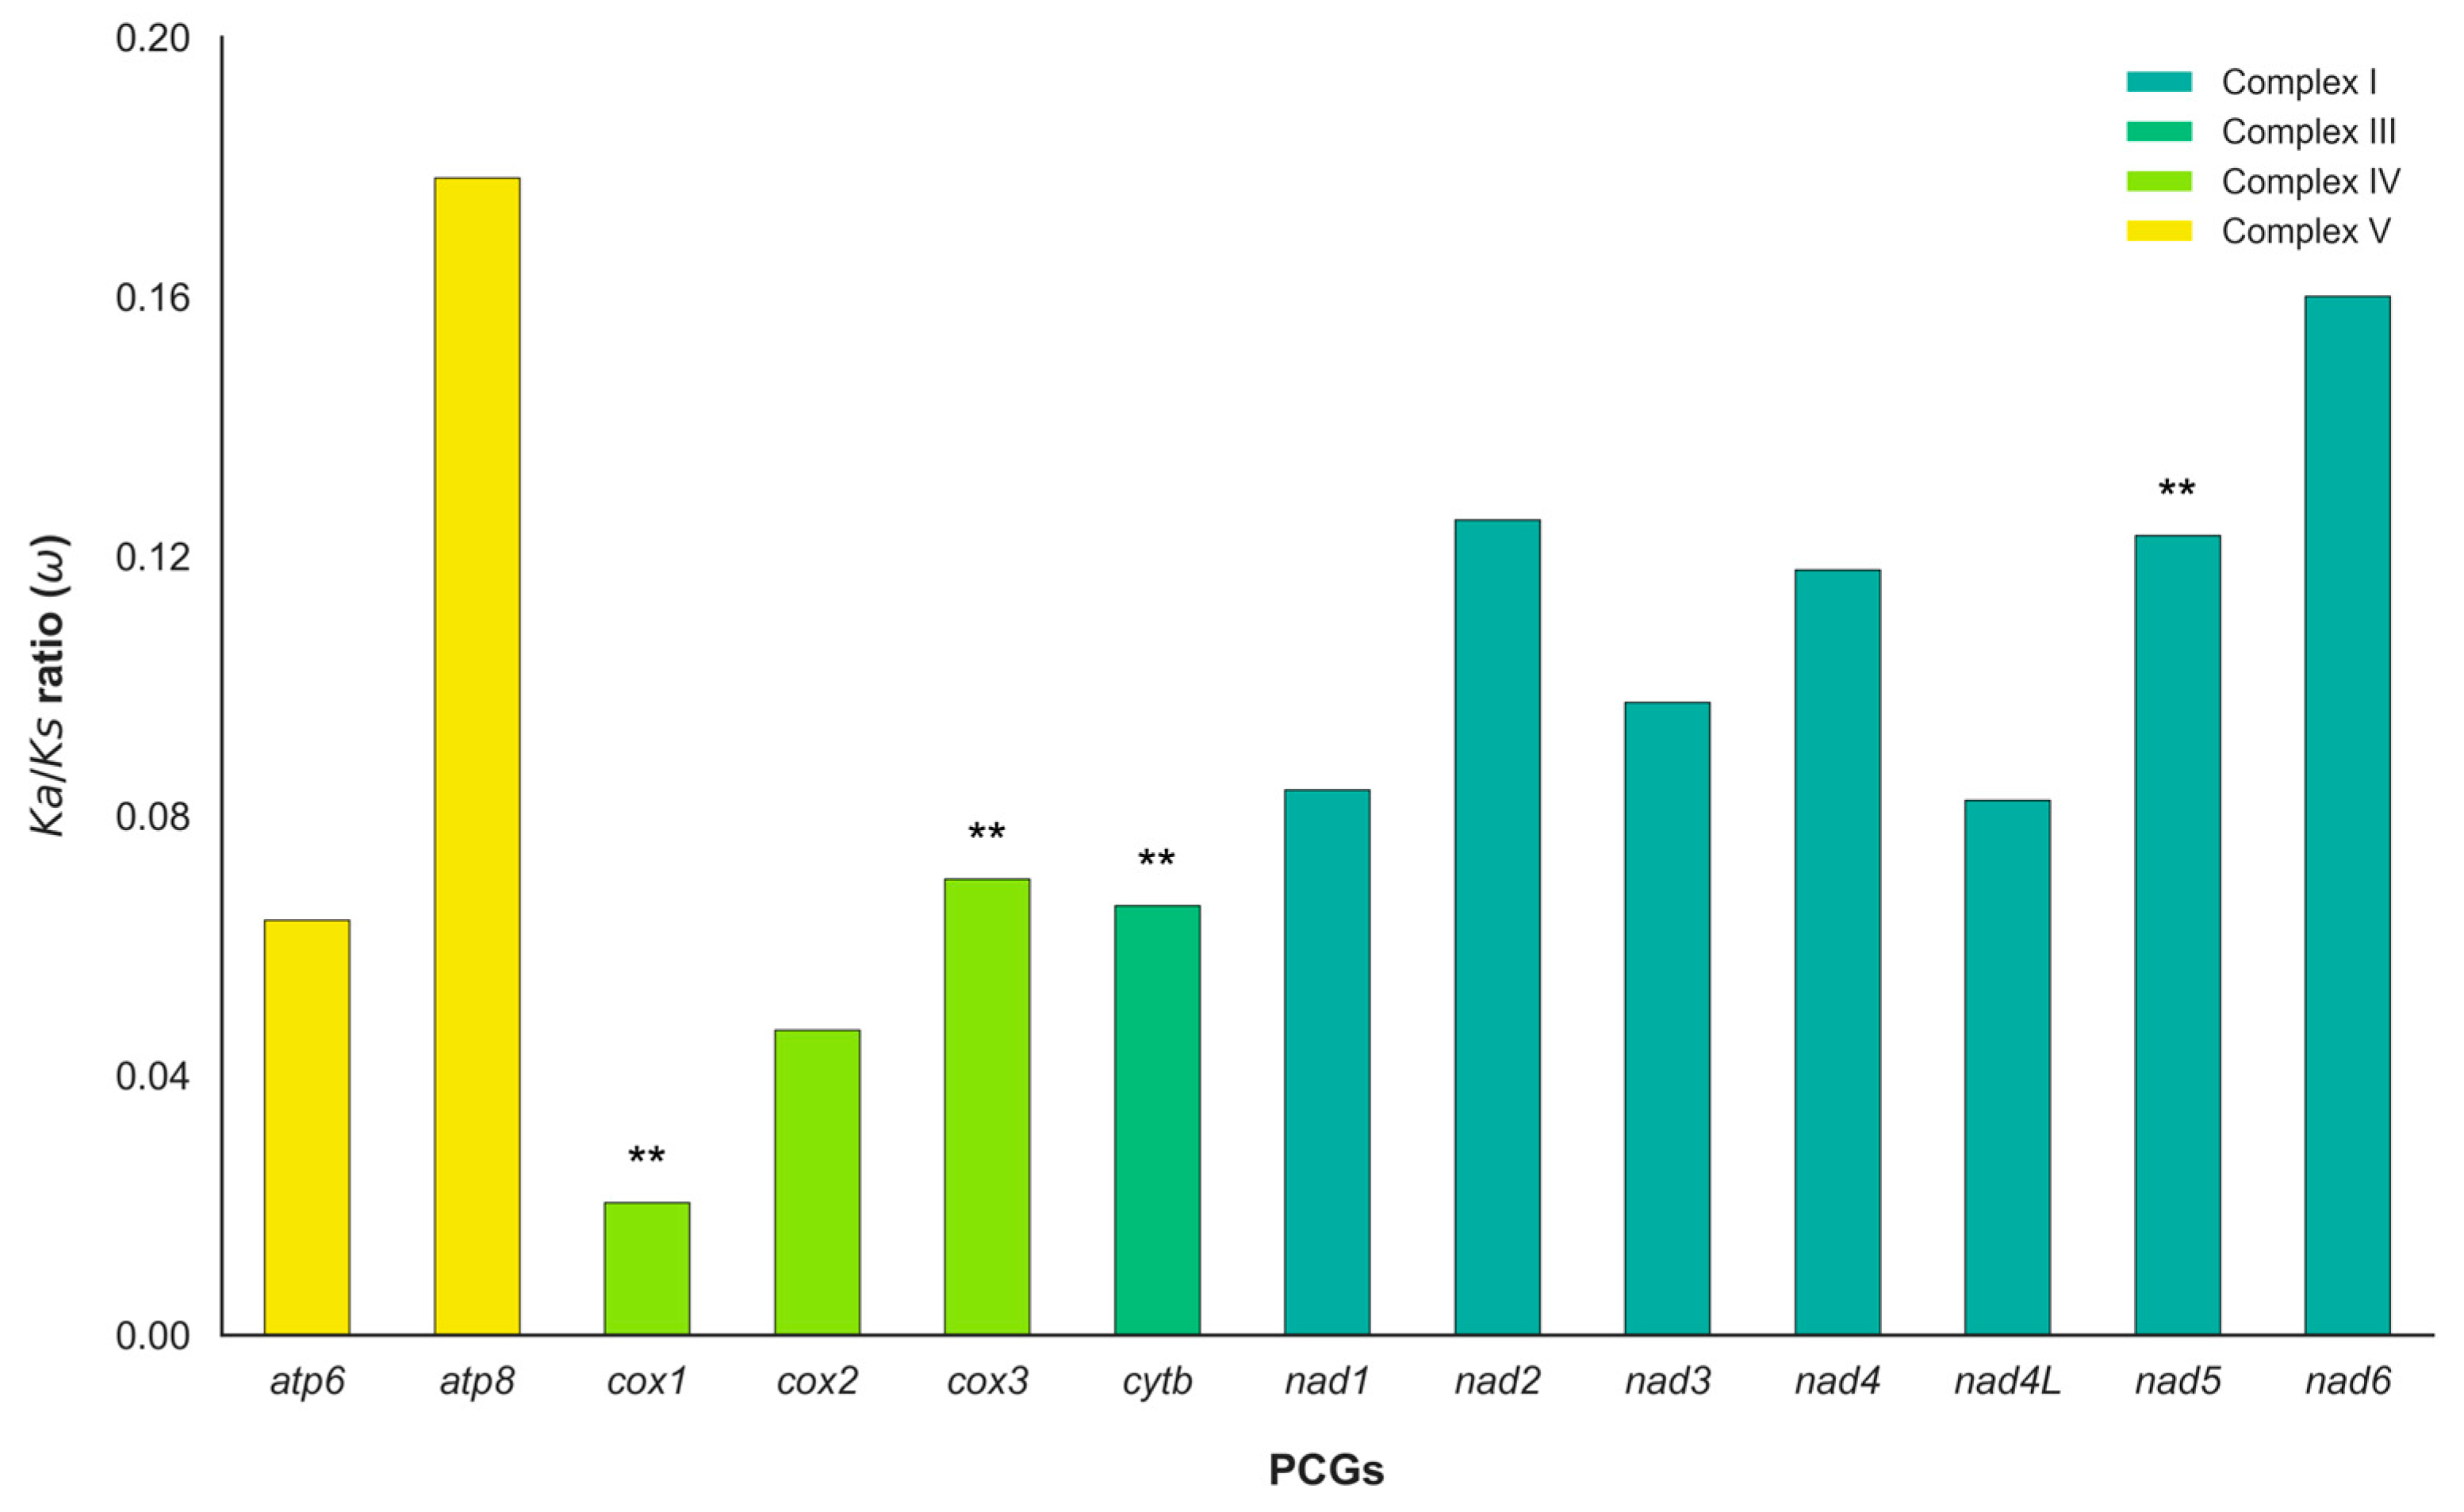
Figure 5.
Secondary structures of tRNASer1 found in the mitogenome of G. bimaculatus (A) and T. mitratus (B) that lack dihydrouridine (DHU) arm.
Figure 5.
Secondary structures of tRNASer1 found in the mitogenome of G. bimaculatus (A) and T. mitratus (B) that lack dihydrouridine (DHU) arm.
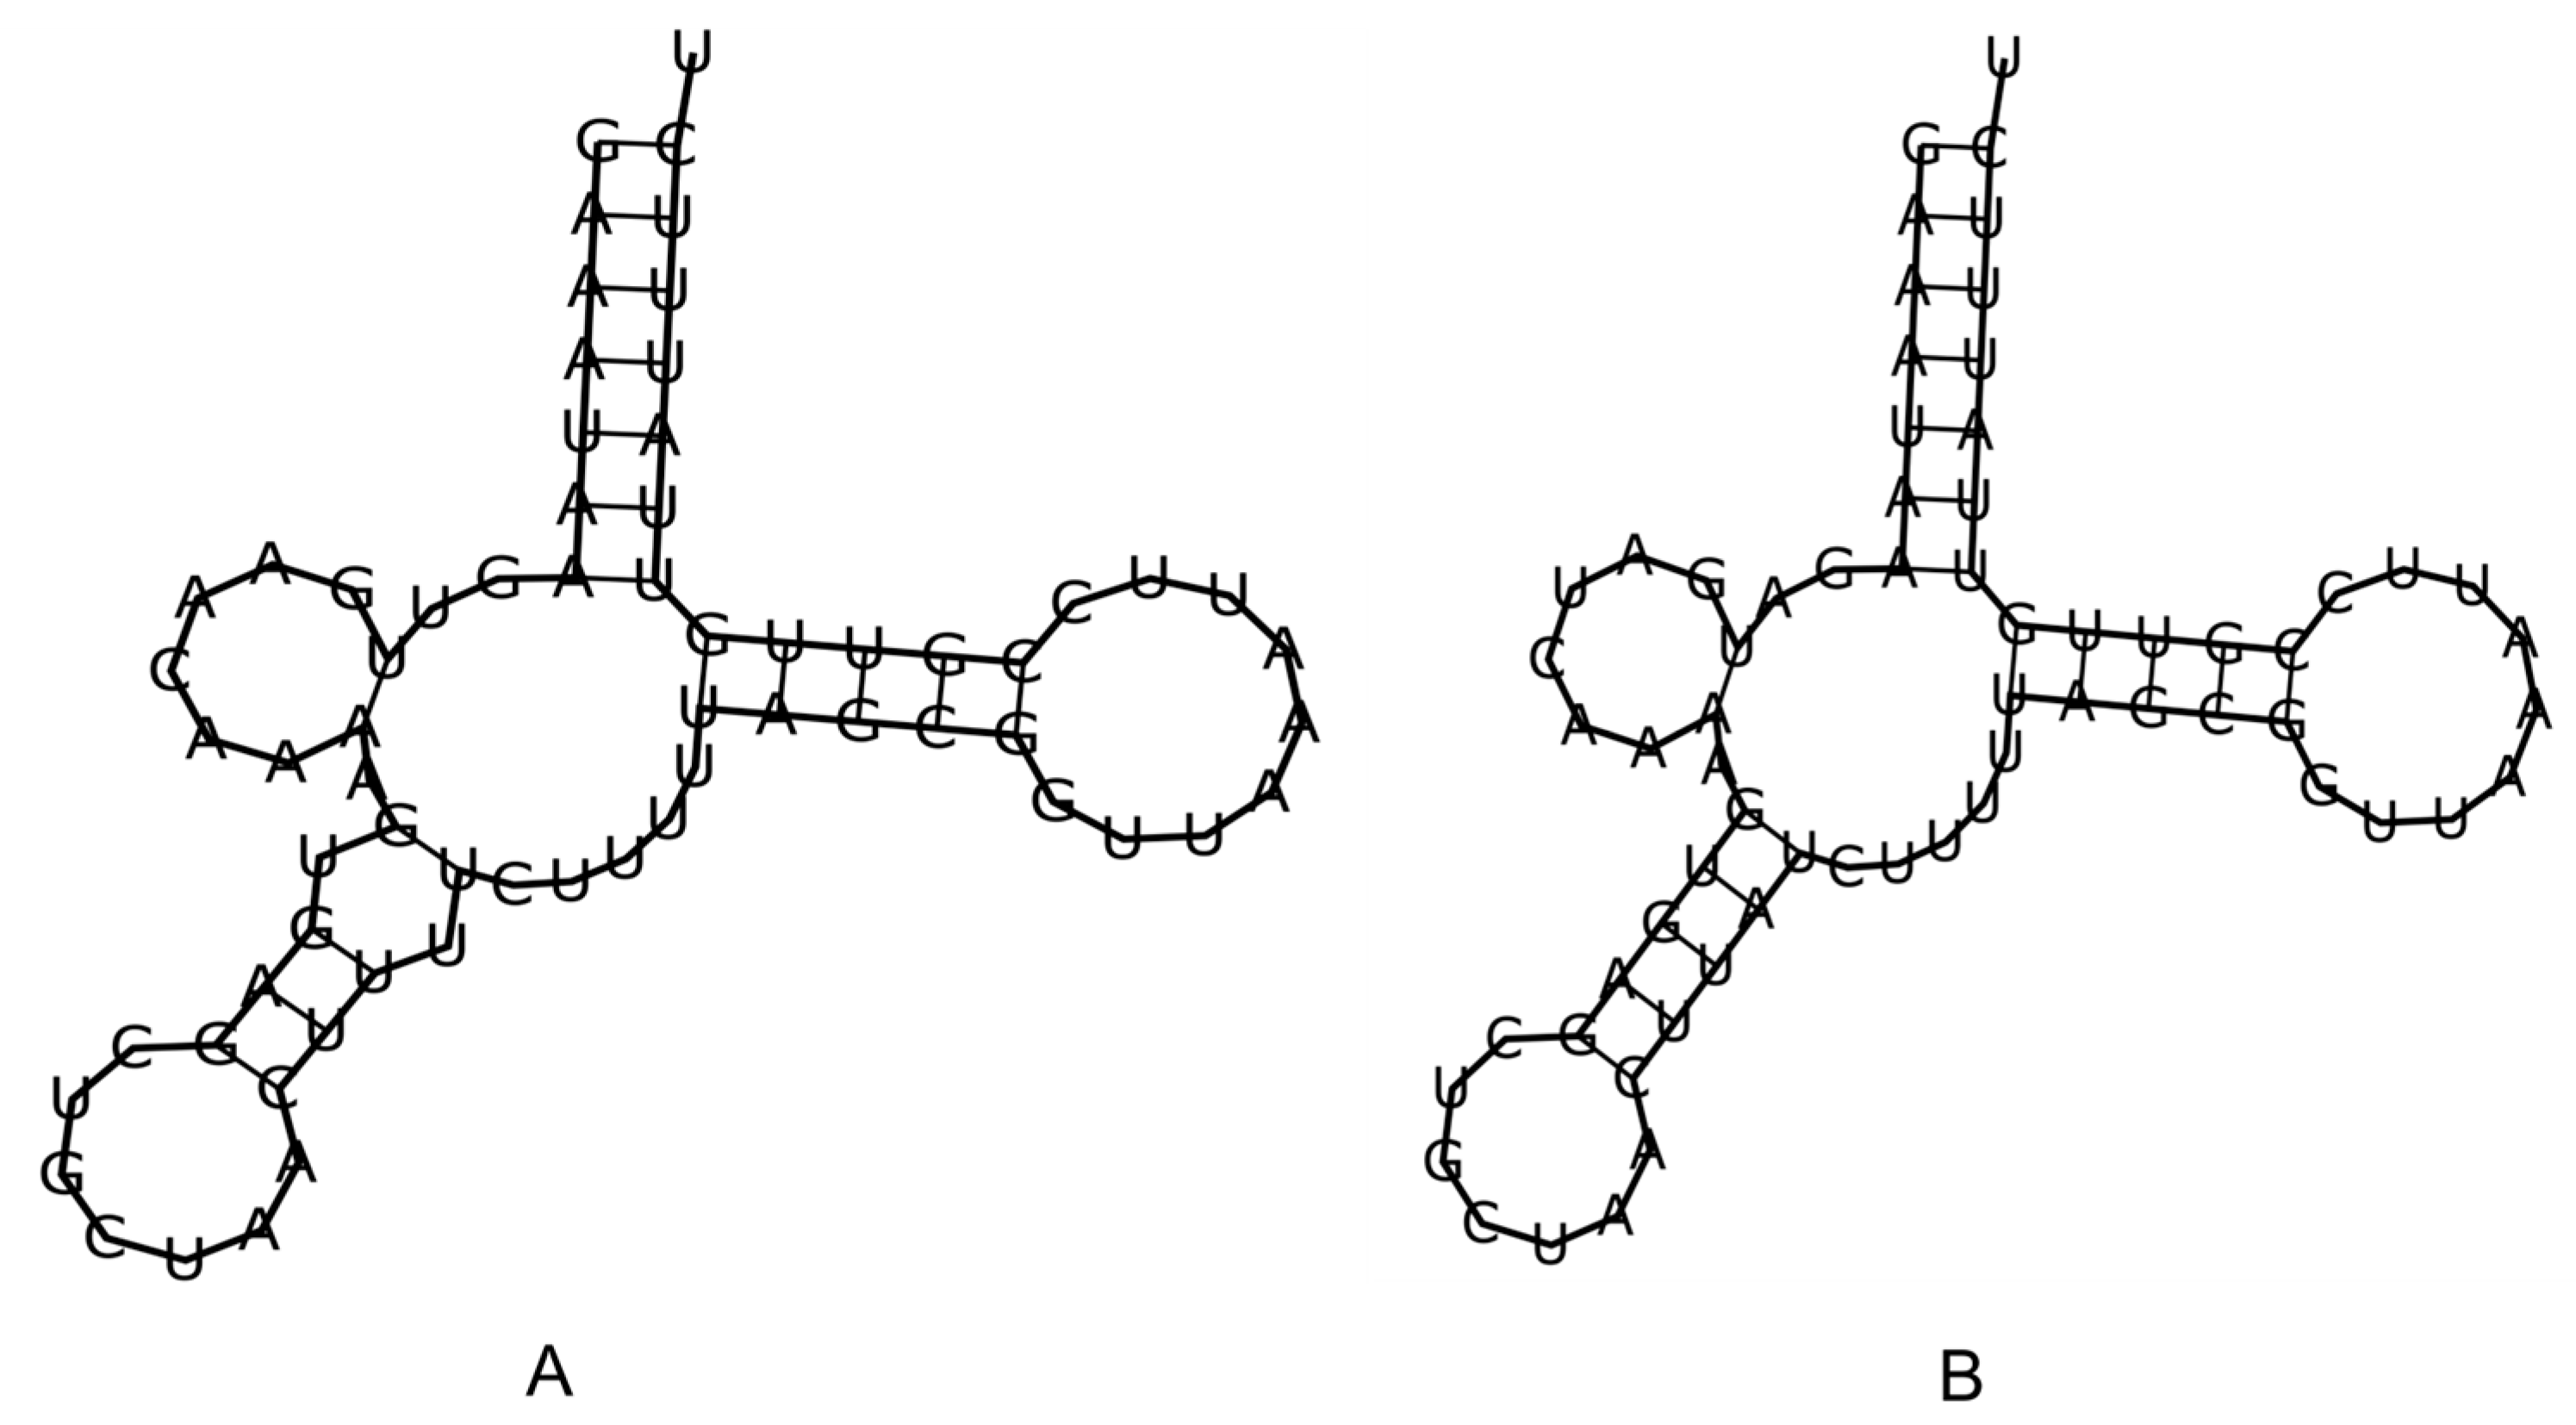
Figure 6.
Phylogenetic relationships of G. bimaculatus and T. mitratus within the family Gryllidae based on concatenated mitochondrial protein-coding genes (PCGs) and ribosomal RNA genes. The tree was inferred using Bayesian Inference (BI) (A) and Maximum Likelihood (ML) (B) methods, which yielded identical topologies. Numbers at nodes represent ML bootstrap support (%) and BI posterior probabilities, respectively. Ceuthophilus sp. and G. henana served as outgroups. The newly sequenced species from this study are highlighted in red color.
Figure 6.
Phylogenetic relationships of G. bimaculatus and T. mitratus within the family Gryllidae based on concatenated mitochondrial protein-coding genes (PCGs) and ribosomal RNA genes. The tree was inferred using Bayesian Inference (BI) (A) and Maximum Likelihood (ML) (B) methods, which yielded identical topologies. Numbers at nodes represent ML bootstrap support (%) and BI posterior probabilities, respectively. Ceuthophilus sp. and G. henana served as outgroups. The newly sequenced species from this study are highlighted in red color.
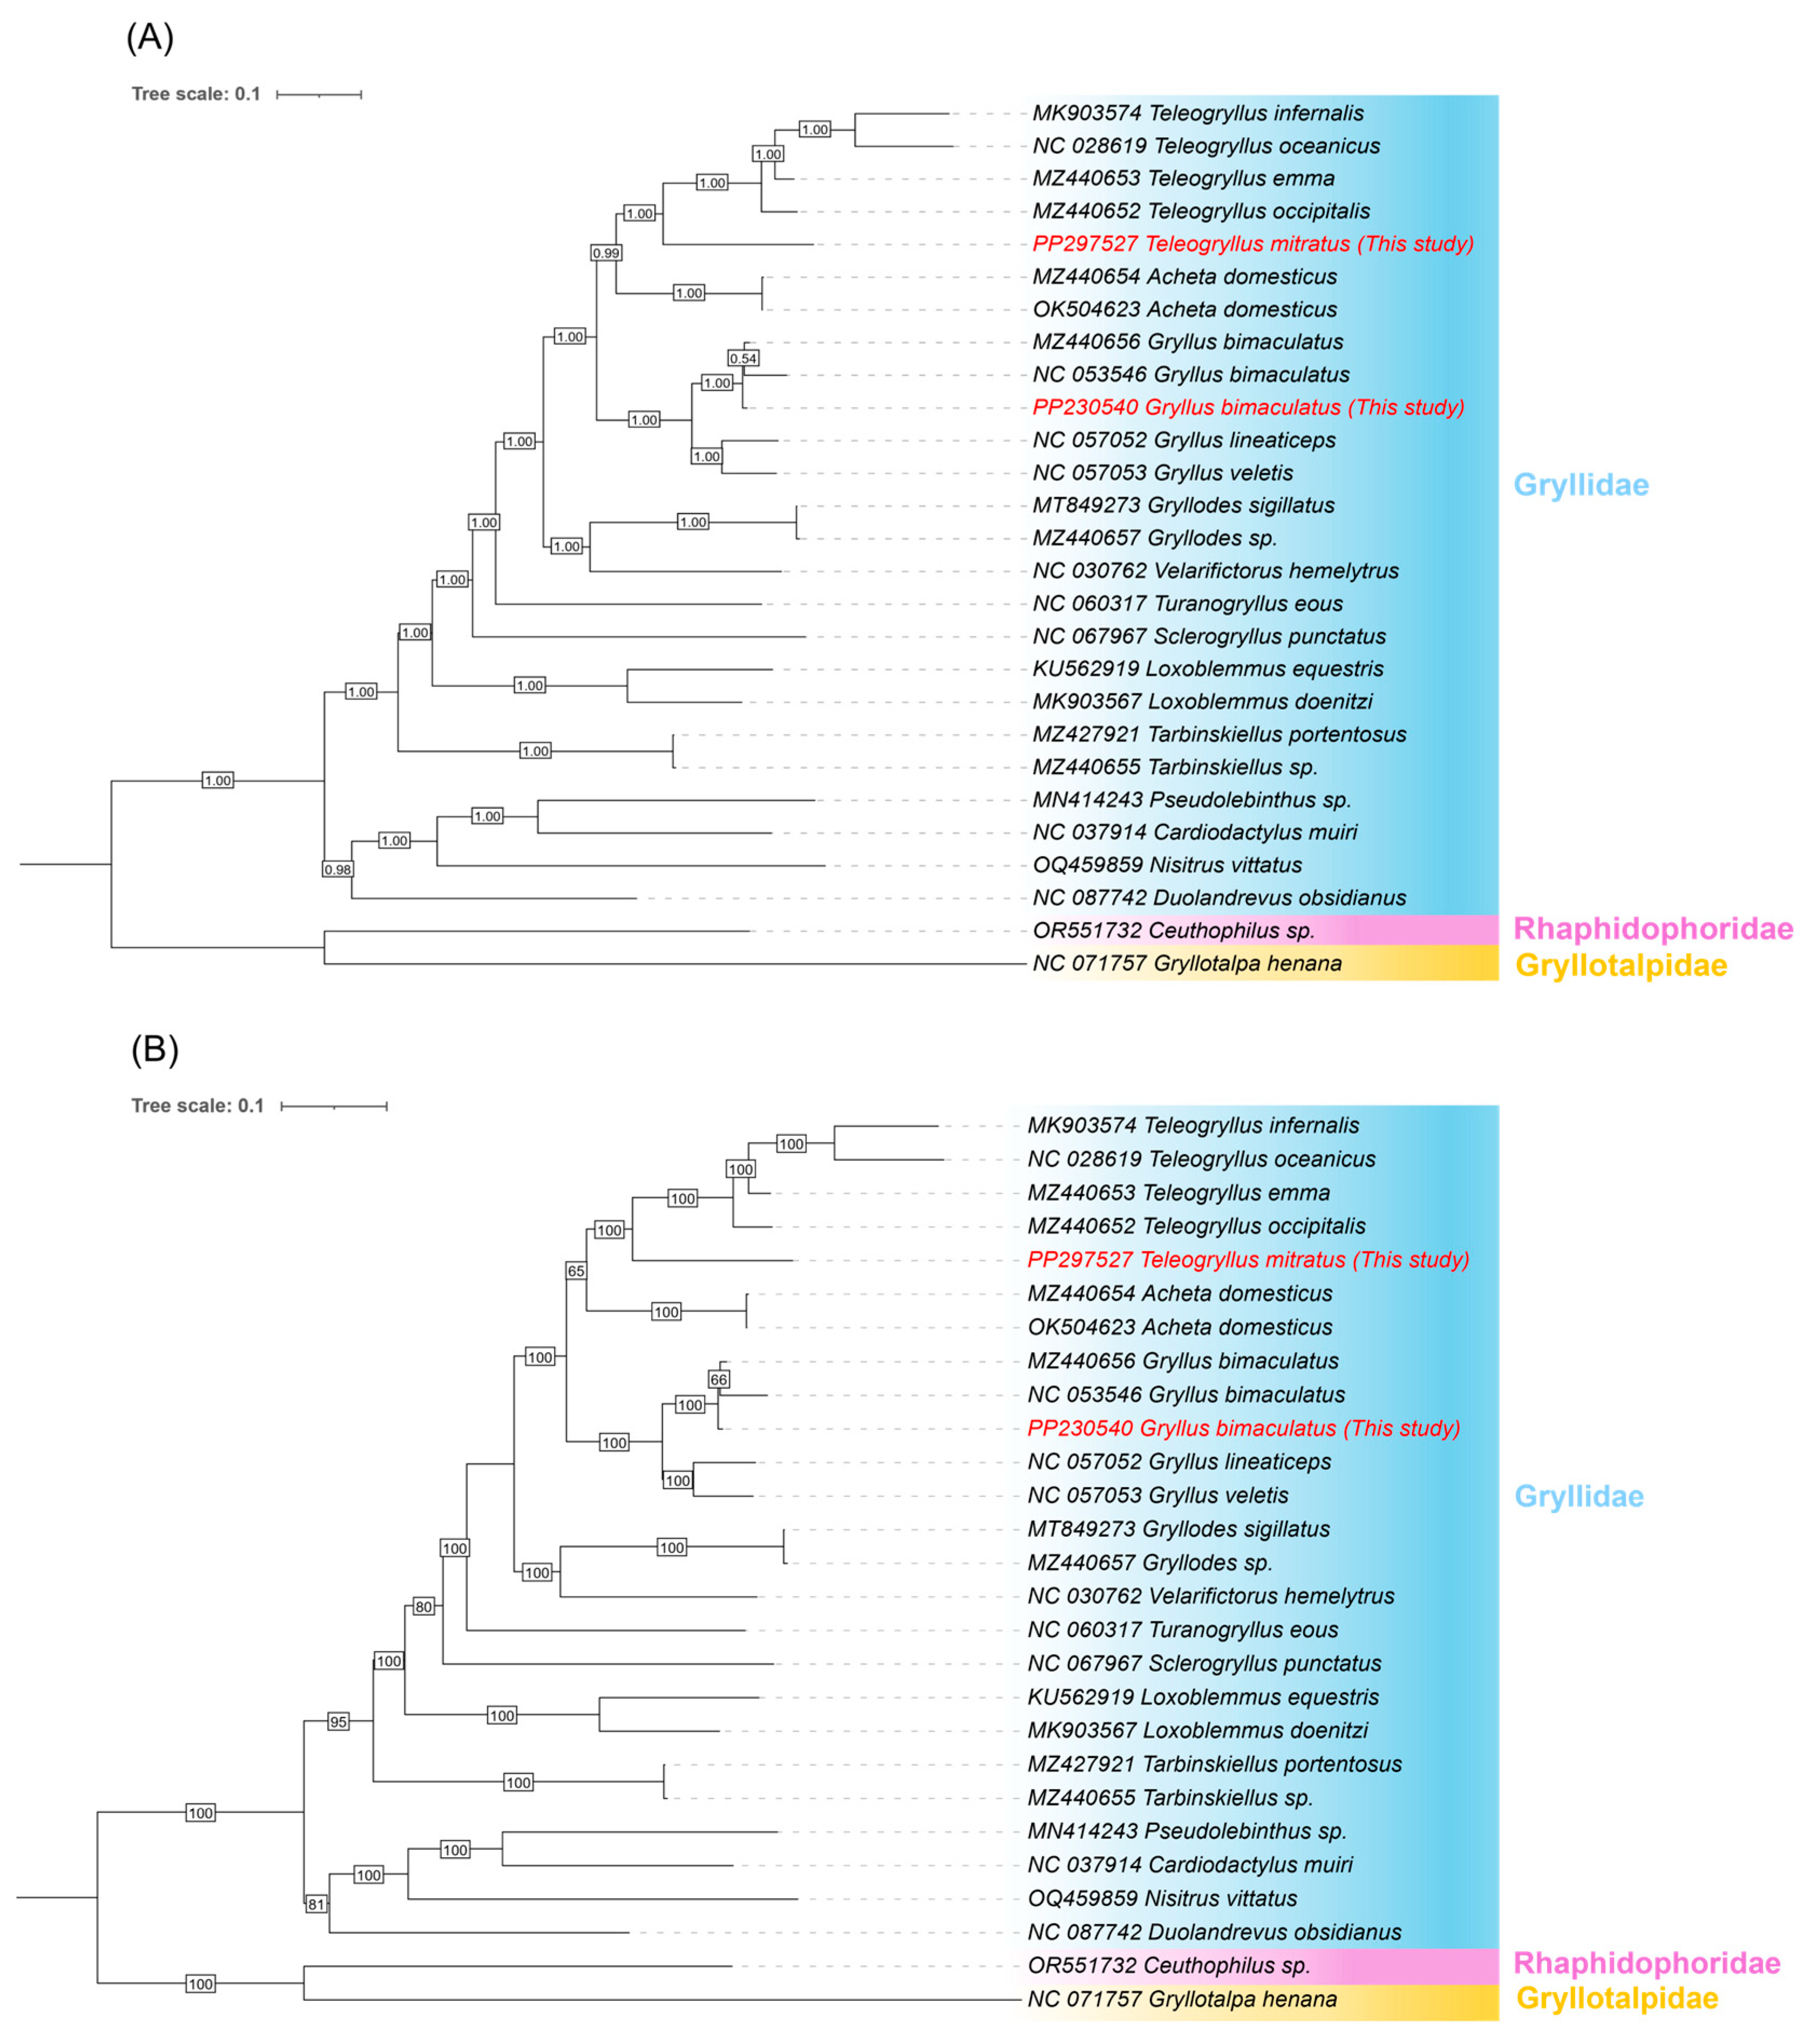

Table 1.
Nucleotide composition of two mitogenomes (G. bimaculatus and T. mitratus).
| Species | Regions | Length (bp) | A (%) | T (%) | C (%) | G (%) | AT (%) | GC (%) | AT-skew | GC-skew |
|---|---|---|---|---|---|---|---|---|---|---|
| G. bimaculatus | Mitogenomes | 15,955 | 40.5 | 33.5 | 16.9 | 9 | 74 | 25.9 | 0.095 | -0.31 |
| PCGs | 11,136 | 31.1 | 41.7 | 13.3 | 13.3 | 73.4 | 26.6 | -0.138 | 0.001 | |
| tRNAs | 1,448 | 37.6 | 38.4 | 9.5 | 14.4 | 76 | 23.9 | -0.01 | 0.205 | |
| rRNAs | 2,121 | 33.7 | 41.2 | 8 | 17.1 | 74.9 | 25.1 | -0.1 | 0.365 | |
| T. mitratus | Mitogenomes | 16,046 | 39.7 | 33.7 | 17 | 9.6 | 73.4 | 26.6 | 0.0821 | -0.28 |
| PCGs | 11,196 | 31.2 | 41.4 | 13.8 | 13.7 | 72.6 | 27.5 | -0.141 | -0.004 | |
| tRNAs | 1,452 | 38.6 | 36.9 | 9.8 | 14.7 | 75.5 | 24.5 | 0.022 | 0.202 | |
| rRNAs | 2,133 | 31.9 | 41.6 | 8 | 18.5 | 73.5 | 26.5 | -0.131 | 0.398 |
Disclaimer/Publisher’s Note: The statements, opinions and data contained in all publications are solely those of the individual author(s) and contributor(s) and not of MDPI and/or the editor(s). MDPI and/or the editor(s) disclaim responsibility for any injury to people or property resulting from any ideas, methods, instructions or products referred to in the content. |
© 2026 by the authors. Licensee MDPI, Basel, Switzerland. This article is an open access article distributed under the terms and conditions of the Creative Commons Attribution (CC BY) license (http://creativecommons.org/licenses/by/4.0/).
Copyright: This open access article is published under a Creative Commons CC BY 4.0 license, which permit the free download, distribution, and reuse, provided that the author and preprint are cited in any reuse.


