Submitted:
18 March 2026
Posted:
19 March 2026
You are already at the latest version
Abstract
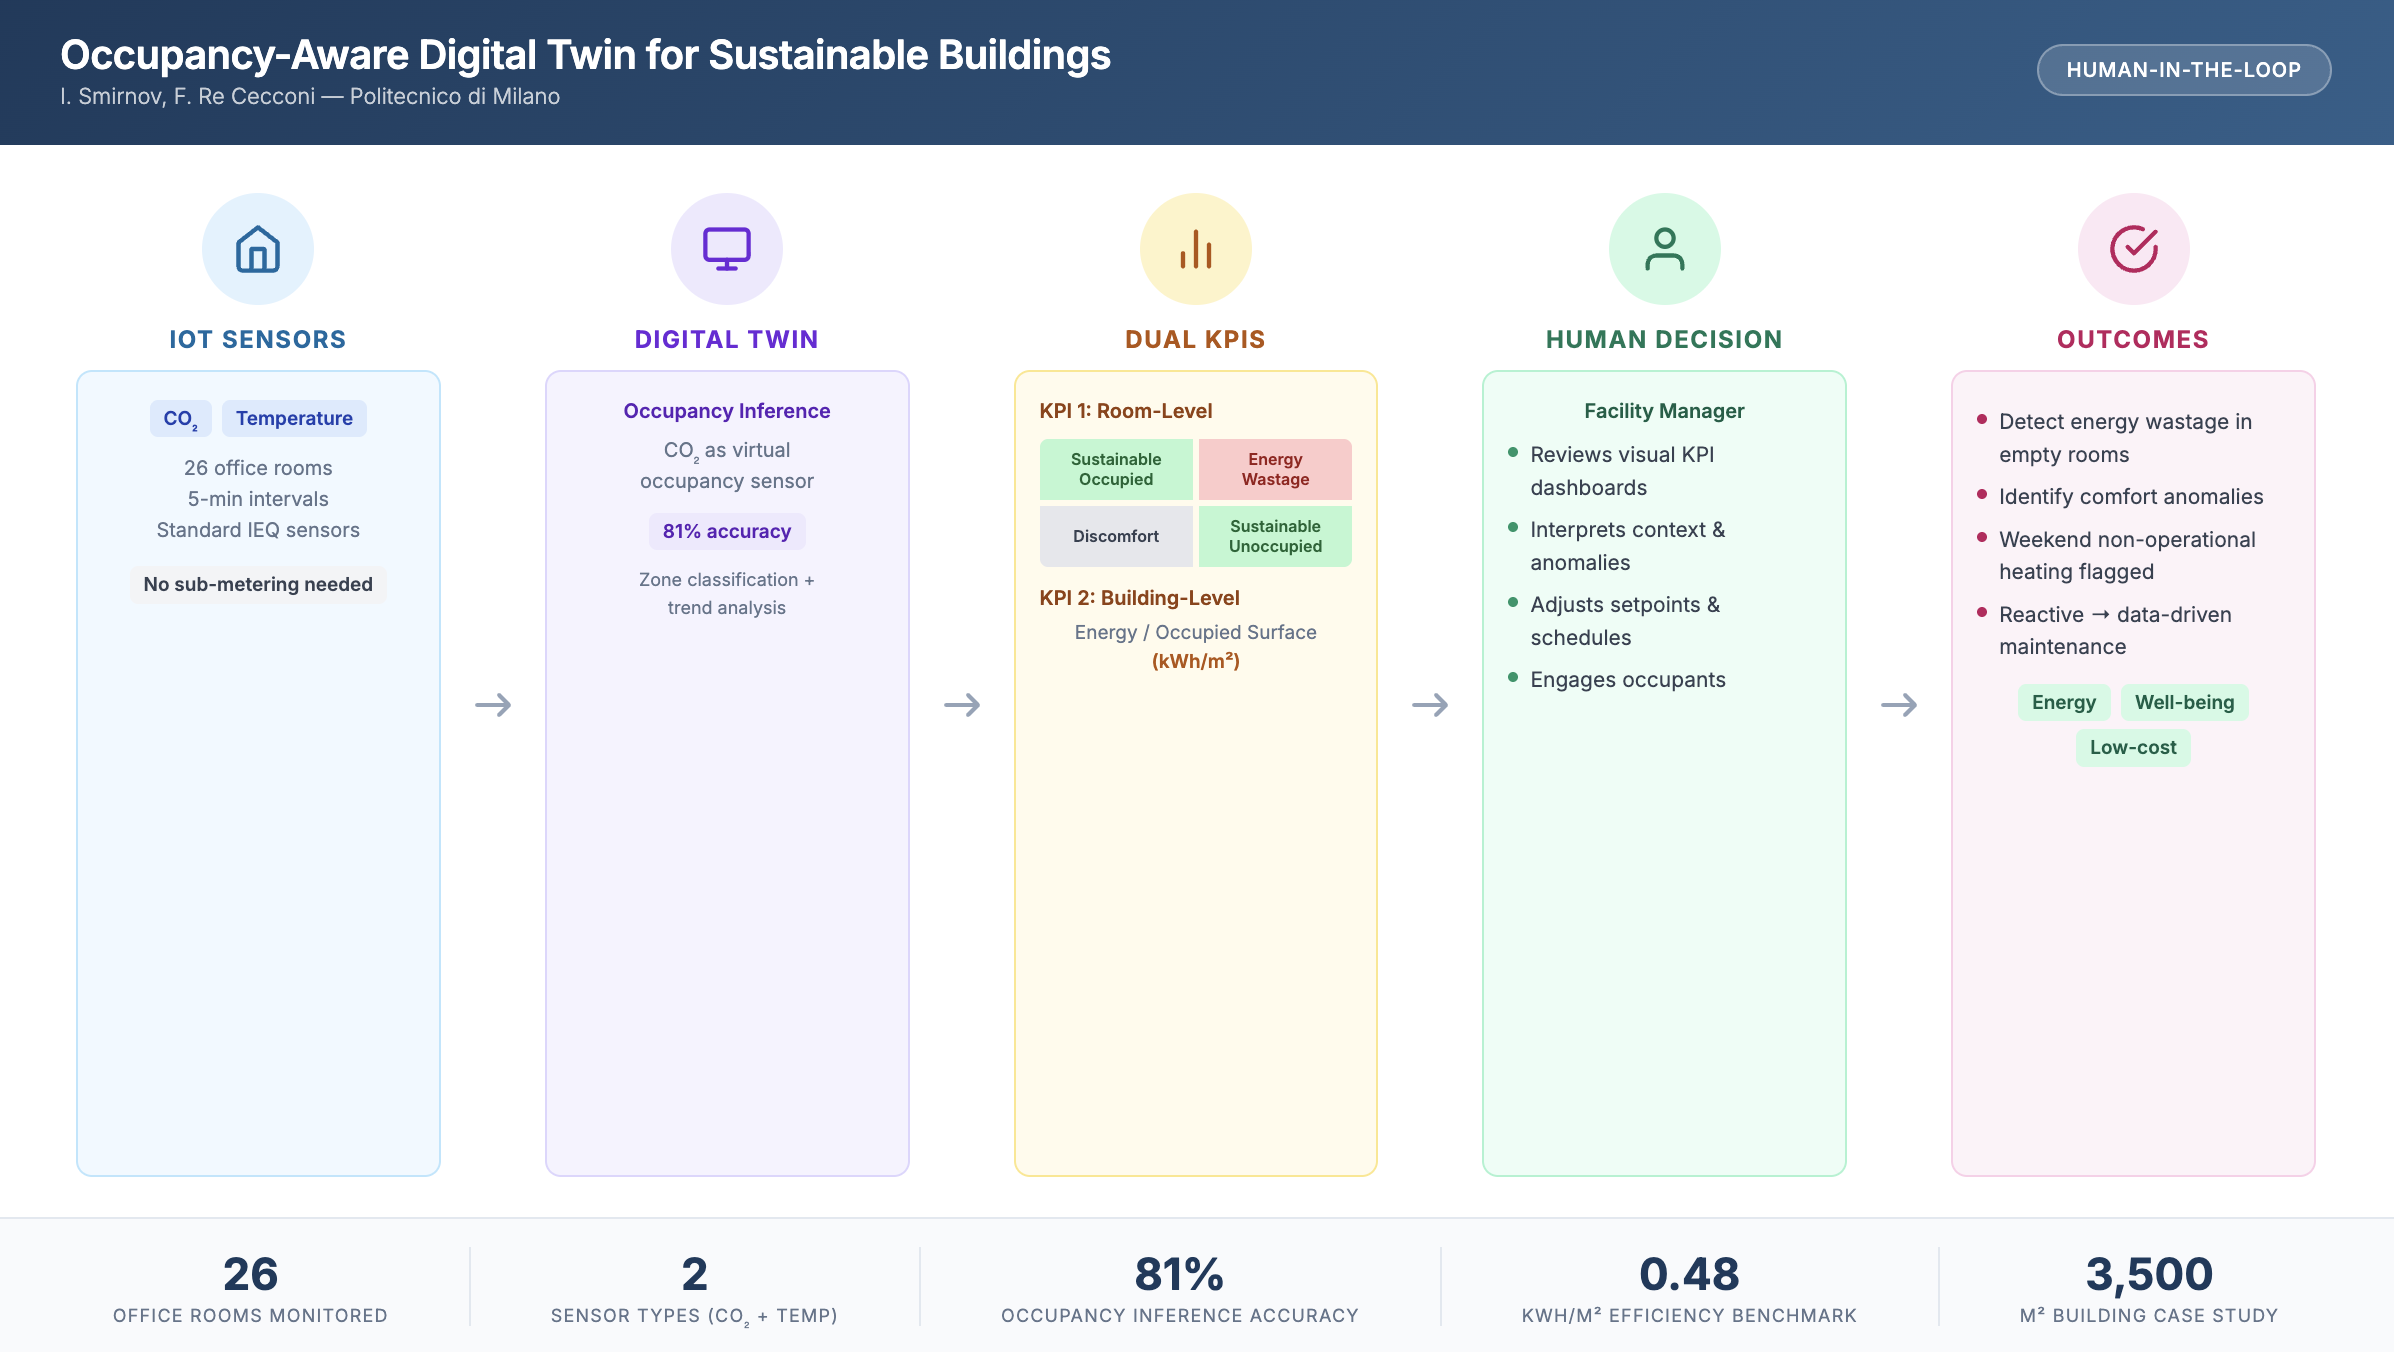
This paper proposes a human-centric Digital Twin (DT) framework balancing energy efficiency with occupant well-being in existing buildings, addressing the lack of actionable insights in data-driven facility management and comfort issues common in fully automated systems. A “Human-in-the-loop” approach using dual-KPIs integrates real-time IoT data and visualization to evaluate sustainable energy use via Indoor Environmental Quality (IEQ). A novel occupancy-inference method tracks efficiency in legacy buildings without granular metering, implemented through a case study of 26 office rooms. Results indicate that the framework successfully identifies significant energy wastage and comfort anomalies without compromising well-being. Integrating real-time analytics with human oversight enables more resilient management than fully automated alternatives, particularly for detecting non-operational heating waste. The occupancy inference method was validated against ground truth, achieving 81% accuracy, with limitations regarding decay lag discussed. This research offers a cost-effective diagnostic tool for legacy buildings lacking sub-metering, lowering DT adoption barriers, and shifting maintenance from reactive to data-driven strategies. The framework leverages human expertise and infers occupancy-normalized energy metrics from standard IEQ sensors, proposing a human-centric DT framework to bridge the gap between raw sensor data and actionable facility management insights.
Keywords:
digital twin
; indoor environmental quality
; occupancy inference
; energy efficiency
; key performance indicators
; building management
; human-in-the-loop
; CO2 monitoring
1. Introduction
The relationship between the built environment and human biology is foundational to facility management. While the primary function of a building is shelter, modern commercial facilities act as active life-support systems that must optimize the cognitive and physiological well-being of occupants. Research has firmly established that working in environments characterized by high temperatures and elevated carbon dioxide CO2 concentrations is detrimental to human health [23].
A study by Satish et al. [26] demonstrated that CO2 is not merely a proxy for ventilation but a direct pollutant affecting cognitive function. Exposure to indoor CO2 concentrations of 1,000 parts per million (ppm) and more markedly at 2,500 ppm can significantly impact decision-making performance, strategic thinking, and information usage in adults. When combined with thermal stress, these conditions cause cardiovascular strain and fatigue, leading to measurable declines in productivity and increased morbidity risks in vulnerable populations [21].
Simultaneously, commercial buildings remain dominant consumers of global energy, responsible for approximately 40% of total usage and a third of greenhouse gas emissions [20]. This creates a fundamental tension: the mandate to aggressively reduce energy consumption (e.g., by reducing ventilation rates or widening temperature deadbands) often comes at the direct expense of IEQ. Facility managers are tasked with a complex optimization problem: how to reduce the carbon footprint without compromising the “human footprint” of health and productivity. Standards such as LEED [19] and WELL [29] have codified these dual requirements but the reality of balancing them remains difficult for many existing assets.
Digital twin (DT) technology has emerged as a promising tool in asset management to address the challenge of combining a sustainable use of resources with the best possible IEQ in a building and as a “hype” technology in AEC [6]. A DT is essentially a dynamic virtual representation of a physical building that continuously mirrors the state of the real environment and enables convergence between the physical and digital states at an appropriate rate of synchronisation [17]. Prior studies have demonstrated DT applications in optimizing HVAC settings, improving energy efficiency, and even performing predictive maintenance on equipment [8,15,16,28]. In essence, DTs offer a data-driven approach to achieve sustainability goals by making the invisible aspects of building performance visible and manageable.
Nonetheless, fully automated digital twin–driven control systems, while enabling near real-time decision-making and action across assets, present notable limitations. A frequently cited concern is the marginalization of the human element: when operational decisions are determined exclusively by automated algorithms or distant managers, occupants may experience a diminished sense of agency. Indeed, research has found that if building adjustments such as thermostat settings or window controls are made without occupants’ input or understanding of their needs, it often leads to occupant dissatisfaction [25]. For instance, automated façade controls intended to save energy have become a source of frustration when they fail to meet individual comfort preferences or offer no manual override for users [10]. Such user disempowerment can reduce overall comfort and acceptance of smart building technologies [30]. Additionally, technical and retrofit challenges can hinder the deployment of DT systems in existing buildings [12]. Many older buildings lack the necessary digital models or sensors and, more importantly, actuators infrastructure, making it difficult to implement a comprehensive digital twin without significant upgrades [18]. Overall, in legacy buildings, DTs often lack full bi-directional control due to hardware limits. These limitations highlight that a purely automated, top-down approach to smart building management may fall short in terms of occupant comfort, user adoption, and practical feasibility in legacy building stock.
A more pervasive issue is the “gap” between data collection and insight generation. The shift toward data-driven facility management is hindered not by a lack of data, but by a lack of effective tools to convert raw telemetry into actionable insights. Massive amounts of data regarding temperature, CO2, and energy are collected, but they are rarely used effectively. These data end up in “data lakes,” disconnected from the daily workflows of FM teams. This “Data Rich, Information Poor” [5] state results in a reactive maintenance culture. Managers respond to complaints rather than data, because the data is too complex, noisy, or decontextualized to interpret in real-time. Annaswamy et al. [2] highlights that there is an increasing need for human systems to interact with cyber-physical systems in various ways to provide innovative solutions. Since the current automated systems fail because they lack context, rather than excluding building occupants and operators, there is a need to integrate human decision-making and feedback into the control loop (Figure 1). Involving the end-users (or at least facility managers) in closer communication with occupants can empower a sense of agency and engagement, helping align building operations with occupants’ actual needs and behaviors [25]. Studies suggest that such occupant-centric strategies can jointly optimize energy use and comfort; by accounting for human preferences and letting the occupants act, operational efficiency gains need not come at the expense of well-being [7]. In other words, human-in-the-loop digital twins aim to leverage human insight and adaptability alongside automated intelligence. This can lead to more acceptable and effective interventions — occupants who understand and influence their environment are more likely to support energy-saving measures, leading to a virtuous cycle of improved comfort and sustainability. Moreover, while fully automated digital twin, having actuators, can influence the buildings’ behaviour every time the new data come (i.e. every minute the Air Quality readings reach the database) and directly work on data, the human in “human-in-the-loop” approach is limited by how often they see the data and how much time they spend understanding these data or, the other way around, by how many data they can process. These limitations do not only make the “human” slower than the “machine”, but they also make the human-in-the-loop DT in need for tools, i.e. Key Performance Indicators (KPIs), that transform data into easily accessible information to help them make the building operations decisions (Figure 1).
The core innovation of this research lies in the development of Key Performance Indicators (KPIs) that bridge the gap between raw sensor inputs and management of the building. These KPIs convert abstract numbers (ppm, ∘C) into semantic zones of operation (e.g., “Energy Wastage,” “Fair Usage”), reducing cognitive load. Also, they utilize a novel method to infer occupancy patterns from standard IEQ sensors, enabling “virtual sensing” and efficiency tracking in legacy buildings without granular metering or privacy-invasive cameras. By visualizing these metrics, the framework empowers non-experts (occupants and non-facility managers) to understand the invisible conditions of their environment, fostering shared responsibility for sustainability.
The remainder of this paper is structured as follows: Section 2 details the proposed dual-KPI methodology for assessing building performance. It first defines a room-level KPI to evaluate healthy and sustainable usage based on integrated CO2 and temperature zones. It then introduces a building-level KPI that assesses energy efficiency by normalizing daily electricity consumption against the actual occupied area, which is inferred from sensor data. This section also outlines the specific visualization techniques designed to translate complex data into actionable insights for stakeholders. Section 3 presents a case study that applies this framework to 26 office rooms within a university building. The results are analyzed at both the room level, identifying specific instances of energy wastage or discomfort, and at the building level, revealing broader energy consumption patterns in relation to occupancy. Section 4 discusses the synthesized findings, highlighting the operational implications for facility management and the framework’s role in empowering occupants through a human-in-the-loop approach and the conclusion.
2. Methods and Tools
The proposed framework is supported by two novel KPIs designed to evaluate sustainable energy use and users’ health and comfort through IEQ parameters. These KPIs based on IEQ measurements are particularly useful for DTs of existing assets, where access to real-time, high-resolution energy consumption data is often limited.
2.1. KPI 1. Assessing Healthy and Sustainable Room Usage
The literature includes numerous studies that relate indoor temperature and humidity conditions to occupants’ health, as well as research linking CO2 concentration to cognitive performance. The most significant of these contributions are summarised in Section 2.1.1. By combining temperature and CO2 concentration data, it is possible to delineate ‘operational zones’ that are more comfortable, sustainable, healthier.
To quantify performance, three Performance Parameters (PPs) are calculated as the percentage of operational time spent in specific operational zones:
PP 1: “Fair” usage (%): Aggregates time spent in sustainable states. This includes the ‘Sustainable Unoccupied’ zone (energy saving mode) and the ‘Sustainable Occupied’ zone, where thermal comfort targets are met during period of active occupancy.
PP 2: Thermal Inefficiency / Discomfort (%): Measures ventilation inefficiency. It tracks time in the zones indicating poor air quality despite acceptable thermal conditions.
PP 3: Energy Wastage (%): Measures active waste. It tracks time in the ‘Conditioning Unoccupied’ zone, where empty spaces are actively heated or cooled beyond the sustainability threshold.
2.1.1. Rationale for CO2 and Temperature Thresholds: Occupancy Inference and Ventilation
Thresholds were established based on a synthesis of international standards, local regulations, and literature regarding occupant health. For CO2, a primary threshold of 800 ppm was selected to differentiate acceptable conditions from potential ventilation deficits. Although CO2 is an indirect proxy [24], its temporal dynamics reliably indicate occupancy [14]. While historical standards (e.g., ASHRAE 62.1) implied targets around 1100 ppm [27], recent studies indicate that levels exceeding 1000 ppm negatively impact cognitive performance [26] and increase drowsiness [11,31] while levels below 800 ppm are recommended for adequate ventilation [3] and reduced airborne transmission risk [1].
For temperature, the analysis strictly adheres to Italian building regulations for Climatic Zone E. While EN 16798-1 recommends a broad comfort range of 20–24 ∘C, Italian law mandates a maximum of 20∘ computed as weighted average of the temperatures over the surfaces of the rooms for offices [9]. The framework defines sustainable heating range between 18∘ (minimum comfort) and 22∘ (20∘ regulatory max +/-2∘ tolerance). Temperatures exceeding 22∘ are classified as regulatory non-compliance and distinct energy wastage. (signifying the definite overheating) was chosen to be 26 ∘C.
2.1.2. Definition of Integrated Operational Zones for Heating and Cooling Seasons
To assess efficiency, CO2 (C) and Temperature (T) readings are combined to classify the room state into operational zones. Table 1 defines these zones for both heating and cooling seasons based on the thresholds defined in Section 2.1.1.
Operational Zones for both periods are shown with a color schema in Figure 2. Green zones indicate ‘Fair Usage’. Red zones indicate ‘Energy Wastage’. ‘Discomfort’ is in Gray. Finally, yellow zones represent situations with uncertain conditions where further analysis is required.
2.1.3. Classification of Transitional States (Uncertain Zones)
A challenge in zone-based analysis arises when readings fall into ‘transitional’ states — conditions that are not clearly within the boundaries used in the KPI calculation, with or . Assigning these points to a simple ‘Transitional’ category can obscure valuable information about the direction of the occupants’ behaviour changes. Therefore, a methodology is employed to classify these ambiguous points more informatively, taking into account the “timely” nature of the sensor readings. The primary approach combines Temporal Trend Analysis with Rule-Based Classification.
Temporal Trend Analysis: The rate of change (gradient) of CO2 or temperature is calculated for time steps surrounding the transitional point. The sign and magnitude of this gradient provide information about whether conditions are improving or worsening. For example, if CO2 is measured at 900 ppm (within the transitional range of 800–1200 ppm) but its value has increased compared to the previous time step(s), the state might be classified as trending towards ‘High CO2’. Conversely, if the CO2 level is decreasing, it might be classified as trending downwards. Similar logic applies to temperature trends relative to the established boundaries.
Rule-Based Classification: Specific rules are defined to classify transitional points based on both their current value and their recent trend. These rules provide a structured and reproducible logic:
For the heating season, for all points that fall in the “Transitional” zones at the timestep t, that can be described with:
The belonging to a certain zone is decided by following rules:
For the cooling season the rules change according to the different colors of the “border” zones.
Focusing on gradients and rules for these uncertainty points offers a balance between extracting more meaningful information from the data than simple thresholding and making the implementation of the whole approach feasible without requiring complex machine learning models (like HMMs or transfer learning approaches) specifically for this classification step. Addressing these zones reflects the dynamic nature of the indoor environment. It’s important, however, to acknowledge, that while the rule-based logic captures the majority of wastage events, it may produce false positives during rapid manual ventilation events.
2.2. KPI 2. Assessing Building-Level Energy Efficiency
The reduction of a building’s electricity consumption constitutes a fundamental component of the virtuous pathway towards sustainability pursued by contemporary organisations [22]. To this end, buildings are frequently equipped with electricity meters capable of capturing consumption data across different temporal scales and levels of granularity, from the entire building down to specific zones or individual points of use. While monitoring electricity consumption can yield some insights into electricity usage patterns, it is not, on its own, sufficient to enable the comprehensive range of actions required to meet the sustainability goals set by modern enterprises [4].
For this reason, the implementation of KPIs that support decision-makers in taking data-informed actions is essential. One such KPI is the daily electricity usage normalised by the area of office space actually in use.
Although a building’s DT provides geometric information regarding the surface area of its offices, it may not monitor the actual use of individual office spaces due to GDPR [13] constraints. Nevertheless, it is possible to derive occupancy indicators based on sensor data collected in each space. CO2 readings can be employed to construct an indicator reflecting hourly space usage within the operational timeframe of the building. To achieve this, two thresholds must be established.
The first is a CO2 concentration threshold, above which the presence of at least one occupant is assumed. Here, the scientific literature offers substantial guidance, and reference is made to previously established thresholds used in related research. The second threshold, more closely related to the specific operational definition of space utilisation, is less commonly addressed in existing literature. Given the high frequency of CO2 sensor readings within a room, the proportion of readings within a given hour that exceed the established minimum CO2 threshold can be calculated.
where:
- is the value of a sensor’s reading in the office o
- is the total number of readings in the hour h
- is the CO2 threshold to define when an office is used
- is the fraction of readings above the threshold for office o during hour h of the day
This ratio is then compared to a predefined utilisation threshold, denoted as . If the ratio exceeds , the office is considered occupied for that hour; conversely, if it falls below , the office is deemed unoccupied.
where:
- is the surface of the office
- is a threshold for the fraction of readings
For each hour, the surface areas of all occupied offices can be summed, and these hourly sums aggregated across the working day yield the total effective office area utilised on a given day.
In this manner, a daily electricity consumption value may be associated with the corresponding utilised office area. This pairing of daily values enables the computation of a daily electricity-to-area ratio, which can be further analysed against weekly or monthly averages of the same ratio. Such metrics provide near real-time feedback to the facility manager regarding the rationality of the building’s energy usage.
While CO2 decay introduces a lag compared to physical presence, the goal of this KPI is to identify relative trends in “occupancy-normalized” energy use rather than exact headcount precision, designed specifically for legacy buildings lacking sub-metering.
2.3. Data-Driven Visualization for Actionable Insights
The way to make these KPIs usable by the building managers or the users is to visualize the data in a way that allows reading it easily and making assumptions and decisions based on this data.
2.3.1. Characterizing Room Performance: 2D Environmental State Visualization (KPI 1)
To understand the typical environmental operating conditions within a specific room and how they relate to the defined performance zones, a two-dimensional visualization technique is employed. This involves creating a scatter plot that correlates CO2 concentration and temperature readings over a defined period, such as the operational hours of the preceding week.
The process involves selecting the relevant data points from the sensor logs for the chosen room and time window. Having the air quality sensor readings interval at 5–15 mins, the visual clutter is not expected to be high, but if it is, the data may be aggregated into discrete time intervals (e.g., means or medians over 15 min period). The chosen aggregation method (mean or median) and interval duration have to be documented.
The key element of this visualization is the overlay of the defined operational zones (from Figure 2) onto the plot area, based on the CO2 and temperature thresholds (, , , , etc.). Boundary lines between zones are clearly demarcated. This mapping allows for immediate visual interpretation of where the room’s environmental state predominantly resides. The density and clustering of points within specific colored zones reveal the room’s typical operating characteristics. For instance, a dense cluster of points in the ‘High CO2’ zone indicates persistent ventilation issues and a wrong usage of the space, while points scattered across multiple zones suggest high variability. Temporal patterns might be explored by optionally encoding points by time of day or day of week (e.g., using color or size), although the primary interpretation relies on the distribution of points relative to the background zone definitions.
While the 2D scatter plot provides detailed insight into a single room, comparing performance across multiple spaces requires aggregating data into the KPIs defined in Section 2.1. Comparative visualizations are then used to highlight differences and identify outliers among the monitored spaces (e.g., different rooms on the same floor or within the same building).
First, the relevant KPIs (Fair usage, Discomfort and Energy Wastage) are calculated for each monitored space over a consistent aggregation period (e.g., the previous day, week or month, during operational hours). These calculated KPI values then form the input for comparative visualizations: Bar Plots, Leaderboards, Energy Wastage values as a heatmap on a DT. These comparative visualizations provide facility managers with a concise overview of performance across their portfolio of monitored spaces. They enable efficient identification of rooms or areas exhibiting persistent inefficiencies or discomfort issues, thereby facilitating prioritization of resources for investigation, maintenance, or operational adjustments.
2.3.2. Visualizing the Building-Level Energy Efficiency (KPI 2)
To translate the building-level energy data into actionable intelligence, a suite of visualizations is employed to analyze the “Electricity over Surface” (EoS) KPI (KPI 2). The first step is to understand the typical performance of the building. A histogram is generated to show the frequency distribution of the daily EoS values over a long period, such as a full year. This visualization allows managers to establish a data-driven benchmark for “normal” energy use. Statistical markers, such as the mean and the 75th percentile, are overlaid on the plot to define a clear, quantitative threshold for what constitutes an anomalously high-consumption day.
To understand when inefficiencies occur, the daily energy consumption and the EoS ratio are plotted over time. The daily energy use plot reveals the building’s fundamental consumption patterns, including a clear baseline energy load that is consumed even when the building is empty. The daily EoS ratio plot specifically highlights days when energy consumption was disproportionately high compared to the actual use of the space. By counting the number of days per month where the EoS ratio exceeds the 75th percentile benchmark, a bar chart can be created to identify systemic issues and seasonal trends, such as increased energy waste during summer weekdays or winter weekends.
A scatter plot that maps the total daily used surface area (m2) on the x-axis against the total daily energy consumption (kWh) on the y-axis provides an intuitive snapshot of the building’s operational efficiency. The cluster of points on the y-axis where occupancy is zero immediately quantifies the building’s baseline energy consumption—the energy required for essential services when no one is present. The data points often form distinct clusters, revealing different performance profiles corresponding to heating and cooling seasons. Meanwhile, the days that appear as outliers high above the main trendline represent periods of significant inefficiency, where more energy was used than would be expected for that level of occupancy.
Together these tools help facility managers understand baseline consumption, identify anomalies, and uncover seasonal patterns of inefficiency. Furthermore, plotting these value pairs over an extended time period allows for the detection of deviations from the building’s ideal operational behaviour. Ideally, electricity consumption should increase proportionally with the area in use and approach the baseline load.
3. Application in a Case Study Building
This section details the application of the environmental performance assessment methodology, outlined in Section 2, to a real-world case study involving multiple office spaces. The case study is a three-story university building, part of the NEXTbuild Living Lab (NBLL), located in the north of Italy, and built between the 1950s and 1960s. The total gross surface of the building is around 3,500 m2, including two underground floors for a total of 1,360 m2.
Starting from data collected by the installed sensors, building performances are compared across spaces using the defined KPIs, and the operational implications of the findings are discussed in the context of building management and energy efficiency.
3.1. KPI 1. Healthy and Sustainable Room Usage during the Heating Period
The study encompassed 26 individual office rooms. These rooms serve as typical academic offices, coworking spaces and meeting rooms, providing a relevant context for evaluating the methodology’s applicability in optimizing indoor environmental quality (IEQ) and operational efficiency.
3.1.1. Analysis Period
For the first KPI (Assessing the sustainable room usage, described in Section 2.1.) the data analysis presented covers a representative working week during the established heating season. Specifically, the period from Monday, December 9th, 2024, to Friday, December 13th, 2024, was selected. The selected week serves as a representative sample to demonstrate the application of the 2D zoning methodology under winter conditions, consistent with the heating season context established for threshold definition in Section 2.1.1. It was selected to demonstrate the granularity of the tool. The analysis focused on standard operational hours, defined as 7:00 AM to 7:00 PM Central European Time (CET), Monday through Friday, to align with expected building usage patterns.
3.1.2. Data Acquisition and Processing
The effectiveness of the framework depends on a robust and representative data acquisition strategy that ensures reliability and fitness for purpose. Regular calibration of the sensors, often automated in intermittently occupied buildings, is required to prevent drift and maintain data integrity.
Devices were installed within the human breathing zone (1–1.8 m above floor level) and positioned to avoid local disturbances such as direct solar gain, heat sources, supply vents, or operable windows. In typical single-occupant offices, one appropriately located sensor is sufficient to capture meaningful environmental conditions.
Subsequent data pre-processing involved several steps to ensure data quality and relevance for the analysis. First, the dataset was filtered to include only measurements recorded during the defined operational hours (7:00 AM to 7:00 PM). Second, potentially erroneous CO2 readings below an outdoor baseline level (400 ppm) were excluded. This step acknowledges the typical outdoor CO2 concentrations (around 400–450 ppm) and focuses the analysis on variations clearly attributable to respiration.
3.1.3. Threshold Implementation
The analysis applied the specific operational thresholds established and justified in Section 2.1.1 to classify the environmental state within each room. Consistent with the methodology for the heating season analysis:
CO2 Thresholds: As described in Section 2.1.1, a lower threshold () of 800 ppm and an upper threshold () of 1200 ppm was used.
Temperature Thresholds (Heating Season): A minimum acceptable temperature () was set at 18 ∘C. An upper threshold () of 22 ∘C was adopted to identify potentially inefficient heating. This upper limit incorporates the 2 ∘C tolerance band around the standard Italian regulatory maximum of 20 ∘C. (signifying the definite overheating) was chosen to be 26 ∘C.
3.1.4. Individual Room Environmental Performance Analysis
Following the visualization technique described in Section 2.3.1, a scatter plot CO2 (ppm) – Temperature ( ∘C) was generated for the rooms. The background of each plot was color-coded according to the operational zone definitions established in Section 2.1.1, using the implemented thresholds (=18 ∘C, =22 ∘C, =26 ∘C, =800 ppm, =1200 ppm). The zones by color represent:
- Green: ‘Fair Usage’;
- Red: ‘Energy Wastage’;
- Gray: ‘Thermal Inefficiency / Discomfort’;
- Orange: Transitional state.
Two example rooms are displayed on Figure 3.
3.1.5. Hourly Distribution Analysis
For rooms identified with high ‘Energy Wastage’ (significant point density in the ‘Red’ zone), the hourly temperature histograms often revealed consistently high temperatures (e.g., frequently > 22 ∘C) across most, if not all, operational hours. Concurrently, the corresponding CO2 histograms typically showed persistently low concentrations, reinforcing the interpretation of continuous heating in unoccupied states. Observing whether this wastage is concentrated in specific periods (e.g., early morning or late afternoon) can help pinpoint potential causes, such as misaligned heating schedules versus actual occupancy times. Wastage spread throughout the day might point more towards issues with thermostat setpoints, calibration, or control logic.
In rooms used intermittently, such as for meetings or shared work, the CO2 histograms exhibited distinct peaks during specific hours (e.g., mid-morning or mid-afternoon), exceeding 1200 ppm, while remaining low during other periods. The combination of the 2D scatter plot and the hourly histograms provides a richer understanding of how and when a room operates within different environmental states, facilitating more targeted investigations by facility managers.
3.1.6. Transitional State Classification
A key aspect of the analysis involved the classification of data points falling within the Transitional zones, where conditions were not definitively within the primary sustainable or unsustainable categories (800<CO2≤1200 ppm or 18 ∘C < T < 22 ∘C, excluding combinations already defined). As outlined in Section 2.1.3, a rule-based classification relying on temporal trends was implemented. For each point (t) falling within an uncertain zone, its state was compared to the preceding point (t−1). Based on the direction of change in both Temperature (T(t) vs T(t−1)) and CO2 (C(t) vs C(t−1)), the point was reclassified into one of the primary KPI categories: ‘Fair Usage’ (Green), ‘Energy Wastage’ (Red), or ‘Discomfort’ (Gray), according to the specific rules defined in Section 2.1.3. For visualization purposes on the scatter plots (Figure 3), points initially falling into these transitional zones might be marked distinctly (having the color of the zones to which they were “reassigned”) before their final classification contributes to the KPI calculations.
The final calculated KPI percentages (Section 3.1.7) include these reclassified points. The effectiveness of this classification directly impacts the final quantitative assessment, particularly for rooms exhibiting significant variability around the CO2 and temperature boundaries.
3.1.7. KPI Calculation
Following the classification of all 5-minute data points within the operational hours for each room (including the rule-based reclassification of transitional points), the percentage of time spent in the key operational states was calculated. These percentages correspond to the Key Performance Indicators (KPIs) defined conceptually in Section 2.1 and Table 1. The calculated KPIs for each room were visualized using a stacked bar plot (Figure 4), as described in Section 2.3.1.
3.2. KPI 2. Building-Level Energy Consumption
This section presents the results of the building-level analysis, shifting focus from individual rooms to the entire monitored area. It uses the Energy over Surface (EoS) KPI, described in Section 2.2., to evaluate the overall energy efficiency of the building in relation to its actual, sensor-inferred occupancy.
3.2.1. Analysis Period
The analysis covers an eight-month period from April 20, 2024, to December 31, 2024, encompassing both cooling and heating seasons to capture diverse operational conditions.
3.2.2. Distribution and Benchmarking of the EoS KPI
To establish a baseline for the building’s energy performance, the distribution of the daily EoS KPI was analyzed. ratio was set to 0.5, this means an office is considered “in use” if readings exceed the threshold for at least 30 minutes of the hour. As shown on Figure 5, the majority of EoS values are below 0.48 kWh/m2. This value, representing the 75th percentile of the distribution, serves as a practical benchmark; days exceeding this threshold are considered to have anomalously high energy consumption relative to their occupancy. The analysis also reveals a number of outlier values, which primarily occur during weekends when the calculated “used surface” is at or near zero. It’s not a necessarily “anomalous behaviour” by the occupants but an artifact of the baseline load.
3.2.3. Temporal Analysis and Seasonal Inefficiency Patterns
A time-series analysis provides deeper insight into when inefficiencies occur. The top panel of Figure 5 reveals a significant baseline energy load that consistently remains above 200 kWh. The bottom panel displays the daily EoS ratio, highlighting days where performance deviated from the norm. Many days are shown to have an EoS value significantly above the 75th percentile benchmark. To identify systemic patterns, these high-EoS days were aggregated on a monthly basis. This reveals a clear seasonal pattern of inefficiency: During the cooling season periods of high energy waste are concentrated on weekdays; During the heating season, high energy waste shifts primarily to the weekends.
3.2.4. Correlation Between Energy Use and Occupancy
The relationship between energy consumption and actual building use is visualized in the scatter plot Figure 6. The plot maps the total daily used surface area against the total daily energy consumption. It visually confirms the substantial baseline energy consumption of the building, evidenced by the cluster of data points showing significant energy use even when total occupancy is zero. It reveals two distinct clusters of data points, suggesting different operational modes that correspond to the heating and cooling seasons.
To validate the reliability of the CO2-based “virtual presence”, a ground-truth validation was conducted on a sample room over the full observation period (Total N=129,990 samples). Actual occupancy was established using the camera-based occupancy meter and compared against the inferred status. Performance metrics indicated an Accuracy of 81.8% and a Recall of 73.4%. However, the Precision was 52.4%, which indicated a substantial rate of False Positives (16,902 samples). This discrepancy is attributable to the physical behavior of CO2 decay; after occupants leave, CO2 levels remain elevated above the threshold for some time.
The decision to use CO2 concentration levels as a proxy for office occupancy offers the advantage of reducing the cost of constructing the DT, as no presence sensors are required. However, it also makes the analysis outcomes dependent on the chosen CO2 threshold used to classify an office as occupied. For this reason, a sensitivity analysis was conducted by varying the threshold concentration and assessing the resulting effects on the total number of days in which the KPI value exceeded the 75th percentile. Figure 7 presents the results of this sensitivity analysis. The findings show that even substantial increases in the threshold produce only limited changes in the number of days above the 75th percentile, whereas decreasing the threshold by 30% leads to an increase of approximately 36% in this metric. It is worth noting that this latter threshold (−30% relative to the threshold adopted in the analyses described above, equal to approximately 465 ppm) is very close to the outdoor ambient CO2 concentration at the location of the case-study building (450 ppm) thus likely is the expected reading from an empty office.
4. Discussion and Conclusions
The findings of this study underscore a critical reality in smart building management: the primary bottleneck is no longer data acquisition, but data interpretation. As noted in the “Data Rich, Information Poor” literature, the availability of massive datasets often paralyzes decision-making rather than enhancing it. The proposed framework solves this by acting as a Decision Support System. By synthesizing multivariate data (CO2, Temp, Occupancy) into an interpretable zoning structure, it automates the otherwise labor-intensive analytical process. In doing so, it enables facility managers to transition from manually searching for issues across spreadsheets and time-series plots to efficiently responding to system-validated anomalies grounded in robust data analysis.
While the industry often focuses on AI and full automation, this research highlights the indispensable value of the Human-in-the-Loop (HITL). As already pointed out in Section 1, fully automated “black box” systems often fail because they lack context. By keeping the human factor, the framework capitalizes on the facility manager’s contextual expertise: the proposed KPIs flag the anomaly, but the facility manager determines the appropriate course of action. This approach builds trust in the system. Unlike opaque AI algorithms, the proposed KPIs and 2D visualization are explainable, the manager can see exactly why the room was flagged as dire. This transparency is critical for the adoption of digital technologies by office workers who may be skeptical of automation.
The utility of these visualizations extends to the occupants themselves. By making the “invisible” conditions of air quality and energy waste visible, the framework democratizes building data. If occupants see that opening a window pushes their room into the “Red Zone,” they receive immediate feedback on the environmental cost of their actions. Seeing the “Gray Zone” empowers occupants to advocate for better ventilation. This shared situational awareness fosters a culture of sustainability that technology alone cannot achieve.
The most significant implication is the economic viability of this model for legacy buildings. The majority of the built environment cannot afford the “Smart Building” ideal of thousands of IoT sensors. The “virtual sensor” approach, using existing CO2 sensors to infer occupancy-normalized energy use, offers a high Return on Investment. This lowers the barrier to entry for Digital Twin adoption, making it accessible to public institutions, schools, and older commercial assets that are currently left behind in the green transition.
The reliance on CO2 as an occupancy proxy has limitations. CO2 accumulation and decay introduce a latency or lag compared to real-time events. Validation indicates that CO2 decay latency generates significantly more False Positives (n=16,902) than False Negatives (n=6,751). This bias creates a tendency to misclassify non-operational heating as ‘Sustainable Occupied’ (Zone B) rather than ‘Energy Wastage’ (Zone C). Consequently, the inefficiency metrics reported in Figure 4 represent a conservative lower bound; the actual prevalence of energy wastage is likely higher than visualized, confirming that identified anomalies are genuine operational failures rather than sensor artifacts. For KPI 2, while the F1-Score (0.61) highlights the limitations of using a single environmental proxy, the high rate of False Positives results in an overestimation of the “Used Surface.” Consequently, the calculated Energy-over-Surface (EoS) (KPI 2) is likely underestimated (i.e., the building appears more efficient in the Digital Twin than in reality). Therefore, the inefficiencies and “wastage” reported in Section 3.2 are conservative estimates; the actual operational inefficiency of the legacy building is likely higher than the framework suggests.
Future work utilizing LSTM models could specifically target the reduction of these False Positives to sharpen the EoS metric. Additionally, the integration of this framework with Generative AI and Large Language Models (LLMs) offers a promising frontier. An LLM could interpret the KPI zones and generate natural language reports, further reducing the cognitive load on the FM.
The gap between collecting IoT data and generating actionable insights is the defining challenge of modern facility management. This study demonstrates that this gap can be bridged not by adding more hardware, but by adding more meaning. Through the application of occupancy-driven KPIs, raw telemetry is transformed into a narrative of building performance that is accessible, actionable, and aligned with the dual mandates of built environment decarbonization and human health.
Author Contributions
Conceptualization, I.S. and F.R.C.; methodology, I.S. and F.R.C.; software, I.S.; validation, I.S.; formal analysis, I.S.; investigation, I.S.; resources, F.R.C.; data curation, I.S.; writing—original draft preparation, I.S.; writing—review and editing, F.R.C.; visualization, I.S.; supervision, F.R.C.; project administration, F.R.C.; funding acquisition, F.R.C. All authors have read and agreed to the published version of the manuscript.
Funding
Ivan Smirnov’s PhD research is funded by Maticmind S.p.A.
Institutional Review Board Statement
Not applicable.
Informed Consent Statement
Not applicable.
Data Availability Statement
Data available on request.
Acknowledgments
This research was conducted within the NEXTbuild Living Lab, a research infrastructure funded by the Department of Architecture, Built Environment and Construction Engineering (dABC) and by Politecnico di Milano. The authors gratefully acknowledge the NEXTbuild Living Lab for providing the sensing infrastructure, and real-world operational data that made this study possible.
Conflicts of Interest
The authors declare no conflicts of interest.
References
- Adzic, F.; Roberts, B.M.; Hathway, E.A.; Kaur Matharu, R.; Ciric, L.; Wild, O.; Cook, M. A post-occupancy study of ventilation effectiveness from high-resolution CO2 monitoring at live theatre events to mitigate airborne transmission of SARS-CoV-2. Build. Environ. 2022, 223, 109392. [Google Scholar] [CrossRef] [PubMed]
- Annaswamy, A.M.; Yildiz, Y. Cyber-Physical-Human Systems. In Encyclopedia of Systems and Control; Springer: Cham, Switzerland, 2021; pp. 497–508. [Google Scholar] [CrossRef]
- Bakó-Biró, Z.; Clements-Croome, D.J.; Kochhar, N.; Awbi, H.B.; Williams, M.J. Ventilation rates in schools and pupils’ performance. Build. Environ. 2012, 48, 215–223. [Google Scholar] [CrossRef]
- Bandória, L.H.T.; Cortes, B.; de Almeida, M.C. Statistical characterization of electricity use profile: Leveraging data analytics for stochastic simulation in a smart campus. Energy Build. 2024, 324, 114934. [Google Scholar] [CrossRef]
- Bernus, P.; Noran, O. Data rich – But information poor. In IFIP Advances in Information and Communication Technology; Springer: New York, NY, USA, 2017; Vol. 506, pp. 206–214. [Google Scholar] [CrossRef]
- Bosch-Sijtsema, P.; Claeson-Jonsson, C.; Johansson, M.; Roupe, M. The hype factor of digital technologies in AEC. Constr. Innov. 2021, 21, 899–916. [Google Scholar] [CrossRef]
- Brackley, C.; O’Brien, W.; Trudel, C.; Bursill, J. The in-situ implementation of a feature-rich thermostat: A building engineering and human factors approach to improve perceived control in offices. Build. Environ. 2021, 199, 107884. [Google Scholar] [CrossRef]
- Clausen, A.; Arendt, K.; Johansen, A.; Sangogboye, F.C.; Kjærgaard, M.B.; Veje, C.T.; Jørgensen, B.N. A digital twin framework for improving energy efficiency and occupant comfort in public and commercial buildings. Energy Inform. 2021, 4, 1–19. [Google Scholar] [CrossRef]
- DECRETO DEL PRESIDENTE DELLA REPUBBLICA 16 aprile 2013, n. 74 - Normattiva. n.d. Available online: https://www.normattiva.it/uri-res/N2Ls?urn:nir:presidente.repubblica:decreto:2013;74art9 (accessed on 23 December 2025).
- De la Barra, P.; Luna-Navarro, A.; Prieto, A.; Vásquez, C.; Knaack, U. Influence of Automated Façades on Occupants. J. Facade Des. Eng. 2022, 10, 19–38. [Google Scholar] [CrossRef]
- Du, B.; Tandoc, M.C.; Mack, M.L.; Siegel, J.A. Indoor CO2 concentrations and cognitive function: A critical review. Indoor Air 2020, 30, 1067–1082. [Google Scholar] [CrossRef] [PubMed]
- Elghaish, F.; Matarneh, S.T.; Edwards, D.J.; Pour Rahimian, F.; El-Gohary, H.; Ejohwomu, O. Applications of Industry 4.0 digital technologies towards a construction circular economy: gap analysis and conceptual framework. Constr. Innov. 2022, 22, 647–670. [Google Scholar] [CrossRef]
- General Data Protection Regulation (GDPR) – Legal Text. Available online: https://gdpr-info.eu/ (accessed on 18 December 2025).
- Haidar, N.; Tamani, N.; Nienaber, F.; Wesseling, M.T.; Bouju, A.; Ghamri-Doudane, Y. Data Collection Period and Sensor Selection Method for Smart Building Occupancy Prediction. In Proceedings of the 2019 IEEE 89th Vehicular Technology Conference (VTC2019-Spring), Kuala Lumpur, Malaysia, 28 April–1 May 2019; IEEE: Piscataway, NJ, USA, 2019; pp. 1–6. [Google Scholar] [CrossRef]
- Hosamo, H.H.; Nielsen, H.K.; Kraniotis, D.; Svennevig, P.R.; Svidt, K. Improving building occupant comfort through a digital twin approach: A Bayesian network model and predictive maintenance method. Energy Build. 2023, 288, 112992. [Google Scholar] [CrossRef]
- Hosamo, H.H.; Svennevig, P.R.; Svidt, K.; Han, D.; Nielsen, H.K. A Digital Twin predictive maintenance framework of air handling units based on automatic fault detection and diagnostics. Energy Build. 2022, 261, 111988. [Google Scholar] [CrossRef]
- n.d. Available online: https://www.iso.org/standard/81442.html (accessed on 7 October 2025).
- Jradi, M.; Madsen, B.E.; Kaiser, J.H. DanRETwin: A Digital Twin Solution for Optimal Energy Retrofit Decision-Making and Decarbonization of the Danish Building Stock. Appl. Sci. 2023, 13, 9778. [Google Scholar] [CrossRef]
- LEED rating system | U.S. Green Building Council. n.d. Available online: https://www.usgbc.org/leed (accessed on 8 October 2025).
- Li, Y.L.; Han, M.Y.; Liu, S.Y.; Chen, G.Q. Energy consumption and greenhouse gas emissions by buildings: A multi-scale perspective. Build. Environ. 2019, 151, 240–250. [Google Scholar] [CrossRef]
- Liu, J.; Varghese, B.M.; Hansen, A.; Zhang, Y.; Driscoll, T.; Morgan, G.; Dear, K.; et al. Heat exposure and cardiovascular health outcomes: a systematic review and meta-analysis. Lancet Planet. Health 2022, 6, e484–e495. [Google Scholar] [CrossRef] [PubMed]
- Moghimi, S.M.; Gulliver, T.A.; Thirumarai Chelvan, I.; Teimoorinia, H. Resource Optimization for Grid-Connected Smart Green Townhouses Using Deep Hybrid Machine Learning. Energies 2024, 17, 6201. [Google Scholar] [CrossRef]
- Porras-Salazar, J.A.; Tartarini, F.; Schiavon, S. The effect of indoor temperature on work performance of fifty-eight people in a simulated office environment. Build. Environ. 2024, 263, 111813. [Google Scholar] [CrossRef]
- Re Cecconi, F.; Rampini, L. Effectiveness of HSE Procedures Based on IAQ Data to Reduce COVID-19 Contagion Risk Inside School Classrooms. In Advances in Science, Technology and Innovation; Springer: Cham, Switzerland, 2024; pp. 173–184. [Google Scholar] [CrossRef]
- Saadatifar, S.; Sawyer, A.O.; Byrne, D. Occupant-Centric Digital Twin: A Case Study on Occupant Engagement in Thermal Comfort Decision-Making. Architecture 2024, 4, 390–415. [Google Scholar] [CrossRef]
- Satish, U.; Mendell, M.J.; Shekhar, K.; Hotchi, T.; Sullivan, D.; Streufert, S.; Fisk, W.J. Is CO2 an Indoor Pollutant? Direct Effects of Low-to-Moderate CO2 Concentrations on Human Decision-Making Performance. Environ. Health Perspect. 2012, 120, 1671–1677. [Google Scholar] [CrossRef] [PubMed]
- Standards 62.1 & 62.2. n.d. Available online: https://www.ashrae.org/technical-resources/bookstore/standards-62-1-62-2 (accessed on 21 September 2025).
- Vering, C.; Mehrfeld, P.; Nürenberg, M.; Coakley, D.; Lauster, M.; Müller, D. Unlocking Potentials of Building Energy Systems’ Operational Efficiency: Application of Digital Twin Design for HVAC systems. In Proceedings of the Building Simulation Conference, Rome, Italy, 2–4 September 2019; IBPSA: Toronto, ON, Canada, 2019; Vol. 16, pp. 1304–1310. [Google Scholar] [CrossRef]
- WELL - International WELL Building Institute | IWBI. n.d. Available online: https://www.wellcertified.com/ (accessed on 8 October 2025).
- Xu, L. A Systematic Review of Smart Building Acceptance Based on User Experience. Hum. Factors Archit. Sustain. Urban Plan. Infrastruct. 2023, 89, 89. [Google Scholar] [CrossRef]
- Zhang, N.; Liu, C.; Hou, C.; Wang, W.; Yuan, Q.; Gao, W. The impact of indoor carbon dioxide exposure on human brain activity: A systematic review and meta-analysis based on studies utilizing electroencephalogram signals. Build. Environ. 2024, 259, 111687. [Google Scholar] [CrossRef]
Figure 1.
Comparison between a DT and a DT with human in the loop.

Figure 2.
Heating (left) and Cooling (right) Season Operational Zones.

Figure 3.
Representative Room Performance. The “definite overheating” never happened during the working week on the top image, but it was heated while empty for some time. On the contrary, the second room (below) was never too warm while empty.
Figure 3.
Representative Room Performance. The “definite overheating” never happened during the working week on the top image, but it was heated while empty for some time. On the contrary, the second room (below) was never too warm while empty.

Figure 4.
Comparison across all the spaces.

Figure 5.
Daily Energy Consumption Apr 2024 to Jan 2025, with the chiller energy use stacked on top of the “others”. On the lower figure — a monthly distribution of high-ratio days.
Figure 5.
Daily Energy Consumption Apr 2024 to Jan 2025, with the chiller energy use stacked on top of the “others”. On the lower figure — a monthly distribution of high-ratio days.

Figure 6.
Correlation between total daily energy consumption (kWh) and total daily used surface area (m2). The plot visualizes the building’s baseline energy load (points at zero occupancy) and distinct seasonal operational patterns.
Figure 6.
Correlation between total daily energy consumption (kWh) and total daily used surface area (m2). The plot visualizes the building’s baseline energy load (points at zero occupancy) and distinct seasonal operational patterns.

Figure 7.
Sensitivity analysis of the variation of the number of days with the Energy / Surface ratio above 75% as a function of the CO2 threshold used to define an office used.
Figure 7.
Sensitivity analysis of the variation of the number of days with the Energy / Surface ratio above 75% as a function of the CO2 threshold used to define an office used.


Table 1.
Definition of Integrated Operational Zones.
| Operational State (Zone) | Heating Season Logic | Cooling Season Logic | Interpretation |
|---|---|---|---|
| Energy Wastage (Red) | Zone C AND |
Zone C AND |
Significant conditioning of a likely unoccupied space (low CO2). Represents direct energy waste. |
| Sustainable Unoccupied (Green) | Zone A AND |
Zone B AND |
System is correctly off or in setback mode while the room is empty. |
| Sustainable Occupied / Preference (Green) | Zone B AND |
Zone A AND |
Room is occupied (high CO2) and conditioned to a level that implies active usage or occupant preference. |
| Discomfort / Ventilation Issue (Gray) | Zone D AND |
Zone D AND |
High occupancy load without adequate conditioning or ventilation. Suggests poor IEQ. |
| Definite Inefficiency (Red) | Zone E |
Zone E |
Temperature exceeds extreme limits regardless of occupancy (e.g., overheating beyond regulatory max). |
| Transitional (Orange) | Zone F Values between thresholds |
Zone F Values between thresholds |
Intermediate states requiring trend analysis (see Section 2.1.3) for classification. |
Disclaimer/Publisher’s Note: The statements, opinions and data contained in all publications are solely those of the individual author(s) and contributor(s) and not of MDPI and/or the editor(s). MDPI and/or the editor(s) disclaim responsibility for any injury to people or property resulting from any ideas, methods, instructions or products referred to in the content. |
© 2026 by the authors. Licensee MDPI, Basel, Switzerland. This article is an open access article distributed under the terms and conditions of the Creative Commons Attribution (CC BY) license (http://creativecommons.org/licenses/by/4.0/).
Copyright: This open access article is published under a Creative Commons CC BY 4.0 license, which permit the free download, distribution, and reuse, provided that the author and preprint are cited in any reuse.


