

Submitted:
17 March 2026
Posted:
18 March 2026
You are already at the latest version
Abstract
This paper employs machine learning techniques based on market volatility to identify and construct trading signals for both short-term and long-term Time Series Momentum (TSM) strategies. Through a comparative study of China's CSI 300 Index and the U.S. S&P 500 Index, we conduct an empirical analysis from a cross-market perspective. The findings reveal that the performance of time series momentum strategies is jointly determined by their signal responsiveness and the prevailing market volatility regime. Using the Random Forest algorithm, this study effectively identifies critical thresholds for regime switching between low-volatility and high-volatility states in index futures markets. The empirical results demonstrate that during high-volatility periods, short-term TSM strategies significantly outperform their long-term counterparts, whereas the opposite holds true in low-volatility environments. Further analysis indicates that the short-term momentum alpha can be attributed to market timing ability. Our findings provide important theoretical and practical implications for optimizing trend-following strategies in commodity and financial futures markets through machine learning approaches.
Keywords:
machine learning
; time series momentum
; turning points
; volatility
; regime switching
; Random Forest
1. Introduction
Time Series Momentum (TSM) strategies are designed to capture persistent upward or downward trends in financial asset prices (Moskowitz et al., 2012; Asvanunt et al., 2015; Hurst et al., 2017). From an investment management perspective, TSM has become one of the mainstream strategies in index futures markets. It not only offers significant diversification benefits to traditional asset classes but also allows investors to capture a distinct volatility risk premium. Moreover, incorporating equity index futures into traditional long-only equity strategies can broaden the asset class coverage and further enhance portfolio risk diversification. The inherent characteristics of TSM make it particularly suitable for implementation in index futures markets. As a result, financial futures are increasingly employed in asset allocation frameworks—such as in return forecasting within trend-following strategies and spread prediction in arbitrage trading.
The main objective of this study is to extend and comparatively apply the framework proposed by Cheng et al. (2021). In their work, Cheng et al. developed a machine learning technique based on decision trees to integrate long- and short-term time series momentum (TSM) signals, utilizing market volatility as a core predictive feature. Their findings indicate that the performance of TSM strategies is jointly influenced by factors such as their responsiveness and the prevailing market volatility regime. The decision tree model offers a simple yet insightful approach to identifying thresholds that characterize transitions between low- and high-volatility regimes. Specifically, the authors show that long-term TSM strategies tend to outperform short-term ones during periods of low market volatility, whereas the opposite holds true under high-volatility conditions. This study trains a decision tree model to develop an intelligent system that adaptively switches between long- and short-term time series momentum strategies based on prevailing market volatility states. Backtesting results demonstrate that this adaptive strategy significantly enhances the annualized return and effectively reduces the maximum drawdown compared to the primitive baseline strategy with fixed lookback periods.
A comparative study between the Chinese and U.S. equity index futures markets is of substantial value, primarily due to their systematic differences across several critical dimensions:
1.Market Maturity: The U.S. market, since the launch of its first index futures contract in 1982, has evolved into a highly sophisticated and well-established system. In contrast, China's index futures market started much later, marked by the introduction of the CSI 300 index futures in 2010, indicating a relatively lower level of market maturity.
2.Trading Volume and Liquidity: Products like the S&P 500 index futures on the Chicago Mercantile Exchange (CME) boast globally leading trading volume and market depth, ensuring high liquidity. Although trading activity in the Chinese market has grown rapidly, it still lags behind the U.S. in terms of absolute scale and liquidity depth.
3.Product Diversity and Innovation: The U.S. market offers a comprehensive suite of products, covering a full spectrum from large-cap to small-cap index futures, and exhibits continuous financial innovation. The Chinese market currently focuses on core broad-based index futures, such as those tracking the CSI 300, CSI 500, and SSE 50, with room for expansion in product variety.
4.Investor Base: The U.S. market is dominated by sophisticated institutional investors—including pension funds, hedge funds, and investment banks—leading to more rational market behavior. While institutional participation is increasing in China, retail investors still constitute a significant portion of the market, resulting in a distinct investor structure.
5.Regulatory Framework: The U.S. market operates under a mature regulatory system overseen by bodies like the Commodity Futures Trading Commission (CFTC). In China, the regulatory framework under the China Securities Regulatory Commission (CSRC) is also being refined through practice.
These fundamental differences make the comparative examination crucial for testing the robustness and applicability of the adaptive TSM strategy across disparate market environments. Therefore, this research not only validates the effectiveness of the machine learning approach in optimizing strategies within a single market but also, through cross-country comparison, delves into the market structural factors underlying its performance.
The marginal contributions of this paper are primarily manifested in the following two aspects:
First, regarding the application and examination of methodology, this study systematically validates the transferability and conditionality of the long-short Time Series Momentum (TSM) strategy proposed by Cheng et al. (2021) and its deep learning-based variants when applied to distinct financial markets. A key finding is the systematic disparity in the performance of these strategies between U.S. and Chinese equity index futures markets. Specifically, in the U.S. market, while all strategies generate positive returns, the performance difference between traditional approaches and their deep-learning variants is statistically insignificant. In stark contrast, the deep learning variants demonstrate exceptionally strong and significant alpha in the Chinese market. This comparative evidence suggests that the efficacy of these strategies is not universal but is deeply embedded in the market microstructure shaped by factors such as market maturity, investor composition, and institutional frameworks.
Second, in interpreting the source of returns and the underlying economic mechanisms, this paper moves beyond mere methodological refinement by adopting the Alpha-Beta decomposition framework of Goulding et al. (2023). This allows for a nuanced attribution of the excess returns generated. Furthermore, we extend the analysis beyond statistical phenomena by linking these performance differentials to macro- and micro-level factors, including the economic fundamentals, institutional settings, and investor behaviors characteristic of each country. This integration of cutting-edge computational finance techniques with the insights of comparative international finance constitutes a key innovation of our work, distinguishing it from purely technical studies.
The remainder of this paper is organized as follows. Section 2 provides a systematic review and critical examination of the literature concerning TSM and its applications in finance. Section 3 begins with a concise overview of the methodological framework established by Cheng et al. (2021). It then proceeds to formally define the simple short-term and long-term momentum signals used in this study. Employing a decision tree classifier from the machine learning toolkit, this section rigorously analyzes the relationship between the speed of TSM strategy signals and prevailing market volatility regimes. Section 4 develops main research hypothesis in this paper. In Section 5, we apply the volatility-regime-based TSM strategy to the Chinese and American stock futures market, presenting a comparative analysis and detailed interpretation of the empirical findings. Collectively, this research demonstrates that capturing the transition between fast and slow momentum signals enhances the robustness of volatility regime detection. The empirical results from the Chinese commodity futures market serve to validate the proposed framework and its practical implications. Section 7 concludes.
2. Literature Review
Time Series Momentum (TSM), as a significant market anomaly, is predicated on the core idea that future price movements of an asset are positively correlated with its own past performance. This concept is consistent with the time-varying expected returns hypothesis supported by Fama and French (1988) and Cochrane (2011). In practice, a TSM strategy typically involves taking long positions in assets that have performed strongly over a specific lookback period while simultaneously taking short positions in assets that have performed weakly. Extensive empirical research demonstrates the efficacy of TSM strategies across multiple historical periods and a diverse range of markets and asset classes (Jegadeesh and Titman, 1993; Asness, 1994; Conrad and Kaul, 1998; Lee and Swaminathan, 2000; Gutierrez and Kelley, 2008). More importantly, this momentum effect exhibits remarkable stability across different asset classes and national markets (Rouwenhorst, 1998; Griffin, Ji, and Martin, 2003; Israel and Moskowitz, 2012; Asness, Moskowitz, and Pedersen, 2013).
Recent studies provide further direct evidence for TSM, indicating that such strategies can successfully capture persistent trends in asset returns, characterized by a positive correlation between current and future returns (Moskowitz et al., 2012; Georgopoulou and Wang, 2017; Ehsani and Linnainmaa, 2019). Among these, the seminal work of Moskowitz et al. (2012) is of landmark significance. They found that a TSM strategy based on a 12-month lookback period generates substantial profitability and provided systematic evidence of return predictability across lookback periods ranging from 1 (short-term) to 12 months (long-term). Their study also highlighted that long-momentum strategies, which rely on longer-term signals, generally outperform short-term strategies in capturing sustained trends and exhibit superior historical risk-return profiles. This finding provides a direct theoretical foundation for this paper's distinction between long and short momentum and its investigation into their applicable conditions.
The significant returns generated by TSM strategies are difficult to fully explain with traditional financial theories. Behavioral finance offers several perspectives: in the early stages of a trend, investors' anchoring bias (difficulty in rapidly adjusting prior judgments) and disposition effect (propensity to sell winning assets too early and hold onto losing assets too long) lead to sluggish price adjustment to new information. During the trend continuation phase, herding behavior (blindly following the crowd) and institutional program trading further drive prices to overshoot in the direction of the trend. These behavioral biases cause prices to systematically deviate from their fair value during trend formation. TSM strategies systematically "buy rising assets and sell falling ones," thereby capturing the profits arising from these pricing errors.
Regarding strategy optimization, the basic TSM strategy faces challenges such as unstable risk exposure in practical application. Researchers have optimized it through volatility scaling techniques, which maintain stable risk levels by inversely linking position sizes to the asset's recent volatility, thereby smoothing the return curve. Furthermore, in portfolio construction, employing the risk parity approach—allocating equal risk weights to assets with different volatilities and setting a target volatility level—helps stabilize the overall risk of the portfolio.
Based on the established literature, the Time Series Momentum (TSM) phenomenon is well-documented as a pervasive and robust source of return across asset classes and time periods. However, the practical implementation and consistent outperformance of TSM strategies face significant challenges. The core issue lies in their static nature; traditional strategies with fixed lookback periods often fail to adapt to shifting market volatility regimes, which critically influence the relative efficacy of short-term versus long-term momentum signals.
This inherent limitation points to a promising avenue for research: the development of adaptive TSM frameworks that dynamically adjust to market conditions. While foundational work, such as that by Cheng et al. (2021), has begun to explore this by using machine learning to link volatility regimes to optimal signal speed, their application remains focused on a specific methodological approach and a limited set of markets. This presents a clear opportunity for meaningful extension.
Building directly upon this foundation, our study is motivated by two pivotal questions that naturally extend the existing research frontier:
1. Generalizability and Comparative Performance: How effectively can these adaptive, machine learning-driven TSM frameworks be generalized and applied to other major financial markets? Furthermore, a critical, yet under-explored, question is how their performance compares across markets with fundamentally different microstructures, such as the mature U.S. market versus the developing Chinese market.
2. Source of Excess Returns: Moving beyond pure pattern recognition, what is the economic origin of the excess returns generated by these adaptive strategies? A deeper investigation requires decomposing the returns into components attributable to market timing (Alpha) and risk factor exposure (Beta) to provide an economic interpretation, rather than a purely statistical one.
By addressing these questions, this study aims not only to validate the transferability of a novel methodological approach but also to uncover the fundamental market-specific drivers of its success, thereby bridging the gap between advanced machine learning techniques and comparative financial market analysis..
3. The Dynamic Interplay Between Momentum Horizons and Market States: A Review
In this section, we first review the primary methodology from the literature (Cheng et al., 2021) for defining simple fast and slow momentum signals, and then empirically evaluate the relationship between TSM signal speed and market volatility.
3.1. TSM Construction
At month t, if the cumulative return over the preceding N consecutive months, denoted as r, , the TSM strategy will take a long position of one unit of the underlying asset in the subsequent period; otherwise, it will take a short position of one unit.
Specifically, fast momentum is defined with N = 1, and slow momentum with N = 12, referred to as "fast" and "slow" respectively. Within our sample period of less than one year, these settings provide the clearest informational distinction.
Figure 1 and Figure 2 display the slow and fast momentum signals for the S&P 500 and CSI 300 from January 2000 to December 2020, with blue representing the fast momentum signal and red representing the slow momentum signal. The fast momentum reflects the speed of adaptation to market changes, while the slow momentum captures the long-term movement of the market. Over this 21-year period, the fast and slow signals shared the same direction 63.5% of the time. During periods of signal conflict, investors face the dilemma of choosing which signal to follow and may even opt to remain neutral. A more effective method of selecting between fast and slow signals could potentially enhance strategy performance.
3.2. Momentum Across Different Market Volatility Regimes
According to Cheng et al. (2021), during relatively stable market periods, investor behavior exhibits inertial characteristics, making long-term momentum signals suitable for capturing market trends. Strategies based on slower signals benefit from this long-term perspective and have historically added more value than fast signals. However, during periods of significant market turbulence, trading behavior does not remain unchanged. In high-volatility environments, market participants are often driven by panic and uncertainty or stimulated by external shocks, leading to a tendency for more frequent trading. Based on perceived new information, some investors may trade to protect their portfolios, while others may seek to exploit newly created buying or selling opportunities. During high-volatility periods, investors are more likely to focus on short-term market events. Therefore, we hypothesize that in such periods, faster momentum signals exhibit better adaptability and superior predictive power compared to slower signals. Moreover, the aforementioned hypotheses find support in the Fractal Market Hypothesis (FMH), whose core tenets revolve around heterogeneous investors and "liquidity"—two critical elements overlooked by the Efficient Market Hypothesis. The Fractal Market Hypothesis posits that financial markets are complex systems composed of numerous heterogeneous traders, emphasizing the diversity in trader types and investment time horizons.
The primary distinction among traders lies in their trading time horizons. The market participant structure and holding period composition are highly diverse, ranging from market makers engaged in algorithmic trading with holding periods measured in seconds, to noise traders holding positions for minutes, technical traders maintaining positions for days to weeks, and fundamental or hedging traders with holding periods extending from months to years. Information carries different implications and value for each category of trader, who process it in distinct ways. Typically, short-term traders focus on technical information and the herd behavior of other market participants, whereas long-term traders base their decisions on fundamental information, largely disregarding collective market behavior. Each trader category adheres to its own set of trading rules, and the market environment shaped by these heterogeneous participants constitutes an exceedingly complex system.
During stable market phases, all types of traders operate within their normal time horizons. However, when sudden shocks induce market instability, panic and uncertainty pervade the participant base. Trading becomes dominated by one or several categories of traders, often with short-term traders being the most active, while long-term traders reduce or cease trading activities. This imbalance in supply and demand across different trader groups cannot be effectively absorbed, leading to market inefficiencies. Externally, this manifests as pronounced unilateral trending behavior in market prices.
Building on the approach of Cheng et al. (2021), this study employs a decision tree model from machine learning to determine the switching mechanism between short- and long-term momentum signals across different volatility regimes in both Chinese and U.S. index futures markets. An equal capital weight is allocated to the short-term and long-term momentum strategies. This setup can be formally represented as follows (for detailed derivation, refer to Cheng et al., 2021):
3.3. Return Attribution Framework: A Review
To examine the source of the superior performance of the decision tree model, we adopt the α and β determinant decomposition framework proposed by Goulding et al. (2023). Covariance between the momentum strategy return , where for fast and for slow, and the market return can be used to present static and dynamic elements. By definition:
The market beta can be decomposed as follows:
where the three parts in the equation are static beta, market timing beta, and volatility timing beta, respectively. Alpha can be derived from this equation as:
Given that , we have:
where the first term is market timing alpha and the second term is volatility timing alpha.
At time , fast and slow take positions and , respectively. Their next period return, and , will be attributed to the regime detected at time . Classified in the same way as return, and can be expressed as:
4. Hypothesis Development
Time-series momentum (TSM) strategies exploit the persistence of asset returns by forecasting future price movements from past trends. Traditional TSM models generally rely on fixed look-back windows and assume stable trend dynamics. However, financial markets differ substantially in their volatility structures, participant compositions, and information diffusion mechanisms. These structural asymmetries may cause the same momentum signal to behave differently across markets. The integration of machine learning allows the signal to adjust dynamically to changing market conditions, potentially improving robustness and cross-market adaptability. Building on both financial theory and empirical observations, this study develops the following hypotheses.
4.1. Return Attribution Framework: A Review
Volatility captures how information and investor sentiment are transmitted into prices. In mature markets such as the United States, information dissemination is efficient, trading is dominated by institutional investors, and price adjustments are relatively smooth. Consequently, return trends tend to persist over longer horizons, and conventional, fixed-parameter momentum rules are often sufficient to capture these dynamics. In contrast, emerging markets such as China exhibit more frequent regulatory interventions, heterogeneous trader behavior, and stronger sentiment-driven reactions. Volatility tends to cluster around policy events or speculative cycles, leading to irregular trend durations and rapid state changes. A machine learning–based adaptive model can respond to these volatility shifts by reweighting or switching momentum signals in real time, thereby mitigating the instability that undermines static strategies.
Hypothesis 1.
Because of structural differences in volatility dynamics, the adaptive machine-learning TSM strategy delivers larger relative improvements in emerging markets with higher volatility clustering than in mature markets with smoother trend persistence.
4.2. Nonlinear State Recognition Through Machine Learning
Traditional momentum strategies rest on linear assumptions—namely, that the magnitude of past returns linearly predicts future price changes. Yet markets are inherently nonlinear systems characterized by regime shifts: a steady uptrend can abruptly give way to panic selling when volatility crosses certain thresholds. Linear rules fail to account for these abrupt transitions. Machine learning models, particularly tree-based and ensemble algorithms, are designed to detect threshold effects and interaction terms among variables such as volatility, volume, and return acceleration. These algorithms can endogenously partition the state space, identifying when the market transitions from a “trend-following” regime to a “risk-aversion” regime. By recognizing such nonlinear switches, ML-based strategies can downweight momentum exposure precisely when trend reversals become more probable.
Hypothesis 2.
Machine learning models, by capturing nonlinear regime transitions between trend-following and risk-averse market states, achieve superior adaptability and risk-adjusted performance relative to conventional linear momentum strategies.
4.3. Information Diffusion and Trend Stability Differences
The efficiency with which markets absorb new information directly influences trend stability. In the United States, institutional dominance and rapid information dissemination produce relatively smooth and continuous price adjustments, allowing long-term trends to persist. In China, information diffusion is slower, investor bases are more retail-oriented, and feedback trading behaviors are more prevalent. These features create shorter-lived and more volatile price trends. An adaptive ML model can exploit the lag in information incorporation by identifying transient but profitable short-term signals. In markets where information arrives unevenly and reactions are delayed, such adaptive models can dynamically recalibrate signal horizons, effectively extracting value from short-lived momentum components.
Hypothesis 3.
Due to differences in information diffusion and behavioral heterogeneity, the adaptive machine-learning TSM model captures short-term trend signals more effectively in information-inefficient markets, leading to stronger relative gains than in highly efficient markets.
4.4. Market Complexity and Algorithmic Learning Advantage
The forecasting edge of machine learning depends on the structural complexity of the market environment. When the data-generating process is relatively linear and transparent—as in deep, institutionally dominated markets—traditional momentum models already capture most of the systematic return components, leaving limited room for nonlinear algorithms to add value.
Conversely, in complex and behaviorally heterogeneous markets, prices are shaped by multiple interacting factors: regulatory policies, liquidity shocks, sentiment contagion, and speculative herding. Machine learning models, through nonlinear mapping and multivariate feature interaction, can extract latent patterns that linear models overlook. Thus, the marginal benefit of algorithmic adaptivity rises with market complexity, explaining the more pronounced performance improvement observed in the Chinese sample.
Hypothesis 4.
The performance advantage of adaptive machine-learning TSM strategies increases with market structural complexity and behavioral heterogeneity, as the algorithm’s nonlinear learning ability enables it to uncover hidden predictive relationships absent in linear momentum models.
5. Data and Empirical Results
5.1. Data and Basic Statistics
The backtesting period selected for this study spans from 2006 to 2020. This timeframe was chosen to ensure comparability between the Chinese and U.S. markets, particularly considering the relatively late introduction of index futures in China. Figure 3 presents a comparative analysis based on the monthly returns of the index futures. As illustrated in the figure, the Chinese index futures exhibit significantly higher volatility compared to their U.S. counterparts.
5.2. Cross-Market Performance Overview
5.2.1. Cross-Market Performance Overview
The empirical results show that the adaptive machine-learning time-series momentum strategy consistently outperforms traditional fixed-horizon momentum rules in both markets, but the magnitude and pattern of outperformance differ markedly between China and the United States as shown in Figure 4. The market return and momentum return are plotted in Figure 5 and Figure 6 based on different markets.
In the U.S. equity index futures, excess returns from the adaptive strategy are modest yet stable, largely reflecting improved timing during volatility surges. In contrast, in the Chinese futures market, the adaptive strategy delivers substantially higher Sharpe ratios and smaller drawdowns, particularly during turbulence episodes such as the 2015 stock market crash and the 2020 pandemic period. This asymmetry suggests that the algorithm’s advantage depends critically on the underlying market structure and volatility regime. Whereas the U.S. market offers relatively continuous trends and efficient price discovery, the Chinese market features abrupt shifts, behavioral clustering, and strong policy-related shocks.
The following subsections interpret these findings through the lens of the four hypotheses developed earlier.
5.2.2. Market Volatility Structure and Adaptive Response (H1)
Consistent with Hypothesis 1, the ML-based adaptive model achieves its largest relative improvements in markets characterized by clustered volatility and frequent state transitions as shown in Figure 7 and Figure 8. In the Chinese market, realized volatility exhibits sharp spikes around macro and policy events, while periods of calm are often short-lived. Traditional momentum models, which rely on constant parameters, tend to overreact to noise during such unstable intervals, leading to premature signal reversals. The adaptive algorithm mitigates this problem by recognizing changes in volatility patterns and adjusting the effective look-back horizon accordingly. When the volatility regime shifts upward, the model automatically shifts toward shorter momentum windows, prioritizing fast-reacting signals; when volatility subsides, it stabilizes by emphasizing slower components. This dynamic rebalancing aligns model sensitivity with prevailing market turbulence, explaining the improved performance observed in the Chinese sample. In contrast, the smoother volatility structure of the U.S. market offers fewer opportunities for this adaptivity to generate incremental gains. Because volatility clustering is weaker and trends persist longer, static TSM rules already approximate the optimal signal frequency. Hence, the adaptive model’s marginal advantage manifests mainly during crisis periods, such as the 2008 global financial crisis or the COVID-19 shock, when volatility surges temporarily disrupt trend persistence.
5.2.3. Nonlinear State Recognition and Turning-Point Adaptation (H2)
Empirical plots of cumulative strategy returns in Figure 9 and Figure 10 show that the adaptive model most clearly differentiates itself during trend reversals and high-volatility transitions, precisely as Hypothesis 2 predicts. In both markets, static momentum strategies suffer large drawdowns when long-established trends suddenly reverse, because linear signal updating reacts too slowly to regime shifts. The machine learning model, however, detects nonlinear interactions between returns and volatility. Decision-tree–based structures identify threshold points where volatility or drawdown acceleration signals a potential regime switch. Once these thresholds are crossed, the model dynamically downweights the prior trend exposure or flips the position altogether. As a result, drawdowns are reduced and recovery occurs faster after major inflection points. This mechanism is particularly visible in the Chinese market’s crisis phases: the model recognizes early signs of liquidity withdrawal or policy-induced panic and cuts exposure before large losses accumulate. Technically, this represents a successful capture of nonlinear state transitions — a capability unavailable to linear momentum rules. Economically, it reflects an ability to anticipate shifts in market psychology from momentum trading to risk aversion, which are more abrupt in retail-dominated markets.
5.2.4. Information Diffusion and Trend Stability Differences (H3)
The contrasting signal frequencies between the two markets further support Hypothesis 3. In the U.S. sample, the adaptive model switches signals infrequently and maintains longer holding periods, mirroring the high informational efficiency and slower drift of institutional flows. Price adjustments occur promptly after news arrivals, and prolonged trends are mainly driven by macro fundamentals or sector rotations. Consequently, the adaptive model’s role is mostly confirmatory: it reinforces persistent trends but rarely needs to recalibrate signal direction. In China, however, trends are shorter-lived, and information dissemination is uneven across investor groups. Retail sentiment, media coverage, and policy rumors create feedback loops that amplify price fluctuations before eventual mean reversion. The ML algorithm responds by identifying micro-trends embedded within broader volatility swings — essentially exploiting the time lag between information release and collective investor reaction. This explains why adaptive signals in China exhibit higher turnover yet maintain stronger risk-adjusted returns: the model dynamically extracts profit from transient predictability generated by delayed information absorption and behavioral inertia. Economically, these findings underscore how the same predictive architecture interacts differently with market efficiency. Where informational efficiency is high, adaptivity adds stability; where inefficiency and behavioral noise dominate, adaptivity extracts incremental alpha.
5.2.5. Market Complexity and Algorithmic Learning Advantage (H4)
The fourth hypothesis emphasizes that the effectiveness of ML-based strategies scales with market structural complexity. Empirical evidence aligns with this expectation: the adaptive model’s relative alpha contribution is largest in China, where return-generating processes are multifactorial and partially opaque. Machine learning’s capacity to process multi-dimensional, nonlinear features — such as lagged returns, realized volatility, order-book depth, and short-term momentum dispersion — allows it to uncover patterns hidden from linear frameworks. In a market where price dynamics reflect interactions among heterogeneous participants, regulatory actions, and exogenous shocks, such nonlinear mapping yields tangible predictive gains. By contrast, in the U.S. market, where noise is lower and institutional arbitrage reduces exploitable nonlinearity, the incremental benefit of ML diminishes. This finding suggests that algorithmic adaptivity is not universally advantageous but context-dependent: its edge arises precisely when the underlying market structure exhibits higher entropy and behavioral diversity.
From a financial-econometric perspective, the machine-learning component effectively substitutes for missing structural modeling — discovering latent conditional relationships in complex data environments that standard parametric specifications cannot represent.
5.2.6. Synthesis and Economic Interpretation
Taken together, the empirical patterns validate the conceptual framework introduced earlier. The adaptive ML-based TSM model’s superior performance in China arises from its ability to adjust dynamically to clustered volatility regimes (H1), detect nonlinear regime transitions and limit drawdowns during reversals (H2), exploit delayed information diffusion and short-lived trends (H3), and learn complex, nonlinear structures embedded in behavioral and policy-driven dynamics (H4).
In contrast, the U.S. market’s structural stability, high liquidity, and informational efficiency limit the incremental role of adaptivity. Here, the ML model serves more as a robustness enhancer than a return generator, preserving capital during volatility spikes rather than discovering new alpha sources.
Overall, the findings demonstrate that the interaction between market structure and algorithmic adaptability is central to understanding the heterogeneous performance of ML-driven momentum strategies. Machine learning does not merely “predict better” — it dynamically interprets the changing regime logic of each market, translating statistical adaptivity into economic timing ability.
6. Return Attribution Analysis of the Strategy
To further investigate the sources of excess returns generated by the adaptive machine learning momentum strategy, we adopt the Alpha-Beta decomposition framework proposed by Goulding et al. (2023), breaking down the strategy returns into the following components:
1.Alpha (Timing Ability): The strategy's capability to capture market turning points, avoid downturns, or position ahead of market movements.
2. Beta (Risk Factor Exposure): The strategy's systematic exposure to market risk, volatility, momentum factors, and other risk sources.
6.1. Momentum and Return Attribution Analysis in the S&P 500: Short- vs. Long-Term Horizons
Figure 11 present the cumulative returns, rolling alpha, volatility regimes, and factor exposure of the adaptive TSM strategy applied to the S&P 500 futures.
As illustrated in Figure 11, the adaptive strategy achieves steady performance with lower drawdowns compared to static benchmarks, particularly during volatile periods such as 2008–2009 and 2020. However, the rolling alpha shown in Figure 12 remains close to zero for most of the sample period and is statistically insignificant, indicating limited genuine market timing ability.
Figure 13 reveals that the strategy’s signal switching aligns well with volatility regimes—preferring short-term signals during high-volatility periods and long-term signals during calm markets. This dynamic adjustment, while effective in controlling risk, is primarily a rebalancing of beta exposures, as confirmed by Figure 14, where the strategy maintains consistent exposure to momentum and volatility factors.
In summary, the U.S. adaptive strategy’s outperformance is beta-driven. The adaptive strategy demonstrates limited alpha contribution in the U.S. market. Although the estimated alpha is positive, it lacks statistical significance, indicating that the observed excess returns primarily stem from systematic exposure to market risk factors such as volatility and momentum. This performance is predominantly beta-driven: the strategy leans toward long-term momentum during low-volatility periods and shifts to short-term momentum in high-volatility regimes. Such dynamic adjustments essentially represent a rebalancing of beta exposures rather than genuine market timing ability. In conclusion, within the highly efficient and institutionally dominated U.S. equity market, the principal advantage of the machine learning model lies not in alpha generation but in the enhancement of risk management capabilities.
6.2. Momentum and Return Attribution Analysis in the CSI 300: Short- vs. Long-Term Horizons
Figure 15 report the parallel results for the CSI 300 futures.
Figure 15 shows that the adaptive strategy not only achieves higher cumulative returns but also significantly mitigates losses during high-stress periods, such as the 2015 market crash and the 2018 trade war. Figure 16 clearly demonstrates a positive and statistically significant rolling alpha, especially during high-volatility and policy-sensitive periods, underscoring the model’s superior market timing capability.
From Figure 17, we observe frequent and timely signal switching driven by volatility regime recognition—short-term signals dominate during turbulence, while long-term signals prevail in stable conditions. This flexibility allows the model to capitalize on transient mispricing caused by behavioral biases among retail investors.
Figure 18 further supports that although the strategy retains exposure to classic risk factors, the share of returns explained by alpha is substantially higher than that in the U.S. market. This suggests that the model captures value not only from risk premia but also from behavioral and informational inefficiencies peculiar to the Chinese market.
The adaptive strategy exhibits statistically significant positive alpha in the Chinese market, indicating a strong market timing capability, particularly during high-volatility regimes and policy-induced disruptions. While a portion of the strategy's returns remains attributable to exposures to risk factors such as volatility and momentum, the proportion derived from alpha is substantially larger than that observed in the U.S. market. This can be behaviorally explained by the structure of the Chinese market, which is dominated by retail investors, characterized by delayed information diffusion and pronounced sentiment-driven trading. These conditions create short-lived pricing dislocations resulting from irrational investor behavior, which the machine learning model is able to systematically identify and exploit, thereby generating alpha.
The return attribution results strongly align with the market structural differences outlined in Section 1. In the U.S., high informational efficiency and institutional dominance leave little room for pure alpha generation. The adaptive model mainly adds value through smart beta timing. In China, pervasive retail trading, slow information diffusion, and policy shocks create repeated pricing errors. The machine learning model identifies these regime-dependent inefficiencies, yielding significant and persistent alpha. This contrast confirms that the economic value of machine learning in momentum strategies is not uniform but closely tied to the degree of market efficiency and investor structure.
7. Concluding Remarks
This study develops and empirically validates an adaptive time-series momentum (TSM) strategy that dynamically switches between short- and long-term signals based on volatility regimes identified by a machine learning model. Our comparative analysis between the S&P 500 and CSI 300 index futures markets yields several key conclusions and practical implication. Our findings robustly demonstrate that the adaptive machine learning strategy enhances risk-adjusted performance in both the U.S. and Chinese markets. However, the economic source of this outperformance is fundamentally different, deeply rooted in the distinct market microstructures.
In the U.S. market, characterized by high informational efficiency and institutional dominance, the strategy's value is primarily derived from dynamic beta management. It adeptly adjusts risk factor exposures—most notably to volatility and momentum—in response to changing market regimes. While this leads to more stable returns and reduced drawdowns, particularly during crisis periods, it does not generate statistically significant alpha. The model's role here is that of a sophisticated risk optimizer rather than a pure alpha generator.
Conversely, in the Chinese market, where retail investors play a more substantial role and information diffusion is less efficient, the strategy demonstrates a pronounced and significant alpha-generating capability. This alpha stems from the model's ability to identify and exploit short-lived pricing inefficiencies and behavioral biases. It successfully captures transient trends driven by sentiment and reacts swiftly to policy-induced shocks, translating nonlinear regime recognition into tangible economic gain through superior market timing.
Ultimately, the research underscores that the efficacy of machine learning in quantitative finance is not one-size-fits-all. Its value is maximized in complex, less informationally efficient environments where it can decipher the intricate, nonlinear interactions between market structure, investor behavior, and price dynamics.
Author Contributions
Conceptualization, Q.L and K.H.; methodology, Q.L. Z.Z and K.H; software, Q.L.; validation, Q.L., K.H. and Z.Z.; formal analysis, Q.L. Z.Z and X.H; investigation, Q.L. and K.H; resources, Q.L X.H and K.H; data curation, X.H Q.L. and Z.Z; writing—original draft preparation, Q.L. and K.H, Z.Z; writing—review and editing, Q.L. Z.Z X.H and Z.Z; visualization, Q.L.; supervision, Q.L. and X.H; project administration, Q.L and K.H.; funding acquisition, Q.L and K.H. All authors have read and agreed to the published version of the manuscript.
Funding
This research was funded by the National Natural Science Foundation of China, grant number 72462001; the National Social Science Foundation of China under Grant 24XJY047; Guangxi Philosophy and Social Science Planning Research Project, grant number 22CJY003 and 23FYJ026; Nanning University Institutional Research Project, grant number 2025KYJJ330.
Data Availability Statement
Not applicable.
Acknowledgments
We appreciate helpful comments from LING LIN.
Conflicts of Interest
The authors declare no conflicts of interest.
References
- ASNESS C S. The interaction of value and momentum strategies[J]. Financial Analysts Journal 1994, 50(2), 29–36.
- ASNESS C S, MOSKOWITZ T J, PEDERSEN L H. Value and momentum everywhere[J]. The Journal of Finance 2013, 68(3), 929–985.
- CONRAD J, KAUL G. An anatomy of trading strategies[J]. The Review of Financial Studies 1998, 11(3), 489–519. [CrossRef]
- COCHRANE J H. Presidential address: Discount rates[J]. The Journal of Finance 2011, 66(4), 1047–1108. [CrossRef]
- EHSANI S, LINNAINMAA J T. Factor momentum and the momentum factor[J]. The Journal of Finance 2022, 77(3), 1877–1919. [CrossRef]
- FAMA E F, FRENCH K R. Dividend yields and expected stock returns[J]. Journal of Financial Economics 1988, 22(1), 3–25. [CrossRef]
- GEORGOPOULOU A, WANG J G. The trend is your friend: Time-series momentum trends across asset classes[J]. Risk 2017, 30(8), 1–5.
- GRIFFIN J M, JI X, MARTIN J S. Momentum investing and business cycle risk: Evidence from pole to pole[J]. Journal of Finance 2003, 58(6), 2515–2547. [CrossRef]
- GUTIERREZ R C, KELLEY E K. The long-lasting momentum in weekly returns[J]. The Journal of Finance 2008, 63(1), 415–447. [CrossRef]
- ISRAEL R, MOSKOWITZ T J. The role of shorting, firm size, and time on market anomalies[J]. Journal of Financial Economics 2013, 108(2), 275–301. [CrossRef]
- JEGADEESH N, TITMAN S. Returns to buying winners and selling losers: Implications for stock market efficiency[J]. The Journal of Finance 1993, 48(1), 65–91. [CrossRef]
- LEE C M C, SWAMINATHAN B. Price momentum and trading volume[J]. The Journal of Finance 2000, 55(5), 2017–2069. [CrossRef]
- MOSKOWITZ T J, OOI Y H, PEDERSEN L H. Time series momentum[J]. Journal of Financial Economics 2012, 104(2), 228–250.
- ROUWENHORST K G. International momentum strategies[J]. The Journal of Finance 1998, 53(1), 267–284. [CrossRef]
- CHENG E, KOSTYUCHYK N, LEE W, et al. Trending Fast and Slow[J]. The Journal of Portfolio Management 2021, 47(8), 151–165.
- GOULDING C L, HARVEY C R, MAZZOLENI M G. Momentum turning points[J]. Journal of Financial Economics 2023, 149(3), 378–406.
- ASVANUNT A, NIELSEN L E, VILLALON D. Working your tail off: Active strategies versus direct hedging[J]. The Journal of Investing 2015, 24(2), 134–145. [CrossRef]
- HURST B, OOI Y H, PEDERSEN L H. A century of evidence on trend-following investing[J]. The Journal of Portfolio Management 2017, 44(1), 15–29.
Figure 1.
S&P 500 Signal.

Figure 2.
CSI 300 Signal.

Figure 3.
Market Return Comparison (2006-2020).

Figure 4.
Overall Return Comparison (2006-2020).

Figure 5.
Market Return and Momentum Return in CSI 300 from 2006-2020.

Figure 6.
Market Return and Momentum Return in S&P from 2006-2020.

Figure 7.
CSI 300 Rolling Volatility.
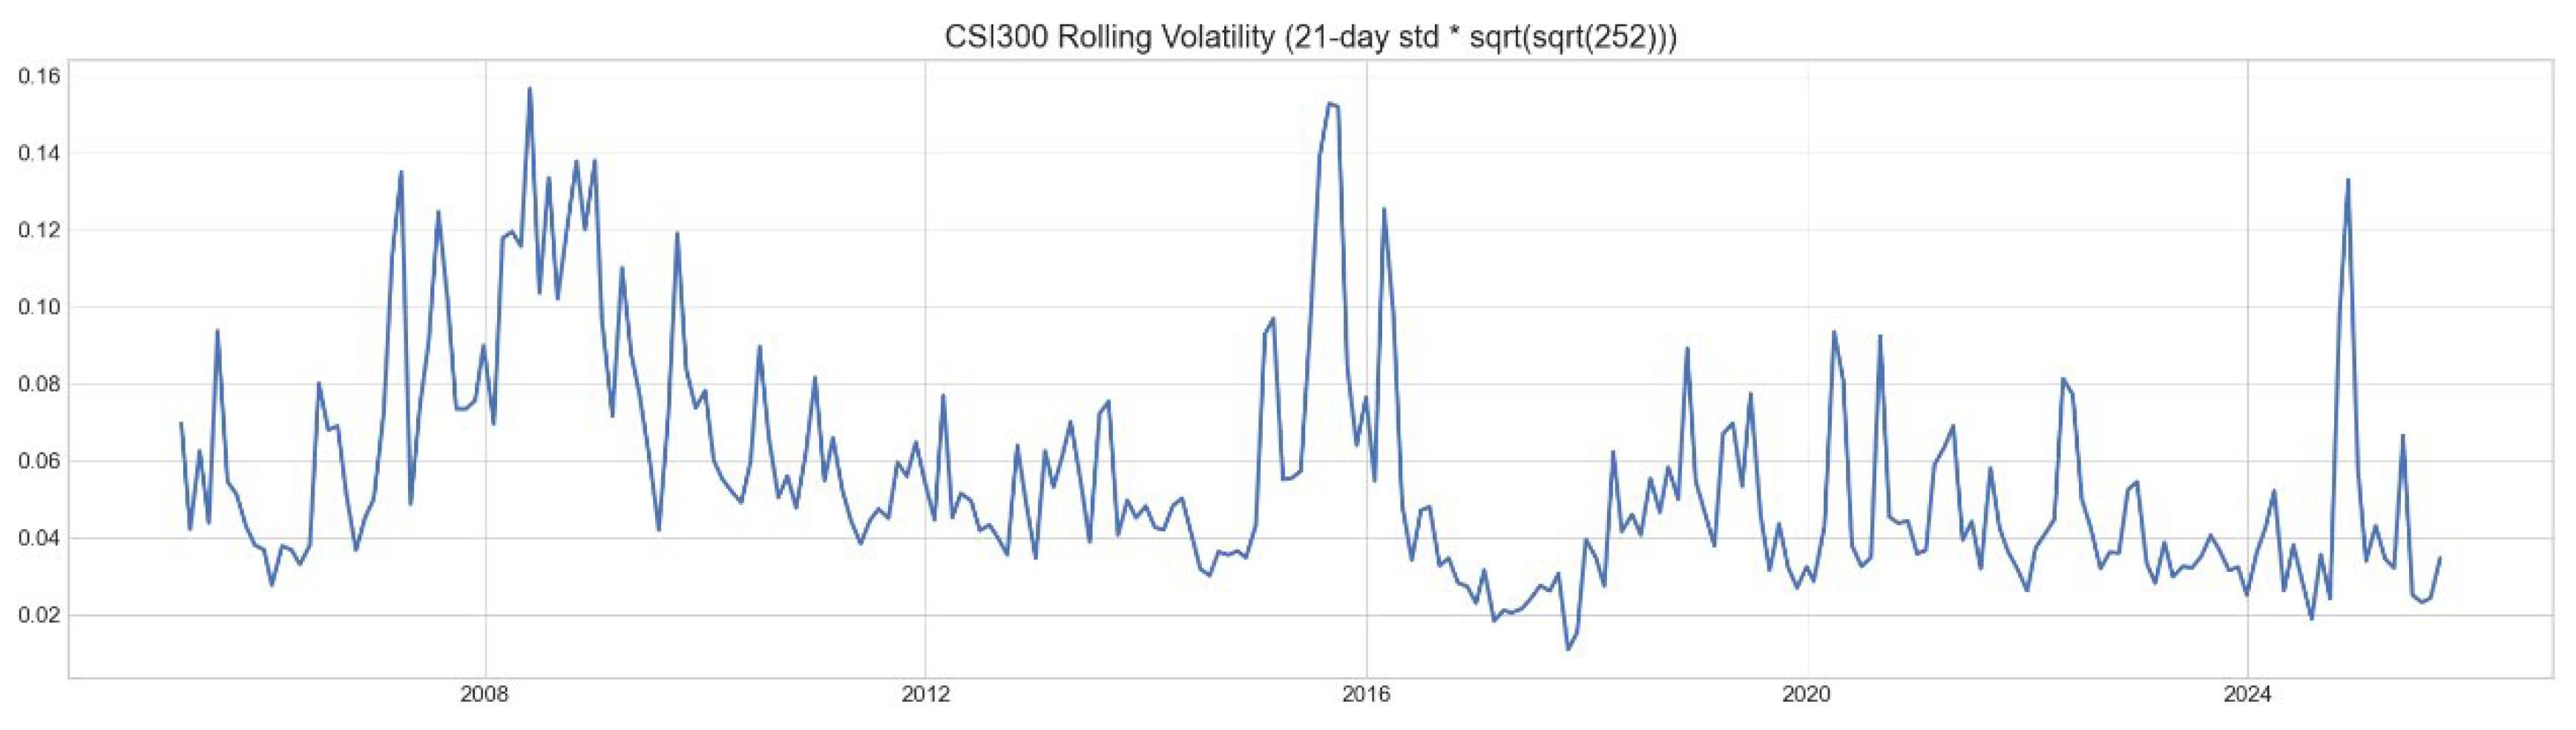
Figure 8.
S&P500 Rolling Volatility.

Figure 9.
Strategy Return in S&P 500 from 2006-2020.

Figure 10.
Strategy Return in CSI 300 from 2006-2020.

Figure 11.
S&P 500 Tree Strategy Alpha Attrition by Volatility Bucket.

Figure 12.
S&P 500 Tree Strategy Alpha Attrition by Trend Strength.

Figure 13.
S&P 500 Tree Strategy Alpha Attrition: Agreement vs Conflict.

Figure 15.
CSI 300 Tree Strategy Alpha Attrition by Volatility Bucket.

Figure 16.
CSI 300 Tree Strategy Alpha Attrition by Trend Strength.

Figure 17.
CSI 300 Tree Strategy Alpha Attrition: Agreement vs Conflict.

Figure 18.
CSI 300 Tree Strategy Alpha Attrition Across Market Conditions.

Disclaimer/Publisher’s Note: The statements, opinions and data contained in all publications are solely those of the individual author(s) and contributor(s) and not of MDPI and/or the editor(s). MDPI and/or the editor(s) disclaim responsibility for any injury to people or property resulting from any ideas, methods, instructions or products referred to in the content. |
© 2026 by the authors. Licensee MDPI, Basel, Switzerland. This article is an open access article distributed under the terms and conditions of the Creative Commons Attribution (CC BY) license.
Copyright: This open access article is published under a Creative Commons CC BY 4.0 license, which permit the free download, distribution, and reuse, provided that the author and preprint are cited in any reuse.