

Submitted:
10 March 2026
Posted:
13 March 2026
You are already at the latest version
Abstract
Translation process research (TPR) relies on objective behavioral data to uncover the cognitive mechanisms underlying translation. This paper provides a comprehensive methodology for using Translog-II, a specialized tool for recording user activity data during translation tasks. We outline the complete experimental workflow—from project configuration to data collection—demonstrated through an English-to-Chinese translation-from-scratch case study. The study details the integration of Translog-II with the CRITT Translation Process Research Database (TPR-DB) to facilitate advanced post-processing. Key technical challenges are addressed, specifically the complexities of keystroke-to-word mapping for logo-graphic scripts requiring Input Method Editors (IMEs). We further demonstrate automated alignment protocols, multidimensional error annotation, and data visualization techniques utilizing Python scripts and Shiny R interfaces. The results indicate that while automated mapping is generally robust, specific technical noise, particularly regarding long deletions, can be mitigated through systematic analysis. Ultimately, this protocol establishes a reproducible framework for exploring translator behavior, enhancing the precision of data-driven insights into cognitive translation processes.
Keywords:
translation process research
; keylogging
; eye-key span
; cognitive translation studies
; input method editor
; user activity data
1. Introduction
Understanding how translators process language — how they read, comprehend, and reformulate meaning across linguistic systems — is a central concern in both applied linguistics and cognitive science. Translation, as a complex bilingual language processing task, offers a unique window into the interaction between comprehension and production, drawing on skills that span reading, writing, problem-solving, and cross-linguistic transfer (Angelone et al., 2015; Shreve & Lacruz, 2014). Over the past three decades, translation process research (TPR) has evolved from introspective methods such as think-aloud protocols (Jääskeläinen, 2010) to empirical, technology-driven approaches that capture behavioral data with millisecond precision (Kotze, 2019).
Keystroke logging has emerged as one of the popular methods for studying translation and writing processes (Muñoz Martín et al., 2025). By recording every insertion, deletion, and cursor movement during text production, keylogging provides a non-intrusive, fine-grained record of how a text unfolds over time. Pauses between keystrokes, for instance, are widely interpreted as indicators of cognitive effort — reflecting processes such as lexical retrieval, syntactic planning, or problem-solving at various linguistic levels (Alves & Vale, 2009, 2011; Muñoz Martín & Cardona Guerra, 2019). Similarly, patterns of revision and deletion reveal how translators monitor and regulate their output, offering insights into the interplay between automatic and controlled processing during bilingual text production (Schaeffer & Carl, 2017).
Among the tools developed for keystroke logging in translation research, Translog-II (Carl, 2012a) has been one of the most established instruments in the field of TPR. Building on its predecessors, Translog-2000 and Translog-2006 (Schou et al., 2009), Translog-II records keystrokes and, when connected to an eye-tracker, gaze movements during reading and writing tasks. The logged data can be uploaded to the CRITT Translation Process Research Database (TPR-DB) (Carl, 2012a; Carl et al., 2016), which offers post-processing capabilities including tokenization, keystroke-to-word mapping, bilingual word alignment, and the extraction of a wide range of process and product features. Together, Translog-II and the CRITT TPR-DB have formed the backbone of a substantial body of empirical research in TPR, with data from hundreds of translation sessions publicly available under a Creative Commons license.
Importantly, keylogging with Translog-II represents the most accessible entry point for conducting behavioral experiments in TPR. The software is freely available for download from the CRITT website, and a keylogging experiment requires no specialized hardware beyond a standard Windows computer. This makes it particularly well-suited for researchers who are new to empirical translation studies and wish to gain hands-on experience with process data before advancing to more complex experimental setups. Once researchers are comfortable with the foundational keylogging workflow, they can progressively integrate more sophisticated data streams — for instance, connecting an eye-tracker to capture gaze data alongside keystrokes, combining Translog-II data with Inputlog for broader writing process analysis, or using the Trados-to-Translog-II interface (Yamada et al., 2022; Zou & Carl, 2022; Zou et al., 2023) to collect process data within a professional computer-assisted translation (CAT) environment. This scalability — from a simple, zero-cost keylogging setup to a multimodal, ecologically valid research design — makes Translog-II an ideal starting point for building methodological competence in empirical TPR.
Beyond its value for research, the accessibility of the keylogging setup also makes it a practical tool for translation pedagogy. Instructors can incorporate process-oriented activities into their courses, for example, having students translate a text in Translog-II accompanied by concurrent think-aloud protocols, or replaying the recorded session afterward for retrospective verbalization of their decision-making, pausing behavior, and revision strategies. Combining these approaches also introduces students to the principle of methodological triangulation in empirical research. Such activities enable students to monitor and critically examine their own translation processes at minimal cost, supporting the growing emphasis in translator education on process awareness alongside product quality.
Despite its long history, widespread use, and low barrier to entry, a comprehensive, hands-on guide to conducting keylogging experiments with Translog-II and processing the resulting data through the CRITT TPR-DB has not been available. Existing descriptions of the tool are distributed across conference proceedings, book chapters, and technical documentation on the CRITT website (Schou et al. (2009); Carl (2012a, 2012b); Carl et al. (2016)), making it difficult for newcomers, particularly researchers outside the immediate TPR community, to adopt the methodology. This is a notable gap, as keylogging methods hold considerable potential for researchers in second language acquisition, writing studies, psycholinguistics, and language pedagogy who may benefit from process-level data but lack familiarity with the available tools and workflows.
Moreover, conducting keylogging experiments with languages that require Input Method Editors (IMEs) — such as Chinese and Japanese — presents unique methodological challenges. The relationship between keystrokes and the characters that appear on screen is not straightforward in these writing systems, as multiple keystrokes are needed to produce a single logographic character through phonetic conversion. How these IME-mediated processes are logged and mapped to the final text has important implications for the reliability of process data, yet this topic has received limited systematic attention.
This paper addresses these gaps by providing a step-by-step demonstration of how to use Translog-II to conduct a keylogging experiment, from project creation and data collection to post-processing and analysis using the CRITT TPR-DB. Using an English-to-Chinese translation task as a case study, the paper illustrates the complete experimental workflow, with particular attention to keystroke-to-word mapping and the challenges posed by IME-based input. It also demonstrates basic data analysis and visualization techniques, including the use of TPR-DB tables, Jupyter notebooks, and translation progression graphs. By making this workflow accessible and transparent, the paper aims to lower the barrier to entry for researchers across linguistics and language studies who wish to incorporate keylogging into their empirical research.
2. Translog-II: Components and Functions
This section describes the architecture and core functions of Translog-II. A more detailed account of its technical specifications can be found in (Carl, 2012a), and a historical overview of its development is provided by (Schou et al., 2009).
2.1. Components of Translog-II
Translog-II consists of two main components: Translog-II Supervisor and Translog-II User. Translog-II Supervisor is used to create a project file and to replay recorded sessions. Translog-II User is used to run text production experiments in which a participant reads, writes, or translates a text. During a session, Translog-II produces log files containing user activity data (UAD), including keystrokes and, if an eye-tracker is connected, gaze movements.
Translog-II classifies keystroke data into several categories: insertion, deletion (via the delete and backspace keys), navigation (cursor movements), copy/cut-and-paste, return key, and mouse operations (Carl, 2012a). Since the keylogger runs in the background, the recording does not interfere with the writing or translation process. Translog-II logs the exact time at which each keystroke operation occurs. When connected to an eye-tracker, it also records gaze-sample points, computes fixations (i.e., clusters of gaze-samples), and maps fixations to the closest character on the screen (Carl, 2012a). This mapping relates the spatial location of gaze on the screen (an X/Y coordinate of a fixation center) to a character position in the text being viewed. Because gaze-sample recordings contain some noise, fixations and their character mappings can be recomputed offline. The gaze and keystroke data can then be correlated, as both refer to positions in the text. All information is stored in an XML format and can be replayed and analyzed within Translog-II or uploaded to the CRITT TPR-DB (Carl et al., 2016) for further processing.
2.2. Functions of Translog-II
Translog-II provides three main functions, as described by Carl (2012a). Function 1 (project creation) allows researchers to set up an experiment by configuring the screen layout — determining the size and orientation of source and target windows, as well as reading and writing permissions for each. Researchers can input and format texts for these windows, adjusting layout, font, size, color, and line spacing. They can also specify which data streams to log, such as keyboard input and eye-tracking information.
Function 2 (session recording) enables researchers to run and record a Translog-II session. This involves loading a project file, calibrating an eye-tracker if connected, and recording the UAD generated during the session.
Function 3 (replay and analysis) offers visualization and basic analysis capabilities for recorded log files. Researchers can access statistics and visualizations related to text production, deletion, and navigation events.
The Translog-II Supervisor program handles Functions 1 and 3 (project creation and replay), while the Translog-II User program is dedicated to Function 2 (session recording). A project file can be configured for different experimental setups: in a reading experiment, only the source window is visible; in a writing experiment, only the target window is visible; in a translation experiment, both windows are displayed, as illustrated in Figure 4. The source and target windows can be oriented horizontally or vertically and positioned left-right or top-bottom. Translog-II also supports post-editing experiments, in which a pre-existing text (e.g., machine translation output) is entered in the target window for participants to revise.
2.3. Replay and Visualization
Translog-II includes a replay tool designed primarily for qualitative data analysis, offering three visualization modes as described in Carl (2012a).
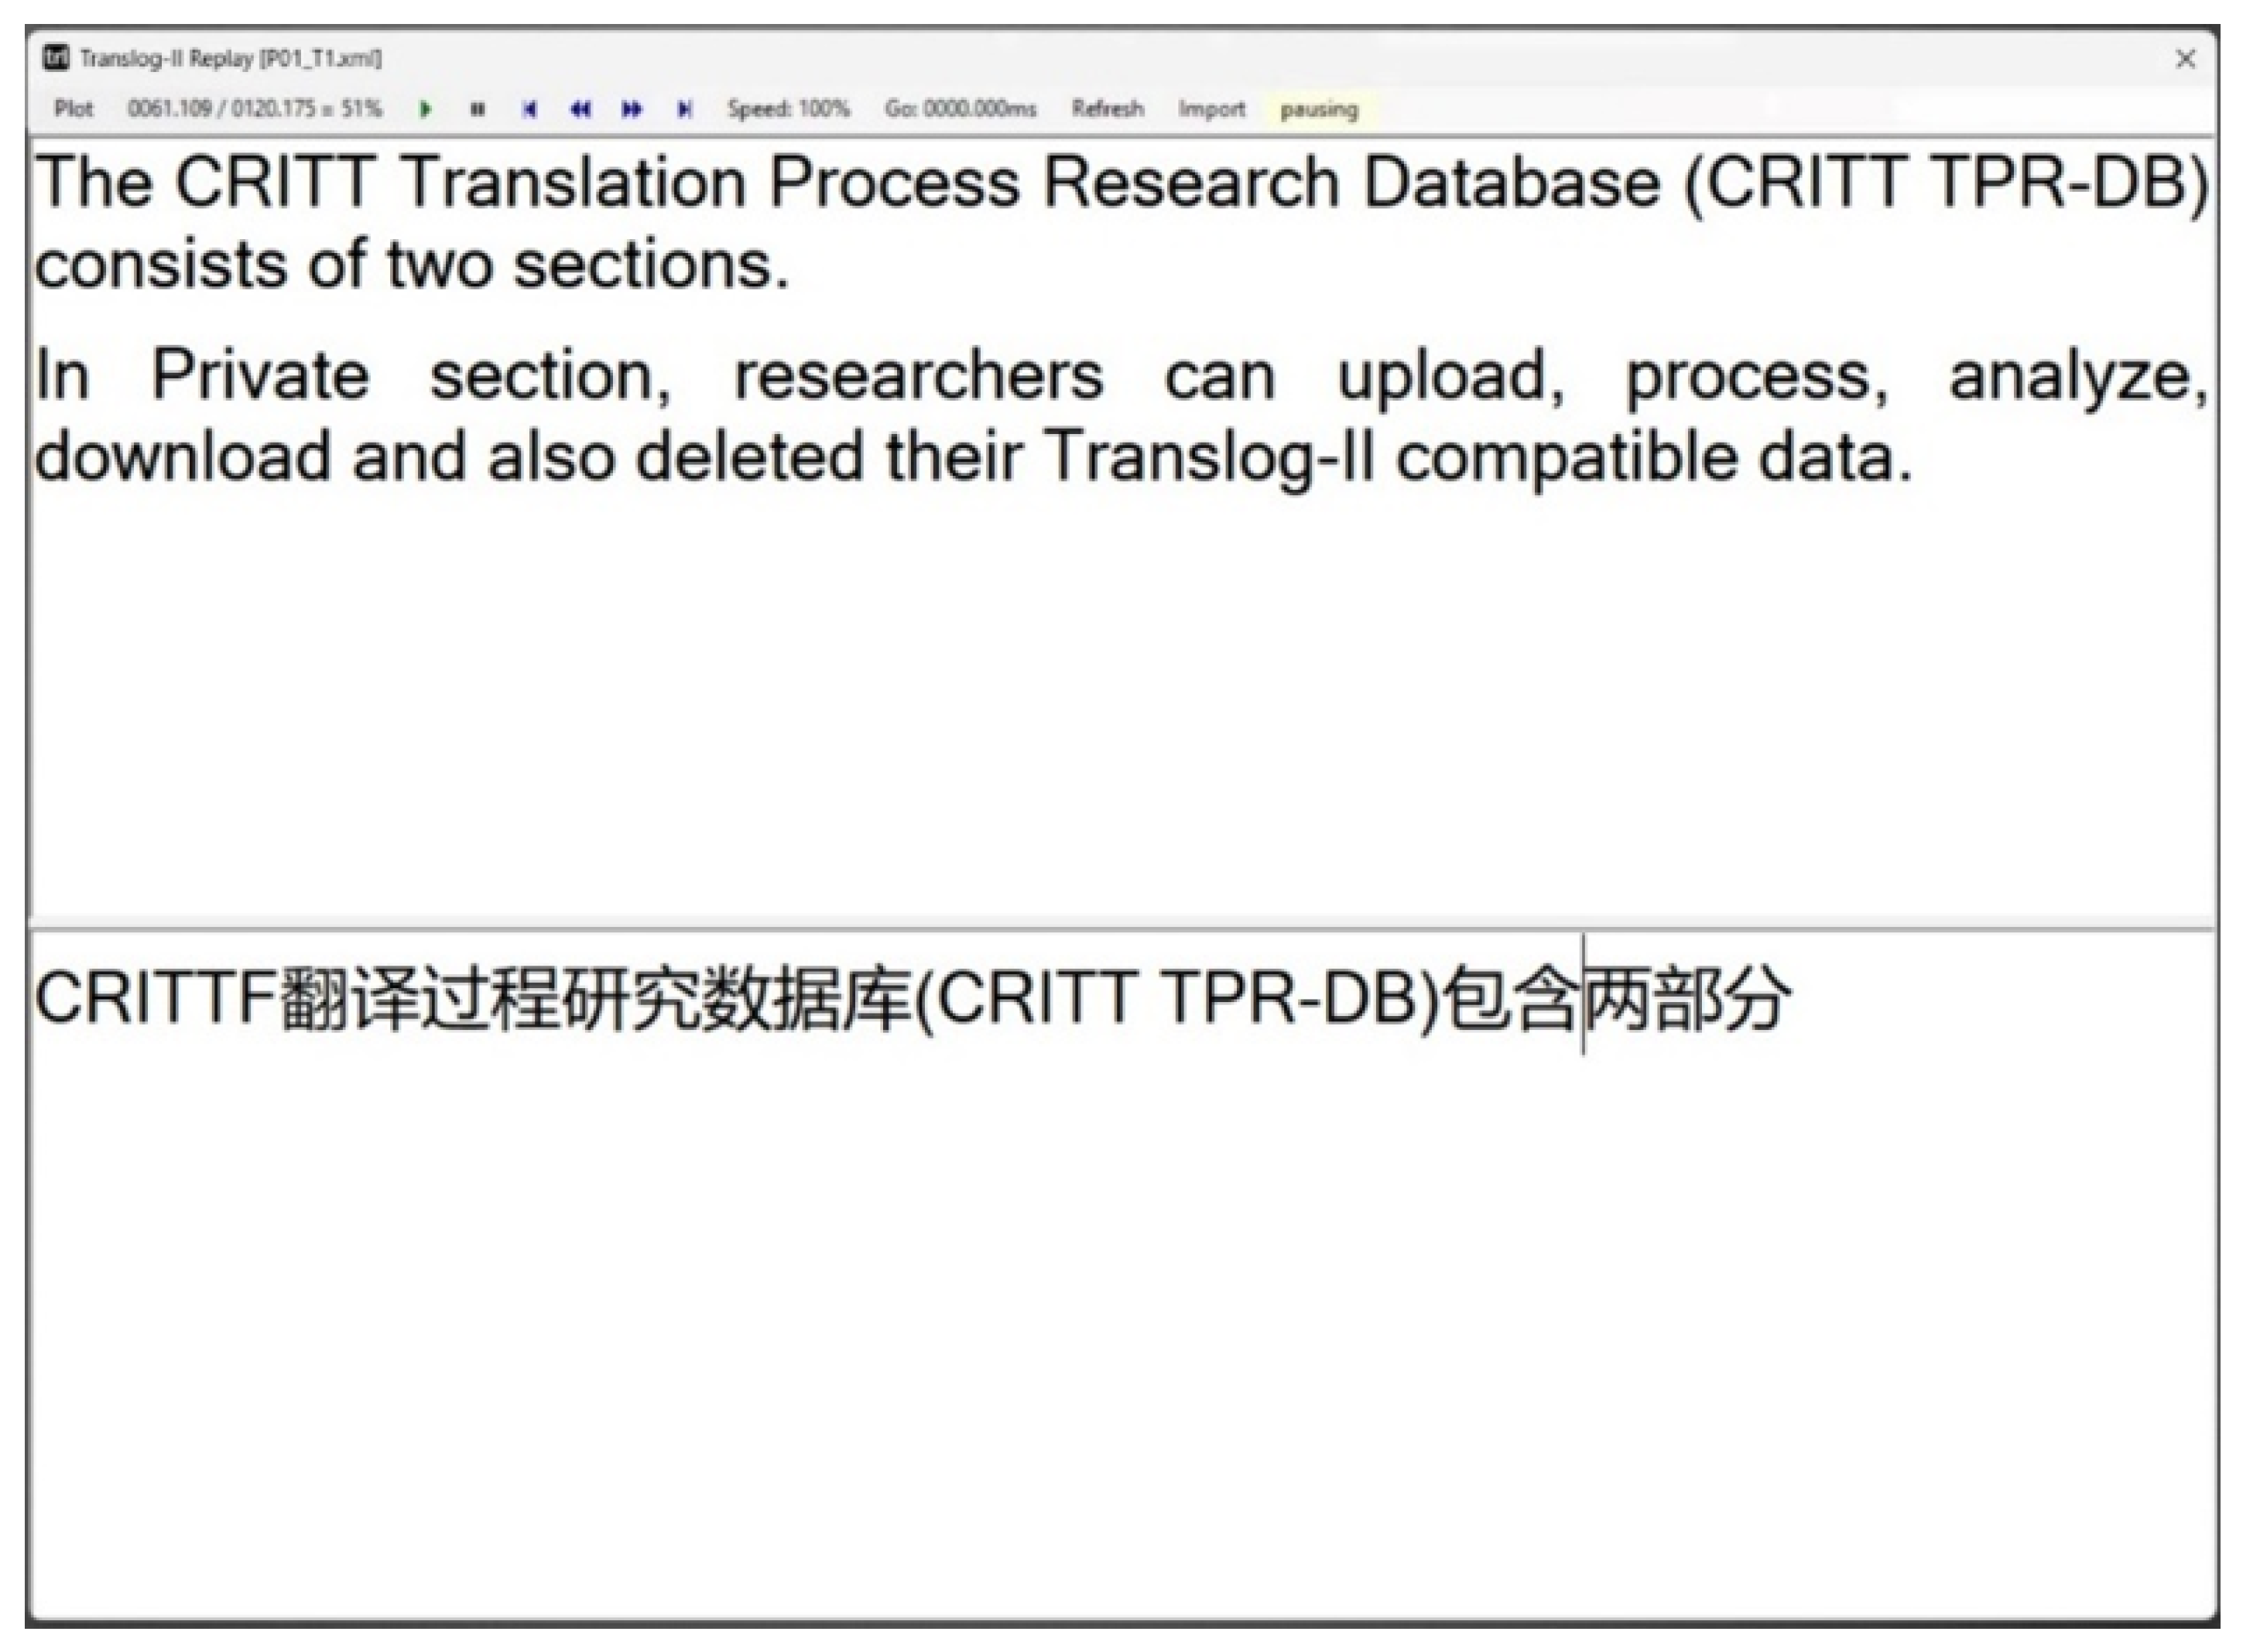
The user view (depicted in Figure 6) provides a real-time replay of the logged data, allowing researchers to observe the participant’s typing activity as it occurred during the session. Playback controls at the top of the interface allow researchers to accelerate, decelerate, pause, rewind, or fast-forward the replay.
The linear view displays the UAD in a textual format, representing each key and mouse activity in a linear sequence. Pauses between successive actions are indicated by asterisks or numeric values showing their duration. The granularity of the pause display can be adjusted from as little as 1 millisecond to any longer duration, allowing researchers to either obtain an overview of the overall temporal structure of a session or zoom in on specific sequences to study pausing behavior in detail.
The pause plot presents the same information as the linear view in the form of a 2D graph. Keyboard activities are displayed on the horizontal X-axis, while the vertical Y-axis shows the accumulation of time (pauses). Researchers can scroll through the pause plot and zoom in or out as needed.
Translog-II allows all three visualization modes to be opened simultaneously and synchronized. By activating the synchronization option in the user view, the cursor in all three windows is positioned at the same point in time, enabling synchronous replay across all views.
It should be noted, however, that the user view and linear view do not function reliably with gaze data, and their statistical outputs may be inaccurate when eye-tracking information is included. For more precise analysis involving gaze data, it is recommended to upload Translog-II log files to the CRITT TPR-DB and utilize the generated tables rather than relying on Translog-II’s built-in visualization functions.
3. Data Processing and Keystroke-to-word Mapping
In Translog-II, keystroke logging, gaze sampling, fixation detection, and gaze-to-word (or more accurately, fixation-to-character) mappings are performed online and in real time. The behavioral data collected, which includes keystrokes and gaze data with their time stamps and screen locations, is stored as raw logging data in an unstructured XML format. This data encompasses each translation session’s behavioral data, as well as the source and target texts and the positions of the characters on the screen. To map the behavioral and textual information, the data can be uploaded to the CRITT Translation Process Research Database (CRITT TPR-DB) (Carl et al., 2016) for post-processing.
3.1. CRITT TPR-DB
The CRITT TPR-DB is closely integrated with the data acquisition software Translog-II. It consists of two main sections. The first section is a publicly available database of recorded text processing sessions, primarily focused on translation, and is accessible under a Creative Commons license. The CRITT TPR-DB already hosts a significant amount of publicly accessible data, including legacy studies and sessions that have been utilized in various translation process research (TPR) projects. The legacy data were recorded using Translog-2006, the CASMACAT workbench, and Translog-II, which log keystrokes and gaze data during text perception and production.
The second section of the TPR-DB consists of private accounts. In this section, researchers can upload, process, analyze, download, and delete their Translog-II compatible data. If requested, private data can also be added to the public section of the TPR-DB. With the recent launch of the Trados-to-Translog-II interface (Yamada et al., 2022; Zou & Carl, 2022; Zou et al., 2023), keylogging data collected with Trados Studio (via the Qualitivity plugin) can now be uploaded to the TPR-DB. The uploading option can also synchronize with data from various eye-trackers, such as Tobii, Eyelink, and Gazepoint, recorded during translation sessions. To upload and process data in the TPR-DB, a private account is required. CRITT now offers a free test account, providing temporary access to the TPR-DB for researchers interested in exploring its features and functions1.
The browser interface of the TPR-DB enables researchers to upload and download raw logging data, align it at the segment or word level using various automatic and manual tools, annotate errors in translation products, generate TPR-DB tables, and analyze the data using a wide range of predefined and customized features. The processing of logged data in the TPR-DB generally involves four main steps.
1. Tokenization: segmentation of the source and target texts into word tokens
2. Keystroke mappings: decide which keystrokes (insertions and deletions) contribute to the production of which target token
3. Bilingual segment alignment: a very basic method to align ST-TT segments
4. Bilingual word alignment: assign minimal translation equivalents of source and the target tokens
The result is a richly interconnected data structure from which a large number of features can be extracted, as reported in (Carl et al., 2016). From Step 1 we know which are the most basic linguistic entities in the source and target texts. Step 2 allows us to compute the temporal effort (production duration) and technical effort (number of keystrokes) for each word produced, as we know the type of keystrokes (i.e. insertion/deletion) and its production time. Step 3 establishes connections between corresponding source and target segments. Step 4 finally relates the source and the target words, so that we can infer which keystrokes contributed to the translation of which source word. This allows us subsequently to assess the temporal and technical effort not only for each target word but also for the translation production of each source word. These steps are performed fully automatically when uploading a translation study to the TPR-DB.
The post-processed version of the data can be downloaded from the TPR-DB. This data consists of several tab-separated summary tables2, making it easier to process with various visualization and statistical analysis tools. The structure of these summary tables and the features they contain are documented on the CRITT website and also detailed in several publications (Carl, 2014; Carl et al., 2016), and research findings derived from these tables have been documented in numerous publications3.
On top of this, and if an eye tracker4 is connected during the Translog-II translation session, the TPR-DB relates gaze information to the source and target texts. In the recording phase of the gaze data, we only know which characters (in the source or the target texts) were fixated. After completion of Step 4, the TPR-DB can relate gaze information to words and across translations. For instance, by knowing the word alignments, the CRITT TPR-DB computes not only how often and how long a source word was fixated, but also how long and how often the translation of the source word was fixated. In addition, the uploading step relates gaze duration to keystroke activities, so that we can know, for instance, the lapse of time between the first fixation of a source word and the production of its translation (so-called eye-key span (EKS), see e.g. Dragsted (2010); Schaeffer & Carl (2017)).
The cross-lingual mapping provides a rich amount of information that has been the basis for a number of studies and insights in TPR. However, each of the processes: initial online logging, as well as Step 1 to Step 4, is based on heuristic assumptions on which later inferences and analysis depend. Gaze data has particularly fuzzy and noisy properties, which make the mapping of gaze records on characters and words somewhat unreliable. Also, keystroke mapping (Step 2) has uncertainties, mainly due to longer sequences of deletions, as it may be unclear to the production of which target tokens they should be assigned. In this paper, we will mainly focus on keystroke information and keystroke-to-word mapping in Translog-II.
3.2. Keystroke logging data
Translog-II logs keystrokes (and mouse clicks) in time. For keystroke events the following information is stored:
- Type: type of the keyboard activity: insert, delete, return, navigation, IME
- Text: deleted text string, or ‘###’ if it cannot be reconstructed in the editor.
- Value: value of the keystroke. This is usually the inserted character and the logged text modification in the case of IME
- X / Y: position of the top left corner of the character on the screen
- Width: width of the inserted character
- Height: height of the inserted character
Only backspace and the delete button produce events of type “delete”. A chunk of text can also be deleted when highlighting it while at the same time inserting another chunk of text. Such events (including paste operation, i.e., Ctrl+V) are recorded as insertions where the “Text” attribute contains the deleted chunk of text. Table 1 shows the Translog-II logging information of a deletion and an insertion event.
The two keystroke events in Table 1, deleting a highlighted piece of text and hitting the backspace and successive insertion of “N”, could equally be achieved through a single event in which the highlighted chunk is directly overwritten through the insertion of an “N”, which would have produced a log entry shown in Table 2. Key events of Type=navi are triggered by the navigation keys, including “Home”, “End”, etc., and in combination with the ctrl key. Type=return is only produced by a return keystroke.
3.3. Text Diff Logging and Input Method Editor (IME)
Since 2014, Translog-II makes use of an additional text-diff logging method, in addition to keystroke logging. As explained in Carl et al. (2016), the text-diff logging method records differences in the emerging texts as it appears on the screen, rather than memorizing the pressed keystrokes on the keyboard. For languages written in the Latin script, there is an isomorphism between the produced keystrokes and the modifications in the text, even though in some cases, two (or more) keystrokes have to be typed to produce diacritics, such as äæêèöçÆÜ, etc. This isomorphism does not exist for some other scripts, such as, e.g., Chinese or Japanese. These logo-graphic scripts make use of a special input method editor (IME), such as Microsoft Pinyin or SoGou 5 which converts a pinyin transcription into a most likely logo-gram. As a consequence, the relation between the pressed keys on the keyboard and the characters that appear on the screen cannot be reproduced from the keystroke log only, and the text cannot be reproduced. In these cases, Translog-II logs the pressed keystrokes in time and the text modifications in the editor, encodes them in UTF-8 and stores it in an XML file.
For example, in order to produce the Japanese Kanji "年", Table 3 shows that four characters were typed, “NENN”, plus the space bar to trigger the conversion in the IME tool. Translog-II records these five keystrokes as “Type=IME” events and the actual text modification as insertion.
While the text modification in the text editor was registered at time stamp 539451, the actual production started almost one second (826ms) earlier at time stamp 538625. Half of this time, i.e., 405ms, passed between the moment when triggering the Kanji conversion at time stamp 539046 until the Kanji appearance on the screen is logged. There are thus at least two possible answers if we ask how much time it takes to produce this Kanji: 421ms to produce the necessary keystrokes, or, 826ms until the Kanji appears on the screen.
The attribute “IMEtext” records the sequence of keystrokes that were typed to produce a (sequence of) characters which eventually appear on the screen. This IMEtext may be quite long, recording keystrokes for more than one word and it may contain arbitrary editing and deletion operations. The production of “につながった” (it led to), for instance, took more than 3.7 seconds and required about 24 keystrokes. It contains several revision operations in the IME, as recorded through the “Back” operation in the IMEtext:
NIOem5TUNAGABackBackBackBackTUNAGATTASpace
In another instance, the production of the Japanese term “終身刑” (Life penalty) needed 21 seconds and was obtained by approximately 22 keystrokes with the IMEtext:
SHBackBackD4BAISpaceBackBackSHUUSINKEISpace
Despite the fact that all keystrokes are recorded with a time stamp, if the produced string consists of more than one word, it is difficult to allocate the exact time needed for the production of each word, in particular because many IMEs (such as SoGou) can learn and adapt to different users, so that the typed sequence of keystrokes may (in principle) be different for the same terms produced.
3.4. Keystroke to Word Mapping
By successively replaying the recorded keystrokes (or in the case of IME, the logged text modifications) from the beginning to the end, we are in most of the cases able to reproduce the final translated text 6. The final translation is thus the final snapshot in the history of 1..m intermediate text versions, which – according to Step 1 described earlier – is segmented into a sequence of 1..n target text tokens. A cursor offset for each token indicates at which position the token starts in the final translation textm. As we know from the keystroke logging data (see Table 1) at which cursor positions an insertion or deletion took place, we can thus associate each keystroke k1 ... km a unique word token identifier (1 ... n).
The function keystroke-to-word-mapping starts backward from the end of the keylogging records with the final text textm at time t(km) and successively rewinds all the intermediate texts (textm. ... text1) by applying keystroke insertion or deletion activities (km ... k1) in a reversed order. An insertion ki of a string a at position x and time t(ki) will thus shorten the intermediate text texti-1 at time t(ki-1) by the length of the string a at position x. A deletion of a string a at position x increases the length of the texti-1 by inserting the deleted string a at position x. At the same time when reproducing the sequences of successive intermediate texts, all the gaze activities (if an eye tracker is connected) on the target tokens in the time span t(ki+1) - t(ki) texti as well as the technical and temporal effort are associated with the respective tokens. The offset for all tokens is thus updated.
The keystroke-to-word-mapping function works well for insertions. If text production only consists of insertions, all keystrokes could be correctly assigned to the tokens they produce. For deletions, it must be decided which token(s) (or parts of them) are deleted by the operation and which token IDs these activities should be assigned to.
The current heuristic for attributing deletions in text production assumes that the deleted string belongs to the token at its beginning. This approach is generally reliable for short deletions relative to the modified token’s length. For example, in correcting “imporantantes” to “importantes,” it is reasonable to attribute the deletion of “an” to the production of “importantes.” However, this method becomes less dependable as deletions increase in length, particularly when they span multiple words or entire phrases. Such longer modifications, often involving rephrasing in translation, have attracted significant attention in the TPR literature due to their potential to illuminate cognitive processes during translation.
Alves & Vale (2009, 2011), for instance, base their definition of micro units on recurring modifications (deletion, correction, addition, and other possible online changes) of the same text positions. They test on different pause thresholds (5 second, 3 second or 1 second intervals) and discuss several examples about the segment processing patterns in keylogging data. Building on this, Vale et al. (2016) suggests a toolkit that automatizes this task, by detecting replacements of different grammatical and semantic structures in ongoing text production.
For researchers requiring precise information about text deletions, especially longer ones, it may be advisable to re-assess longer deletions and manually assign them to the correct words they modify or replace. To facilitate this process, the CRITT TPR-DB offers a tool for semi-automatic adjustment of keystroke tables, so that parameters of technical and temporal effort can be correctly computed 7. Mapping of behavioral and linguistic data in the TPR-DB uploading process is not perfect and can introduce noise into analyses. However, the substantial volume of data often compensates for this noise, allowing researchers to detect significant patterns. There is, nevertheless, space for improvement and experimentation with novel and better methods to ameliorate the mapping processes and thus to enhance the precision and usability of the data and extracted features.
4. Research Case and Analysis
This section focuses on utilizing Translog-II to collect, process, and analyze data for a keystroking TPR experiment. We will provide a step-by-step demonstration of how to conduct an English-to-Chinese translation-from-scratch experiment.
4.1. Data Collection
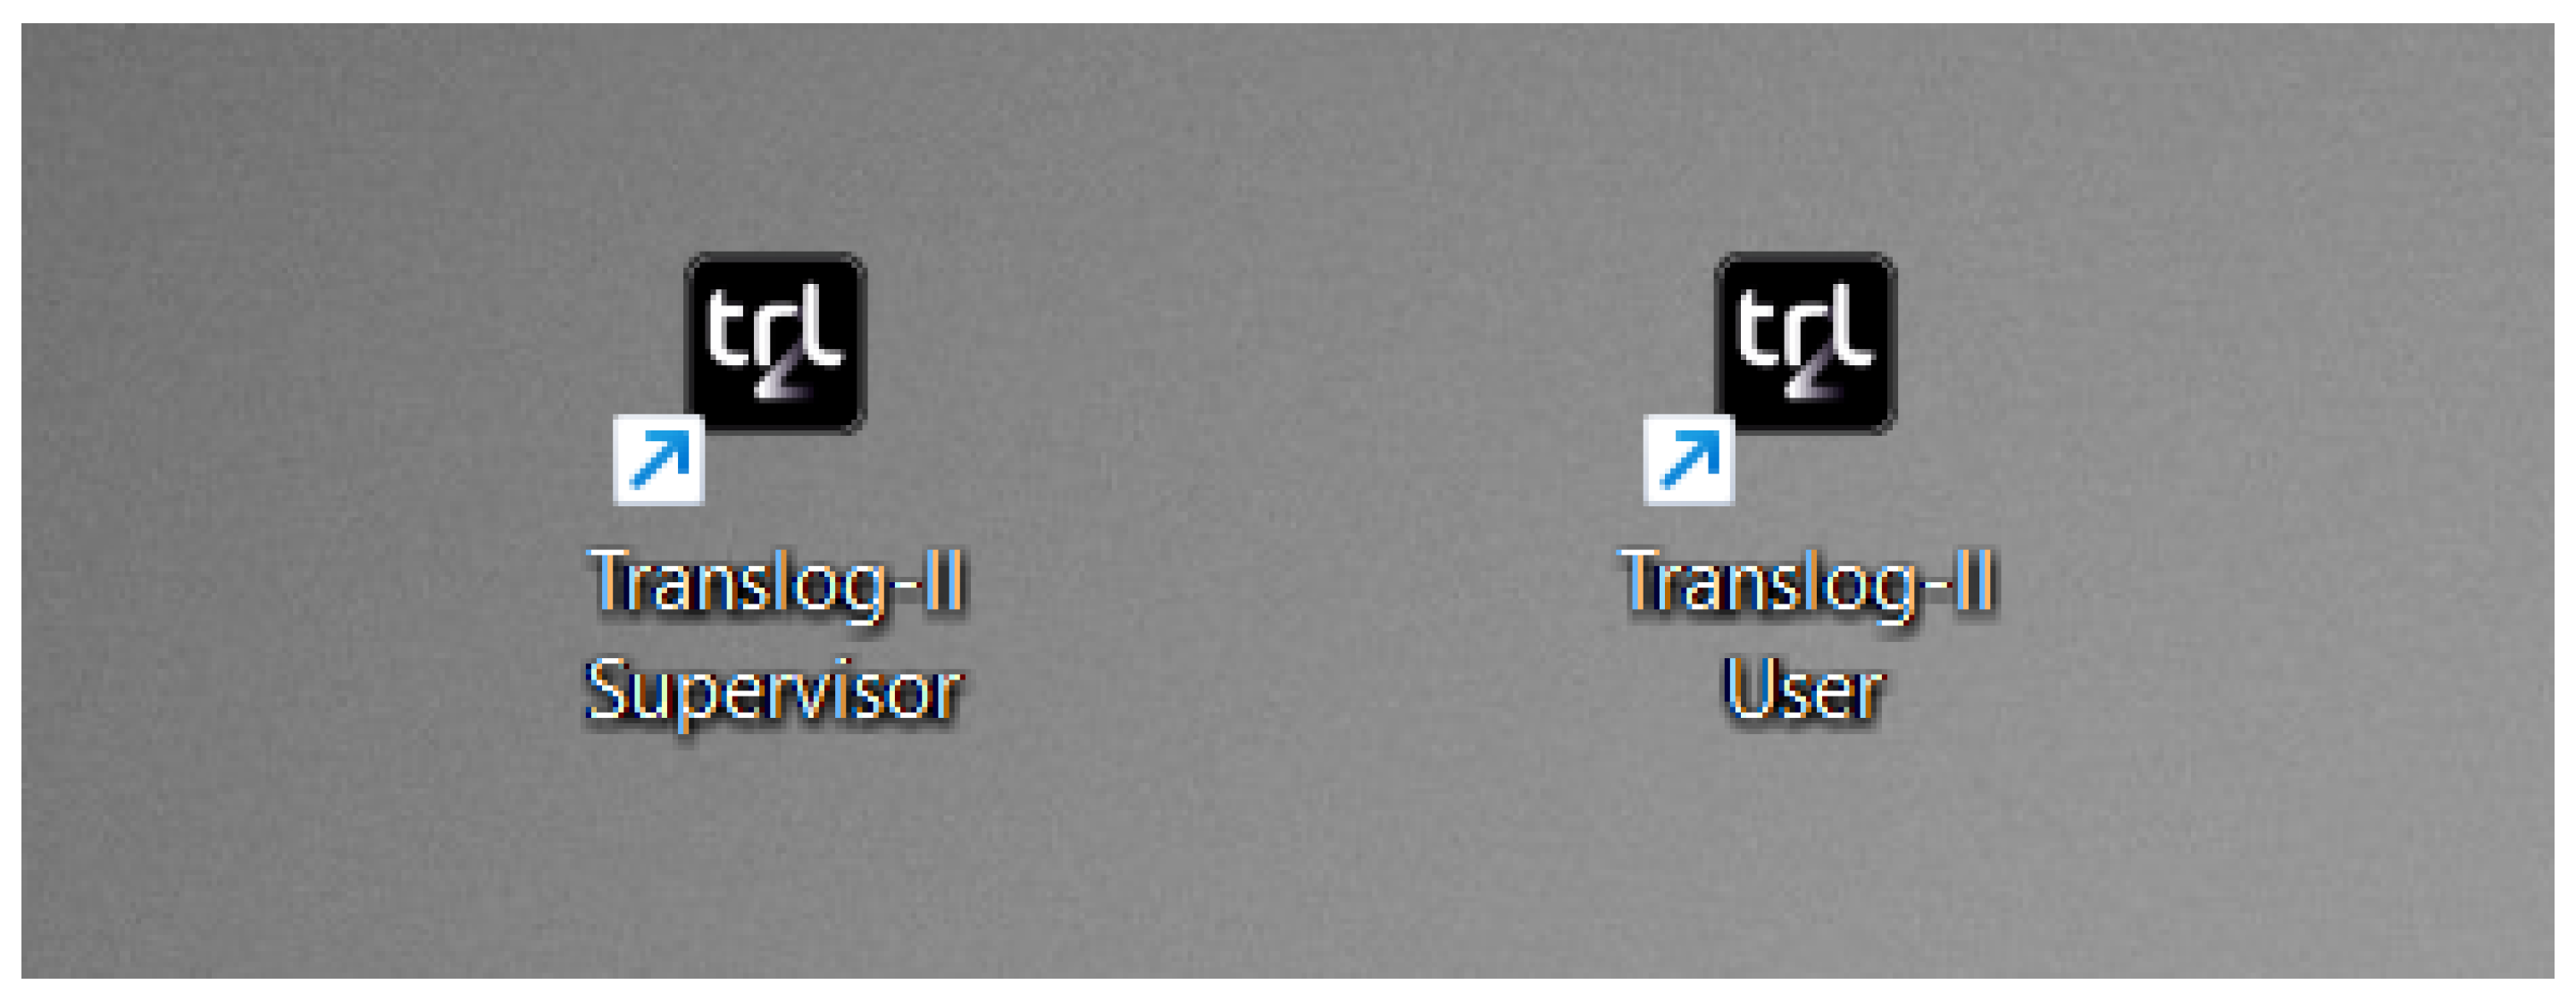
To collect keylogging data using Translog-II, we need to download the Translog-II software from the Critt@Kent website first 8. Translog-II operates exclusively on Windows system, so it is recommended to use a Windows computer for conducting the translation experiment with Translog-II. Upon downloading, we will have two programs on our computer: Translog-II Supervisor and Translog-II User, as illustrated in Figure 1 below.
Figure 1.
Translog-II Supervisor and Translog-II User
4.1.1. Create a new project
To start a new from-scratch translation experiment, we first use Translog-II Supervisor to design the experiment. When we open Translog-II Supervisor, we will see two options, “Create Project” and “Open Project,” under the “Project” tab in the leftmost corner of the task bar on the interface, as depicted in Figure 2 below. For creating a new project, we select “Create project”, whereas for opening an existing project, we select “Open project”.
Figure 2.
Creating a project in Translog-II

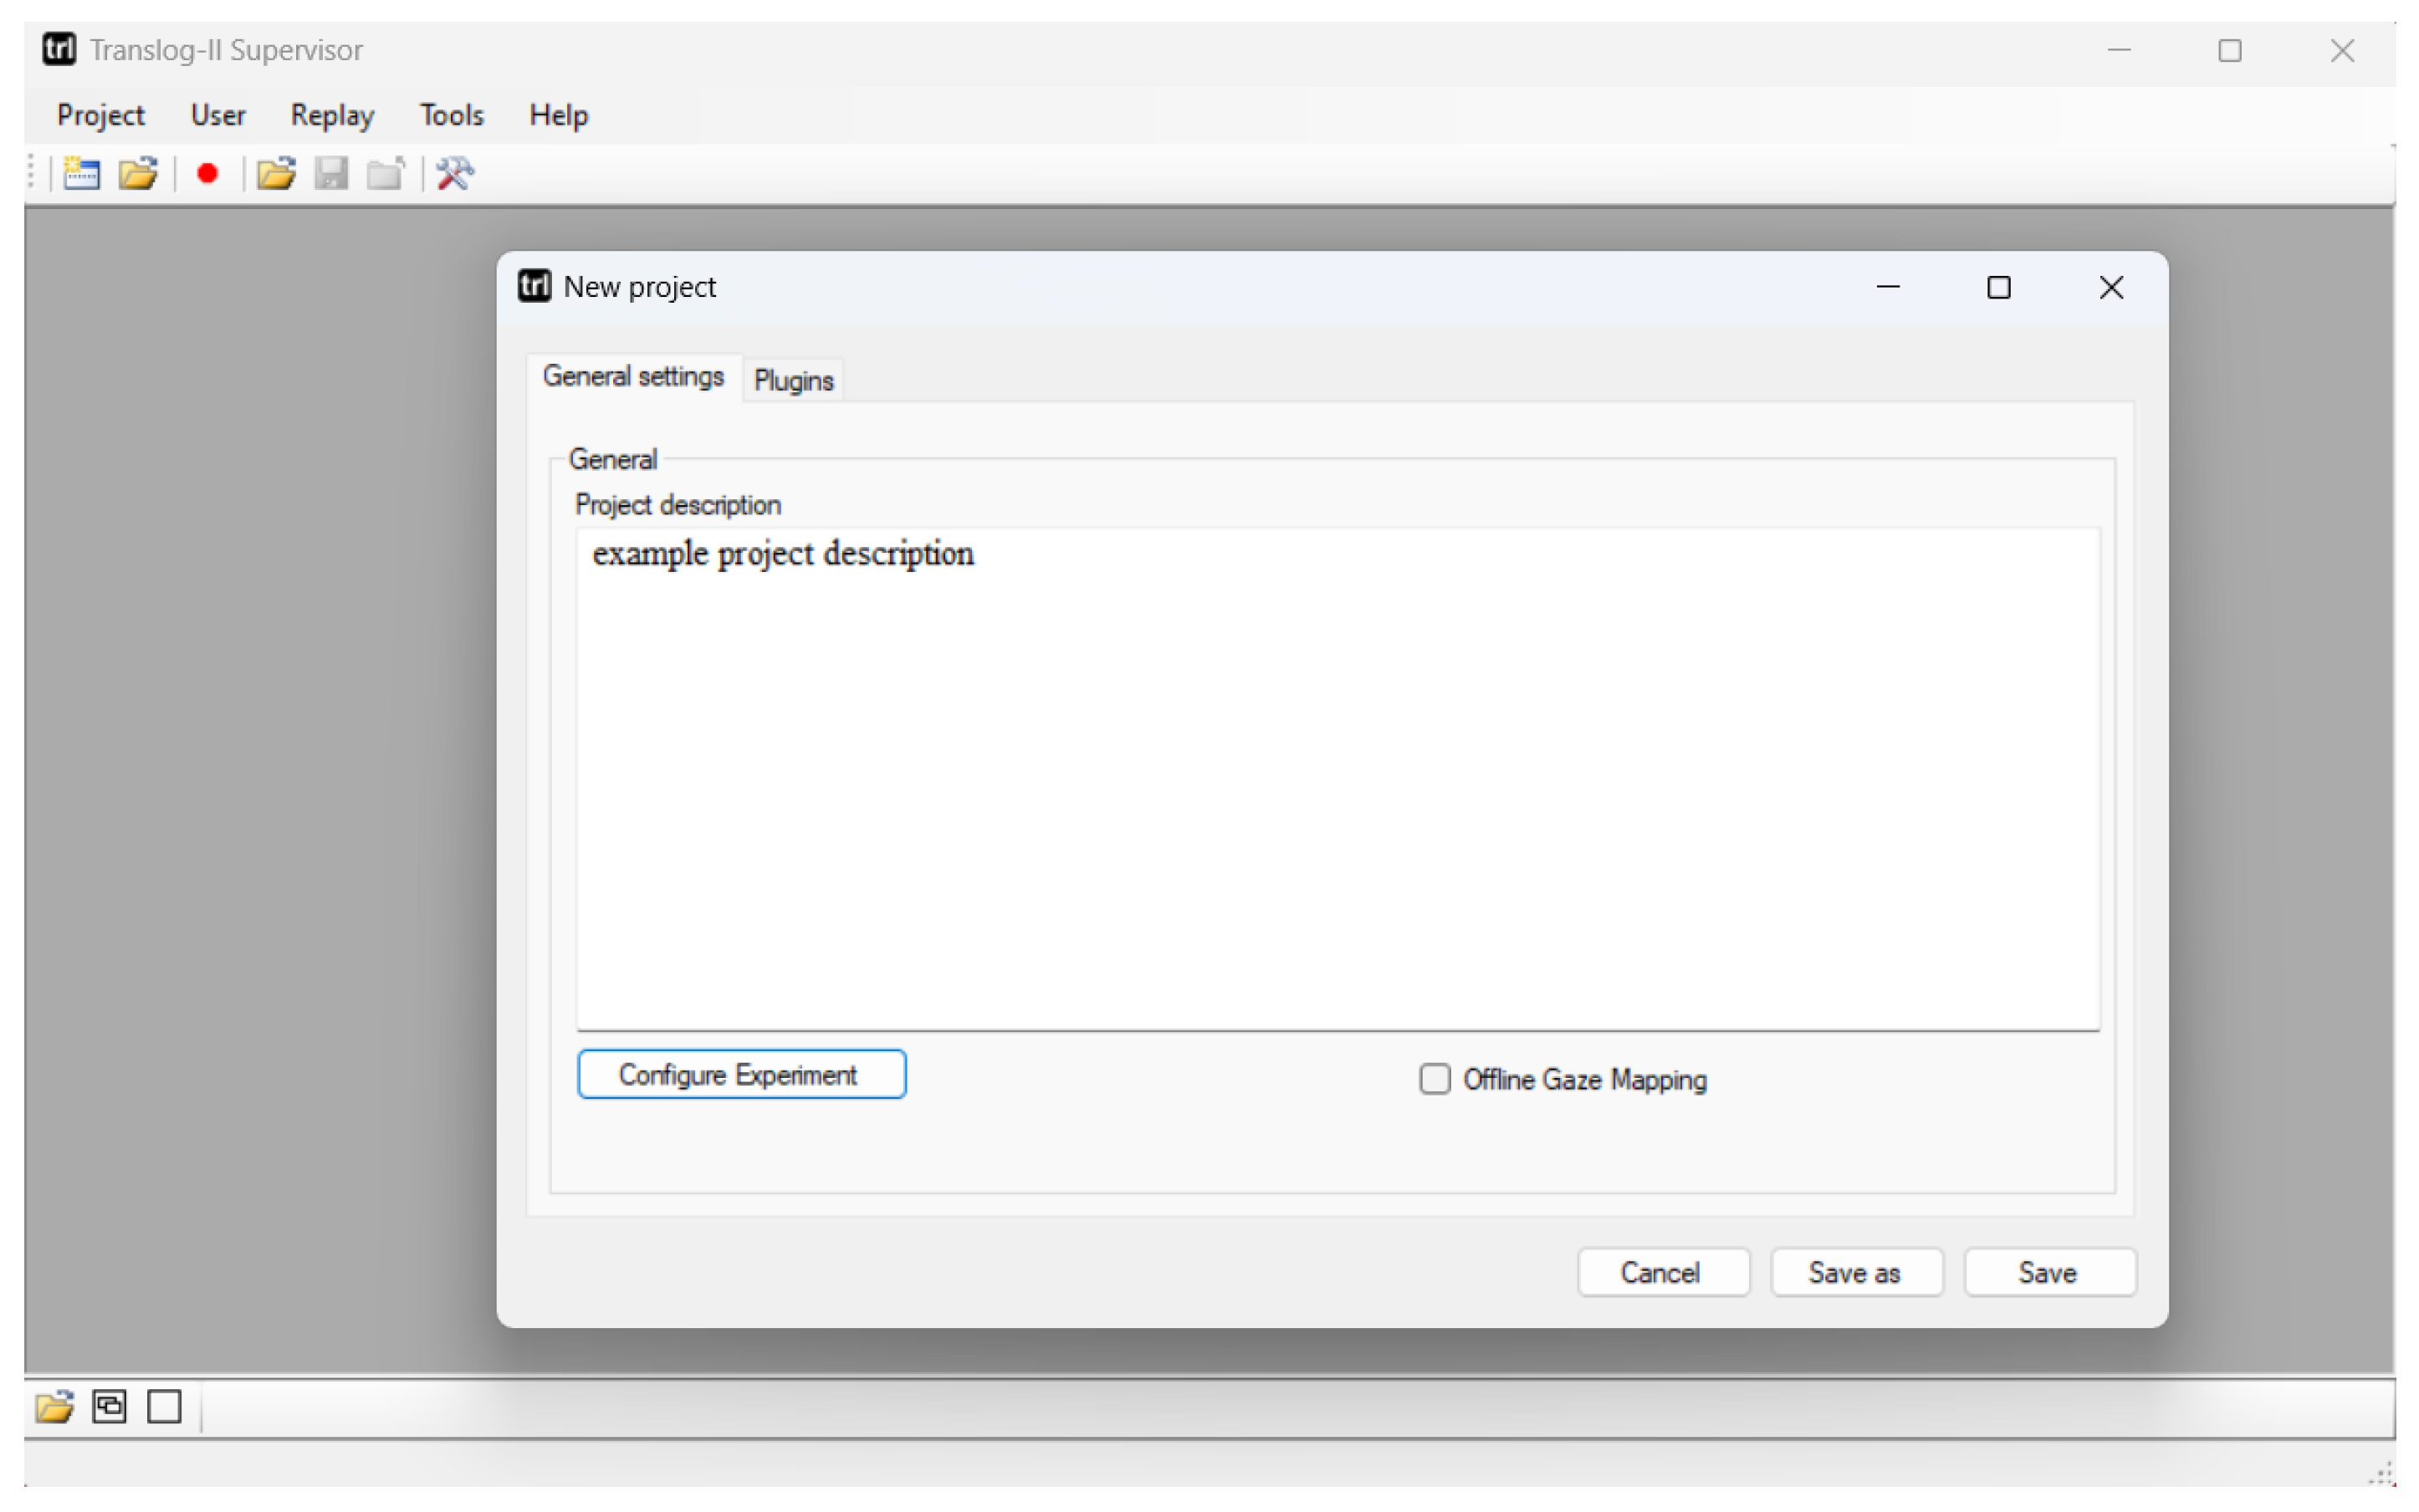
Once we click on “Create Project”, there will be a “New project” dialogue box popping out, as shown in Figure 3. We can click “Configure Experiment” on the lower left side of the dialogue box to design the experiment. For language pairs such as Chinese and Japanese, which require an input method editor (IME) like SoGou Pinyin for typing, it is necessary to check the “Offline Gaze Mapping” box on the lower right side of the dialogue box if an eye tracker is connected in your experiment. This step helps map the alphabetic letters typed on the keyboard to the corresponding Chinese characters shown on the screen during the translation session, as explained in Section 3.3.
Figure 3.
Creating a new project in Tranlog-II supervisor
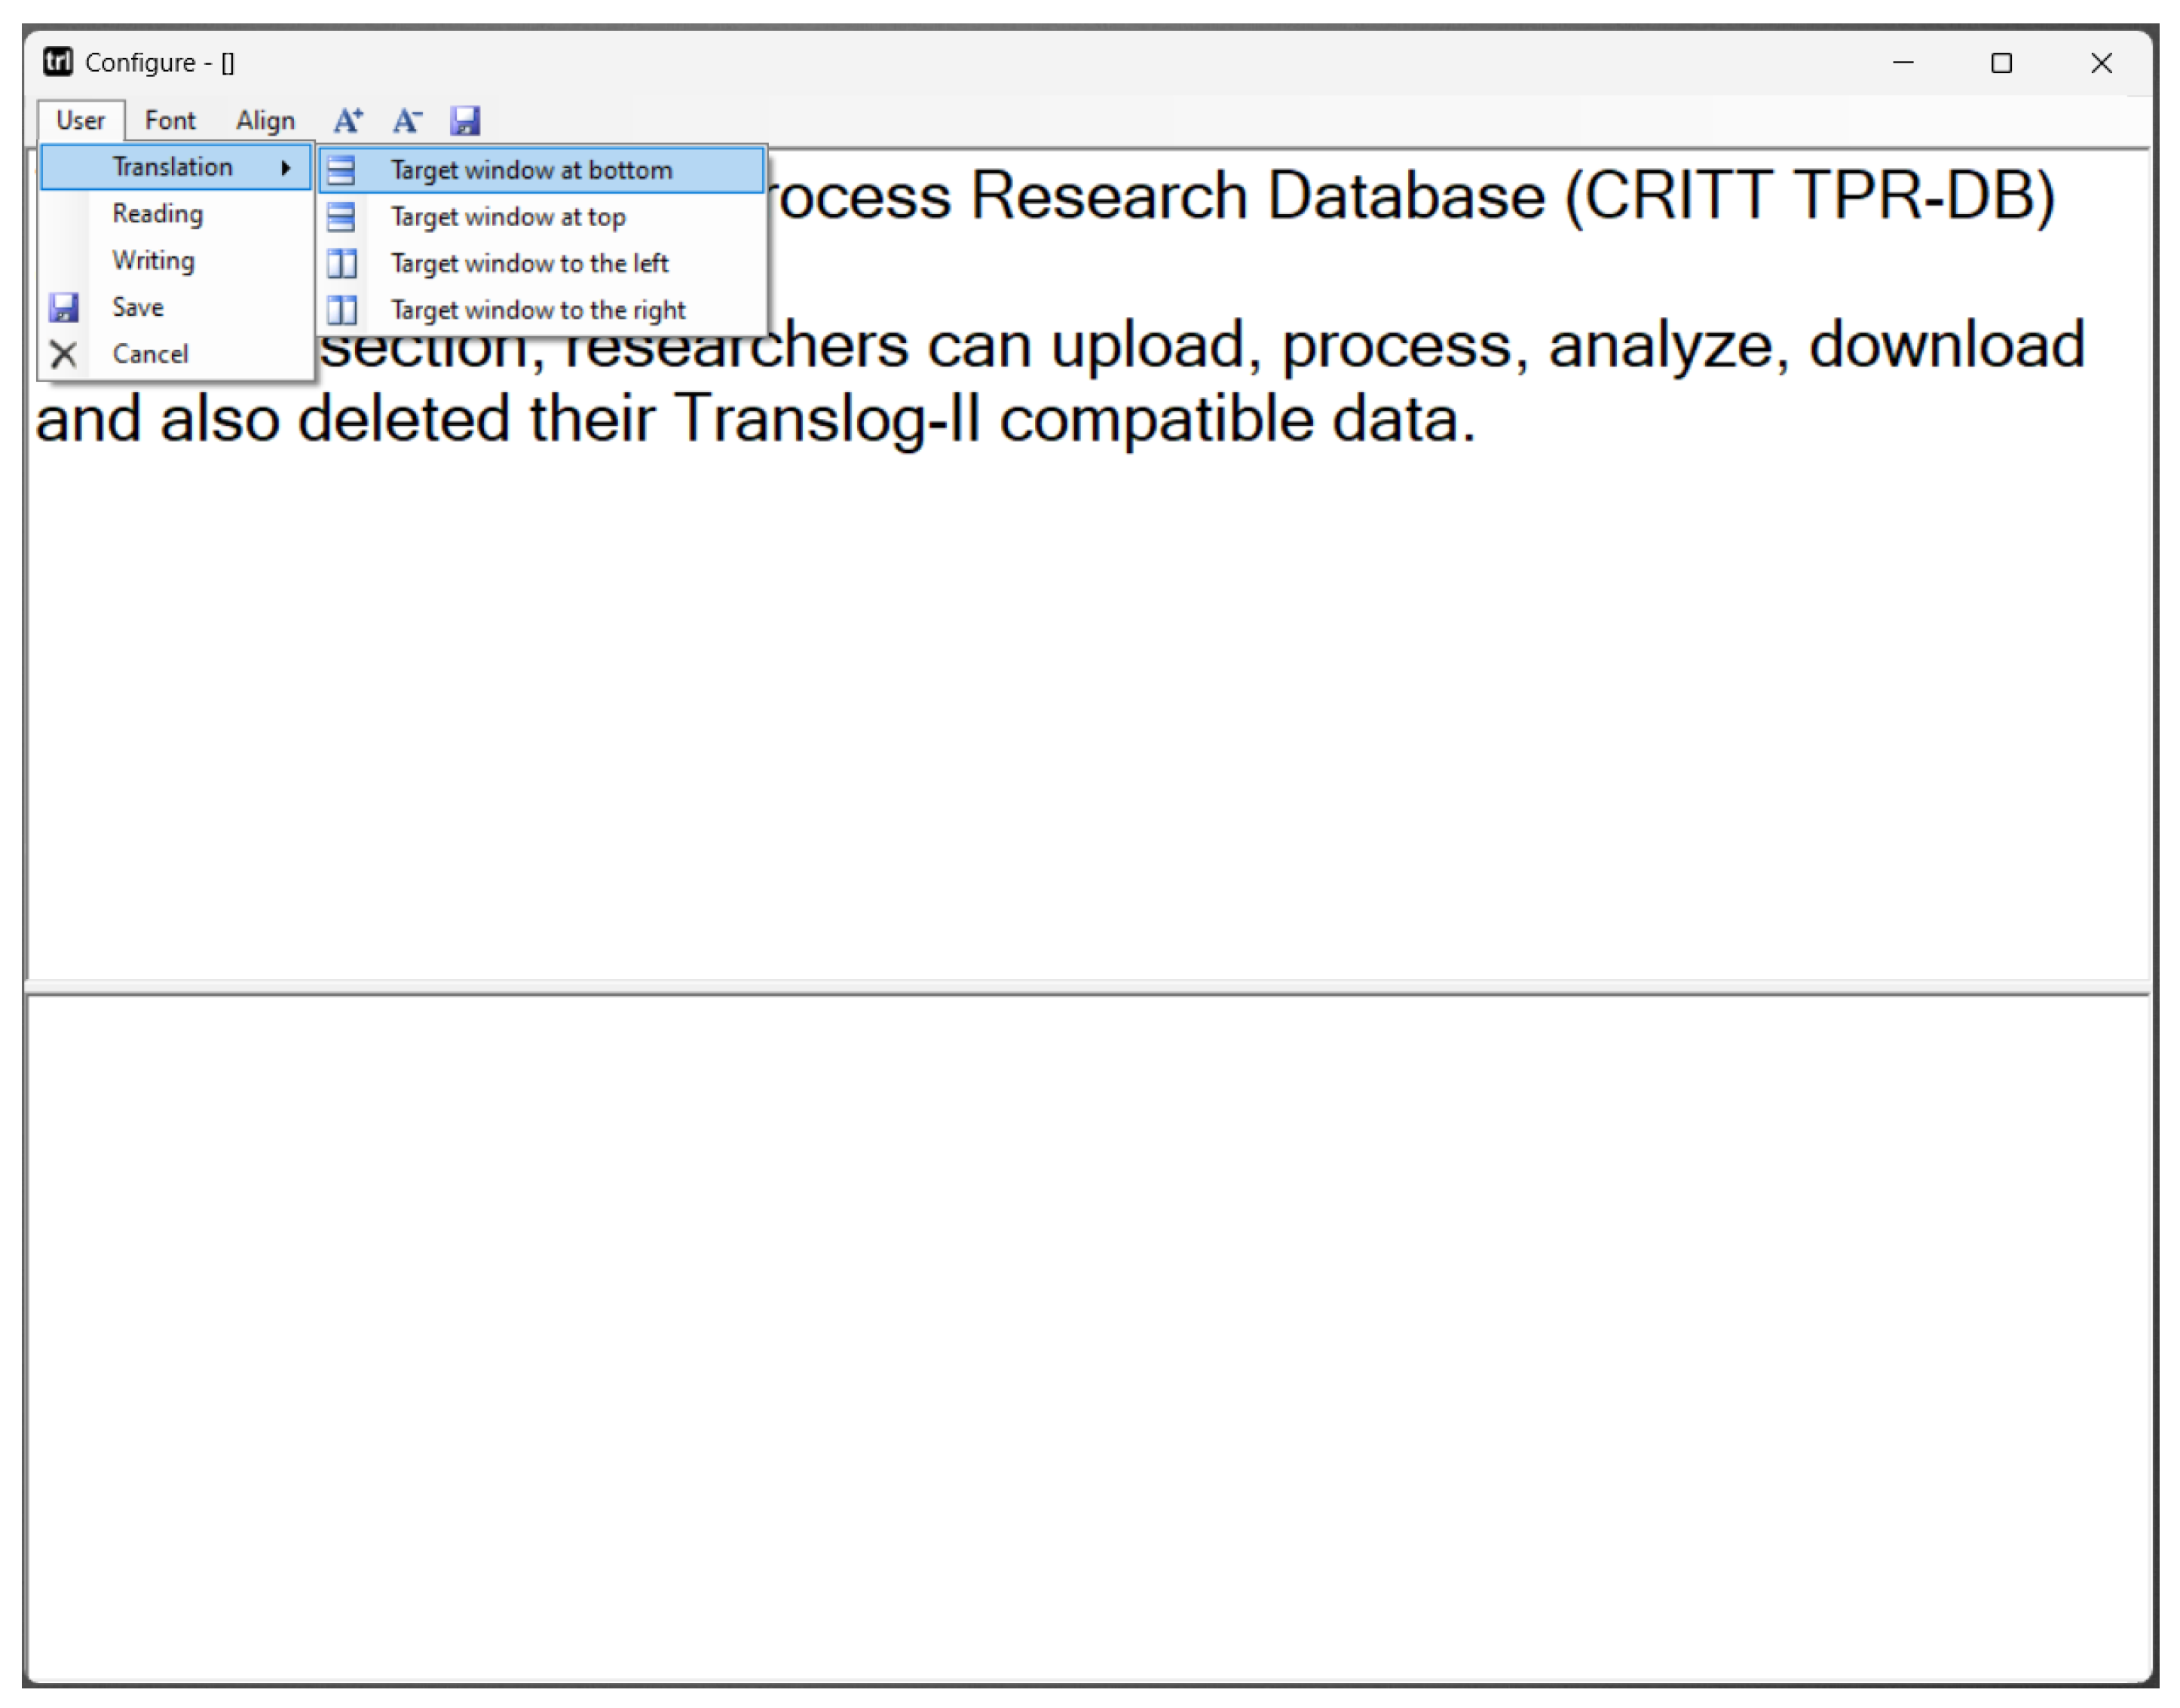
Once we hit the “Configure Experiment” button, we can enter the ST of the experiment and select the experiment type, adjust the window layout, font 9, and text alignment in the subsequent dialogue box, as shown in Figure 4. For demonstration purpose, we input two English sentences into the upper window, adjust the font and text alignment, select “Translation” and “Target window at bottom,” and leave the bottom window empty for the participant to enter their translation later in the experiment.
Figure 4.
Configuring experiment in Translog-II Supervisor
Alternatively, Translog-II can be used for post-editing experiments by entering the machine translation in the target window and recording the participant’s text modifications during post-editing. After configuring these settings, we can save the setup as a project file with the extension “.project” (e.g., Atranslogdemo.project). This project file can be used for all participants with the same ST in the experiment.
4.1.2. Open and run a keylogging experiment
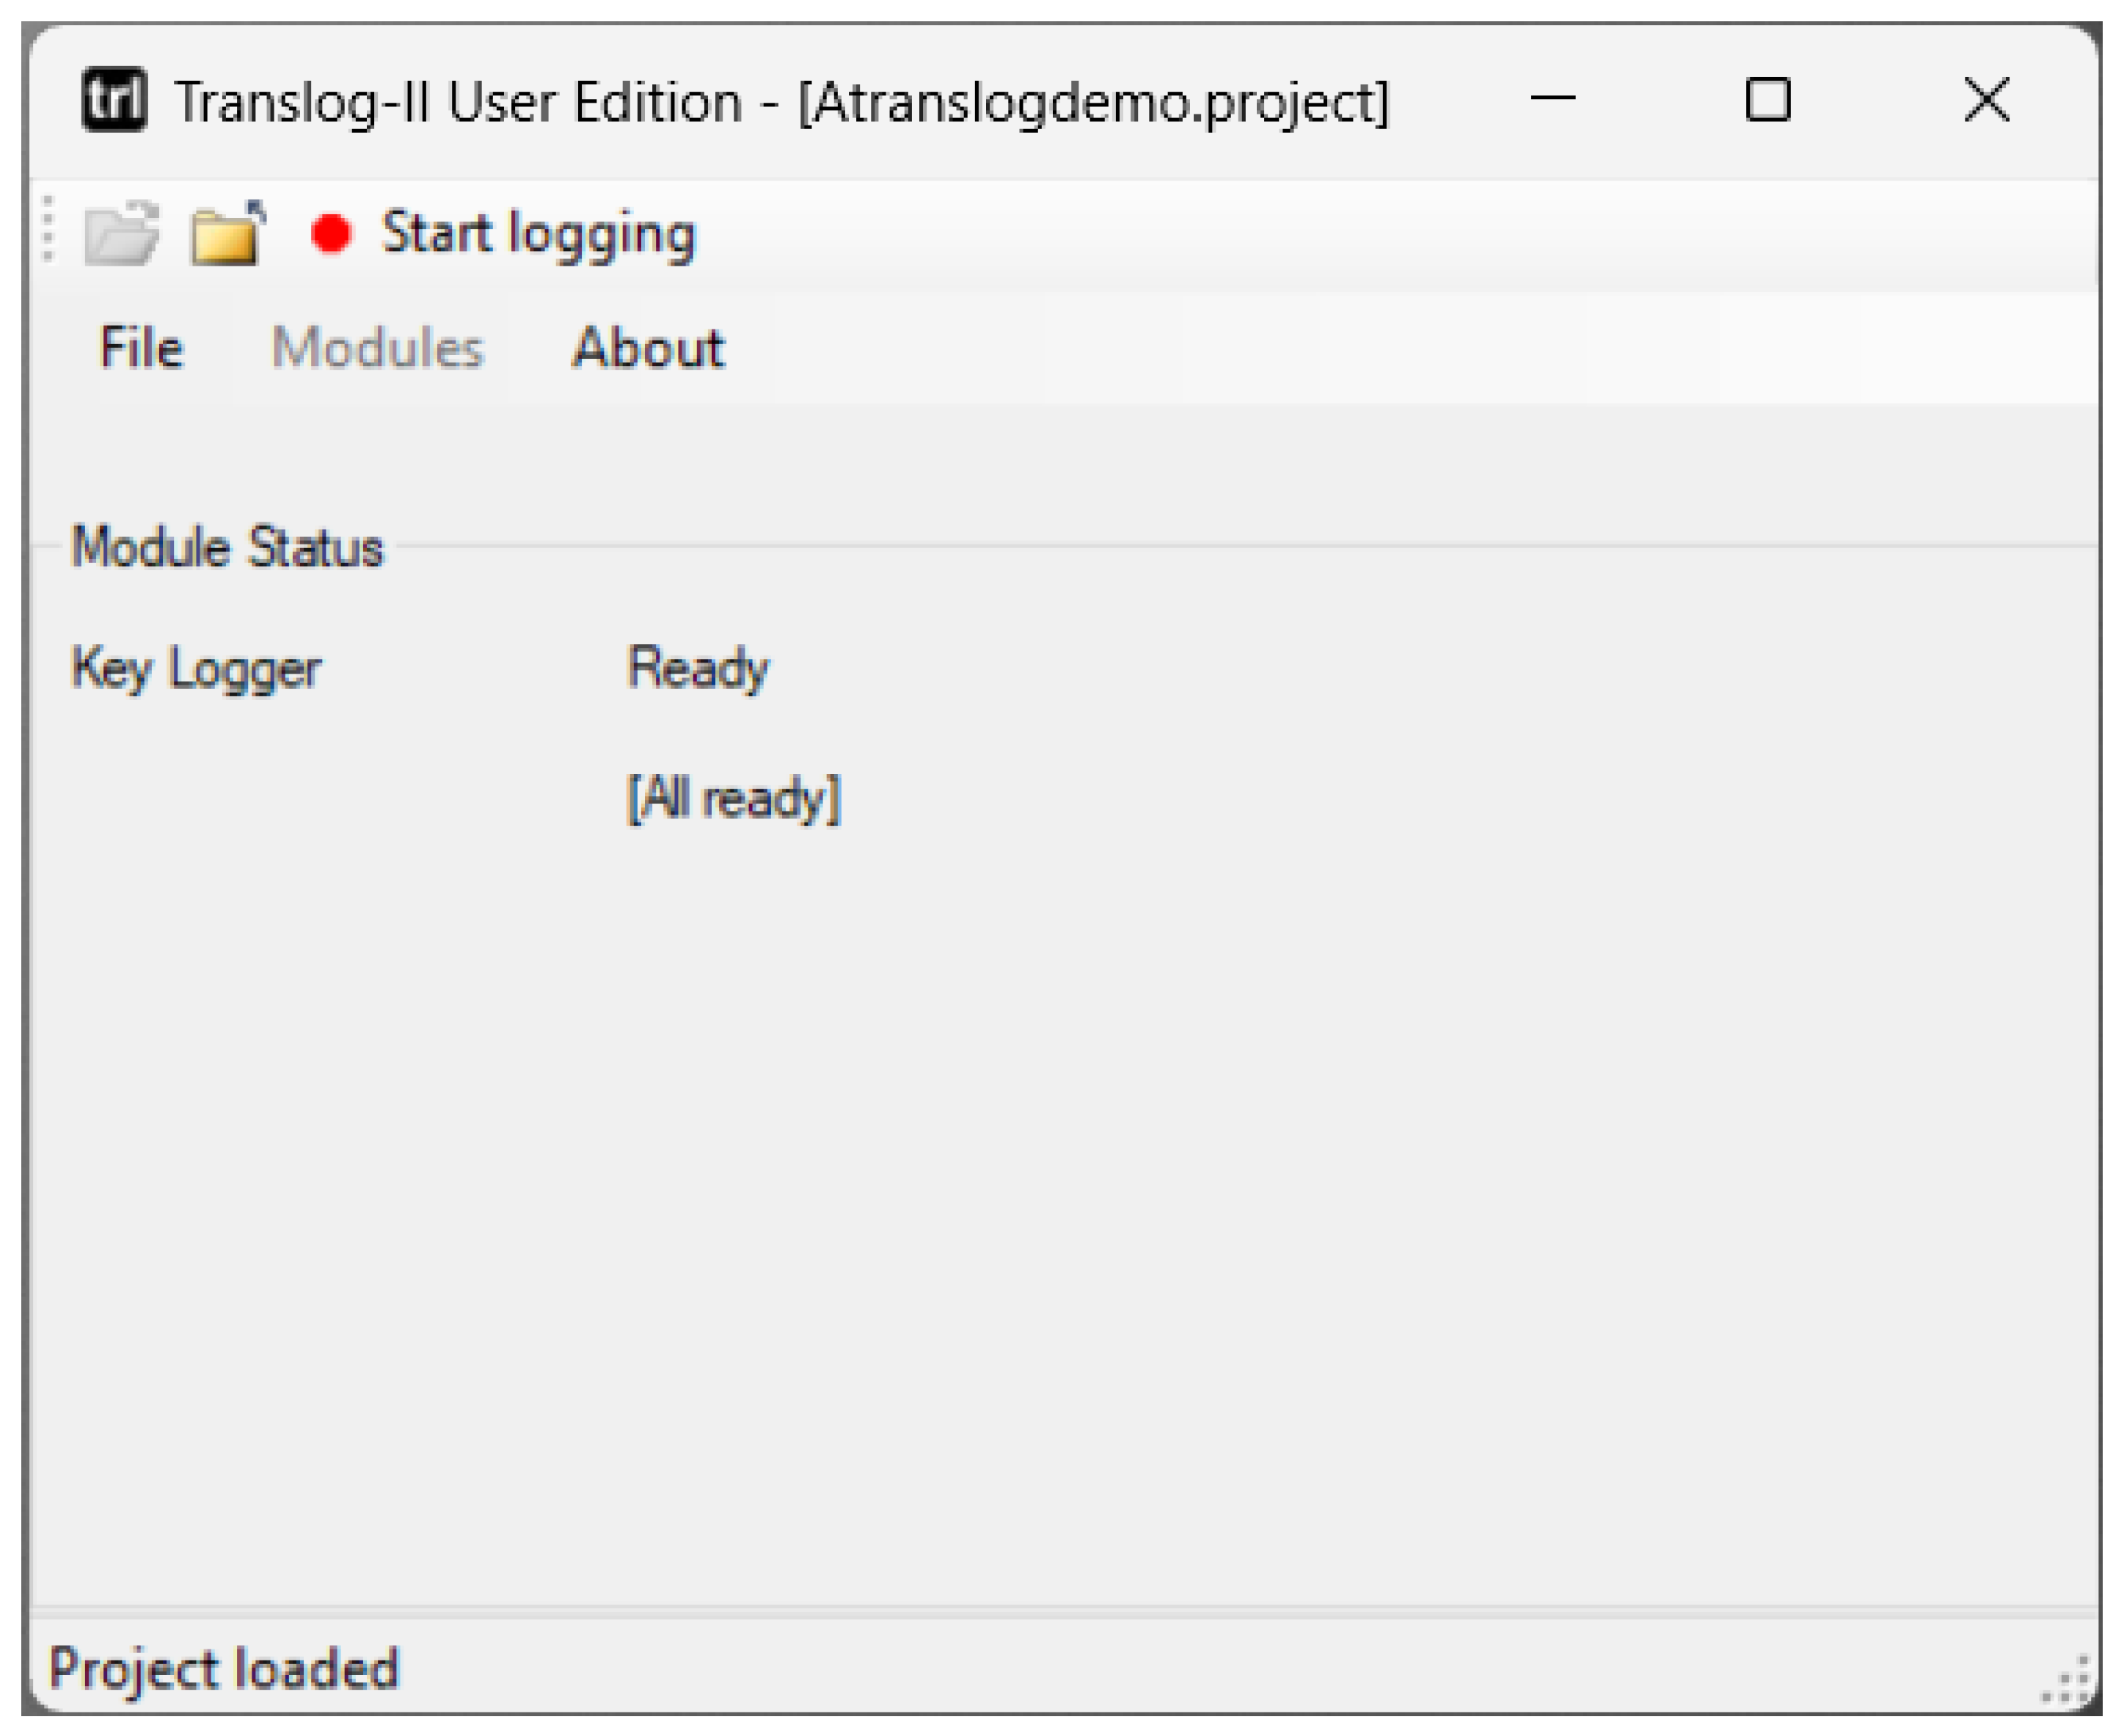
After creating the new project file, we can utilize Translog-II User to load the file and conduct a keylogging experiment. As shown in Figure 5, when we click the “Start logging” button in the Translog-II User interface, a screen with both the Source and target windows will open as configured previously in Section 4.1.1. Translog-II User displays the pre-defined texts in the source window and waits for the participant to type their translation into the target window. Since the size, window layout, font, and text alignment are defined in the project file, resizing the windows or changing the font in Translog-II User is not possible.
Figure 5.
Opening and running a keylogging experiment in Translog-II
When the participant completes the translation session, click “Stop logging” at the top left of the screen and save the logged file in XML format. To analyze the data later with the CRITT TPR-DB (Carl et al., 2016), an anonymized database of logged translation sessions that includes various translation modes, the file must be saved according to the TPR-DB naming convention. For example, we name this session as P01_T1, where P stands for Participant, 01 is the index number of participant, T indicates the task code of translation from scratch, and 1 represents the index number of text 10.
4.2. Data Processing
4.2.1. Replay log files
After we save the logged file (P01_T1.xml), we can replay the translation session in Translog-II Supervisor. We click “Replay” tab and open the XML file on the Translog-II Supervisor interface, then we can see a replay of the logged data showing how the typing proceeds in real-time and play buttons on the top of the interface can be used to accelerated or decelerated, to pause the replay, rewind or forward it, etc.
Figure 6 shows a snapshot of a replay session, illustrating typing activities on the target window (bottom) in relation to the source window (top) at the timestamp of 61109ms. At this moment, the participant has just finished typing the translation of the last word in the first sentence in the target window (“CRITTF 翻译过程研究数据库(CRITT TPR-DB) 包括两部分”), marking 51% of the total production time for the session.
Figure 6.
Replaying keystroke logging data in Translog-II
4.2.2. Upload to the TPR-DB
The above replay function can give us preliminary analysis of the keystroking data collected by Translog-II, for instance, how typing proceeds with time in the translation session. If we want to conduct more sophisticated analysis of the data, we can upload the keylogging data (the XML file P01_T01.xml) gathered by Translog-II to the CRITT TPR-DB management tool 11. The data upload procedures for the TPR-DB management tool involves several steps following account login.
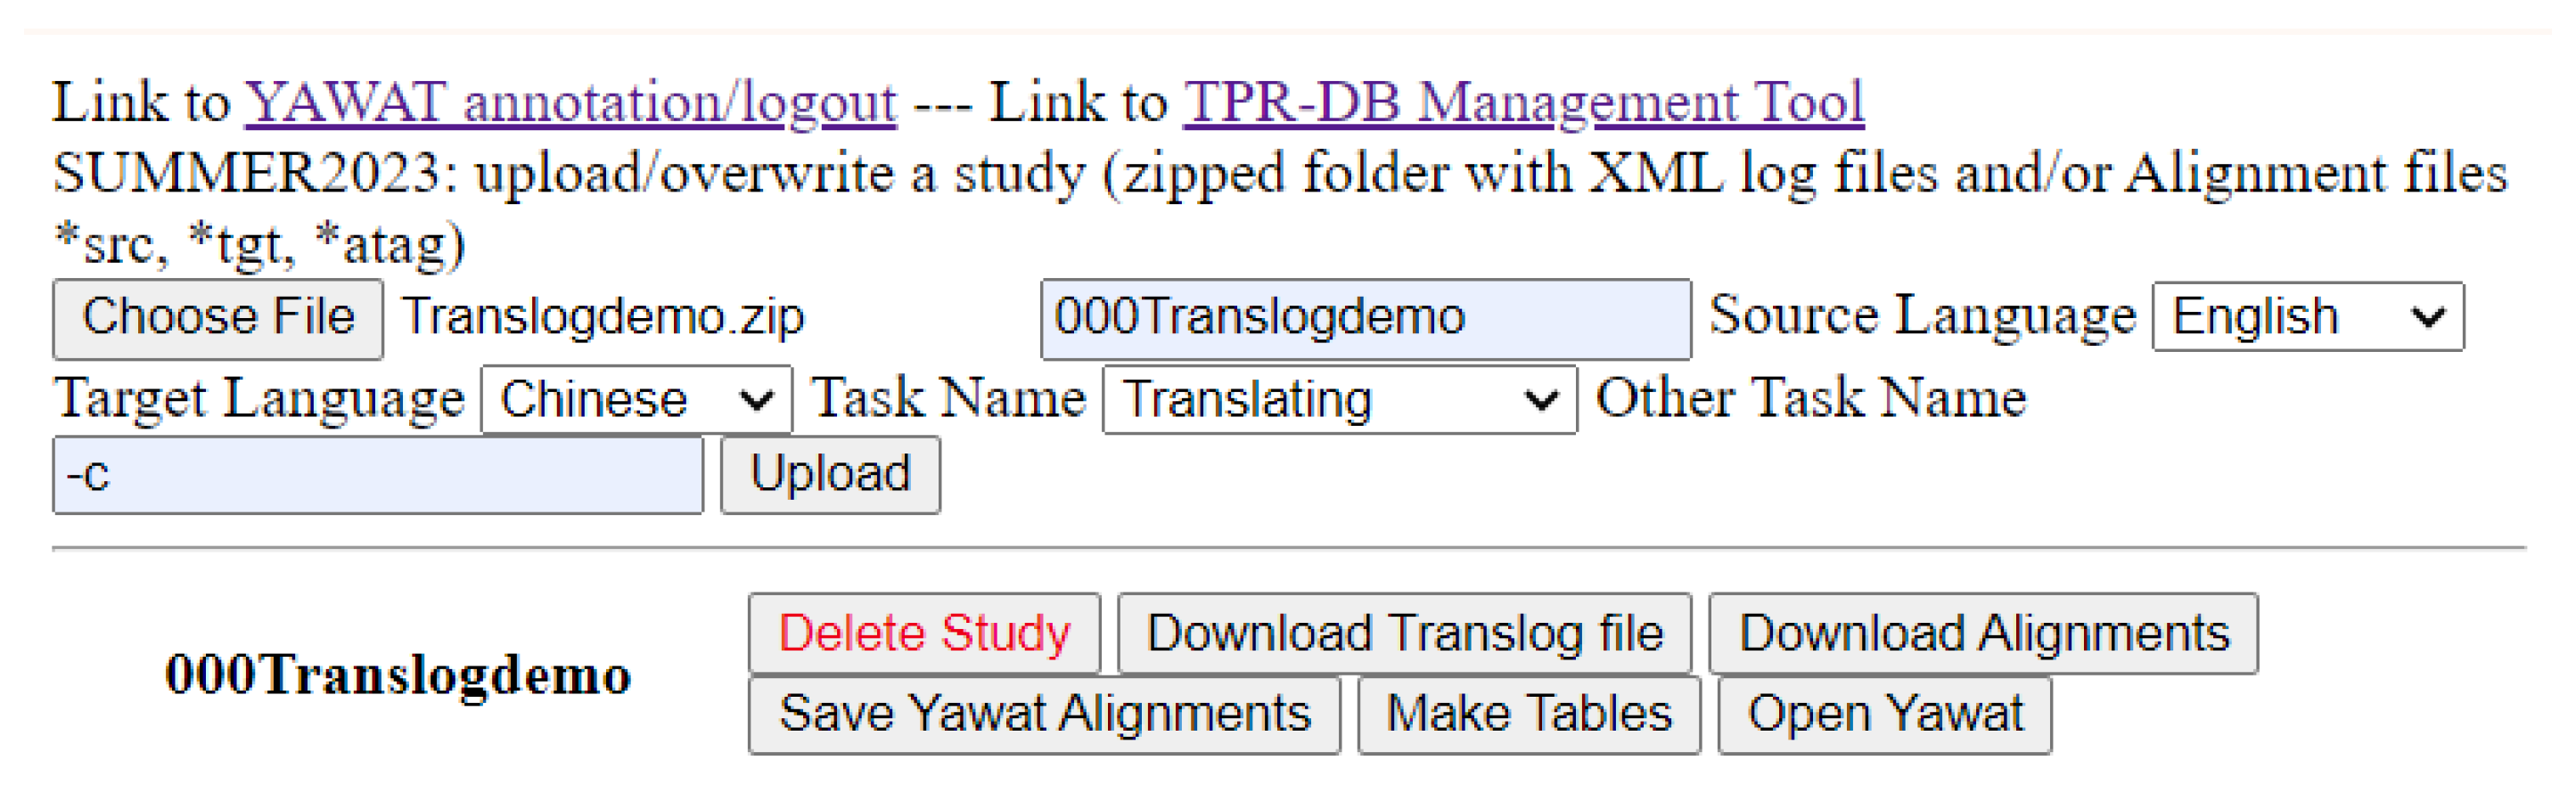
We first compress the XML file (P01_T1.xml) generated from the Translog-II experiment into a zip format (P01_T1.zip). We then use the “Choose File” function located in the upper left corner of the browser interface and select this zipped file. Here we use the test account SUMMER2023 for the demonstration purpose. As the upper part of Figure 7 shows, the interface requires input of various study parameters. These include a descriptive study name (e.g., “000Translogdemo”), the source and target languages for the translation task (such as English and Chinese), and the mode of the translation task (e.g., “Translating”) selected from a drop-down menu. An additional parameter, “-c”, should be entered in the second field. Upon completion of these inputs, we initiate the upload process via a designated button in the upper right corner of the interface. As shown in the lower part of Figure 7, once the system completes uploading the data, the study name appears on the web page along with a set of functional buttons, enabling further data processing and analysis.
Figure 7.
Uploading the Translog file to the CRITT TPR-DB
4.2.3. Word-alignment and manual annotation
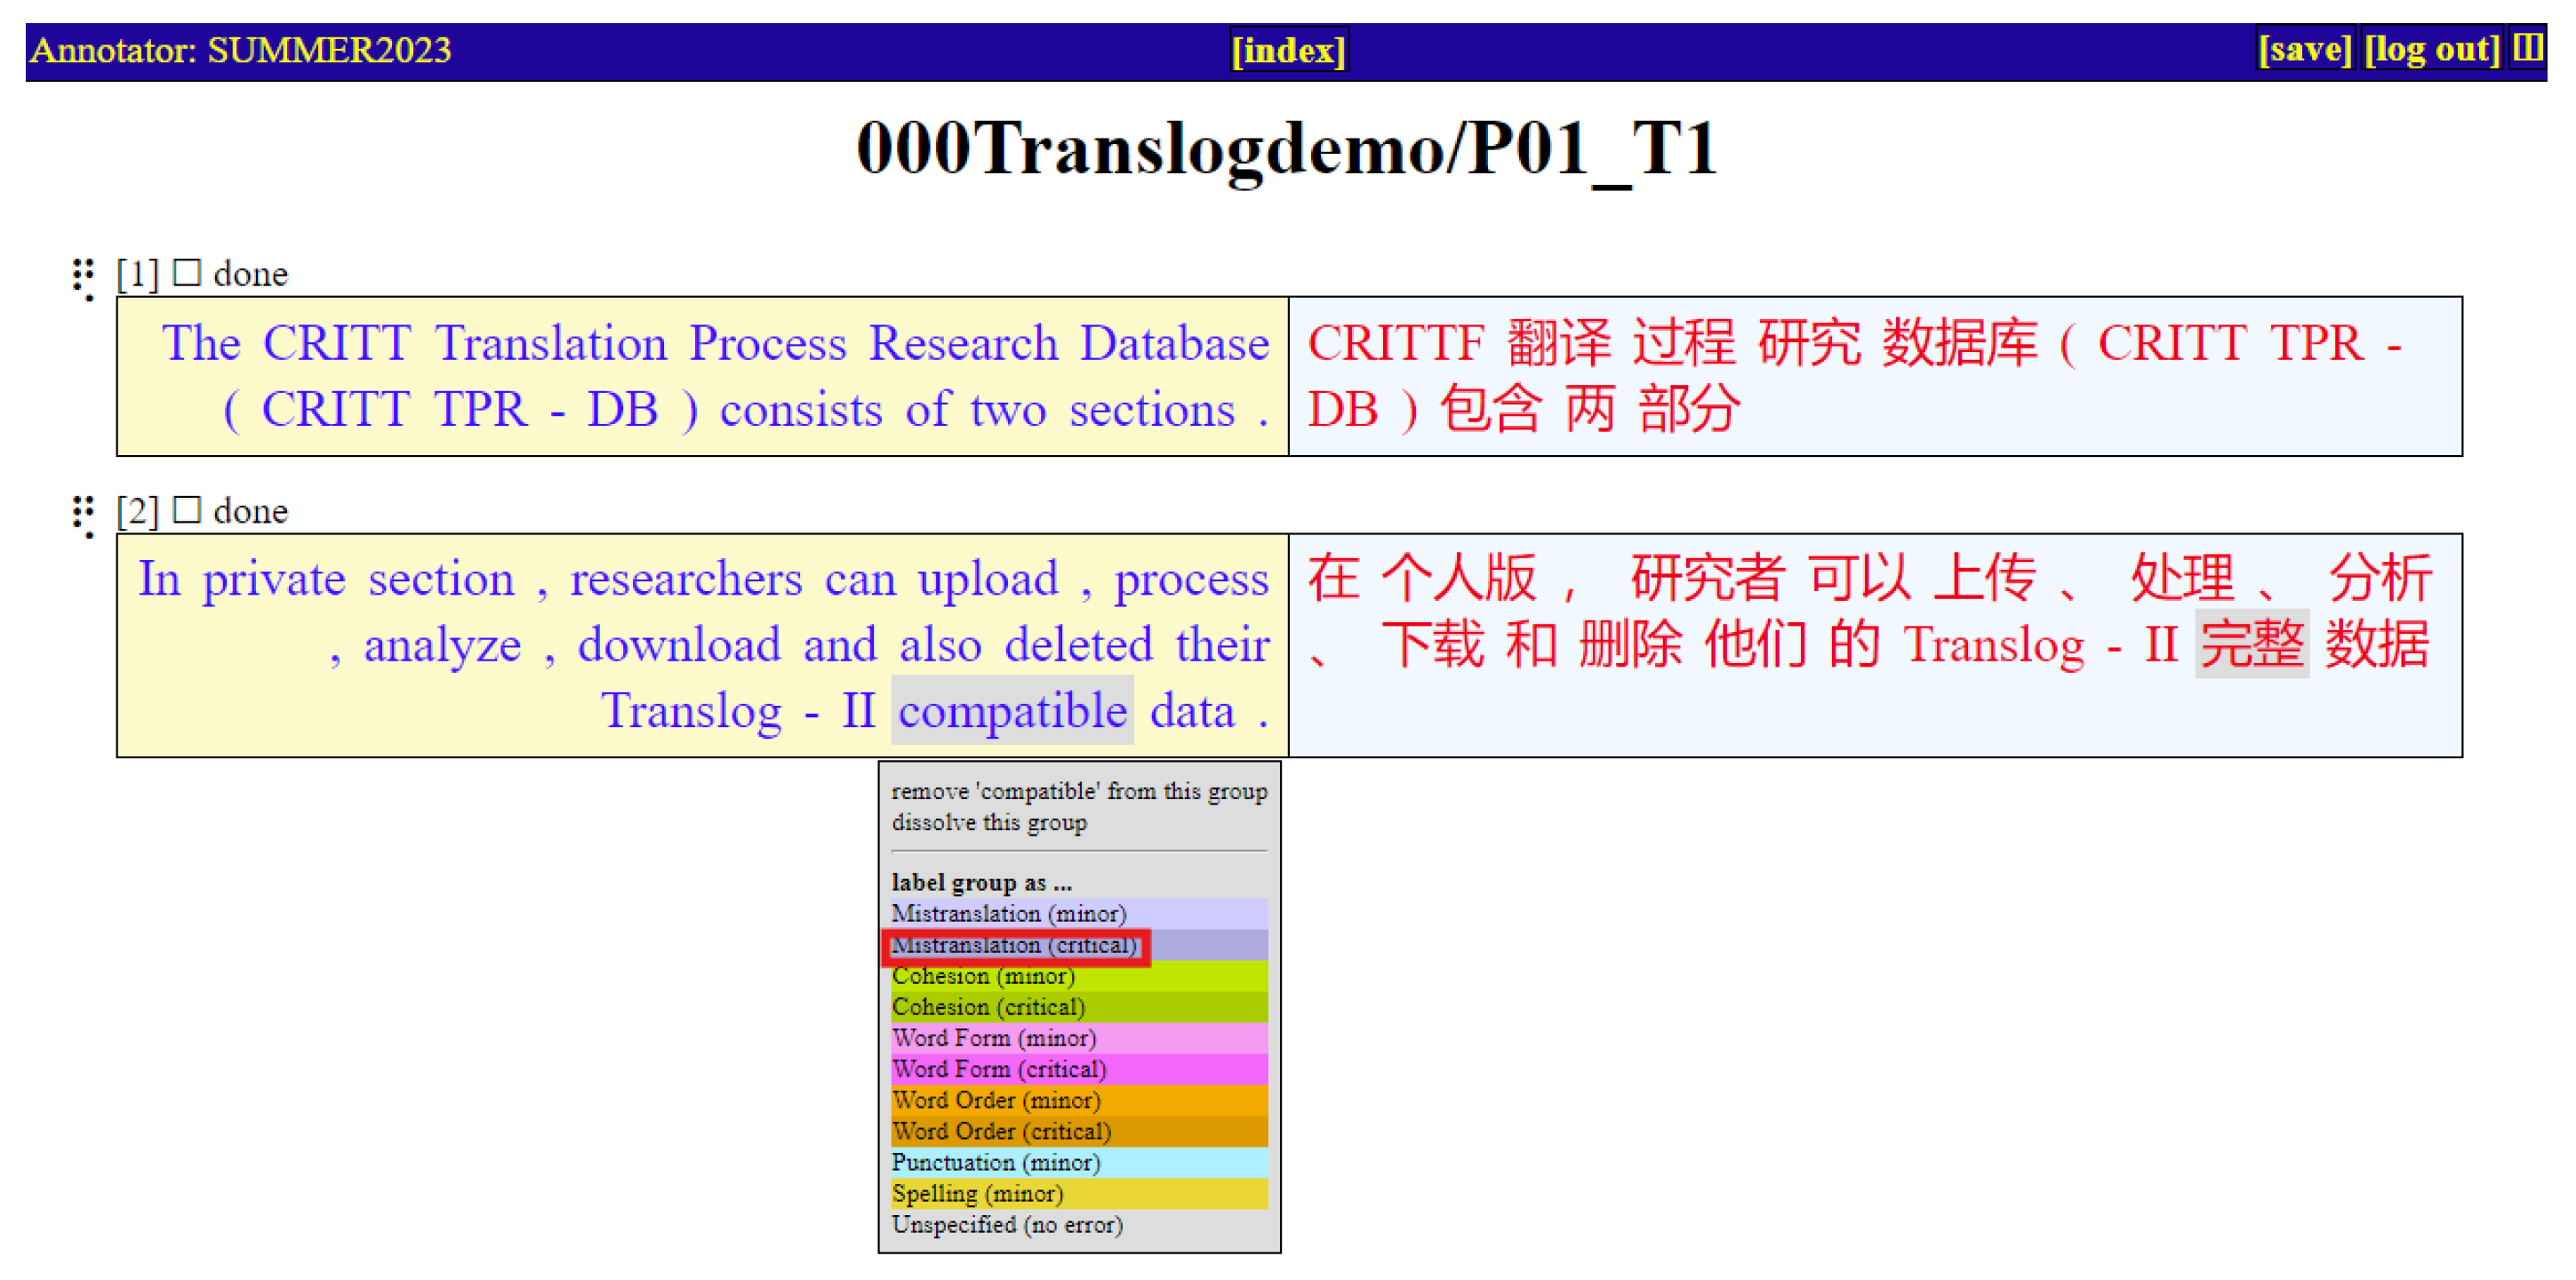
As discussed in Section 3.1, tokenization and keystroke mappings are already automated when the data is successfully uploaded to the TPR-DB. If we want to automatize bilingual word alignment, we can enter “-c SI” in the second field before we hit “upload”. To manually perform word alignment, we begin by clicking the last button next to the study name “000Translogdemo” in Figure 7, labeled “Open Yawat.” This action will open a new webpage displaying the ST and TT from the translation session, already aligned at segment level, as illustrated in Figure 8. The alignment (Yawat) interface (Germann, 2008) can be set to either vertical (as shown in Figure 8) or horizontal (as shown in Figure 9), based on the researcher’s preference, by clicking the small rectangular icon in the rightmost corner of the webpage.
Figure 8.
Yawat interface of TPR-DB
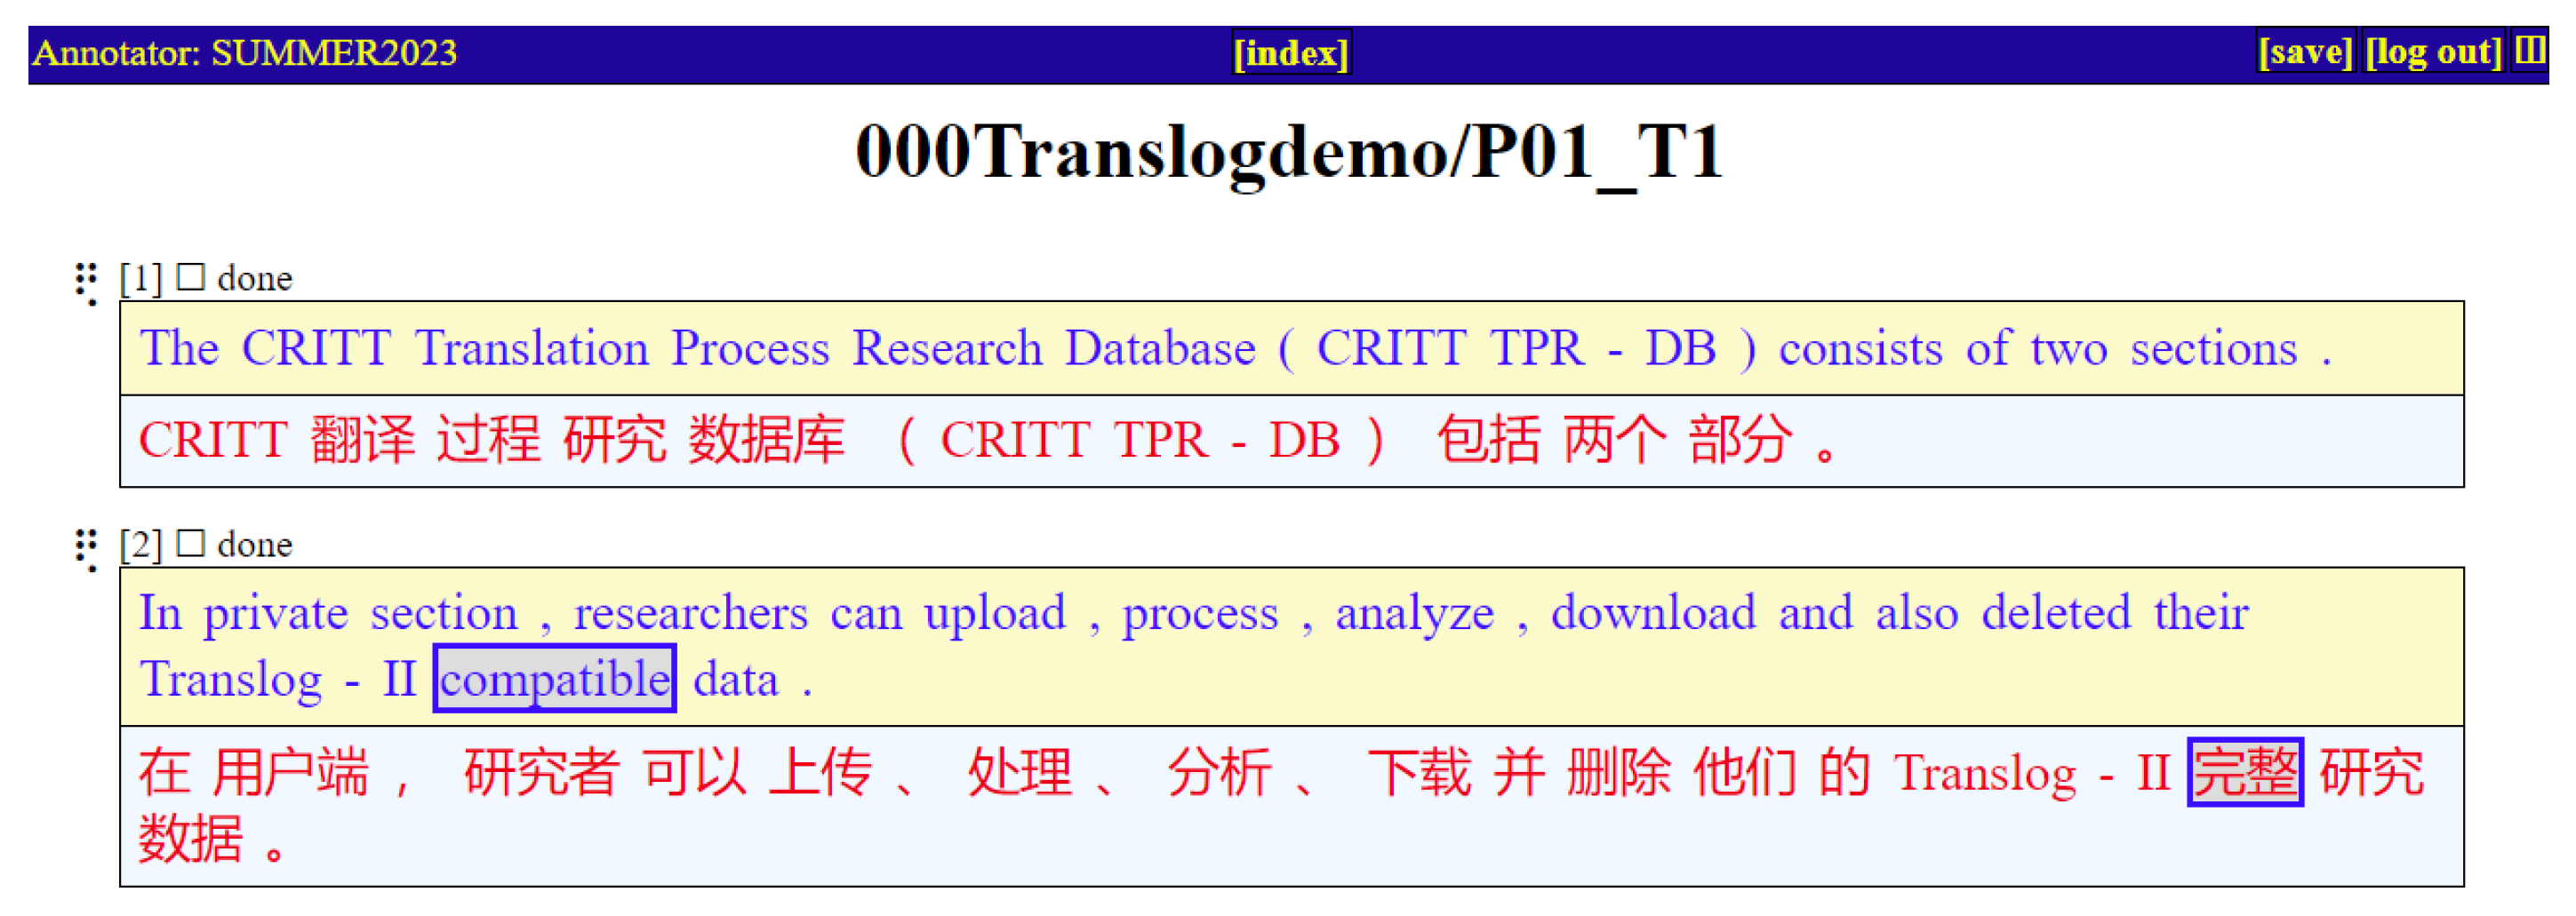
To establish connections between the keylogging data of target words and their corresponding source words during the translation process, it is recommended to align the smallest equivalent meaning unit at the word level. For example, in Figure 8, we align the English source word “compatible” with the Chinese target word “完整” by left-clicking on the words (which will be highlighted in pink), and then confirming the alignment by right-clicking (which will turn the word pair grey). By repeating this procedure thoroughly for all alignment groups in the session, you can then save the word alignment by checking the “done” box at the top of each segment or by clicking “save” at the top right of the webpage.
Following the completion of word alignment, we are able to conduct detailed analysis of how each source word is processed and rendered in the target language. Additionally, we have the option to perform manual error annotation in the TPR-DB. This annotation can be based on established translation quality assessment frameworks such as Multidimensional Quality Metrics (MQM) (Lommel et al., 2014), or the American Translators Association (ATA) framework (Koby, 2015). Alternatively, we can develop and apply a customized error taxonomy tailored to our specific research needs. By incorporating this error annotation, we create a valuable link between the observable indicators of the translation process and the resulting translation quality. This connection enables us to explore potential correlations between specific aspects of the translation process and the quality of the final output, offering insights into the relationship between translator behavior and translation performance.
As illustrated in Figure 9, we can right-click on the word pair (alignment group) we just aligned and select a predefined error type from the drop-down menu to assign to the translation. For example, we might classify the translation of “compatible” into “完整” as a Mistranslation (critical) error, as shown in Figure 9. Once all errors have been annotated, we can click “save” in the top right corner of the webpage. Then, click the “Save Yawat Alignment” button next to the study name on the TPR-DB management tool in Figure 7. This annotation information will then become one of the features in the tables generated by the TPR-DB.
Figure 9.
Error annotation in the TPR-DB
4.3. Data Analysis
This section focuses on methods for analyzing and visualizing TPR-DB data. There are three main approaches available to researchers. First, tables can be downloaded from the TPR-DB management tool for local analysis on one’s own computer. Second, computational analysis can be performed using R or Python scripts via the CRITT Jupyter account. Third, translation progression graphs can be visualized online through CRITT’s Shiny R interface.
4.3.1. TPR-DB tables
Clicking the “Make Tables” button next to the study name in the TPR-DB management tool (as shown in Figure 7) will automatically generate 11 tables, which include various translation process features (Carl et al., 2016). These tables comprise the ST table (source text features at the word level), TT table (target text features at the word level), SG table (features of both source and target texts at the segment level), among others. We can then click “Download Tables” to download these Tables to our local computer12. Based on these features, we can conduct more sophisticated data analysis using python and R scripts.
Although this is a very small session with only two segments, it provides a clear example of the data structure of the TPR-DB tables. All the TPR-DB tables share the columns such as “Study” (i.e., the name of the study “000Translogdemo”), “Session” (i.e., the name of the session “P01_T1”), “SL” (i.e., the ST language, English), “TL” (i.e., the TT language Chinese), “Task” (i.e., the experimental translation task, translating), “Text” (i.e., the index number of the text, Text 1), and “Part” (i.e., the index number of the participant, P01). This information matches the parameters we provided when uploading the data to the TPR-DB management tool, as described in Section 4.2.2. Because the TPR-DB tables share a similar structure, we can merge them, perform calculations across tables with different features within the same dataset, or compare them to other datasets in the TPR-DB, depending on our research goals.
Other features are post-processed by the TPR-DB after the word alignment of the session is completed, whether automatically or manually. For instance, a portion of the ST table’s features (P01_T1.st) is displayed in Figure 10 below. Each row in the table corresponds to a token in the ST, presented in the same order as they appear in the original text. As shown, there are 40 words in the ST. We can view the alignment groups by checking the “SGroup” and “TGroup” columns. For example, in row 38, the word “compatible” is aligned with “完整”. The “Yawat” column provides information of the manual error annotation performed in Section 4.2.3; for instance, in row 38, “compatible” is marked with a critical mistranslation error, labeled as “mistrc”.
Figure 10.
Part of the features of the ST table generated by the TPR-DB (a)
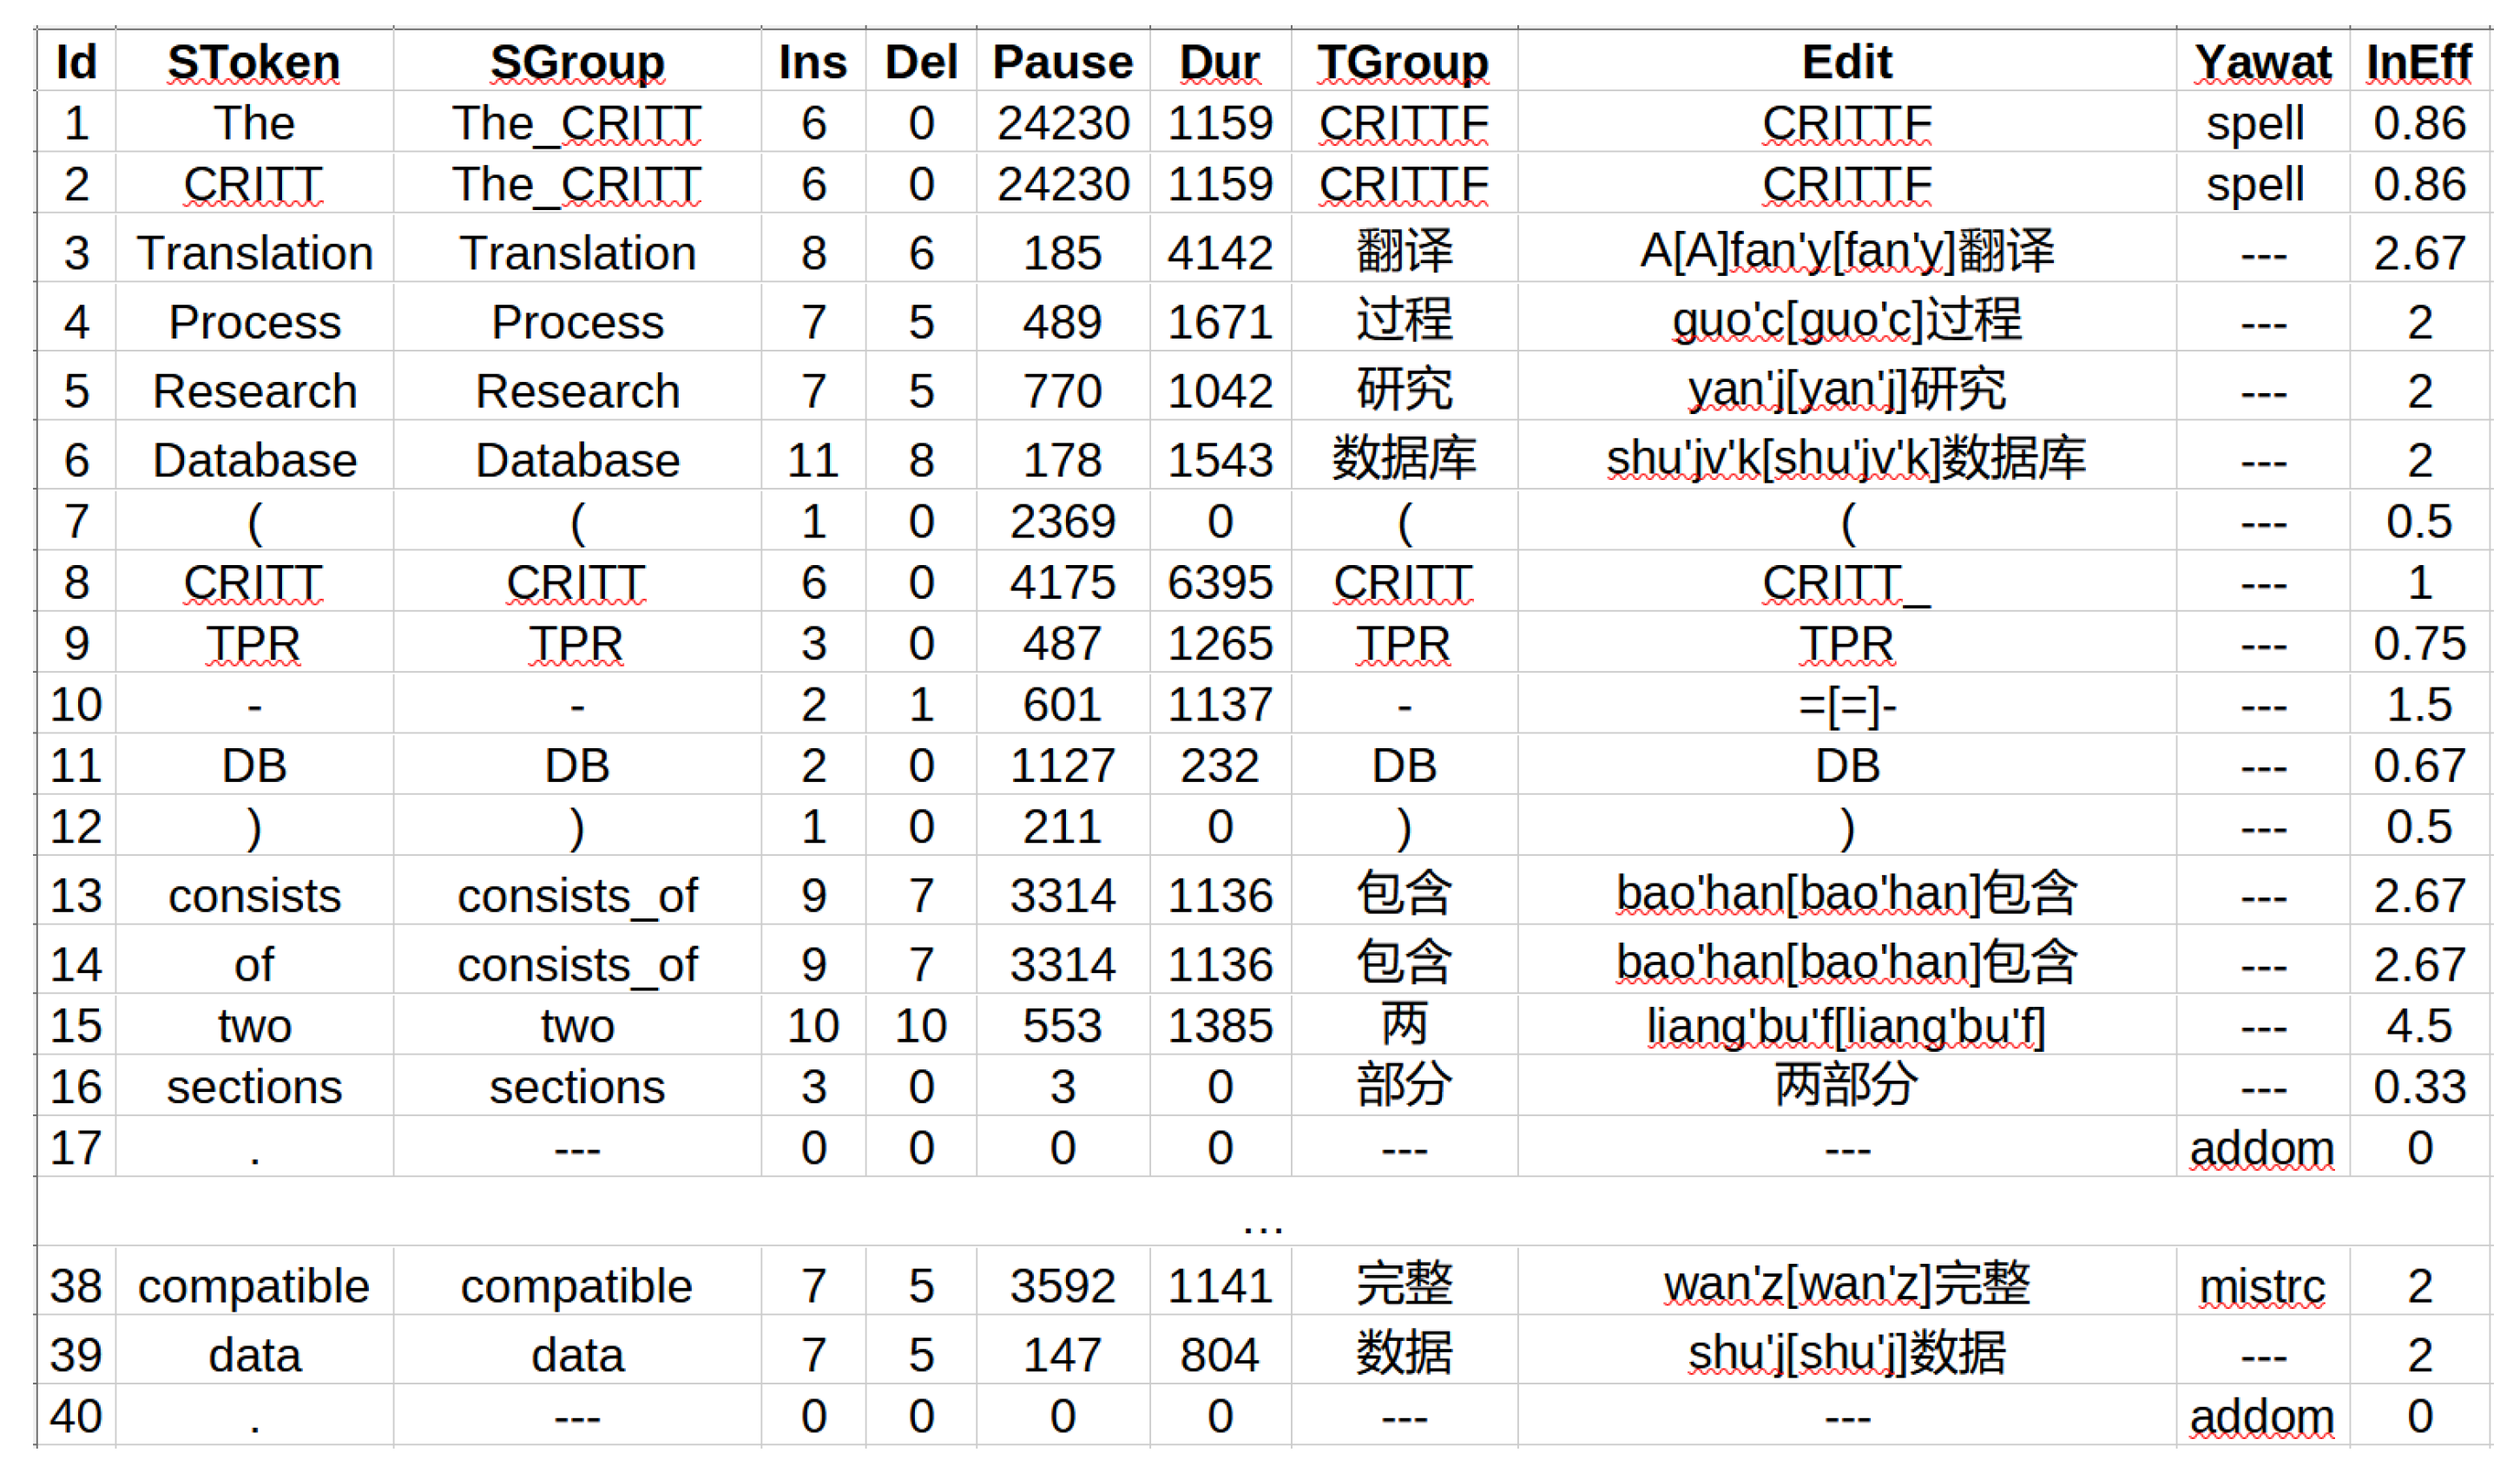
We can also derive some basic interpretations of the translation process during the session based on the data presented in Figure 10. The first three rows of the keylogging data illustrate how the participant translated the initial three words of the ST, “The CRITT Translation,” into the TT (“CRITTF 翻译”). First, the participant typed “CRITTF” in 1159ms, with pauses totaling 24230ms. This involved 6 keystrokes, all insertions and no deletions. Then, to produce the Chinese target word “翻译”, the participant entered “A[A]fan’y[fan’y]翻译” in 4142ms, with pauses totaling 185ms. This involved 14 keystrokes: 8 insertions and 6 deletions. The keystrokes within square brackets indicate a deletion. For example, the participant entered ‘A’ and then deleted it. However, the keystrokes in the second set of square brackets, [fan’y], were automatically “deleted” during the conversion process of the IME.
By examining other columns of the data as shown in Figure 11 (rows 1-3 of the ST table), we can better understand why the participant made the “CRITTF” typo, which is marked with a spelling error, labeled as “spell” in the “Yawat” column. The process unfolded as follows: At timestamp 19323ms (Time1), and this is also the first pause (Pause1) before typing the first keystroke for translating this source word, the participant typed “CRITT” (Edit1), taking 1159ms (Dur1). After a 4907ms pause (Pause2), at 43388ms (Time2), the participant typed “F” (Edit2). Following a brief 185ms pause (Pause1 in row 3), at timestamp 43573ms (Time1 in row 3), the participant spent 4142ms (Dur1 in row 3) typing “Afan’y翻译” (Edit1). This involved typing a capitalized A, deleting it, typing “fan’y” in lowercase, and then converting it to Chinese characters “翻译” by the IME. This sequence suggests that the additional “F” typed after “CRITT” was initially intended for translating the following source word, “Translation”. The error likely occurred due to confusion while switching between capitalization and lowercase on the keyboard (FA-fa). The participant forgot to delete the “F”, resulting in the misspelling of “CRITT” in the target text.
Figure 11.
Part of the features of the ST table generated by the TPR-DB (b)

4.3.2. Data analysis on Jupyter notebook
We can access the TPR tables and analyze the data via the Jupyter notebook using the private account or the test account “summer_gst” offered by CRITT (see how to register the test account in Section 3.1). In this section, we will use the CRITT Jupyter account to demonstrate some basic analyses based on the tables generated in Section 4.2.
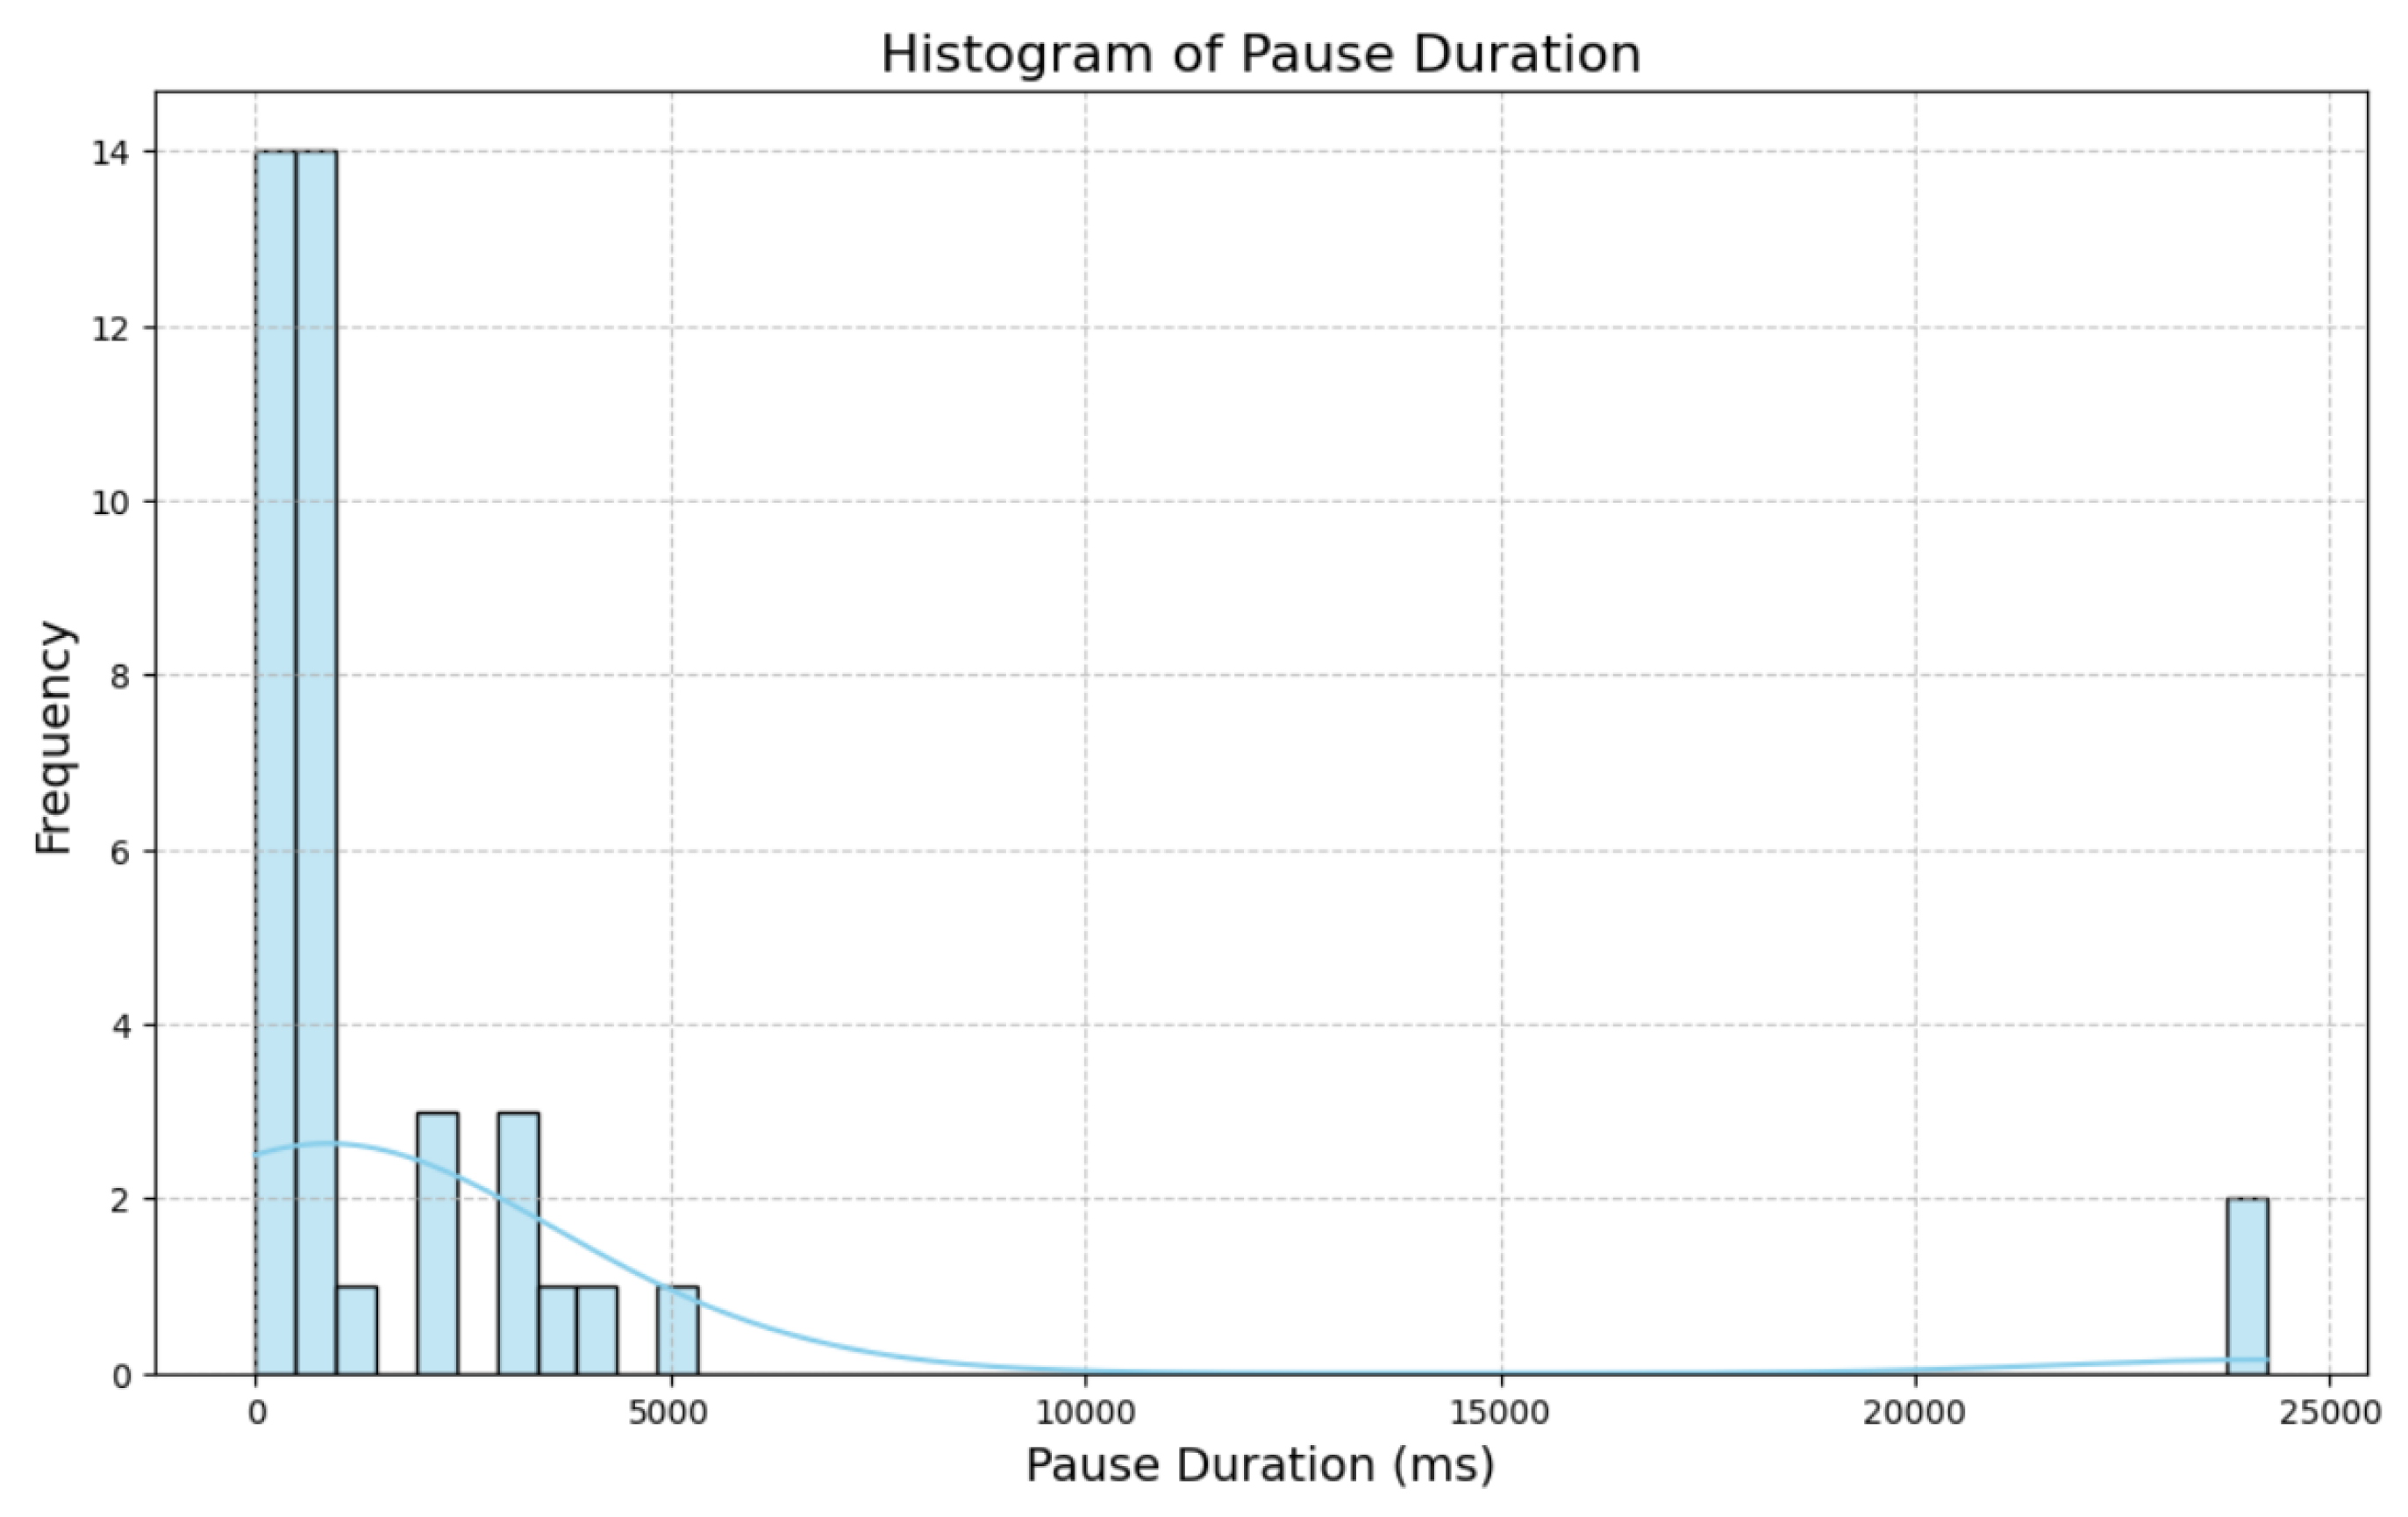
We can perform descriptive analysis based on this data. For example, by examining the “Dur” and “Pause” columns, we find that the average translation duration per word in this session is 1254.75ms. The word “CRITT” in row 8 had the longest translation duration of 6395ms. This is noteworthy because, as a proper noun, “CRITT” didn’t require translation and remained unchanged in the TT. Moreover, the participant had already translated this word once before. Despite these factors, the participant still spent the most time on this particular source word. Additionally, the average pause duration per word in this session is 2259.35ms. The longest pause, lasting 24230ms, occurred at the beginning of the session (the first and second rows). This extended pause likely represents the orientation phase (Carl et al., 2011), where the participant may have skimmed part or all the ST before typing the first keystroke. The shortest pause duration of 0ms appears in both row 17 and row 40. Interestingly, these zero pauses correspond to the periods at the end of sentences. This pattern is understandable, as transferring punctuation between languages often relies on translators’ procedural memory, requiring minimal cognitive effort. Such automaticity in handling sentence-ending punctuation explains the absence of measurable pauses in these instances.
We can visualize this data through various means. For instance, by using Python scripts, we can generate a histogram of the pause durations. As illustrated in Figure 12, the rightmost bar is a significant outlier, representing the extended pause at the start of the session. This pause, nearly eleven times longer than the average pause duration of the session, may indicate that the participant was becoming familiar with the ST during this time, which could have facilitated a faster translation process thereafter.
Figure 12.
Histogram (demo)
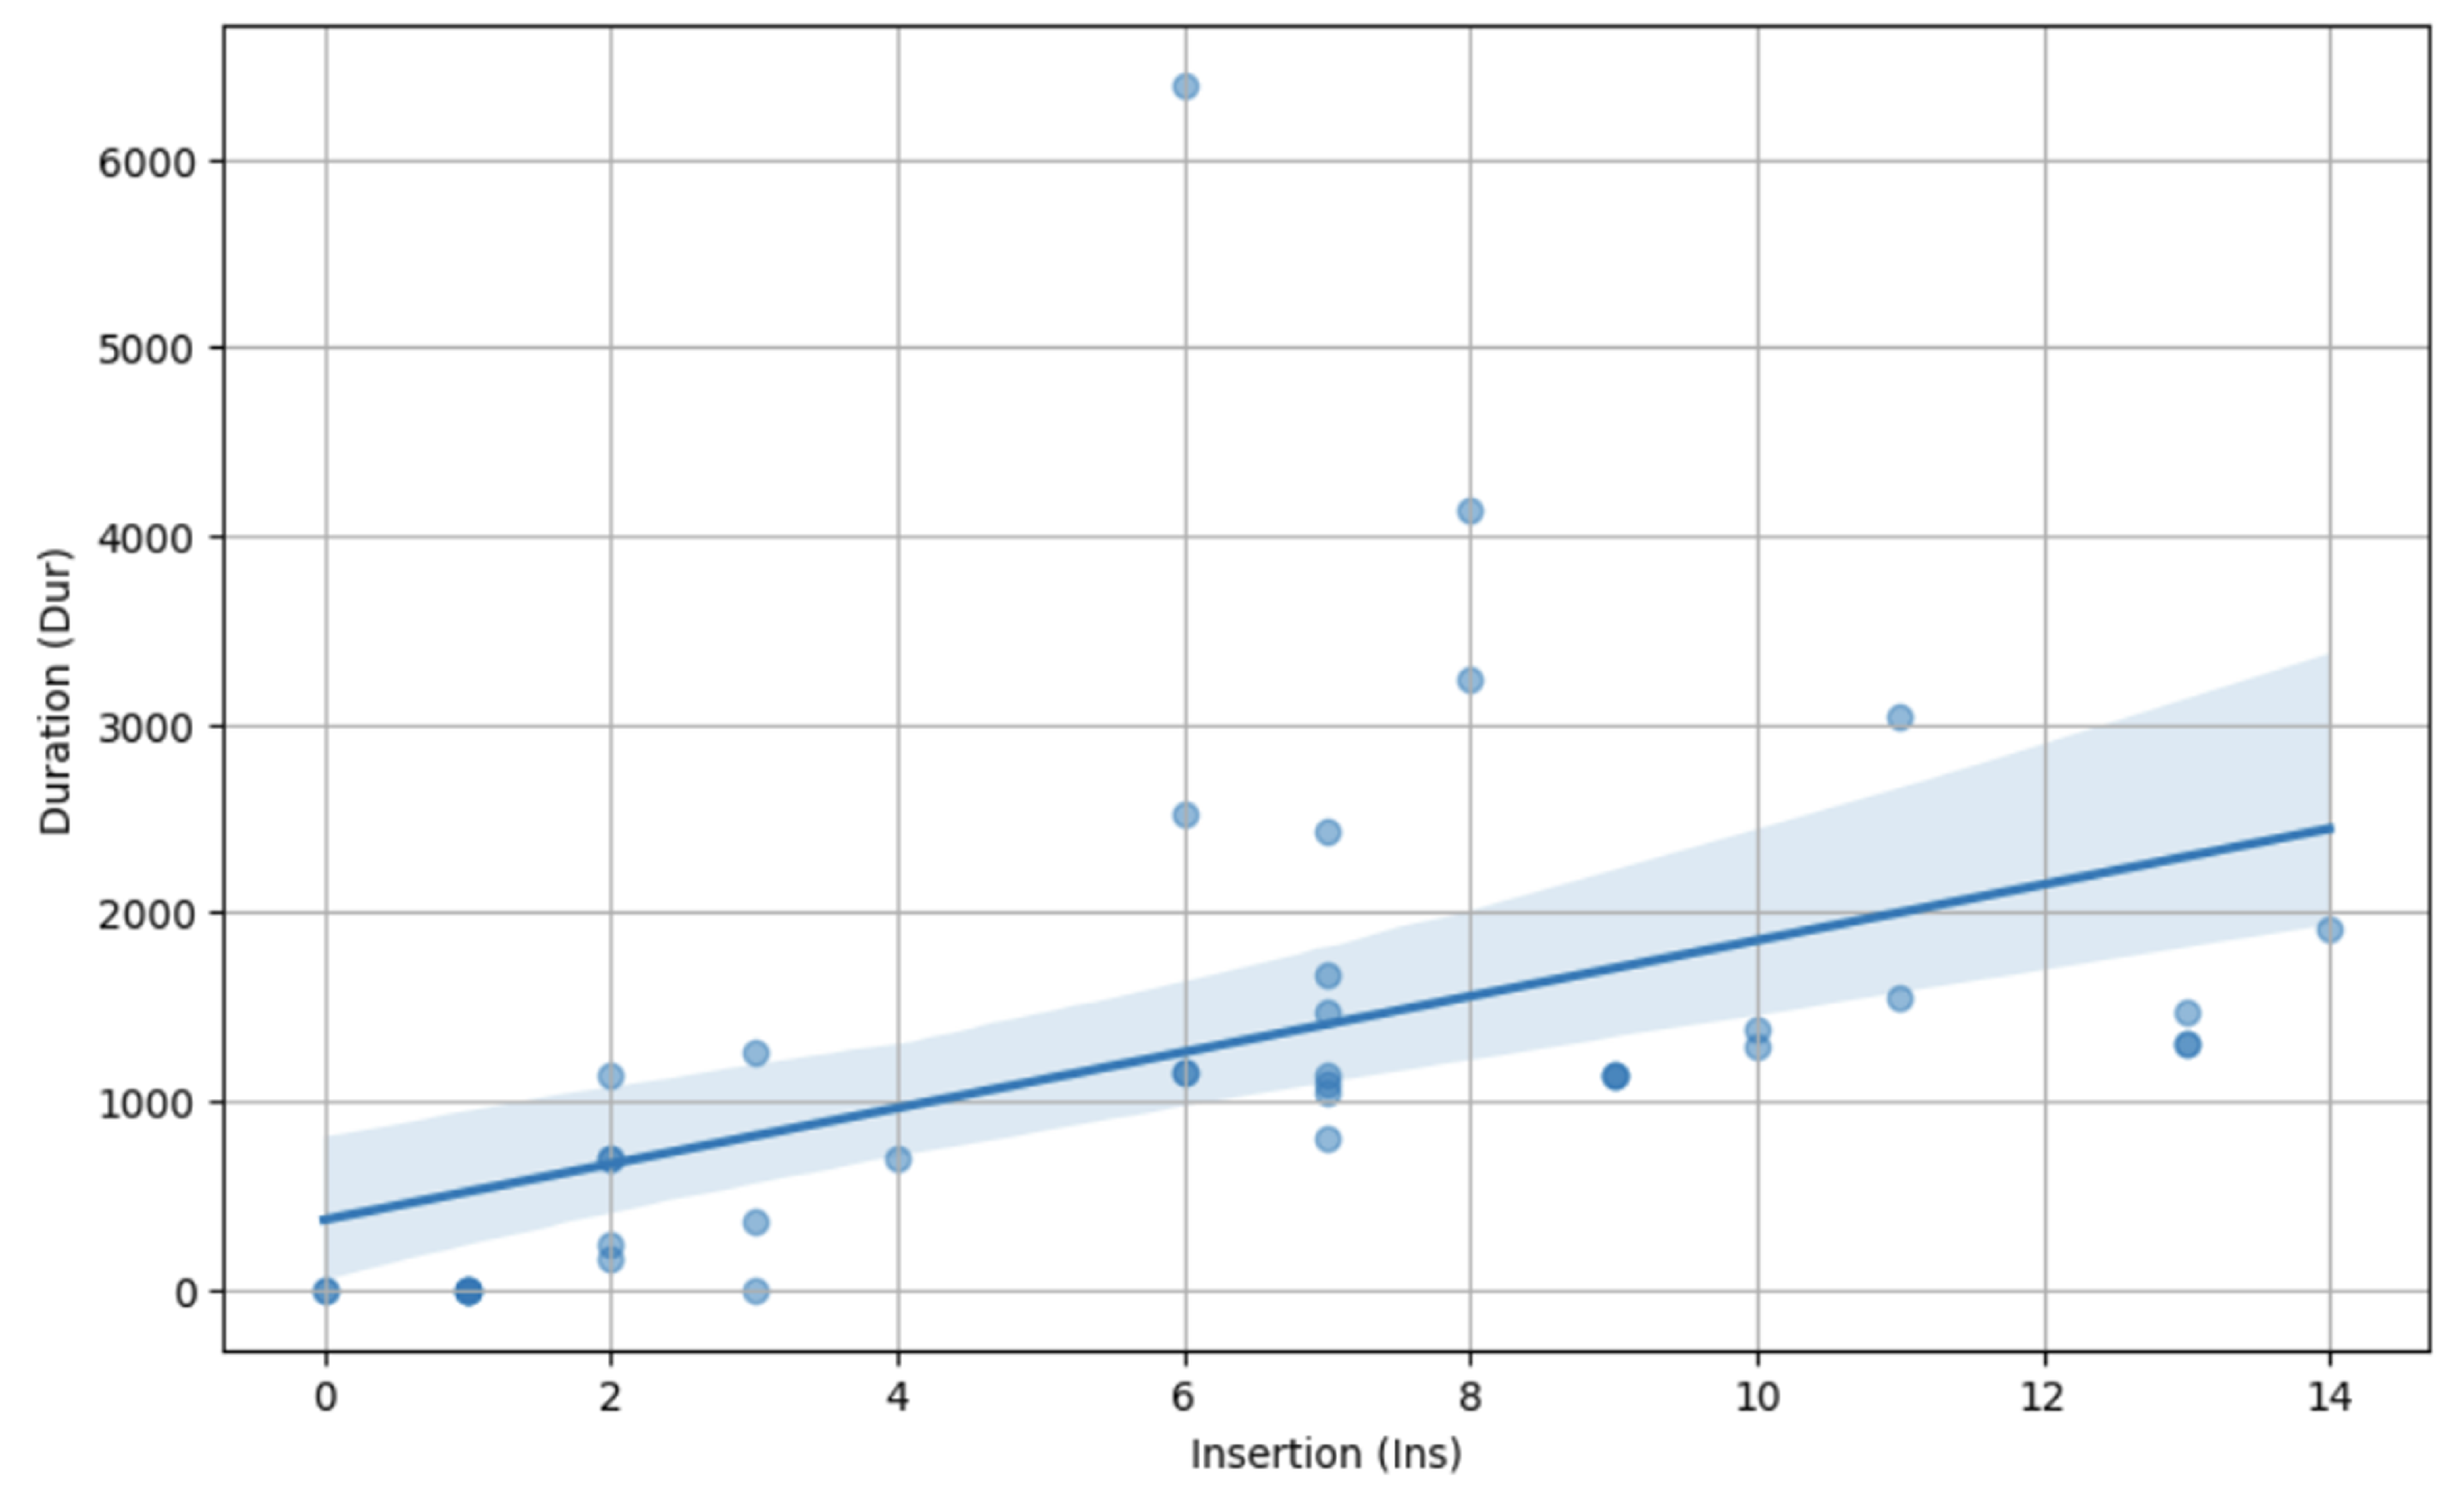
We can explore the relationship between insertion and translation duration in this session. For example, we can perform a correlation analysis between “Ins” and “Dur,” with “Ins” as the independent variable (X-axis) and “Dur” as the dependent variable (Y-axis). A scatter plot with a regression line can then be drawn, as shown in Figure 13. The visualization and regression analysis results demonstrate a statistically significant positive correlation between “Ins” (insertions) and “Dur” (duration), with a p-value of 0.002, well below the 0.05 significance threshold. This finding suggests that as the number of insertions increases, translation durations tend to increase. However, the insertion variable accounts for just 22.6% of the variance in duration, indicating that while insertions play a role in determining translation time, other factors (e.g., deletion, pause, etc) likely contribute substantially to the duration of the translation process.
Figure 13.
Correlation analysis between insertion (Ins) and duration (Dur)(demo)
4.3.3. Data visualization on Shiny R interface
In addition to the Jupyter account, CRITT provides a user-friendly, code-free interface built with Shiny R 13. This web-based tool enables researchers to generate and view translation progression graphs for experimental sessions online, without requiring programming expertise. This accessibility allows for efficient visualization and analysis of translation process data, catering to researchers with varying levels of technical proficiency.
To view the progression graph for our demonstration session, we follow the following steps on the webpage shown in Figure 14. We first input the username “SUMMER2023” at the bottom of the page and press enter. From the top drop-down menu, select the study name “000Translogdemo”. In the second drop-down menu, choose the session “P01_T1”. Then click the “Load selected session” button, and the progression graph for the entire session will appear on the right side of the page. We can then adjust the view using the X-axis to zoom in or out on the temporal progression of the session in milliseconds, and the Y-axis to zoom in or out on the sequence of source tokens. This allows researchers to focus on specific areas of interest within the translation process.
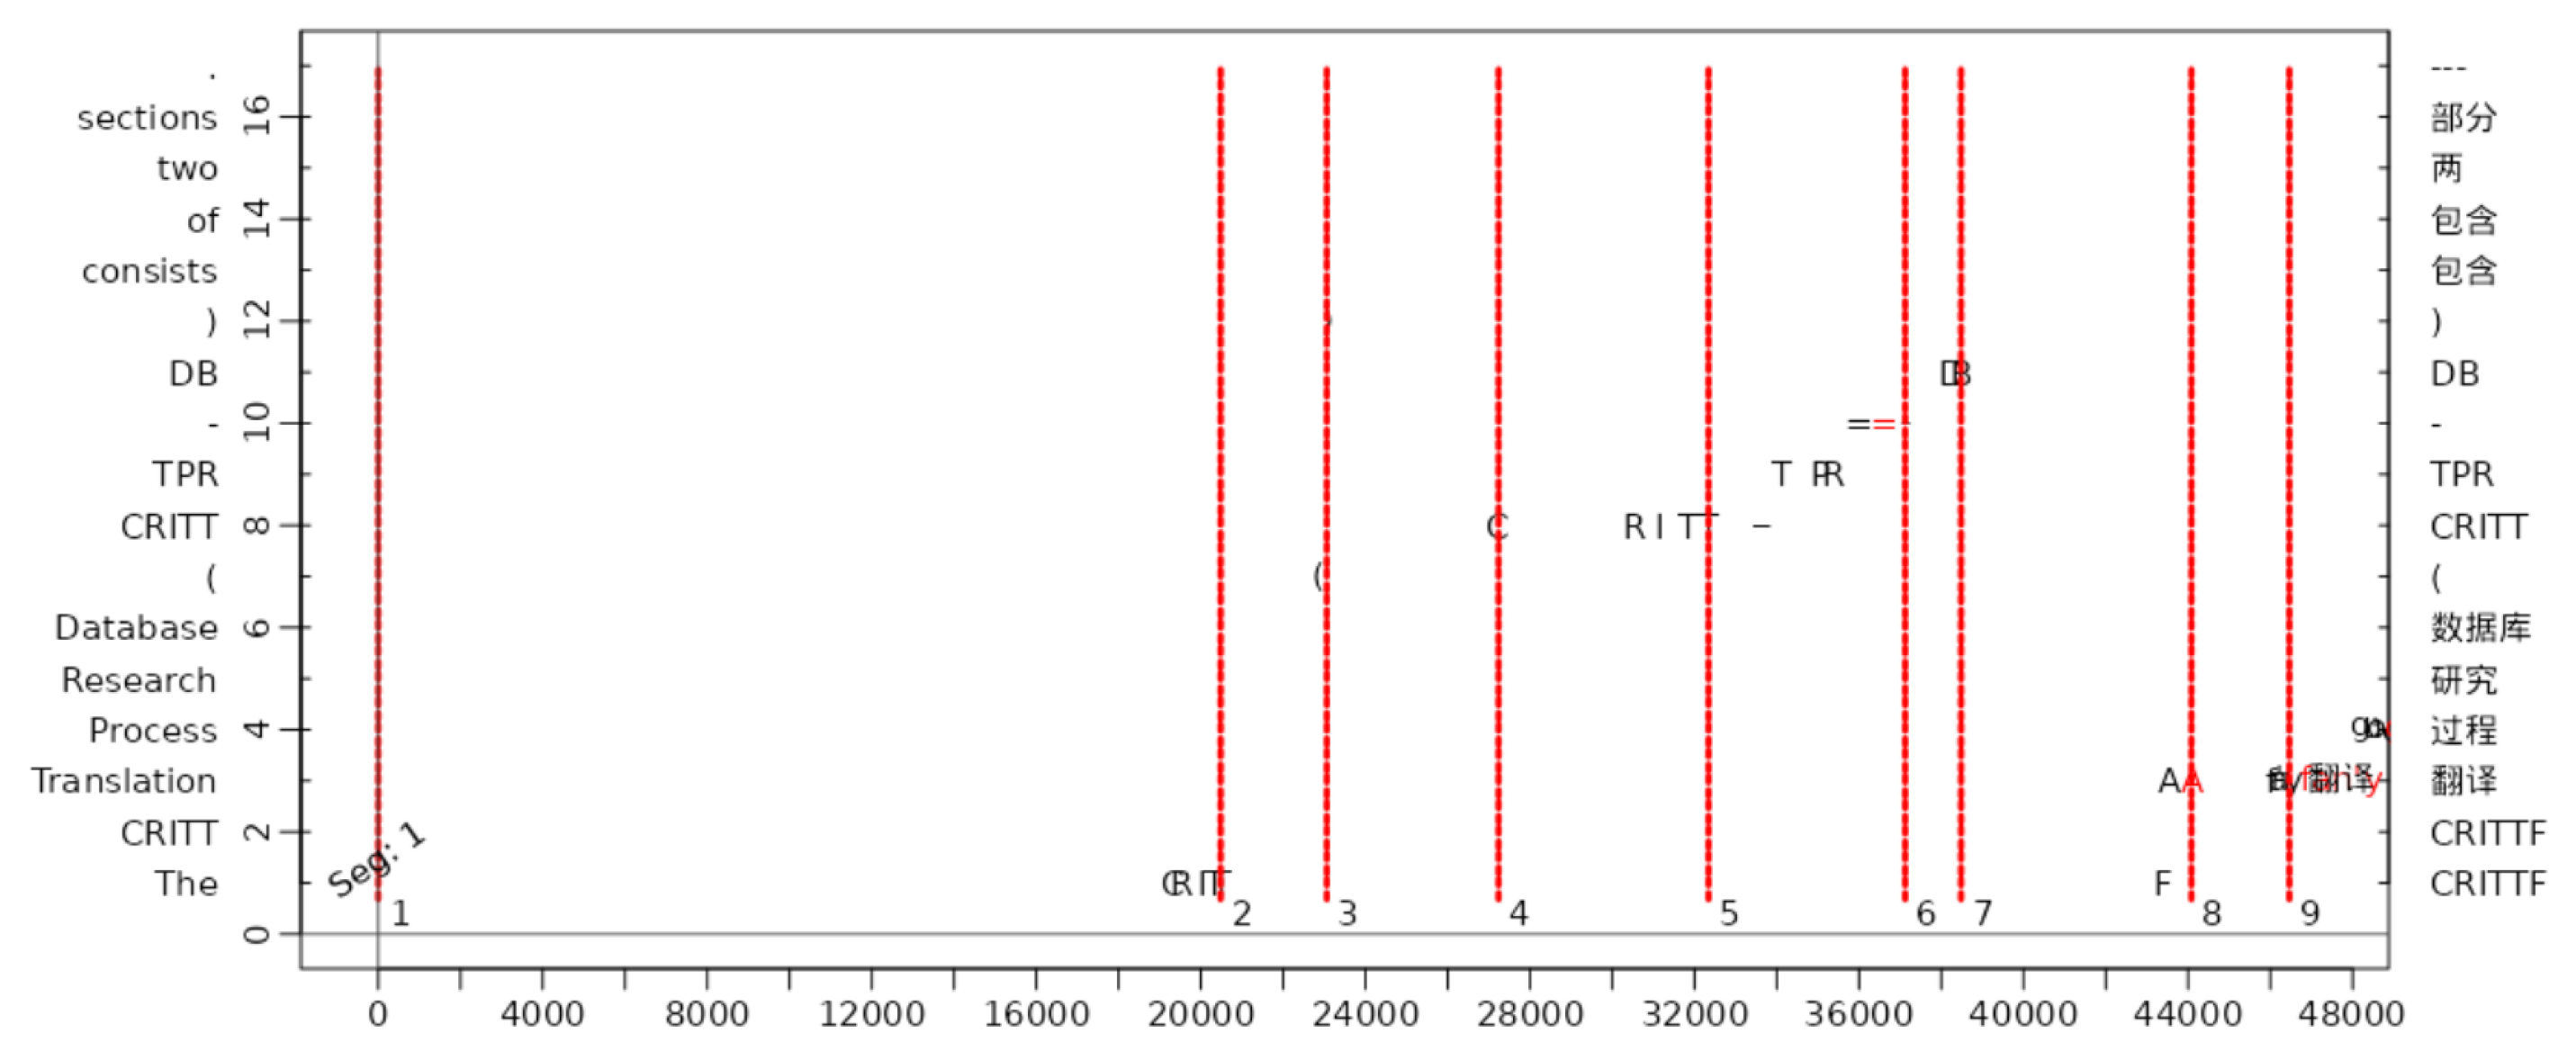
For instance, as indicated by the analysis in Section 4.3.1, the participant completed typing the translation for the first three words in the ST at around 47,000ms. Consequently, we can zoom in on the X-axis of the progression graph to focus on the 0ms to 47,000ms range and adjust the Y-axis to 0-17, as the first sentence contains 17 tokens. This can be done by sliding the horizontal bars for the “Production Segment” and “Source Text Segment”. Additionally, we can select options under “Show/Hide Items” to visualize translation units of different granularities or various data streams on the progression graph. For example, by ticking the “TU lines” option, red dashed lines representing translation units will appear on the progression graph (Carl, 2021), as shown in Figure 15. Moreover, we can view parts of the TPR-DB tables corresponding to the translation process section we have selected with the sliding bar. For example, by choosing “ST” from the “Show Data Tables” drop-down menu, the section of the ST table related to source tokens 1-17 will be displayed beneath the progression graph on the right side of the page.
As illustrated in Figure 15, there was a significant initial pause before the participant began typing the first target word, “CRITT.” Notably, the participant did not follow the sequence of the source words when typing the translation. Instead, the participant first typed all the proper nouns that didn’t require translation (“CRITT (CRITT TPR-DB)”), and then returned to translate the third source word. This behavior suggests that during the lengthy initial pause, the participant likely scanned the ST and determined a translation strategy to enhance efficiency in the process.
Figure 14.
Shiny R interface for translation progression graph
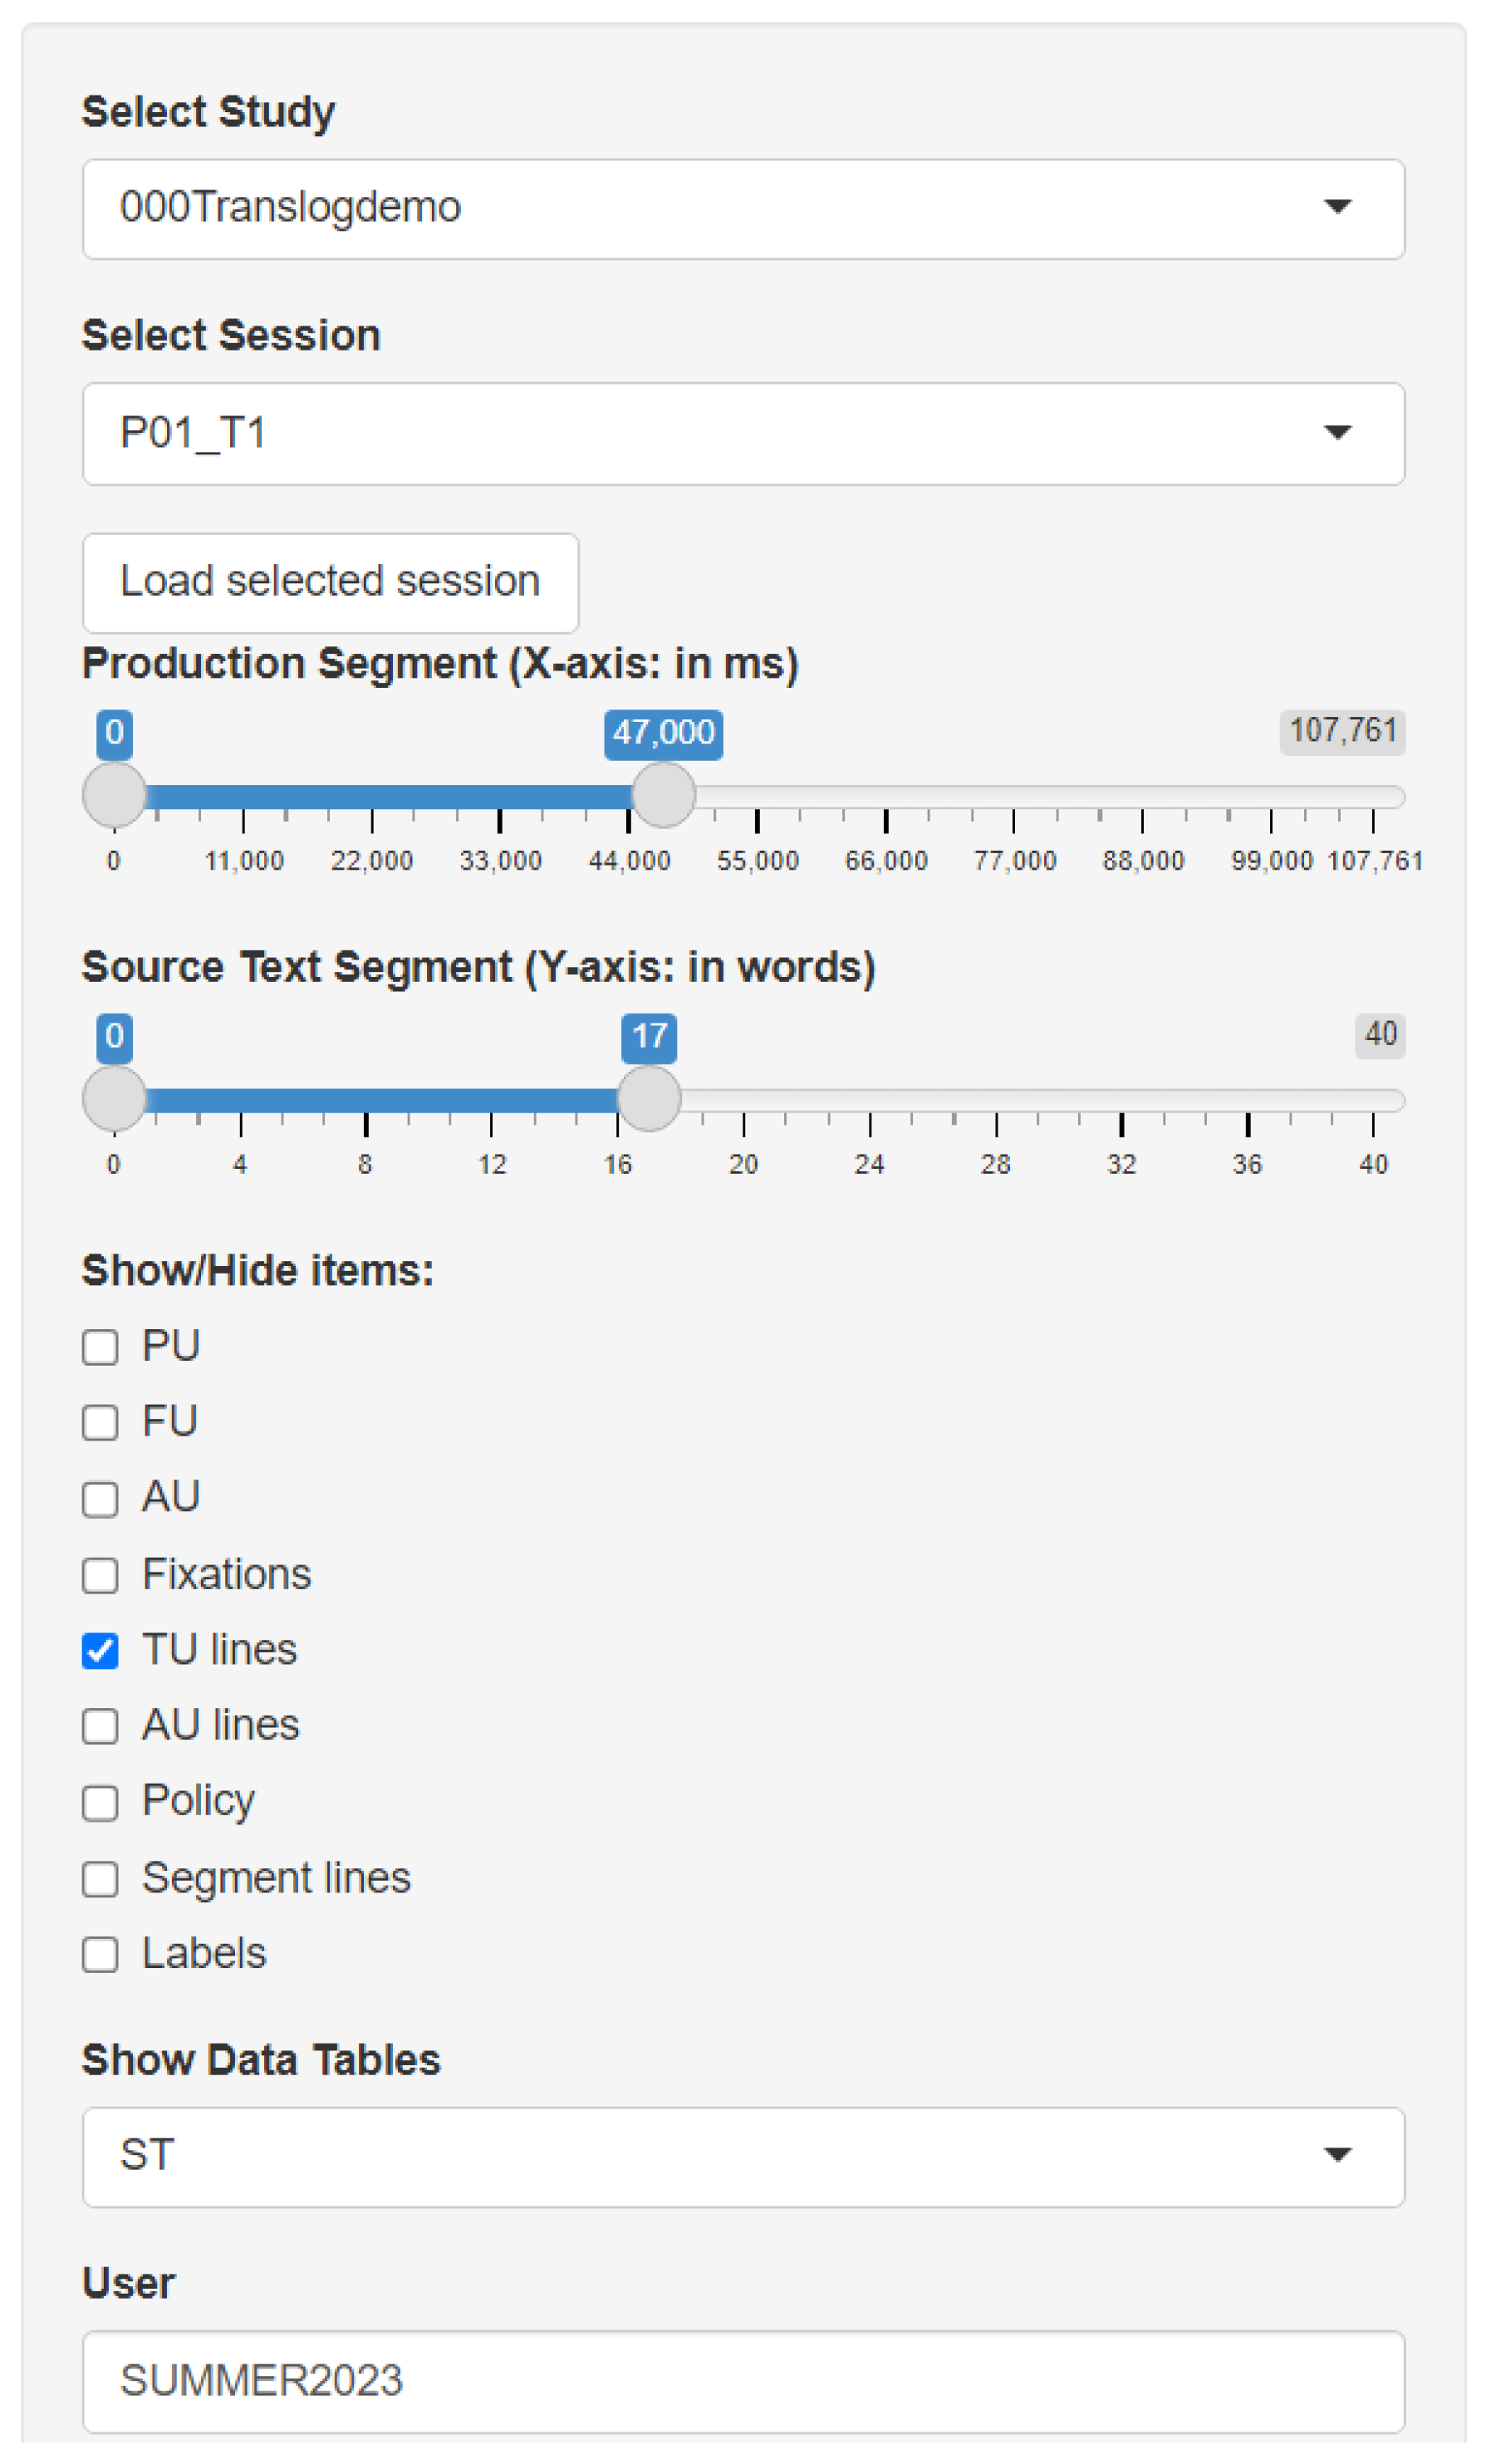
Figure 15.
Translation Progression Graph (demo)
This demonstration session, with its single participant, simple experimental design, and limited data, provides only a basic example of data analysis. Full-scale experiments in this field often triangulate multiple research methodologies. Researchers frequently combine eye tracking and keylogging, sometimes incorporating think-aloud protocols as well (Sun & Wen, 2017). This approach enhances the ecological validity of the studies, enables more sophisticated experimental designs, allows for a larger and more diverse participant pool, and yields more comprehensive datasets. These more comprehensive studies facilitate the exploration of advanced data analytics in TPR using the tools available in the TPR-DB. With richer datasets, researchers can delve deeper into various aspects of the translation process. For example, they can examine the relationships between different indicators of translation difficulty (Sun, 2015) and measures of translation performance. This approach helps to build a more nuanced understanding of the cognitive processes involved in translation and can lead to more robust findings in the field of TPR.
5. Discussion and Conclusions
This paper has provided a comprehensive, step-by-step guide to conducting keylogging experiments using Translog-II and processing the resulting data through the CRITT TPR-DB. Using an English-to-Chinese translation task as a demonstration, it has illustrated the complete experimental workflow from project creation and data collection to word alignment, error annotation, and data analysis using TPR-DB tables, Jupyter notebooks, and translation progression graphs. By documenting this workflow in a single, accessible resource, the paper aims to lower the barrier to entry for researchers and educators who wish to incorporate keylogging methodology into their work.
A key methodological issue addressed in this paper concerns the logging and mapping of keystrokes in languages that rely on Input Method Editors (IMEs), such as Chinese and Japanese. As demonstrated in the English-to-Chinese case study, the relationship between keystrokes and the characters that appear on screen is not straightforward in these writing systems: multiple keystrokes are required to produce a single logographic character, and the IME may introduce additional editing operations during the conversion process. This creates ambiguity in determining production time at the word level and complicates the keystroke-to-word mapping process. While Translog-II’s text-diff logging method addresses this challenge by recording both keystrokes and text modifications, the measurement of production effort for IME-mediated input remains an area that warrants further methodological refinement.
Beyond its applications in research, the Translog-II and TPR-DB workflow offers considerable potential as a pedagogical tool in translator education. As discussed in the introduction, the keylogging setup is freely available and requires no specialized hardware, making it feasible for classroom use. Instructors can design process-oriented activities in which students translate a text in Translog-II and then review their own sessions through concurrent think-aloud protocols during the task or retrospective verbalization during replay to develop awareness of their decision-making, pausing behavior, and revision strategies.
The TPR-DB’s word alignment and error annotation functions, accessible through the Yawat interface (Germann, 2008), extend these pedagogical possibilities further. By manually aligning source and target words, students engage in a hands-on activity that deepens their understanding of translation shifts and strategies (Catford, 1965; Vinay & Darbelnet, 1995), making abstract concepts such as transposition, modulation, or explicitation concrete and observable at the word level. This is particularly valuable for students working with typologically distant language pairs, where structural divergence between source and target languages tends to produce more frequent and more complex translation shifts (xiao2010, zou2024), requiring learners to move beyond word-level correspondence and engage with fundamental differences in syntactic organization. The alignment activity also encourages students to engage with the concept of the translation unit — a fundamental but long-debated notion in translation studies (Alves & Vale, 2009; Carl, 2021) — by requiring them to identify minimal equivalent meaning units between source and target texts through practice rather than theory alone.
Students can also use the error annotation function to conduct peer review of their classmates’ translations, linking process data to translation quality in a structured way. These activities are not limited to conventional bilingual translation: the alignment tool can also be applied to intralingual translation tasks, such as rendering classical Chinese texts into modern Chinese, allowing students of classical languages to annotate and analyze the linguistic transformations involved in making historical texts accessible to contemporary readers. Such applications demonstrate that the tools described in this paper have relevance beyond their original TPR context, extending into language pedagogy, historical linguistics, and cross-linguistic analysis more broadly.
Several limitations of this study should be acknowledged. The demonstration is based on a single participant translating a short text in one language pair (English to Chinese), which provides a clear illustration of the workflow but does not capture the complexity of full-scale experimental designs involving multiple participants, longer texts, or diverse language combinations. The paper focuses exclusively on keylogging data and does not cover the integration of eye-tracking, which would add a further dimension of cognitive process data. The data analysis presented is intentionally basic, designed to illustrate the available tools rather than to address a specific research question.
Future work could extend the approach of this paper in several directions. Applications involving other writing systems and language pairs would help researchers anticipate the specific challenges associated with different scripts and IME configurations. Methodological improvements to the keystroke-to-word mapping algorithm, particularly for longer deletion sequences and IME-mediated input, would enhance the precision of the extracted features. Another promising direction involves triangulating multiple data streams by integrating Translog-II keylogging data with eye-tracking and interface-level writing process data from tools such as Inputlog. While Translog-II captures the keystroke-level translation process and eye-tracking reveals what translators attend to during reading and production, Inputlog provides an additional layer of information about how translators interact with their broader working environment, including resource consultation and application switching. This multimodal approach becomes particularly relevant as large language models (LLMs) play an increasingly prominent role in translation workflows. Investigating how translators engage with, revise, and adapt LLM-generated output — and how they navigate between the LLM interface and their translation environment — could yield valuable insights into the evolving nature of translation as a cognitive and collaborative human-machine activity. We hope that this paper serves as a practical starting point for researchers and educators across linguistics and language studies who wish to explore the rich potential of translation process data.
Author Contributions
Longhui Zou: Conception and design of the study, data collection, data analysis and visualization, and drafting of the manuscript. Michael Carl: Development and maintenance of the Translog-II software and CRITT TPR-DB infrastructure, analysis and interpretation of the data, and critical revision of the manuscript for intellectual content. All authors have read and agreed to the published version of the manuscript.
Funding
This research received no external funding.
Data Availability Statement
The data used in this article is freely available and can be downloaded from the CRITT website. The CRITT provides free server access through registration via https://sites.google.com/site/centretranslationinnovation/tpr-db/getting-started. Upon logging into the CRITT server as summer_gst, a Python notebook is available under Shared_Translogdemo/translogdemo.ipynb that contains the Python code to produce the analysis and visualization in Figure 12 and Figure 13 of this study. The graphs shown in Figure 14 and Figure 15 can be reproduced via https://critt.as.kent.edu/shiny/mcarl6/ProgGraph/, by entering the User as “SUMMER2023” and selecting study “000Translogdemo” and the session “P01_T1”.
Conflicts of Interest
The authors declare no conflicts of interest.
References
- Alves, F., & Vale, D. (2009). Probing the unit of translation in time: Aspects of the design and development of a web application for storing, annotating, and querying translation process data. Across languages and cultures, 10(2), 251–273. [CrossRef]
- Alves, F., & Vale, D. (2011). On drafting and revision in translation: A corpus linguistics oriented analysis of translation process data. Translation: Computation, corpora, cognition, 1(1), 89–110.
- Angelone, E., Ehrensberger-Dow, M., & Massey, G. (2015). Cognitive processes. Researching translation and interpreting, 43–57. Routledge.
- Carl, M., Dragsted, B., & Jakobsen, A. L. (2011). A taxonomy of human translation styles. Translation journal, 16(2), 155–168.
- Carl, M. (2012a). Translog-II: A Program for Recording User Activity Data for Empirical Translation Process Research. The 8th International Conference on Language Resources and Evaluation (LREC 2012), Istanbul, Turkey.
- Carl, M. (2012b). The CRITT TPR-DB 1.0: A database for empirical human translation process research. Workshop on post-editing technology and practice.
- Carl, M. (2014). Produkt-und prozesseinheiten in der critt translation process research database. In Translationswissenschaftliches Kolloquium III: Beiträge zur Übersetzungs-und Dolmetschwissenschaft (Köln/Germersheim) (pp. 247–266). Peter Lang.
- Carl, M., Schaeffer, M., & Bangalore, S. (2016). The CRITT translation process research database. In Carl, M., Schaeffer, M., & Bangalore, S. (Ed.), New directions in empirical translation process research: Exploring the CRITT TPR-DB (pp. 37–50). Cham: Springer International Publishing.
- Carl, M. (2021). Micro units and the first translational response universal. In Explorations in empirical translation process research (pp. 233–257). Cham: Springer International Publishing.
- Catford, J. C. (1965). A linguistic theory of translation. London: Oxford University Press.
- Dragsted, B. (2010). Coordination of reading and writing processes in translation. Translation and Cognition, 15, 41.
- Germann, U. (2008). Yawat: yet another word alignment tool. The ACL-08: HLT demo session.
- Jääskeläinen, R. (2010). Think-aloud protocol. In Gambier, Y., & Doorslaer, L. (Ed.), Handbook of translation studies (pp. 371–374). John Benjamins Publishing Company.
- Koby, G. S. (2015). The ATA flowchart and framework as a differentiated error-marking scale in translation teaching. In Handbook of research on teaching methods in language translation and interpretation (pp. 220–253). IGI Global Scientific Publishing.
- Kotze, H. (2019). Converging what and how to find out why: An outlook on empirical translation studies. In New empirical perspectives on translation and interpreting (pp. 333–371). Routledge.
- Lommel, A., Burchardt, A., Popović, M., Harris, K., Avramidis, E., & Uszkoreit, H. (2014). Using a new analytic measure for the annotation and analysis of MT errors on real data. The 7th Annual conference of the European Association for Machine Translation.
- Muñoz Martín, R., & Cardona Guerra, J. M. (2019). Translating in fits and starts: Pause thresholds and roles in the research of translation processes. Perspectives, 27(4), 525–551. [CrossRef]
- Muñoz Martín, R., Sun, S., Du, Z. & Puerini, S. (2025). Keylogging. In A. Rojo López & R. Muñoz Martín (Ed.) Research Methods in Cognitive Translation and Interpreting Studies (pp. 157–182). John Benjamins Publishing Company.
- Schaeffer, M., & Carl, M. (2017). Language processing and translation. In Hansen-Schirra, S., Czulo, O., & Hofmann, S. (Ed.), Empirical Modeling of Translation and Interpreting (pp. 117–154). Language Science Press.
- Schou, L., Dragsted, B., & Carl, M. (2009). Ten years of Translog. In Mees, I., Alves, F., & Göpferich, S. (Ed.), Copenhagen Studies in Language (pp. 13–54). Copenhagen Business School.
- Shreve, G. M., & Lacruz, I. (2014). Translation as higher-order text processing. A companion to translation studies, 107–118.
- Sun, S. (2015). Measuring translation difficulty: Theoretical and methodological considerations. Across languages and cultures, 16(1), 29–54. [CrossRef]
- Sun, S., & Wen, J. (2017). Translation process research: An overview. In The Routledge handbook of Chinese translation (pp. 275–290). Routledge.
- Vale, D. C., Neumann, S., & Niemietz, P. (2016). Automatic recognition of linguistic replacements in text series generated from keystroke logs. The Tenth International Conference on Language Resources and Evaluation (LREC’16).
- Vinay, J. P., & Darbelnet, J. (1995). Comparative stylistics of French and English. John Benjamins. (Original work published 1958).
- Xiao, R. (2010). How different is translated Chinese from native Chinese?: A corpus-based study of translation universals. International journal of corpus linguistics, 15(1), 5–35. [CrossRef]
- Yamada, M., Mizowaki, T., Zou, L., & Carl, M. (2022). Trados-to-Translog-II: Adding gaze and Qualitivity data to the CRITT TPR-DB. The 23rd Annual Conference of the European Association for Machine Translation, Ghent, Belgium.
- Zou, L., & Carl, M. (2022). Trados and the CRITT TPR-DB: Translation process research in an ecologically valid environment. Model building in empirical translation studies: TRICKLET Conference (2022), Aachen, Germany.
- Zou, L., Carl, M., & Gilbert, D. (2023). Integrating Trados-qualitivity data to the CRITT TPR-DB: Measuring post-editing process data in an ecologically valid setting. In Pan, J., & Laviosa, S. (Ed.), Corpora and translation education: Advances and challenges (pp. 63–86). Singapore: Springer Nature Singapore.
- Zou, L. (2024). Cognitive Processes in Human-ChatGPT Interaction during Machine Translation Post-editing (Doctoral dissertation, Kent State University).
| 1 | To register for a temporary test account, check the link: https://sites.google.com/site/centretranslationinnovation/tpr-db/getting-started. |
| 2 | The data can be downloaded free of charge from the CRITT website: https://sites.google.com/site/centretranslationinnovation/tpr-db. |
| 3 | Many of which are listed on the CRITT website: https://sites.google.com/site/centretranslationinnovation/tpr-db-publications. |
| 4 | Currently, Eyelink, Tobii, and SMI eyetracker are supported. |
| 5 | |
| 6 | In some rare cases the logging information is not complete, most likely due to some unanticipated keystroke combination. |
| 7 | The tool can be downloaded from the CRITT website: https://sites.google.com/site/centretranslationinnovation/tpr-db/auxilliary-tools
|
| 8 | |
| 9 | It is usually recommended to use a font without serifs. |
| 10 | See naming conventions of the TPR-DB via the following link: https://sites.google.com/site/centretranslationinnovation/tpr-db/uploading?authuser=0#h.p_ID_175. |
| 11 | |
| 12 | Check the interactive table describing all the current features supported by the TPR-DB on https://sites.google.com/site/centretranslationinnovation/tpr-db/features?authuser=0. |
| 13 |

Table 1.
Deletion of a string “die Motive für die Morde Norris” and insertion of “N”
| <Key Time ="323531" Cursor ="769" Text =" die Motive für die Morde Norris " Type =" |
| delete " Value ="[ Back ]" /> |
| <Key Time ="324248" Cursor ="769" Type =" insert " Value ="N" /> |
Table 2.
Possible alternative operation for the same logging information from Table 1
Table 2.
Possible alternative operation for the same logging information from Table 1
| <Key Time ="323531" Cursor ="769" Text =" die Motive für die Morde Norris " Type =" |
| insert " Value ="N" /> |
Table 3.
Log of the production of a Japanese Kanji
| <Key Time="538625" Type="IME" Value="[N]" /> |
| <Key Time="538796" Type="IME" Value="[E]" /> |
| <Key Time="538952" Type="IME" Value="[N]" /> |
| <Key Time="538952" Type="IME" Value="[N]" /> |
| <Key Time="539046" Type="IME" Value="[Space]" /> |
| <Key Time="539451" Cursor="148" IMEtext="NENNSpace" Type="insert" Value="年" /> |
Disclaimer/Publisher’s Note: The statements, opinions and data contained in all publications are solely those of the individual author(s) and contributor(s) and not of MDPI and/or the editor(s). MDPI and/or the editor(s) disclaim responsibility for any injury to people or property resulting from any ideas, methods, instructions or products referred to in the content. |
© 2026 by the authors. Licensee MDPI, Basel, Switzerland. This article is an open access article distributed under the terms and conditions of the Creative Commons Attribution (CC BY) license (http://creativecommons.org/licenses/by/4.0/).
Copyright: This open access article is published under a Creative Commons CC BY 4.0 license, which permit the free download, distribution, and reuse, provided that the author and preprint are cited in any reuse.


