Submitted:
11 March 2026
Posted:
11 March 2026
You are already at the latest version
Abstract
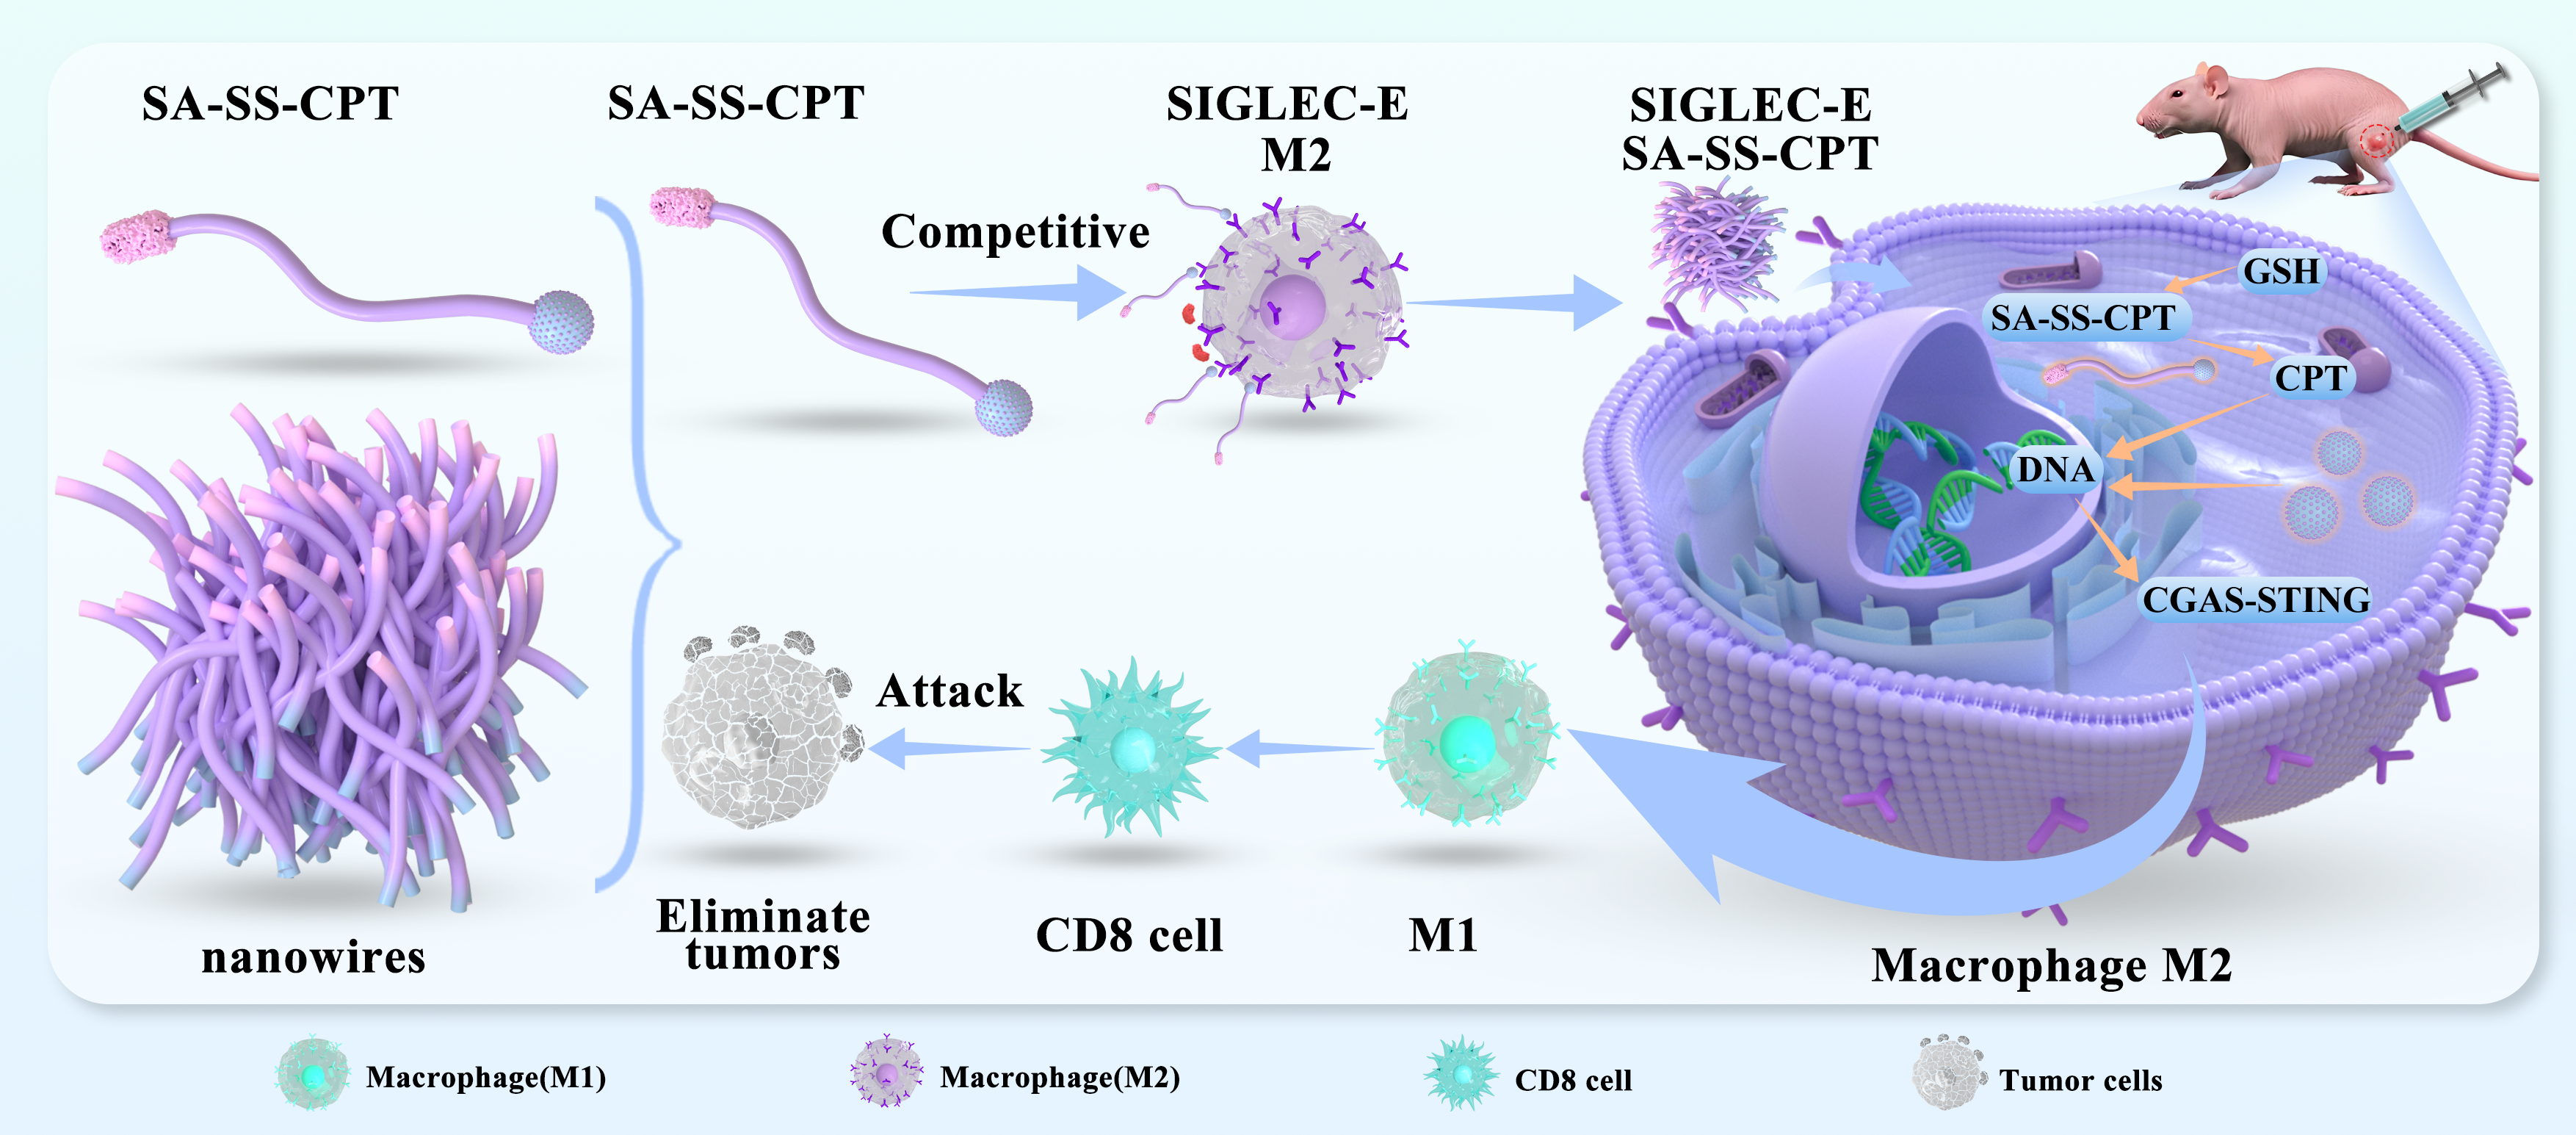
This study successfully developed a novel tumor-associated macrophages (TAMs)-targeting nanoplatform-sialic acid-disulfide bond-camptothecin (SA-SS-CPT) nanowires. This system significantly improved the solubility and bioavailability of camptothecin (CPT) and achieved active targeted drug delivery by utilizing sialic acid as a targeting ligand to specifically recognize the highly expressed Siglec-E receptor on TAMs. Upon internalization into TAMs, the disulfide bond in the SA-SS-CPT nanowires was cleaved in response to intracellular glutathione (GSH), leading to the controlled re-lease of CPT. SA-SS-CPT induced DNA damage in TAMs, thereby activating the cGAS-STING signaling pathway, promoting the polarization of TAMs toward the M1 phenotype, enhancing pro-inflammatory and anti-tumor immune responses, and effec-tively inhibiting tumor immune escape. Furthermore, the SA-SS-CPT nanowires syner-gistically enhanced the efficacy of PD-L1 blockade immunotherapy, collectively remod-eling the tumor immune microenvironment and ultimately facilitating significant tumor clearance.
Keywords:
camptothecin nanowires
; sialic acid
; tumor-associated macrophages
; cGAS-STING signaling pathway
; immune escape
1. Introduction
Liver cancer is the fifth most common cancer and the second leading cause of cancer-related deaths in Asia. Data from 2020 show that 72.5% of global liver cancer cases are concentrated in Asia, with hepatocellular carcinoma (HCC) being the predominant pathological type [1]. Currently, treatment options for advanced HCC are limited, highlighting an urgent need to develop new drugs and therapeutic strategies. Although targeted therapy and immunotherapy have shown potential, further exploration is required to determine their optimal application and therapeutic targets [2].
In recent years, immunotherapy, which aims to restore the immune system's ability to recognize and kill tumor cells, has played a significant role in the treatment of HCC. Among immune components, macrophages are crucial to immunity and are ubiquitous in peripheral tissues, serving as the first line of defense against pathogens. In the tumor microenvironment, tumor-associated macrophages (TAMs) are categorized into two main functional phenotypes: M1 and M2. M1 macrophages are generally considered to have anti-tumor effects [3,4], whereas M2 macrophages tend to promote tumor growth and metastasis [5,6]. In the tumor microenvironment, TAMs are often polarized toward the M2 phenotype, which exhibits tumor-promoting properties [7]. Therefore, reprogramming TAMs from M2 polarization into the tumor-suppressive M1 phenotype represents an important approach in cancer therapy.
Sialic acid (SA) is a derivative of neuraminic acid and a type of nine-carbon monosaccharide widely found at the terminal structures of glycoproteins and glycolipids. It plays important roles in various physiological and pathological processes [8]. In recent years, the role of SA in cancer has garnered significant attention, particularly in HCC, where abnormal SA expression has been closely associated with cancer progression, invasiveness, and prognosis [9]. Studies have revealed that tumor cells, through surface-expressed SA, interact with Siglec receptors on macrophages, further promoting M2 polarization. This process suppresses the immune system's attack on tumor cells, facilitating immune escape. Therefore, targeting the SA-Siglec interaction may offer a strategy to reprogram TAMs towards the M1 phenotype, potentially improving the tumor immune microenvironment [10].
Siglec receptors are primarily expressed on the surface of immune cells such as macrophages, dendritic cells, and natural killer cells [11]. The extracellular domain of Siglec receptors can specifically recognize sialic acid (SA), while their intracellular domain typically contains an immunoreceptor tyrosine-based inhibitory motif, which mediates the negative regulation of immune responses [12]. Through inhibitory signal transduction, Siglec receptors play a crucial role in maintaining immune homeostasis and preventing excessive inflammatory reactions [11]. This mechanism is similar to that of immune checkpoints, making Siglec a part of the immune escape process. In HCC, high SA expression activates Siglec-10, inhibiting the phagocytic activity and pro-inflammatory responses of TAMs, thereby promoting tumor immune escape [13]. The interaction between Siglec-E and tumor-associated dendritic cells suppresses antigen presentation, further impairing the immune system's ability to recognize HCC [14]. Numerous studies have highlighted the potential of targeting the SA-Siglec axis to modulate macrophage immune function, which may provide new directions for the development of novel cancer immunotherapies [15].
Currently, therapeutic agents for HCC include camptothecin (CPT). CPT is a topoisomerase I inhibitor that exerts its anti-tumor effects by interfering with DNA replication processes [16,17]. Additionally, studies such as that by Chen [18] have reported that CPT influences macrophage function by inhibiting nitric oxide biosynthesis in RAW 264.7 macrophages. However, whether CPT participates in anti-tumor activity by modulating the polarization pathway of tumor-associated macrophages remains unreported. Although CPT has demonstrated potent anti-tumor activity in cancer treatment, its direct application in HCC therapy faces several challenges. First, CPT exhibits extremely poor water solubility, leading to low absorption and bioavailability in vivo, which limits its broad clinical use. Furthermore, CPT has high toxicity, particularly toward normal cells, significantly restricting its therapeutic applicability [19]. Therefore, researchers are actively exploring various strategies to enhance the safety and efficacy of CPT in cancer treatment.
Nanomedicine-based drug delivery systems have emerged as a pivotal area in pharmaceutical research in recent years and are frequently employed to overcome the limitations of active natural products. This study aims to design nanoparticles with active targeting capability toward TAMs to address the challenges of CPT, including its high toxicity and poor water solubility. A chemical synthesis approach was used to conjugate CPT with SA via a disulfide bond, resulting in SA-SS-CPT. The SA modification enables the nanoparticles to competitively target macrophages over tumor cells, reducing the binding opportunity between tumor-derived SA and Siglec receptors on TAMs, thereby inhibiting tumor immune evasion. The disulfide bond (-SS-) in SA-SS-CPT is cleaved by intracellular glutathione (GSH) within TAMs, leading to the release of CPT [20,21]. SA-SS-CPT induces DNA damage in TAMs, subsequently activating the cGAS-STING signaling pathway. This promotes the repolarization of TAMs toward the M1 phenotype, enhancing their pro-inflammatory response and anti-tumor immune activity, which effectively counteracts immune escape. Furthermore, SA-SS-CPT nanoparticles synergize with PD-L1 blockade immunotherapy to jointly remodel the tumor immune microenvironment, ultimately leading to significant tumor clearance, as illustrated in Scheme 1.
2. Materials and Methods
2.1. Materials and Animals
(S)-(+)-Camptothecin (Aladdin), N-Acetylneuraminic acid (Aladdin), Anti-PD-1 (BE0146, Bio X Cell, USA), HiScript III RT SuperMix for qPCR (+gDNA wiper (R323-01), ChamQ Universal SYBR qPCR Master Mix (Q711-02) (Vazyme), 3,3'-Dioctadecyloxacarbocyanine perchlorate (DiO) (Sigma-aldrich), 1,1'-Dioctadecyl-3,3,3',3'-tetramethylindotricarbocyanine iodide (DiR) (Sigma-aldrich), Cell Counting Kit-8 assay (Sigma-aldrich), TNF-α, IL-1β, IL-1RA, CD33, CD169, and β-Tubulin primary antibody (HUABIO); SYNERGY microplate reader (BIOTEK, USA); Transmission electron microscopy (TEM) (JEM1200EX, Japan); Marvin nanoparticle size analyzer (Malvern, UK); Carestream in vivo FX Professional Imaging System (Bruker, Germany); Confocal laser scanning microscope (DeltaVision Ultra, GE, USA); Flow cytometry (Beckman Coulter, USA).
Twenty BALB/c-nu/nu nude mice, male, 20-30 g, 4 weeks of age, SPF grade, purchased from Beijing Weitonglihua Laboratory Animal Technology Co., Ltd. (China). All mice were kept in the SPF animal room with a 12-hour light/dark cycle, maintained at a temperature range of 18-22℃ and humidity levels of 50-60%. The animal experiment was approved by the Animal Ethics Committee of the Second Affiliated Hospital of Harbin Medical University (YJSKY2024-433).
Twenty male BALB/c-nu/nu nude mice (4 weeks old, 20–30 g, SPF grade) were purchased from Beijing Weitonglihua Laboratory Animal Technology Co., Ltd. (China). The mice were housed under specific pathogen-free conditions with a 12-hour light/dark cycle, ambient temperature maintained at 18–22 °C, and relative humidity of 50–60%. The animal study was approved by the Animal Ethics Committee of the Second Affiliated Hospital of Harbin Medical University (approval no. YJSKY2024-433). All procedures involving anesthesia and euthanasia were conducted in strict accordance with the American Veterinary Medical Association (AVMA) Guidelines for the Euthanasia of Animals. For surgical anesthesia, mice were administered sodium pentobarbital (40-80 mg/kg) via intraperitoneal injection, and the depth of anesthesia was assessed by the absence of pedal withdrawal reflex. At the experimental endpoints, euthanasia was humanely performed by an overdose of the same anesthetic at a dose exceeding 150 mg/kg. Death was confirmed by the absence of pupillary light reflex and cessation of heartbeat.
2.2. Methods
2.2.1. Synthesis of Camptothecin Nanowires
The synthetic route for Sialic acid-SS-camptothecin (SA-SS-CPT) was shown in Scheme S1. The purity of all intermediate compounds and the final product was confirmed by proton nuclear magnetic resonance spectroscopy (¹H-NMR, 400 MHz) and MS-HPLC analysis. Detailed synthetic procedures are provided in the Supporting Methods. Dried SA-SS-CPT was thoroughly ground and mixed with spectrally pure potassium bromide powder at a mass ratio of approximately 1:100, and then pressed into pellets. Fourier transform infrared spectroscopy was used for characterization. SA-SS-CPT nanowires were dissolved in a suitable amount of methanol, and full-wavelength scanning was performed using a UV-visible spectrophotometer.
2.2.2. Preparation and Characterization of SA-SS-CPT Nanowires
SA-SS-CPT nanowires were prepared by dissolving 5 mg of SA-SS-CPT in 1 mL of ultrapure water, followed by probe sonication on ice (5 s on/5 s off cycles for a total of 30 times). The hydrodynamic diameter, polydispersity index (PDI), and zeta potential of the nanowires were determined using dynamic light scattering (DLS; Malvern Instruments, UK). The morphology of the SA-SS-CPT nanowires was observed under a tungsten-filament transmission electron microscope (JEM1200EX, JEOL, Japan) after negative staining. To evaluate the stability of the SA-SS-CPT nanowires, their average size and zeta potential were measured at days 0, 3, 6, 9, 12, 15, 18, 21, 24, 27, and 30 during storage.
2.2.3. Hemolysis Assay
A hemolysis assay was performed to evaluate the biocompatibility of the nanowires. Briefly, mouse blood was collected via cardiac puncture into heparinized tubes. A 2% erythrocyte suspension was prepared by centrifuging the blood, washing the erythrocytes with normal saline, and resuspending them. This suspension was incubated with various concentrations of SA-SS-CPT nanowires at 37°C for 1 h. The samples were then centrifuged, and the absorbance of the supernatants was measured at 540 nm. Distilled water and normal saline served as the positive and negative controls, respectively. The hemolysis rate (%) = (Asample - Anegative) / (Apositive - Anegative) × 100%.
2.2.4. Camptothecin Release
Standard CPT solutions at varying concentrations (0, 1, 2, 5, and 10 μg/mL) were prepared separately. The absorbance of these solutions was measured at a wavelength of 257 nm using a UV-Vis spectrophotometer to establish a standard curve. Subsequently, 1 mg/mL of the SA-SS-CPT solution was placed in a centrifuge tube, to which a 10 mM GSH solution was added. After thorough mixing, the tube was incubated in a constant temperature shaker at 37°C with an agitation speed of 100 rpm. The supernatant was sampled at specific time intervals (0, 15, 30, 45, 90, and 135 minutes) after the reaction initiation. The absorbance of the reaction solution at 257 nm was measured for each sample. The concentration of released CPT was calculated based on the linear regression equation derived from the standard curve.
2.2.5. Pharmacokinetics Study
BALB/c-nu/nu nude mice were intravenously administered SA-SS-CPT via the tail vein. Blood samples were collected at predetermined time points (0, 1, 2, 3, 6, 8, 12, and 24 hours) post-injection. Plasma was separated from the blood samples, treated with methanol, and centrifuged. The resulting supernatant was analyzed using High-performance liquid chromatography.
2.2.6. Immunofluorescence Analysis of Siglec-E Expression
A co-culture system was established using RAW 264.7 cells (1×10⁵ cells/mL) and Hepa1-6 cells (5×10⁴ cells/mL), with the latter seeded in the upper chamber of a transwell insert, for 24 hours under standard conditions (37°C, 5% CO₂). Following co-culture, the RAW 264.7 cells on coverslips were fixed with 4% paraformaldehyde, permeabilized with 0.1% Triton X-100, and blocked with 5% BSA. The cells were subsequently incubated with an anti-Siglec-E primary antibody at 4°C overnight. After PBS washes, a fluorescent secondary antibody was applied in the dark. Imaging was performed using a fluorescence microscope.
2.2.7. Cellular Uptake of SA-SS-CPT
RAW 264.7 cells in the logarithmic growth phase were seeded into 12-well plates at a density of 1 × 10⁵ cells/mL and cultured for 24 hours in a 5% CO₂ incubator at 37°C. Subsequently, the cells were treated with 20 μL of DiO-labeled SA-SS-CPT nanowires and further incubated for 4 hours at 37°C. After incubation, the culture medium was removed, and the cells were washed twice with PBS, trypsinized, and centrifuged. The resulting cell pellet was resuspended in 200 μL of PBS. Cellular uptake was analyzed using a flow cytometer.
2.2.8. In Vivo Imaging
Hepa1-6 cells were subcutaneously inoculated into BALB/c nude mice at five weeks of age. Seven weeks post-inoculation, once the tumor model was successfully established, the model mice were intravenously administered SA-SS-CPT@DiR solutions. Briefly, the SA-SS-CPT@DiR complex was prepared by mixing DiR solution (1 mg/mL) with SA-SS-CPT solution (1 mg/mL) in chloroform at a 10:1 volume ratio. After chloroform evaporation, the resulting film was reconstituted in 1 mL of physiological saline. Free DiR was removed by centrifugation at 5,000 rpm for 5 minutes. The formulated solution was injected via the tail vein at a DiR dose of 40 μg/kg. Fluorescence imaging was performed using a Carestream In Vivo FX Professional Imaging System (Bruker, Germany) with excitation and emission wavelengths set at 720 nm and 790 nm, respectively.
2.2.9. In Vitro Cytotoxicity of SA-SS-CPT
The in vitro cytotoxicity of SA-SS-CPT nanowires was determined by a CCK-8 assay. HCCLM3 cells, plated in 96-well plates (1 × 10⁴ cells/mL) for 24 hours, were treated with a series of nanowires concentrations (1920-15 μg/mL) for an additional 24 hours. Following the treatment, RAW 264.7 cells were incubated with CCK-8 reagent for 1 hour at 37°C. The absorbance was measured at 450 nm. Cell viability was expressed as a percentage relative to untreated controls, calculated using the formula: Viability (%) = [(Adrug - Ablank) / (Acontrol - Ablank)] × 100%.
2.2.10. 3D Nanolive Imaging for Macrophage Polarization
RAW 264.7 cells were adjusted to a density of 5×10⁴ cells/mL in DMEM with 10% FBS and plated in a Nanolive-specific dish. Following a 24-hour adhesion period (37°C, 5% CO₂), the cells were stimulated with 30 ng/mL SA-SS-CPT for 24 hours. Morphological changes and cell state were subsequently visualized and analyzed with a Nanolive 3D Cell Explorer microscope.
2.2.11. RNA-Seq Analysis
RAW 264.7 cells were either untreated (Control) or treated with SA-SS-CPT for 24 h (Drug). Cell pellets, stored at -80°C, were sent for RNA sequencing (Shanghai Biochip Co.). DEGs were called using DESeq2 (R package) with criteria of |log2FC| ≥ 1 and P < 0.05. GO enrichment analysis for the DEGs was performed using a hypergeometric test to identify significantly enriched terms relative to the genomic background.
2.2.12. Immunofluorescence Analysis
After a 24-hour intervention of RAW 264.7 cells with SA-SS-CPT (7.5, 15, and 30 ng/mL), the cells on coverslips were processed for immunofluorescence. Briefly, cells were fixed with 4% PFA, permeabilized with 0.1% Triton X-100, and blocked with 5% BSA. Staining was performed using a primary antibody against γ-H2AX (overnight, 4°C) followed by a fluorescent secondary antibody (room temperature, in the dark). Imaging was conducted with a fluorescence microscope.
2.2.13. Detection of DNA Damage and the cGAS-STING Pathway
After reaching an appropriate confluence, RAW 264.7 cells were treated with SA-SS-CPT or CPT at concentrations of 7.5, 15, and 30 ng/mL for 24 hours. Subsequently, total protein was extracted from the cells for subsequent analysis. Equal amounts of proteins (40 μg/well) and protein marker were taken for SDS-PAGE electrophoresis and then transferred to a PVDF membrane. The membrane was blocked with 5% BSA at room temperature for 1 hour, and then incubated overnight on a shaker at 4°C with γ-H2AX, IRF-3, TBK-1, P-STING, STING, CD206, CD86, TNF-α, IL-1β monoclonal primary antibody (1:1000). After thorough washing with TBST, the membrane was incubated with secondary antibody (1:50,000) at room temperature in the dark for 1 hour. The ECL chemiluminescence method was used for color development. The Image J software was used to analyze the gray value of the target band, and β-tubulin was used as an internal reference for standardized quantification.
2.2.14. RT-PCR Analysis of Inflammatory Factors
Total mRNA from SA-SS-CPT-treated RAW 264.7 cells was isolated with TRIzol. After reverse transcription (PrimeScript™ Kit; 37°C, 15 min), qPCR was performed using gene-specific primers (Table 1, Ribobio) under standard cycling conditions (95°C for 10 min; 40 cycles of 95°C/15s and 60°C/60s). Gene expression (Arg-1, IL-1ra, CD163, iNOS, TNF-α, IL-6) was normalized to β-actin and calculated via the 2-ΔΔCT method.
| Primers | Sequences (5’------3’) | |
| Arg-1 | Forward: | CAGCACTGAGGAAAGCTGGT |
| Reverse: | CAGACCGTGGGTTCTTCACA | |
| IL-1ra | Forward: | TAAGCAACCACCTTGAGCCT |
| Reverse: | CCAGCAGATTTCCATCCCGA | |
| CD163 | Forward: | TGCTGTCACTAACGCTCCTG |
| Reverse: | CATTGCATGCCAGGTCATCG | |
| iNOS | Forward: | TGTCGCAGCTCCCTATCTTG |
| Reverse: | CATTGGCCAGCTGCTTTTGC | |
| TNF-α | Forward: | TGTCTCAGCCTCTTCTCATTCC |
| Reverse: | TGAGGGTCTGGGCCATAGAAC | |
| IL-6 | Forward: | TAGTCCTTCCTACCCCAATTTCC |
| Reverse: | TTGGTCCTTAGCCACTCCTTC |
2.2.15. Establishment of Tumor-Bearing Mouse Model
A tumor-bearing mouse model was established by subcutaneously injecting Hepa1-6 cells (1 × 10⁶) into the right posterior flank of BALB/c-nu/nu nude mice, which was designated as day 0. Seven days post-inoculation, once the model was successfully established, the mice were randomly divided into three groups (n=6): Con, CPT, and SA-SS-CPT. Treatments were administered via tail vein injection at a dose of 20 mg/kg. The administration continued until day 22, after which subsequent experiments were performed. Tumor volume was monitored and calculated using the formula: V = L×W²/2, where V represents the tumor volume, L is the longest diameter, and W is the shortest diameter. Additionally, tumor growth was monitored by bioluminescent imaging using an in vivo imaging system.
2.2.16. Hematoxylin and Eosin (H&E) Staining
5 μm paraffin sections were deparaffinized in graded ethanol (100%, 95%, 75%), stained with hematoxylin, rinsed, and dehydrated through an ascending ethanol series (75% to absolute). After clearing in xylene, sections were mounted with neutral balsam for imaging.
2.2.17. Ki67 Immunohistochemical Staining
Paraffin sections were deparaffinized in xylene and rehydrated. Frozen sections were air-dried and fixed with 4% PFA. All sections underwent antigen retrieval, endogenous peroxidase blockade (3% H₂O₂), and serum blocking. Incubation with anti-Ki67 primary antibody (4°C overnight) was followed by an HRP-conjugated secondary antibody and DAB development for microscopic examination.
2.2.18. Immunohistochemistry for CD86
Following deparaffinization in xylene and rehydration through an ethanol gradient, tissue sections were subjected to antigen retrieval. Endogenous peroxidases were blocked with 3% H₂O₂ (10-15 min, RT). After PBS washing, sections were blocked with 5%BSA and then incubated with an anti-CD86 primary antibody overnight at 4°C. After PBS washes, a secondary antibody was applied 60 min. Signal was visualized using DAB, and sections were examined microscopically.
2.2.19. Analysis of Liver Metastasis
A liver metastasis model was established by intrasplenic injection of 1 × 10⁶ Hepa1-6 cells into BALB/c-nu/nu nude mice (day 0). Pharmacological intervention began on day 4 post-inoculation. The animals were randomly assigned to three groups: a Control group administered normal saline, a CPT group (30 ng/mL), and an SA-SS-CPT group (30 ng/mL). All formulations were delivered intravenously at a dosage of 20 ng/kg daily for a 12-day period. Tumor progression was assessed non-invasively via fluorescence imaging. On day 16, mice were euthanized under pentobarbital anesthesia. Livers were excised to evaluate metastatic nodule formation, liver weight, and maximum tumor size. Body weights were recorded throughout the study. Liver sections were prepared for histopathological examination using H&E staining and for assessment of macrophage polarization via CD86 immunohistochemical staining.
2.2.20. SA-SS-CPT Enhances the Immunotherapeutic Efficacy of PD-L1 in Mice
A hepatocellular carcinoma model was established in male C57BL/6 mice by hydrodynamic tail vein injection of plasmid DNA (dissolved in sterile physiological saline). The plasmids (Sangon Biotech, Shanghai, China) included C-Myc (18 μg), sgP53 (18 μg), and SB13 (7.5 μg) per mouse, delivered in a volume equivalent to 10% of the body weight within 6-7 seconds. Starting on day 7, mice were administered PD-L1, SA-SS-CPT, or PD-L1 & SA-SS-CPT until day 22. On day 24, in vivo imaging was conducted, after which liver tissues were collected for analysis of liver weight, maximum tumor size, and CD8 immunohistochemistry.
2.3. Statistical Analysis
Data from three independent replicates are expressed as mean ± SD. GraphPad Prism 7 and SPSS 21.0 were used for statistical analysis. Inter-group comparisons were made by Student's t-test or one-way ANOVA, as appropriate. Repeated-measures ANOVA with Bonferroni correction was used for multi-timepoint comparisons, and Spearman's test was used for correlation analysis. A P-value < 0.05 was defined as statistically significant.
3. Results
This section may be divided by subheadings. It should provide a concise and precise description of the experimental results, their interpretation, as well as the experimental conclusions that can be drawn.
3.1. Synthesis of SA-SS-CPT
The compound SA-SS-CPT was obtained as a pale yellow solid (110 mg, 34.4% yield). 1H NMR (400 MHz, DMSO-d6) δ 8.72 (s, 1H), 8.21 – 8.12 (m, 2H), 7.89 (t, J = 7.6 Hz, 1H), 7.74 (t, J = 7.6 Hz, 1H), 7.10 (s, 1H), 5.53 (s, 1H), 5.31 (d, J = 14.1 Hz, 3H), 4.70 (s, 1H), 4.46 (s, 2H), 4.34 (td, J = 9.7, 3.5 Hz, 5H), 4.15 (s, 1H), 3.79 (s, 1H), 3.70 (d, J = 10.2 Hz, 1H), 3.61 (s, 4H), 3.11 – 2.93 (m, 3H), 2.89 – 2.72 (m, 2H), 2.68 (s, 1H), 2.55 (s, 1H), 2.33 (s, 1H), 2.26 – 2.04 (m, 3H), 1.87 (d, J = 2.5 Hz, 3H), 1.30 – 1.22 (m, 1H), 0.92 (t, J = 7.4 Hz, 3H) (Figure 1A). The molecular weight of SA-SS-CPT was 972.25, and it showed 971.25 in the negative mode, as shown in Figure 1B. Infrared spectroscopic analysis of SA-SS-CPT revealed characteristic functional group absorptions: a peak at 3440 cm-1 corresponding to the O-H stretching vibration of hydroxyl groups, 3298 cm-1 to the N-H stretching vibration of secondary amines, 2735 cm-1 to the C-H stretching vibration of methyl groups, 1749 cm-1 to the C=O stretching vibration of carbonyl groups, 1263 cm-1 to the C-N stretching vibration, and 976 cm-1 to the C=C-H bending vibration of alkenes, as shown in Figure 1C. The maximum UV absorption peaks of SA-SS-CPT were observed at 257 nm, 338 nm, and 370 nm. Among these, the peaks at 338 nm and 370 nm appeared as doublets, while only the peak at 257 nm was a singlet. Therefore, in subsequent experiments, the wavelength of 257 nm was selected as the maximum absorption wavelength for SA-SS-CPT, as indicated in Figure 1D. Intermediate compounds were characterized as exhibited in Figures S1–S5.
3.2. Characteristics of SA-SS-CPT Nanowires
The aqueous solution of SA-SS-CPT nanowires appeared pale yellow. TEM observations revealed filamentous structures, presenting as either short fibers or continuous filaments with a diameter of approximately 10 nm, as shown in Figure 2A. Dynamic light scattering (DLS) analysis indicated that the SA-SS-CPT nanowires had an average hydrodynamic size of 110.4 ± 24.3 nm, a polydispersity index (PDI) of 0.52 ± 0.09, and an average zeta potential of -31.4 ± 1.6 mV, as shown in Figure 2B–D. The stability of the SA-SS-CPT nanowires was monitored over a storage period of 30 days. Although the particle size gradually increased with time, the overall size remained below 150 nm, which is consistent with nanoscale characteristics, as shown in Figure 2E. Hemolysis assays showed that the hemolysis rate of SA-SS-CPT at a concentration of 1000 μg/mL was significantly lower than 5%, indicating its safety for tail vein administration, as shown in Figure 2F,G. As demonstrated in Figure 2H,I, in vitro release studies of SA-SS-CPT revealed that upon treatment with 10 μM GSH, the disulfide bond was cleaved, leading to CPT release. The amount of released CPT gradually increased over time, reaching 100% at 135 minutes, while the residual SA-SS-CPT exhibited an opposite, decreasing trend. Pharmacokinetic results in nude mice demonstrated that after administration of SA-SS-CPT, the relative SA-SS-CPT intensity in serum detected at different time points gradually decreased over time and stabilized after 12 hours, as shown in Figure 2J.
3.3. Targeting Evaluation of SA-SS-CPT Nanowires
Siglec-E, a receptor that recognizes sialic acid groups, can regulate various immune responses. Studies have shown that the expression level of Siglec-E significantly increases during the differentiation of monocytes into macrophages[22]. After co-culturing Hepa1-6 cells with RAW246.7 cells, the fluorescence expression of Siglec-E in RAW246.7 cells was significantly enhanced, with a notable difference in fluorescence intensity, as shown in Figure 3A. Similarly, the protein expression of Siglec-E in RAW246.7 cells also increased after co-culture, as shown in Figure S6. The highly expressed Siglec-E in RAW246.7 cells can specifically recognize sialic acid-modified SA-SS-CPT nanowires. After encapsulating DiO dye with SA-SS-CPT nanowires (SA-SS-CPT@DiO), the nanowires were administered to both RAW246.7 cells and co-cultured RAW246.7 cells for 4 hours. Confocal imaging revealed that the uptake of SA-SS-CPT@DiO was significantly higher in co-cultured RAW246.7 cells compared to the control group (Figure 3B).
To evaluate the in vivo tumor targeting ability of SA-SS-CPT, a subcutaneous tumor model was first established in nude mice. Hepa1-6 cells were suspended and injected subcutaneously into 5-week-old nude mice. After successful modeling, SA-SS-CPT encapsulating DiR (SA-SS-CPT@DiR) was administered via tail vein injection in the 7th week (Figure 3C). Initially, SA-SS-CPT@DiR primarily accumulated in the liver of the nude mice. Over time, after 8 hours, SA-SS-CPT@DiR gradually accumulated at the tumor site, reaching its peak at 24 hours. The distribution of SA-SS-CPT@DiR in various organs of the nude mice was examined, and it was observed that SA-SS-CPT@DiR mainly accumulated in the liver and tumor (Figure 3D–F).
To determine the optimal concentration of SA-SS-CPT for influencing RAW246.7 cells polarization while ensuring cell survival, RAW246.7 cells were incubated with SA-SS-CPT for 24 hours, and cell viability was measured. The results showed that at a concentration of 1.95 μg/mL, the cell survival rate was 31.9 ± 7.3%. However, at a concentration of 30 ng/mL, the cell survival rate was 91.3 ± 9.8%, and at 15 ng/mL, it was 98.2 ± 8.3%, as shown in Figure 3G. Therefore, the optimal concentration of SA-SS-CPT for subsequent experiments was determined to be 30 ng/mL. In addition, we evaluated the toxicity of SA-SS-CPT to the heart, liver, spleen, lung and kidney of mice in vivo. The results showed that SA-SS-CPT was non-toxic to the heart, liver, spleen, lung and kidney of mice (Figure S7).
3.4. SA-SS-CTP Drived DNA Damage-Dependent M1 Macrophage Polarization
We employed 3D nanolive imaging to observe the polarization state of RAW246.7 cells 24 hours after SA-SS-CPT intervention. Unpolarized RAW246.7 cells typically exhibited a regular spherical or elliptical morphology with a relatively smooth surface. They displayed fewer and shorter pseudopodia (cellular protrusions), and intracellular organelles such as lysosomes and mitochondria were evenly distributed without obvious polarity. However, after 24 hours of SA-SS-CPT treatment, the RAW246.7 cells transitioned to a pro-inflammatory (M1) phenotype which generally showed an irregular, flattened morphology with increased spreading area, more filopodia and lamellipodia at the periphery, and distinct membrane ruffling structures in 3D imaging (Figure 3H).
To investigate the mechanism by which SA-SS-CPT administration promoted polarization of RAW246.7 cells, RNA sequencing was carried out using total RNA extracted from RAW246.7 cells treated with SA-SS-CPT for 24 hours. Impressive alternations in the gene expression profiles of RAW246.7 cells were detected (Figure 4A,B). Significantly different expressed genes were filtered and enriched in the GO signaling pathway. Notably, the top 15 signaling pathways were listed and we found that the enriched gene set was associated with signal transduction in response to DNA damage and T-cell immunoregulation (Figure 4C,D). As γ-H2AX is a key marker of DNA damage, we measured its expression in RAW246.7 cells under different concentrations. The IF showed that RAW246.7 cells treated with increasing concentrations of SA-SS-CPT resulted in a concentration-dependent rise in γ-H2AX expression (Figure 4E). Consistent results were also observed in WB (Figure 4F).
Although SA-SS-CPT induces DNA damage in RAW246.7 cells, the underlying pathway through which DNA damage influences polarization remained unclear. To investigate this, we further examined the status of the cGAS-STING pathway following DNA damage by measuring the expression of key proteins including IRF-3, TBK-1, P-STING, and STING. Compared to the control group, both the CPT and SA-SS-CPT groups showed significantly enhanced expression of IRF-3, TBK-1, and P-STING. Notably, the SA-SS-CPT group exhibited the strongest upregulation of these proteins relative to the CPT group, while STING expression remained consistent across all three groups. These results indicate that SA-SS-CPT treatment activates the cGAS-STING pathway in RAW246.7 cells, as shown in Figure 4G. After treatment with 30 ng/mL SA-SS-CPT, RAW246.7 cells displayed a shift toward M1 polarization, characterized by significantly reduced protein expression of CD206 and increased expression of the M1-related inflammatory cytokines TNF-α and IL-1β. Meanwhile, the M1-related marker CD86 was also elevated, with statistically significant differences among the groups, as shown in Figure 4H. To further evaluate polarization at the transcriptional level, RT-PCR was performed to measure marker gene expression in RAW246.7 cells treated with Con, CPT, or SA-SS-CPT. The results revealed that, compared to the normal and CPT groups, the SA-SS-CPT group showed significantly increased mRNA expression of M1 markers (iNOS, TNF-α, and IL-6) and decreased expression of M2 markers (Arg1, IL-1ra, and CD163) (Figure 4I). In summary, SA-SS-CPT triggers DNA damage in RAW246.7 cells, activating the cGAS-STING pathway and driving M1 polarization.
3.5. Tumor Proliferation Evaluation
Seven days after subcutaneous injection of Hepa1-6 cells into nude mice, the model was successfully established. The mice were then administered 1.0 ng/kg SA-SS-CPT via tail vein injection for 15 consecutive days, as shown in Figure 5A. Tumors were collected from each group and compared in size. The gross image of tumor tissues in the indicated group exhibited that SA-SS-CPT was the most effective in inhibiting tumor growth (Figure 5B). In addition, liver weight and bioluminescence imaging showed that the proliferation of tumor was slowed down significantly in SA-SS-CPT treated mice compared to the mice model group and CPT group (Figure 5C,D). Similar results were observed that the tumor grew curve in mice treated with SA-SS-CPT were obviously more fewer and smaller than that in model group and CPT group (Figure 5E).
Moreover, H&E staining and Ki67 staining indicated that tumor sections from model and CPT group mice presented stronger Ki67 staining than those from SA-SS-CPT group (Figure 5F,G). Furthermore, the M1-modulating role of SA-SS-CPT was further confirmed by IHC staining of CD86 (M1) at tumor tissues in the indicated groups (Figure 5F–H). CD86, as a co-stimulatory molecule, is primarily expressed on antigen-presenting cells such as macrophages and provides essential co-stimulatory signals for T cell activation and survival [23]. IHC staining of CD86 showed very low expression in the control group, with almost no observable reddish-brown spots. However, after intervention with CPT and SA-SS-CPT, the number of reddish-brown spots gradually increased, particularly in the SA-SS-CPT group. This suggested that SA-SS-CPT promoted the polarization state of macrophages.
3.6. Evaluation of Tumor Metastasis
To further investigate the effect of SA-SS-CPT on tumor metastasis in vivo, we established a mice liver metastasis model by intrasplenic injection of Hepa1-6 cells. Four days after the injection, interventions with CPT or SA-SS-CPT were administered via the tail vein every other day. Liver tissues were collected from each group on day 16, as shown in Figure 6A. Bioluminescence imaging revealed that the control group had the largest tumor burden with the the highest bioluminescence intensity, followed by the CPT group. In contrast, the SA-SS-CPT group showed significantly reduced bioluminescence intensity and area (Figure 6B). The mice in the SA-SS-CPT group exhibited less and smaller liver metastatic nodules than the control group and CPT group (Figure 6C). Consistent results were observed that SA-SS-CPT treatment resulted in less liver metastatic burden in term of liver weight and tumor maximum size (Figure 6D). We also monitored and analyzed the body weight changes of the mice across all groups. The results showed that from day0 to day3, the body weight of all groups exhibited an increasing trend. However, from day6 to day15, the body weight gradually decreased over time, with the less pronounced reduction observed in the SA-SS-CPT group (Figure 6E). The presence of the liver metastatic nodules was confirmed by H&E staining (Figure 6F). Furthermore, compared with the control group, CPT and SA-SS-CPT application resulted in stronger CD86 staining in liver tumor sections, particularly in the SA-SS-CPT group. Taken together, our findings indicated that SA-SS-CPT could suppressed HCC metastasis and promoted M1-macrophage infiltration in tumor tissues.
3.7. SA-SS-CPT Enhances the Immunotherapeutic Efficacy of PD-L1 in Mice
The above observation provided evidence that SA-SS-CPT promoted the repolarization of TAMs from an M2 to an M1 phenotype. Hence, we investigated the therapeutic efficacy of combining SA-SS-CPT with anti-PD-1 therapy in mouse model of HCC. Following the successful establishment of hydrodynamic transfection HCC model, the mice were randomly assigned into four groups: control group, SA-SS-CPT group, anti-PD-1 group and SA-SS-CPT & anti-PD-1 group (Figure 7A). After treatment, the bioluminescence imaging showed that the combination therapy group mice suffered from the least tumor burden compared with mono-therapy groups (Figure 7B). Furthermore, we analyzed the number of HCC nodules on the liver surface as the evaluation standard, we found that the combination therapy group resulted in a lower liver tissue weight and a smaller maximum tumor nodule diameter in mice compared to the monotherapy groups, which were also reduced in the monotherapy groups relative to the control group (Figure 7C,D). We performed IHC staining on HCC tissues harvested from mice that received the respective treatments, and we found that compared to monotherapy groups, SA-SS-CPT & anti-PD-1 treatment resulted in an increased tumor infiltration of CD8+T cells (Figure 7E). Consistently, CD8+T cells in tumor tissues of mice treated with SA-SS-CPT & anti-PD-1 were approximately two times higher than those of mice received monotherapy (Figure 7F). Taken together, the data above indicated that SA-SS-CPT administration greatly improved the efficacy of checkpoint blockade therapy.
4. Discussion
Camptothecin is an important anticancer drug whose primary mechanism of action involves inhibiting the activity of topoisomerase I, thereby interfering with DNA replication and transcription and inducing tumor cell apoptosis. However, the clinical application of this compound is severely limited due to its poor water solubility and high toxicity. The low water solubility of camptothecin leads to insufficient bioavailability, which compromises its anticancer efficacy [24,25]. Furthermore, its active lactone ring is unstable under physiological conditions and prone to ring-opening reactions, resulting in drug deactivation [24]. To overcome these challenges, various nanocarrier systems have been developed to improve the solubility, stability, and controlled release behavior of camptothecin. For instance, cyclodextrin-based carriers can significantly enhance the solubility and stability of camptothecin through inclusion complexation [26]. Systems such as polymer microcapsules and nanomicelles contribute to improving its pharmacokinetic properties and targeting capabilities [27,28]. In recent years, smart responsive nanocarriers have garnered increasing attention due to their ability to trigger drug release under specific physiological conditions, thereby enhancing targeting and therapeutic efficacy [29,30]. Based on this, the present study designed an intelligent nanofilament system (SA-SS-CPT) responsive to GSH. These nanowires exhibit a filamentous morphology under transmission electron microscopy, with characteristics such as small particle size, high stability, and low hemolytic activity. This system not only effectively reduces the toxicity of camptothecin but also demonstrates good feasibility for in vivo applications.
SA-SS-CPT utilizes SA as a targeting ligand to achieve specific targeting of TAMs. Sialic acid can specifically bind to the Siglec-E receptor on the macrophage surface. This binding not only promotes high cellular uptake of the nanocarrier system but also competitively inhibits the immunosuppressive functions associated with M2 polarization, thereby reducing tumor immune evasion. The unique feature of the SA-SS-CPT nanowires designed in this study lies in their structural incorporation of sialic acid, which effectively targets Siglec-E and facilitates efficient internalization by macrophages via this pathway, preventing tumor immune evasion. Both confocal microscopy and flow cytometry results confirmed that SA-SS-CPT can specifically accumulate in TAMs.
On the other hand, the disulfide bond (SS) structure in SA-SS-CPT confers GSH-responsive drug release capability. Under the high intracellular GSH concentration in TAMs, the disulfide bond undergoes reductive cleavage, leading to the release of CPT. In recent years, various GSH-responsive nanodrug delivery systems have been developed to achieve precise drug release in tumors and significantly enhance therapeutic efficacy [31,32,33,34]. However, the structure connecting sialic acid and camptothecin via a disulfide bond and self-assembling into nanowires has not been reported previously. In vitro experiments demonstrated that these nanowires can release CPT upon GSH triggering within TAMs. In vivo pharmacokinetic studies showed that the relative intensity of SA-SS-CPT in the serum of nude mice gradually decreased over time after administration and stabilized after 12 hours. These results provide a basis for understanding the in vivo metabolic behavior of the drug and for developing rational dosing regimens.
To investigate the immune response mechanisms of macrophages following SA-SS-CPT intervention, transcriptome sequencing analysis revealed that differentially expressed genes in macrophages treated with SA-SS-CPT were enriched in pathways related to MHC class II protein complex, DNA damage, and T-cell immunoregulation. We observed an increase in γ-H2AX protein expression in macrophages after SA-SS-CPT treatment. As a well-established DNA damage marker, γ-H2AX is involved in the early recognition of DNA damage [35]. These results demonstrate that SA-SS-CPT significantly upregulates γ-H2AX levels in macrophages, induces DNA damage in TAMs, and consequently promotes their immunostimulatory functions.
In this study, SA-SS-CPT-induced DNA damage was found to activate the cGAS-STING pathway, as evidenced by increased expression of key pathway proteins including IRF-3, TBK-1, and phospho-STING. This indicates a close relationship between DNA damage and activation of the cGAS-STING pathway. As a DNA sensor, cGAS (cyclic GMP-AMP synthase) triggers innate immune responses by producing the second messenger cGAMP, which in turn binds to and activates STING (stimulator of interferon genes) [36]. Activation of the cGAS-STING pathway is not only associated with inflammatory responses but also closely linked to cellular senescence and cancer development [36]. Further analysis revealed that SA-SS-CPT treatment significantly upregulated both protein and gene expression of iNOS, TNF-α, and IL-6 in TAMs, indicating enhanced inflammatory responses. This increased inflammation subsequently contributed to further activation of the cGAS-STING pathway. Activation of this pathway plays a crucial role in remodeling the tumor microenvironment. As a key receptor for sensing both endogenous and exogenous DNA, the cGAS-STING pathway activates innate immunity and exerts important functions in antitumor immunity [37]. While multiple studies have shown that DNA damage can induce apoptosis via the cGAS-STING pathway [38], the SA-SS-CPT treatment dose used in this study (30 ng/mL) induced DNA damage in TAMs that was insufficient to trigger apoptosis, but instead promoted M1 polarization and initiated immune activation. Experimental results confirmed that activation of the cGAS-STING pathway following DNA damage in SA-SS-CPT-treated TAMs enhanced the expression of IRF-3, TBK-1, and phospho-STING, thereby amplifying inflammatory and antitumor immune responses and suppressing tumor immune evasion. These findings are consistent with recent studies highlighting the role of the cGAS-STING pathway in cancer immunotherapy [39,40].
To investigate the polarization of TAMs following SA-SS-CPT intervention, we examined TAM polarization markers and found that SA-SS-CPT promotes a shift toward M1 polarization. The interaction between M1-polarized macrophages and T cells plays a critical role in enhancing the efficacy of PD-L1 blockade therapy. This study demonstrates that the combination of PD-L1 blockade and SA-SS-CPT not only acts through the activation of CD8⁺T cells but also mediates antitumor effects by remodeling the innate immune landscape within the tumor microenvironment, specifically by inducing M1-like macrophage polarization. These findings are consistent with previous studies confirming that promoting M1 polarization can potentiate the effectiveness of PD-L1 blockade therapy [41,42,43].
The antitumor efficacy of SA-SS-CPT was further validated in vivo. In a nude mouse tumor model, administration of 30 ng/mL SA-SS-CPT via tail vein injection for 14 days significantly reduced tumor weight and suppressed tumor cell proliferation, demonstrating the potent inhibitory effect of SA-SS-CPT on tumor growth. Furthermore, in the evaluation of tumor metastasis, SA-SS-CPT treatment markedly decreased the number of metastatic tumor cells in liver tissues. Concurrent analysis in the animal model confirmed that SA-SS-CPT promotes M1 polarization of macrophages.
In summary, this study successfully developed a multifunctional nanoplatform that intelligently integrates targeted drug delivery and immunomodulation. It not only achieves efficient tumor killing but also activates antitumor immune responses. These findings provide a novel strategy and experimental foundation for overcoming the clinical limitations of camptothecin and developing new combination immunotherapy approaches.
5. Conclusions
This study comprehensively investigated the characteristics and mechanisms of SA-SS-CPT nanowires in tumor immunotherapy. The results demonstrate that SA-SS-CPT nanowires not only exhibit favorable nanoscale properties, stability, and low toxicity, enabling intelligent GSH-responsive drug release, but also specifically recognize Siglec-E on macrophages, achieving targeted delivery. Moreover, SA-SS-CPT induces DNA damage in macrophages, activates the cGAS-STING pathway, promotes M1 polarization of macrophages, and thereby enhances antitumor immune responses.
Supplementary Materials
The following supporting information can be downloaded at the website of this paper posted on Preprints.org.
Author Contributions
Sheng Tai conceived the research and designed the research approach and supervised the study. Congyi Zhang and Haotian Wu performed the main experiments; Other authors, such as Xiaotong Chen, Wenze Yin, Shizhuan Huang, Dixiang Wen, Xueting Song, and Xiaoyan Xu participated in some related experiment. Congyi Zhang and Sheng Tai wrote the manuscript with input from all the authors.
Funding
This work was supported by the National Natural Science Foundation of China (82373111) and China Postdoctoral Science Foundation (2025T180212).
Data Availability Statement
The datasets used and/or analyzed during the current study are available from the corresponding author upon reasonable request.
Acknowledgments
We thank the National Natural Science Foundation of China (82373111) and China Postdoctoral Science Foundation (2025T180212).
Conflicts of Interest
The authors declare no conflict of interest.
References
- Zhang, C.A.O.; Cheng, G.Y.; Zhang, S.; et al. Changing epidemiology of hepatocellular carcinoma in Asia. Liver Int. 2022, 42, 2029–2041. [Google Scholar] [CrossRef] [PubMed]
- Llovet, J.M.; Pinyol, R.; Yarchoan, M.; Singal, A.G.; Marron, T.U.; Schwartz, M.; Pikarsky, E.; Kudo, M.; Finn, R.S. Adjuvant and neoadjuvant immunotherapies in hepatocellular carcinoma. Nat Rev Clin Oncol. 2024, 21, 294–311. [Google Scholar] [CrossRef] [PubMed]
- Giulia, G.; Pierluigi, P.; Giuseppina, A.; et al. Modulating Tumor-Associated Macrophage Polarization by Synthetic and Natural PPARγ Ligands as a Potential Target in Breast Cancer. CELLS 2020, 5, 2. [Google Scholar]
- Chen, G.; Fu, Y.; Guo, E.S.; et al. BRD4 Inhibition by AZD5153 Promotes Antitumor Immunity via Depolarizing M2 Macrophages. FRONTIERS IN IMMUNOLOGY 2020, 5, 9. [Google Scholar]
- Enyong, D.; Leng, H.; Jiao, L.; et al. Autophagy-dependent ferroptosis drives tumor-associated macrophage polarization via release and uptake of oncogenic KRAS protein. AUTOPHAGY 2020, 14, 3. [Google Scholar]
- Qian, C.; Lu, J.; Man, L.S.; et al. RIPK3 Orchestrates Fatty Acid Metabolism in Tumor-Associated Macrophages and Hepatocarcinogenesis. CANCER IMMUNOLOGY RESEARCH 2020, 8, 2. [Google Scholar]
- Zhang, J.; Zhou, X.; Hao, H. Macrophage phenotype-switching in cancer. European Journal of Pharmacology 2022, 931, 175229. [Google Scholar] [CrossRef]
- Visser, E.A.; Moons, S.J.; Timmermans, S.; et al. Sialic acid O-acetylation: From biosynthesis to roles in health and disease. J Biol Chem. 2021, 297, 100906. [Google Scholar] [CrossRef]
- Zhang, X.; Dou, P.; Akhtar, M.L.; et al. NEU4 inhibits motility of HCC cells by cleaving sialic acids on CD44. Oncogene 2021, 40, 5427–5440. [Google Scholar] [CrossRef]
- Tang, X.; Sui, D.; Liu, M.; et al. Targeted delivery of zoledronic acid through the sialic acid-Siglec axis for killing and reversal of M2 phenotypic tumor-associated macrophages-A promising cancer immunotherapy. International Journal of Pharmaceutics 2020, 590, 119929. [Google Scholar] [CrossRef]
- Häuselmann, I.; Borsig, L. Altered tumor-cell glycosylation promotes metastasis. Front Oncol. 2014, 4, 28. [Google Scholar] [CrossRef]
- Läubli, H.; Kawanishi, K.; George Vazhappilly, C.; et al. Tools to study and target the Siglec-sialic acid axis in cancer. FEBS J. 2021, 288, 6206–6225. [Google Scholar] [CrossRef]
- Xiao, N.; Zhu, X.; Li, K.; et al. Blocking siglec-10(hi) tumor-associated macrophages improves anti-tumor immunity and enhances immunotherapy for hepatocellular carcinoma. Exp Hematol Oncol. 2021, 10, 36. [Google Scholar] [CrossRef]
- Dusoswa, S.A.; Horrevorts, S.K.; Ambrosini, M.; et al. Glycan modification of glioblastoma-derived extracellular vesicles enhances receptor-mediated targeting of dendritic cells. J Extracell Vesicles 2019, 8, 1648995. [Google Scholar] [CrossRef] [PubMed]
- Adams, O.J.; Stanczak, M.A.; Von Gunten, S.; et al. Targeting sialic acid-Siglec interactions to reverse immune suppression in cancer. Glycobiology 2018, 28, 640–647. [Google Scholar] [CrossRef] [PubMed]
- Boudjedir, A.; Kraim, K.; Saihi, Y.; et al. A computational molecular docking study of camptothecin similars as inhibitors for topoisomerase 1. Structural Chemistry 2021, 32, 689–97. [Google Scholar] [CrossRef]
- Tomicic, M.T.; Kaina, B. Topoisomerase degradation, DSB repair, p53 and IAPs in cancer cell resistance to camptothecin-like topoisomerase I inhibitors. Biochim Biophys Acta 2013, 1835, 11–27. [Google Scholar] [CrossRef]
- Chiou, W.F.; Chou, C.J.; Chen, C.F. Camptothecin suppresses nitric oxide biosynthesis in RAW 264.7 macrophages. Life Sciences 2001, 69, 625–635. [Google Scholar] [CrossRef]
- Mollica, A.; Stefanucci, A.; Fau-Feliciani, F.; Cacciatore, I.; et al. Delivery methods of camptothecin and its hydrosoluble analogue irinotecan for treatment of colorectal cancer. Curr Drug Deliv. 2012, 9, 122–31. [Google Scholar] [CrossRef]
- Bansal, A.A.-O.; Simon, M.A.-O.X. Glutathione metabolism in cancer progression and treatment resistance. J Cell Biol. 2018, 217, 2291–2298. [Google Scholar] [CrossRef]
- MA, Z.; GAO, X.; RAZA, F.A.-O.; et al. Design of GSH-Responsive Curcumin Nanomicelles for Oesophageal Cancer Therapy. Pharmaceutics 2022, 14, 1802. [Google Scholar] [CrossRef]
- Hiroshi, H.; Toru, S.; Shinji, I.; et al. Constitutively expressed Siglec-E inhibits LPS-induced CCR7, but enhances IL-4-induced CD200R expression in human macrophages. BIOSCIENCE BIOTECHNOLOGY AND BIOCHEMISTRY 2016, 1, 3. [Google Scholar]
- Rifeng, C.; Di, Y.; Linxia, S. Overexpression of CD86 enhances the ability of THP-1 macrophages to defend against Talaromyces marneffei. IMMUNITY INFLAMMATION AND DISEASE 2022, 2, 7. [Google Scholar]
- Schmidt Keith, T.; Peer Cody, J.; Huitema Alwin, D.R.; et al. Measurement of NLG207 (formerly CRLX101) nanoparticle-bound and released camptothecin in human plasma. JOURNAL OF PHARMACEUTICAL AND BIOMEDICAL ANALYSIS 2020, 3, 1. [Google Scholar] [CrossRef] [PubMed]
- Nasim, A.; Mehriar, A.; Faramarz, M. Molecular Insight into the Interaction between Camptothecin and Acyclic Cucurbit[4]urils as Efficient Nanocontainers in Comparison with Cucurbit[7]uril: Molecular Docking and Molecular Dynamics Simulation. JOURNAL OF CHEMICAL INFORMATION AND MODELING 2020, 5, 3. [Google Scholar]
- Diana, C.; Laura, F.; Nuno, R.F. Cyclodextrin-based delivery systems for in vivo-tested anticancer therapies. DRUG DELIVERY AND TRANSLATIONAL RESEARCH 2020, 5, 5. [Google Scholar]
- Jie, C.; Xiaoheng, F.; Shangcong, H. Novel polymeric micelles as enzyme-sensitive nuclear-targeted dual-functional drug delivery vehicles for enhanced 9-nitro-20(S)-camptothecin delivery and antitumor efficacy. NANOSCALE 2020, 5, 1. [Google Scholar]
- Brian, K.W.; Prud'homme, R.K. Encapsulation and Controlled Release of a Camptothecin Prodrug from Nanocarriers and Microgels: Tuning Release Rate with Nanocarrier Excipient Composition. MOLECULAR PHARMACEUTICS 2021, 4, 5. [Google Scholar]
- Bing, X.; Mengmeng, Y.; Fei, Z.; et al. Prostate-Specific Membrane Antigen and Esterase Dual Responsive Camptothecin-Oligopeptide Self-Assembled Nanoparticles for Efficient Anticancer Drug Delivery. INTERNATIONAL JOURNAL OF NANOMEDICINE 2021, 6, 5. [Google Scholar]
- Avelino, C.; Pablo, B.; Eva, R.-B. Silica-Based Stimuli-Responsive Systems for Antitumor Drug Delivery and Controlled Release. PHARMACEUTICS 2022, 5, 5. [Google Scholar]
- Xiaoqing, Z.; Xiaomei, R.; Jiayin, T.; et al. Hyaluronic acid reduction-sensitive polymeric micelles achieving co-delivery of tumor-targeting paclitaxel/apatinib effectively reverse cancer multidrug resistance. In DRUG DELIVERY; 2020. [Google Scholar]
- Preeti, K.; Milan, P.; Himanshu, B.; et al. Chlorin e6 Conjugated Methoxy-Poly(Ethylene Glycol)-Poly(D,L-Lactide) Glutathione Sensitive Micelles for Photodynamic Therapy. PHARMACEUTICAL RESEARCH 2020, 4, 3. [Google Scholar]
- Roshni, I.; Tam, N.; Dona, P.; et al. Glutathione-responsive biodegradable polyurethane nanoparticles for lung cancer treatment. JOURNAL OF CONTROLLED RELEASE 2020, 11, 5. [Google Scholar]
- Ying, P.; Youqing, S.; Jianbin, T.; et al. Glutathione-Specific and Intracellularly Labile Polymeric Nanocarrier for Efficient and Safe Cancer Gene Delivery. ACS APPLIED MATERIALS & INTERFACES 2020, 8, 2. [Google Scholar]
- Hyukjin, C.; Julie M, L.; Henghong, L.; et al. Wip1 directly dephosphorylates gamma-H2AX and attenuates the DNA damage response. CANCER RESEARCH 2010, 16, 6. [Google Scholar]
- Tuo, L.; Zhijian, J.C. The cGAS-cGAMP-STING pathway connects DNA damage to inflammation, senescence, and cancer. JOURNAL OF EXPERIMENTAL MEDICINE 2018, 10, 6. [Google Scholar]
- Rong, S.; Disheng, L.; Xiaoning, W.; et al. DNA Damage and Activation of cGAS/STING Pathway Induce Tumor Microenvironment Remodeling. FRONTIERS IN CELL AND DEVELOPMENTAL BIOLOGY 2022, 4, 3. [Google Scholar]
- Can, L.; Weiwei, L.; Fang, W.; et al. DNA damage-triggered activation of cGAS-STING pathway induces apoptosis in human keratinocyte HaCaT cells. MOLECULAR IMMUNOLOGY 2021, 3. [Google Scholar]
- Boyi, Y.; Xuanyi, L.; Xianglong, F.; et al. Gadolinium Oxide Nanoparticles Reinforce the Fractionated Radiotherapy-Induced Immune Response in Tri-Negative Breast Cancer via cGAS-STING Pathway. INTERNATIONAL JOURNAL OF NANOMEDICINE 2023, 6, 5. [Google Scholar]
- Ming, T.; Shasha, Y.; Hongliang, Z.; et al. The P286R mutation of DNA polymerase ε activates cancer-cell-intrinsic immunity and suppresses endometrial tumorigenesis via the cGAS-STING pathway. CELL DEATH & DISEASE 2024, 9, 6. [Google Scholar]
- Ganesh, R.; Khatri, L.; Martina, O.; et al. Anti-PD-1 Induces M1 Polarization in the Glioma Microenvironment and Exerts Therapeutic Efficacy in the Absence of CD8 Cytotoxic T Cells. CLINICAL CANCER RESEARCH 2020, 10, 2. [Google Scholar]
- Lin, X.; Jiang, L.; JunYan, L.; et al. Methionine restriction promotes the polarization of macrophages towards M1 and the immunotherapy effect of PD-L1/PD-1 blockades by inhibiting the secretion of MIF by gastric carcinoma cells. TRANSLATIONAL ONCOLOGY 2024, 4, 1. [Google Scholar]
- Lili, H.; Jingbo, Y.; Jinjin, Z.; et al. PD-L1 in melanoma and extracellular vesicles promotes local and regional immune suppression through M2-like macrophage polarization. AMERICAN JOURNAL OF PATHOLOGY 2024, 3, 6. [Google Scholar]
Scheme 1.
Mechanism of camptothecin nanowires remodeling tumor-associated macrophage polarization via the cGAS-STING signaling pathway to promote anti-tumor immunity.
Scheme 1.
Mechanism of camptothecin nanowires remodeling tumor-associated macrophage polarization via the cGAS-STING signaling pathway to promote anti-tumor immunity.

Figure 1.
1H NMR (400 MHz, DMSO-d6) of SA-SS-CPT. B: MS spectra of SA-SS-CPT; C: Infrared spectroscopy of SA-SS-CPT; D: Ultraviolet absorption spectrum of SA-SS-CPT.
Figure 1.
1H NMR (400 MHz, DMSO-d6) of SA-SS-CPT. B: MS spectra of SA-SS-CPT; C: Infrared spectroscopy of SA-SS-CPT; D: Ultraviolet absorption spectrum of SA-SS-CPT.

Figure 2.
A: Cross image and morphology of SA-SS-CPT nanowires observed at different magnifications; B: Zeta potential (mV) of SA-SS-CPT nanowires; C: Size distribution by intensity (%) of SA-SS-CPT nanowires; D: Statistical analysis of the mean particle size and zeta potential of SA-SS-CPT nanowires; E: 30-day stability of SA-SS-CPT nanowires; F: Gross image of hemolysis; G: Hemolysis (%) of SA-SS-CPT; H: The mechanism of CPT release triggered by GSH; I: The CPT release profiles of SA-SS-CPT in PBS and in the presence of GSH (10 μM); J: The kinetics of CPT-SS-SA in the nude mice.

Figure 3.
A: Fluorescence expression and mean fluorescence intensity of Siglec-E, comparison between two groups, **P<0.01; B: In vitro cell uptake and representative images of SA-SS-CPT@DiO, and mean fluorescence intensity, comparison between two groups, **P<0.01; C: Schematic diagram of the subcutaneous tumor model in nude mice and SA-SS-CPT@DiR intervention; D-F: In vivo fluorescence images and semiquantitative study of excised organs and tumors at 36 h post-injection; G: Cell viability (%) of SA-SS-CPT nanowires; H: 3D nanolive image of Macrophage morphology.

Figure 4.
A: Volcano plot of differential genes; B: Heat map representing the significantly regulated genes detected in RNA-seq analysis of control and SA-SS-CPT and gene expressions were normalized with row Z-score; C: KEGG pathway enrichment analysis in macrophages compared with macrophages treated with SA-SS-CPT for 24 hours; (D) GSEA of regulated genes in macrophages and the SA-SS-CPT group. Signal transduction in response to DNA damage, **P<0.01, ES=0.671, NES=1.762, and regulation of T-cell mediated immunity, **P<0.01, ES=0.537, NES=1.525; E: Fluorescence imaging of γ-H2AX; F: Western blot band images and relative gray-scale statistical graph of γ-H2AX protein expression, ***P<0.001; G: Western blot band images of IRF-3, TBK-1, P-STING, STING expression and relative protein gray-scale statistical graph in three groups, *P<0.05, **P<0.01, ***P<0.001; H: Western blot band images of CD206, CD86, TNF-α, IL-1β expression and relative gray-scale statistical graph in three groups, *P<0.05, **P<0.01, ***P<0.001; I: Relative mRNA expression of Arg-1, IL-1ra, CD163, iNOS, TNF-α, IL-6 in three groups, *P<0.05, ***P<0.001.

Figure 5.
A: Schematic illustration of the establishment of the animal model and treatment schedules; B: Tumor gross image; C: Tumor weight (g); D: Tumor volume (mm3); E: Tumor-bearing imaging; F: H&E staining, Ki67 staining, and CD86 staining; G: Ki67 positive tumor cells (%); H: Relative CD86 expression. Comparison between two groups, *P<0.05, **P<0.01, ***P<0.001, ****P<0.0001. Data represent mean ± standard deviation (SD) from n independent experiments (n = 3).

Figure 6.
A: Schematic showing the experimental design for the indicated group; B:Tumor-bearing imaging; C: Liver gross images; D: Liver weight (g), tumor max size (mm), and photo counts; E: Body weight (g); F: H&E staining and CD86 staining, and relative CD86 expression. Comparison between two groups, *P<0.05, **P<0.01, ***P<0.001, ****P<0.0001. Data represent mean ± standard deviation (SD) from n independent experiments (n = 3).

Figure 7.
A: The simplified experimental scheme for B-E; B: Tumor-bearing imaging; C: Gross images; D:Liver weights (g), tumor max size (mm) and photo counts; E: CD8 cells staining; F: Flow cytometry and quantification of the portions of CD8 and CD4 population in macrophages.
Figure 7.
A: The simplified experimental scheme for B-E; B: Tumor-bearing imaging; C: Gross images; D:Liver weights (g), tumor max size (mm) and photo counts; E: CD8 cells staining; F: Flow cytometry and quantification of the portions of CD8 and CD4 population in macrophages.

Disclaimer/Publisher’s Note: The statements, opinions and data contained in all publications are solely those of the individual author(s) and contributor(s) and not of MDPI and/or the editor(s). MDPI and/or the editor(s) disclaim responsibility for any injury to people or property resulting from any ideas, methods, instructions or products referred to in the content. |
© 2026 by the authors. Licensee MDPI, Basel, Switzerland. This article is an open access article distributed under the terms and conditions of the Creative Commons Attribution (CC BY) license (http://creativecommons.org/licenses/by/4.0/).
Copyright: This open access article is published under a Creative Commons CC BY 4.0 license, which permit the free download, distribution, and reuse, provided that the author and preprint are cited in any reuse.


