Submitted:
09 March 2026
Posted:
11 March 2026
You are already at the latest version
Abstract
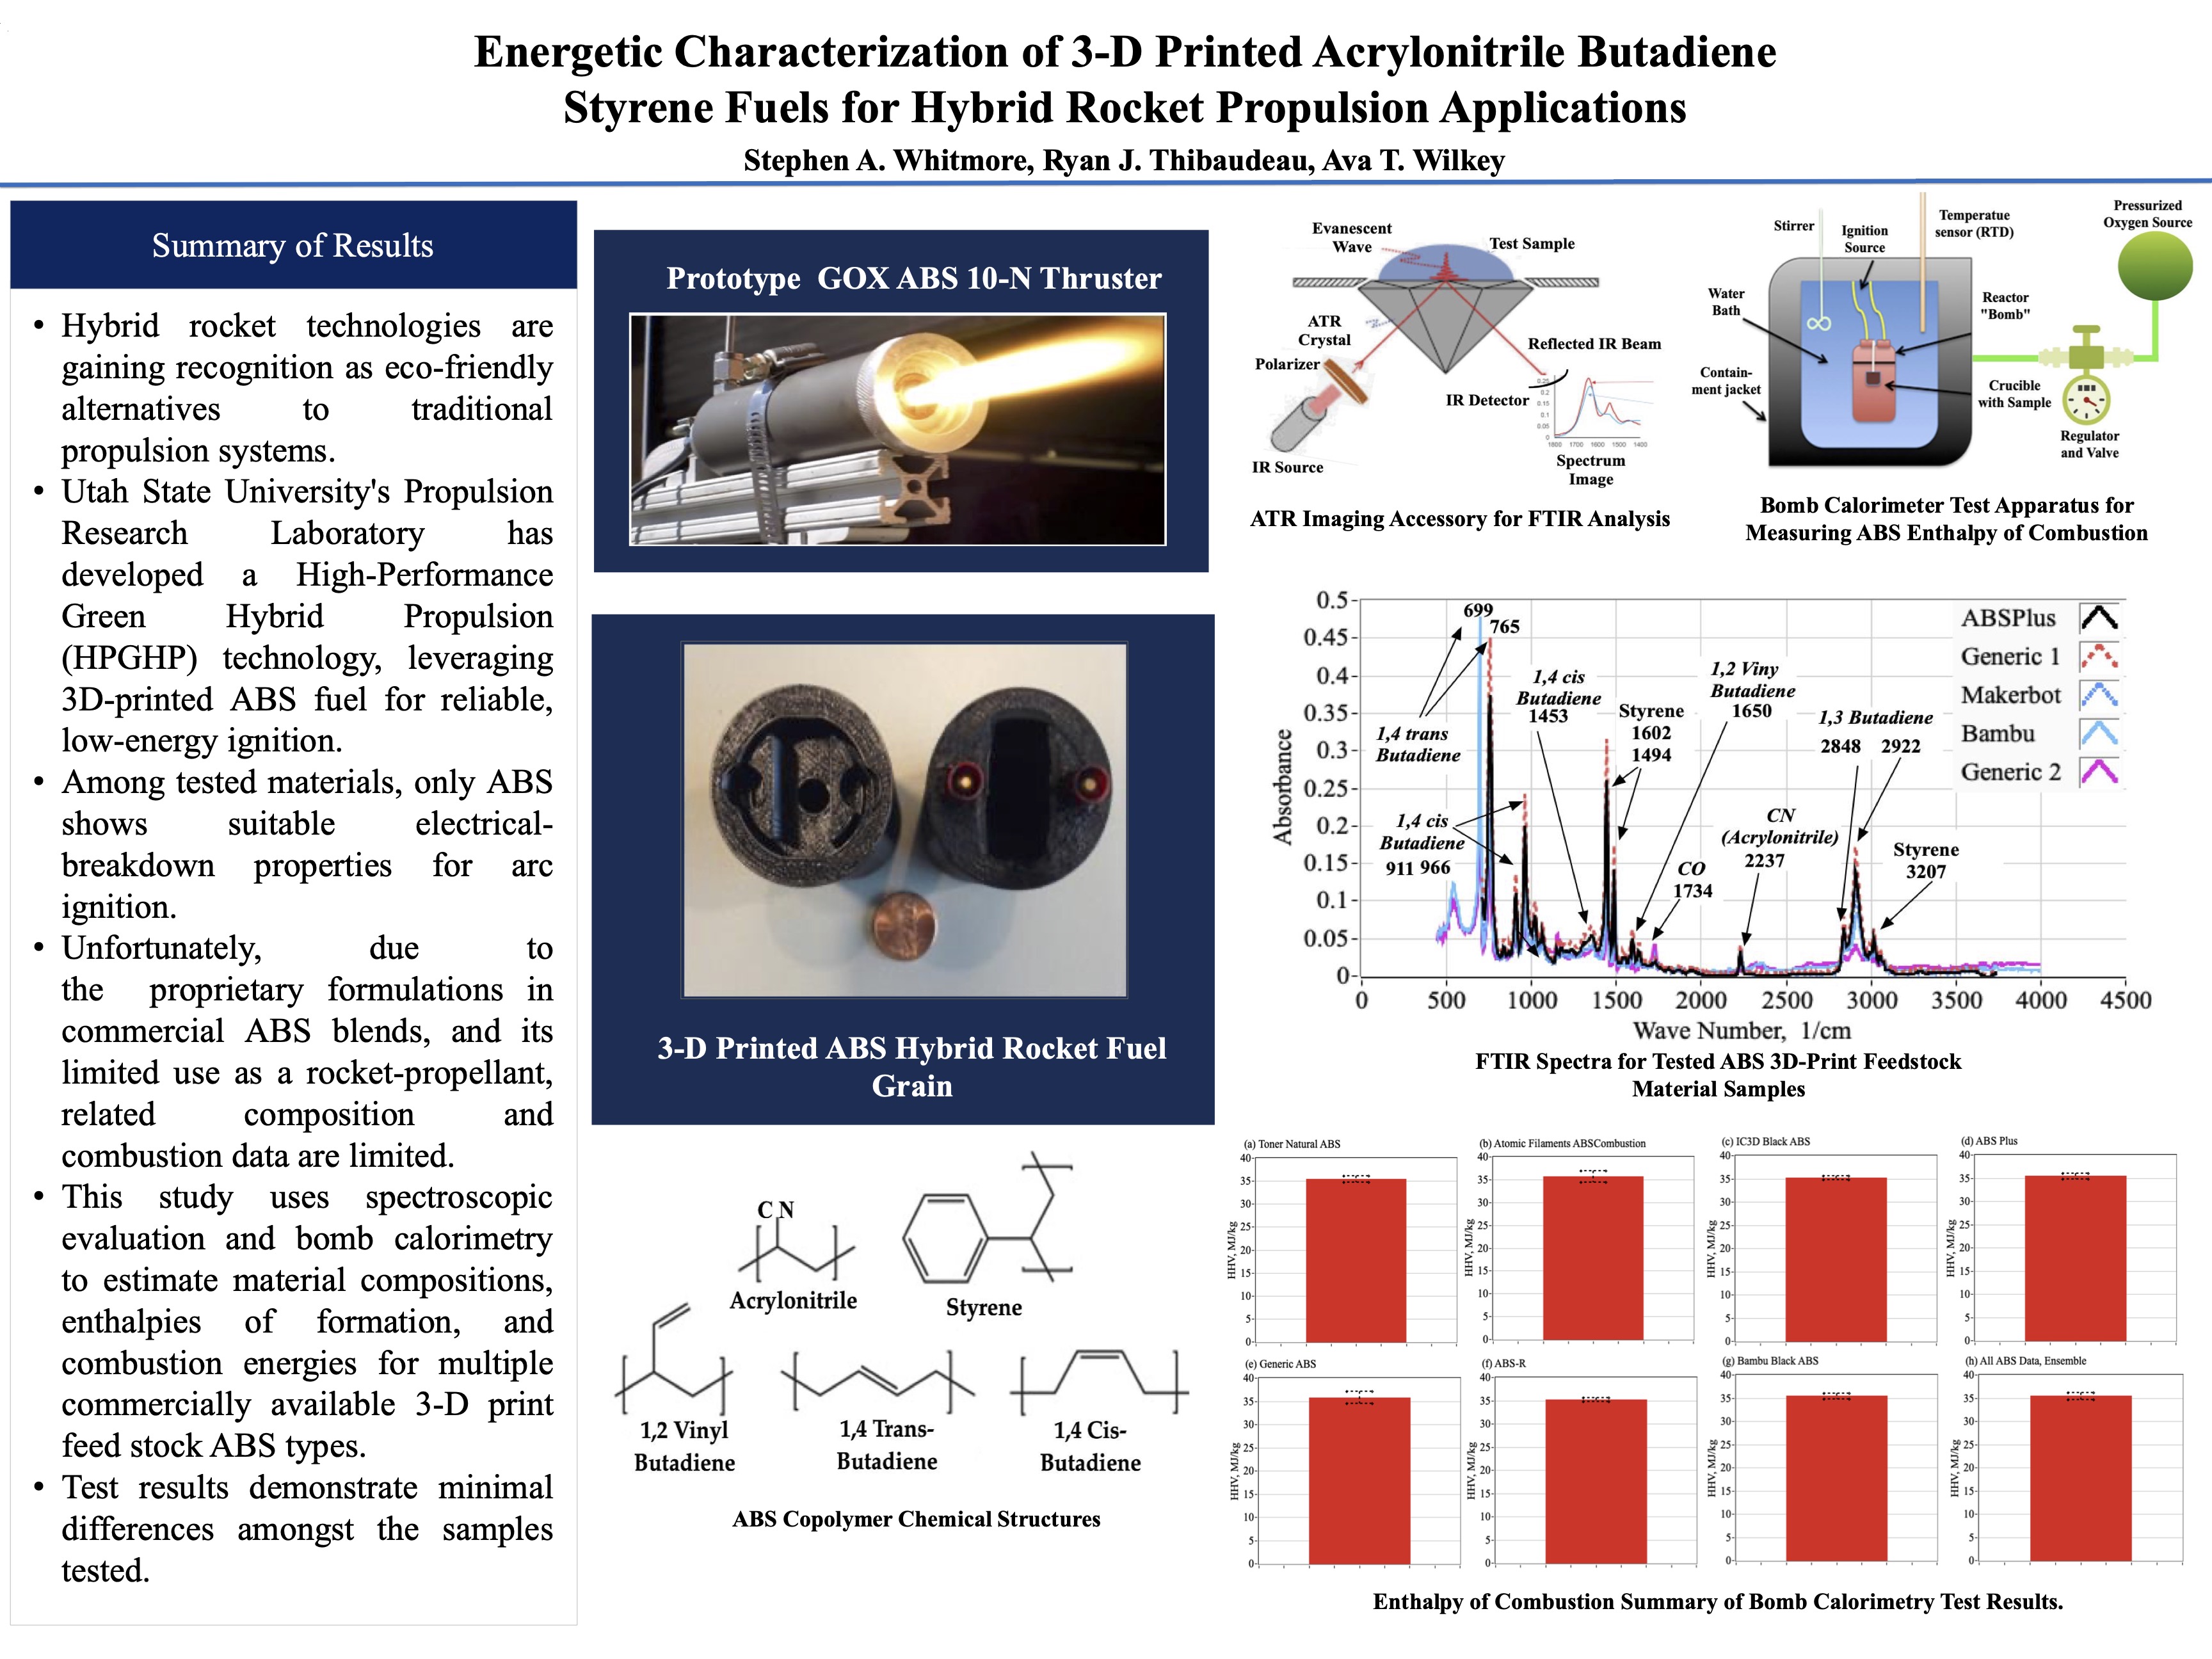
Hybrid rocket technologies are gaining recognition as eco-friendly alternatives to traditional propulsion systems. Utah State University's Propulsion Research Laboratory has developed a High-Performance Green Hybrid Propulsion (HPGHP) technology, leveraging 3D-printed ABS fuel for reliable, low-energy ignition. Among tested materials, only ABS shows suitable electrical-breakdown properties for arc ignition. Unfortunately, due to the proprietary formulations in commercial ABS blends, and its limited use as a rocket-propellant, related composition and combustion data are limited. This study uses spectroscopic evaluation and bomb calorimetry to estimate material compositions, enthalpies of formation, and combustion energies for multiple commercially available 3-D print feed stock ABS types, finding minimal differences amongst the samples tested. Based on these test results, “representative” ABS properties including chemical formula, mean molecular weight, enthalpy of formation, and Higher Heating Value, is recommended. Follow-on tests with 5 alternative, commonly used, 3D-printable thermoplastic feed stocks demonstrate that ABS has significantly higher energy content. This result supports ABS’s advantages and utility as a conveniently fabricated hybrid rocket fuel.
Keywords:
acrylonitrile butadiene styrene
; enthalpy of formation
; higher heating value
; 3-D printing
; FTIR
; bomb calorimetry
1. Introduction
A recent European Space Agency study [1,2] highlighted the need to lower production, operational, and transport costs by reducing propellant toxicity and explosion risks. With stricter regulations and costly requirements for hydrazine use—including storage, transport, servicing, and cleanup—hydrazine is becoming less viable. Developing a non-toxic, stable “green” propulsion system is crucial for the SmallSat industry’s growth. Both NASA [3]and the USAF [4] are pursuing alternatives to hydrazine.
Hybrid rockets are emerging as environmentally sustainable alternatives to traditional propellants. Compared to liquid and solid systems, hybrids offer notable safety and handling benefits, with single fluid flow paths making them as simple as hydrazine monopropellant systems but delivering better performance. Their built-in safety makes them especially suitable for ride-share spacecraft and positions them well in the growing commercial space market. Current considerations for hybrid propulsion include sounding rockets, [5,6], orbital insertion stages for nano launchers and SmallSats, [7] and surface launch technology for sample return missions from the Moon, Mars, and beyond. [8]
Over the last decade, Utah State University’s Propulsion Research Laboratory has created advanced hybrid propulsion systems offering a safer, eco-friendly alternative to hydrazine. Their High-Performance Green Hybrid Propulsion (HPGHP) system can be started, stopped, and restarted easily, [9,10] and multiple units ranging from 5 to 1600 N thrust have been built ad tested. [11] The HPGHP thruster technology uses 3D-printed Acrylonitrile Butadiene Styrene (ABS) fuel, the printed ABS exhibits useful electric-breakdown properties; under an inductive potential, arcing pyrolyzes the material, enabling reliable arc-ignition and efficient operation. Refs. [12,13] attempted to reproduce this phenomenon with various 3-D printed and extruded fuel materials. Only a few printed materials, notably ABS, showed the necessary arcing properties, while none of the extruded materials did. These results suggest that 3-D printing is crucial for low-energy arc-ignition, likely due to the FDM grain structure and ABS’s electromechanical characteristics.
Thus, because of the advantages of arc-ignition, ABS is the preferred material for HPGHP applications. As a widely used thermoplastic that is known for its durability and versatility. ABS serves in plumbing, structural uses, and can last underground for decades. Its compatibility with FDM printing [14] allows easy fabrication into various shapes. Using 3-D printing it is possible to embed complex high- surface area flow paths within the hybrid fuel grains. [15,16]. These internal flow paths increase burn rates and combustion efficiency, enabling much shorter motor aspect ratios than those possible with conventional casting methods for solid propellants like hydroxyl terminated polybutadiene (HTPB).
ABS is rarely studied as a rocket fuel grain, so there is little published data on its standard enthalpy of formation needed for motor performance and plume analysis. Whitmore et al. [17,18] provide early analytical estimates using group-addition methods, but only for a single, assumed ABS formulation and without experimental validation. The study showed that the ABS enthalpy of formation and combustion properties will vary widely depending on the ratio of the various monomers that make up the ABS polymer. For plume contamination research, basic chemical properties like monomer mass, mole fractions, molecular weights, and enthalpy must be measured or estimated. Commercial-available ABS formulations, including 3-D printing feed-stock compositions are proprietary and undisclosed. Thus, no widely accepted enthalpy value is available.
This work builds on Refs. [17,18] by presenting results from spectroscopic testing of various commercial ABS formulations. The tests identify chemical compositions, which are then used to estimate enthalpies of formation. These enthalpies inform hybrid combustion property calculations with gaseous oxygen as the oxidizer. Combustion heats from analysis are compared to bomb calorimetry measurements, supporting the accuracy of ABS formulation identification and enthalpy values.
2. Materials and Methods
This section covers the thermochemical properties of ABS polymer, including its chemical structure, molecular weight, enthalpy of formation, and combustion energy. To assess these properties, FTIR spectroscopy and bomb calorimetry were used. The section also outlines the tested ABS samples and explains the lab procedures and analytical methods used for the thermochemical assessments.
2.1. Thermo-Chemical Analysis of ABS Fuel Material
ABS [19] is a type of terpolymer made from three monomers: acrylonitrile, butadiene, and styrene. To produce ABS, acrylonitrile and styrene are first copolymerized to form styrene-acrylonitrile (SAN), then butadiene gas is added to the SAN mixture. Figure 1 shows the chemical structure of the constituent copolymers and Equation 1 shows the corresponding chemical formulas for the constituent ABS monomers [20],
In Eq. 1 the subscript on the butadiene entry indicates that ABS is made from polybutadiene, with n being the polymer chain length. Polybutadiene [21] is a clear-to-pale yellow, viscous liquid at room temperature. Depending upon the polymerization method, the butadiene monomers can be bonded in one of three configurations: 1) 1,2 vinyl, 2) 1,4 trans, and 3) 1,4 cis, with 1,4 cis being the most common allotrope in ABS formulations. The bond structure of butadiene copolymers primarily impacts mechanical properties: acrylonitrile enhances chemical resistance, butadiene boosts impact resistance and energy content, and styrene increases stiffness for easier machining. Combustion properties are rarely emphasized by commercial vendors, except when burn retardants are occasionally added. Commercial FDM feed-stock formulas are proprietary, and their monomer ratios vary by brand. Most ABS contains 21%-27% acrylonitrile, 12%-25% butadiene, and 54%-63% styrene molar proportions.
2.1.1. Analyses of ABS Samples Using Fourier Transform Infrared Spectroscopy (FTIR)
Accurate combustion analysis necessitates the estimation of the molar concentrations of the ABS constituent monomers. Fourier Transform Infrared (FTIR) spectroscopy [22] was performed to identify potential differences among four different industrial ABS formulations. The FTIR analysis reveals the types of functional groups found in the samples and provides an approximate measure of their relative molar amounts. The specific technique used for this analysis was Attenuated Total Reflection (ATR). [23] In ATR, the sample is placed on a germanium reflective crystal, pressure is applied, and an IR beam creates an evanescent wave that interacts with the sample. Where the sample absorbs energy, the IR signal is attenuated, then detected and processed into an IR spectrum by the FTIR spectrometer. Figure 2 shows a functional schematic of the ATR imaging accessory.
The four material analyzed were: 1) Stratasys ABSPlus-340 print stock (ABS-Plus, https://support.stratasys.com), 2) Generic Natural color pellets (Generic, https://stemfinity.com), 3) Makerbot Natural ABS feed-stock (ABS-R, https://store.goengineer.com), and 4) Bambu Labs® black print stock (Bambu, https://stemfinity.com). The NASA Marshall Space Flight Center’s (MSFC) Chemical Analysis Group, in collaboration with the Utah State University’s Propulsion Research Laboratory (PRL) analyzed the ABS-Plus, Generic, and ABS-R materials. [24] The USU Materials Physics group, collaborating with the PRL, performed FTIR analysis of the Bambu feed stock. The USU PRL also duplicated the Generic ABS analysis to compare FTIR methods. For later reference, the MSFC Generic ABS analysis is labeled as Generic-1, while the USU PRL Generic ABS analysis is labeled as Generic-2 to differentiate the groups. Data and conclusions from FTIR experiments will be presented later in Results section of this paper, Section 3.1.
2.1.2. Using FTIR Spectrum to Estimate the Molar Proportions of Constituent Monomers
By applying the Beer-Lambert law [25] and performing a least-squares linear-regression analysis, and the monomer compositions of the various samples was estimated. For this analysis, the FTIR spectra are compared to reference spectra for acrylonitrile, butadiene, and styrene, using a linear curve-fit model of the form,
In Eq. (2), { C3H3N, C4H6, and C8H8} are the absorbances of acrylonitrile, butadiene, and
styrene monomers at wavenumber n. The parameters {a, b, c} are linear fit coefficients, and ABS, is the least-squares estimate of ABS absorbance at wave number n. These coefficients are optimized to minimize the squared error between the measured ABS spectrum and the model across all wavenumbers. Normalizing {a, b, c} estimates the molar proportions of each monomer in the ABS sample; dividing each by its molecular weight yields the mass fractions.
2.1.3. Selecting the Proper Reference Spectra
To calculate the mole fractions of acrylonitrile, butadiene, and styrene in ABS accurately, selecting the correct reference spectra is essential. The following sub-sections illustrate these choices.
Acrylonitrile
Acrylonitrile is an essential monomer in ABS plastic production, polymerized with styrene and butadiene to form ABS’s unique structure. Polyacrylonitrile (PAN), which consists only of acrylonitrile units, is not involved in ABS manufacturing. Instead, the raw acrylonitrile monomer reacts directly with other components to create ABS, integrating acrylonitrile chains with styrene and butadiene. [26] Figure 3 compares the absorption spectra of acrylonitrile monomer [27] and PAN [28]. Both spectra display two main peaks at approximately 1410/cm and 2230/cm. However, the prominent monomer peak near 960/cm is absent in PAN due to its saturated backbone. The origin of the extra “soft peaks” observed in PAN on Figure 3 is unclear; they might be due to the conversion from the original data, changes from transmittance to absorbance, or possibly artifacts introduced in the published spectrum.
Styrene
Similarly, in the polymerization of ABS the raw acrylonitrile monomer reacts directly with the other components. The polymer polystyrene is not a constituent component of ABS. Figure 4 compares the IR absorbance spectra of the styrene monomer [29] to that of polystyrene. [30] Again, notice the absence of strong peaks at low wavenumbers in the polystyrene spectrum, which is a result of its saturated backbone.
Butadiene
Polybutadiene, and not the butadiene monomer, is a key component in ABS plastic. ABS is produced by polymerizing styrene and acrylonitrile with polybutadiene, which adds toughness and impact resistance. Figure 5 shows that the IR spectrum of (cis) polybutadiene [31] lacks the strong peak at 750–760/cm seen in the (1-3) butadiene monomer, [32] due to its saturated polymer backbone. Higher-frequency variations in the plotted results likely stem from differing sampling methods used by the original authors of these data.
2.1.4. Using Mole-Fractions to Calculate ABS Properties of Combustion
Mole fractions from Section 2.1.2 are used to estimate ABS’s equilibrium combustion characteristics with NASA’s Chemical Equilibrium with Applications (CEA) program. [33,34] CEA, developed at NASA Glenn Research Center, is an industry standard software package for calculating chemical equilibrium compositions and thermodynamic properties of mixtures. It can also determine theoretical rocket performance parameters like thrust, specific impulse, and characteristic velocity. Detailed results from CEA calculations will be discussed in Section 3.2.
As shown in Figure 6, the CEA Graphical User Interface (GUI, Ref. [35]) is used to input the data to the program. While the oxidizer O₂ is selectable from standard CEA libraries, [36,37]; ABS is not included, so its thermodynamic and transport properties must be entered manually. ABS monomers and their enthalpy values are added in the “Reactants with user-provided names and properties” table, including material name, mass fraction, reactant temperature, and specific enthalpy of formation. Their chemical formulas are specified in the adjacent table labeled “Enter Chem. Formula with atomic symbols, numbers for each reactant.”
2.2. Bomb Calorimeter Testing for ABS Enthalpies of Combustion
To complement the previously presented test results and analyses, a series of bomb calorimetry experiments were conducted. Bomb calorimetry offers a direct and reliable approach to experimentally determine the enthalpy of combustion for candidate ABS feedstocks. Enthalpy values from calorimetry will be compared with those calculated using FTIR monomer mass fraction and CEA analysis. Results from calorimetry testing campaign will be discussed in detail in in Section 3.3.
Besides the four ABS materials tested in FTIR—ABS-Plus, Generic, ABS-R, and Bambu—three additional commercial feedstocks were evaluated. These additional materials were, 1) Toner-Plastics Natural Color ABS, (Toner, https://tonerplastics.com), 2) Atomic Filaments Black ABS (Atomic, https://atomicfilament.com/), and 3) IC3D Black ABS (IC3D, https://www.ic3dprinters.com). Finally, after completing ABS bomb calorimetry tests, other 3D printing materials were also tested to compare their combustion performance with ABS.
2.2.1. Bomb Calorimetry Test Apparatus
A Parr 6200 Isoperibol Calorimeter [38] was used for precise calorific measurements. This device records heat release during combustion at constant volume in pressurized oxygen, with a temperature resolution of 0.0001 °C and accuracy of ±0.1%. Figure 7 shows a simplified schematic of the calorimeter apparatus. The setup includes a stainless-steel vessel, water jacket, ignition circuit, and digital controls. Procedures followed ASTM D240 [39,40] with minor changes for solid polymeric fuels. Calorimeter calibration using benzoic acid tablets gave a heat-capacity constant of about 8932.1 J/K.
2.2.2. Bomb Calorimetry Test Procedures
For each test, a 1-gram sample was placed on a nickel combustion dish with a nickel-chromium fuse wire. The bomb was sealed, filled with oxygen to 20 atm, and submerged in a 2000 g water jacket. After stabilizing for 10 minutes, the sample was ignited by energizing the fuse wire for 3 seconds. Jacket water temperature was recorded every 30 seconds until it plateaued. Afterwards, the bomb was depressurized, disassembled, and cleaned of residue.
2.2.3. Bomb Calorimeter Analysis Methods
The energy content of a fuel is expressed as its higher heating value (HHV). The total heat released was determined from the bomb’s heat capacity, temperature increase during combustion, and the fuse’s heat contribution.
In Eq. (3), Cbomb is the heat capacity of the bomb calorimeter, from calibration, DT is the water bath temperature increase, DL is the burned wire length, and ewire is the energy per unit length (about 9.6 J/cm). As described in the previous paragraph, the bomb calorimeter operates at a constant volume, and for accurate comparison to the FTIR/CEA data, the data must be adjusted to account for the work done on the bomb chamber during combustion. Thus, the total change of enthalpy is calculated by
In Eq (4), P is the internal bomb pressure after combustion, and V is the bomb reactor internal volume, approximately 342 cm3. The post-combustion internal pressure is calculated by the following analysis. The initial pressures before and after combustion are related to the number of gaseous (n) moles, the universal gas constant (Ru = 8314.46J/kg-K), and the internal bomb gas temperatures (T),
Since the initial mass oxygen in the bomb is calculated by,
and number of initial gaseous moles of O2 is
Similarly, the number of post-combustion gaseous moles is calculated by
In Eq. (8), Mwcomb is the molecular weight of the combustion products. Assuming stoichiometric internal bomb combustion, the mean molecular weight for GOX/ABS combustion under stoichiometric conditions at 20 atm—derived from CEA analysis of average ABS data—is approximately 26.75 g/mol and is used as an estimate for this value. Finally, using Eq. (5) the post-combustion pressure is solved for,
The test sample HHV is subsequently calculated by dividing the work-adjusted total heating u by the mass of the fuel sample, Mf,
3. Results
This section summarizes results from FTIR and bomb calorimetry tests. Chemical formulas, molecular weights, and enthalpies of formation for each ABS sample are determined using FTIR data. With these values, CEA calculates rocket performance parameters and combustion enthalpies for ABS burned with gaseous oxygen. CEA’s Higher Heating Values are compared to bomb calorimetry findings, and presented statistical analysis evaluates material performance quantitatively.
3.1. FTIR Testing Campaign and Associated Analyses
Portions of the FTIR data to be presented here were originally published by Whitmore and Brewer (2017, [41] and Whitmore (2022, [42]). This report includes the original data and results from additional test samples. Also, the presented analysis is considerably more detailed. To reduce noise in FTIR spectra, each ABS material (ABS-Plus, Generic1, Generic2, ABS-R, and Bambu) was tested several times and the results averaged. Figure 8 shows the mean absorbance spectra by wavenumber, with key peaks labeled. The spectra are very similar, although USU PRL tests span a wider range than MSFC tests. Table 1 lists correlation coefficients, all above 90%. Differences between Generic-1 and Generic-2 are mainly due to different testing instruments. High correlations indicate minimal variation in chemical composition among the ABS materials.
As examples of the least squares data fits, Figure 9 compares the best-fit and measured ensemble spectra for the Bambu (a) material and Generic-2 (b) spectra. Table 2 summarizes monomer mole and mass fractions and the curve fit correlation coefficients, as determined by least the squares curve-fitting analysis, for each of the five ABS materials. The final row of Table 2 lists the curve-fit correlation indexes for the test materials.
The fits in Figure 9 yield correlation coefficients of about rc = 0.865 for Bambu and rc = 0.815 for Generic-2, reflecting the limitations of a simple linear model given the likely complexity of the chemical structures. The calculations using Eq. (11) show that their compositions differ by less than 6%. Similar results are observed for the other materials tested.
3.2. Calculating the Enthalpies of Formation Using FTIR Results
As an example, Table 3 calculates the enthalpy of formation (ΔHf) for ABS using the mean material composition from Table 2, with mole fractions of 25.4% acrylonitrile, 34.71% butadiene, and 39.89% styrene. ABS polymerization is highly exothermic; thus, combustion requires breaking these bonds, reversing the energy released during polymerization. This effect means the combustion products retain less energy. Since ABS forms by copolymerization, its enthalpy of polymerization varies, typically between 71 and 85 kJ/mol, as reported by Hu et al. [43] and online by Refs. [44,45]. The total enthalpy of ABS is lower than the sum of its monomers, with each monomer’s net enthalpy calculated by subtracting ΔQp from ΔHf. Table 3 also lists the enthalpy contributions for each of the ABS copolymers including Hf , Qp, and the net enthalpy contribution of each monomer, according to its mole fraction. The chemical formula and molecular weight (Mw) of the ABS material are determined using the mole fractions of the monomers. When bond energy is included in the calculation, the net enthalpy contribution for the Bambu ABS is 66.285 kJ/mol (0.9068 kJ/g). Without considering bond energy, the estimated ΔHf is 137.928 kJ/mol (1.8598 kJ/g), which is over 70% higher than the actual enthalpy value.
Table 4 shows the calculated properties for the five ABS materials, along with their mean values, standard deviations, and student-t confidence intervals. Despite up to 5% variation in FTIR-based mole fractions (see Table 2), molar enthalpy of formation differs by only +1.75% at the 95% confidence level. Table 2 and Table 4 confirm that these industrial ABS samples are similar in composition, molecular weight, and enthalpy of formation. The averages in Table 4 reflect typical ABS properties.
3.3. Calculating the Properties of Combustion
As mentioned in Section 2.1.3, the enthalpies of chemical formulas and the enthalpies of formation from Table 4 were used, along with CEA, to estimate theoretical equilibrium combustion characteristics. Figure 10 displays the results of the CEA calculations using the averaged mass-fraction properties from row 7 of Table 4. In this analysis, it is assumed that ABS fuel combusts with gaseous oxygen (GOX) at various oxidizer-to-fuel (O/F) ratios with a combustion efficiency of 100%. The combustion chamber pressure (Pc) is adjusted across anticipated operating ranges typical of hybrid motors, specifically from 50 psia (345 kPa) to 500 psia (3450 kPa) in 50 psi increments. Figure 7 presents several critical parameters as functions of the O/F ratio: (a) combustion flame temperature (T0), (b) ratio of specific heats (γ), molecular weight (Mw), specific heat at constant pressure (Cpcomb), specific heat at constant volume (Cvcomb), equivalence ratio (Φ), and specific enthalpy of combustion (Dhcomb).
For this assessment, Φ is defined as the stoichiometric O/F ratio (approximately 2.97) divided by the actual O/F ratio. Figure 7(f) illustrates the relationship between Φ and the O/F ratio, and Figure 7(g) and 7(h) depict Dhcomb as functions of both O/F and Φ. In these graphs Dhcomb represents the total heat released per unit mass during the reaction minus the initial enthalpy of reactants, which are at standard conditions (298 K). Additionally, Figure 7(k) shows Dhcomb under stoichiometric conditions as a function of combustion chamber pressure. It is important to note that Dhcomb exhibits a slight decrease with increasing chamber pressure, a phenomenon attributed to the reduced heat capacity of combustion products at higher pressures.
3.4. Bomb Calorimeter Testing Campaign and Associated Analyses
The average higher heating value (HHV) for each material was determined based on five repeated tests, with the standard deviation reflecting the consistency of the results. As an example, Table 5 shows the complete set of test outcomes for the Toner ABS test sample. Identical calculations were performed for each of the other 6 material samples.
Table 6 presents calorimetry results for seven materials, including mean values and standard deviations from five samples each. Columns show total heat release, specific internal energy, and work-adjusted HHVs. Rows 9-11 provide ensemble statistics. Figure 11’s bar charts display mean HHVs with 95% confidence intervals. The minimal variation among data supports FTIR test conclusions that industrially available ABS feed stocks are fabricated using essentially the same monomer ratios.
3.5. Comparing CEA Calculations to Bomb Calorimeter Test Results for ABS Samples
The CEA calculations were repeated for each ABS material in Table 4 using mass fraction data from the FTIR tests. Table 7 presents the results, including material name, mass fraction, chemical formula, enthalpy of formation enthalpy (by mass), and combustion enthalpies at the stoichiometric O/F ratio. Both the low-heating (LHV) and high-heating (HHV) values are listed. The LHV is derived from plume specific enthalpy, adjusted for fuel, and not total mass flow rate,
In Equation (12), flame temperature (T0) and specific heat (Cv) are taken from CEA analysis and interpolated to the bomb-calorimeter’s post-combustion pressure, which is roughly 27.9 atm (425 psig). It must also be noted here, because the CEA calculations, which assumed a constant pressure process, are to be compared against the bomb calorimetry data, which result from a constant volume process, Cv and not Cp are used the DHLHV calculation.
The CEA-derived enthalpy ignores the water content in the exhaust plume, treating all water as vapor. Figure 12 shows how plume water content changes with chamber pressure and O/F ratio, based on average monomer fractions from Table 4. At stoichiometric conditions, water ranges from 12% to 13% depending on pressure. For accurate comparison with bomb calorimetry data, the CEA LHV requires adjustment for the latent heat of vaporization of plume water, calculated as follows:
In Eq. (12), DHH2O is the latent heat adjustment, MH2O is the exhaust plume water mass fraction, and LH2O the latent heat of vaporization for water under standard conditions, about 2460 kJ/kg. Adding the calculated enthalpy of vaporization, to the LHV gives the adjusted value for the HHV. The calculated values for HHV can now be accurately compared against the bomb calorimetry data. Table 7 summarizes the results of the CEA Enthalpy Calculations. Figure 13 also presents this comparison graphically as bar charts where the ensemble mean HHV values from the calorimetry tests (a) (from Table 6) are compared against the ensemble mean CEA enthalpy (b), calculated using FTIR mass fraction analysis (from Table 7). Each bar graph also displays 95% student-t confidence intervals from the tables.
3.6. Comparing the Enthalpies of Combustion to ABS to Alternative Commercially Available 3-D Print Materials
As referenced earlier, because ABS is a thermoplastic suitable for 3-D printing, it offers key advantages over traditional thermoset solid-propellant binders like HTPB. With the rise of 3-D printing; however, many plastics can now be additively manufactured, including Polycyclohexylene Dimethylene Terephthalate glycol (PCTG), Polyethylene Terephthalate Glycol (PETG), Acrylonitrile Styrene Acrylate (ASA), Thermoplastic Polyurethane (TPU), and Polyamide-6 (PA6). These materials have not been evaluated as rocket propellants before. Therefore, bomb calorimetry tests were performed on five commercial 3-D printer feedstocks to address inconsistent energy data among different polymer brands. The alternative commercial feed-stock materials as tested were: 1) PCTG-3DX-TECH, (2) PETG-HF Bambu Labs, (4) Polymaker ASA, (4) Bambu Labs TPU 95A HF, and (5) SunLu Nylon-6.
The additional bomb calorimetry tests were conducted using the same equipment, procedures. Because FTIR data on sample composition and molecular weights was unavailable for the alternative materials, constant volume corrections were not performed. For consistency with the ABS samples, specific internal energies (u), equivalent to the Low Heating Values (LHV) are compared, instead of the higher heating values (HHV). Figure 14 presents these results, displaying the ABS ensemble’s specific internal energies alongside those of alternative materials. The repeatability of the subsequent tests matched previous levels; however, ABS consistently produced higher combustion energies compared to the other materials tested.
4. Discussion
This section presents a statistical assessment for both the ABS (Section 3.5) and alternative materials (Section 3.6) test results. Here a student’s t-test assesses whether any observed differences between the means of these two groups are statistically significant or simply due to random chance, considering the sample means, variances, and sizes. The corresponding t-value is calculated using Equation (13), where μ and σ represent the sample mean and variance, respectively, for each group, and n indicates the sample count within each dataset. At 95% confidence level is assumed. The associated degrees of freedom for the collected data set are approximated by Eq. (14).
The associated degrees of freedom for the collected data set are approximated by Eq. (14),
4.1. Statistical Assessment of FTIR/Bomb Calorimetry Results for ABS Samples
Figure 15 presents the outcome of a student’s t-test (Ref. Error! Bookmark not defined.) comparing the two sets of data from Figure 13: one from bomb calorimetry experiments (35 samples) and the other from FTIR mass-fraction analysis (5 samples). In this comparison, the t-statistic (1.305) falls below the critical value (2.031) for the (equivalent) 37 degrees of freedom, so the null hypothesis is accepted, suggesting there’s no significant difference between the data sets. Figure 15 shows that the blue symbol—representing the t-statistics—remains well within the critical range indicated by the dashed red lines. Accordingly, all tested ABS samples are statistically identical, and row 7 of Table 4 accurately reflects typical properties for commercial ABS feed stocks. The results from bomb calorimetry support FTIR mass-fraction analysis, confirming the findings presented in Table 4 and Table 6, and 7.
4.2. Statistical Assessment of Bomb Calorimetry Results, Comparing Mean ABS Result Against the Alternative Materials
When testing alternative materials, only the ASA Polymaker sample (31.92 MJ/kg) had a comparable energy content to the ABS average (34.50 MJ/kg, Table 6). A Student’s t-test performed at the 95% confidence level resulted in a t-statistic of 5.284, which far exceeded the critical value of 2.446 for the equivalent degrees of freedom. This outcome demonstrates that ABS possesses a significantly higher combustion energy relative to ASA. As shown in Figure 16, the t-statistic falls outside the critical range, reinforcing the finding that among all tested 3D print feed-stock alternatives, ABS exhibits the highest energy content.
5. Conclusions
Hybrid rockets provide a sustainable option to conventional propellants, offering enhanced safety and easier handling. Even with their operational simplicity, hybrid rocket can hydrazine monopropellant systems in performance, making them ideal for ride-share missions and commercial space markets.
During the past decade, Utah State University’s Propulsion Research Laboratory has developed advanced High-Performance Green Hybrid Propulsion (HPGHP) technology, designed for reliable restart capability. The HPGHP thruster utilizes 3D-printed ABS fuel, which allows for consistent arc ignition and efficient performance. Among several tested 3D printing materials, ABS demonstrated the optimal characteristics for low-energy arc ignition. Consequently, due to its superior arc-ignition properties, ABS is selected as the primary material for HPGHP applications.
However, ABS is rarely studied as a rocket fuel grain, so there is little published data on its standard enthalpy of formation needed for motor performance and plume analysis. Commercial-available ABS formulations, including 3-D printing feed-stock compositions are proprietary and undisclosed. Thus, no widely accepted enthalpy value is available.
This study analyzes commercial ABS formulations using spectroscopy to identify chemical compositions and estimate enthalpies of formation. Results from combustion property calculations with gaseous oxygen agree with bomb calorimetry measurements, confirming the accuracy of both composition analysis and enthalpy values. Among seven industrial ABS samples, no significant differences were found between data sets. For general-use hybrid rocketry calculations with 3-D printed ABS, a mean enthalpy of formation of 66.69 KJ/g-mol (0.8938 MJ/kg) is recommended, with a 95% confidence interval of +1.38 kJ/mol. The average formula is C5.3416 H6.0358 N0.254 (molecular weight: 74.16 g/mol), and the High Heating Value when burned with gaseous oxygen is about 35.42 MJ/kg ±1.48 MJ/kg.
Follow-on bomb calorimetry tests demonstrated that ABS possesses more combustion energy compared to five alternative, commercially available 3D printing materials: PCTG, PETG, ASA, TPU, and Polyamide-6. Among these, only ASA had energy levels close to ABS. Statistical analysis using a Student’s t-test confirmed that ABS has significantly higher energy, proving that ABSD is more energetic than all tested non-ABS alternatives. The benefits and usefulness of ABS as a hybrid rocket fuel are already well recognized.
Author Contributions
All listed authors contributed significantly to this research project. Conceptualization and methodology, Stephen A. Whitmore 60%, Ryan J. Thibaudeau 25%, Ava T. Wilkey 15%; analysis software, Stephen A. Whitmore 70%, Ryan J. Thibaudeau 20%, Ava T. Wilkey 10%;validation, Stephen A. Whitmore 70%, Ryan J. Thibaudeau 20%, Ava T. Wilkey 10%; formal analysis, Stephen A. Whitmore 50%, Ryan J. Thibaudeau 25%, Ava T. Wilkey 25%; data curation Stephen A. Whitmore 50%, Ryan J. Thibaudeau 25%, Ava T. Wilkey 25%, X.X.; writing—original Stephen A. Whitmore 100%; writing—review and editing, Stephen A. Whitmore 70%, Ryan J. Thibaudeau 20%, Ava T. Wilkey 10%, visualization, Stephen A. Whitmore 100%; supervision, Stephen A. Whitmore 100%; project administration, Stephen A. Whitmore 100%; funding acquisition, Stephen A. Whitmore 100%;. All authors have read and agreed to the published version of the manuscript.
Funding
The authors would like to thank the NASA Small Spacecraft Technology Program (SSTP) for partially funding this work through cooperative agreement number 80NSSC20M0083.
Data Availability Statement
The data supporting this report are properties of Utah State University. Parties interested in using any of the published test results may request formal data sets by contacting the corresponding author on this report. The authors would like to thank the Utah State University Office of Research and the Vice-President of Research for partially funding this work under the Research Catalyst (RC) program. This work is published under the Fundamental Research Exclusion (FRE) 49 which allows general scientific, mathematical, or engineering principles commonly taught in schools, colleges, and universities, or information in the public domain, to be published without specific US government authorization.
Conflicts of Interest
“The authors declare no conflicts of interest.”.
Nomenclature
| Symbols | ||
| = | Spectral absorbance of tested material | |
| {a,b,c} | = | FTIR least-squares curve fit coefficients |
| C | = | Symbol for atomic carbon |
| Cp | = | Specific heat at constant pressure, KJ/kg-K |
| Cv | = | Specific heat at constant volume, KJ/kg-K |
| Cbomb | = | Heat capacity of bomb calorimeter, KJ/K |
| ewire | = | energy content of bomb calorimeter fuse wire, J/cm |
| H | = | Symbol for atom hydrogen |
| DH | = | Total enthalpy change, MJ |
| DHc | = | Specific enthalpy of combustion, MJ |
| Hf | = | Molar enthalpy of formation, kJ/g-mol |
| DHLHV | = | Specific enthalpy changes due to condensed water vapor, MJ/kg |
| DHLHV | = | Specific enthalpy change used to calculate LHV, MJ/kg |
| L | = | Latent heat of vaporization, KJ/kg |
| DLfuse | = | Length of consumed fuel wire for bomb calorimetry tests, cm |
| Mf | = | Mass of fuel sample, g |
| MH2O | = | CEA plume of water mass fraction, kg/kg |
| Mox | = | Initial mass of oxygen in bomb calorimeter, g |
| Mw | = | Molecular weight, g/mol |
| Mwcomb | = | Molecular weight of combustion products, g/mol |
| Mwox | = | Molecular weight of O2, 31.9988 g/mol |
| = | Fuel mass flow rate, g/sec | |
| = | Oxygen mass flow rate, g/sec | |
| N | = | Symbol for atomic nitrogen |
| n | = | Number of samples in spectrum |
| n | = | Number of gaseous moles in bomb calorimeter, alternate definition |
| O | = | Symbol for atomic oxygen |
| O/F | = | Oxidizer to fuel ratio |
| O/Factual | = | Actual/achieved oxidizer to fuel ratio |
| O/Fstoich | = | Stoichiometric oxidizer to fuel ratio |
| P | = | Calorimeter bomb pressure, atms |
| Pc | = | Combustion (chamber) pressure, kPa |
| DQ | = | Total heat released during combustion, MJ |
| rc | = | Curve fit correlation index |
| T0 | = | Combustion flame temperature, K |
| DT | = | Temperature change during event |
| u | = | Specific internal energy of combustion, MJ/kg |
| V | = | Calorimeter bomb volume, cm3 |
| g | = | Ratio of specific heats |
| m | = | Sample mean |
| | = | Equivalence ratio |
| s | = | Sample standard deviation |
| Acronyms and Abbreviations | ||
| ABS | = | Acrylonitrile butadiene styrene |
| ASA | = | Acrylonitrile Styrene Acrylate |
| ATR | = | Attenuated total reflection |
| CEA | = | Chemical equilibrium with applications (computer program) |
| D.O.F. | = | Degrees of freedom |
| FDM | = | Fused deposition modeling |
| FTIR | = | Fourier transform infrared spectroscopy |
| GOX | = | Gaseous oxygen |
| GUI | = | Graphical user interface |
| HPGHP | = | High-Performance Green Hybrid Propulsion |
| HHV | = | High heating value, MJ/kg |
| LHV | = | Low heating value, MJ/kg |
| PA6 | = | Polyamide-6 (Nylon-6) |
| PCTG | = | Polycyclohexylene Dimethylene Terephthalate Glycol |
| PETG | = | Polyethylene Terephthalate Glycol |
| PRL | = | Propulsion Research laboratory |
| Stoich | = | Stoichiometric O/F ratio |
| TPU | = | Thermoplastic Polyurethane |
References
- Bombelli, V. Economic Benefits for the Use of Non-toxic Monopropellants for Spacecraft Applications, AIAA-2003-4783. 39th AIAA/ASME/SAE/ASEE Joint Propulsion Conference and Exhibit, Huntsville, AL, July 2003. [Google Scholar] [CrossRef]
- Haeseler, D.; Bombelli, V.; Vuillermoz, P.; Lo, R.; Marée, T.; Caramelli, F. “Green Propellant Propulsion Concepts for Space Transportation and Technology Development Needs,” ESA SP-557. In Proceedings of the 2nd International Conference on Green Propellants for Space Propulsion, Cagliari, Sardinia, Italy, 7-8 June 2004. https://adsabs.harvard.edu/full/2004ESASP.557E...4H (accessed on 2 December 2025).
- Goldstein, E. The Greening of Satellite Propulsion. Aerospace America. 2012, pp. 26–28. https://uppsagd.files.wordpress.com/2012/05/aerospace-america (accessed on 2 December 2025).
- Hawkins, T. W.; Brand, A. J.; McKay, M.; Tinnirello, M. “Reduced Toxicity, High Performance Monopropellant at the U.S. Air Force Research Laboratory,” AFRL-RZ- ED-TP-2010-219. 4th International Association for the Advancement of Space Safety Conference, Huntsville, AL, May 2010; www.dtic.mil/dtic/tr/fulltext/u2/a522113.pdf (accessed on 2 December 2025).
- Dornheim, M.A. Reaching 100 km. Av. Week Space Technol. 2024, 2004, 45–46. https://www.researchgate.net/publication/292268464 (accessed on 29 Jan. 2026).
- Casalino, L.; Pastrone, D. Optimization of Hybrid Sounding Rockets for Hypersonic Testing. J. Propuls. Power 2012, 28, 405–411. [Google Scholar] [CrossRef]
- Jens, E.; Karp, A.C.; Nakazono, B.; Eldred, D.B.; DeVost, M.E.; Vaughan, D. Design of a Hybrid CubeSat Orbit Insertion Motor. AIAA 2016-4961, 52nd AIAA/SAE/ASEE Joint Propulsion Conference, Salt Lake City, UT, USA, 25–27, July 2016. [Google Scholar] [CrossRef]
- Karp, A.C.; Nakazono, B.; Benito Manrique, J.; Shotwell, R.; Vaughan, D.; Story, G.T. A Hybrid Mars Ascent Vehicle Concept for Low Temperature Storage and Operation. AIAA 2016-496252nd AIAA/SAE/ASEE Joint Propulsion Conference, Salt Lake City, UT, USA, 25–27, July 2016. [Google Scholar] [CrossRef]
- Whitmore, S.A. “Three-Dimensional Printing of Green” Fuels for Low-Cost Small Spacecraft Propulsion Systems. J. Spacecraft Rockets 2018, 55. [Google Scholar] [CrossRef]
- Whitmore, S.A. Additive Manufacturing as an Enabling Technology for “Green” Hybrid Spacecraft Propulsion. In Proceedings of the RAST-1039, Conference on Recent Advances in Space Technology 2015, Istanbul Turkey, 2015; pp. 16–19. https://ieeexplore.ieee.org/document/7208305 (accessed on 5 December 2025).
- Whitmore, S.A. Additive Manufacturing as an Enabling Technology for “Green” Hybrid Spacecraft Propulsion. Istanbul Turkey, 16-19 June 2015. https://ieeexplore.ieee.org/document/7208305 (accessed on 5 December 2019).
- Whitmore, Stephen A. Additively Manufactured Acrylonitrile-Butadiene-Styrene–Nitrous-Oxide Hybrid Rocket Motor with Electrostatic Igniter. J. Prop. Power 2015, 31, 1217–1220. [Google Scholar] [CrossRef]
- Whitmore, S.A.; Inkley, N.R.; Merkley, D. P.; Judson, M.I. Development of a Power-Efficient, Restart Capable Arc Ignitor for Hybrid Rockets. J. Prop. Power 2015, 31, 1739–1749. [Google Scholar] [CrossRef]
- Wright, P. K. 21st Century Manufacturing; Prentice–Hall: Upper Saddle, River, NJ, 2001; pp. 7–67. ISBN -10 0130956015, ISBN-13 978-0130956019. [Google Scholar]
- Fuller, J. K.; Ehrlich, D. A.; Lu, P. C.; Jansen, R. P.; Hoffman, J. D. Advantages of Rapid Prototyping for Hybrid Rocket Motor Fuel Grain Fabrication. AIAA 2011-5909, 47th AIAA/ASME/SAE/ASEE Joint Propulsion Conference & Exhibit, San Diego, CA, 2011. [Google Scholar] [CrossRef]
- Whitmore, S. A.; Walker, S. D.; Merkley, D. P.; Sobbi, M. High Regression Rate Hybrid Rocket Fuel Grains with Helical Port Structures. J. Prop. Power 2015, 31, 1727–1738. [Google Scholar] [CrossRef]
- Whitmore, S. A.; Peterson, Z.; Eilers, S. D. “Analytical and Experimental Comparisons of HTPB and ABS as Hybrid Rocket Fuels,” AIAA 2011-5909. 47th AIAA/ASME/SAE/ASEE Joint Propulsion Conference & Exhibit, July 2011; https://arc.aiaa.org/doi/abs/10.2514/6.2011-5909.
- Whitmore, S. A.; Peterson, Z.; Eilers, S. D. “Comparing of Hydroxyl Terminated Poly Butadiene and Acrylonitrile Butadiene as Hybrid Rocket Fuels,”. J. Prop. Power 2012, 29, 582–592. [Google Scholar] [CrossRef]
- Cha, J. Co-authors, Engineering Plastics Handbook, Chap. 6, "Acrylonitrile-Butadiene-Styrene (ABS) Resin"; Margolis, J. M., Ed.; McGraw-Hill, 2006; pp. 101–130. ISBN 0071457674, ISBN-13: 9780071457675. [Google Scholar]
- Anon. National Institute for Standards in Technology (NIST), Standard Reference Database Number 69. http://webbook.nist.gov/chemistry (accessed on 25 June 2025).
- Othmer, K. Butadiene. In Encyclopedia of Chemical Technology; John Wiley & Sons, Inc.: New York, 2006; (accessed on 25 June 2025). [Google Scholar] [CrossRef]
- Anon. The Basics of Infrared Spectrophotometry. 10 October 2019. https://conductscience.com/the-basics-of-infrared-spectrophotometry/ (accessed on 10 January 2026).
- Bradley, M. FTIR Sample Techniques: Attenuated Total Reflection (ATR)," ThermoFisher Scientific Technical Note. https://www.thermofisher.com/us/en/home/industrial/spectroscopy (accessed on 1 June 2025).
- Whitmore, Stephen A. Plume Contamination Measurements of an Additively Printed, Green-Propellant Hybrid Thruster. J. of Prop. and Power 2022, 38, 671–685. [Google Scholar] [CrossRef]
- Ball, D. W. Beer’s Law, Field Guide to Spectroscopy. International Society for Optics and Photonics, SPIE. 2006, p. 66. https://spie.org/publications (accessed on 30 January 2026).
- Anon. Polyacrylonitrile, Millipore Sigma, 2026, Merck KGaA, Darmstadt, Germany and/or its affiliates. https://www.sigmaaldrich.com/US/en/product/aldrich/181315 (accessed on 25 February 2026).
- Anon. 2-Propenenitrile, NIST Chemistry WebBook, SRD 69, National Institute of Standards and Technology, U.S. Dept. of Commerce. https://webbook.nist.gov/cgi/cbook.cgi?ID=C107131&Mask=80#IR-Spec (accessed on 25 February 2026).
- Anon. Polyacrylonitrile, (25014-41-9) IR1, Chemical Book. https://www.chemicalbook.com/SpectrumEN_25014-41-9_IR1.htm (accessed on 25 February 2026).
- Anon, Styrene. NIST Chemistry WebBook, SRD 69, National Institute of Standards and Technology, U.S. Dept. of Commerce. https://webbook.nist.gov/cgi/cbook.cgi?ID=C100425&Type=IR-SPEC&Index=2#IR-SPEC (accessed on 25 February 2026).
- Anon. Polystyrene, (9003-56-6) IR1, Chemical Book. https://www.chemicalbook.com/SpectrumEN_9003-53-6_IR1.htm (accessed on 25 February 2026).
- Anon, 1-3 Butadiene, NIST Chemistry WebBook, SRD 69, National Institute of Standards and Technology, U.S. Dept. of Commerce. https://webbook.nist.gov/cgi/cbook.cgi?ID=C106990&Type=IR-SPEC&Index=1 (accessed on 25 February 2026).
- Anon. Cis-Polybutadiene NIST Chemistry WebBook, SRD 69, National Institute of Standards and Technology, U.S. Dept. of Commerce. https://webbook.nist.gov/cgi/cbook.cgi?ID=B6002924&Mask=80 (accessed on 25 February 2026).
- Gordon, S.; McBride, B. J. “Computer Program for Calculation of Complex Chemical Equilibrium Compositions and Applications, I. Analysis” National Aeronautics and Space Administration, Cleveland, Ohio, Tech. Rep. NASA RP-1311, 1994. https://ntrs.nasa.gov/api/citations/19950013764/downloads/19950013764.pdf (accessed on 23 January 2026).
- Gordon, S.; McBride, B. J. “Computer Program for Calculation of Complex Chemical Equilibrium Compositions and Applications, II. User’s Manual and Program Description” National Aeronautics and Space Administration, Cleveland, Ohio, Tech. Rep. NASA RP-1311-2, 1994. https://ntrs.nasa.gov/api/citations/19960044559/downloads/19960044559.pdf (accessed on 23 January 2026).
- Leader, M. K.; Lavelle, T. M.; Wang, X.J.; Dickens, K. W.; McTague, M. CEA2022: A Modernization of NASA Glenn’s Software CEA (Chemical Equilibrium with Applications), Thermal and Fluids Analysis Workshop (TFAWS), 2024. https://ntrs.nasa.gov/api/citations/20240009728/downloads/TFAWS_2024_CEA.pdf (accessed on 23 January 2026).
- McBride, B. J.; Zehe, M. J.; Sanford Gordon, S. NASA Glenn Coefficients for Calculating Thermodynamic Properties of Individual Species,“ NASA/TP—2002-211556, 2002. https://ntrs.nasa.gov/api/citations/20020085330/downloads/20020085330.pdf (accessed on 23 January 2026).
- Svehla, R. A. Transport Coefficients for the NASA Lewis Chemical Equilibrium Program. https://ntrs.nasa.gov/api/citations/19950021761/downloads/19950021761.pdf (accessed on 23 January 2026).
- Anon. Model 6200 Calorimeter. Preiser Scientific. https://preiser-my.sharepoint.com (accessed on 2 February 2026).
- Anon. “Introduction to Bomb Calorimetry,” 483M. Parr Instrument Co. https://www.scimed.co.uk/wp-content/uploads/2024/02/Introduction-to-bomb-calorimetry.pdf (accessed on 2 February 2026).
- ASTM International. Standard Test Method for Heat of Combustion of Liquid Hydrocarbon Fuels by Bomb Calorimeter (ASTM D240-19); ASTM International, 2025. https://store.astm.org/d0240-19.html (accessed on 2 February 2026).
- Whitmore, S. A.; Brewer, D. L. Plume Contamination Measurements of an Additively-Printed GOX/ABS Hybrid Thruster. AIAA 2017- 4982, 53rd AIAA/SAE/ASEE Joint Propulsion Conference, Atlanta GA, USA, 10-12 July 2017. [Google Scholar] [CrossRef]
- Whitmore, S. A. Plume Contamination Measurements of an Additively Printed, Green-Propellant Hybrid Thruster. J. of Prop. Power 2022, Vol. 38(No. 4). https://arc.aiaa.org/doi/abs/10.2514/1.B38612 (accessed on 2 March 2026). [CrossRef]
- Hu, K-H.; Kao, C-S.; Duh, Y-S. Studies on the Runaway Reaction of ABS Polymerization Process. J. Haz. Materials 2008, 159, 1–186. http://lib3.dss.go.th/fulltext/e_content/0304-3894/2008v.159n.1.pdf. [CrossRef] [PubMed]
- Anon. “ABS poly-acrylonitrile-co-butadiene-co-styrene,” Specification Sheet. http://www.polympart.com (accessed on 30 January 2026).
- Anon. “Molar Heat of Polymerization of ABS,” AI Search. https://www.google.com/search?q=molar+heat+of+polymerization+of+ABS (accessed on 30 January 2026).
- Baxendale, J. H.; Madaras, G. W. Kinetics and Heats of Copolymerization of Acrylonitrile and Methyl Methacrylate, J. Polymer Science 1956, 19, 171–179. [Google Scholar] [CrossRef]
- Van Krevelen, D. W.; Jijenhuis, K. Properties of Polymers: Their Correlation with Chemical Structure; Their Numerical Estimation and Prediction from Additive Group Contributions, Chapt. 20, 4th ed.; Elsevier Science Ltd., 2009; https://www.amazon.com/Properties-Polymers-Correlation-Estimation-Contributions/dp/0080548199.
- Prosen, E.J.; Rossini, F.D. Heats of Formation and Combustion of 1,3-Butadiene and Styrene. J. Research, NIST (formerly NBS) 1945, 34, 59–63. https://nvlpubs.nist.gov/nistpubs/jres/34/jresv34n1p59_A1b.pdf. [CrossRef]
- Anon. NATIONAL POLICY ON THE TRANSFER OF SCIENTIFIC, TECHNICAL AND ENGINEERING INFORMATION, National Security Decision Directives (NSDDs), 1985. https://irp.fas.org/offdocs/nsdd/nsdd-189.htm (accessed on 7 November 2024).
Figure 1.
ABS Copolymer Chemical Structures. (Original Image by Authors.

Figure 2.
Figure 2. Schematic of ATR Imaging Accessory. (Original Image by Authors.

Figure 3.
Comparing Acrylonitrile Monomer and PAN Absorption Spectra.

Figure 4.
Comparing Monomer Styrene and PolyStyrene Absorption Spectra.

Figure 5.
Comparing Butadiene Monomer and Polybutadiene Absorption Spectra.

Figure 6.
Entering the ABS Monomer Properties into the CEA GUI. (Original Image from CEA GIU).

Figure 7.
Bomb Calorimeter Test Apparatus Schematic. (Original Image by Authors).

Figure 8.
Ensemble Mean FTIR Spectra for ABS Material Samples.

Figure 9.
Comparing Least-Squares Curve Fits to Ensemble Spectra for Bambu and Generic 2 Samples.

Figure 10.
Mean ABS Combustion Properties for Various Pressure Levels, O/F, and Equivalence Ratios.

Figure 11.
High Heating Value (HHV) Bar Chart Summary of Bomb Calorimetry Test Results.

Figure 12.
CEA-Predicted Plume Water Content for Mean ABS Mass Fractions (from Table 4).
Figure 12.
CEA-Predicted Plume Water Content for Mean ABS Mass Fractions (from Table 4).

Figure 13.
HHV Comparisons from Bomb Calorimetry and FTIR Mass Fraction Analysis Tests.

Figure 14.
Comparing Specific Internal Combustion Energy (u) of ABS materials Against 5 Alternative 3-D Printer Plastics.
Figure 14.
Comparing Specific Internal Combustion Energy (u) of ABS materials Against 5 Alternative 3-D Printer Plastics.

Figure 15.
Student’s-t Test Comparing HHV Comparisons from Bomb Calorimetry and FTIR Mass Fraction Analysis Tests.
Figure 15.
Student’s-t Test Comparing HHV Comparisons from Bomb Calorimetry and FTIR Mass Fraction Analysis Tests.

Figure 16.
Student’s-t Test Comparing Mean LHV Energies of ASA and ABS Samples.


Table 1.
ABS Sample Correlation Indexes, rc.
| Material | ABS-Plus | Generic-1 | ABS-R | Bambu | Generic-2 |
|---|---|---|---|---|---|
| ABS-Plus | 1.000 | 0.931 | 0.951 | 0.905 | 0.901 |
| Generic-1 | 0.931 | 1.000 | 0.950 | 0.925 | 0.905 |
| ABS-R | 0.951 | 0.950 | 1.000 | 0.911 | 0.866 |
| Bambu | 0.905 | 0.925 | 0.911 | 1.000 | 0.964 |
| Generic-2 | 0.901 | 0.905 | 0.905 | 0.964 | 1.000 |
Table 2.
Monomer Mole and Mass Fraction Estimates for Each of the 5 Tested ABS Materials.
| Material | Acrylonitrile | Butadiene | Styrene | Curve Fit rc | |||
|---|---|---|---|---|---|---|---|
| Mole Frac. % | Mass Frac. % | Mole Frac. % | Mass Frac. % | Mole Frac. % | Mass Frac. % | ||
| ABS-Plus | 23.77 | 16.90 | 34.60 | 25.06 | 41.63 | 58.06 | 0.885 |
| Generic-1 | 24.32 | 16.93 | 30.95 | 22.00 | 44.73 | 61.11 | 0.826 |
| ABS-R | 28.39 | 21.81 | 41.09 | 32.18 | 30.52 | 46.02 | 0.871 |
| Bambu | 24.01 | 17.18 | 35.40 | 25.82 | 40.59 | 57.00 | 0.865 |
| Generic-2 | 26.53 | 18.82 | 31.50 | 22.77 | 41.97 | 58.42 | 0.815 |
| Mean, m | 25.40 | 18.33 | 34.71 | 25.57 | 39.89 | 56.12 | 0.869 |
| Std. Dev. s | 2.00 | 2.10 | 4.05 | 4.02 | 5.46 | 5.85 | 0.015 |
Table 3.
Enthalpy of Formation Contributions of Co-polymers for Mean ABS Composition from Table 2.
Table 3.
Enthalpy of Formation Contributions of Co-polymers for Mean ABS Composition from Table 2.
| Monomer | Chemical Formula | Mw g/mol |
Hf monomer kJ/g-mol |
Qp polymer kJ/g-mol |
Net Hf kJ/g-mol | Mole Fraction | Mass Fraction | Net Enthalpy Contribution kJ/g-mol |
|
|---|---|---|---|---|---|---|---|---|---|
| Acrylo-nitrile | C3H3N | 53.06 | 172.62 [46] | 72.4 | 100.22 | 0.2540 | 0.1826 | 25.456 | |
| Butadiene | C4H6 | 54.09 | 104.10 [47] | 69.8 | 34.30 | 0.3471 | 0.2544 | 11.906 | |
| Styrene | C8H8 | 104.15 | 146.91 [48] | 72.8 | 74.11 | 0.3989 | 0.5630 | 29.563 | |
| ABS Total | C5.3416H6.0358 N0.254 | 74.164 | 1.000 | 1.000 | 66.924 | ||||
| Net Enthalpy Contribution kJ/g | 0.9068 | ||||||||
Table 4.
Summary of FTIR Results, Enthalpy and Mass Fraction Analysis of ABS Materials.
| Material | Hf(Molar) kJ/g-mol | Hf(Mass) kJ/g | Mw g/mol | Monomer Mass Fractions (%) | Chemical Formula | ||
| C3H3N | C4H6 | C8H8 | |||||
| ABS-Plus | 66.542 | 0.8910 | 74.687 | 16.90 | 25.06 | 58.06 | C5.428H6.120N0.238 |
| Generic-1 | 68.139 | 0.8938 | 76.233 | 16.93 | 22.00 | 61.11 | C5.546H6.165N0.243 |
| ABS-R | 65.165 | 0.9434 | 69.078 | 21.81 | 32.18 | 46.02 | C4.937H5.759N0.284 |
| Bambu | 66.286 | 0.8937 | 74.164 | 17.18 | 25.82 | 57.00 | C5.384H6.092N0.240 |
| Generic-2 | 67.296 | 0.9148 | 73.5671 | 18.82 | 22.77 | 58.42 | C5.315H6.002N0.262 |
| Mean, m | 66.924 | 0.9068 | 73.799 | 18.26 | 25.44 | 56.30 | C5.3416H6.0358N0.254 |
| Std. Dev. s | 1.155 | 0.0223 | 2.686 | 2.10 | 4.02 | 5.85 | - |
|
95% Student-t Conf. Interval |
1.384 | 0.0277 | 3.333 | 2.61 | 4.99 | 7.25 | |
Table 5.
Summary of Bomb Calorimeter Tests Fir Toner Plastics ABS Sample.
| Parameter | Sample Mass , g | DT Bomb, oC | P final, atms | DQ, kJ | u, MJ/kg | HHV, MJ/kg |
|---|---|---|---|---|---|---|
| Test 1 | 0.970 | 3.70 | 26.86 | 33.011 | 34.032 | 34.992 |
| Test 2 | 0.960 | 3.80 | 26.84 | 33.892 | 35.304 | 36.273 |
| Test 3 | 0.970 | 3.80 | 26.87 | 33.894 | 34.942 | 35.902 |
| Test 4 | 0.970 | 3.70 | 26.86 | 33.002 | 34.022 | 34.982 |
| Test 5 | 0.970 | 3.70 | 26.86 | 33.016 | 34.997 | 34.997 |
| m | 0.968 | 3.74 | 26.86 | 33.363 | 34.468 | 35.429 |
| s | 0.0045 | 0.055 | 0.010 | 0.4838 | 0.612 | 0.615 |
| 95% Conf. Intvl. | 0.0047 | 0.057 | 0.011 | 0.5073 | 0.642 | 0.645 |
Table 6.
Summary of Bomb Calorimetry Test Results.
| Test Sample | Degrees of Freedom |
DQ, kJ Mean (m) |
DQ, kJ Std. Dev. (s) |
u, MJ/kg Mean |
u, MJ/kg Std. Dev. |
HHV, MJ/kg Mean |
HHV, MJ/kg Std. Dev. |
|---|---|---|---|---|---|---|---|
| Toner Plastics | 4 | 33.36 | 0.484 | 34.47 | 0.612 | 35.43 | 0.615 |
| Atomic Filaments | 4 | 34.25 | 1.011 | 34.75 | 1.218 | 35.69 | 1.224 |
| IC3D Black | 4 | 33.00 | 0.012 | 34.24 | 0.324 | 35.20 | 0.333 |
| ABSPlus | 4 | 33.34 | 0.032 | 34.32 | 0.341 | 35.29 | 0.349 |
| Generic Natural | 4 | 34.25 | 0.450 | 34.40 | 0.515 | 35.36 | 0.517 |
| ABS-R | 4 | 33.03 | 0.045 | 34.32 | 0.261 | 35.28 | 0.267 |
| Bambu Labs Black | 4 | 33.39 | 0.462 | 34.51 | 0.580 | 35.48 | 0.583 |
| m | 34 | 33.53 | 34.496 | 35.424 | |||
| s | 0.665 | 1.519 | 1.475 | ||||
| 95% Conf. Intvl. | 0.337 | 0.61 | 0.253 | ||||
Table 7.
CEA Enthalpy Calculations using FTIR Mass Fraction Analysis of ABS Materials.
| Material | Hf (Mass), kJ/g | MH2O, % Concentration |
Hc (Mass), kJ/g LHV |
Hc (Mass), kJ/g HHV |
|---|---|---|---|---|
| ABS-Plus | 0.891 | 24.26 | 32.54 | 35.81 |
| Generic-1 | 0.894 | 23.99 | 32.43 | 35.70 |
| ABS-R | 0.944 | 24.29 | 32.47 | 35.87 |
| Bambu | 0.894 | 24.73 | 32.55 | 35.88 |
| Generic-2 | 0.915 | 24.00 | 32.33 | 35.61 |
| Mean, m | 0.907 | 24.25 | 32.46 | 35.77 |
| Std. Dev. s | 0.022 | 0.300 | 0.221 | 0.232 |
|
95% Student-t conf. Interval |
0.028 | 0.373 | 0.150 | 0.144 |
Disclaimer/Publisher’s Note: The statements, opinions and data contained in all publications are solely those of the individual author(s) and contributor(s) and not of MDPI and/or the editor(s). MDPI and/or the editor(s) disclaim responsibility for any injury to people or property resulting from any ideas, methods, instructions or products referred to in the content. |
© 2026 by the authors. Licensee MDPI, Basel, Switzerland. This article is an open access article distributed under the terms and conditions of the Creative Commons Attribution (CC BY) license (http://creativecommons.org/licenses/by/4.0/).
Copyright: This open access article is published under a Creative Commons CC BY 4.0 license, which permit the free download, distribution, and reuse, provided that the author and preprint are cited in any reuse.


