

Submitted:
09 March 2026
Posted:
10 March 2026
You are already at the latest version
Abstract
Universal Accessibility in Astronomy requires a paradigm shift from visual-centric communication to multisensory data interaction. This article explores the development and evaluation of a low-cost, multimodal tool designed to represent complex astronomical concepts—specifically stellar magnitude and color—through tactile and auditory stimuli. Unlike traditional methods, our approach focuses on the haptic-cognitive link, allowing users to "feel" data through physical relief models. We present a structured impact study involving a heterogeneous group of blind, low-vision, and sighted participants.The methodology followed a mixed-methods approach, including a participatory workshop with 20 individuals and a detailed usability assessment with a core group (N=6) of participants. Preliminary results from this pilot phase demonstrate that the multimodal integration effectively reduces the perceived mental effort for complex spatial data comprehension. Quantitative and qualitative feedback suggests that tactile-auditory sensory substitution not only improves accessibility but also enhances engagement and information retention across all user groups. These findings highlight the potential of multimodal models in transforming public scientific environments, such as museums and observatories, into inclusive, interactive spaces.
Keywords:
user center design
; cross-modal mapping
; haptic perception
; multimodal astronomy
1. Introduction
Within academia, science outreach has traditionally been perceived as a low-status task. However, the "translation" and "interpretation" of scientific research and content for general audiences and diverse public is not a minor topic: it requires specialized and interdisciplinary teams to innovate, and also generate resources that produce an impact.
There are certain foundations on which commitments to the community are based when it comes to outreach activity, such as trust, competence and warmth or empathy in dealing with people; these characteristics are not stable, they are not seen in all cases as necessary when communicating science with the public and therefore, the execution of many programs in this area is ineffective, in the sense of reducing the gap between scientists and non-scientists [16]. When discussing Inclusive Science Outreach, the proposal of "universality" in content production entails creating resources for everyone, fostering community engagement, and prioritizing educational efforts and professional development as the foundation of the activity.
The dissemination of science involves sharing knowledge, discoveries, and technological advancements with the general public, including non-scientists. One of the ways to reach diverse audiences is through science exhibitions, museums, and, in recent years, thanks to science and technology exhibitions in large spaces, interactive installations and performances, allowing public participation in the approach to knowledge. On the other hand, there is currently greater awareness of the need for a multisensory approach to science education through tools that allow multimodal access to knowledge. Accessibility involves the development of resources specifically designed to accommodate various disabilities—such as blindness, deafness, and attention deficit disorders—while also offering value to non-disabled persons.
Inclusive education in the field of astronomy focused on accessibility, through a multidisciplinary approach that brings space closer to Earth using specialized resources and tools [17,18], with preeminence in tactile models of the celestial objects such as stars, galaxies and nebulas [19,20].
In recent years specific tactile models are being proposed: for galaxies [7]; for stars [31]; for Eta Carinae Homunculus [41]; and statistical studies, analysing the impact of the models [2], support the idea of the positive reception of these tools by different audiences. The use of innovative softwares to produce detailed 3D representations of complex images, as the Cosmic Microwave Background [10,15], the sonification of data [8], models that proposes the use of the sense of taste to explore the content of the universe as the G-Astronomy project (Trotta, R.: The Kitchen Theory [44]), or a multisensory approach [24], enriched the ways to show astronomy for all. This multisensory strategy fosters the development of diverse skills in individuals of all abilities.
To assess the impact and satisfaction of users engaging with multimodal outreach materials, it is essential to establish control or focus groups that enable evaluation of the proposal’s benefits and effectiveness. However, conducting such studies in restricted settings or with small sample sizes poses significant challenges. For this reason, the project was designed from the outset for implementation in a broad public context, targeting diverse audiences and enabling effectiveness monitoring without prior bias.
This context was provided by special science exhibition as Tecnópolis [42], initially in its Buenos Aires editions from 2011 to 2016, and later through its traveling exhibitions, which offered unprecedented opportunities for large-scale visitor feedback. Beyond Tecnópolis, other initiatives have also contributed, such as citizen science projects like ReInForce [38]. These proposals and projects, incorporated tactile materials and sonification techniques, as the sonoUno software [8,40]; [13] to further spark public interest in science, in a multimodal framework.
Finally, this article describes the design, evaluation and exploitation of a "thermal constellation", in which the colors of the stars are in connection with the temperatures, beyond the initial models in which only the magnitude issue was considered. The goal of this work is not to achieve population-wide final general acceptance or a generalization in the results, but to demonstrate that the thermal-tactile mapping of astronomical data is physically perceptible and cognitively intuitive for the end-user.
2. Multimodality in Astronomy
Astronomy for Inclusion is often associated with the development and adaptation of tools and resources for people with visual impairments. In the case of this work, we do not follow this partial approach to the topic. We prefer to talk about a multimodal or multisensory approach [33,46,49]. On the other hand, the sense of vision covers a broad spectrum of possibilities, from perfect vision to total blindness. A person with low vision presents problems such as difficulty perceiving shapes, colors, contrasts, distances, textures, or adjusting the eye to the light-dark perception, as well as a reduction of the visual field, in the case of diminished night vision [47]. These characteristics may be present in the person from birth or may have been acquired with age, and in this sense, the inclusion in sciences also includes elderly people.
Blind or visually impaired people shift their environmental interaction towards auditory (which may also be affected in elderly persons), olfactory/taste, and tactile information, relying on more complex mental spatial representations to locate objects [47]. The loss of vision does not immediately translate into an improvement in other senses, because the cognitive domain is part of the communication between the brain and the world [28], and a set of abilities needs to be trained. Among people with visual impairments, the tactile sense tends to become more refined through continuous and purposeful use. However, this enhanced perceptual capacity often remains unrecognized until specific situations demand its application, for instance, in the detection of temperature variations, the experience of physical injury, or interaction with textured surfaces. Many times sight is not enough for the mental images of some object, and we need to complement the vision of it with touch (for example, feeling the texture of a fabric or the surface of a table or wall, or recognizing the shape of a body, or detecting the temperature).
Experiences involving the design, installation, and implementation of universal models integrate multiple disciplines, foster cooperative work and mutual learning, and support specialized training of human resources.
One of these developments, the Planetarium for the Blind, presented for the first time in 2011 [17] (Figure 1), is a proposal that aims to bring the sky closer to mostly blind populations through a multi sensory experience, by allowing us to raise our arms and, through touch, recognize the constellation forms andd stars that appear in them, bringing us closer not only to the fact that the sky is above our heads, but incorporating resources that allow us to distinguish, for example, between the different magnitudes and surface temperatures of the stars. On the other hand, this planetarium is an immersive experience that reproduces the conditions of a night of observation, appealing to the ear (to identify animals of the nocturnal ecosystem), to the touch from the point of view of cutaneous thermal detectors (since at night the temperature is lower than during the day) and smell (because through a series of aromatizations the perfume of grass and earth is perceived, in a country environment). This resource is also adapted for deaf visitors.
Perhaps the most important conclusion about this proposal is that not only do people with disabilities feel included in the experience, but those visitors without obvious disabilities notice the multiple ways in which human beings connect with the world.
The commonly used forms of tactile images consist of 2D (tactile graphics) and 3D (tactile models) representations.
The skin has multiple receptors that permit the tactation, the sensation perceived by the sense of touch. Touch is used in many ways to connect our brain with the environment. The tactile stimulation is linked with mechanoreceptive units, which react to different stimuli, pressure, temperature, and electric signals; in this sense, several works propose different displays to give access to new ways to exchange information with blind and motor-disabled people, mainly, but also deaf people [12].
The key parameters that determine the design of a tactile display for each receptor include:
- sensor spatial resolution and sensitivity,
- temporal processing properties (e.g., adaptation and summation),
- spatial characteristics of sensory processing, and
- information processing delays.
The skin contains several classes of mechanoreceptors with respective sensory modalities. Four types of mechanoreceptors are embedded at different depths within the skin tissue [3,4]. On the palm, Meissner corpuscles (superficial) and Pacinian corpuscles (deep) are located approximately 0.7 mm and 2 mm beneath the surface, respectively. Among these, Merkel cells (pressure), Meissner corpuscles (low-frequency vibration), and Pacinian corpuscles (high-frequency vibration) are the most commonly used in tactile display applications. Merkel cells and Meissner corpuscles are found at depths of 0.7–0.9 mm, while Pacinian corpuscles are deeper, at around 2 mm (see Figure 2).
The microstructure of a surface fundamentally influences its perceptual attributes - specially in terms of the roughness - smoothness spectrum and provides tactile cues essential for the sensory discrimination and identification of materials such as paper, leather, metal, or glass. According to Katz (1989), fingers are more sensitive to substance-related properties—such as temperature, hardness, and texture—than to shape-related ones like form, size, weight, or volume. His studies show high accuracy in haptic discrimination of texture and hardness, especially when there is rotational movement between the hand and the surface.
Touch can be categorized as passive or active [22]. Passive touch occurs when the stimulus is applied to a static contact area of the skin. In contrast, active touch involves intentional exploratory movements of the fingers, which are adapted to the type of information being sought.
The tactile perception of specialized symbols and other complex concepts within maps or two-dimensional representations underscores the critical importance of optimizing tactile information. This optimization should be achieved through user-centered design methodologies, ensuring that the message is both accessible and meaningful for diverse users, particularly those with touch as a primary sensory modality. For example, two lines separated by at least 1.3 mm are perceived as separate lines. The optimal elevation for tactile graphics, at which resources are minimized and performance is maximized, appears to be around 200 microns [26]. In this sense, it is important to note that there are areas of the hand with maximum sensitivity and analize how people with a tactile learning modality, which could be all people, use the sensors in the hand. The presence of sensors on the fingers of the hand is notable and are used when perceiving textures, temperatures, elevations, and depressions on surfaces, such as on maps, and even when reading a text in Braille code.
Even taking into account the bibliography, a user center desing is needed; the absence of user feedback can lead to the development of materials that fail to effectively convey specific concepts, such as identifying key reference points, understanding spatial relationships, and interpreting the overall structure of a diagram. The mental model of the blind user can not be adjusted to the real world without user-centered design.
3. Tactile Models
3.1. Visual and Only-Tactile-Relief Models
Several works have explored the fabrication of objects with tactile properties [14,35], fabricated texture plates from a set of visual textures converted to shallow height maps, asked human subjects to rate the resulting textures according to a set of adjectives (including "rough"), and analyzed a set of computational texture features to find those highly correlated with the perceptual scales.
Other work in the fabrication domain has aimed to facilitate the incorporation of tactile properties in 3D printed models. Torres et al. (2015) [43] provide an interface to fabricate objects with user-specified weight, compliant infill, and rough displacement maps. Chen [11] also developed methods to fabricate objects with specified deformation behavior and textured surface displacement. Tymms et al. [45] presented a perceptually based model for evaluating the tactile roughness of surface textures obtained with a 3D printer.
Over the years, different scaled models have been developed in the framework of the present study for the education and dissemination of Astronomy using relief maps of stars. Probably the most widely spread tools are tactile. Users tend to prefer thermoformed and microcapsule paper for tactile representations [39]; however, these materials lack long-term durability. To determine the most effective method for representing stars, asterisms, and accompanying Braille descriptions using a universally accessible technology, multiple trials were conducted with 3D-printed models.
In Figure 3, the constellations of Orion and Scorpius are shown. From the feedback with the users, the representation of the faintest stars was changed, from cylinders to semi-spheres, and for Braille code, the final print was connected with the "best perception" for the blind users. One of the common comments at the moment of detecting the small features on the printed model is about the texture; in the case of Braille, the texts must be felt as soft, easy to touch, and the word used when the perception is not adequate is that the text is perceived as "aggressive".
Due to the limitations of 3D printing for large-scale models—primarily in terms of production time and cost—we investigated alternative representational methods that integrate both tactile and visual components, specifically through the incorporation of LEDs. This includes the electronic control of these lights, which permits an original design involving technicians and engineers. As outlined in Section 1, this exploration led to the development of a specialized planetarium designed mainly for users with visual impairments. It consists of a dome covered with LEDs representing the stars with different sizes (magnitudes). Beyond their primary purpose for visually impaired users, these resources are also appealing to sighted individuals. The LED lighting not only enhances visibility but also conveys additional information—such as color—which can be used to represent the surface temperature of a star in the model [17,18]. The Planetarium represents the southern sky as seen in May. This choice was made to align with a significant moment in Argentine history, serving as a way to connect astronomy with the sky of a memorable time.
This type of proposal is accessible to the blind, because people can touch the stars and recognize the different patterns (asterisms, constellations), dimension of the represented stars (associated with the magnitude, using the same approach than the used in the star maps) to understand the meaning of the magnitude, a diameter of a circle represents the "brightness" of the star: big, means more energy, small circle reppresents less energy, and then, a fainted stellar object.
3.2. Portable Constellations
Following the development of the planetarium and user feedback, the proposal evolved into individual portable constellations—also equipped with LEDs—designed for use in classrooms or auditoriums (Figure 4). However, the model required improvement, as it is essential for visually impaired individuals to have the opportunity to imagine and experience a realistic environment—not only through textures, sizes, and material properties, but also through temperature.
Visual and tactile-relief-thermal model implementation
Heat and temperature are also important modalities of the sense of touch. While the skin may seem sensitive to temperature, its receptors do not register absolute temperature values; rather, they respond to the flow of thermal energy. As a result, temperature differences contribute to the qualitative perception of touch. In this context, the ability to perceive two nearby points (e.g., two stars) and the use of varying or similar temperatures increase the effectiveness of this type of device by stimulating different skin actuators (Figure 5).
Experiments have shown that humans can discriminate between spatially distinct thermal stimuli based on the flow of heat perceived through the skin [23,25,27].
A challenge of this kind of development is to include in the model both characteristics: brightness (magnitude) and surface temperature (color of the stars ) for blind people. Exploiting the modalities of the skin’s sensors, previously described, the systems implemented so far can be classified into the following major categories based on:
- static pressure (mechanical energy), and
- thermal flow (temperature difference).
The star magnitude concept was solved using different LEDs, which present different sizes, good to explain the concept of magnitudes. In addition, present a set of colors, appropriated to explain surface temperature for not blind people, because the highest temperatures in the star are perceived as blue, and the lower as red, for the blind adaptation was needed to include the tactile perception of the temperature, and this is the base of this innovation.
The following sections describe the design, supplies, and construction of a constellation made with incandescent lamps, which represent stars with different temperatures, including the issue of magnitude.
3.3. Thermal Model: Design and construction
The design of the thermal model was informed by user feedback from previous multimodal projects, prioritizing ergonomic dimensions and the tactile requirements of diverse users. This development responds to consistent demand observed during years of testing and exhibitions; consequently, we believe a comprehensive description of this resource is essential. In an era dominated by digital interfaces and AI, presenting a hand-on, as the tactile-thermal proposal is a core objective of our research group. Our goal is not to overlook new technologies, but to highlight the importance of an analog approach to knowledge, recognizing that both digital and physical methods are complementary in achieving a deeper understanding of nature.
Due to its relative simplicity, considering the brightest stars (until magnitude 4) and the variety of colors, the Scorpio constellation was chosen to prepare a prototype for a thermal model. Figure 6 shows the constellation and distribution of stars with the identification and color assigned to each object, according to their temperature. Table 1 details the magnitude and spectral type/color of each selected star.
The stars with apparent magnitudes between 1.6 and 3.6, were organized in 3 ranges of brightness, assigning the LED diameters (10, 8, and 5 mm); according to the spectral types, the objects were organized in 3 groups, assigning the colors (Blue, Yellow, and Red), as presented in Figure 6 and Table 1.
The prototype design includes:
- Thermal Actuators: Incandescent micro-lamps (T5, 12V/12W) were used as electrical-to-thermal energy transducers.
- Intensity Control: Temperature modulation was achieved using variable voltage regulators (based on the LM317 integrated circuit), allowing precise calibration of three thermal ranges representative of the spectral classes:
Class M (Cold): 27 °C (Simulating red stars).
Class G (Medium): 35 °C (Simulating yellow stars).
Class O/B (Hot): 45 °C (Simulating blue stars).
To represent the stars and cover the lamps, specially designed caps were 3D printed, taking into account three different measurements: 8 mm, 10 mm and 12 mm (Figure 7, right) and using 3 different colors: red, blue and yellow, which covers the set of stars selected in the constellation. Each cap is 15 mm high, allowing the same lamp to be used for all magnitudes of stars involved. ABS material was used for the lamp caps as it has a melting temperature above 200 °C, which prevents the plastic from melting when the lamp reaches 55 °C on its surface, the maximum temperature programmed for the model.
User interface: the final scaled model of the constellation Scorpio is presented in Figure 8: the box dimensions (left), which can be considered as a "haptic interaction matrix" with specific dimensions, enabling bimanual scanning and different magnitudes-size and surface temperature-colors (right).
4. Testing the Haptic Interface
In sensory design, it is essential to enable visually impaired individuals to perceive spatial atmospheres through different textures, temperatures, and material qualities. The skin translates tactile stimuli into neurochemical signals that support both mental imagery and emotional responses [1,37]. Higher material fidelity improves the accuracy of these internal representations. Therefore, realism in tactile models is key to effectively conveying environmental experience.
To evaluate the thermal performance of the model and the thermal perception of blind and sighted users, several tests were conducted. The final version of the model was presented in high-impact exhibitions (see Figure 9 and Figure 10).
Active touch enables up to 95% accuracy in perceiving abstract or unfamiliar objects, while passive touch yields only about 45% accuracy [21]. However, passive touch plays a key role in detecting temperature differences or changes. In both cases, the tactile system must integrate information acquired progressively and across multiple dimensions.
From a neurophysiological perspective, the interface addresses two important aspects:
- Selective Stimulation: The design leverages the density of Meissner’s corpuscles and Merkel discs in the fingertips for texture discrimination (magnitude), while thermoreceptors (C and A-delta fibers) decode spectral information (color).
- Kinesthetic Perception: By utilizing the Scorpius asterism, kinematic exploration is encouraged, allowing the user to construct a spatial mental map based on the relative position of the actuators.
The experience during exhibitions and workshops confirms that people can perceive subtle thermal differences between materials through touch, even when the absolute temperature differences are minimal, and the mulimodality is of interest not only to blind individuals, but also to those who are color blind or visually impaired, as it helps convey concepts related to the relationship between color and temperature. Multimodality also has an impact on users with a predominantly visual learning profile.
5. Pilot Qualitative Study with a Target User Group
A very recent (2025) multimodal experience that allowed for the inclusion of all tactile-relief, tactile-thermal, and auditory resources, including transducer devices for transforming color into sound, was conducted. The activities were organized in workshops of 3 hours, once a week, for 2 month. The experience was not just important to understand in which way the brain can organize the same information detected by different senses, but to reinforce the original thesis about the importance of a multimodal approach to nature (Figure 11 and Figure 12).
The participants completed a free exploration phase followed by a guided identification task. A workshop was conducted with 20 participants to evaluate the initial interaction.
For a pilot qualitative analysis of cognitive load and diagnostic accuracy, a core group of 6 participants, Blind and Low-Vision (BLV), were selected and fully completed the usability assessment. Their responses allowed for the identification of critical patterns in thermal perception, asterism recognition in principle.
This study was conceived as a qualitative usability pilot for a novel multimodal thermal device, rather than a large-scale statistical validation and the followed methodological approach aligns with established standards, suppoted by the usability frameworks of Nielsen (1993) [32]. Within the fields of Assistive Technology and Human-Computer Interaction (HCI)—particularly when engaging with specialized populations such as the BLV community—a sample size of n=6 is widely recognized as sufficient for the identification of primary usability barriers and the validation of a "proof-of-concept", and to uncover the vast majority of core interaction issues in high-fidelity prototypes. Consequently, the current sample size provides a robust foundation for assessing the device’s functional viability and informing future iterative designs.
To complete this pilot study, we introduced the sonification of the data as well as the transduction of magnitud (brightness) and temperature color into sound, thanks the availability of sonoUno software [9], the LightSound device [5] and a prototype of the Orchestar [6]. The LightSound was designed to be used during the eclipses, and the Orchestar permits to transform color into sound, and both transduce exactly what was important for the experience: the sound frequency change from low (faint star) to high (bright stars) and the color of each star is correctly transformed into sound, acording the scale: red low temperature-low frecuency and blue high temperature-high frecuency.
Moreover, some exaples of extended astronomical objects as nebulae, were presented. In these cases, the full collor images (with high contrast and resolution for sonorizetion), and tactile 3d-printed models of the same objects, were used.
The questions related to the thermal constellation were relevant to this study, but the entire study is presented since it was carried out in a combined manner and comparing between modalities.
To ensure the validity and reliability of the results, a Reflective Thematic Analysis was employed, and patterns associated with specific themes were identified through the collected responses.
Beyond the coments by the participant during the experience (which were also collected), specific questions asked to they were:
- What did you think of the multisensory materials you used?
- What is your opinion about the relief map of the constellations?
- What is your opinion about the thermal constellation?
- Are there any aspects you would like to see improved?
- What do you think you have learned from these models?
- What would you change about their presentation?
- Do you prefer models that are only tactile, or does the addition of thermal elements aid understanding?
- What do you think about the sound effects for the colors of the stars or nebulae?
- Did working with these models change your relationship with astronomy or your understanding of science?
The raw information (presented in Table 2 and Table 3) was processed following the recommended methodology:
- reading the responses (in some cases then transcription from audio to text was needed) to identify units of meaning based on the participants’ perceptions of tactile, thermal, and auditory stimuli;
- common themes were grouped into three dimensions: Usability (simplicity, novelty, synergy between senses), pedagogical effectiveness (understanding and learning of scientific concepts), and emotional impact (inclusion, perception of science);
- analysis of multimodality, based on the comparison of simple or combined stimulus models (multiple senses: relief only, relief-thermal, relief-sound), was performed;
-
and finally, an inquiry was made into difficulties encountered, needs for change and/or improvements.From the raw responses or data in final categories, tables and matrices were used to arrive at the final numerical results.
5.1. Results of the Pilot Study
The study analyzed not only the sensory experience itself, but also the effectiveness of multimodality, concept learning, whether the experience could be improved, and whether it had an impact that modified prior ideas about science.
In this way, perceptual, cognitive, emotional, continuous improvement, and inclusion aspects were addressed:
• In the sensory dimension, tactile, thermal, and auditory models, as well as multimodal synergy (Table 2), were explored. The participants acknowledged the undeniable impact of the thermal model and multimodal synergy. Regarding tactile perception, its usefulness was recognized in all cases, most of the responses indicated a need for this model to complete the image of what was being represented. It should be noted that some of the respondents were not blind.
• In the cognitive dimension (Table 3), the participants improved upon previously acquired concepts or gained new knowledge. By working with specific aspects related to celestial objects, it was possible to quickly assess the learning; concepts such as brightness-distance, color-temperature, and color-chemical composition were clearly understood, and participants commented on how they transferred their "new" knowledge to others.
• Regarding the emotional dimension (Table 3), the high impact of the proposal in terms of interest and inclusion is noteworthy. The participants unanimously declared interest and amazement at the experience and felt completely included; they changed their idea regarding astronomy, which they considered a science forbidden to blind people, and about science in general, stating that the workshop ‘had made them think and become interested in topics related to research’.
Some of the most remarkable comments, as reflected in the survey, were:
‘I thought the sky was off-limits to us, but it wasn’t. Working with these models made me feel included, included in science, and changed my whole perspective, showing me that I could access this knowledge. I felt like I was entering such a beautiful yet mysterious world’.
‘Before learning about these models, I thought astronomy was impossible for us, except perhaps through documentaries. These models changed my perception of astronomy and science. It’s very clever to incorporate thermal and sound data, which are fundamental for us. Regarding science, this can help change other aspects; it could be a starting point for accessing other topics’.
‘It was eye-opening to see how many mistakes I had made, and in some ways, I wish I had had the knowledge from the beginning so I wouldn’t have wasted that time. I love that I’m not the same person I was when I started the workshop’.
As it is usually the case, this proposal considers the possibility of improvements, and some participants suggested incorporating a sense of smell into the multimodal approach, and dedicating more time to each workshop or experience to enhance learning, although there were no comments about exhaustion or difficulty in understanding the content. Given the heterogeneity of the participants in the experience, the questions lacked the bias that a person trained in the discipline, or members of the working group on the proposals, might have brought. It has also been noted that there is repetition in certain responses when compared with previous experiences related to the present work and with other experiences around the world [2,49]. Expressions such as "I never imagined that astronomy was also for us (blind people)," and "the combination of resources involving different senses is novel and helps in understanding the concepts and topics, with less cognitive effort" are repeated in each activity and with different audiences.
6. Conclusions
In all cases, participants highlighted the simplicity of the models.The presentation of the data using sound (not a central objective of this study, but included) was a novelty for most attendees, and acoording their words it does not increase the mental effort required for comprehension, especially for blind people, for whom hearing is one of their primary senses: the user can identify the hottest star of Scorpius (Antares) while recognizing the shape of the constellation at the same time.
From a very important emotional perspective, the proposal has a positive impact, inspiring attendees who mention that they would participate in similar experiences again and even repeat the same one. This is fundamental if the inclusion of multimodal models is being considered in spaces such as museums and exhibitions. There is also a positive response from sighted people, who realize that the use of more than one sense improves comprehension and long-term retention of both familiar and new concepts.
The personal growth of the participants is evident when they express thoughts such as: ‘Until now, astronomy was a science for experts. After the workshop, I felt encouraged to share my knowledge with others, and that’s what inclusion is all about’.
We started the development of a series of activities to be used as diagnosis to implement training classes, for different ages and environments (classroom, museums, exhibitions in general), to enlarge the "space sense" for blind people: select points and find they later, detect space orientations of lines in a plane, replicate angles, measure distances, recognize values in a 2D plot and organise near points or lines to produce a mental image to help them to move by themselves in a graphics-based world.
One important and relatively new result from the activity was the discussion and a kind of ranking of the recent tools for cell phones such as, for example, Seeing AI1, a free app designed with and for the blind and low vision community, by Microsoft. With this app it is possible, for example, transform light (brightness) into sound, scan a barcode to describe a product or recognize a face. The field of the apps for the blind and low vision community is a new line of research and also for training people: not the full community knows the available resources for them and a lot do not know how to use it.
The next phase of this work will apply new strategies aimed at studying human cognition, decision-making, and the physiological impact of “alternative visualization” of complex, non-spatial data within a specific experimental environment based on different ways of exploration.
Author Contributions
Conceptualization, Beatriz Garcia, Johanna Casado and Alexis Mancilla; Methodology, Beatriz Garcia and Johanna Casado; Software, Johanna Casado; Validation, Beatriz Garcia and Johanna Casado; Formal analysis, Beatriz Garcia and Alexis Mancilla; Investigation, Beatriz Garcia and Johanna Casado; Resources, Beatriz Garcia, Johanna Casado and Alexis Mancilla; Data curation, Beatriz Garcia; Writing – original draft, Beatriz Garcia; Writing – review editing, Johanna Casado; Visualization, Beatriz Garcia, Johanna Casado and Alexis Mancilla; Supervision, Beatriz Garcia and Johanna Casado; Project administration, Beatriz Garcia; Funding acquisition, Beatriz Garcia. All authors have read and agreed to the published version of the manuscript.
Funding
This research received no external funding.
Informed Consent Statement
Informed consent was obtained from all subjects involved in the study.
Data Availability Statement
The original contributions presented in this study are included in the article. Further inquiries can be directed to the corresponding author(s).
Acknowledgments
This work was possible thanks to the support of CONICET, the National Technological University, the Pierre Auger Observatory, the International Astronomical Union, and also many engineers, technicians, students and other people who contribute with ideas, suggestions and testing or enjoying the models. For the training courses in 2025, the support by the University of Mendoza, Malargue Municipality and the Luis Braille Association in Mendoza were fundamental for the success of the work.
Conflicts of Interest
The authors declare no conflicts of interest.
References
- Ackerley, R; Carlsson, I; Wester, H; Olausson, H; Backlund Wasling, H. Touch perceptions across skin sites: differences between sensitivity, direction discrimination and pleasantness. Front Behav Neurosci 2014, 8, 54. [Google Scholar] [CrossRef] [PubMed] [PubMed Central]
- Arcand, K.; Jubett, A.; Watzke, M.; Price, S.; Williamson, K.; Edmonds, P. Touching the stars: improving NASA 3D printed data sets with blind and visually impaired. JCOM 2019, 18(04), A01. [Google Scholar] [CrossRef]
- Asamura, N.; Tomori, N.; Shinoda, H. A Tactile Feeling Display Based on Selective Stimulation to Skin Receptors. In Proceedings of the IEEE, Virtual Reality Annual International Symposium, Atlanta, Georgia, March 1998; 1988. [Google Scholar] [CrossRef]
- Asamura, N.; Yokoyama, N.; Shinoda, H. Method of selective stimulation to epidermal skin receptors for realistic touch. Proceedings of IEEE Virtual Reality ’99 Conference, 1999. [Google Scholar] [CrossRef]
- Bieryla, A.; Diaz-Merced, W.; Diaz-Merced, W.; Davis, D.; Hyman, S.; Hyman, S.; Troncoso Iribarren, P.; García, B.; Labbe, E. LightSound: The sound of an eclipse. *Communicating Astronomy with the Public Journal* 2020, 14(2), 38–42. [Google Scholar] [CrossRef]
- Bieryla, A. Orchestar-color Arduino. 2019. Available online: https://astrolab.fas.harvard.edu/orchestar.html (accessed on 02-02-2026).
- Bonne, N. J.; Gupta, J. A.; Krawczyk, C. M.; Masters, K. L. Tactile Universe Makes Outreach Feel Good. Astron. Geophys. 2018, 59(1), 1.30–1.33. [Google Scholar] [CrossRef]
- Casado, J.; De La Vega, G.; Díaz-Merced, W.; Gandhi, P.; García, B. Sonouno: a user-centred approach to sonification. Proceedings of the International Astronomical Union 2019, 15(S367), 120–123. [Google Scholar]
- Casado, J.; De la Vega, G.; García, B. SonoUno development: a User- Centered Sonification software for data analysis. Journal of Open Source Software 2024. [Google Scholar] [CrossRef]
- Casado, j.; García, B. A multimodal approach to data analysis in Astronomy: sonoUno applications in photometry and spectroscopy. RAS Techniques and Instruments 2025, Volume 3(Issue 1), 625–635. [Google Scholar] [CrossRef]
- Chen, D.; Levin, David I. W.; Didyk, D.I.W.; Sitthi-Amorn, P.; Matusik, W. Spec2Fab: A reducer-tuner model for translating specifications to 3D prints. ACM Transactions on Graphics (TOG) 2013, 32(4), 135. [Google Scholar] [CrossRef]
- Chouvardas, V. G.; Miliou, A. N.; Hatalis, M. K. Tactile displays: Overview and recent advances. Displays 2008, 29(3), 185–194. [Google Scholar] [CrossRef]
- De La Vega, G.; Dominguez, L. M. E.; Casado, J.; García, B. Sonouno web: An innovative user-centred web interface. HCI International 2022–Late Breaking Posters: 24th International Conference on Human-Computer Interaction, HCII 2022. Proceedings, Part I, 2022; Springer Nature Switzerland; pp. 628–633. [Google Scholar]
- Elkharraz, G.; Thumfart, S.; Akay, D.; Eitzinger, C.; Henson, B. Making tactile textures with predefined affective properties. IEEE Transactions on Affective Computing 2014, 5(1), 57–70. [Google Scholar] [CrossRef]
- Farjo, C.; Casado, J.; García, B. The CMB In 3D: tactile models as an educational and outreach resource for Astronomy. In Proceedings of the RAAA67, BAAA, 2025; in press; Vol. 67. [Google Scholar]
- Fiske, C. H. Gaining trust as well as respect in communicating to motivated audiences about science topics. In Proceedings of the National Academy of Sciences, September 2014; 2014. [Google Scholar] [CrossRef]
- García, B.; Maya, J.; Mancilla, A.; Pérez Álvarez, S.; Videla, M.; Yelós, D.; Cancio, A. Touch the sky with your hands: a special Planetarium for the blind, deaf, and motor disabled. Highlights of Astronomy, August 2012; 2012; Volume 16. [Google Scholar]
- García, B.; Maya, J.; Mancilla, A.; Pérez Álvarez, S.; Videla, M.; Yelós, D.; Cancio, A.; Broin, D.; Ferrada, R. A Multisensory Space to Teach and Learn Astronomy. EPSC Abstracts, 2013; Vol. 8, p. EPSC2013-348. [Google Scholar]
- García, B. La trama celeste: por qué educar en astronomía. Una oportunidad de aprendizajes múltiples. Boletín de la AAA 2016, vol.58, 331–337. Available online: https://articles.adsabs.harvard.edu/pdf/2016BAAA...58..331G.
- García, B; Mancilla, A.; Maya, J.; Pérez, S.; Yelós, D.; Cancio, A.; Castro, J. Astronomía para la Igualdad y la Inclusión, en CIEDUC2017, marzo 2017, Mendoza, Argentina; Ed. Universidad de Alcalá de Henares, 2017; Volume 2017, pp. 270–79. Available online: http://www.cieduc.org/2017/LibroCIEDUC2017-Volumen1.pdf.
- Gibson, J. J. Observations on active touch. Psychological Review 1962, 69(6), 477–491. [Google Scholar] [CrossRef] [PubMed]
- Gibson, J. J. The senses considered as perceptual systems; Houghton Mifflin: Boston, 1966. [Google Scholar]
- Green, B. G. Localization of thermal stimuli to the hand: Evidence of a central mechanism of thermal sensitivity. Perception & Psychophysics 1977, 22(4), 331–337. [Google Scholar]
- Gruber, D. Astronomy for all Senses. CAPjournal 2019, No. 25. [Google Scholar]
- Ho, H.-N.; Jones, L. A. Thermal and tactile integration in the perception of touch. Journal of Neurophysiology 2006, 96(3), 1664–1673. [Google Scholar]
- Jehoel, S.; McCallum, D.; Rowell, J.; Ungar, S. An empirical approach on the design of tactile maps and diagrams: the cognitive tactualisation approach. British Journal of Visual Impairment 2006, 24(2), 67–75. [Google Scholar] [CrossRef]
- Jones, L. A.; Berris, M. The psychophysics of temperature perception and thermal-interface materials. Proceedings of the Human Factors and Ergonomics Society Annual Meeting 2002, 46(21), 1735–1739. [Google Scholar]
- Kastrup, V. A invenção na ponta dos dedos: a reversão da atenção em pessoas com deficiência visual. Psicologia, em Revista 69, Belo Horizonte 2007, v. 13(n. 1), 69–90. [Google Scholar]
- Katz, D. The world of touch; Lawrence Erlbaum Associates: NJ, 1989; Available online: https://www.taylorfrancis.com/books/.
- Ktchen Astronomy. Available online: https://kitchen-theory.com/g-astronomy-the-universe-at-the-tip-of-your-tongue/ (accessed on 02-02-2026).
- Neves, M.; Almeida, M.; Miquelin, A.; Silva, J.; Lima, C.; Nascimento, C. Stars Beyond Sight: Developing a Universally Accessible 3D Tactile Resource for Teaching Constellations to Visually Impaired Learners 1. 2025. [Google Scholar]
- Nielsen, J. Usability engineering; Academic Press, 1993. [Google Scholar]
- Obrist, M.; Velasco, C. Multisensory Experiences: Formation, Realization, and Responsibilities. Communications of the ACM 2025, 68. [Google Scholar] [CrossRef]
- OpenStax CNX. Somatosensation; Modified, 2017; Available online: https://archive.cnx.org/contents/b32f61fc-5fab-4b07-bcc8-e455aa4a903d@6/.
- Piovarči, M.; Rebello, D.I.W.; Chen, J.; Ďurikovič, D.; Pfister, R.; Matusik, W.; Didy, P. An interaction-aware, perceptual model for non-linear elastic objects. ACM Transactions on Graphics (Proc. SIGGRAPH) 2016, 35(4), 55. [Google Scholar] [CrossRef]
- Pohl, I.M.; Loke, L. Engaging the sense of touch in interactive architecture. OZCHI, 2012. [Google Scholar] [CrossRef]
- Ramachandran, V.; Brang, D. Tactile-emotion synesthesia. Neurocase 2008, 14(5), 390–9. [Google Scholar] [CrossRef]
- ReInForce Projet. 02 02 2026. Available online: https://www.reinforceeu.eu.
- Rowell, J.; Ungar, S. Felling Our Way: Tactile Map User Requirements – A Survey. In Proceedings of the 21st International Cartographic Conference (ICC) Durban; South Africa, Cartographic Renaissance Hosted by The International Cartographic Association (ICA), 2003; ISBN 0-958-46093-0. [Google Scholar]
- sonoUno software. Available online: https://reinforce.sonouno.org.ar (accessed on 02-02-2026).
- Steffen, W.; Teodoro; Madura, T. I.; Groh, J. H.; Gull, T. R.; Mehner, A.; Corcoran, M. F.; Damineli, A; Hamaguchi, K. The three-dimensional structure of the Eta Carinae Homunculus. Monthly Notices of the Royal Astronomical Society 2014, Volume 442(Issue 4), 3316–3328. [Google Scholar] [CrossRef]
- Tecnópolis (2025) Wikipedia. 16 02 2026. Available online: https://en.wikipedia.org/wiki/Tecn%C3%B3polis.
- Torres, C.; Campbell, T.; Kumar, N.; Paulos, E. HapticPrint: Designing feel aesthetics for digital fabrication. In Proceedings of the 28th Annual ACM Symposium on User Interface Software & Technology. ACM, 2015; pp. 583–591. [Google Scholar]
- Trotta, R. G-Astronomy: The Universe at the Tip of your Tongue. 2023. Available online: https://kitchen-theory.com/g-astronomy-the-universe-at-the-tip-of-your-tongue/.
- Tymms, C.; Gardner, E.P.; Zorin, D. A Quantitative Perceptual Model for Tactile Roughness. In ACM Transactions on Graphics (TOG); 2018; Volume 37, Issue 5 , Article No. 168; pp. 1–14. Available online: https://dl.acm.org/doi/10.1145/3186267.
- Varano, S.; Zanella, A. Design and evaluation of a multi-sensory representation of scientific data. Frontiers in Education 2023, 8. [Google Scholar] [CrossRef]
- Ventorini, S. E. A experiência como fator determinante na representação espacial do deficiente visual. Dissertação (mestrado), Universidade Estadual Paulista, Instituto de Geociências e Ciências Exatas, Rio Claro, 2007. [Google Scholar]
- Yamamoto, A.; Cros, B.; Hashimoto, H.; Toshiro, H. Control Of Thermal Tactile Display based on Prediction of Contact Temperature. Proceedings - IEEE International Conference on Robotics and Automation 2004, 2004(2), 1536–1541. [Google Scholar] [CrossRef]
- Zanella, A.; Harrison, C. M.; Lenzi, S.; Cooke, J.; Damsma, P.; Fleming, S. W. Sonification and sound design for astronomy research, education and public engagement. In Nature Astronomy; 2022; pp. 1–8. [Google Scholar] [CrossRef]
Figure 1.
Teachers and blind and visual impair students recognizing the constellation at the Inclusive Planetarium.The image presents different aspect of the "starry sky" at the Inclusive Planetarium: stars with different magnitudes (size-brightness) and spectral types (colors- temperature) (right)
Figure 1.
Teachers and blind and visual impair students recognizing the constellation at the Inclusive Planetarium.The image presents different aspect of the "starry sky" at the Inclusive Planetarium: stars with different magnitudes (size-brightness) and spectral types (colors- temperature) (right)
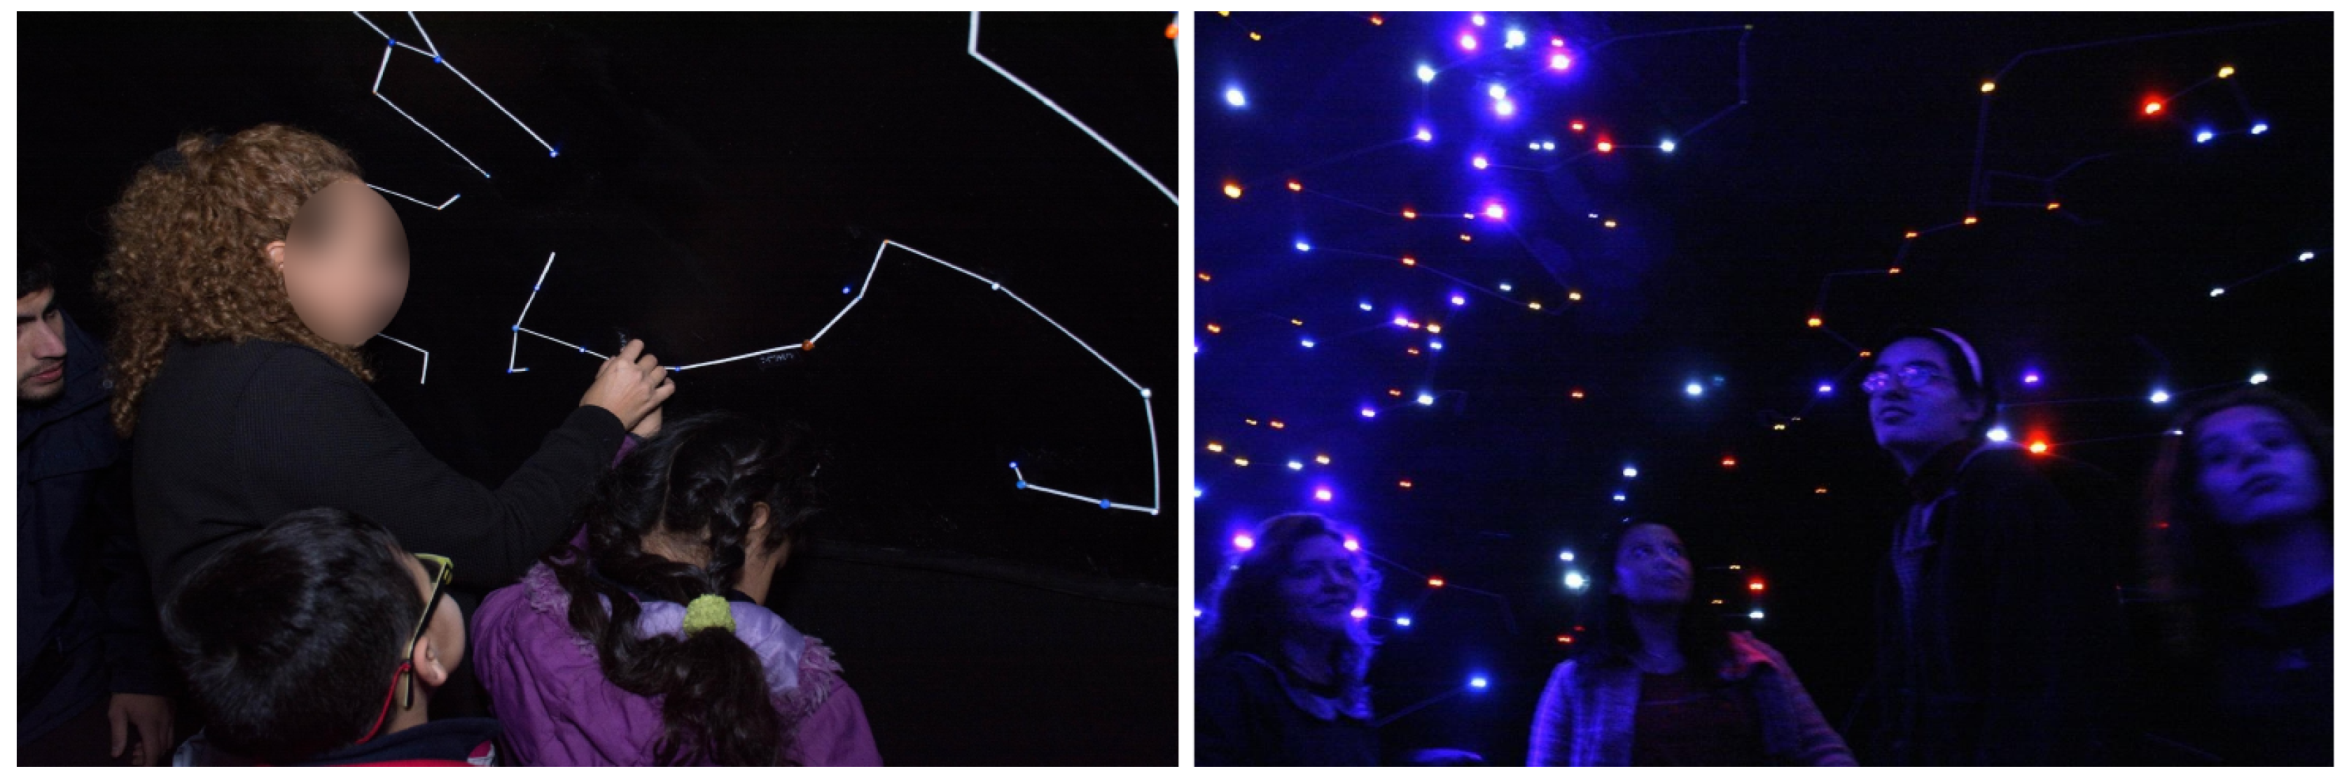
Figure 2.
Diagram of the structure of human skin and tactile receptors (Credit: free license).
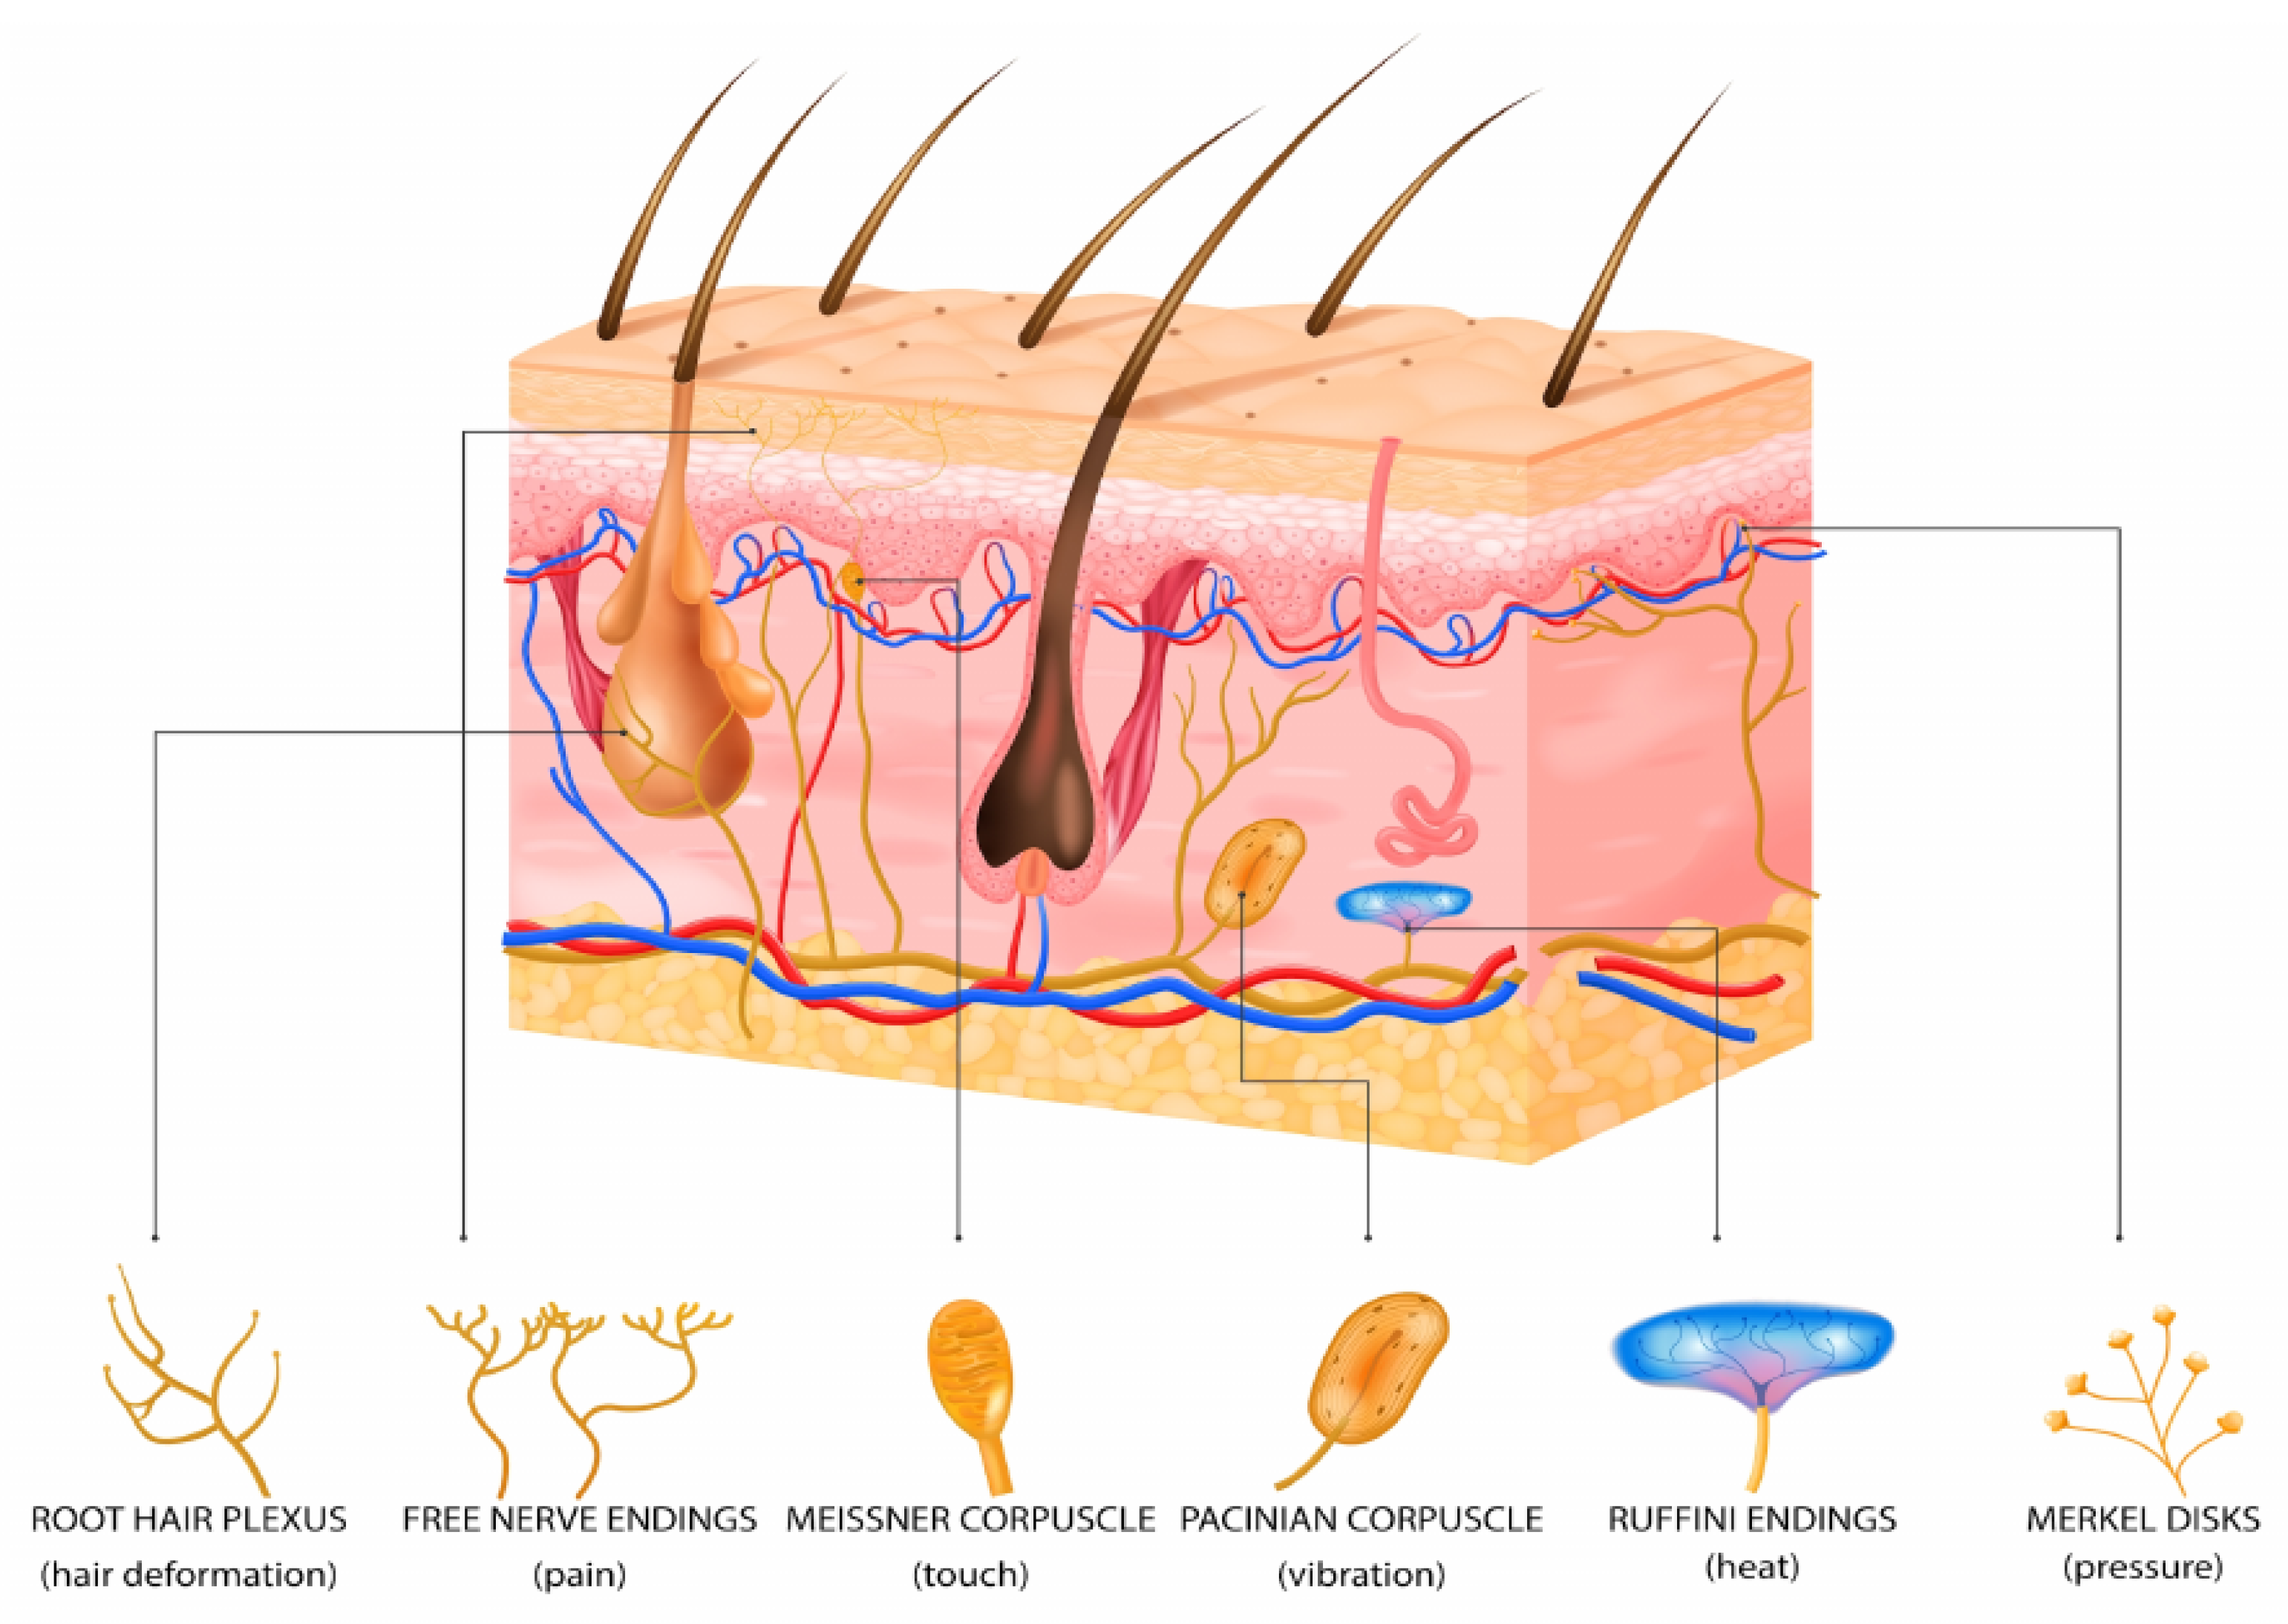
Figure 3.
Orion (left) and Scorpius (right) asterisms, in a 3D printer representation. Note that the text in Braille was included as part of the impresion.The constellations are represented as they can be seen in the northern hemisphere.
Figure 3.
Orion (left) and Scorpius (right) asterisms, in a 3D printer representation. Note that the text in Braille was included as part of the impresion.The constellations are represented as they can be seen in the northern hemisphere.
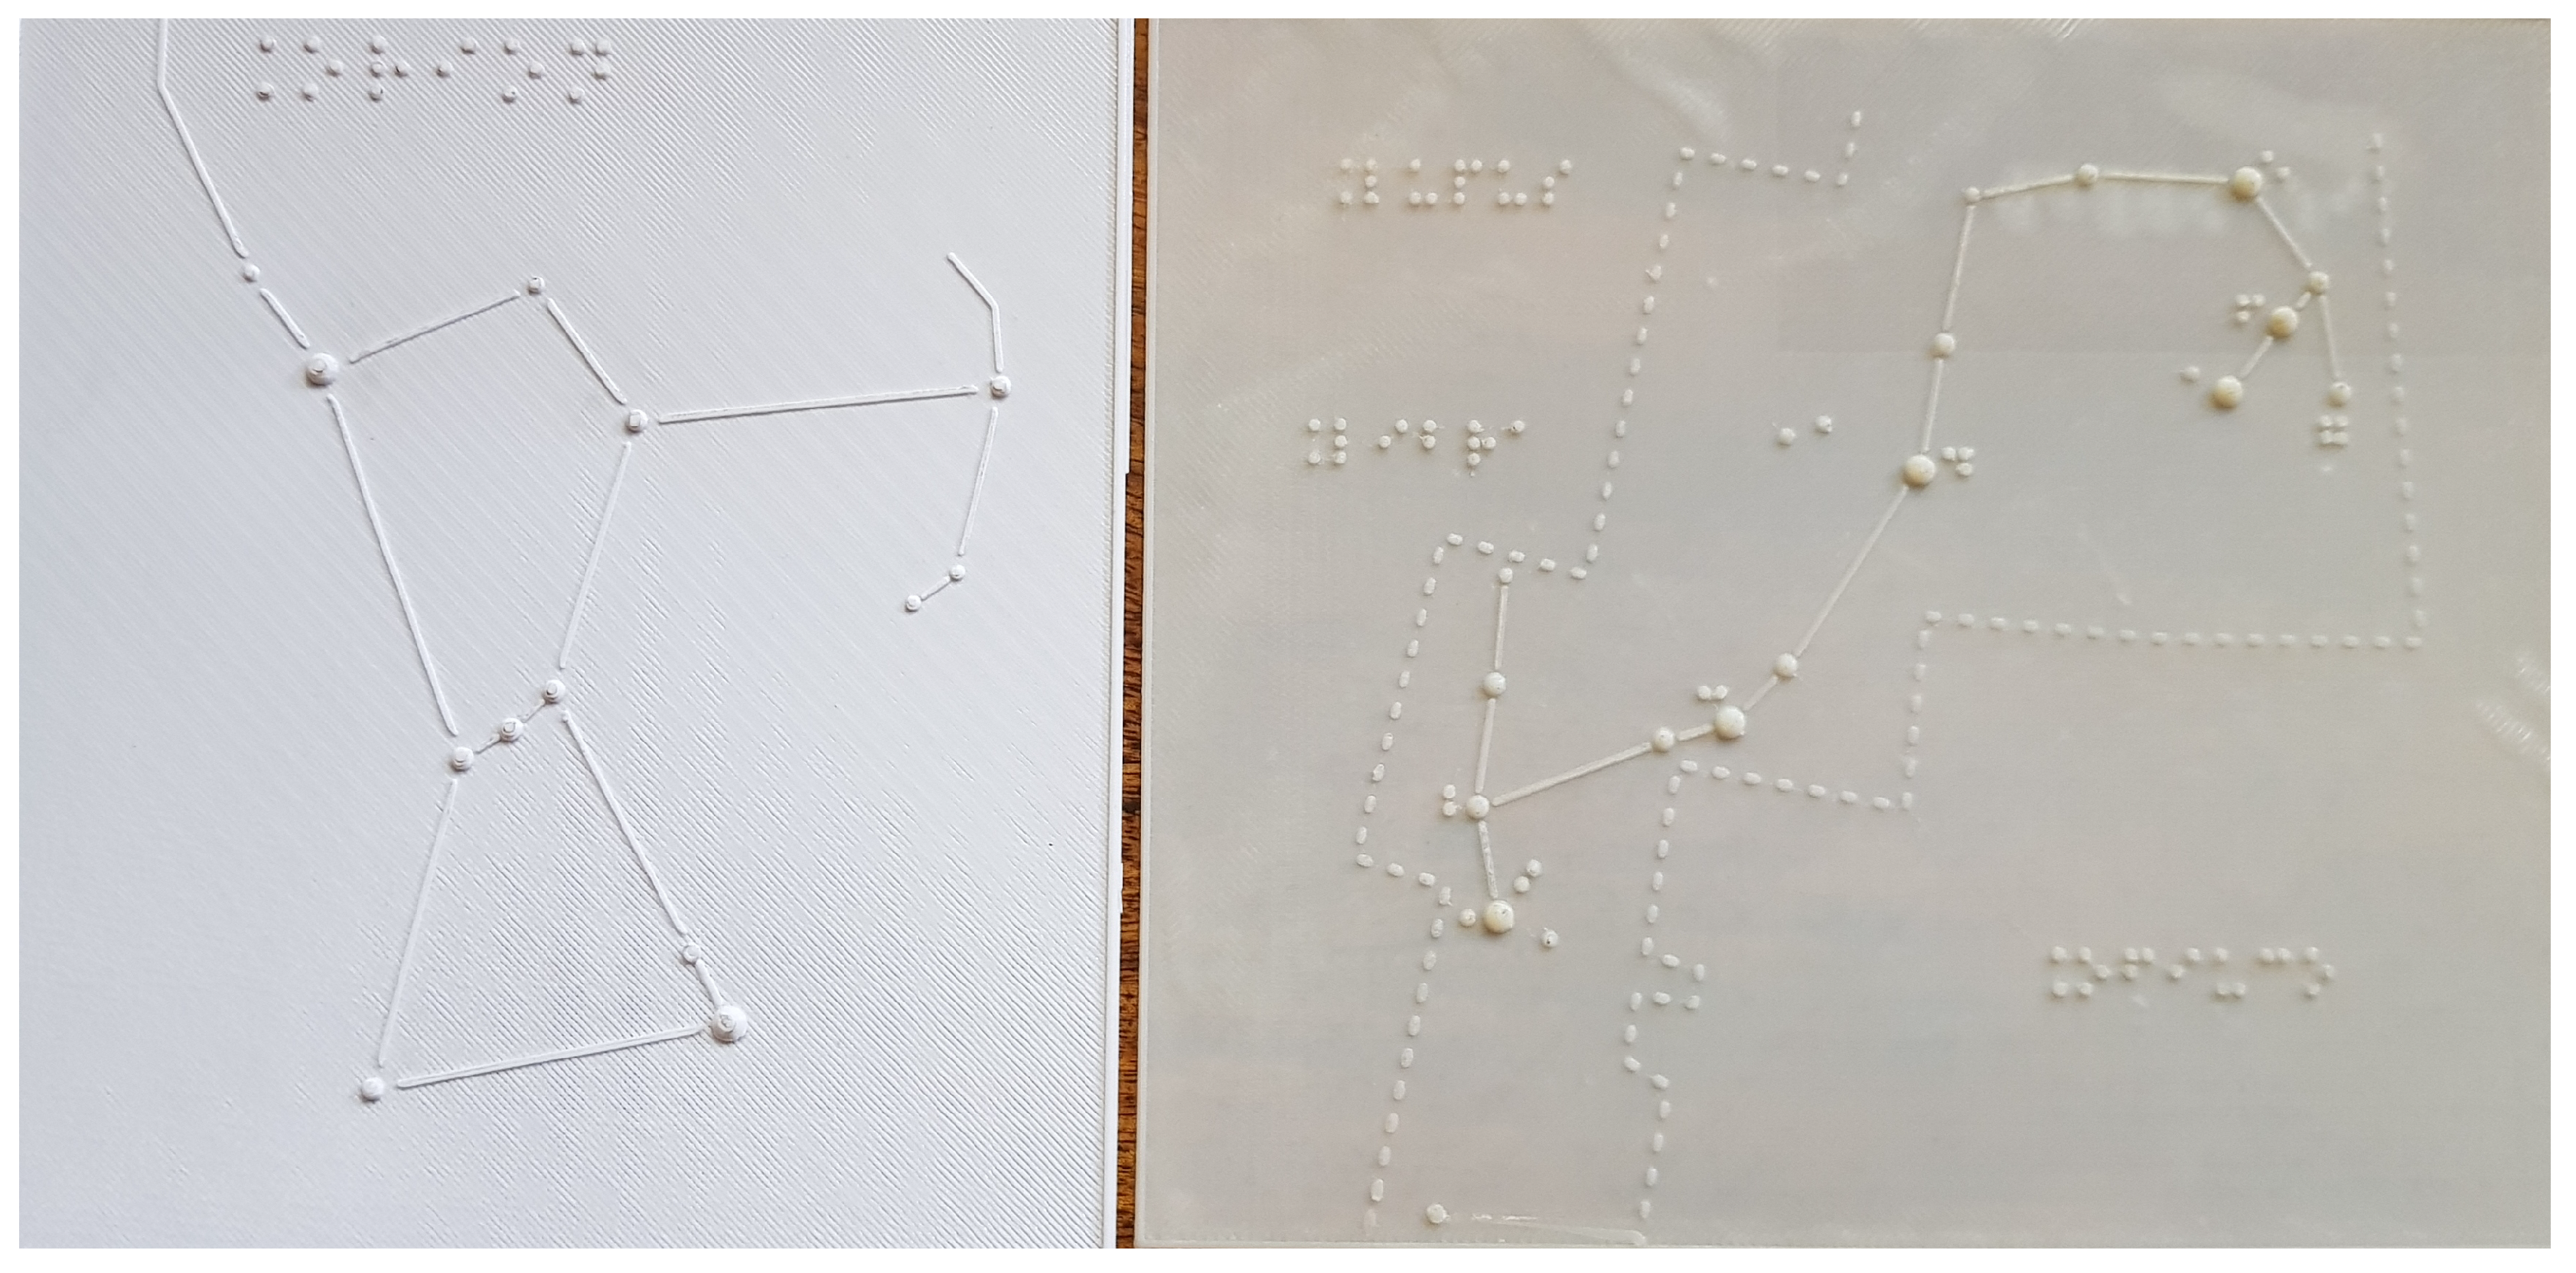
Figure 4.
Portable LEDs Tactile Constellations: Scorpius (left) and Orion (right).
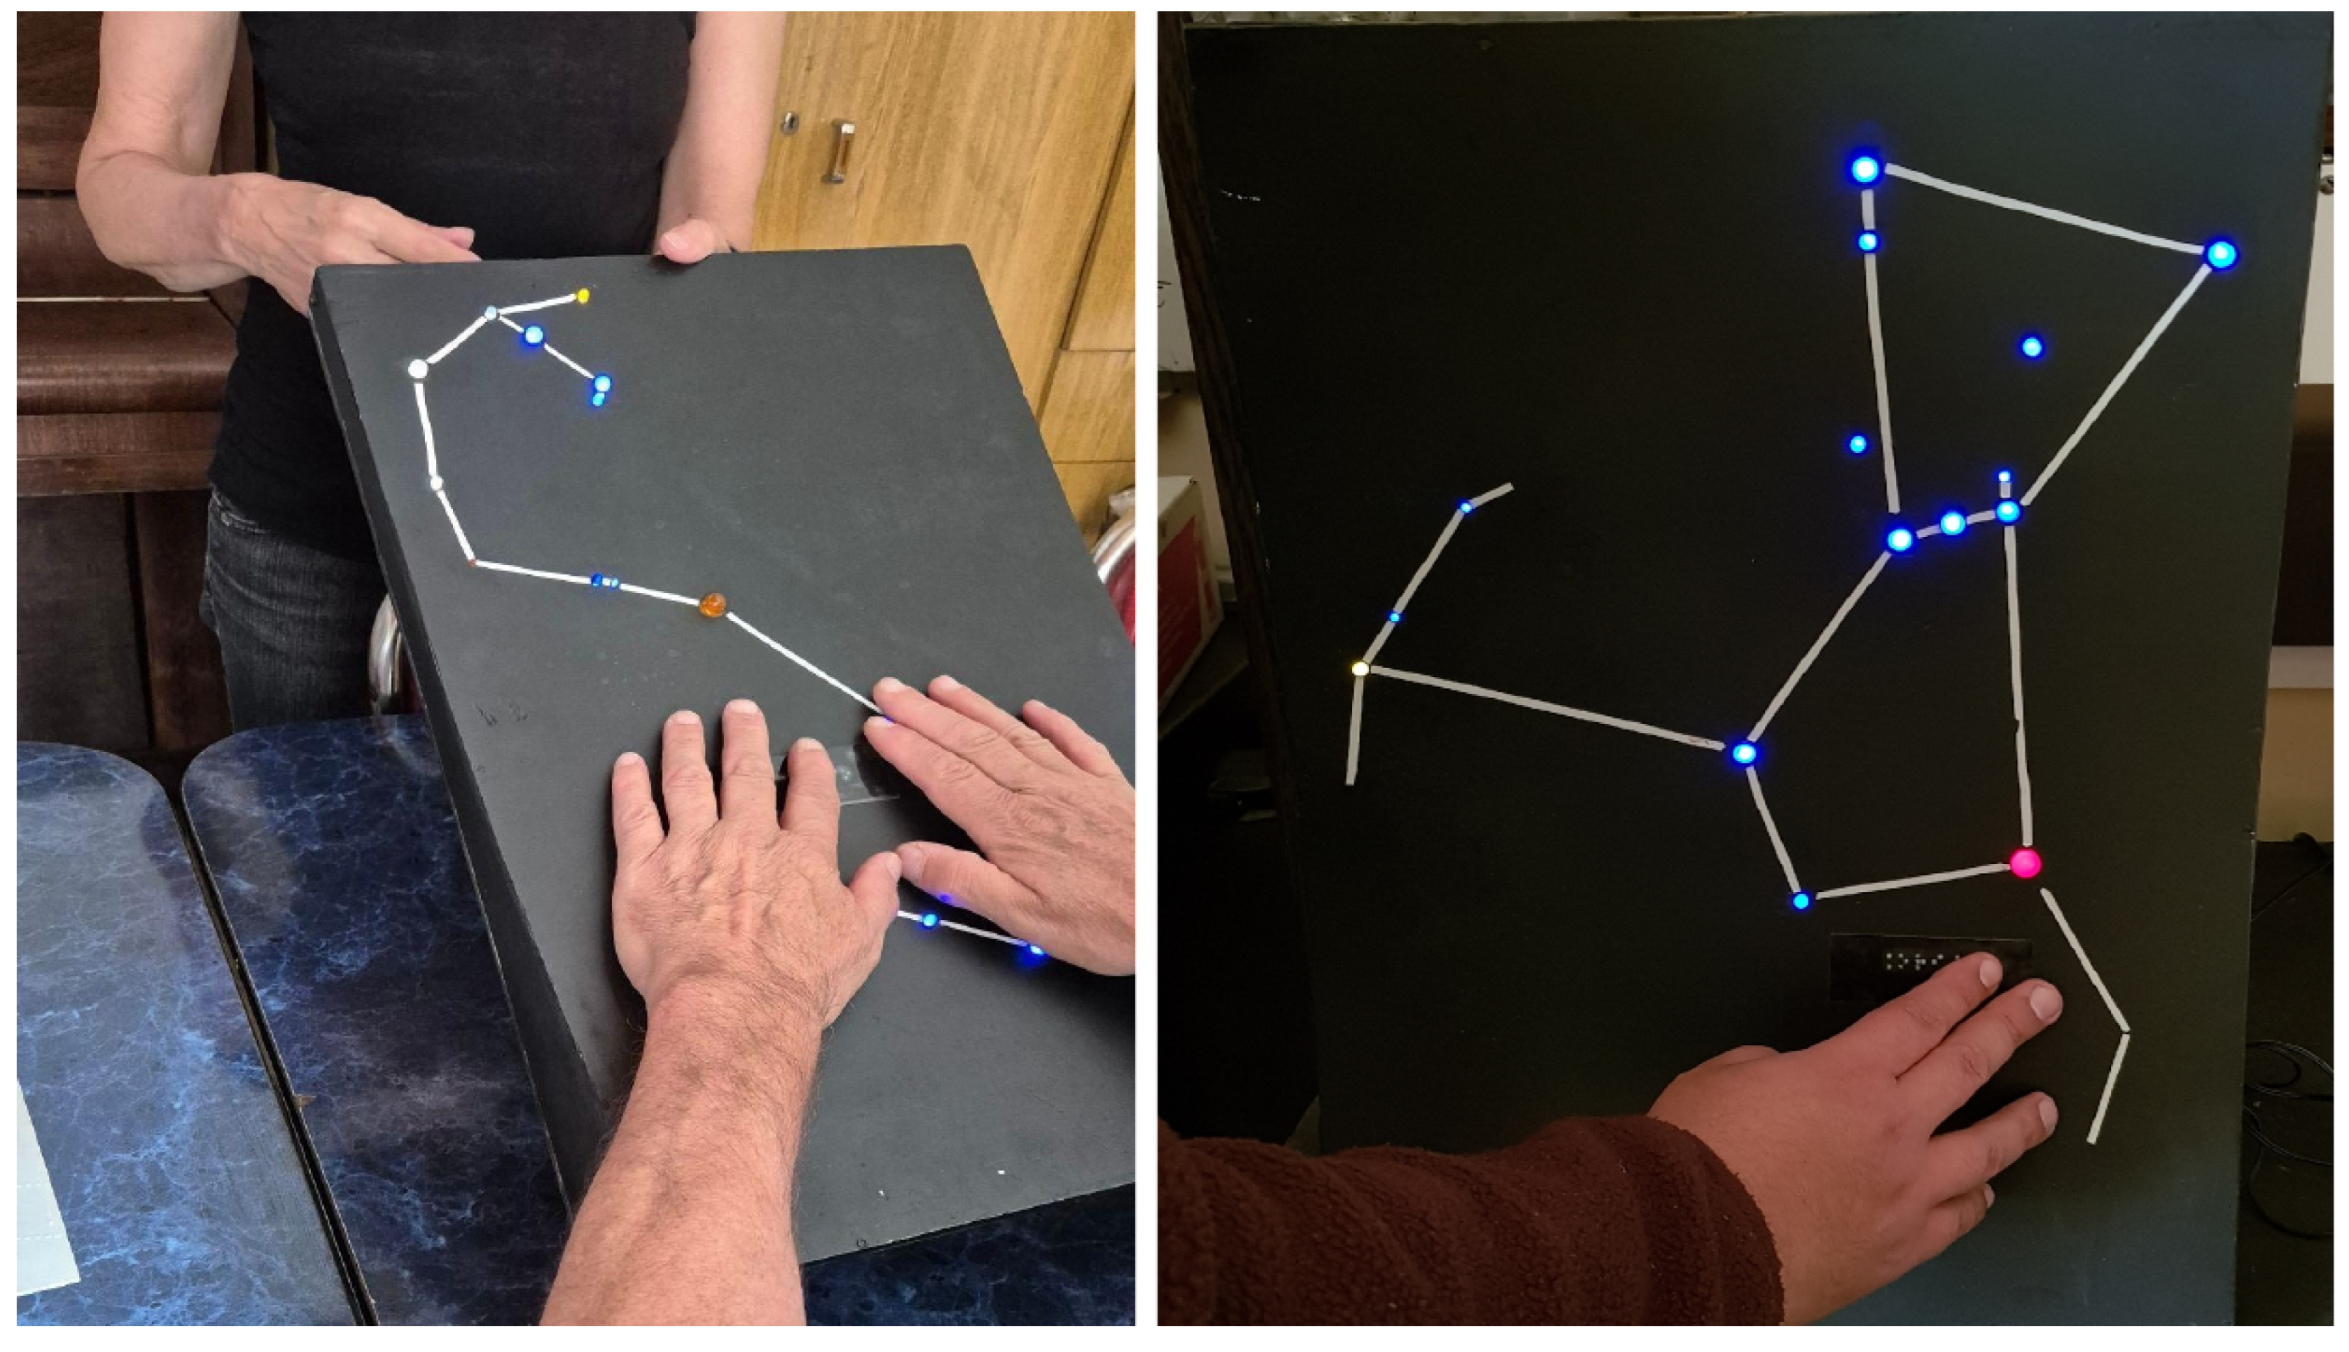
Figure 5.
The three layers of the skin contain specific receptors, responsible for perceiving distinct external stimuli.D uring interaction with the surface, a variety of haptic experiences can be evoked, based on the combination of actuators, surface folding, and user behaviour [36]
Figure 5.
The three layers of the skin contain specific receptors, responsible for perceiving distinct external stimuli.D uring interaction with the surface, a variety of haptic experiences can be evoked, based on the combination of actuators, surface folding, and user behaviour [36]
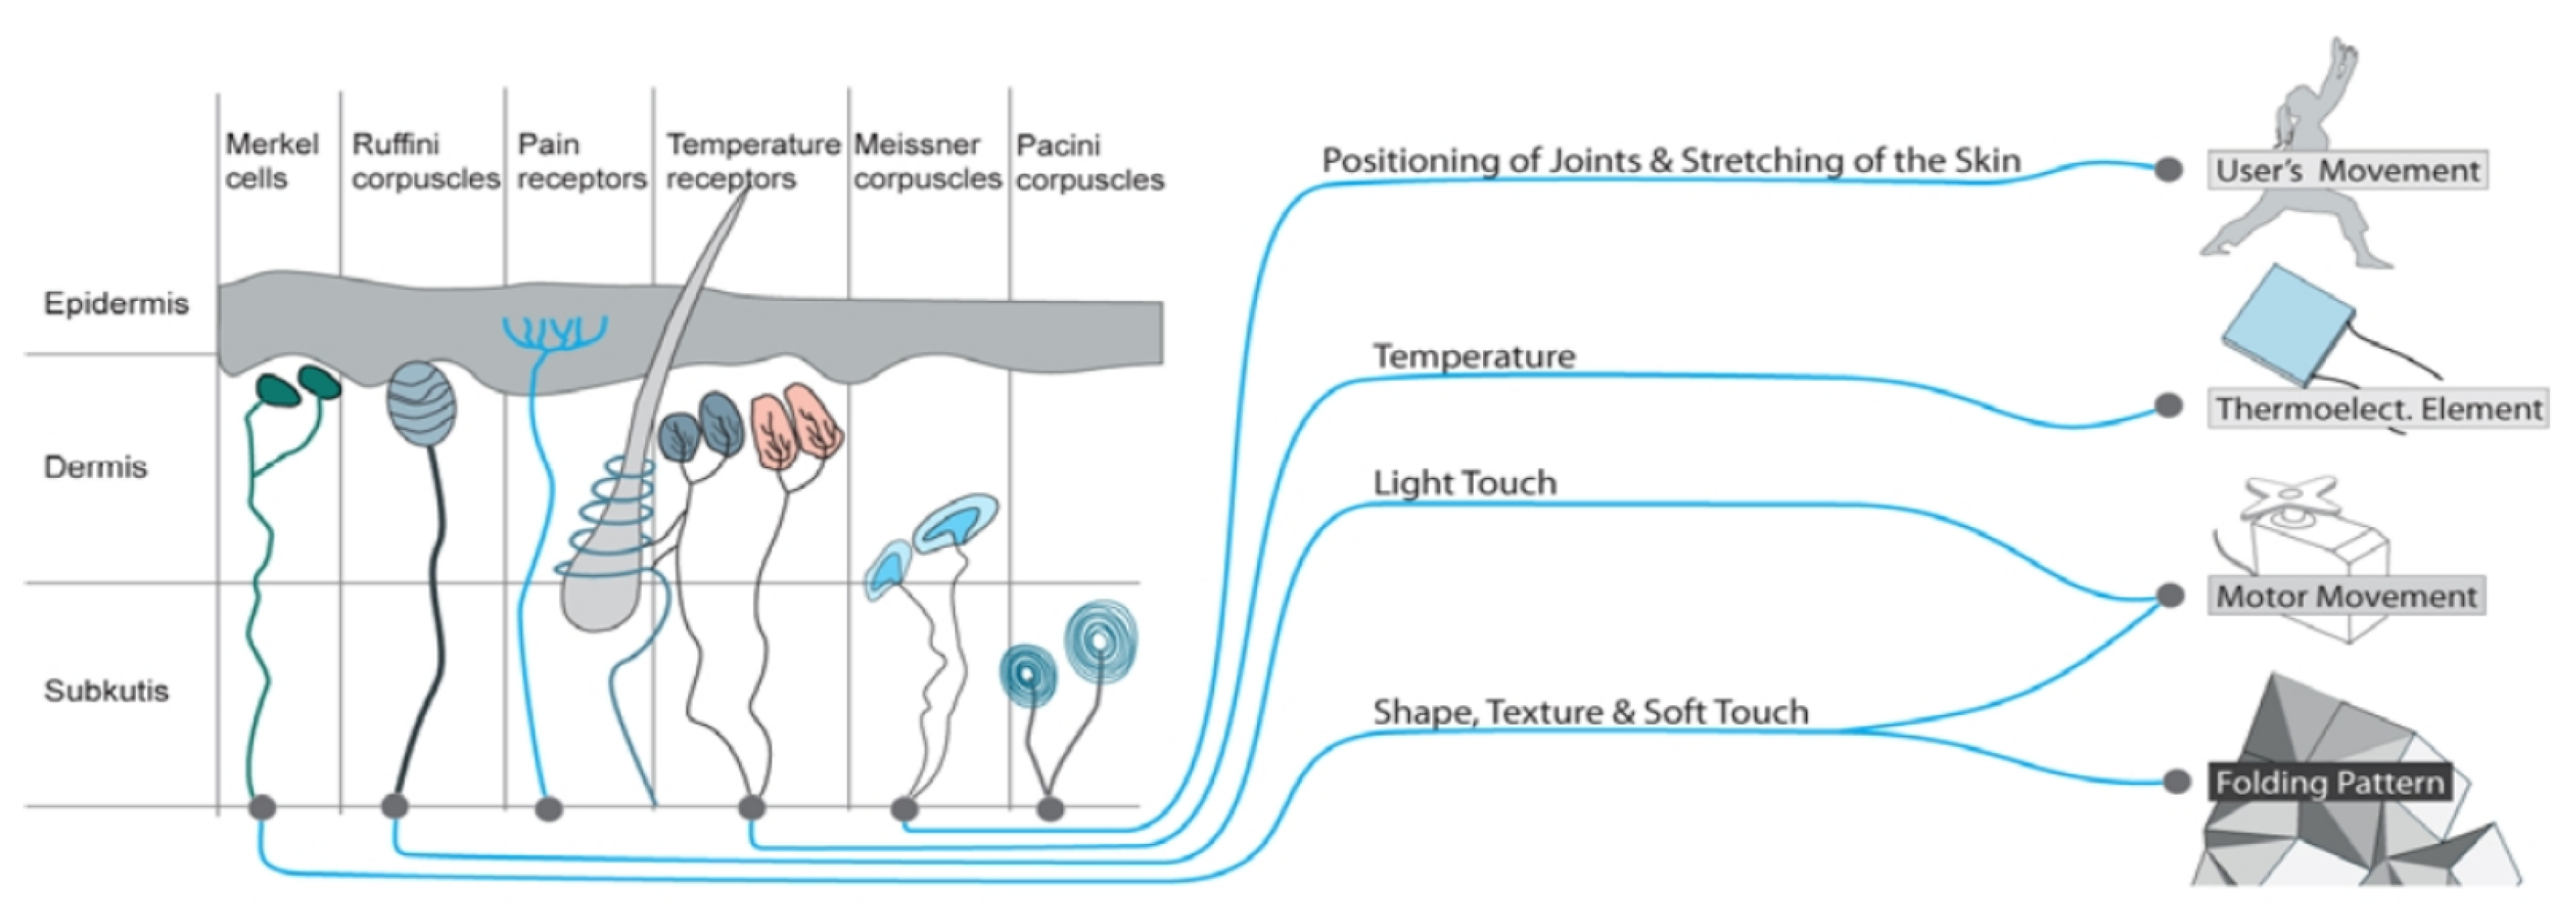
Figure 6.
Scorpius Asterism: haptic constellation design.
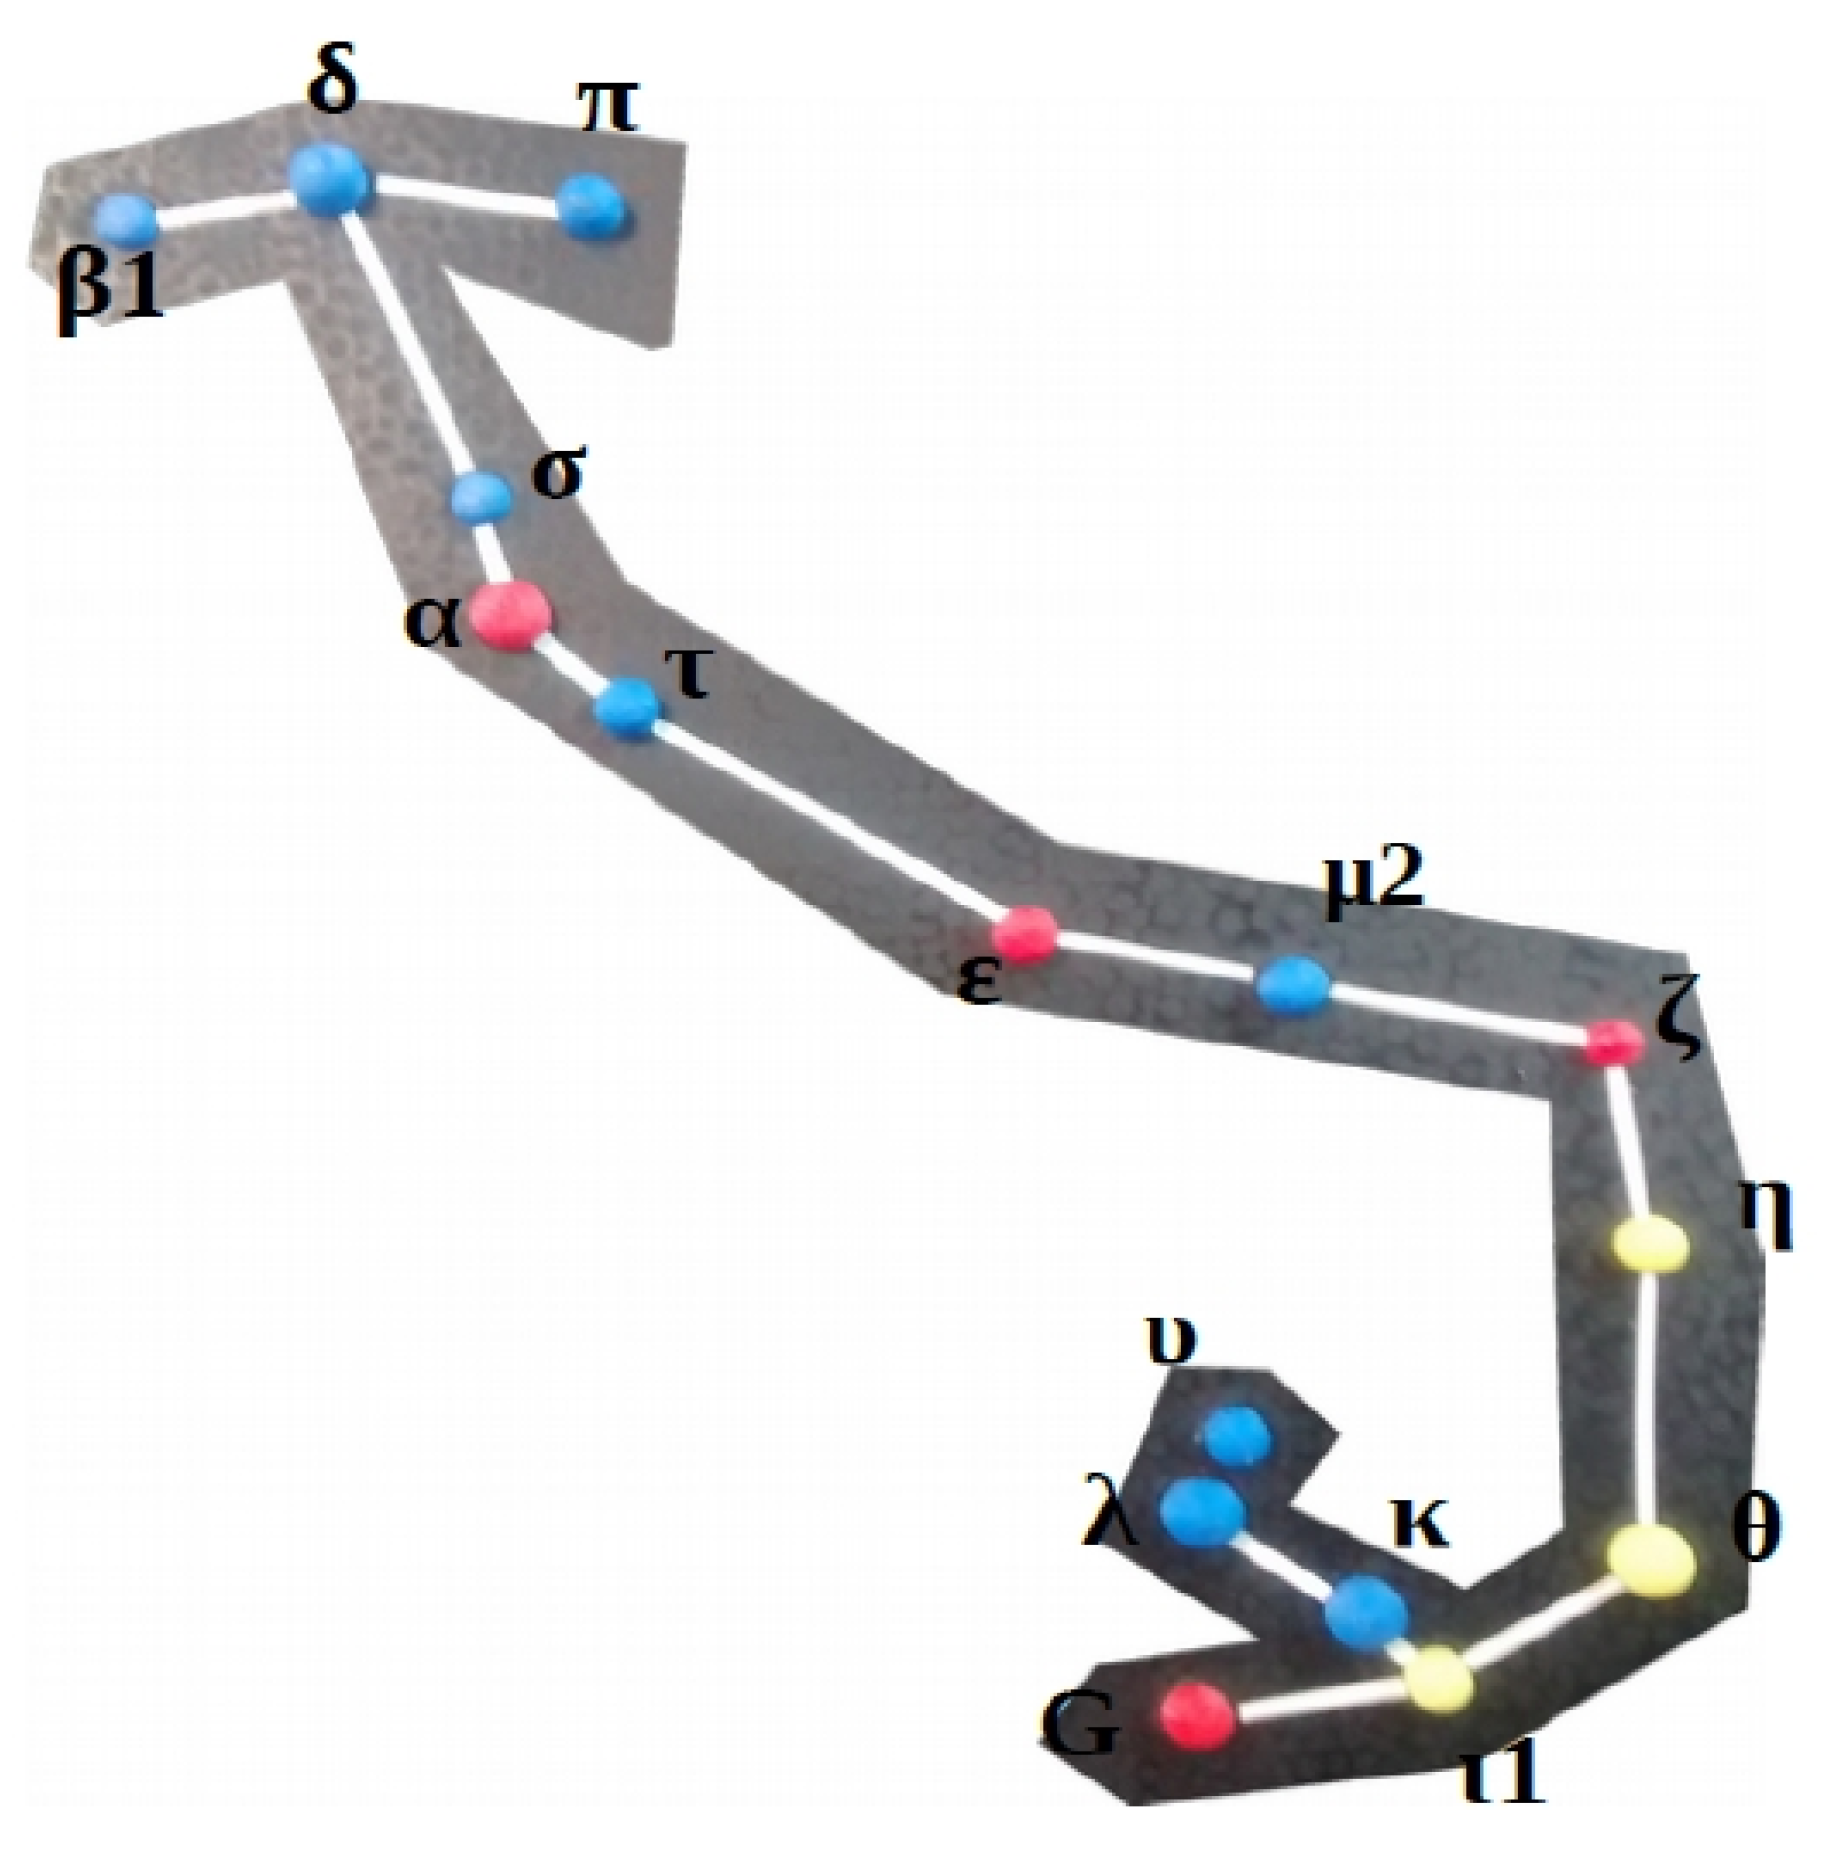
Figure 7.
T5 car dashboard lamp 12V/12W (left); lamp caps: 8mm, 10mm, and 12mm, from left to right (right).
Figure 7.
T5 car dashboard lamp 12V/12W (left); lamp caps: 8mm, 10mm, and 12mm, from left to right (right).
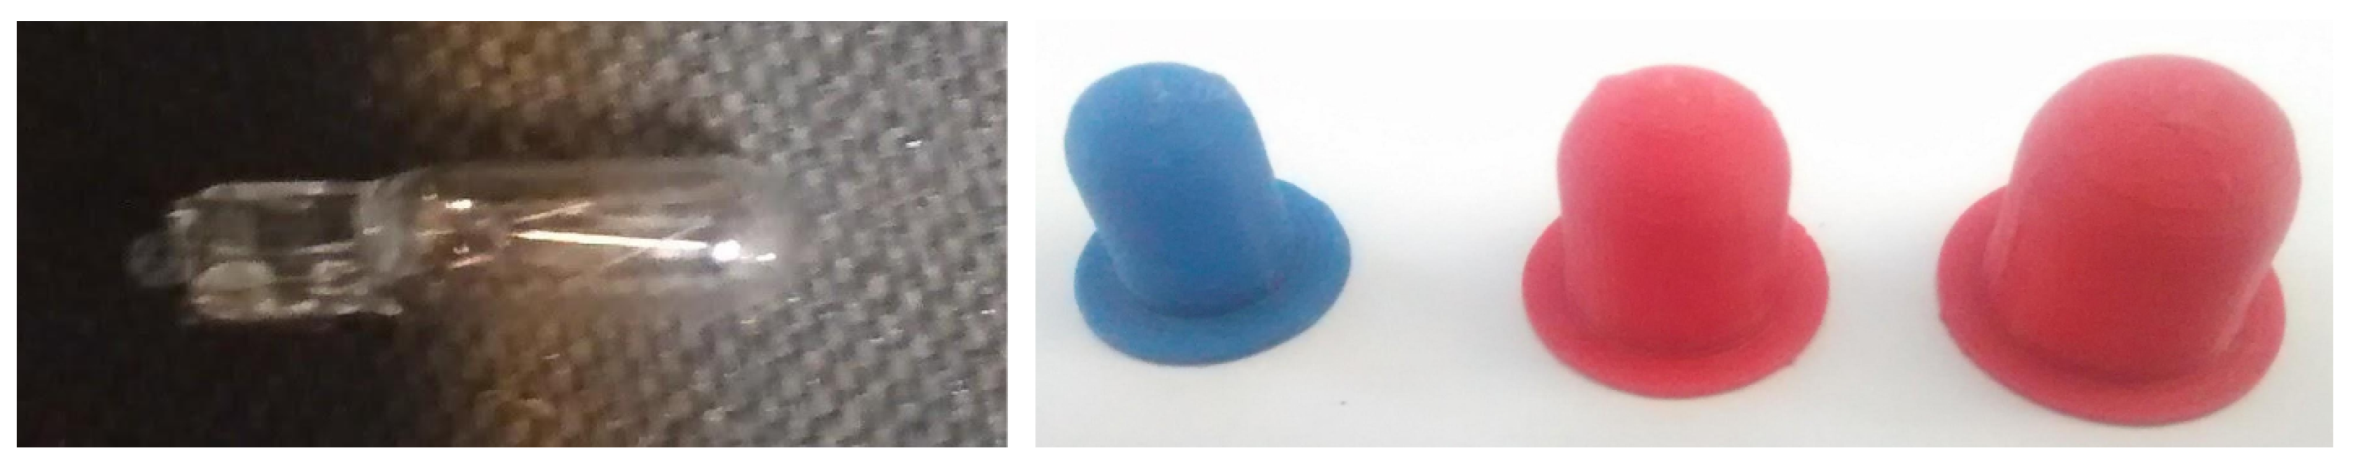
Figure 8.
Haptic interface of the thermal constellation (dimensions expressed in mm) (left); final thermal Scorpio constellation model (right).
Figure 8.
Haptic interface of the thermal constellation (dimensions expressed in mm) (left); final thermal Scorpio constellation model (right).
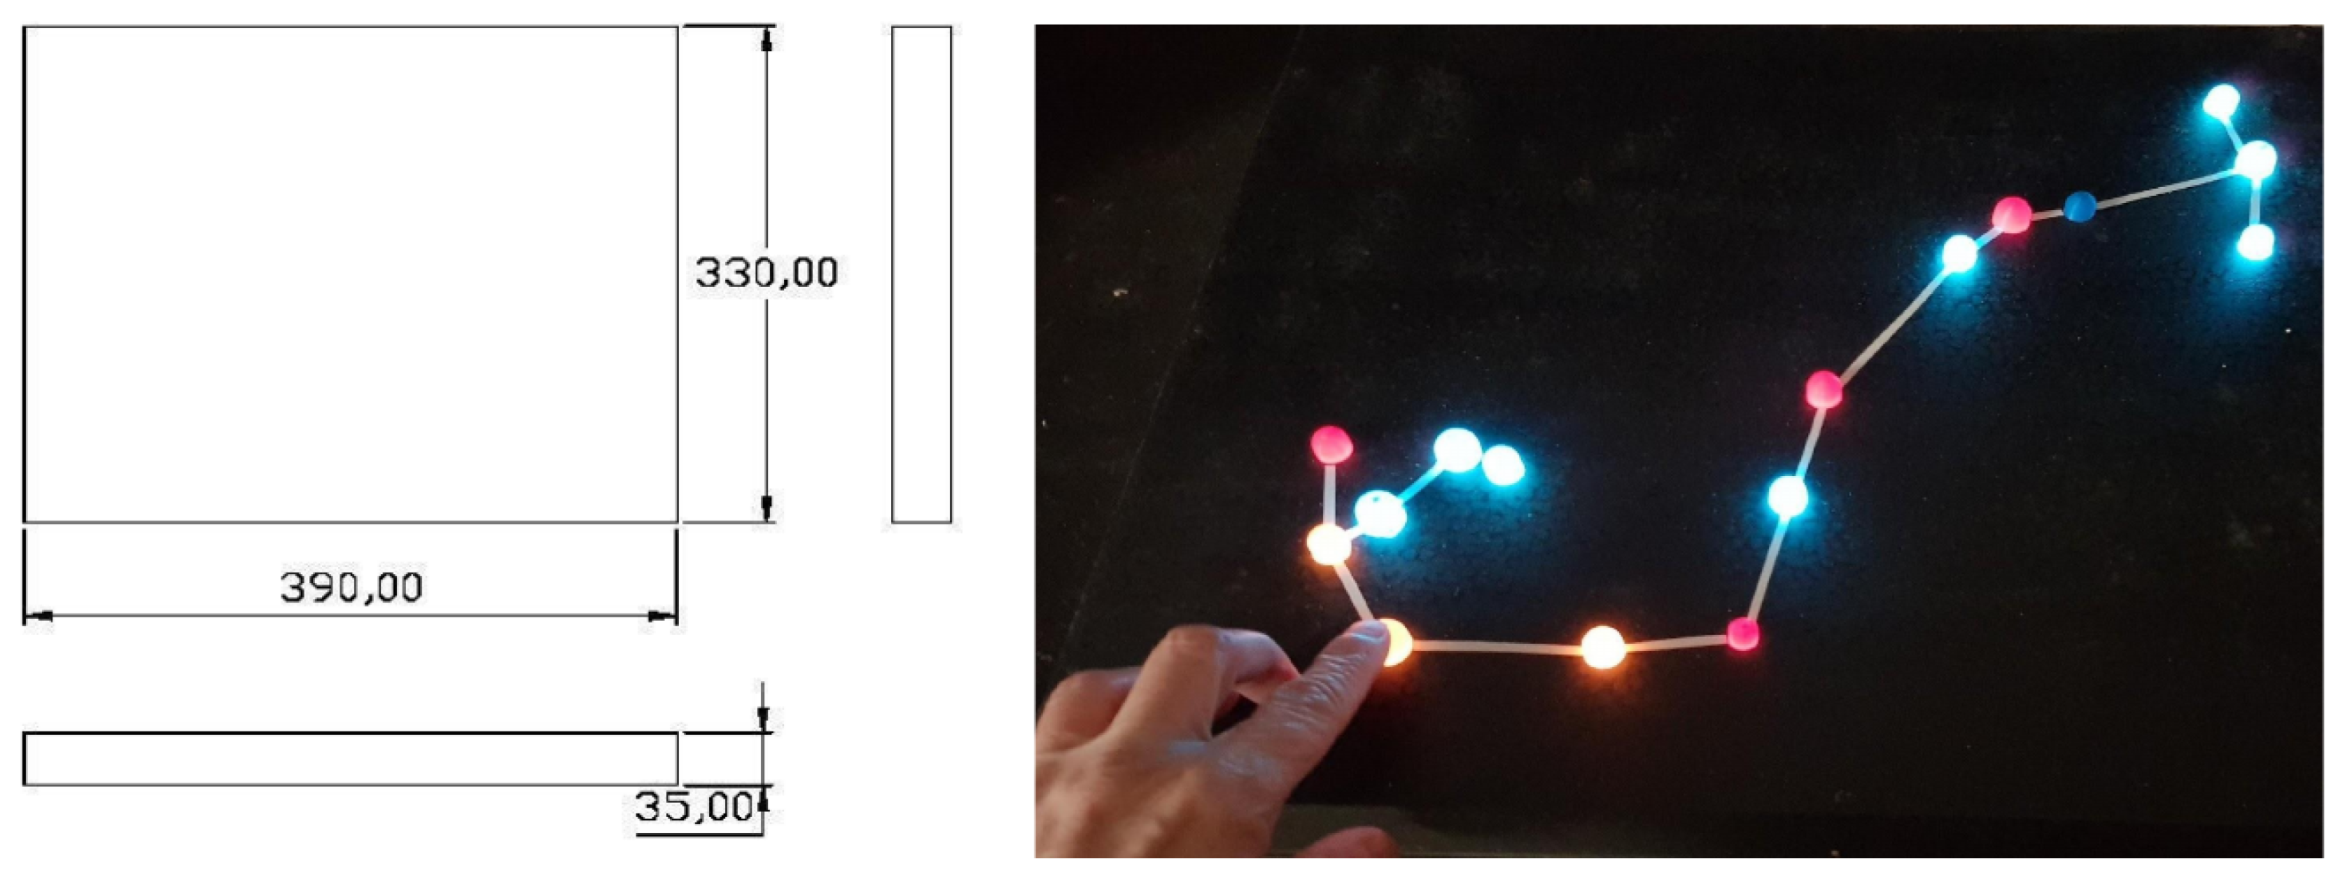
Figure 9.
Blind people testing the thermal constellation The Invisible Factory exhibition, Mendoza, Argentina, July 2019.
Figure 9.
Blind people testing the thermal constellation The Invisible Factory exhibition, Mendoza, Argentina, July 2019.
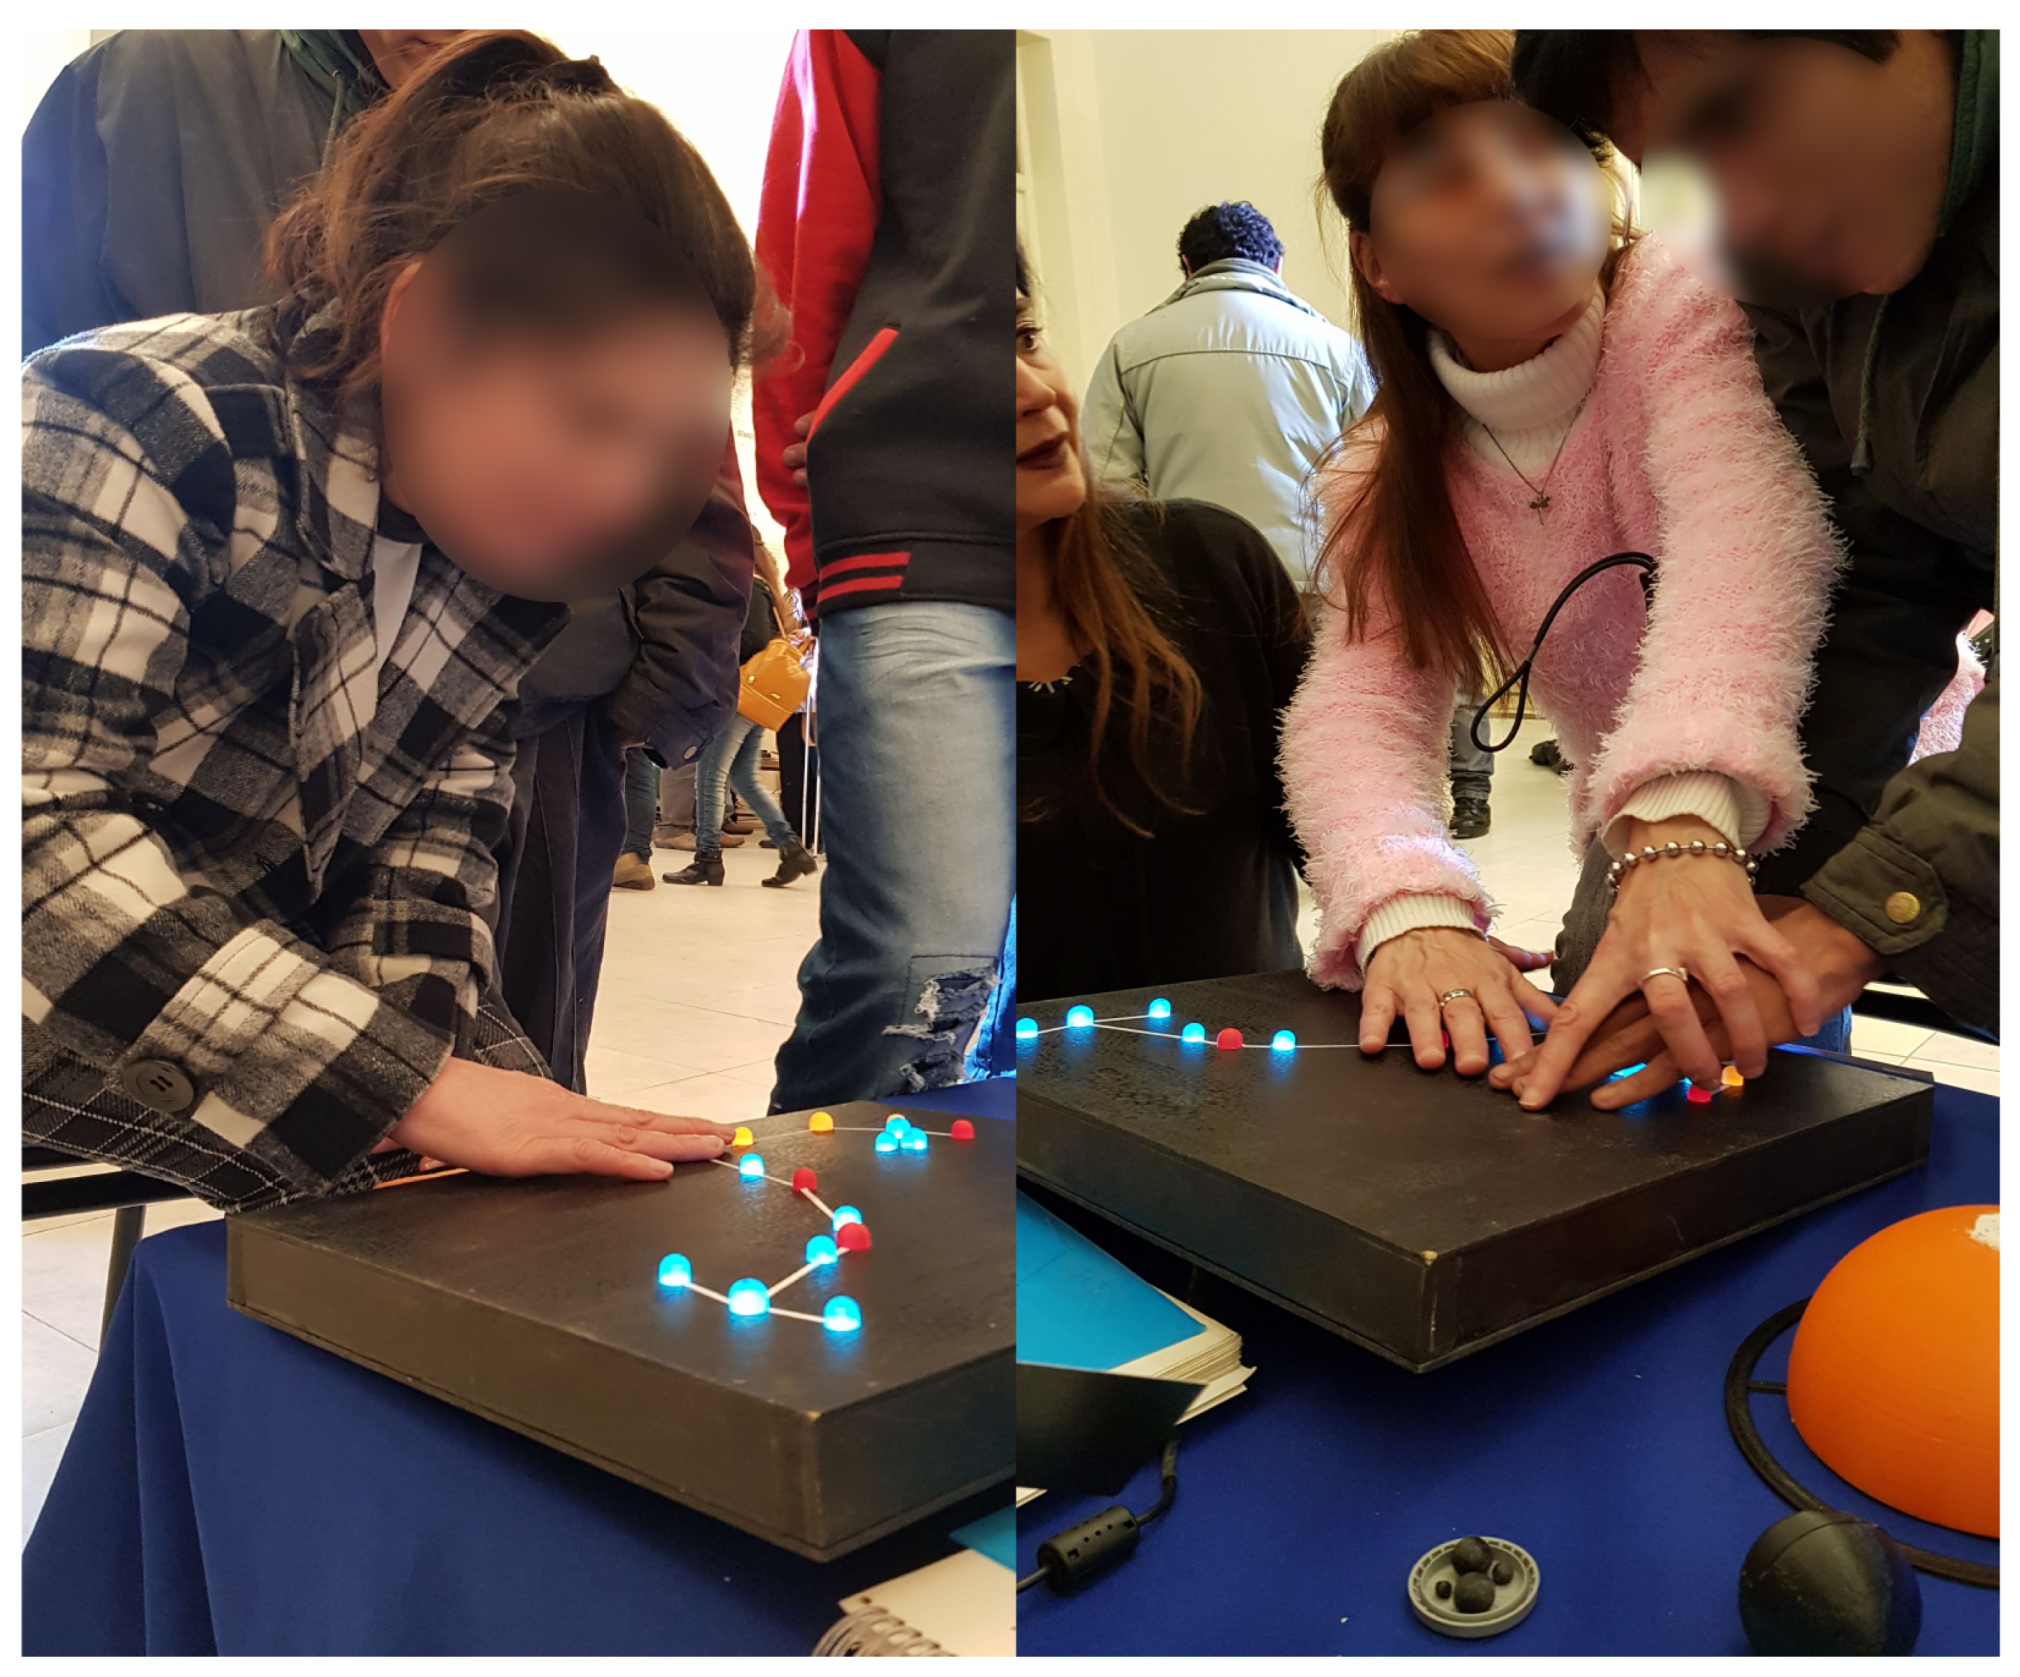
Figure 10.
Visitors in the XXX IAU General Assembly, during the 1st IAU-Inspiring Stars exhibition. Vienna, August 2018.
Figure 10.
Visitors in the XXX IAU General Assembly, during the 1st IAU-Inspiring Stars exhibition. Vienna, August 2018.
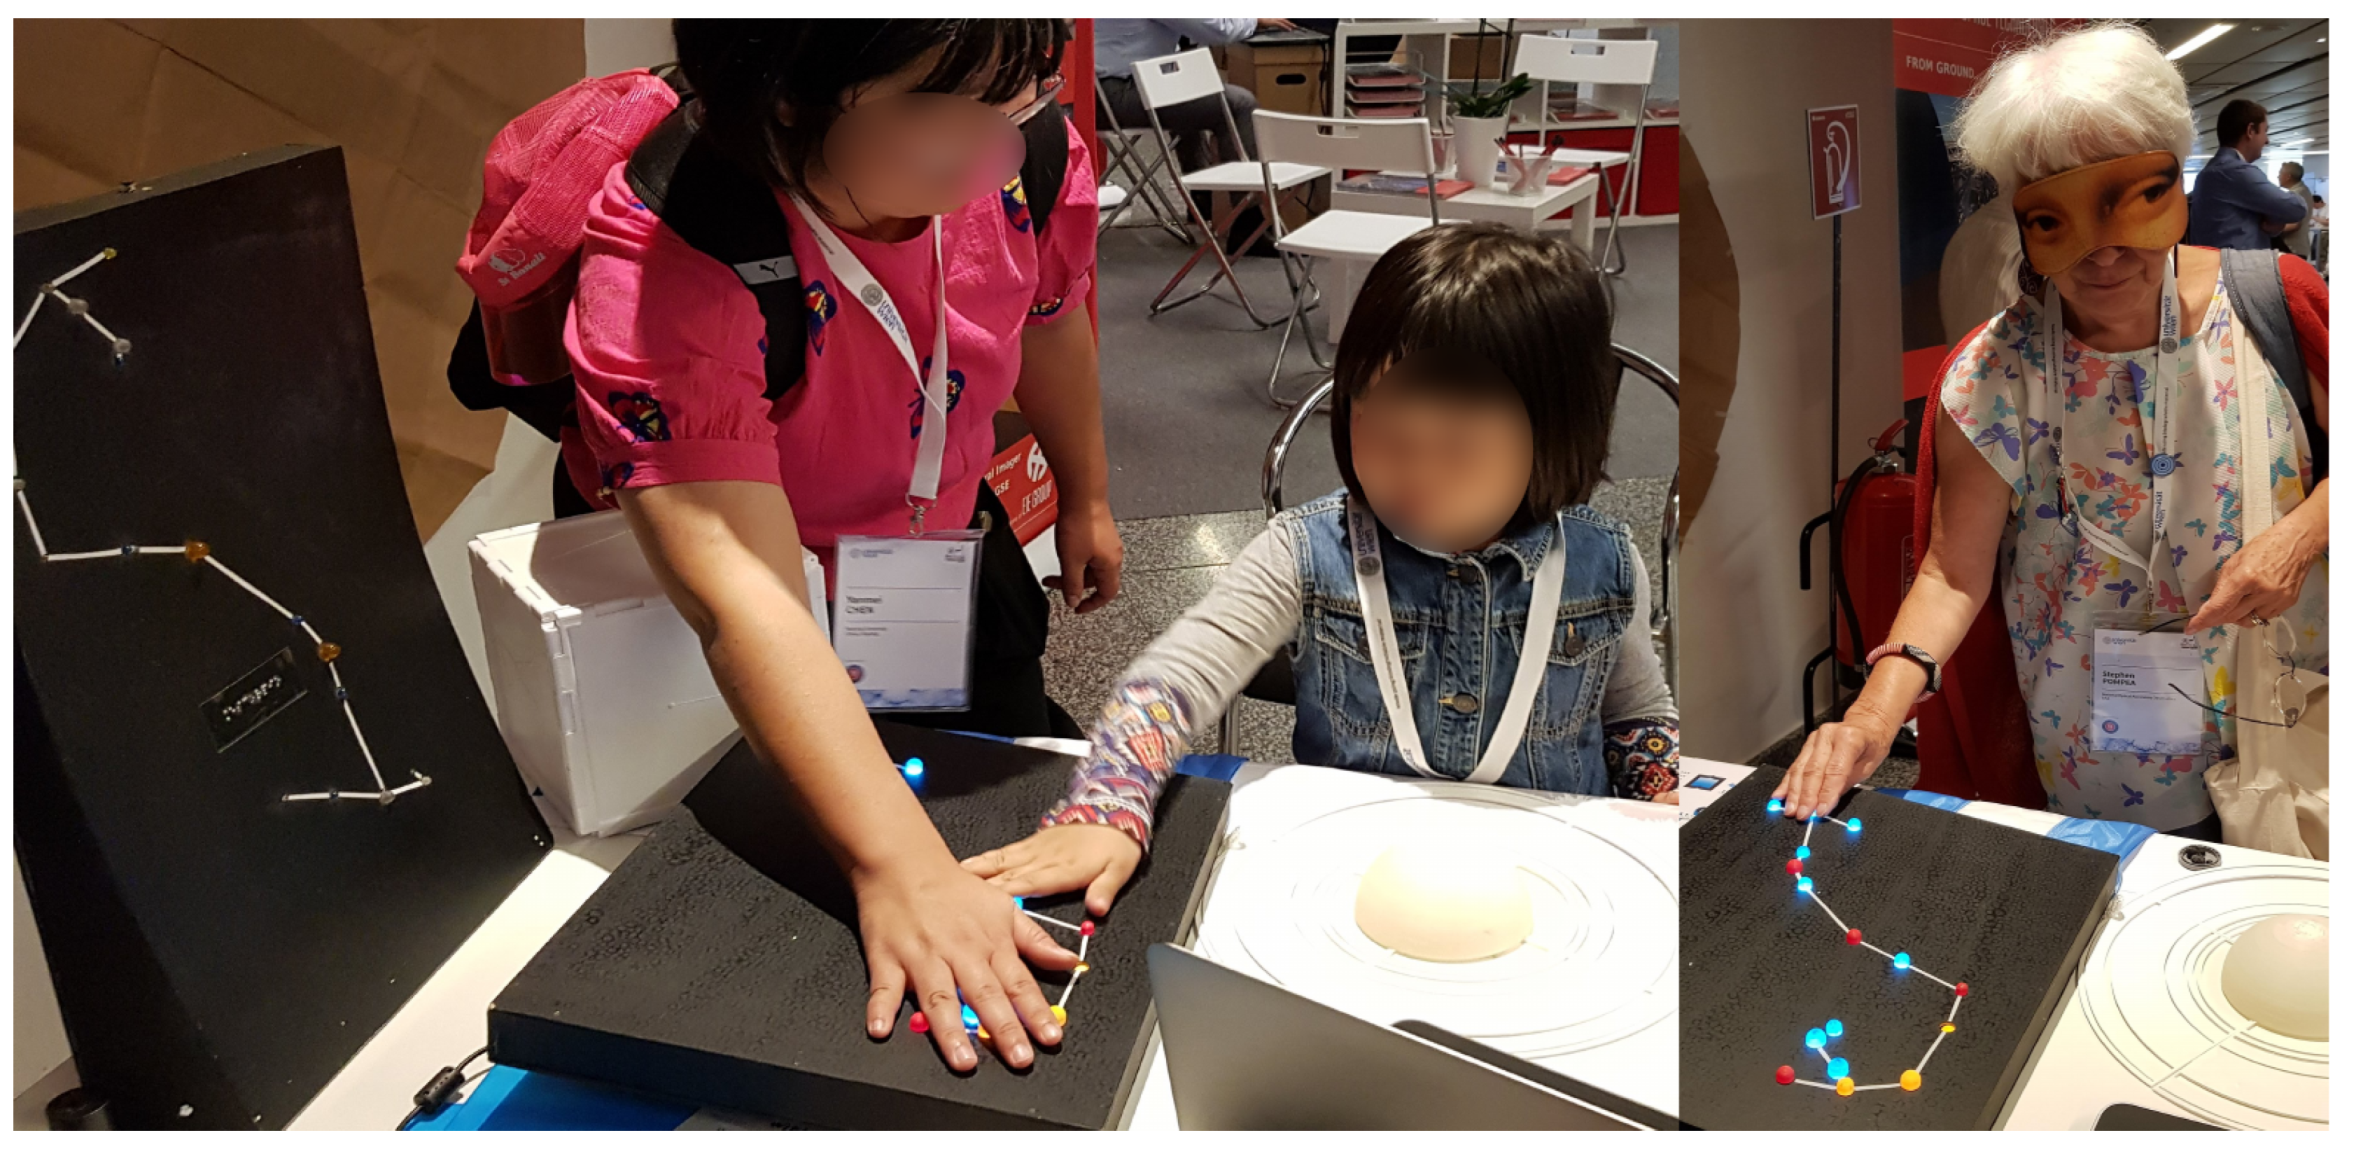
Figure 11.
Blind people recognizing magnitudes and temperatures in two models of Scorpius: magnitude and colors from the temperature (left) and non thermal LED tactile constellation for only brightness detection (right). (Senses Stimulation Training course, Nov. 2025)
Figure 11.
Blind people recognizing magnitudes and temperatures in two models of Scorpius: magnitude and colors from the temperature (left) and non thermal LED tactile constellation for only brightness detection (right). (Senses Stimulation Training course, Nov. 2025)
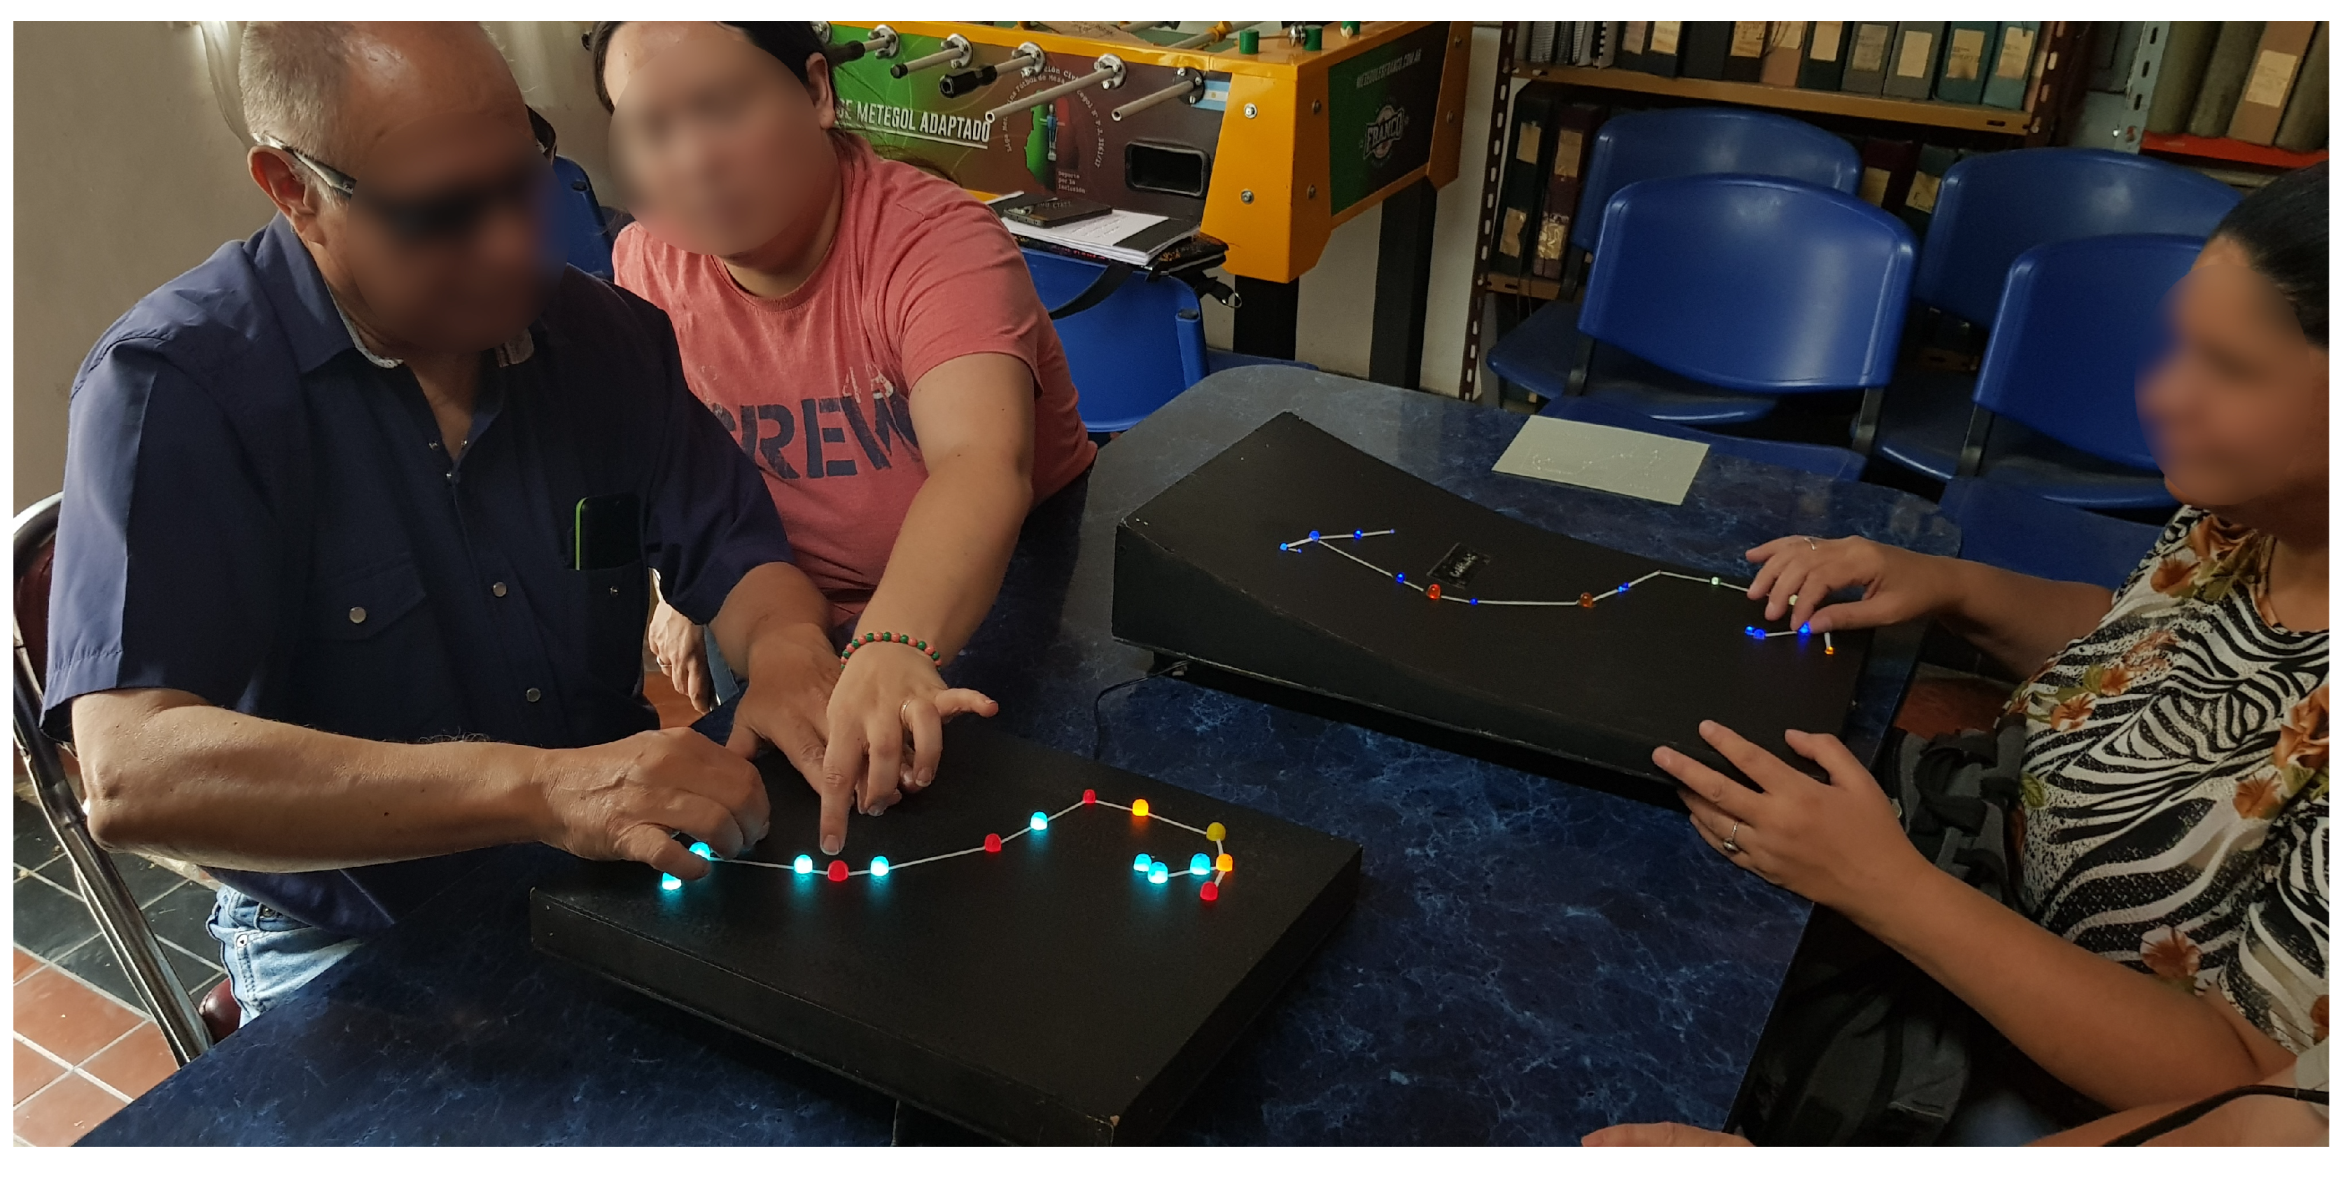
Figure 12.
Comparing temperatures on the thermal constellation and recognizing magnitudes. (Senses Stimulation Training course, Nov. 2025).
Figure 12.
Comparing temperatures on the thermal constellation and recognizing magnitudes. (Senses Stimulation Training course, Nov. 2025).
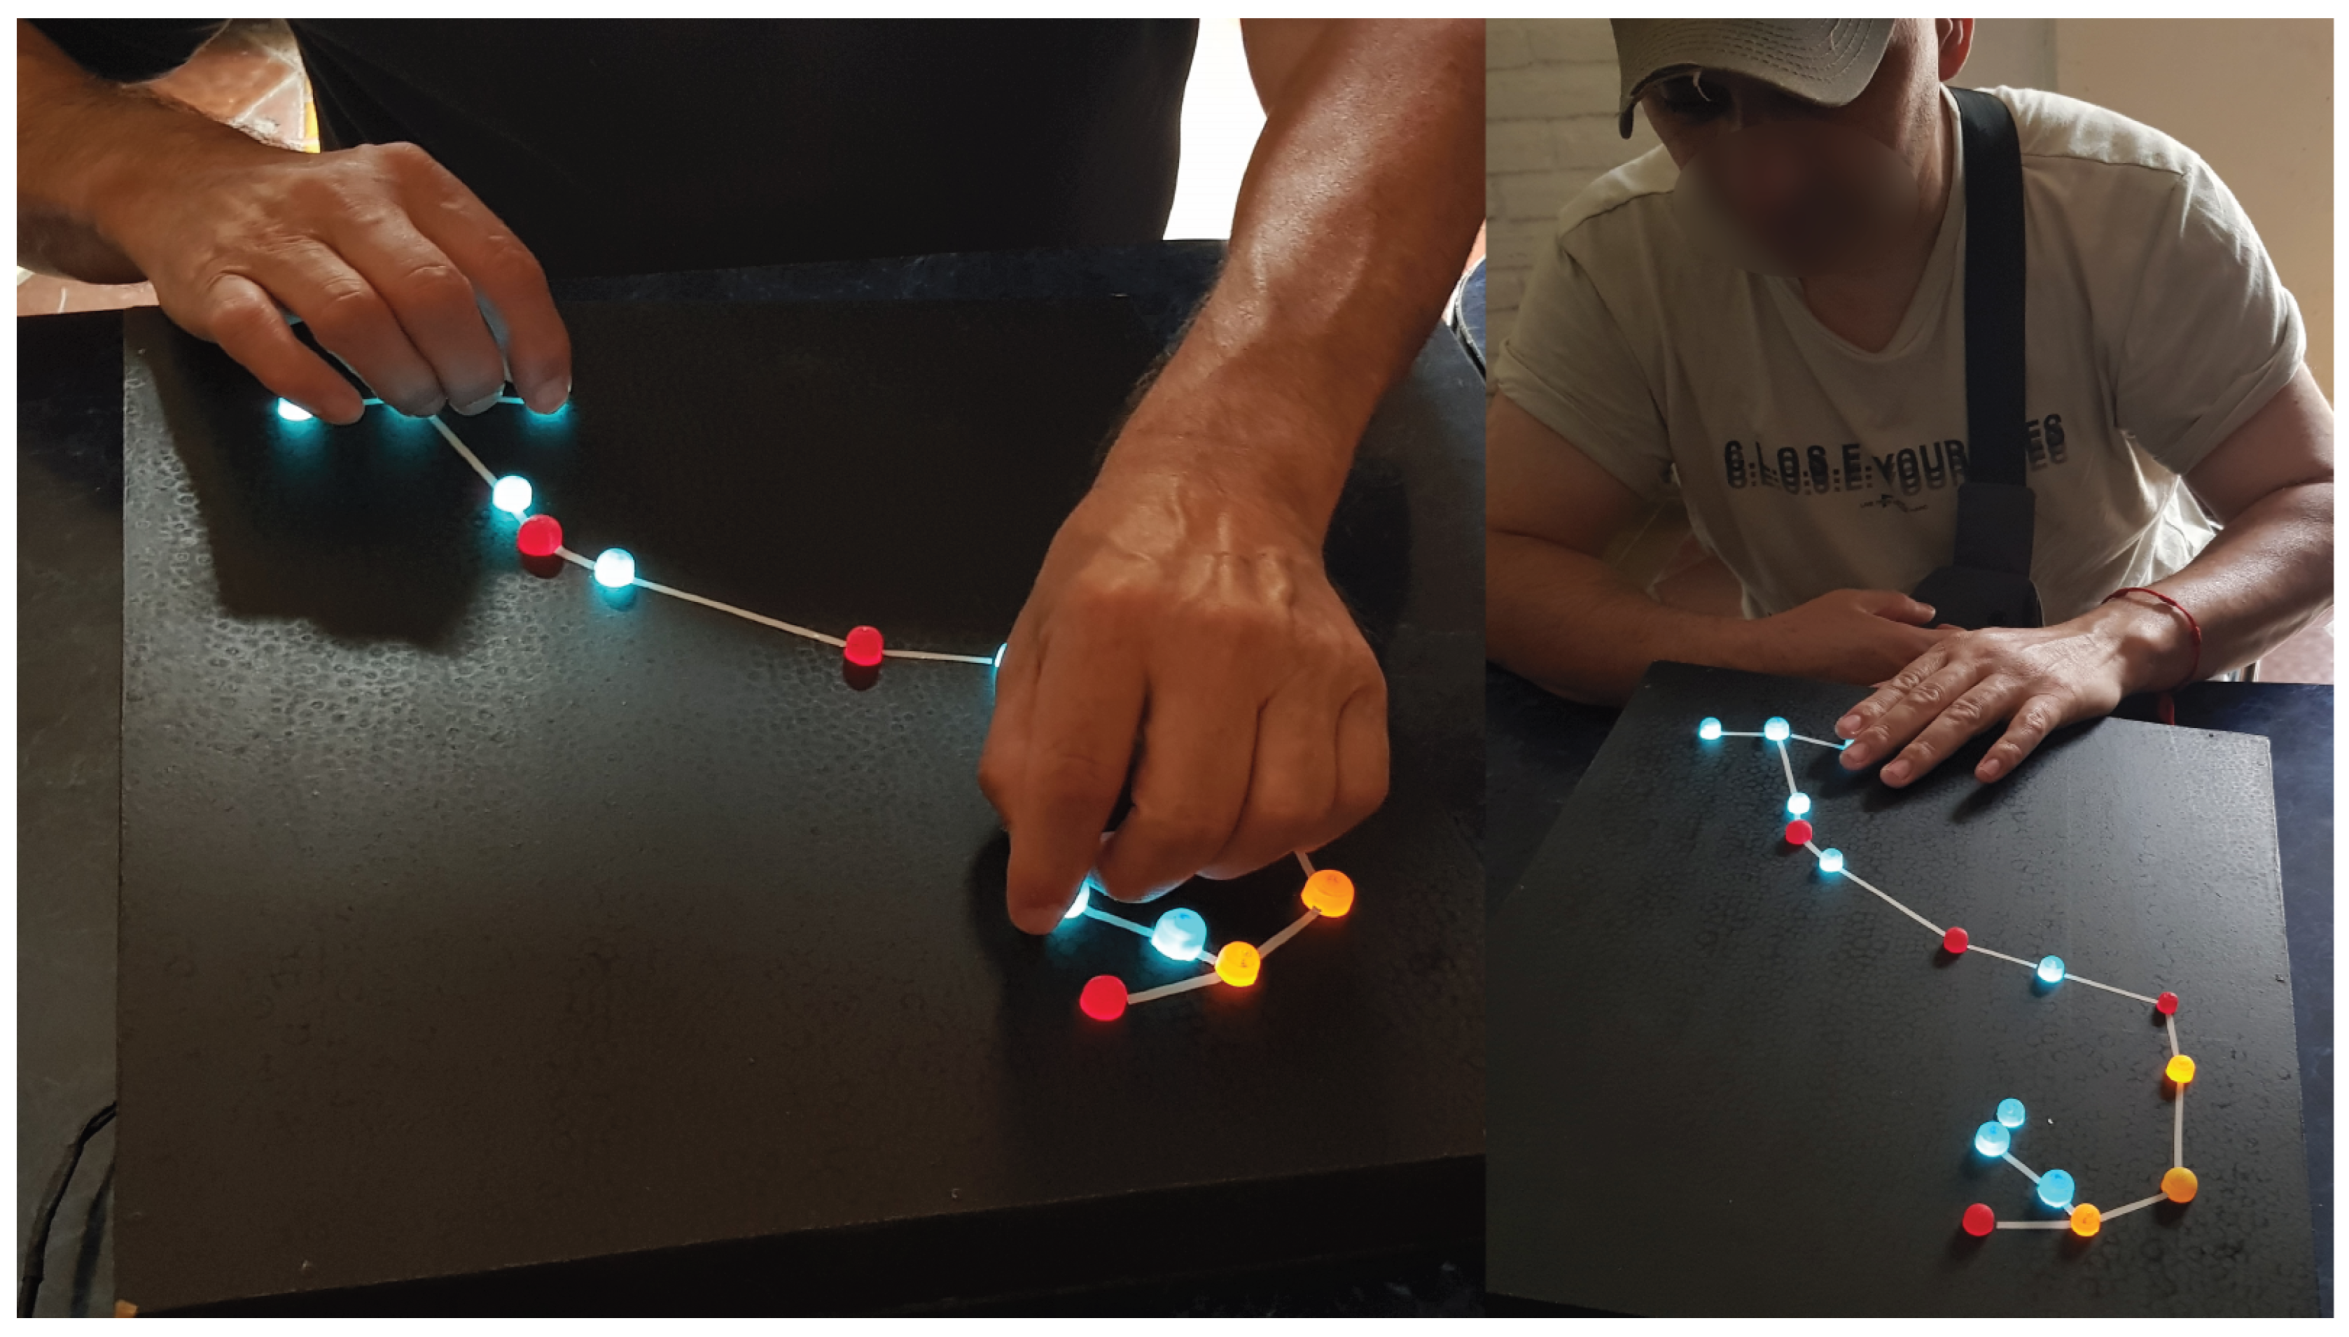

Table 1.
Magnitude and Color equivalences of the brightest stars in Scorpius.
| Id Star | Mag | LED Size | SpT/Color |
|---|---|---|---|
| alfa | 1.6 | 10 | K-red |
| lambda | 1.6 | 10 | B-blue |
| tetha | 1.9 | 8 | A-white/yellow |
| delta | 2.3 | 8 | B-blue |
| epsilon | 2.3 | 8 | K-red |
| kappa | 2.4 | 8 | B-blue |
| beta1 | 2.6 | 5 | B-blue |
| nu | 2.7 | 5 | B-blue |
| tau | 2.8 | 5 | B-blue |
| pi | 2.9 | 5 | B-blue |
| sigma | 3 | 5 | B-blue |
| iota1 | 3 | 5 | F-yellow |
| mu1 | 3 | 5 | B-blue |
| G | 3.2 | 5 | K-red |
| eta | 3.3 | 5 | F-yellow |
| zeda2 | 3.6 | 5 | K-red |
Table 2.
User Experience and sensorial dimensions: participants testimonies.
| ID | Complete Answer | User Experience / Sensorial Dimension | |||
|---|---|---|---|---|---|
| Tactile | Thermal | Sonification | Synergy | ||
| U1 | "I thought the sky was off-limits to us, but it wasn’t. Working with these models made me feel included..." | I thought they were very good. | The thermal component completes the touch model. | Sound was very effective for learning concepts like color. | I thought the combination of materials was perfect. |
| U2 | "Before learning about these models, I thought astronomy was impossible for us..." | I thought the materials were perfect. | The thermal aspect was innovative. | Sound complements the other senses. | A perfect combination. |
| U3 | "I had never thought that there are many things that blind people cannot even imagine..." | I thought the materials were wonderful. | The thermal feature was the icing on the cake! | It is very interesting. | I saw more by touching than by looking at the sky! |
| U4 | "Until now, astronomy was, in my opinion, a science for experts..." | Very useful. | Interesting. | I didn’t know the possibility of sound reinforcement existed. | I thought the multisensory materials were good. |
| U5 | "Working with these models changed my relationship with astronomy and science..." | The relief map helped a lot to understand the constellations. | The thermal constellations helped to identify colors. | The sound system is very effective for understanding brightness. | Method helped to build a mental image of the objects. |
| U6 | "I learned things I never imagined I could learn." | Good. | The combination of tactile relief with thermal sensations was enriching. | Interesting, because I’d never heard of such data before. | The multisensory proposal is very exciting. |
Table 3.
Focus-group impact study: congnitive and emotional dimensiones, improvement and critics.
| ID | Cognitive Dimension | Emotional Dimension | Improvement | ||||
|---|---|---|---|---|---|---|---|
| New Learning | Understand Structures | Ideas about Astronomy | Interest | Inclusion | Science Vision | Critics | |
| U1 | Understood color/temp relationship. | Interested in galaxies and nebulae shapes. | Changed many concepts. | Exceeded expectations. | Felt totally included. | Now I know I can understand the universe. | Nothing to change. |
| U2 | Improved perception of stars. | Sound effects allowed knowing what nebulae are like. | Brought abstract topics closer. | Very interesting proposal. | Felt very included. | Changed perception of science in general. | Nothing to change. |
| U3 | Corrected bad concepts in all topics. | — | Eye-opening to realize past errors. | Felt very motivated. | "I could see, and I felt very included." | Changed my view of science. | Nothing to change. |
| U4 | Constellations topic was new and enriching. | Interpreted through touch. | As an artist, learned true color formation. | Inspired to communicate to others. | Felt very comfortable. | Learned to see from another perspective. | Add smell and tactile signage. |
| U5 | Relationship between brightness, distance and color. | Recognized extended objects like nebulae. | Changed relationship with research. | Very excited to know more. | Felt very included. | Changed relationship with science. | More time for exploration. |
| U6 | Novel topics related to celestial objects. | — | Sound effects for chemical composition. | Enriching experience. | Felt very included. | Made me think beyond the workshop. | Loved the course. |
Disclaimer/Publisher’s Note: The statements, opinions and data contained in all publications are solely those of the individual author(s) and contributor(s) and not of MDPI and/or the editor(s). MDPI and/or the editor(s) disclaim responsibility for any injury to people or property resulting from any ideas, methods, instructions or products referred to in the content. |
© 2026 by the authors. Licensee MDPI, Basel, Switzerland. This article is an open access article distributed under the terms and conditions of the Creative Commons Attribution (CC BY) license (http://creativecommons.org/licenses/by/4.0/).
Copyright: This open access article is published under a Creative Commons CC BY 4.0 license, which permit the free download, distribution, and reuse, provided that the author and preprint are cited in any reuse.


