Submitted:
05 March 2026
Posted:
09 March 2026
You are already at the latest version
Abstract
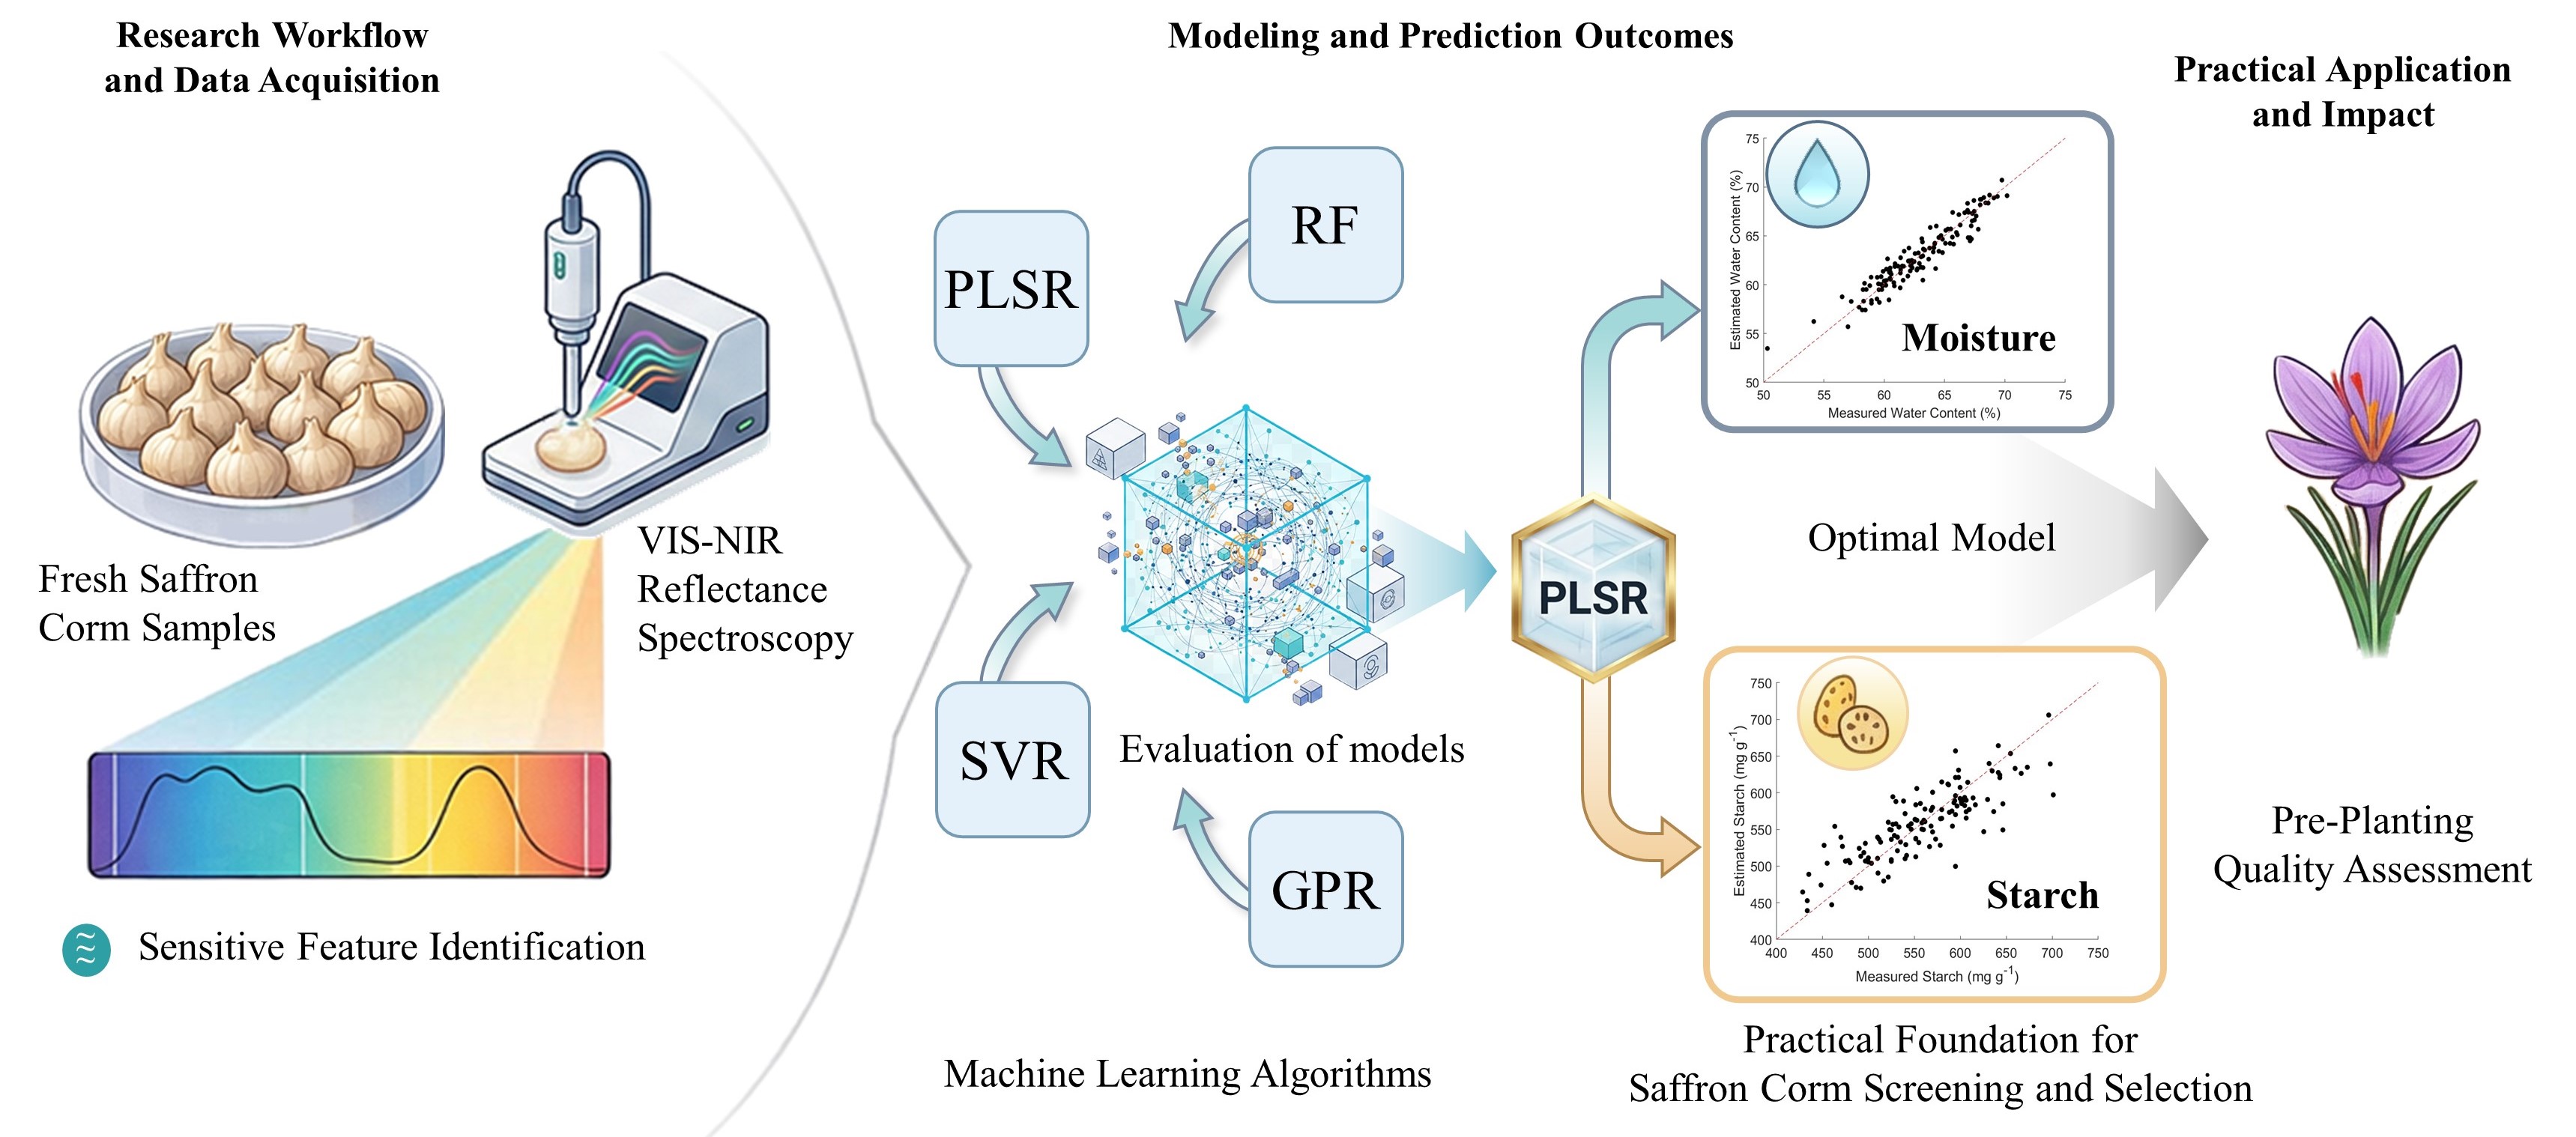
The starch and moisture content of saffron corms are critical indicators of their flowering potential and yield. This study investigated the use of rapid, non-destructive vis-NIR reflectance spectroscopy measurement to assess these parameters. The measurements were used to develop predictive models through four machine learning algorithms (PLSR, RF, SVR, and GPR). Spectral data were obtained from 130 fresh corm samples. Wavelength analysis identified key starch-sensitive intervals (~930–1000 nm and ~1150–1220 nm) and a broad moisture-sensitive region (~900–1350 nm). Among the evaluated models, the partial least squares regression (PLSR) model demonstrated the optimal predictive performance for moisture (R² = 0.89, RMSE = 0.91%, RPD = 3.67, RPIQ = 4.91) and moderate performance for starch (R² = 0.68, RMSE = 26.29 mg g⁻¹, RPD = 1.87, RPIQ = 2.37, dry weight). These results demonstrated the viability of VIS-NIR spectroscopy as a viable, non-destructive tool for the pre-planting assessment of saffron corm quality. The method provides a practical foundation for corm screening and selection, with potential for further improvement in starch prediction through expanded calibrations and advanced modeling techniques.
Keywords:
reflectance spectrometry
; corm screening
; chemometrics
; pre-planting quality assessment
; PLSR
1. Introduction
Saffron (Crocus sativus L.), the world’s most valuable spice, derives its economic and medicinal value from secondary metabolites such as crocin, picrocrocin, and saffranal [1,2]. As a sterile triploid plant, saffron is propagated exclusively through daughter corms [3,4]. The mother corm is not merely a reproductive unit but a critical storage organ, whose physiological state dictates the plant’s capacity for flowering and the vigor of the next generation [5]. Consequently, the internal quality of the planting corm is a primary determinant of field performance and final yield [6].
The saffron corm mobilizes internal reserves to initiate flowering and sustain early growth. Starch, which constitutes the primary storage carbohydrate reserve, is essential for metabolic activities and dormancy break [7,8]. Since flowering often occurs before any significant leaf development, the initial phases of floral and vegetative growth are strongly reliant on these stored compounds [9]. Therefore, quantifying starch and moisture content provides a direct proxy for the corm’s physiological maturity and flowering potential, offering a valuable metric for rapid screening of corms before planting [10].
In Iran, the leading global producer, saffron yield is facing increasing pressure from both climate change and soil degradation [11,12], as well as limited access to large and healthy corms [4]. Accordingly, improving corm quality management is a strategic task for improving yield stability and sustainability of saffron cultivation in all countries [13]. This challenge requires practical methods to assess corm composition. Traditional techniques, such as High Performance Liquid Chromatography (HPLC) and Gas Chromotography (GC), while accurate, are time-consuming, expensive, and destructive, rendering them impractical for large-scale screening [14,15]. Therefore, there is a pressing need for the development of rapid, accurate, and non-destructive methods to fill the gap between laboratory precision and the field-scale application [16].
Visible-near-infrared (VIS-NIR) spectroscopy (350-2500 nm) has been widely used in agriculture for measuring cereal protein content and fruit ripeness grade [17], controlling food industry input materials [18], assessing crop quality [19], monitoring plant health [20,21], and predicting internal plant components [22]. This method can potentially be used for rapid and non-destructive assessment of corm quality by detecting the molecular vibrations of O–H, C–H, and N–H bonds. Chemometric methods, such as partial least squares regression (PLSR), effectively translate spectral data into reliable quantitative models capable of predicting moisture content and carbohydrate composition [23,24]. While VIS-NIR has been used to assess saffron stigma quality and detect adulteration [25], recent hyperspectral studies have shown that starch and moisture in saffron corms can be predicted under specific conditions [26]. However, the direct and targeted prediction of these two key traits in healthy saffron corms using a simple VIS-NIR approach remains largely unexplored.
This study aims to address this gap by developing and validating machine learning models based on VIS-NIR spectroscopy data for the rapid, accurate, and non-destructive prediction of starch and moisture content in saffron corms. The full-scale goal is to provide a practical, decision-making framework for screening and grading corms before cultivation. Simultaneous assessment of starch and moisture also provides producers with a more comprehensive picture of the corm’s physiological status and can strengthen corm planting and maintenance management towards precision agriculture and sustainable production.
2. Materials and Methods
2.1. Plant Material and Sample Preparation
Saffron corms with a commercial caliber size of 9-10 cm in circumference (mean fresh weight about 12 g) were obtained from the supplier Roco Saffron (The Netherlands; https://www.rocosaffron.com/) on July 15, 2024 (Figure 1). Upon delivery, the corms were stored at 25±2 °C in darkness condition the Department of Agricultural and Food Sciences (DISTAL) of Alma Mater Studiorum University of Bologna (UNIBO), Emilia-Romagna, Italy. Two groups of corms were analyzed. In the first group, fresh corms were weighed and assigned a unique ID. VNIR spectra were then collected from each intact corm. Subsequently, the same corms were oven-dried at 60 °C to constant weight, ground into a fine powder, and used for reference starch determination. In the second group, corms were weighed, oven-dried under the same conditions, ground into powder (≤ 0.5 mm particle diameter), and VNIR spectra were acquired from the resulting powder. Spectra from dried corms were collected for a small subset of 12 samples. These measurements were used only for visual inspection and comparison of the dried-sample spectral patterns. They were not included in any quantitative analysis or model development, and no spectral preprocessing was applied to these data.
2.2. Reference Measurements
Moisture content was determined gravimetrically. The percentage moisture content relative to the initial fresh weight was calculated using the mass loss after oven-drying at 60 °C to constant weight. Total starch content was determined using the Megazyme Total Starch Assay Kit (K-TSTA-100A) following the manufacturer’s instructions. Accordingly, 100 mg of dried corm powder was assessed for starch content in duplicate. The assay employs enzymatic hydrolysis of starch with thermostable α-amylase followed by amyloglucosidase (AMG). Eventually, it was quantified by colorimetric determination of the released glucose using the GOPOD (glucose oxidase/peroxidase) reagent. Absorbance was measured at 510 nm. UV-Vis spectrophotometric analyses were performed using a Biochrom Libra S80PC double beam spectrophotometer controlled via PC. Starch content was calculated according to manufacturer instructions
2.3. Saffron Corms Preparation and VIS-NIR Spectroscopy
For the spectroscopic analysis, fresh saffron corms were used. A total of 130 fresh corm samples allowed for the observation of spectral features influenced by the inherent moisture content. For 12 corms (different from 130 fresh samples), spectroscopy has been done for dried powdered samples, enabling the removal of moisture-related spectral variations. Before spectroscopy, each corm was weighed with a scale with 4 decimals of precision. The spectral measurement was done at the Italian National Research Council (CNR-ARTOV), Rome, Italy. VNIR reflectance spectra were acquired using an ASD FieldSpec-4 spectrometer (Analytical Spectral Devices Inc., USA), covering the wavelength range of 350–2500 nm. In order to obtain spectra from fresh and healthy corms, the entire tunic was removed. This step was necessary to eliminate the detrimental effect of the corm’s skin on the spectroscopy analysis. All spectra were collected on August 12, 2024, under natural light conditions between 11:00 and 13:00 (local time). The sensor was mounted on a tripod at a nadir position, with the lens positioned 7 cm above the sample surface. To reduce the sensor’s field of view, an 8-degree lens was used. White references (Spectralon®) were taken before each measurement to account for light variation.
Subsequently, the corms were placed in an oven at 60 °C for one week to achieve complete drying for starch determination. The corms were then reweighed and ground into a fine powder. After that, spectral measurements were performed on the resulted samples to investigate the relationship between the spectral characteristics of the corms and their starch content. This step aimed to evaluate the potential of spectrophotometry as a non-destructive method for estimating starch content in saffron corms.
2.4. Spectral Data Pre-Processing
Due to outdoor measurement conditions and the presence of atmospheric water vapor, high noise was exhibited in the spectral data in the 1350–1450 nm and 1750–2500 nm regions. These wavelength ranges were consequently masked during data analysis, resulting in 1,300 spectral bands being retained for subsequent processing and model development. For the fresh and dried corms, a minimum of three scans per sample were recorded and averaged. The spectra were mean-centered to minimize variations in overall intensity, with the focus placed on spectral features relevant to starch content.
2.5. Feature Engineering: Narrow-Band Ratio Indices
Pearson correlation coefficients were computed between reflectance values at each wavelength and reference measurements for starch and moisture content. Negative correlations were observed between certain spectral bands and starch content, specifically in the overtone and combination bands of C–H and O–H stretches. These bands are known to be related to the presence of starch in plant tissues.
Moreover, narrow-band hyperspectral indices were computed using the ratio index (RI) to determine the optimal band pairs related to estimating saffron corm starch and moisture content, as defined in Equation (1).
where ρ and λ are the reflectance and the wavelengths, respectively. For this purpose, all possible two-band combinations were computed after the images’ pre-treatment for ASD (1300 bands, 1,690,000 indices). The coefficient of determination (R2) was then calculated for each two-band combination between the derived indices and the starch and moisture content.
2.6. Machine Learning Techniques for Moisture and Starch Estimating
To predict starch and water content, Partial Least Squares Regression (PLSR), Random Forest (RF), Support Vector Regression (SVR), and Gaussian Process Regression (GPR) algorithms were applied to the VIS-NIR spectra of fresh corms. The number of latent variables for the PLSR model was optimized using cross-validation to avoid overfitting.
Gaussian Process Regression (GPR): GPR is a versatile and supervised method for modelling intricate relationships in data and generating forecasts with associated uncertainty. It produces a distribution of all possible functions given the training points, rather than a single function. The GPR method is one of the up-to-date regression techniques and has attracted attention due to its ability to obtain a wide variety of system behavior through covariance functions [27].
Support Vector Regression (SVR): SVR is a powerful regression analysis that has proven to be particularly operational in managing dimensionality when datasets are limited [28]. SVR is a non-linear regression method with low computation costs and relatively high accuracy, founded on the premise of structural risk minimization and statistical learning theory [29].
Partial Least Squares Regression (PLSR): The PLSR technique [30,31] is a proper method for escaping the collinearity across bands problem presented in hyperspectral data [31]. PLSR is a covariance-based strategy that tries to optimize both the explained variance and the correlation between the response variables [32].
Random Forest (RF): The RF technique [33] is an ensemble classifier that employs many decision trees and combines their results to forecast an output. There are two main steps in building each decision tree in an RF: (1) creation of a new training set by random selection of subsamples through bootstrapping sampling from a specific number of samples in the original dataset, and (2) random selection of features. These two random processes help to avoid overfitting [34]. The number of trees is obtained using out-of-bag data analysis, and the number of features is obtained using the square root of the features.
2.7. Model Validation and Performance Metrics
Model robustness and generality were assessed using ten-fold cross-validation, a suitable method for the dataset size, which provides unbiased estimates while reducing the risk of overfitting. The model performance was evaluated using the R2, root mean square error (RMSE), residual predictive deviation (RPD), and ratio of performance to interquartile range (RPIQ), as calculated by Equations (2)–(5).
where , , and represent the measured, predicted, and average observed values, respectively, over n measurements. The IQ is the interquartile range of the data.
Data handling, spectral pre-processing, and model development (PLSR, RF, SVR, and GPR) were performed in MATLAB 2024b (MathWorks, Natick, MA) using custom-written scripts.
3. Results
3.1. Starch and Moisture Content in Saffron Corms
As shown in Table 1, the average starch content in the corms was 558 mg.g−1, on dry weight basis. Additionally, the average moisture content was 63%, based on the fresh weight of the corms, reflecting the percentage of moisture in the total weight of the corms.
3.2. Spectral Characteristics of Saffron Corm
Over 350–2350 nm, the reflectance spectra of fresh and dried-powdered saffron corms displayed three distinct profiles with instrumental gaps at ~1350–1450 nm and ~1750–1900 nm (visible as blank intervals), as shown in Figure 1. Although a characteristic absorption feature related to starch is present around ~2100 nm, this spectral region is included only for visual comparison of spectral characteristics in Figure 1 and was not considered in the modeling process. Consequently, wavelengths beyond 1750 nm were excluded from further analysis.
For fresh corms, the spectral profile was dominated by strong water absorption features. Reflectance rose from ~0.1-0.25 at 400 nm to a broad maximum (~0.6-0.7) in the near-infrared (700-900 nm), with characteristic dips associated with water (e.g., ~970 nm, ~1200 nm) and broad overtone bands of organic constituents (Figure 2a).
In contrast, spectra of dried, powdered corms showed significantly higher reflectance (Figure 2b). In the VIS-NIR region (400–1350 nm), reflectance rose from ~0.05–0.15 at 400 nm to a broad maximum of ~0.95 near ~1000 nm, with minor variations in reflectance. A pronounced downturn occurs between ~1100–1250 nm, followed by a secondary rise toward ~1350 nm. In the first SWIR window (1450–1750 nm), spectra lie around ~0.40–0.60 and show a broad hill centered near ~1600 nm with shoulders at ~1500–1550 nm and ~1680–1710 nm. In the second SWIR window (1900–2350 nm), reflectance is lower (~0.12–0.30) and exhibits two repeatable feature sets: (i) peaks–troughs around ~2000–2100 nm and (ii) structured bands over ~2150–2300 nm. Across all windows, similar line-shape patterns are shown; variability appears primarily as vertical intensity offsets rather than wavelength shifts, and the deep minima typical of strong water bands are notably attenuated in these dried powders.
3.3. Wavelength-Specific Correlation with Starch and Moisture
Pearson’s wavelength dependent correlations analysis revealed weak but consistent trends with starch and moisture content in fresh corms (Figure 3). Water content showed uniformly negative correlations across the recorded range. Coefficients decreased smoothly to about −0.05 over 500–800 nm, reached a local minimum at ~930–1000 nm (≈−0.10), exhibited a shallow shoulder at ~1030–1070 nm (≈−0.06 to −0.07), and declined again over 1150–1220 nm (≈−0.12 to −0.13). The deepest minimum occurred around 1300–1350 nm (≈−0.15 to −0.16). After the spectral gap (~1350–1450 nm), correlations remained consistently negative at ~−0.10 ± 0.01 through 1450–1750 nm. Collectively, the dataset delineates three water-informative windows: ~930–1000 nm, 1150–1220 nm, and 1270–1330 nm.
Starch content exhibited a different pattern, with predominantly positive correlations in the visible to short-wave NIR (400–900 nm, from ~+0.09 down toward zero), with modest positive undulations over 950–1250 nm (≈0 to +0.02). In the post-gap region (1450–1750 nm), coefficients were mildly negative (≈−0.04) and showed a trend toward zero. The discontinuity between ~1350 and 1450 nm reflects a missing spectral segment in the input data.
3.4. Optimal Narrow-Band Spectral Indices
The predictive power of all possible two-band ratio indices (RIs) was mapped using R2 heatmaps (Figure 4). For moisture, the highest R2 values exhibited an intense, elongated region along the main diagonal centered at 930–1000 nm and 1050-1150 nm, accompanied by an elongated band of elevated correlation over ~1300–1350 nm. Additionally, fluctuations in moisture content were observed at wavelengths below 800 nm. For starch, the most predictive region was more limited, centered in the ~730–900 nm range with a narrow ridge along the diagonal at ~740–930 nm. Only weak, isolated peaks are present near ~400–520 nm and ~1000–1100 nm. Above 1300 nm, additional weak features were observed, but they were poorly resolved due to the masked spectral gaps (1350–1450 and 1750–1900 nm). The optimal band-pairs and their performance are summarized in Table 2. For water content, the best-performing band pair was RI (λ1182, λ1305), with a modest R2 = 0.41 and RMSE = 2.82%. For starch, the highest performance was obtained with RI (λ735, λ810), with R2 = 0.35 and RMSE = 43.1 mg g−1. Overall, these two-band indices show limited predictive potential. The corresponding calibration equations are provided in Table 2.
3.5. Predictive Performance for Starch and Water Content Estimation
The performance of the PLSR, RF, SVR, and GPR algorithms to estimate the saffron corms scratch and water content using VIS-NIR spectra is shown in Table 3. The results showed that the moisture content was predicted with higher accuracy than starch content across all ML algorithms. Starch content prediction was moderately successful.
Among the various models evaluated for starch, the PLSR yielded the best results, achieving the highest R2 value (0.68) and the lowest RMSE (26.29). Both the PLSR and RF models exhibited identical RPD values of 1.87, while the PLSR model demonstrated superior performance with an RPIQ value of 2.37. In predicting starch content, the RF model performed similarly to PLSR. For moisture content prediction, the PLSR model outperformed the other models with an R2 value of 0.89 and the lowest RMSE (0.91). Additionally, it delivered the most accurate predictions, as evidenced by the highest RPD (3.67) and RPIQ (4.91) values. The GPR model ranked second in performance after PLSR.
As shown in Table 3, PLSR was the best-performing algorithm for modeling saffron corms’ moisture and scratch content. Figure 5 shows scatter plots of measured versus estimated values for these properties, obtained using PLSR. The model achieved R2 = 0.68 with RMSE = 26.29 mg g−1 (dry weight basis) across a range of approximately 400-750 mg g−1 (Figure 5b). The model explained 89% of the variance (R2 = 0.89) with RMSE = 0.91% across a range of ~51–74% moisture (Figure 5a). Data points clustered tightly along the 1:1 line with no evident systematic bias. Dispersion remains nearly uniform across the domain, indicating stable precision over low- to high-moisture samples. While a linear trend is evident, prediction scatter was greater than for moisture, especially at higher starch concentrations (above ~600 mg g−1), where a slight underestimation was observed. The PLSR model exhibits a slight but consistent overestimation of starch content in samples with lower actual values.
4. Discussion
4.1. Starch and Moisture Content in Saffron Corms
On a dry weight basis, the average starch content in saffron corms was approximately 55.8 mg g−1 (Table 1), indicating a significant amount of this compound in the corm tissue. Starch plays an important role in the plant’s metabolic processes, including flowering and energy storage. The role of starch content as a key factor in corm growth and daughter corm formation has been recently documented [35]. Additionally, the moisture content of the corms was 63% (Table 1) on a fresh weight basis, reflecting a high level of moisture in the plant tissue. High moisture content may be crucial in maintaining cell density and protecting against environmental stresses during the early growth stages [36]. Compared with the active growth phase of the plant, mid to late summer (around August) coincides with the dormant period of saffron corms, during which above-ground growth ceases, and physiological activity is minimal. During this period, the corms neither absorb water nor retain water in their tissues. Mid and late summer may represent a favorable period for spectroscopic measurement (starch), as the moisture content, which can interfere with the accurate prediction of starch content, is at its lowest [35]. Together, starch and moisture content represent critical physiological factors that determine the saffron’s quality and health, as well as its subsequent flowering potential.
4.2. Spectral Signatures and Their Biochemical Basis
The positive correlation between VIS-NIR reflectance and starch content, particularly pronounced in the 930–1000 nm, 1150–1200 nm, and 1270–1330 nm ranges (Figure 3), aligns with known carbohydrate absorption features. These correlations can be attributed to light scattering resulting from the structural characteristics of starch in these regions. Starch is stored in the plant tissue as semi-crystalline granules, which consist of both amorphous and crystalline layers. This structure is influenced by the ratio of amylose to amylopectin [37]. Additionally, the shape and method of starch storage may affect how the light is reflected. Starch granules may be oval or polyhedral [38], and the way light is reflected from each of these shapes may vary. Similar studies have reported negative correlations for starch within these spectral regions, with the scattering effects being especially significant in amylopectin and amylose and their molecular structure [39,40].
The negative correlation between moisture and reflectance across the 400–900 nm range is more complex and likely indirect. This pattern is more likely consistent with moisture-induced, indirect changes in tissue scattering and overall optical behavior, rather than direct absorption by water. In contrast, in water-sensitive near-infrared regions (approximately 970–1200 nm and around the 1450 nm water absorption band), increased moisture is expected to reduce reflectance, which accords with the slightly negative correlations observed beyond 1450 nm [41]. Therefore, the light absorption characteristics of moisture in these spectral regions may seem logical, as water molecules naturally absorb light. On the other hand, because water molecules contain hydroxyl groups, they can affect signals in the VIS-NIR region. Given that the moisture content in the saffron corm is much higher than that of starch, any wavelength that is more influenced by the moisture content may indirectly show an inverse correlation with the starch content itself. Hydroxyl (O–H) bonds can absorb light and reduce reflectance. Because O–H groups exist in both water and starch, these absorptions may reflect contributions from both. However, since the moisture content of the saffron corm is much higher than the starch content, bands that are sensitive to both moisture and starch are likely dominated by moisture, meaning the apparent starch-related signal may be influenced by moisture. The dominance of the water signal makes it difficult to predict starch content, as water absorption can mask or alter the subtle spectral signatures of starch, which explains the inverse correlation pattern noted in some regions.
4.3. Spectral Profiles of Fresh and Powdered Saffron Corms Across 400–2350 nm
Figure 2 shows the VIS-NIR–SWIR reflectance behavior of fresh (wet) corms and dried, powdered material. Across 400–1350 nm, reflectance increases steeply toward a broad maximum near ~1000 nm, followed by a pronounced downturn over ~1100–1250 nm and partial recovery toward the end of the VIS-NIR window. This behavior is consistent with that typically observed in plant tissue optics, where high NIR reflectance is strongly influenced by internal scattering, while water-related features contribute to localized absorption around the NIR plateau [42,43]. The presence of O-H, C-H, and C-O bonds can lead to light absorption and the creation of vibrational modes in these areas. The absorption feature at 750 nm could be related to the third O–H band and the fourth overtone of C–H [44].
In the SWIR region, reflectance is lower and exhibits a repeatable structure at wavelengths of around 2000–2100 nm and 2150–2300 nm. Earlier studies on dry plant materials have reported features in these intervals. The absorptions of 1200 nm, 1450–1600 nm, and 2100 nm are often linked to overtone and combination bands of O–H and C–H vibrations containing components such as cellulose and starch [45,47]. Two blank intervals, at ~1350–1450 nm and ~1750–1900 nm, correspond to instrumental gaps (missing spectral data) in the acquisition system and were excluded from interpretation. This may be because measurements were made outdoors under natural illumination. Compared to fresh corms, the dried powders are less influenced by liquid water and more influenced by particle-scale scattering. This can reduce the prominence of water-related spectral features and modify the overall reflectance intensity.
4.4. Two-Dimensional R2 Maps of RI Band-Pair Indices: Key Wavelengths for Water and Starch
The two-dimensional R2 maps for moisture and starch reveal specific regions of the spectrum that exhibit the highest R2 values for these features. For moisture, the strongest correlations were observed in the 930-1000, 1050–1150 nm, and 1300–1350 nm regions. In line with Table 2, the optimal RI band pair for moisture was λ1182/λ1305. These spectral regions are consistent with water-related absorption features in the NIR. Such features are usually attributed to O–H bonds in water molecules. So, changes in a sample’s water content show up as changes in NIR absorption. In studies on plant materials, these regions have been reported as moisture-sensitive areas. These results show that selected wavelength pairs capture informative moisture-related variation in the NIR range [46,47]. This finding effectively demonstrates that moisture prediction through VNIR spectroscopy can be achieved with the use of useful bands (band-pair selection).
For starch, two-dimensional R2 maps indicated stronger activity in the 740–930 nm regions. Accordingly, Table 2 identified λ735/λ810 as the optimal RI band pair for starch. These wavelengths may be related to vibrations of O-H and C-H bonds, which are present in amylose and amylopectin. These areas may reflect the impact of amylopectin and amylose on light scattering, as reported in similar studies [50,51]. The sparse region at 1350–1450 nm reflects the measurement gap in the spectra. However, the correlations in regions above 1000 nm were weaker, which may be linked to lower light scattering and the specific characteristics of starch in these regions. In the wavelength range of 400 to 500 nanometers, where some changes have been observed, no evidence of starch absorption has yet been found. This could be due to the physical and chemical structure of starch or phenomena such as light scattering.
4.5. Machine Learning Algorithms Performance For Starch and Moisture Prediction
The PLSR model achieved the best predictive accuracy for both moisture and starch content of saffron corms using VIS-NIR spectra in comparison with other models (RF, SVR, and GPR). For moisture content (R2 = 0.89, RMSE = 0.91%, RPD = 3.67, RPIQ = 4.91), with good agreement between measured and predicted values across the ~51–74% range. As shown in Figure 5a, data points are tightly clustered along the 1:1 line with no evident systematic bias and relatively uniform dispersion, indicating stable prediction precision across low- to high-moisture samples [52].
Compared with moisture, the starch prediction showed moderate performance, with RF achieving the second-best ranking among the evaluated models (Table 3). Figure 5b reveals a linear trend across the approximate range of 400–750 mg g−1, yet greater scatter and a slight underestimation at higher starch concentrations (above ~600 mg g−1). This reduced accuracy can be attributed to three main factors: first, the overwhelming spectral influence of water, which complicates the detection of the weaker starch signal; second, the light-scattering properties of semi-crystalline starch granules, which are influenced by granule size, shape, and the amylose-to-amylopectin ratio [38,39]; and, third, potential non-linear interactions between water and starch in the fresh tissue matrix. The moderate performance suggests that while VIS-NIR can rank corms by starch content, its use for precise quantitative determination may require enhanced calibration strategies, for instance, neural network models have shown benefits [53,54].
5. Conclusions
This study demonstrates that VIS-NIR–NIR spectroscopy is an effective, non-destructive method for the rapid assessment of key compositional traits in saffron corms. Among the evaluated models (PLSR, RF, SVR, and GPR), PLSR provided the best predictive performance for both traits. Moisture content was predicted with strong accuracy (R2 = 0.89, RMSE = 0.91%, RPD = 3.67, RPIQ = 4.91), while starch content achieved moderate but informative precision (R2 = 0.68, RMSE = 26.29 mg g−1, RPD = 1.87, RPIQ = 2.37, dry basis). Wavelength-dependent analysis identified starch-sensitive intervals (~930–1000 nm and ~1150–1220 nm) and confirmed the strong influence of moisture in the 900-1350 nm range. The results confirm the practical potential of VIS-NIR spectroscopy as a screening tool for evaluating pre-planting corms. The method offers a scientifically grounded alternative to destructive laboratory analyses, enabling the assessment of moisture in saffron corms and providing a workable basis for starch estimation. This leads to the grading and selection of corms based on their physiological reserves. To enhance robustness and transition toward field application, future work should focus on expanding the calibration dataset across diverse growing conditions and evaluating advanced modeling techniques to further improve starch prediction accuracy. Future work should also evaluate the use of controlled illumination and purpose-specific wavelength selection, as well as alternative sensing modes such as interactance or transmittance, which may better capture internal corm properties than surface reflectance alone.
Author Contributions
Conceptualization, S.M.; and R.R.; Methodology, S.M.; M.F.; F.S.; A.S; M.C.; SH.M.; and A.N; Software, M.F. and S.M.; Investigation, M.F.; A.P.; Resources, R.R.; F.O.; Data curation, M.F.; Writing—original draft preparation, M.F.; Writing—review and editing, All.; Supervision, R.R.; G.P.; F.S; All authors have read and agreed to the published version of the manuscript.
Funding
This research received no external funding.
Data Availability Statement
The datasets generated during and/or analyzed during the current study are available from the corresponding author on reasonable request.
Acknowledgments
The authors acknowledge the Institute of Methodologies for Environmental Analysis of the Italian National Research Council for providing spectroscopy facilities.
Conflicts of Interest
The authors declare no conflicts of interest.
Abbreviations
The following abbreviations are used in this manuscript:
| AMG | Amyloglucosidase |
| GC | Gas Chromatography |
| GPR | Gaussian Process Regression |
| GOPOD | Glucose Oxidase/Peroxidase |
| HPLC | High-Performance Liquid Chromatography |
| PLSR | Partial Least Squares Regression |
| RPD | Residual Predictive Deviation |
| RPIQ | Ratio of Performance to Interquartile Range |
| RMSE | Root Mean Square Error |
| RTS | Rapid Total Starch |
| SWIR | Short-Wave Infrared |
| SVR | Support Vector Regression |
| RF | Random Forest |
| VIS-NIR | Visible & Near-Infrared |
References
- Cardone, L.; Castronuovo, D.; Perniola, M.; Cicco, N.; Candido, V. Saffron (Crocus Sativus L.), the King of Spices: An Overview. Sci. Hortic. 2020, 272. [Google Scholar] [CrossRef]
- Avila-Sosa, R.; Nevárez-Moorillón, G.V.; Ochoa-Velasco, C.E.; Navarro-Cruz, A.R.; Hernández-Carranza, P.; Cid-Pérez, T.S. Detection of Saffron’s Main Bioactive Compounds and Their Relationship with Commercial Quality. Foods 2022, 11. [Google Scholar] [CrossRef] [PubMed]
- Cardone, L.; Candido, V.; Castronuovo, D.; Perniola, M.; Cicco, N. Comparing Annual and Biennial Crop Cycle on the Growth, Yield and Quality of Saffron Using Three Corm Dimensions. Sci. Hortic. 2021, 288. [Google Scholar] [CrossRef]
- Naseri, E.; Dalir, N.; Mokhtassi-Bidgoli, A.; Ebadi, M.T.; Rahnemaie, R. Optimizing Saffron Cormlet Production through Substrate Composition Nutrient Concentration and Irrigation Management in Soilless Cultivation. Sci. Rep. 2025, 15. [Google Scholar] [CrossRef]
- Dewir, Y.H.; Alsadon, A.; Ibrahim, A.; El-Mahrouk, M. Effects of Growing Substrate, Mode of Nutrient Supply, and Saffron Corm Size on Flowering, Growth, Photosynthetic Competence, and Cormlet Formation in Hydroponics. Horttechnology 2022, 32, 234–240. [Google Scholar] [CrossRef]
- Ralli, P.E.; Menexes, G.; Dordas, C.A. Corm Size and Planting Density Affect the Yield and Longevity of Saffron (Crocus Sativus L.). Not. Bot. Horti Agrobot. Cluj. Napoca. 2024, 52. [Google Scholar] [CrossRef]
- Chrungoo, N.K.; Farooq, S. Correlative Changes in Carbohydrate Content and Starch Hydrolysing Enzymes in Corms of Saffron Crocus (Crocus Sativus L.) during Dormancy and Sprouting. Biochemie und Physiologie der Pflanzen 1985, 180, 55–61. [Google Scholar] [CrossRef]
- Kamenetsky, R.; Zemah, H.; Ranwala, A.P.; Vergeldt, F.; Ranwala, N.K.; Miller, W.B.; Van As, H.; Bendel, P. Water Status and Carbohydrate Pools in Tulip Bulbs during Dormancy Release. New Phytologist 2003, 158, 109–118. [Google Scholar] [CrossRef]
- Bagri, J.; Yadav, A.; Anwar, K.; Dkhar, J.; Singla-Pareek, S.L.; Pareek, A. Metabolic Shift in Sugars and Amino Acids Regulates Sprouting in Saffron Corm. Sci. Rep. 2017, 7. [Google Scholar] [CrossRef]
- Renau-Morata, B.; Nebauer, S.G.; Sánchez, M.; Molina, R. V. Effect of Corm Size, Water Stress and Cultivation Conditions on Photosynthesis and Biomass Partitioning during the Vegetative Growth of Saffron (Crocus Sativus L.). Ind. Crops Prod. 2012, 39, 40–46. [Google Scholar] [CrossRef]
- Maleki, F.; Kazemi, H.; Siahmarguee, A.; Kamkar, B. Development of a Land Use Suitability Model for Saffron (Crocus Sativus L.) Cultivation by Multi-Criteria Evaluation and Spatial Analysis. Ecol. Eng. 2017, 106, 140–153. [Google Scholar] [CrossRef]
- Acharya, B.S.; Ghalehgolabbehbahani, A.; Hamido, S.; Zinati, G.; Bozzolo, A.; Archer, L.; Wendelberger, K.; Das, S.; Thapa, R.; Panday, D. Saffron (Crocus Sativus L.): The Golden Spice — Management, Challenges, and Opportunities for Sustainable Production in the United States. J. Agric. Food Res. 2025, 21. [Google Scholar] [CrossRef]
- Ziaei, S.M.; Feizi, H.; Siuki, A.K.; Sahabi, H. Yield and Quality of Saffron (Crocus Sativus L.) in Response to Priming Treatments and Water Deficit. Italian Journal of Agronomy 2024, 19. [Google Scholar] [CrossRef]
- Mena-García, A.; Sanz, M.L.; Díez-Municio, M.; Ruiz-Matute, A.I. A Combined Gas and Liquid Chromatographic Approach for Quality Evaluation of Saffron-Based Food Supplements. Foods 2023, 12. [Google Scholar] [CrossRef]
- Eghbali, S.; Farhadi, F.; Askari, V.R. An Overview of Analytical Methods Employed for Quality Assessment of Crocus Sativus (Saffron). Food Chem. X 2023, 20. [Google Scholar] [CrossRef]
- Nondestructive Determination of Dry Matter and Soluble Solids Content in Dehydrator Onions and Garlic Using a Handheld Visible; Thailand, 2017.
- Ricci, C.; Gadaleta, A.; Gerardino, A.; Didonna, A.; Ferrara, G.; Bertani, F.R. Portable optical spectroscopy and machine learning techniques for quantification of the biochemical content of raw food materials. CABI Agric Biosci 2024, 5, 39. [Google Scholar] [CrossRef]
- Angel Prieto Lage, M.; Barral Martínez, M.; Seyyedimansour, S.; Manikantan, M.R.; Trif, M.; Khaneghah, M.A. Recent Advancements in NIR Spectroscopy for Assessing the Quality and Safety of Horticultural Products: A Comprehensive Review. Front. Nutr. 9. [CrossRef] [PubMed]
- Fodor, M.; Matkovits, A.; Benes, E.L.; Jókai, Z. The Role of Near-Infrared Spectroscopy in Food Quality Assurance: A Review of the Past Two Decades. Foods 2024, 13. [Google Scholar] [CrossRef] [PubMed]
- Darvishi Boloorani, A.; Mirzaei, S.; Bahrami, H.A.; Soleimani, M.; Neysani Samany, N.; Papi, R.; Mahmoudi, M.; Bakhtiari, M.; Huete, A. In vitro plant spectral response reveals dust stress. Agric. For. Meteorol. 2025, 370. [Google Scholar] [CrossRef]
- Darvishi Boloorani, A.; Ranjbar, S.; Mirzaei, S.; Bahrami, H.A.; Mirzapour, F.; Abbaszadeh Tehrani, N. Spectral behavior of Persian oak under compound stress of water deficit and dust storm. Int. J. Appl. Earth Obs. Geoinf. 2020, 88, 102082. [Google Scholar] [CrossRef]
- Rawal, A.; Hartemink, A.; Zhang, Y.; Wang, Y.; Lankau, R.A.; Ruark, M.D. Visible and Near-Infrared Spectroscopy Predicted Leaf Nitrogen Contents of Potato Varieties under Different Growth and Management Conditions. Precis. Agric. 2024, 25, 751–770. [Google Scholar] [CrossRef]
- Bai, S.H.; Tootoonchy, M.; Kämper, W.; Tahmasbian, I.; Farrar, M.B.; Boldingh, H.; Pereira, T.; Jonson, H.; Nichols, J.; Wallace, H.M.; et al. Predicting Carbohydrate Concentrations in Avocado and Macadamia Leaves Using Hyperspectral Imaging with Partial Least Squares Regressions and Artificial Neural Networks. Remote Sens. (Basel). 2024, 16. [Google Scholar] [CrossRef]
- Wang, Z.; Li, J.; Zhang, C.; Fan, S. Development of a General Prediction Model of Moisture Content in Maize Seeds Based on LW-NIR Hyperspectral Imaging. Agriculture (Switzerland) 2023, 13. [Google Scholar] [CrossRef]
- Alighaleh, P.; Pakdel, R.; Ghanei Ghooshkhaneh, N.; Einafshar, S.; Rohani, A.; Saeidirad, M.H. Detection and Classification of Saffron Adulterants by Vis-Nir Imaging, Chemical Analysis, and Soft Computing. Foods 2023, 12. [Google Scholar] [CrossRef] [PubMed]
- Xu, N.; Chen, B.; Sun, H.; Huang, W.; Wu, Y.; Lu, L.; Lou, X.; Xie, C. High-Throughput Phenotyping of Multiple Quantitative Traits for Saffron Corm Rot via NIR Hyperspectral Imaging and Broad Learning System. Microchemical Journal 2026, 220, 116603. [Google Scholar] [CrossRef]
- Verrelst, J.; Malenovský, Z.; Van der Tol, C.; Camps-Valls, G.; Gastellu-Etchegorry, J.P.; Lewis, P.; North, P.; Moreno, J. Quantifying Vegetation Biophysical Variables from Imaging Spectroscopy Data: A Review on Retrieval Methods. Surv. Geophys. 2019, 40, 589–629. [Google Scholar] [CrossRef]
- Basak, D.; Pal, S.; Patranabis, D.C. Support Vector Regression; 2007; Vol. 11. [Google Scholar]
- Smola, A.J.; Sch¨olkopf, B.; Sch¨olkopf, S. A Tutorial on Support Vector Regression; Kluwer Academic Publishers, 2004; Volume 14, pp. 199–222. [Google Scholar]
- Geladi, P.; Kowalski, B.R. Partial Least-Squares Regression: A Tutorial. Anal. Chim. Acta 1986, 185, 1–17. [Google Scholar] [CrossRef]
- Abdel-Rahman, E.M.; Mutanga, O.; Odindi, J.; Adam, E.; Odindo, A.; Ismail, R. Estimating Swiss Chard Foliar Macro- and Micronutrient Concentrations under Different Irrigation Water Sources Using Ground-Based Hyperspectral Data and Four Partial Least Squares (PLS)-Based (PLS1, PLS2, SPLS1 and SPLS2) Regression Algorithms. Comput. Electron. Agric. 2017, 132, 21–33. [Google Scholar] [CrossRef]
- dos Santos Neto, J.P.; de Assis, M.W.D.; Casagrande, I.P.; Cunha Júnior, L.C.; de Almeida Teixeira, G.H. Determination of ‘Palmer’ Mango Maturity Indices Using Portable near Infrared (VIS-NIR) Spectrometer. Postharvest Biol. Technol. 2017, 130, 75–80. [Google Scholar] [CrossRef]
- Breiman, L. Random Forests. Machine Learning 2001, 45, 5–32. [Google Scholar] [CrossRef]
- Rodriguez-Galiano, V.F.; Ghimire, B.; Rogan, J.; Chica-Olmo, M.; Rigol-Sanchez, J.P. An Assessment of the Effectiveness of a Random Forest Classifier for Land-Cover Classification. ISPRS Journal of Photogrammetry and Remote Sensing 2012, 67, 93–104. [Google Scholar] [CrossRef]
- Pallotti, C.; Renau-Morata, B.; Cardone, L.; Nebauer, S.G.; Albiñana Palacios, M.; Rivas-Sendra, A.; Seguí-Simarro, J.M.; Molina, R. V. Understanding the Saffron Corm Development—Insights into Histological and Metabolic Aspects. Plants 2024, 13. [Google Scholar] [CrossRef] [PubMed]
- Gusain, S.; Joshi, R. Morphological, Physiological, and Transcriptional Changes in Crocus Sativus L. Under In Vitro Polyethylene Glycol-Induced Water Stress. Biology (Basel). 2025, 14. [Google Scholar] [CrossRef]
- Bertoft, E. Understanding Starch Structure: Recent Progress. Agronomy 2017, 7. [Google Scholar] [CrossRef]
- Pérez, S.; Baldwin, P.M.; Gallant, D.J. Structural Features of Starch Granules I. In Starch; Elsevier Inc., 2009; pp. 149–192. ISBN 9780127462752. [Google Scholar]
- Roger, P.; Bello-Perez, L.A.; Colonna, P. Contribution of Amylose and Amylopectin to the Light Scattering Behaviour of Starches in Aqueous Solution. Polymer 1999, 40(25), 6897–6909. [Google Scholar] [CrossRef]
- Zeng, L.; Chen, C. Simultaneous Estimation of Amylose, Resistant, and Digestible Starch in Pea Flour by Visible and near-Infrared Reflectance Spectroscopy. Int. J. Food Prop. 2018, 21, 1129–1137. [Google Scholar] [CrossRef]
- Sims, D.A.; Gamon, J.A. Estimation of Vegetation Water Content and Photosynthetic Tissue Area from Spectral Reflectance: A Comparison of Indices Based on Liquid Water and Chlorophyll Absorption Features. Remote Sensing of Environment 2003, 84, 526–537. [Google Scholar] [CrossRef]
- Hennessy, A.; Clarke, K.; Lewis, M. Hyperspectral Classification of Plants: A Review of Waveband Selection Generalisability. Remote Sens. (Basel). 2020, 12. [Google Scholar] [CrossRef]
- Li, C.; Czyż, E.A.; Halitschke, R.; Baldwin, I.T.; Schaepman, M.E.; Schuman, M.C. Evaluating Potential of Leaf Reflectance Spectra to Monitor Plant Genetic Variation. Plant Methods 2023, 19. [Google Scholar] [CrossRef]
- Farhadi, R.; Afkari-Sayyah, A.H.; Jamshidi, B.; Mousapour Gorji, A. Prediction of internal compositions change in potato during storage using visible/near-infrared (Vis/NIR) spectroscopy. International Journal of Food Engineering 2020, 16(4), 20190110. [Google Scholar] [CrossRef]
- Daughtry, C.S.T.; Hunt, E.R.; McMurtrey, J.E. Assessing Crop Residue Cover Using Shortwave Infrared Reflectance. Remote Sens. Environ. 2004, 90, 126–134. [Google Scholar] [CrossRef]
- Lamb, B.T.; Dennison, P.E.; Hively, W.D.; Kokaly, R.F.; Serbin, G.; Wu, Z.; Dabney, P.W.; Masek, J.G.; Campbell, M.; Daughtry, C.S.T. Optimizing Landsat Next Shortwave Infrared Bands for Crop Residue Characterization. Remote Sens. (Basel). 2022, 14. [Google Scholar] [CrossRef]
- Sadeghi, A.; Khani, S.; Sabourian, R.; Hajimahmoodi, M.; Ghasemi, J.B. Integrating CNNs and chemometrics for ana-lyzing NIR spectra and RGB images in turmeric adulterant detection. J. Food Compos. Anal. 2025, 141, 107324. [Google Scholar] [CrossRef]
- Cozzolino, D. The Role of Near-Infrared Sensors to Measure Water Relationships in Crops and Plants. Appl. Spectrosc. Rev. 2017, 52, 837–849. [Google Scholar] [CrossRef]
- Sun, Y.; Liu, Y.; Yu, H.; Xie, A.; Li, X.; Yin, Y.; Duan, X. Non-Destructive Prediction of Moisture Content and Freezable Water Content of Purple-Fleshed Sweet Potato Slices during Drying Process Using Hyperspectral Imaging Technique. Food Anal. Methods 2017, 10, 1535–1546. [Google Scholar] [CrossRef]
- Ringsted, T.; Siesler, H.W.; Engelsen, S.B. Monitoring the Staling of Wheat Bread Using 2D MIR-NIR Correlation Spectroscopy. J. Cereal Sci. 2017, 75, 92–99. [Google Scholar] [CrossRef]
- Cozzolino, D.; Degner, S.; Eglinton, J. A Review on the Role of Vibrational Spectroscopy as an Analytical Method to Measure Starch Biochemical and Biophysical Properties in Cereals and Starchy Foods. Foods 2014, 3, 605–621. [Google Scholar] [CrossRef] [PubMed]
- Jin, X.; Shi, C.; Yu, C.Y.; Yamada, T.; Sacks, E.J. Determination of Leaf Water Content by Visible and Near-Infrared Spectrometry and Multivariate Calibration in Miscanthus. Front. Plant Sci. 2017, 8. [Google Scholar] [CrossRef]
- Arefi, A.; Sturm, B.; Hoffmann, T. Explainability of Deep Convolutional Neural Networks When It Comes to NIR Spectral Data: A Case Study of Starch Content Estimation in Potato Tubers. Food Control 2025, 169. [Google Scholar] [CrossRef]
- Frey, L.A.; Baumann, P.; Aasen, H.; Studer, B.; Kölliker, R. A Non-Destructive Method to Quantify Leaf Starch Content in Red Clover. Front. Plant Sci. 2020, 11. [Google Scholar] [CrossRef] [PubMed]
Figure 1.
(a) Saffron corms (Crocus sativus L.) obtained from the supplier Roco Saffron; (b) corm size classification and separation of a commercial caliber of 9–10 cm used for measurement.
Figure 1.
(a) Saffron corms (Crocus sativus L.) obtained from the supplier Roco Saffron; (b) corm size classification and separation of a commercial caliber of 9–10 cm used for measurement.

Figure 2.
Reflectance spectra of (a) wet saffron corms with different moisture and starch content (each line = one corm; spectrum averaged over [3] scans) shown as examples with their corresponding reference water (%) and starch (mg g−1, dry weight) and (b) dried (average of 12 samples), powdered saffron corms over 350–2350 nm showing a steep rise to ~1000 nm, a downturn at 1100–1250 nm, a broad hill near 1600 nm, and structured bands at 2000–2100 and 2150–2300 nm (instrumental gaps at ~1350–1450 and 1750–1900 nm).

Figure 3.
Pearson correlation (r) versus wavelength between VIS-NIR reflectance and composition in fresh saffron corms (n=130): moisture (red) is uniformly negative; starch (blue) is generally positive. The 1350–1450 nm gap indicates missing data.
Figure 3.
Pearson correlation (r) versus wavelength between VIS-NIR reflectance and composition in fresh saffron corms (n=130): moisture (red) is uniformly negative; starch (blue) is generally positive. The 1350–1450 nm gap indicates missing data.

Figure 4.
Two-dimensional R2 heat maps of RI narrowband spectral indices (based on wavelength-pair combinations) for estimating (a) water content and (b) starch content from reflectance spectra (400–1750 nm). Warmer colors indicate higher R2. Water shows the strongest structure in ~900–1350 nm (maximum around 1.20–1.26 µm), while starch exhibits compact, high-R2 blocks in the ~730–900 nm range; the sparse band at 1350–1450 nm reflects a measurement gap.

Figure 5.
Plots for VIS-NIR predictions in fresh saffron corms (n = 130). (a) moisture content (%)—measured vs. predicted (R2 = 0.89, RMSE = 0.91%). (b) starch (mg g−1, dry basis)—measured vs. predicted (R2 = 0.68, RMSE = 26.29 mg g−1).
Figure 5.
Plots for VIS-NIR predictions in fresh saffron corms (n = 130). (a) moisture content (%)—measured vs. predicted (R2 = 0.89, RMSE = 0.91%). (b) starch (mg g−1, dry basis)—measured vs. predicted (R2 = 0.68, RMSE = 26.29 mg g−1).


Table 1.
Descriptive statistics for starch and moisture content in saffron corms.
| Property | n | Min | Mean | Max | Standard Deviation |
|---|---|---|---|---|---|
| Starch Content (mg g−1) | 130 | 428 | 558 | 701 | 59 |
| Moisture Content (%) | 130 | 50.3 | 63 | 70.3 | 3.5 |
Table 2.
Optimal narrow-band ratio index (RI) for predicting starch and moisture content in saffron corms.
Table 2.
Optimal narrow-band ratio index (RI) for predicting starch and moisture content in saffron corms.
| Optimal Band Pair | R2 | RMSE | Equation |
|---|---|---|---|
| RI (λ1182, λ1305) | 0.41 | 2.82 | |
| RI (λ735, λ810) | 0.35 | 43.1 | g−1 |
Table 3.
Comparative performance of PLSR, RF, SVR, and GPR models in predicting starch and moisture content in saffron corms using VIS-NIR spectra (n = 130).
Table 3.
Comparative performance of PLSR, RF, SVR, and GPR models in predicting starch and moisture content in saffron corms using VIS-NIR spectra (n = 130).
| Property | Algorithm | R2 | RMSE | RPD | RPIQ |
| Starch | GPR | 0.63 | 28.31 | 1. 79 | 2.16 |
| SVR | 0.59 | 32.43 | 1.54 | 1.98 | |
| PLSR | 0.68 | 26.29 | 1.87 | 2.37 | |
| RF | 0.65 | 27.14 | 1.87 | 2.33 | |
| Moisture Content |
GPR | 0.85 | 0.97 | 3.64 | 4.37 |
| SVR | 0.79 | 1.19 | 2.56 | 2.98 | |
| PLSR | 0.89 | 0.91 | 3.67 | 4.91 | |
| RF | 0.80 | 1.04 | 2.98 | 3.28 |
Disclaimer/Publisher’s Note: The statements, opinions and data contained in all publications are solely those of the individual author(s) and contributor(s) and not of MDPI and/or the editor(s). MDPI and/or the editor(s) disclaim responsibility for any injury to people or property resulting from any ideas, methods, instructions or products referred to in the content. |
© 2026 by the authors. Licensee MDPI, Basel, Switzerland. This article is an open access article distributed under the terms and conditions of the Creative Commons Attribution (CC BY) license (http://creativecommons.org/licenses/by/4.0/).
Copyright: This open access article is published under a Creative Commons CC BY 4.0 license, which permit the free download, distribution, and reuse, provided that the author and preprint are cited in any reuse.


