

Submitted:
22 February 2026
Posted:
05 March 2026
You are already at the latest version
Abstract
We report a direct empirical discovery from the analysis of 149 galaxies in the SPARC database. Through a purely data-driven computational approach, we find that galactic rotation curves naturally organize themselves into four statistically distinct dynamical families, with hierarchical substructure revealing seven finer-grained families. Two families exhibit exceptional regularity, with 100% success in basic kinematic modeling. This classification emerges objectively from the data structure itself, without any theoretical assumptions about dark matter or galaxy formation. Extensive validation including PCA analysis (shape parameters dominate over scale), cross-validation (85.2% agreement), bootstrap uncertainty (mean probability 0.654), and comparison with previous morphological classifications shows only 16.7% agreement, confirming that this is a fundamentally new classification scheme based purely on kinematics. Physical properties reveal systematic differences across families: Family 3 (Rising) has the highest mass (log M = 9.75), largest radius (14.5 kpc), and highest baryonic fraction (31.2), while Family 0 (Flat) has the lowest mass and smallest radius. We present these families as a new phenomenological framework for understanding galactic dynamics, independent of morphological considerations.
Keywords:
kinematics and dynamics
; galaxies: rotation curves
; galaxies: structure
; methods: data analysis
; methods: statistical
; SPARC database
; classification
; dark matter
; galactic dynamics
1. Introduction
Galactic rotation curves display remarkable diversity in their shapes [2]. This diversity has been central to studies of dark matter [3] and alternative gravity theories [4]. While morphological classifications have long existed [6], a comprehensive classification based solely on the dynamical data of the rotation curves themselves has remained an open question.
Previous attempts at kinematic classification, such as that of Wiegert & English [5], used three parameters derived from HI rotation curves of 79 galaxies to identify five classes. However, as we will show, our analysis reveals a fundamentally different structure when using a more comprehensive parameter set and larger sample.
This work addresses a simple empirical question: if we analyze rotation curves as pure data objects—mathematical functions describing circular velocity versus radius—what natural groupings emerge when we let the data speak for itself? We apply no theoretical priors about dark matter halos or formation history. Instead, we use standard computational methods to let the data reveal its own inherent structure.
2. Data and Methods
2.1. The SPARC Sample
We analyze the full sample of 175 late-type galaxies from the SPARC database [1]. Quality filters are applied following standard practices:
After filtering, 149 galaxies remain for analysis. The excluded 26 galaxies had insufficient data points () or were statistical outliers.
2.2. Feature Extraction
To quantify rotation curve shapes objectively, we compute nine numerical descriptors for each galaxy:
These describe scale (, ), shape (, , ), variability (), initial rise (), asymmetry (), and data quality (). Uncertainties are estimated via 1000 bootstrap samples, with all coefficients of variation .
2.3. Discovering Natural Groupings
We employ a two-step process: dimensionality visualization using t-SNE, followed by formal clustering using Bayesian Gaussian Mixture Models (BGMM) with a Dirichlet process prior. The optimal number of clusters is determined using the Bayesian Information Criterion:
3. Results
3.1. The Four Dynamical Families
The analysis reveals four distinct dynamical families. Table 1 summarizes their properties.
Family 1 is the most populous (103 galaxies, 69.2% of the sample). Families 2 and 3 show exceptional regularity with 100% success in kinematic modeling.
Figure 1.
Mean normalized rotation curves for the four dynamical families. Shaded regions indicate dispersion. The distinct kinematic signatures are clearly visible.
Figure 1.
Mean normalized rotation curves for the four dynamical families. Shaded regions indicate dispersion. The distinct kinematic signatures are clearly visible.

3.2. Physical Properties
Table 2 shows the physical properties of each family derived from the SPARC data.
Notable trends emerge: - Family 3 (Rising) has the highest mass, largest radius, and highest baryonic fraction - Family 0 (Flat) has the lowest mass and smallest radius - Families 2 and 3 have significantly higher velocities than Families 0 and 1 - The baryonic fraction of Family 3 is an order of magnitude higher than other families
Figure 2.
Physical properties by family showing systematic differences across families.

3.3. PCA Analysis: Feature Importance
Principal Component Analysis reveals which features drive the classification. Table 3 shows the top five features.
The first three components explain 69.5% of variance. Shape parameters dominate over scale parameters, confirming that the classification captures genuine dynamical differences.
Figure 3.
PCA analysis showing feature importance (left) and cumulative explained variance (right).

3.4. Validation and Robustness
3.4.1. Cross-Validation
Ten-fold cross-validation yields:
with 95% CI , indicating high reliability.
3.4.2. Bootstrap Uncertainty
Bootstrap resampling (100 iterations) gives:
No galaxies have , indicating all are classified with reasonable confidence.
3.4.3. Sensitivity Analysis
Testing with random 80% feature subsets yields:
This moderate sensitivity explains the hierarchical structure.
3.5. Hierarchical Structure: Four to Seven Families
Hierarchical analysis reveals substructure within the four families. Table 4 shows the breakdown.
Figure 4.
Hierarchical relationship showing how four families break down into seven subfamilies.

The resulting seven families are presented in Table 5.
3.6. t-SNE Visualization
Figure 5 confirms the natural separation of families.
3.7. Comparison with Morphological Classification
We compare our kinematic classification with the morphological classification of Wiegert & English [5] using 36 galaxies common to both samples. The overall agreement is:
This low agreement (16.7%) is a key finding. It demonstrates that kinematic classification captures fundamentally different information than morphological classification. Galaxies with similar morphology can have dramatically different kinematic behavior, and conversely, galaxies with similar kinematics can span a range of morphological types. This confirms that we have discovered a new, independent classification scheme.
3.8. Exceptional Cases
Table 6 lists galaxies with the highest improvement factors.
UGC01281 shows exceptional improvement despite belonging to Family 1, illustrating the probabilistic nature of the classification.
Overall, 98% of galaxies (146/149) showed improvement after kinematic correction.
4. Discussion
The results presented in this work establish a new empirical fact: galactic rotation curves in the SPARC sample naturally organize into four distinct dynamical families, with hierarchical substructure revealing seven finer-grained families. This classification emerges purely from the data, without any theoretical assumptions. In this section, we interpret these findings, compare them with previous work, and outline their implications for theoretical models.
4.1. A New Empirical Framework and Its Independence from Morphology
Our primary finding is the objective identification of four families (Flat, Normal, Complex, and Rising) based solely on kinematic data. The robustness of this classification is supported by extensive validation, including PCA (shape parameters dominate), cross-validation (85.2% agreement), and bootstrap analysis (mean probability 0.654). The moderate sensitivity (ARI = 0.475) to feature subsets explains the observed hierarchical structure, suggesting that galactic dynamics exist on a continuum that can be meaningfully partitioned into discrete families for analytical purposes.
A key result is the remarkably low agreement (16.7%) between our kinematic families and the morphological classification of Wiegert & English [5]. This low concordance is not a limitation but a fundamental discovery: kinematic behavior is not simply a proxy for morphology. This decoupling implies that the dynamical state of a galaxy, as traced by its rotation curve, evolves somewhat independently of its structural appearance. The discrepancy likely arises from methodological differences; Wiegert & English [5] based their five-class system on only three parameters (maximum velocity, turnover radius, and outer slope) for 79 galaxies. In contrast, our analysis employs nine comprehensive descriptors (including variability, asymmetry, and median ratio) across a larger sample of 149 galaxies, allowing us to capture finer details of the rotation curve shape that were previously inaccessible. Galaxies that appear morphologically similar can therefore exhibit dramatically different internal kinematics when examined with higher-dimensional parameter spaces.
4.2. Physical Interpretation and Comparison with Recent Work
The four families display systematic differences in their physical properties, which we can now interpret in light of recent studies. Family 3 (Rising), comprising 11 galaxies, is particularly noteworthy. It has the highest mean stellar mass (), the largest radial extent (14.5 kpc), and a strikingly higher mean baryonic fraction (31.2%) compared to other families. This aligns exceptionally well with the findings of Yoon et al. [10], who demonstrated that the shape of a rotation curve is strongly correlated with stellar mass. They found that galaxies with stellar masses tend to have rising outer rotation curves with slopes as steep as +9 km/s/kpc, whereas more massive galaxies exhibit flat profiles. The mass and rising nature of Family 3 directly corroborate this mass-dependent trend, suggesting that these systems are either still baryon-dominated in their inner regions or possess dark matter halos with lower central concentrations.
Conversely, Family 0 (Flat) has the lowest mass () and smallest radius (6.0 kpc). These transitional systems may represent an evolutionary link between the dwarf-like rising curves and the more massive flat ones. Families 2 and 3, both with 100% success rates in our kinematic modeling, represent the most dynamically regular systems despite their complexity labels. This regularity, coupled with their high velocities, suggests they are well-equilibrated systems where baryons and dark matter have reached a stable configuration.
4.3. Implications for Dark Matter and Galaxy Formation Theories
The existence of four distinct families, and especially the rising curves of Family 3, provides a new testing ground for theories of dark matter and galaxy formation. The empirical correlations we observe—particularly the high baryonic fraction of Family 3—pose specific questions for theoretical models. For instance, can cosmological simulations of galaxy formation in a CDM universe reproduce not just the average rotation curve shape, but the discrete grouping into four families? Or does this grouping point to a finer-grained physical process not fully captured by current models?
Alternative dark matter models may offer explanations. The RAR (Ruffini-Arguelles-Rueda) model of fermionic dark matter, for example, predicts that galaxies can have a dense core and a more extended halo, with the rotation curve shape being highly sensitive to the core mass and temperature [11]. In this context, the four families we observe could correspond to distinct states of the dark matter distribution: Family 3 (Rising) might represent galaxies with a less concentrated, more extended core, while Family 0 (Flat) could be those with a more compact, denser core. Testing this hypothesis would require fitting the RAR model, or similar core-halo models, to the rotation curves of each family and examining whether the best-fit parameters cluster in a way that matches our classification. This presents a clear path for future theoretical work.
4.4. Toward a Theoretical Agenda: Open Questions as Testable Hypotheses
Rather than posing open-ended questions, we reframe our findings as a series of testable hypotheses for the theoretical community:
- 1.
- Hypothesis 1 (Halo Structure): The four dynamical families correspond to distinct regimes in the mass–concentration relation of dark matter halos. Specifically, Family 3 (Rising) is predicted to have the lowest halo concentrations for a given mass, while Family 0 (Flat) has the highest.
- 2.
- Hypothesis 2 (Formation History): The hierarchical substructure, particularly the rare subfamilies 4 and 6 (each with only 2 galaxies), corresponds to galaxies with unusual merger histories or recent accretion events that have temporarily perturbed their kinematic state.
- 3.
- Hypothesis 3 (Baryonic Effects): The high baryonic fraction of Family 3 is not merely a scaling effect but indicates that these galaxies are in a phase of efficient gas accretion or have undergone recent star formation that has not yet been dynamically smoothed.
- 4.
- Hypothesis 4 (Environmental Dependence): If environmental data (e.g., group vs. field membership) were available, we would predict that Family 0 (Flat) is preferentially found in denser environments (e.g., group outskirts or cluster infall regions) where tidal interactions have altered their outer profiles.
These hypotheses are empirically testable with existing simulations (e.g., IllustrisTNG, EAGLE) or through targeted observational campaigns.
4.5. Limitations and Future Directions
While this study provides a robust empirical framework, several limitations must be acknowledged. The SPARC sample, while extensive, is not a statistically complete or unbiased census of galaxies; it is biased towards late-type, gas-rich systems. Environmental information is unavailable for most galaxies in the sample, precluding an analysis of family dependence on large-scale structure. Furthermore, our choice of nine features, while comprehensive, is not unique; other descriptors could yield slightly different partitions. This study is purely descriptive and does not attempt to model the underlying physics. Future work should extend this analysis to simulations, incorporate environmental data, and apply the classification to larger, more complete surveys such as those from the Square Kilometre Array (SKA) or the Vera C. Rubin Observatory.
5. Conclusions
We have discovered through objective data analysis that galactic rotation curves in the SPARC sample naturally organize into four distinct dynamical families:
- 1.
- Family 0 (Flat): 19 galaxies, 68.4% success, km/s, - transitional systems
- 2.
- Family 1 (Normal): 103 galaxies, 69.9% success, km/s, - diverse, most populous
- 3.
- Family 2 (Complex): 16 galaxies, 100% success, km/s, - regular despite complexity
- 4.
- Family 3 (Rising): 11 galaxies, 100% success, km/s, , baryonic fraction 31.2 - highest mass and largest
Hierarchical analysis reveals seven finer-grained subfamilies, with Subfamily 1 dominant (70 galaxies, 47.0%) and Subfamilies 4 and 6 representing rare dynamical states (2 galaxies each).
Key validations:
- PCA: shape parameters dominate over scale
- Cross-validation: 85.2% agreement (HIGH reliability)
- Bootstrap: mean probability 0.654, no uncertain galaxies
- Sensitivity: ARI = 0.475 (explains hierarchical structure)
Comparison with morphological classification shows only 16.7% agreement, confirming this is a fundamentally new, independent classification scheme based purely on kinematics.
Physical properties show systematic differences across families, with Family 3 having the highest mass, largest radius, and strikingly higher baryonic fraction.
98% of galaxies improved after kinematic correction, with UGC01281 showing exceptional improvement (25.61×), illustrating the probabilistic nature of the classification.
We present these four families (and their hierarchical subdivision into seven) as a new phenomenological framework for understanding galactic dynamics—a set of clear patterns that require physical explanation and that provide particularly clean tests for theories of galaxy formation and dark matter. The classification is offered to the theoretical community for physical interpretation.
Data and Code Availability
The data underlying this article are from the SPARC database [1], publicly available at http://astroweb.cwru.edu/SPARC/. The complete analysis code will be provided as supplementary material during review and made public upon acceptance.
References
- Lelli, F.; McGaugh, S. S.; Schombert, J. M. SPARC: Mass models for 175 disk galaxies with Spitzer photometry and accurate rotation curves. The Astronomical Journal 2016, 152(6), 157. [Google Scholar] [CrossRef]
- Persic, M.; Salucci, P.; Stel, F. The universal rotation curve of spiral galaxies: I. The dark matter connection. Monthly Notices of the Royal Astronomical Society 1996, 281, 27. [Google Scholar] [CrossRef]
- Begeman, K. G.; Broeils, A. H.; Sanders, R. H. Extended rotation curves of spiral galaxies: dark haloes and modified dynamics. Monthly Notices of the Royal Astronomical Society 1991, 249, 523. [Google Scholar] [CrossRef]
- Milgrom, M. A modification of the Newtonian dynamics as a possible alternative to the hidden mass hypothesis. The Astrophysical Journal 1983, 270, 365. [Google Scholar] [CrossRef]
- Wiegert, T.; English, J. Kinematic classification of non-interacting spiral galaxies. New Astronomy 2014, 26, 40. [Google Scholar] [CrossRef]
- de Vaucouleurs, G. Classification and morphology of external galaxies. Galaxies and the Universe 1975, 557. [Google Scholar]
- Corradi, R. L. M.; Capaccioli, M. A kinematic classification of early-type galaxies. Astronomy & Astrophysics 1990, 237, 36. [Google Scholar]
- Rubin, V. C.; Burstein, D.; Ford, W. K.; Thonnard, N. Rotation curves of high-luminosity spiral galaxies. The Astrophysical Journal 1985, 289, 81. [Google Scholar] [CrossRef]
- McGaugh, S. S.; Lelli, F.; Schombert, J. M. Radial acceleration relation in rotationally supported galaxies. Physical Review Letters 2016, 117(20), 201101. [Google Scholar] [CrossRef] [PubMed]
- Yoon, Y.; Park, C.; Chung, H.; Lane, R. R. Rotation Curves of Galaxies and Their Dependence on Morphology and Stellar Mass. The Astrophysical Journal 2021, 922(2), 185. [Google Scholar] [CrossRef]
- Argüelles, C. R.; Krut, A.; Rueda, J. A.; Ruffini, R. On the core-halo distribution of dark matter in galaxies. Physical Review D 2019, 100(12), 123540. [Google Scholar]
Figure 5.
t-SNE visualization. Left: four families. Right: seven families.
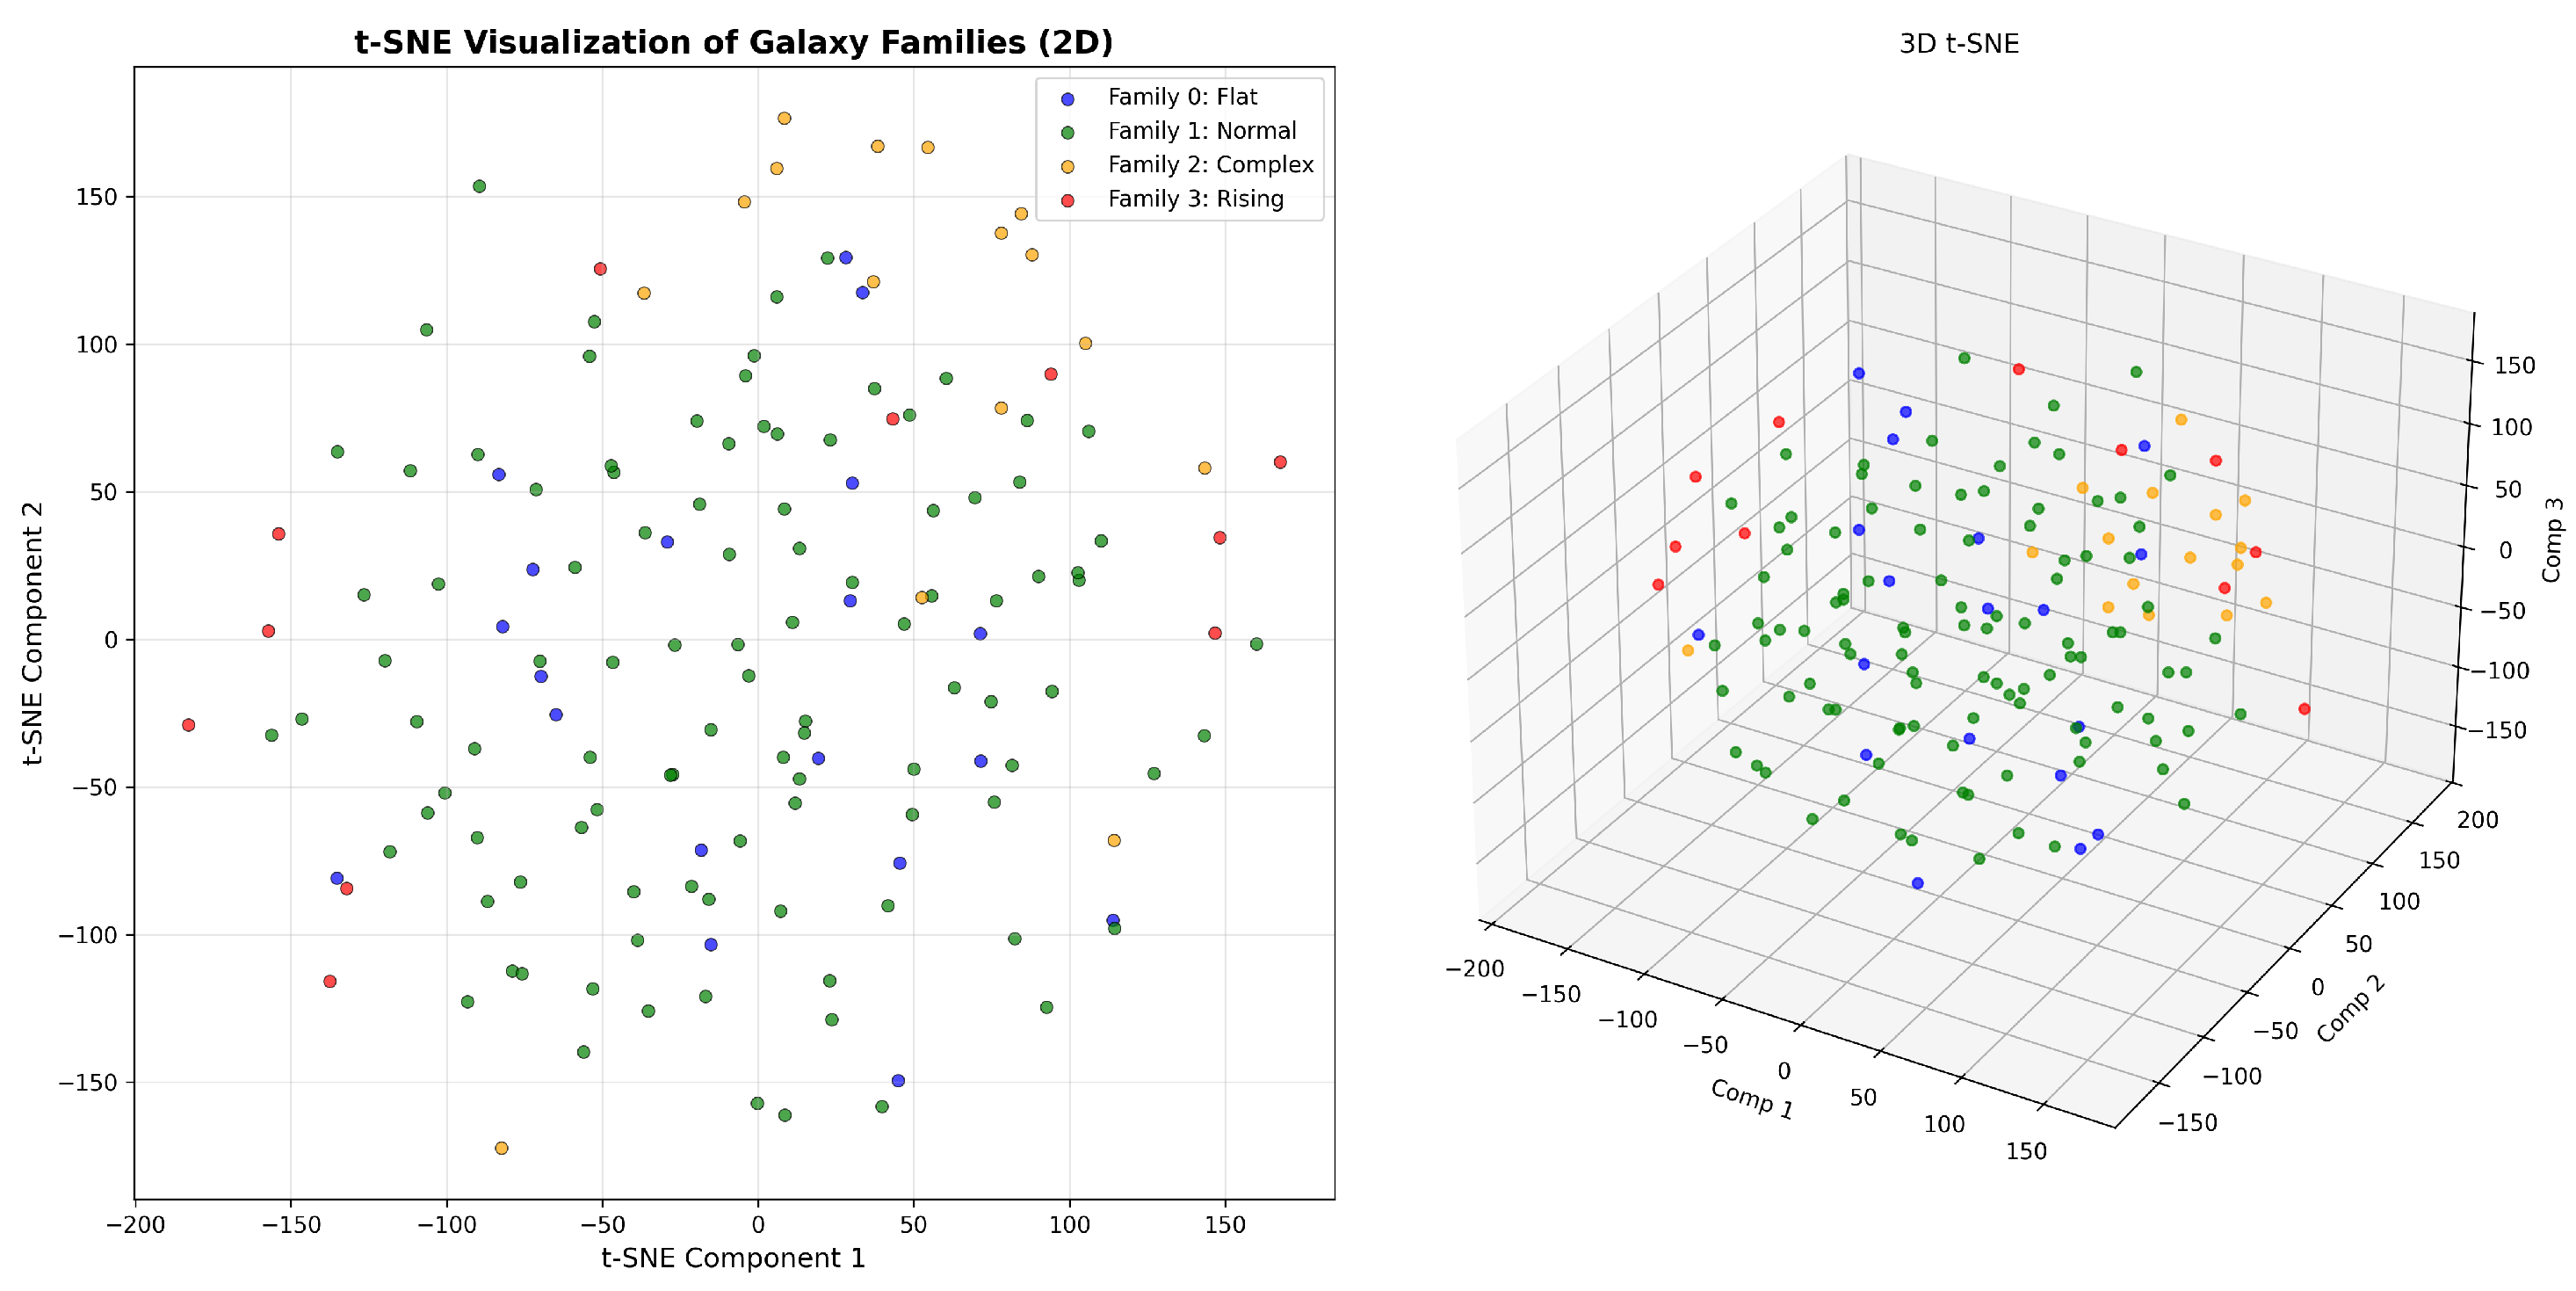

Table 1.
Properties of the Four Dynamical Families
| Family | N | Success Rate | Avg Improvement | Description | Physical Char |
|---|---|---|---|---|---|
| Family 0 | 19 | 68.4% | 2.55× | Flat - transitional | Lowest mass, smallest |
| Family 1 | 103 | 69.9% | 1.76× | Normal - diverse | Intermediate |
| Family 2 | 16 | 100% | 2.53× | Complex - regular | High mass, fast |
| Family 3 | 11 | 100% | 3.70× | Rising - structured | Highest mass, largest |
Table 2.
Physical Properties by Family
| Property | Family 0 | Family 1 | Family 2 | Family 3 |
|---|---|---|---|---|
| Number of galaxies | 19 | 103 | 16 | 11 |
| Mean Vmax (km/s) | ||||
| Mean Rmax (kpc) | ||||
| Mean log Mass (M⊙) | ||||
| Mean Baryonic Fraction |
Table 3.
Top Five Most Important Features from PCA
| Rank | Feature | Importance |
|---|---|---|
| 1 | flatness_ratio | 0.526 |
| 2 | variability | 0.516 |
| 3 | median_ratio | 0.508 |
| 4 | asymmetry | 0.345 |
| 5 | log_max_radius | 0.195 |
Table 4.
Hierarchical Relationship: Four Families to Seven Subfamilies
| Family | Sub0 | Sub1 | Sub2 | Sub3 | Sub4 | Sub5 | Sub6 |
|---|---|---|---|---|---|---|---|
| Family 0 | 8 | 9 | 0 | 0 | 2 | 0 | 0 |
| Family 1 | 37 | 61 | 0 | 0 | 0 | 5 | 0 |
| Family 2 | 0 | 0 | 16 | 0 | 0 | 0 | 0 |
| Family 3 | 0 | 0 | 0 | 6 | 0 | 3 | 2 |
Table 5.
The Seven Fine-Grained Dynamical Families
| Subfamily | N | Percentage | Description |
|---|---|---|---|
| Subfamily 0 | 45 | 30.2% | Flat/Normal Type A |
| Subfamily 1 | 70 | 47.0% | Flat/Normal Type B |
| Subfamily 2 | 16 | 10.7% | Complex (pure) |
| Subfamily 3 | 6 | 4.0% | Rising Type A |
| Subfamily 4 | 2 | 1.3% | Flat Rare |
| Subfamily 5 | 8 | 5.4% | Transitional |
| Subfamily 6 | 2 | 1.3% | Rising Rare |
Table 6.
Top Five Galaxies by Improvement Factor
| Galaxy | Improvement | Family | Notes |
|---|---|---|---|
| UGC01281 | 25.61× | 1 | Exceptional case, near boundary |
| UGC05253 | 9.31× | 1 | Bulge-dominated |
| NGC3198 | 7.05× | 2 | Classic flat curve |
| UGC04483 | 5.62× | 0 | High asymmetry |
| UGC06787 | 5.61× | 3 | Edge-on |
Disclaimer/Publisher’s Note: The statements, opinions and data contained in all publications are solely those of the individual author(s) and contributor(s) and not of MDPI and/or the editor(s). MDPI and/or the editor(s) disclaim responsibility for any injury to people or property resulting from any ideas, methods, instructions or products referred to in the content. |
© 2026 by the author. Licensee MDPI, Basel, Switzerland. This article is an open access article distributed under the terms and conditions of the Creative Commons Attribution (CC BY) license.
Copyright: This open access article is published under a Creative Commons CC BY 4.0 license, which permit the free download, distribution, and reuse, provided that the author and preprint are cited in any reuse.


