Submitted:
03 March 2026
Posted:
04 March 2026
You are already at the latest version
Abstract
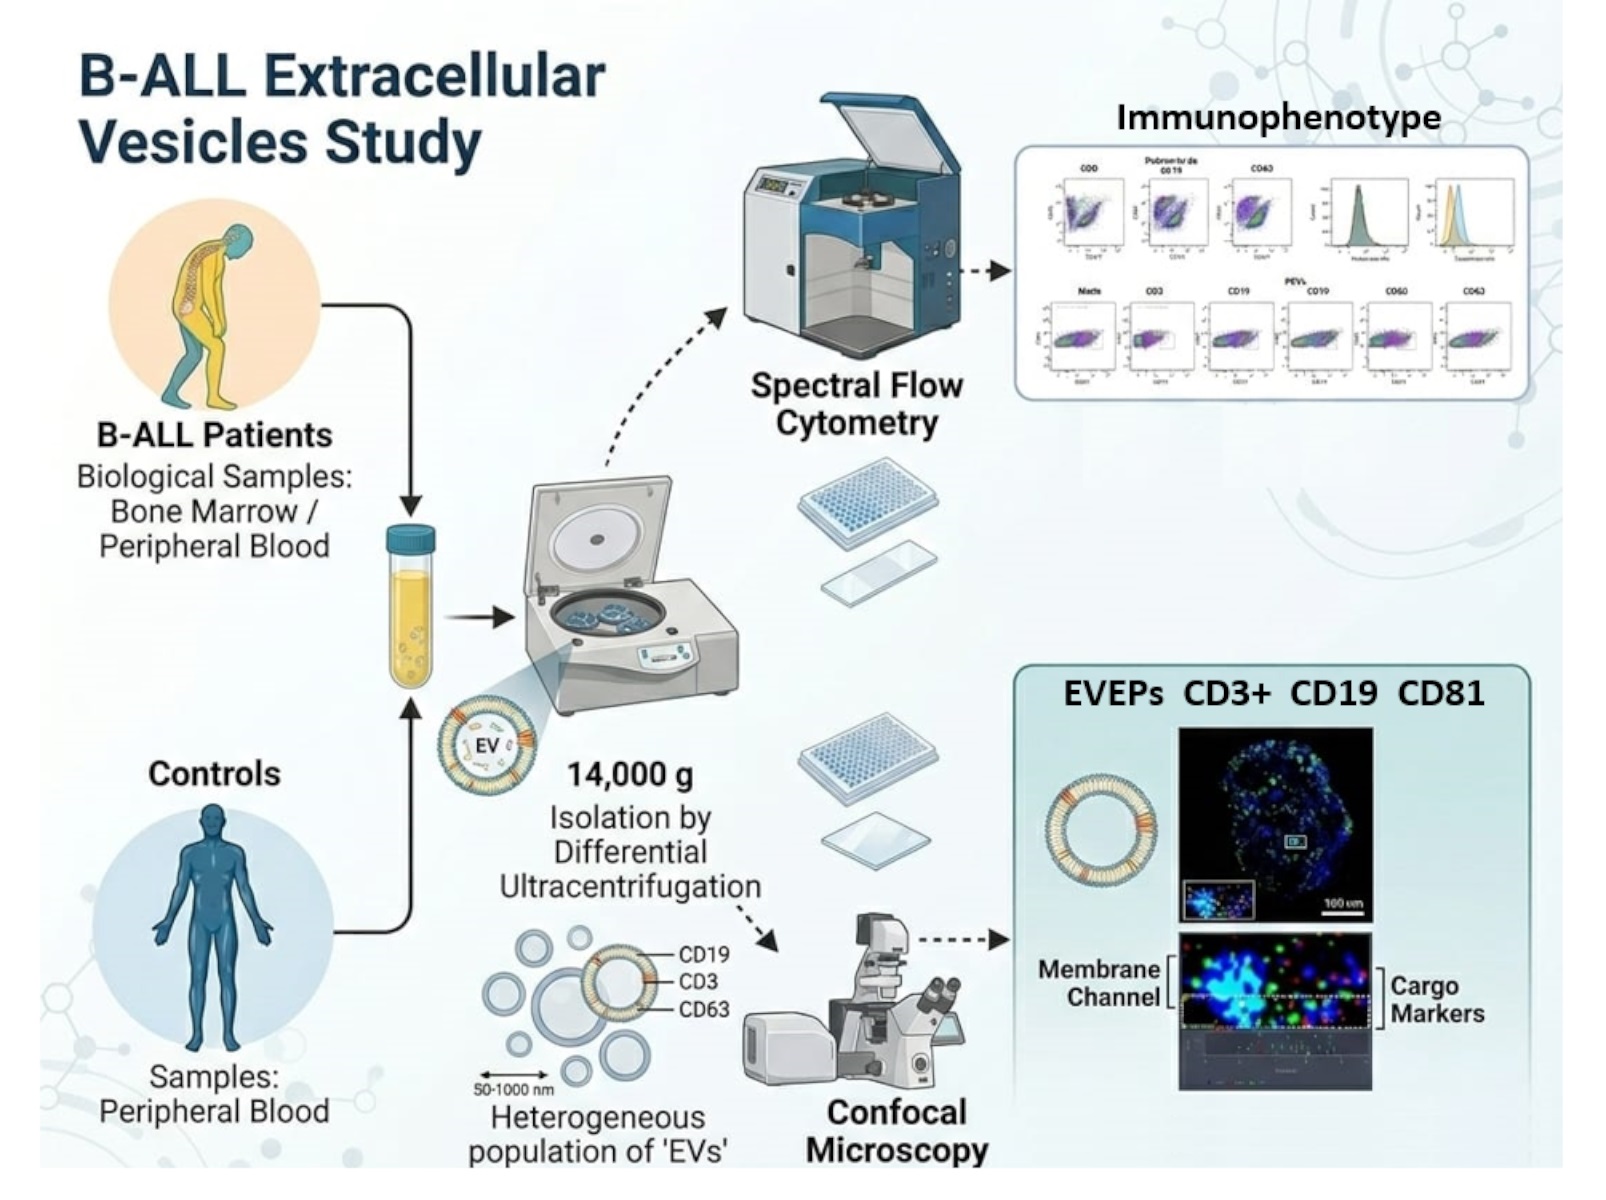
Extracellular vesicles (EVs) are lipid bilayer–bound structures capable of transporting molecular markers from their cell of origin and are secreted by multiple cell types, including malignant cells. EVs have emerged as promising tools for developing less invasive diagnostic approaches. In B-cell acute lymphoblastic leukemia (B-ALL), immunophenotypic characterization of extracellular vesicle–enriched populations (EVEPs) in peripheral blood (PB) may provide complementary information for disease detection and monitoring.
This exploratory study aimed to characterize EVEPs obtained from peripheral blood (PB) and bone marrow (BM) of adult patients with B-ALL and to compare them with the clinical immunophenotype (CIP). EVEPs were isolated by differential centrifugation and analyzed by flow cytometry and confocal microscopy, primarily evaluating CD3 and CD19 expression.
EVEPs derived from PB samples of patients with B-ALL showed increased expression of B-lineage markers (CD45, CD34, CD19, CD20, and CD10), consistent with the leukemic phenotype identified in the CIP. Additionally, CD3⁺CD19⁺ EVEPs were occasionally detected. These findings suggest that EVEPs partially reflect the leukemic immunophenotype and may serve as a complementary source of biological information. The detection of CD3⁺CD19⁺ events highlights complex cellular interactions within the leukemic niche and warrants further investigation.
Keywords:
extracellular vesicles (EVs)
; CD3+ CD19+
; B-cell acute lymphoblastic leukemia
1. Introduction
Extracellular vesicles (EVs) are nanometric structures delimited by a lipid bilayer that play a crucial role in intercellular communication by transporting biomolecules such as proteins, nucleic acids, and lipids [1,2,3]. EVs include subpopulations such as exosomes (30–150 nm) and microvesicles (100 nm–1 µm) [4,5,6].
In the context of oncology, it has been observed that various neoplastic cells can release abundant amounts of EVs, which have been associated with tumor progression, immunomodulation, and the formation of metastatic niches [7,8,9]. In the specific case of leukemia, elevated levels of EVs have been documented in peripheral blood (PB), which have been associated with participating in leukemic transformation, promoting cell survival, and altering the bone marrow (BM) microenvironment [10,11,12], as has been suggested in other types of cancer [6,7,13,14,15,16,17,18].
While the diagnosis of acute lymphoblastic leukemia (ALL) is currently based on invasive methods such as BM aspiration, followed by flow cytometry, cytogenetics, and molecular biology techniques [19,20,21,22,23,24,25], translational research has explored the potential of EVs as a source of less invasive biomarkers in PB [3,26,27,28]. Traditional experiments with EVs have focused on the evaluation of small EVs (mainly exosomes) and, secondarily, large EVs (mainly microvesicles) [29,30]. Although there are still some technical complications that do not allow for 100 percent purity in the isolation process by EVs populations [31,32], their joint study could provide a greater number of markers of interest, including cell surface markers, in addition to showing intervesicular fusion phenomena that could occur in vivo [33,34,35,36]. It might also provide evidence suggesting the presence or absence of abnormal cells, even when these are at levels undetectable by routine strategies.
The cargo that can be contained in EVs secreted by B-ALL or T-ALL cells includes markers specific to these leukemias, which has suggested the use of these EVs for the diagnosis and monitoring of the disease. B-ALL EVs can carry markers such as CD19, CD20, and CD10 [37,38], while T-ALL EVs can carry markers such as CD3 [39,40].
The existence of a rare lymphocyte subpopulation has recently been described. This population is characterized by the co-expression of T-lineage (CD3) and B-lineage (CD19) markers and represents approximately 0.16% of total lymphocytes in healthy donors, and which was significantly more highly expressed in patients with various solid neoplasms (approximately 0.58%) [34], a cell subpopulation that has also been identified in murine models [37,38]. It has been established that EVs contain membrane proteins from their cell of origin [39,40], suggesting two non-mutually exclusive mechanisms for the generation of double-positive CD3⁺CD19⁺ EVs: (1) direct secretion by leukemic lymphoblasts exhibiting an aberrant dual immunophenotype, a well-characterized phenomenon in leukemias of ambiguous lineage [41] and reported in solid cancers as well as in healthy murine and human models [34,38], or (2) post-secretion fusions between CD19⁺ microvesicles derived from B lymphoblasts and CD3⁺ microvesicles derived from T lymphocytes, a mechanism facilitated by the high vesicular concentration and favorable conditions of the leukemic microenvironment [15,32,35,42].
The detection of these EVs could in itself offer a molecular reflection of cellular dynamics that could be considered aberrant, as has been observed with some other oncogenic receptors [43], providing a unique window to investigate biological processes underlying ALL through liquid biopsy [13,29,44].
Considering the current recommendations in MISEV2023 [30,33], it is important to note that, in the present work, the fractions obtained by differential centrifugation are defined as extracellular vesicle-enriched populations (EVEPs). This is stated to emphasize that the samples analyzed were processed with the purpose of obtaining a heterogeneous set enriched in extracellular vesicles of different origin and size. The objective of this study is twofold: to contribute to the immunophenotypic characterization of extracellular vesicles in ‘EVEPs samples’ for the diagnosis of ALL, and to describe the presence of double-positive CD3⁺CD19⁺ EVs.
2. Materials and Methods
2.1. Patient and Control Samples
A descriptive study was conducted that included adult patients (≥18 years) with a confirmed diagnosis of B-ALL, established according to the criteria of the World Health Organization [19,25,45]. A total of eight patients were included, while the control group consisted of three healthy volunteer donors matched for age and sex. One patient was excluded due to a diagnosis of T-ALL. The study was approved by the ethics, biosafety, and research committees of the ‘Hospital Regional de Alta Especialidad Ixtapaluca’ (protocol NR-053-2024), and all participants signed written informed consent prior to inclusion.
For the clinical immunophenotype diagnosis of patients with B-ALL (n = 8), four had a clinical diagnosis established from bone marrow (BM) samples and the remaining four from peripheral blood (PB). In patients diagnosed through BM, plasma was obtained as part of the procedure, and an additional 5 mL sample of PB was collected in EDTA tubes. Based on this design, four samples of extracellular vesicle-enriched populations (EVEPs) from BM and eight EVEPs from PB were analyzed. In the case of healthy controls, a venous PB sample was obtained in EDTA tubes. Plasma was obtained from all samples; a fraction was processed immediately for flow cytometry analysis, while the rest was stored at −80 °C until later use in confocal microscopy studies.
2.2. Isolation of EVEPs
To obtain the enriched mixture of large and small EVs, which we refer to as EVEPs, these were obtained using a differential centrifugation protocol, introducing modifications to previously described methodologies [31,46]. Briefly, the plasma was initially centrifuged at 400 × g for 10 min to remove intact cells, followed by a second centrifugation of the supernatant at 1,500 × g for 10 min to remove larger cell debris and remnants. Finally, the resulting supernatant was centrifuged at 14,000 × g for 15 min at 4 °C, obtaining a pellet corresponding to EVEPs. The pellet was resuspended in pre-filtered 1X PBS and used for subsequent analyses. Given the method used, the events analyzed are consistently described as EVEPs.
2.3. Immunophenotype of EVEPs
The immunophenotypic characterization of EVEPs was performed using the Cyteck Northern Lights-VBR cytometer from Cytek Biosciences, Inc. SpectroFlo software, version 3.3.0, was used for acquisition (12282023). EVEPs were identified using a panel of antibodies that included CD63-PE (Sony Part: 2365020, Lot: 215779, clone: H5C6), CD9-PerCP-Cy5.5 (BioLegend Cat: 312110, Lot: B393332, clone H19a), and CD81-Alexa Fluor 700 (BioLegend Cat: 349518, Lot: B401697, clone 5A6). In parallel, a multicolor panel (cocktail) was used to characterize the clinical leukemic immunophenotype, including antibodies directed against CD45, CD34, CD19, CD10, CD5, CD38, CD20, CD138, CD8, CD4, CD3, CD7, CD14, CD117, and CD27. All of these were conjugated with fluorochromes compatible with spectral cytometry (BioLegend Cat: 900009158, Lot: B425396).
Prior to use, all antibodies were centrifuged at 14,000 × g for 15 min to remove any aggregates that could interfere with the analysis of submicrometric particles. The samples were then incubated with the corresponding antibodies for 20 minutes at room temperature, protected from light. After incubation, they were washed with 1 mL of pre-filtered (0.22 μm) 1X PBS, followed by centrifugation at 14,000 × g for 15 minutes at 4 °C. Data were acquired using standardized instrument parameters: FSC = 10, SSC = 10, SSC-B = 115, threshold = 50,000, and signal amplification factor (ASF) = 1. Subsequent data analysis was performed using Kaluza software (version 3.2).
Lysed EVEPs were controlled using detergent (detergent disruption control). EVEPs samples were treated with 1% Tween 20 for 30 min at 4 °C to destabilize the lipid membranes. The samples were then processed in the same way as the rest of the assays, including incubation with antibodies, washing, and data acquisition under the same instrumental conditions. Unstained samples were also used to establish the negative regions in the histograms. A control consisting of unfiltered 1X PBS to which antibodies were added without prior centrifugation was also included. All assays were performed in triplicate.
2.4. Confocal Microscopy of EVEPs
For confocal microscopy studies, the samples were thawed at room temperature, continuously, and the EVEPs pellet was fixed with 3% paraformaldehyde for one hour. After this time, the samples were washed with 1 mL of PBS by centrifugation at 12,000 × g for 10 min. The vesicles were blocked with 10% fetal bovine serum for one hour, after which additional washes were performed with 1X PBS. Labeling was performed using CD63-FITC antibodies (BioLegend Cat: 353006, Lot: B262101), CD19-PerCP-Vio700 (Milteny Biotec Cat: 130-113-171, clone: LT19) and CD3-PE (Milteny Biotec Cat: 130-113-131, clone: BW264/56) antibodies. The samples were incubated for 24 hours, then washed with 1X PBS and centrifuged three times at 10,000 × g for 15 min. Once the washing was complete, the supernatant was removed, leaving approximately 30 µL of 1X PBS, a 1:1 concentration of Vectashield antifade mounting medium (Vectashield®) was added, and the samples were mounted on untreated coverslips. The samples were analyzed on an Axio Imager Z2 LMS900 confocal microscope (Carl Zeiss) using a 63X objective. The analysis was performed using ZEN software version 3.11, while the morphometric analysis of the vesicles was performed using Fiji version 1.54p with the EVAnalyzer v8.2.3 plugin (threshold: MaxEntropy; circularity: 0.5-0.9; particle size 0.3-0.5 µm, Z-plane projection: max). The colocalization of fluorescent signals was evaluated using the JACoP v2.1.4 plugin.
2.5. Statistical Analysis
Descriptive statistics were performed, calculating the mean, standard deviation, and 95% confidence interval. Subsequently, for the study population size, an inferential analysis was performed using the Kruskal-Wallis test (regardless of whether some variables met normality criteria). The Dunn test was used for post-hoc comparisons of the leukemic immunophenotype. In all cases, a p-value < 0.05 was considered statistically significant. The statistical software used was Sigma Plot 15 Build 15.0.0.13.
Pearson’s correlation coefficient (r) was used to calculate colocalization using Fiji software and the JACoP v2.1.4 plugin. The presence of EVs with CD3+CD19+ labeling was confirmed with the EVAnalyzer plugin.3.
3. Results
3.1. Clinical Information
Healthy controls were used to standardize the technique, from which 5 mL of PB was obtained. In total, samples were collected from 12 individuals, of whom 7 were men and 5 were women, with a mean age of 33.8 years (range: 18–66 years). Of this total, 8 patients were diagnosed with B-cell acute lymphoblastic leukemia (B-ALL), 3 were healthy controls, and 1 patient was diagnosed with T-cell ALL and was therefore excluded from the study. All patients included were diagnosed using flow cytometry, molecular biology, and a comprehensive medical diagnosis. Additionally, two patients with B-ALL had molecular alterations associated with intermediate and high risk, specifically the t(9;22)(q34;q11) BCR::ABL1 translocation, with a minor breakpoint corresponding to the P190 BCR::ABL1 (e1a2) transcript.
3.2. Standardization of EVEPs Analysis by Flow Cytometry
The characterization of extracellular vesicle-enriched populations (EVEPs) was performed by spectral flow cytometry. All assays were performed in triplicate (n = 3) to evaluate the reproducibility of the analytical procedure.
Figure 1A shows the analysis strategy, which initially included a time gate (Time) versus lateral dispersion in height (SSC-H), allowing unstable acquisition periods and instrumental artifacts to be excluded. Subsequently, a compatible region for EVEPs was defined. For this purpose, two instrumental configurations were evaluated, and the one that allowed for better event resolution was finally selected: FSC=10, SSC = 10, SSC-B=115 threshold = 50,000, and signal amplification factor (ASF) = 1. Similarly, positive regions were established for the tetraspanins CD81, CD63, and CD9, with clearly defined positive populations for these markers observed through histogram analysis. Figure 1B shows the unstained samples as a negative reference for the delimitation of positive regions. Furthermore, the region established as the 104 criterion was identified as a positive signal area.
Figure 1C shows signal loss in samples treated with 1% Tween 20 (disruption control) for the tetraspanins evaluated, confirming the viability of the isolation method. Additionally, Figure 1D included a control consisting of unfiltered 1X PBS incubated with antibodies without prior centrifugation, in which a positive signal was detected for CD9 and CD63. These results suggest the methodological importance of not omitting centrifugation before using antibodies.
3.3. Comparison of the Expression of Tetraspanins Associated with Extracellular Vesicles Between Patients with B-ALL and Controls
Once the analysis strategy had been standardized, a comparison was made of the percentage expression of CD9, CD63, and CD81 tetraspanins in EVEPs obtained from patients with B-ALL (BM, white bars; PB, gray bars) and healthy donors (hatched bars), as shown in Figure 2.
Statistical analysis showed no significant differences in the expression of CD81 (H = 3.467, P = 0.196), CD63 (H = 3.289, P = 0.232), or CD9 (H = 5.067, P = 0.086) between the groups evaluated. Despite this, a trend toward lower CD9 expression was observed in BM EVEPs from patients with B-ALL compared to healthy controls. The percentage of CD81 and CD63 expression appears to show a slight tendency to be higher in PB EVEPs from patients with B-ALL compared to the healthy group, without being close to showing a significant difference. The above result suggests that the three markers evaluated do not constitute a differential marker of malignancy by themselves.
3.4. Immunophenotype of EVEPs and Comparison with the Clinical Immunophenotype
Figure 3A shows representative histograms corresponding to EVEPs obtained from PB from a patient with B-ALL and their comparison with a healthy control. These representations show a clear increase in the expression of markers characteristic of the B-cell leukemic lineage, including CD45, CD34, CD38, CD19, CD10, and CD20. Consistently, there was no evidence of overexpression of markers associated with other hematopoietic lineages, such as the T lineage (CD3, CD5, CD7, CD4, CD8, and CD27) or the myeloid lineage (CD14 and CD117), or the plasma cell marker CD138, suggesting a phenotypic specificity of the EVEPs analyzed. The result in Figure 3A suggests that EVEPs can function and be used as a reflection of the tumor cell phenotype, specifically shown in patients with a common B-ALL profile. The ability to detect the CD10+/CD19+/CD34+/CD38+ fingerprint suggests the use of EVEPs as a liquid biopsy from PB and their analysis by flow cytometry.
Figure 3.
A. Immunophenotypic comparison of PB EVEPs. Representative histograms showing the immunophenotype of EVEPs obtained from the peripheral blood of a patient with B-cell acute lymphoblastic leukemia (B-ALL) and their comparison with a healthy control (PB CTRL EVEPs).
Figure 3.
A. Immunophenotypic comparison of PB EVEPs. Representative histograms showing the immunophenotype of EVEPs obtained from the peripheral blood of a patient with B-cell acute lymphoblastic leukemia (B-ALL) and their comparison with a healthy control (PB CTRL EVEPs).

Figure 3B shows a visual representation using a bubble chart of the average expression values of the markers included in the analyzed cocktail, comparing four study groups: clinical immunophenotype (CIP, n = 8), bone marrow EVEPs from patients with B-ALL (BM ALL EVEPs, n = 4), peripheral blood EVEPs from patients with B-ALL (PB ALL EVEPs, n = 8), and healthy controls (CTRL, n = 3). The CIP group consists of clinical results from four BM samples and four PB samples. The size of the bubble and the number inside it represent the average percentage of expression. Visually, the B lineage and progenitor markers CD34, CD38, CD19, and CD10 show very high expression in both tumor cells (CIP), followed by patient EVEPs (BM ALL and PB ALL), suggesting that EVEPs reflect or inherit the protein signature of the cancer cells from which they originate. In ALL EVEPs, a notable increase in CD5 expression (~42–45%) was observed compared with the control group (1.7%). Statistical analysis was performed using the Kruskal–Wallis test followed by Dunn’s post hoc test. The most robust finding was a statistically significant difference in CD38 expression: the CIP group showed higher levels compared with the control group (p = 0.011), and the EVEPs group also exhibited higher levels compared with the control group (p = 0.0001), including the PB ALL EVEPs subgroup (p = 0.012). The remaining CD markers showed no statistically significant differences between groups. CD45 was the marker most abundantly detected in healthy controls (~15%), which is expected due to its basal expression in EVs as part of immune homeostasis. Its levels increased in EVEPs from PB ALL and BM ALL patients, with mean values of approximately 24% and 28%, respectively.
Figure 3.
B. Comparative analysis of the expression profile of the marker cocktail in EVEPs. Bubble chart showing the average percentage of expression of CD markers in CIP (n = 8), PB ALL EVEPs (n=8), BM ALL EVEPs (n = 4), and CTRL (n = 3). Fifteen markers were analyzed: CD45, CD34, CD19, CD10, CD20, CD3, CD38, CD5, CD14, CD8, CD4, CD7, CD27, CD117, and CD138. The bubble size and distribution allow differences to be observed between samples from patients with ALL and CIP vs. the control, including CD38, CD10, CD34, CD19, CD20, and CD5. Kruskal-Wallis analysis followed by Dunn’s post-hoc test showed a statistically significant difference in CD38 expression, with the CIP group showing higher levels than the control (p = 0.011) and the EVEPs PB ALL group (p = 0.012). In the comparison of all groups, the other markers did not show significant differences using this strategy.

Given the above results, we proceeded to analyze the statistics of the groups in Figure 3C, obtaining the lower and upper 95% CI of mean, which showed the absence of overlap in the range of values between several groups of interest, such as CD19 and CD10 between the healthy PB control and the EVEPs of PB B-ALL. The absence of overlap between the ranges of the lower and upper 95% CI of mean of two groups indicates or suggests the existence of a statistically significant difference between them. The statistical findings are consistent with the observed graphical trends.
Figure 3.
C. Quantitative analysis of markers associated with B-ALL in EVEPs Bar charts representing the average expression percentage with the standard error of selected markers associated with B-cell acute lymphoblastic leukemia in the different groups analyzed. The lower and upper 95% CI of mean were calculated. This representation was used to visualize the precision of the estimated mean and explore biological trends between groups based on ’n’.

3.5. Identification of CD3⁺ CD19⁺ CD63⁺ Aggregates Using Confocal Microscopy
Finally, confocal microscopy was used to evaluate EVEPs from PB of patients in three samples with B-ALL. The samples were labeled with anti-CD63-FITC, anti-CD3-PE, and anti-CD19-PerCP-Vio700 antibodies. After performing the procedure to obtain EVEPs using centrifugation, structures compatible with large multivesicular aggregates were identified, with approximate diameters between 2 and 21 μm, which showed a positive signal for CD3, CD19, and CD63. Figure 4 shows one of these EVEPs aggregates, where colocalization sites of the markers were even occasionally observed, so a quantitative analysis of the colocalization was performed, obtaining a Pearson correlation coefficient of 0.69 between the CD3 and CD19 signals, compatible with a partial colocalization of both markers within the same structure (see Figure 4). In parallel, the circularity of the EVEPs was confirmed using the ImageJ2 software EVAnalyzer plugin. Complementarily, morphometric analysis was performed using EVAnalyzer plugin, applying strict segmentation criteria. A circularity index ≥ 0.9 and a minimum intensity threshold of 20 were established to ensure objective selection of structures compatible with EVEPs and reduce the inclusion of artifacts. These parameters allowed confirmation of the vesicular morphology of the analyzed structures.
4. Discussion
In recent years, extracellular vesicles (EVs) have gained increasing interest as a window into exploring biological processes associated with oncohematological diseases. In the context of leukemias, it has been reported that some malignant cells release EVs capable of transporting proteins, lipids, and nucleic acids, suggesting a possible reflection of both the tumor state and its interaction with the bone marrow and immune microenvironment [9,29,47,48,49]. However, the analysis of EVs in complex tissues such as peripheral blood (PB) remains technically and conceptually challenging due to the coexistence of non-vesicular particles with similar physical-optical properties and the biological heterogeneity inherent to leukemia, which particularly complicates its study in acute lymphoblastic leukemia (ALL) [39,50].
The present study was descriptive and exploratory in nature, aimed at characterizing the immunophenotype of extracellular vesicle-enriched populations (EVEPs) obtained from bone marrow (BM) and PB of adult patients with B-ALL. To this end, spectral flow cytometry and confocal microscopy were used as complementary approaches. From its design, this work focused on documenting expression patterns, apparent discrepancies between compartments, and poorly described events that would provide information on the complexity of the vesicular secretome in this context, so that they could be considered in the development of strategies for analyzing clinical associations, prognostic inferences, or diagnostic applications.
A key limitation of the study is the small and heterogeneous size of the cohort (n = 3–8 per group), which limits the statistical power to detect significant differences using robust multiple comparison tests. This restriction means that the results must be interpreted primarily as consistent biological trends rather than conclusive differences. Additionally, the cross-sectional design prevents the evaluation of dynamic changes associated with disease progression or treatment. These limitations are consistent with other initial exploratory studies in ALL that have addressed the analysis of EVs as a starting point for further research [26,29,49,51]. However, analysis with 95% confidence intervals (95% CI) revealed groups with a clear separation from the control, suggesting an underlying biological effect that warrants validation in future research, including the dynamics of the expression of markers such as CD3 and CD19 in EVs from ALL patients during disease progression and in response to treatment, with the findings presented here providing a solid exploratory basis.
From a methodological point of view, removing unwanted contaminants at 1,500 × g and subsequently isolating EVs by differential centrifugation up to 14,000 × g allowed us to obtain the EV-enriched fraction, predominantly in larger vesicles (sample obtained in accordance with the purposes of this study), commonly associated with microvesicles, in line with previously reported strategies [31]. This aspect is relevant, since larger EVs tend to have a higher total protein load and, consequently, a higher density of surface antigens, which may favor their detection by flow cytometry. Additionally, the fact that this approach does not require ultracentrifuges or highly specialized equipment represents a key operational advantage that enhances its implementation and reproducibility in conventional clinical settings.
The purpose of this study was to detect ALL-associated markers in the EVEPs samples obtained, which was achieved. However, it is important to bear in mind that, according to the recommendations of MISEV2023 [33] and MIBlood-EV [13], this type of isolation does not allow for the complete exclusion of co-isolation of non-vesicular particles, particularly lipoproteins such as LDL (18-25 nm) and VLDL (30-80 nm), which share size ranges and physical-optical properties mainly with the smallest EVs [52]. In PB, the abundance of lipoproteins may be influenced by the patient’s metabolic and inflammatory status, so it is suggested that this should be considered taken into account in studies where it could have a drastic influence, such as in studies focused on the smallest EVs [53,54]. For this reason, together with the variety of EVs obtained, the term EVEPs is deliberately used throughout the study, referring to a set of large and small EVs, avoiding the assumption that all detected events correspond exclusively to extracellular vesicles.
To technically validate the spectral flow cytometry detection analysis, specificity controls were added, including tetraspanins (CD9, CD63, and CD81), unstained samples, controls with 1% Tween, and PBS with antibodies without prior centrifugation. These controls support the membranous nature of the events analyzed, reducing limitations in complex biological matrices, thereby seeking rigor and consistency with established guidelines[55]. It is important to note that, although we did not find a sufficient statistical difference, our results are consistent with those presented by Li et al. 2022 [56].
In the global analysis of markers, CD38 showed very high expression in patient ALL samples, sufficient to show a statistically significant difference after nonparametric analysis of the heterogeneous cohort groups (n between 3 and 8 per group). This behavior is consistent with the role of CD38 as a widely described activation marker in B-ALL [57,58,59]. In contrast, when viewing the graphs of classic B-lineage markers (CD19, CD10, and CD20), these appear to show relative attenuation in the peripheral EV compartment when compared to the cellular immunophenotype. This phenomenon could be interpreted as a “dilution” of the B lineage in circulating EVs, suggesting that liquid biopsy strategies based exclusively on these markers may require correlation or normalization factors to avoid underestimating tumor burden. However, it is essential to emphasize that direct comparison between cellular and vesicular histograms has intrinsic limitations. Even so, when comparing EVs from patients with B-ALL versus healthy donors, a clear trend toward higher expression of B markers was observed in the leukemic context, indicating that the vesicular compartment retains relevant biological information and is consistent with other studies [26,56,60].
In the samples we analyzed using immunostaining, we found EVs with the presence of markers typically associated with the T lineage (CD3, CD5, CD7, and CD4) in EVEPs from patients with B-ALL. The literature documents a constitutive basal secretion that is ‘‘low constitutive basal secretion of small T-cell EVs’’ in healthy donors [61,62,63], which would explain the presence of these EVs in the total EVEPs of patients. It is important to note that the bloodstream contains EVs of all cell types that secrete them, including those with the B-ALL signature. Furthermore, the finding of EVs of different origins can be explained by several non-mutually exclusive mechanisms: aggregation of EVs of different origins, interaction between tumor EVs and EVs derived from activated immune cells, or release of EVs by non-neoplastic populations secreted constitutively or by stimulation in the leukemic microenvironment.
Additionally, confocal microscopy revealed the presence of large (2–21 μm) CD3⁺ CD19⁺ CD63⁺ multivesicular aggregates, in which some EVs co-expressed the CD3⁺ CD19 markers, as verified by ImageJ2 software colocalization analysis and confirmation of the presence of some EVs with colocalization using the EVAnalyzer plugin, suggesting that a fraction of the detected events correspond to aggregated structures rather than individual vesicles and, notably, to a lesser frequency of EVs that did possess colocalization. This finding is relevant when considering the possible involvement of lipoproteins and apolipoproteins in vesicular aggregation. Previous studies have documented an increase in apolipoproteins in patients with B-ALL, as well as their ability to interact with lipid membranes and extracellular particles [40,53,64,65,66]. In this regard, it is plausible that circulating apolipoproteins contribute to the recruitment and aggregation of EVs from different lineages, promoting the formation of vesicular complexes capable of transporting biological signals that may appear discordant. In this context, evidence of CD3⁺CD19⁺ cell populations in humans is particularly relevant [34], where a subpopulation of CD3⁺CD19⁺ lymphocytes was described, present in both healthy donors and cancer patients, with a significantly higher frequency in the latter. Although this study focuses on cells and not on EVs, it demonstrates that the coexpression of B and T markers is a real biological phenomenon and not a technical artifact, reinforcing the biological plausibility of detecting similar hybrid signatures in the vesicular compartment and EVs.
The specificity of the resulting immunophenotype (CD3⁺CD19⁺) could suggest a degree of selectivity, opening the door to research into its biological role in ALL. It is known that EVs can carry complete functional protein complexes, including those involving membrane receptors [48,67]. It is plausible that EVs derived from B lymphoblasts (CD19⁺) express immunoregulatory ligands (such as MHC class II molecules), which could be recognized by components of the TCR/CD3 complex present in EVs derived from CD4⁺ T lymphocytes [39]. This specific interaction would create a targeted molecular bridge, mimicking the initial events of immune synapse formation on a nanometric scale. Although this possibility requires direct validation, it would establish these aggregates as biologically significant entities that reflect cross-lineage communication in the leukemic niche.
It has been suggested that a portion of the double-positive CD3⁺CD19⁺ EVs may be directly secreted by the rare cells that are also double-positive, adding to those vesicles that could originate through post-secretion aggregation mechanisms and possible fusion between EVs[67,68]. Research into fusion between EVs and EV-EV relationships can currently be considered emerging. In mixed lineage ALL, the presence of double-positive cell populations with concomitant expression of CD3 and CD19 has been documented. circulating apolipoproteins contributes similarly, Liu et al. 2020 described the existence of B-T cells (CD19⁺CD3⁺) in the peripheral blood of healthy individuals and cancer patients. Although present in both groups, their frequency was significantly higher in cancer patients compared to healthy donors [34]. Others researchers have been reporter CD3+CD19 cells [69]. Although this hypothesis remains speculative, it offers a conceptual framework for interpreting the observation of multivesicular aggregates and mixed immunophenotypic profiles in the context of leukemia.
It is important to note the limitations inherent in the confocal microscopy used in this study, whose lateral resolution is limited to approximately 180 nm. This restriction prevented the direct visualization of smaller individual vesicles, so the analyses were restricted to larger-scale structures.
Finally, the asymmetry in the composition of the cohort (four samples with a CIP of BM and four of PB) constitutes an additional limitation that could influence the interpretation of comparisons between compartments. However, all samples were included as reference points because the clinical immunophenotype represents the diagnostic standard in hematological practice, reflecting a real clinical scenario.
5. Conclusions
This exploratory study presents EVEPs as potential diagnostic tools for adult B-ALL, representing a viable liquid biopsy option, as the results suggest that they may reflect leukemia in peripheral blood. This can be supported by comparison with the clinical immunophenotype (CIP) that was obtained. On the other hand, the occasional identification of CD3+CD19+ vesicles could suggest the existence of complex dynamics that could favor the leukemic niche, which should be studied in future studies.
Author Contributions
Conceptualization, Supervision, Methodology and Project Administration: S.-M.M. and S.-L.F.; Data Curation, Formal Analysis, and Writing – Original Draft Preparation: M.-A.C.-Z. and S.-L.F.; Funding Acquisition: S.-M.M.; Investigation and Visualization: M.-A.C.-Z.; Resources: A.-A.G.; Software: M.-R.C.E.; Validation and Writing – Review and Editing: S.-M.M., S.-L.F., M.-R.C.E. and H.-R.M. All authors have read and agreed to the published version of the manuscript.
Funding
This research was supported by a grant from Secretaría de Ciencia, Humanidades, Tecnología e Innovación (SECIHTI) for the master’s thesis work of M.A.C.-Z. at the Escuela Superior de Medicina (ESM) of the Instituto Politécnico Nacional, who was a scholarship recipient, and by the Hospital Regional de Alta Especialidad de Ixtapaluca, Health Services of the Mexican Social Security Institute (IMSS-BIENESTAR).
Institutional Review Board Statement
The study was conducted in accordance with the Declaration of Helsinki and was approved by the Research Ethics, Investigation and Biosecurity Committee of the Hospital Regional de Alta Especialidad de Ixtapaluca (protocol code: NR-053-2024 and date of approval: 26 February 2025).
Informed Consent Statement
Informed consent was obtained from all patients and control subjects involved in the study.
Acknowledgments
We thank the Molecular Pathogenesis Laboratory for providing the microscope for image acquisition, and Diana Karina Camarillo for her assistance with sample collection. We also thank the Hospital Regional de Alta Especialidad for providing the reagents used in this study. We extend our special gratitude to Fundacion Comparte Vida A.C. for donating the reagents that made these experiments possible, and especially to Dr. Clara Gorodezky for her generous guidance, wisdom, and lasting contributions. Her legacy continues to inspire our work.
Conflicts of Interest
The authors declare no conflicts of interest.
Abbreviations
The following abbreviations are used in this manuscript:
| ALL | Acute lymphoblastic leukemia |
| ASF | Signal amplification factor |
| B-ALL | B-lineage acute lymphoblastic leukemia |
| BM | Bone marrow |
| BCR-ABL1 | Breakpoint cluster region–Abelson murine leukemia 1 |
| BSA | Bovine serum albumin |
| CD | Cluster of differentiation |
| CIP | Clinical immunophenotype |
| EVEPs | Extracellular vesicle–enriched populations |
| EVs | Extracellular vesicles |
| FSC | Forward scatter |
| LDL | Low-density lipoprotein |
| MHC | Major histocompatibility complex |
| MISEV | Minimal Information for Studies of Extracellular Vesicles |
| PB | Peripheral blood |
| SSC | Side scatter |
| SSC-H | Side scatter height |
| TCR | T-cell receptor |
| VLDL | Very low-density lipoprotein |
References
- Sedgwick, A. E.; D’Souza-Schorey, C. The Biology of Extracellular Microvesicles. Traffic 2018, 19, 319–327. [Google Scholar] [CrossRef]
- Nguyen, P. H. D.; Le, A. H.; Pek, J. S. Q.; Pham, T. T.; Jayasinghe, M. K.; Do, D. V.; Phung, C. D.; Le, M. T. N. Extracellular Vesicles and Lipoproteins - Smart Messengers of Blood Cells in the Circulation. Journal of extracellular biology 2022, 1, e49. [Google Scholar] [CrossRef]
- Doyle, L. M.; Wang, M. Z. Overview of Extracellular Vesicles, Their Origin, Composition, Purpose, and Methods for Exosome Isolation and Analysis. Cells 2019, 8. [Google Scholar] [CrossRef] [PubMed]
- Meldolesi, J. Exosomes and Ectosomes in Intercellular Communication. Current Biology 2018, 28, R435–R444. [Google Scholar] [CrossRef] [PubMed]
- Cocucci, E.; Meldolesi, J. Ectosomes and Exosomes: Shedding the Confusion between Extracellular Vesicles. Trends Cell Biol. 2015, 25, 364–372. [Google Scholar] [CrossRef] [PubMed]
- Kalluri, R.; McAndrews, K. M. The Role of Extracellular Vesicles in Cancer. Cell 2023, 186, 1610–1626. [Google Scholar] [CrossRef]
- Rezaie, J.; Ahmadi, M.; Ravanbakhsh, R.; Mojarad, B.; Mahbubfam, S.; Shaban, S. A.; Shadi, K.; Berenjabad, N. J.; Etemadi, T. Tumor-Derived Extracellular Vesicles: The Metastatic Organotropism Drivers. Life Sci. 2022, 289, 120216. [Google Scholar] [CrossRef]
- Jeppesen, D. K.; Zhang, Q.; Franklin, J. L.; Coffey, R. J. Extracellular Vesicles and Nanoparticles: Emerging Complexities. Trends Cell Biol. 2023, 33, 667–681. [Google Scholar] [CrossRef]
- Ratajczak, M. Z.; Ratajczak, J. Leukemogenesis Occurs in a Microenvironment Enriched by Extracellular Microvesicles/Exosomes: Recent Discoveries and Questions to Be Answered. Leukemia 2024, 38, 692–698. [Google Scholar] [CrossRef]
- Samii, A.; Razmkhah, F. Transformation of Hematopoietic Stem and Progenitor Cells by Leukemia Extracellular Vesicles: A Step Toward Leukemogenesis. Stem Cell Rev. Rep. 2020, 16, 1081–1091. [Google Scholar] [CrossRef]
- Yamashita, M.; Dellorusso, P. V.; Olson, O. C.; Passegué, E. Dysregulated Haematopoietic Stem Cell Behaviour in Myeloid Leukaemogenesis. Nat. Rev. Cancer 2020, 20, 365–382. [Google Scholar] [CrossRef] [PubMed]
- Johnsen, K. B.; Gudbergsson, J. M.; Andresen, T. L.; Simonsen, J. B. What Is the Blood Concentration of Extracellular Vesicles? Implications for the Use of Extracellular Vesicles as Blood-Borne Biomarkers of Cancer. Biochimica et Biophysica Acta (BBA) - Reviews on Cancer 2019, 1871, 109–116. [Google Scholar] [CrossRef] [PubMed]
- Lucien, F.; Gustafson, D.; Lenassi, M.; Li, B.; Teske, J. J.; Boilard, E.; von Hohenberg, K. C.; Falcón-Perez, J. M.; Gualerzi, A.; Reale, A.; et al. MIBlood-EV: Minimal Information to Enhance the Quality and Reproducibility of Blood Extracellular Vesicle Research. J. Extracell. Vesicles 2023, 12. [Google Scholar] [CrossRef] [PubMed]
- Vu, L. T.; Peng, B.; Zhang, D. X.; Ma, V.; Mathey-Andrews, C. A.; Lam, C. K.; Kiomourtzis, T.; Jin, J.; McReynolds, L.; Huang, L.; et al. Tumor-secreted Extracellular Vesicles Promote the Activation of Cancer-associated Fibroblasts via the Transfer of MicroRNA-125b. J. Extracell. Vesicles 2019, 8. [Google Scholar] [CrossRef]
- Bebelman, M. P.; Janssen, E.; Pegtel, D. M.; Crudden, C. The Forces Driving Cancer Extracellular Vesicle Secretion. Neoplasia 2021, 23, 149–157. [Google Scholar] [CrossRef]
- Dilsiz, N. Role of Exosomes and Exosomal MicroRNAs in Cancer. Future Sci. OA 2020, 6. [Google Scholar] [CrossRef]
- Urabe, F.; Kosaka, N.; Ito, K.; Kimura, T.; Egawa, S.; Ochiya, T. Extracellular Vesicles as Biomarkers and Therapeutic Targets for Cancer. American Journal of Physiology-Cell Physiology 2020, 318, C29–C39. [Google Scholar] [CrossRef]
- Costa-Silva, B.; Aiello, N. M.; Ocean, A. J.; Singh, S.; Zhang, H.; Thakur, B. K.; Becker, A.; Hoshino, A.; Mark, M. T.; Molina, H.; et al. Pancreatic Cancer Exosomes Initiate Pre-Metastatic Niche Formation in the Liver. Nat. Cell Biol. 2015, 17, 816–826. [Google Scholar] [CrossRef]
- Duffield, A. S.; Mullighan, C. G.; Borowitz, M. J. International Consensus Classification of Acute Lymphoblastic Leukemia/Lymphoma. Virchows Archiv 2023, 482, 11–26. [Google Scholar] [CrossRef]
- Arber, D. A.; Orazi, A.; Hasserjian, R. P.; Borowitz, M. J.; Calvo, K. R.; Kvasnicka, H. M.; Wang, S. A.; Bagg, A.; Barbui, T.; Branford, S.; et al. International Consensus Classification of Myeloid Neoplasms and Acute Leukemias: Integrating Morphologic, Clinical, and Genomic Data. Blood 2022, 140, 1200–1228. [Google Scholar] [CrossRef]
- Harris, M. H.; Czuchlewski, D. R.; Arber, D. A.; Czader, M. Genetic Testing in the Diagnosis and Biology of Acute Leukemia. Am. J. Clin. Pathol. 2019, 152, 322–346. [Google Scholar] [CrossRef] [PubMed]
- Estey, E. H. Acute Myeloid Leukemia: 2019 Update on Risk-Stratification and Management. Am. J. Hematol. 2018, 93, 1267–1291. [Google Scholar] [CrossRef] [PubMed]
- De Kouchkovsky, I.; Abdul-Hay, M. Acute Myeloid Leukemia: A Comprehensive Review and 2016 Update. Blood Cancer J. 2016, 6. [Google Scholar] [CrossRef] [PubMed]
- Malard, F.; Mohty, M. Acute Lymphoblastic Leukaemia. The Lancet 2020, 395, 1146–1162. [Google Scholar] [CrossRef] [PubMed]
- Polyatskin, I. L.; Artemyeva, A. S.; Krivolapov, Yu. A. Revised WHO Classification of Tumors of Hematopoietic and Lymphoid Tissues, 2017 (4th Edition):Lymphoid Tumors. Arkh. Patol. 2019, 81, 59. [Google Scholar] [CrossRef] [PubMed]
- Miljkovic-Licina, M.; Arraud, N.; Zahra, A. D.; Ropraz, P.; Matthes, T. Quantification and Phenotypic Characterization of Extracellular Vesicles from Patients with Acute Myeloid and B-Cell Lymphoblastic Leukemia. Cancers (Basel). 2021, 14, 56. [Google Scholar] [CrossRef]
- Kumar, M. A.; Baba, S. K.; Sadida, H. Q.; Marzooqi, S. Al.; Jerobin, J.; Altemani, F. H.; Algehainy, N.; Alanazi, M. A.; Abou-Samra, A.-B.; Kumar, R.; et al. Extracellular Vesicles as Tools and Targets in Therapy for Diseases. Signal Transduct. Target. Ther. 2024, 9, 27. [Google Scholar] [CrossRef]
- Longjohn, M. N.; Hudson, J.-A. B. J.; Peña-Castillo, L.; Cormier, R. P. J.; Hannay, B.; Chacko, S.; Lewis, S. M.; Moorehead, P. C.; Christian, S. L. Extracellular Vesicle Small RNA Cargo Discriminates Non-Cancer Donors from Pediatric B-Lymphoblastic Leukemia Patients. Front. Oncol. 2023, 13. [Google Scholar] [CrossRef]
- Trino, S.; Lamorte, D.; Caivano, A.; De Luca, L.; Sgambato, A.; Laurenzana, I. Clinical Relevance of Extracellular Vesicles in Hematological Neoplasms: From Liquid Biopsy to Cell Biopsy. Leukemia 2021, 35, 661–678. [Google Scholar] [CrossRef]
- Théry, C.; Witwer, K. W.; Aikawa, E.; Alcaraz, M. J.; Anderson, J. D.; Andriantsitohaina, R.; Antoniou, A.; Arab, T.; Archer, F.; Atkin-Smith, G. K.; et al. Minimal Information for Studies of Extracellular Vesicles 2018 (MISEV2018): A Position Statement of the International Society for Extracellular Vesicles and Update of the MISEV2014 Guidelines. J. Extracell. Vesicles 2018, 7. [Google Scholar] [CrossRef]
- Menck, K.; Bleckmann, A.; Schulz, M.; Ries, L.; Binder, C. Isolation and Characterization of Microvesicles from Peripheral Blood. Journal of Visualized Experiments 2017, No. 119. [Google Scholar] [CrossRef]
- Parolini, I.; Federici, C.; Raggi, C.; Lugini, L.; Palleschi, S.; De Milito, A.; Coscia, C.; Iessi, E.; Logozzi, M.; Molinari, A.; et al. Microenvironmental PH Is a Key Factor for Exosome Traffic in Tumor Cells. Journal of Biological Chemistry 2009, 284, 34211–34222. [Google Scholar] [CrossRef] [PubMed]
- Welsh, J. A.; Goberdhan, D. C. I.; O’Driscoll, L.; Buzas, E. I.; Blenkiron, C.; Bussolati, B.; Cai, H.; Di Vizio, D.; Driedonks, T. A. P.; Erdbrügger, U.; et al. Minimal Information for Studies of Extracellular Vesicles (MISEV2023): From Basic to Advanced Approaches. J. Extracell. Vesicles 2024, 13. [Google Scholar] [CrossRef] [PubMed]
- Liu, Y.; Ye, S.; Guo, X.; Li, W.; Xia, Y.; Wen, X.; Yu, J.; Jia, Y.; Liu, X.; Guo, Y.; et al. Discovery and Characteristics of B Cell-like T Cells: A Potential Novel Tumor Immune Marker? Immunol. Lett. 2020, 220, 44–50. [Google Scholar] [CrossRef]
- Sódar, B. W.; Kittel, Á.; Pálóczi, K.; Vukman, K. V; Osteikoetxea, X.; Szabó-Taylor, K.; Németh, A.; Sperlágh, B.; Baranyai, T.; Giricz, Z.; et al. Low-Density Lipoprotein Mimics Blood Plasma-Derived Exosomes and Microvesicles during Isolation and Detection. Sci. Rep. 2016, 6, 24316. [Google Scholar] [CrossRef]
- Jimenez, D. E.; Tahir, M.; Faheem, M.; Alves, W. B. dos S.; Correa, B. de L.; de Andrade, G. R.; Larsen, M. R.; de Oliveira, G. P.; Pereira, R. W. Comparison of Four Purification Methods on Serum Extracellular Vesicle Recovery, Size Distribution, and Proteomics. Proteomes 2023, 11, 23. [Google Scholar] [CrossRef]
- Japp, A. S.; Meng, W.; Rosenfeld, A. M.; Perry, D. J.; Thirawatananond, P.; Bacher, R. L.; Liu, C.; Gardner, J. S.; Atkinson, M. A.; Kaestner, K. H.; et al. TCR+/BCR+ Dual-Expressing Cells and Their Associated Public BCR Clonotype Are Not Enriched in Type 1 Diabetes. Cell 2021, 184, 827–839.e14. [Google Scholar] [CrossRef]
- zhang, Y.; Guo, C.; Zhou, Y.; Zhang, W.; Zhu, Z.; Wang, W.; Wan, Y. A Biphenotypic Lymphocyte Subset Displays Both T- and B-Cell Functionalities. Commun. Biol. 2024, 7, 28. [Google Scholar] [CrossRef] [PubMed]
- Buzás, E. I.; Tóth, E. Á.; Sódar, B. W.; Szabó-Taylor, K. É. Molecular Interactions at the Surface of Extracellular Vesicles. Semin. Immunopathol. 2018, 40, 453–464. [Google Scholar] [CrossRef] [PubMed]
- Tóth, E. Á.; Turiák, L.; Visnovitz, T.; Cserép, C.; Mázló, A.; Sódar, B. W.; Försönits, A. I.; Petővári, G.; Sebestyén, A.; Komlósi, Z.; et al. Formation of a Protein Corona on the Surface of Extracellular Vesicles in Blood Plasma. J. Extracell. Vesicles 2021, 10, e12140. [Google Scholar] [CrossRef]
- Alexander, T. B.; Gu, Z.; Iacobucci, I.; Dickerson, K.; Choi, J. K.; Xu, B.; Payne-Turner, D.; Yoshihara, H.; Loh, M. L.; Horan, J.; et al. The Genetic Basis and Cell of Origin of Mixed Phenotype Acute Leukaemia. Nature 2018, 562, 373–379. [Google Scholar] [CrossRef] [PubMed]
- Johnson, S. M.; Dempsey, C.; Parker, C.; Mironov, A.; Bradley, H.; Saha, V. Acute Lymphoblastic Leukaemia Cells Produce Large Extracellular Vesicles Containing Organelles and an Active Cytoskeleton. J. Extracell. Vesicles 2017, 6. [Google Scholar] [CrossRef] [PubMed]
- Al-Nedawi, K.; Meehan, B.; Micallef, J.; Lhotak, V.; May, L.; Guha, A.; Rak, J. Intercellular Transfer of the Oncogenic Receptor EGFRvIII by Microvesicles Derived from Tumour Cells. Nat. Cell Biol. 2008, 10, 619–624. [Google Scholar] [CrossRef] [PubMed]
- Abdulmawjood, B.; Roma-Rodrigues, C.; Fernandes, A. R.; Baptista, P. V. Liquid Biopsies in Myeloid Malignancies. Cancer Drug Resist. 2019, 2, 1044–1061. [Google Scholar] [CrossRef]
- Arber, DA; Orazi, A; Hasserjian, R; et al. The 2016 Revision to the World Health Organization Classification of Myeloid Neoplasms and Acute Leukemia. Blood;Blood 2016, 127((20)), 2391-2405, Blood, 2016, 128 (3), 462–463. [Google Scholar] [CrossRef]
- Sierra-López, F.; Iglesias-Vazquez, V.; Baylon-Pacheco, L.; Ríos-Castro, E.; Osorio-Trujillo, J. C.; Lagunes-Guillén, A.; Chávez-Munguía, B.; Hernández, S. B.; Acosta-Altamirano, G.; Talamás-Rohana, P.; et al. A Fraction of Escherichia Coli Bacteria Induces an Increase in the Secretion of Extracellular Vesicle Polydispersity in Macrophages: Possible Involvement of Secreted EVs in the Diagnosis of COVID-19 with Bacterial Coinfections. Int. J. Mol. Sci. 2025, 26, 3741. [Google Scholar] [CrossRef]
- Karami Fath, M.; Azami, J.; Jaafari, N.; Akbari Oryani, M.; Jafari, N.; Karim poor, A.; Azargoonjahromi, A.; Nabi-Afjadi, M.; Payandeh, Z.; Zalpoor, H.; et al. Exosome Application in Treatment and Diagnosis of B-Cell Disorders: Leukemias, Multiple Sclerosis, and Arthritis Rheumatoid. Cell. Mol. Biol. Lett. 2022, 27, 74. [Google Scholar] [CrossRef]
- Ratajczak, J.; Wysoczynski, M.; Hayek, F.; Janowska-Wieczorek, A.; Ratajczak, M. Z. Membrane-Derived Microvesicles: Important and Underappreciated Mediators of Cell-to-Cell Communication. Leukemia 2006, 20, 1487–1495. [Google Scholar] [CrossRef]
- Caivano, A.; Laurenzana, I.; De Luca, L.; La Rocca, F.; Simeon, V.; Trino, S.; D’Auria, F.; Traficante, A.; Maietti, M.; Izzo, T.; et al. High Serum Levels of Extracellular Vesicles Expressing Malignancy-Related Markers Are Released in Patients with Various Types of Hematological Neoplastic Disorders. Tumor Biology 2015, 36, 9739–9752. [Google Scholar] [CrossRef]
- Yang, H.-Q.; Qiu, F.-Q.; Jin, K. E.; Jiang, N.-G.; Zhang, L. I. High Plasma Levels of Oxidatively Modified Low-Density Lipoproteins Are Associated with the Suppressed Expression of Immunomodulatory Molecules in Patients with Hematological Malignancies. Exp. Ther. Med. 2015, 9, 2394–2400. [Google Scholar] [CrossRef]
- Kwaan, H.; Magalhães Rego, E. Role of Microparticles in the Hemostatic Dysfunction in Acute Promyelocytic Leukemia. Semin. Thromb. Hemost. 2010, 36, 917–924. [Google Scholar] [CrossRef]
- Lozano-Andrés, E.; Enciso-Martinez, A.; Gijsbers, A.; Libregts, S. F. W. M.; Pinheiro, C.; Van Niel, G.; Hendrix, A.; Peters, P. J.; Otto, C.; Arkesteijn, G. J. A.; et al. Physical Association of Low Density Lipoprotein Particles and Extracellular Vesicles Unveiled by Single Particle Analysis; 1 September 2022. [Google Scholar] [CrossRef]
- Morel, S.; Leahy, J.; Fournier, M.; Lamarche, B.; Garofalo, C.; Grimard, G.; Poulain, F.; Delvin, E.; Laverdière, C.; Krajinovic, M.; et al. Lipid and Lipoprotein Abnormalities in Acute Lymphoblastic Leukemia Survivors. J. Lipid Res. 2017, 58, 982–993. [Google Scholar] [CrossRef]
- Malhotra, J.; Tonorezos, E. S.; Rozenberg, M.; Vega, G. L.; Sklar, C. A.; Chou, J.; Moskowitz, C. S.; Eshelman-Kent, D. A.; Janiszewski, P.; Ross, R.; et al. Atherogenic Low Density Lipoprotein Phenotype in Long-Term Survivors of Childhood Acute Lymphoblastic Leukemia. J. Lipid Res. 2012, 53, 2747–2754. [Google Scholar] [CrossRef] [PubMed]
- Welsh, J. A.; Van Der Pol, E.; Arkesteijn, G. J. A.; Bremer, M.; Brisson, A.; Coumans, F.; Dignat-George, F.; Duggan, E.; Ghiran, I.; Giebel, B.; et al. MIFlowCyt-EV: A Framework for Standardized Reporting of Extracellular Vesicle Flow Cytometry Experiments. J. Extracell. Vesicles 2020, 9. [Google Scholar] [CrossRef]
- Li, L.; Görgens, A.; Mussack, V.; Pepeldjiyska, E.; Hartz, A. S.; Rank, A.; Schmohl, J.; Krämer, D.; El Andaloussi, S.; Pfaffl, M. W.; et al. Description and Optimization of a Multiplex Bead-Based Flow Cytometry Method (MBFCM) to Characterize Extracellular Vesicles in Serum Samples from Patients with Hematological Malignancies. Cancer Gene Ther. 2022, 29, 1600–1615. [Google Scholar] [CrossRef] [PubMed]
- Zhong, X.; Ma, H. Targeting CD38 for Acute Leukemia. Front. Oncol. 2022, 12. [Google Scholar] [CrossRef] [PubMed]
- Jiang, Z.; Wu, D.; Lin, S.; Li, P. CD34 and CD38 Are Prognostic Biomarkers for Acute B Lymphoblastic Leukemia. Biomark. Res. 2016, 4, 23. [Google Scholar] [CrossRef]
- Eveillard, M.; Floc’h, V.; Robillard, N.; Debord, C.; Wuilleme, S.; Garand, R.; Rialland, F.; Thomas, C.; Peterlin, P.; Guillaume, T.; et al. CD38 Expression in B-Lineage Acute Lymphoblastic Leukemia, a Possible Target for Immunotherapy. Blood 2016, 128, 5268–5268. [Google Scholar] [CrossRef]
- Magalhães-Gama, F.; Malheiros Araújo Silvestrini, M.; Neves, J. C. F.; Araújo, N. D.; Alves-Hanna, F. S.; Kerr, M. W. A.; Carvalho, M. P. S. S.; Tarragô, A. M.; Soares Pontes, G.; Martins-Filho, O. A.; et al. Exploring Cell-Derived Extracellular Vesicles in Peripheral Blood and Bone Marrow of B-Cell Acute Lymphoblastic Leukemia Pediatric Patients: Proof-of-Concept Study. Front. Immunol. 2024, 15. [Google Scholar] [CrossRef]
- Auber, M.; Svenningsen, P. An Estimate of Extracellular Vesicle Secretion Rates of Human Blood Cells. Journal of Extracellular Biology 2022, 1. [Google Scholar] [CrossRef]
- Wahlgren, J.; Karlson, T. D. L.; Glader, P.; Telemo, E.; Valadi, H. Activated Human T Cells Secrete Exosomes That Participate in IL-2 Mediated Immune Response Signaling. PLoS One 2012, 7, e49723. [Google Scholar] [CrossRef]
- Griesel, L.; Kaleja, P.; Tholey, A.; Lettau, M.; Janssen, O. Comparative Analysis of Extracellular Vesicles from Cytotoxic CD8+ Aβ T Cells and Γδ T Cells. Cells 2024, 13, 1745. [Google Scholar] [CrossRef]
- Lu, C.-W.; Lo, Y.-H.; Chen, C.-H.; Lin, C.-Y.; Tsai, C.-H.; Chen, P.-J.; Yang, Y.-F.; Wang, C.-H.; Tan, C.-H.; Hou, M.-F.; et al. VLDL and LDL, but Not HDL, Promote Breast Cancer Cell Proliferation, Metastasis and Angiogenesis. Cancer Lett. 2017, 388, 130–138. [Google Scholar] [CrossRef] [PubMed]
- Oguro, H. The Roles of Cholesterol and Its Metabolites in Normal and Malignant Hematopoiesis. Front. Endocrinol. (Lausanne). 2019, 10. [Google Scholar] [CrossRef] [PubMed]
- Goossens, P.; Rodriguez-Vita, J.; Etzerodt, A.; Masse, M.; Rastoin, O.; Gouirand, V.; Ulas, T.; Papantonopoulou, O.; Van Eck, M.; Auphan-Anezin, N.; et al. Membrane Cholesterol Efflux Drives Tumor-Associated Macrophage Reprogramming and Tumor Progression. Cell Metab. 2019, 29, 1376–1389.e4. [Google Scholar] [CrossRef] [PubMed]
- Karmacharya, M.; Kumar, S.; Cho, Y.-K. Tuning the Extracellular Vesicles Membrane through Fusion for Biomedical Applications. J. Funct. Biomater. 2023, 14, 117. [Google Scholar] [CrossRef]
- Morandi, M. I.; Busko, P.; Ozer-Partuk, E.; Khan, S.; Zarfati, G.; Elbaz-Alon, Y.; Abou Karam, P.; Napso Shogan, T.; Ginini, L.; Gil, Z.; et al. Extracellular Vesicle Fusion Visualized by Cryo-Electron Microscopy. PNAS Nexus 2022, 1. [Google Scholar] [CrossRef]
- Li, Q.; Wang, J.; Zhang, M.; Tang, Y.; Lu, H. Discovery of CD3+ CD19 +cells, a Novel Lymphocyte Subset with a Potential Role in Human Immunodeficiency Virus- Mycobacterium Tuberculosis Coinfection, Using Mass Cytometry. Clin. Transl. Med. 2021, 11. [Google Scholar] [CrossRef]
Figure 1.
Standardization of the analysis of extracellular vesicle-enriched populations using spectral flow cytometry. The phenotypic characterization of EVEPs is described according to the following strategy: (a) Cleaning and event selection: A time window (gate) was applied against side scatter (SSC-H) to exclude artifacts and aggregates, subsequently defining a specific region for EVEPs that excludes unwanted particles. (b) Control of unstained EVEPs. (c) Disruption control (1% Tween 20): In order to confirm that the signal of interest corresponds to EVs and not lysates or soluble antigens, treatment with 1% Tween was performed, observing the absence of positivity events in the histogram after this procedure. (d) Noise control—aggregates removed by centrifugation (PBS + antibodies without centrifugation): An unfiltered 1X PBS sample was included to which antibodies were added without prior centrifugation; a positive signal was detected for CD9 and CD63 markers in this control condition. All assays were performed in triplicate, n= 3.

Figure 2.
Comparison of tetraspanin expression in EVEPs between patients with B-ALL and controls. A comparative analysis of the expression of CD9, CD63, and CD81 markers (EV-associated tetraspanins) was performed by flow cytometry, using histograms for representation. Samples from patients with B-ALL were evaluated, both from bone marrow (white bars) and peripheral blood (gray bar), and compared with those obtained from healthy controls (hatched bars). All tests were performed in triplicate (n = 3). Statistical analysis using the non-parametric Kruskal-Wallis test revealed no statistically significant differences in marker expression between groups for CD81 (H = 3.467, P=0.196), CD63 (H = 3.289, P = 0.232), or CD9 (H = 5.067, P = 0.086). Standard deviation is shown.

Figure 4.
Identification of CD3+CD19+ EVs in patients with B-ALL from peripheral blood. The different markers were detected in EVEPs aggregates, and occasionally EVs double positive for CD3⁺ and CD19⁺ in peripheral blood samples from patients with B-ALL (n = 3). The samples were labeled with anti-CD3-PE, anti-CD19-PerCP-Vio700, and anti-CD63-FITC antibodies. The images were captured using an Axio Imager Z2 microscope (Carl Zeiss) and analyzed using ZEN lite software. Verification of the morphometric and colocalization characteristics specific to EVs was performed using ImageJ2 software and the EVAnalyzer plugin.

Disclaimer/Publisher’s Note: The statements, opinions and data contained in all publications are solely those of the individual author(s) and contributor(s) and not of MDPI and/or the editor(s). MDPI and/or the editor(s) disclaim responsibility for any injury to people or property resulting from any ideas, methods, instructions or products referred to in the content. |
© 2026 by the authors. Licensee MDPI, Basel, Switzerland. This article is an open access article distributed under the terms and conditions of the Creative Commons Attribution (CC BY) license (http://creativecommons.org/licenses/by/4.0/).
Copyright: This open access article is published under a Creative Commons CC BY 4.0 license, which permit the free download, distribution, and reuse, provided that the author and preprint are cited in any reuse.


