
Submitted:
02 March 2026
Posted:
03 March 2026
You are already at the latest version
Abstract
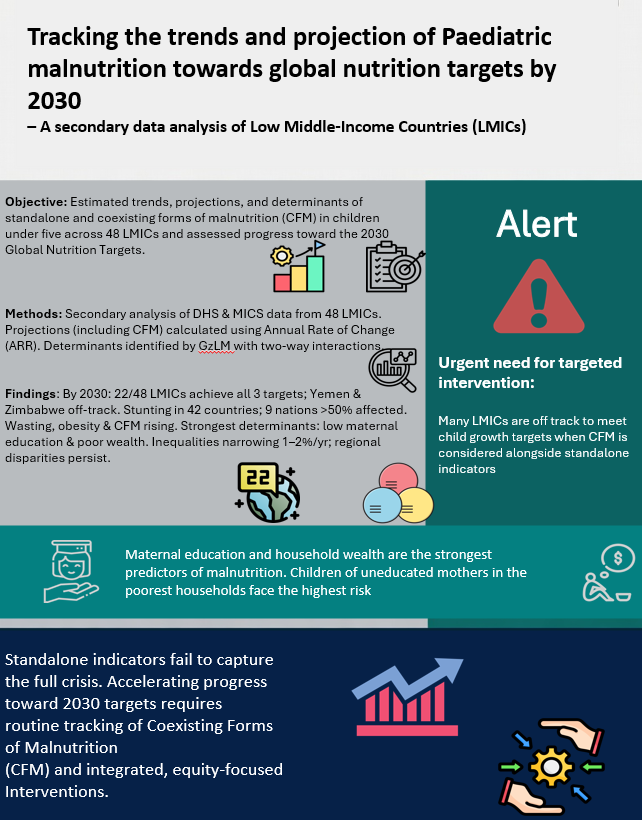
Objective: This study aimed to estimate the trends, projections, and determinants of standalone and Coexisting Forms of Malnutrition (CFM) at global, regional, national, and individual level among children under five in low- and middle-income countries (LMICs). The study also assessed the projection trajectory towards the 2030 GNTs (GNT) for child growth. Methods: Data from 48 LMICs were analysed using the Multiple Indicator Cluster Surveys (MICS) and Demographic & Health Surveys (DHS). Children with complete anthropometry were included for national and individual-level descriptive analyses. Projected prevalence of each form of malnutrition, including CFM, was calculated using the Annual Rate of Change (ARR). Inferential analyses employed generalized linear regression models (GzLM) with two-way interaction terms to identify determinants of each malnutrition type. Findings: By 2030, 22 of 48 LMICs are projected to achieve all three GNT, up from 10 countries currently, while Yemen and Zimbabwe are expected to remain off-track. Stunting is the most prevalent form, affecting 42 countries, with nine nations projected to have over 50% of children affected by any form of malnutrition. Wasting, obesity, and CFM are rising in several countries. Maternal education and household wealth were the strongest determinants, with children of uneducated mothers and from poorest households at highest risk. Inequalities are narrowing slowly, by 1–2% per year, and marked regional disparities persist. Conclusion: Many LMICs are off track to meet child growth targets when CFM in considered alongside standalone indicators. The government and global health partners must strengthen nutrition surveillance systems and equity-focused policies and programs to routinely capture CFM and prevent as well as manage all forms of malnutrition at national and individual levels.
Keywords:
malnutrition
; stunting
; wasting
; obesity
; children
; coexisting forms
; trends
; GNTs
; low-and-middle income countries (LMICs)
; sustainable development goals (SDGs)
What is already known on this topic: The use of anthropometry in measuring nutrition profile of children is a cost-effective and widely used method. The nutrition related indicators, targets and goals devised globally are focused on tracking the progress of standalone forms of malnutrition at the national level. The GNT proposed six nutritional targets for improving the health and nutrition of women and children below five years. However, the targets related to CFM and its various types in an individual are not yet proposed by any local and international bodies.
What this study adds: This is the first study which measured the trends, projected prevalence and determinants of malnutrition and its different types including CFM among the among neonates, infants and young children across 48 LMICs, using combined DHS and MICS datasets spanning over two decades. By the year 2030, it would be expected that more than 20 LMICs will reach the nutritional targets of stunting, wasting and obesity. However, Yemen and Zimbabwe will have higher threshold of all forms of malnutrition by 2030. Male sex, lack of maternal education, poverty and rural residence were identified as major risk factor for various form of malnutrition including CFM. This study highlights an urgency for nutrition interventions, health promotion, and healthy food subsidiaries particularly among children under five years of age.
How this study might affect research, practice or policy: This study establishes a standardized method for measuring CFM using routine DHS and MICS anthropometric data. By completing GNT many LMICs show progress on standalone forms of malnutrition (stunting, wasting, and obesity). Policy makers should integrate CFM into surveillance and guidelines and support research into subclinical cases and intervention effects to achieve meaningful reductions by prioritising multisectoral strategies.
1. Introduction
Malnutrition is one of the pressing public health concerns contributing substantially around half of the deaths among children under five years of age [1]. It is characterised by the imbalance of undernutrition and overnutrition [2]. Recent Joint Malnutrition Estimates (JME) report of 2024 proposed by the UNICEF, WHO and World Bank underscored 23.2% stunting, 6.6% wasting and 5.5% overweight in children aged below five years [3]. This contributes to global malnutrition prevalence in more than a third of children below age five years.
The global burden of malnutrition among children under five years of age is not homogenous. Children living in low- and middle-income countries (LMICs) have disproportionally high prevalence of malnutrition [3]. In general, children living in Asia and Africa are highly vulnerable to various forms of malnutrition, where more than half children are susceptible to different types of nutritional adversities [4]. Poverty, food insecurity, limited access to quality healthcare, and inadequate water and sanitation systems continue to perpetuate the cycle of undernutrition and emerging overnutrition in these countries [3].
Malnutrition in children has profound consequences on their health and development. Paediatric malnutrition has a synergistic relationship with children’s illness, including disability and cognitive impairment, which in turn are associated with negative economic outcomes [5]. Owing to this reason, controlling and eliminating malnutrition specifically among young children has been recognised as an urgent public health concern by various local and international bodies [3,6]. To combat malnutrition, several nutrition-specific and nutrition-sensitive interventions were employed by different countries [7,8]. Furthermore, the Millennium Development Goals (MDGs) and Sustainable Development Goals (SDGs) have set various indicators and targets for eliminating malnutrition by the year 2030 [9,10]. Similarly, the GNTs (GNT) also have set targets for reducing various forms of malnutrition, such as stunting, wasting and obesity by 2030 [11]. However, the progress of most of the countries for reducing malnutrition is not meeting the global malnutrition targets. Most of the LMICs are considered hotspots of malnutrition, where 59%, 73% and 35% children experience stunting, wasting, and obesity, respectively [3]. This depicts either slow or no progress to combat paediatric malnutrition in LMICs by 2030.
There is a pressing need for robust forecasting models that can better evaluate progress toward achieving the WHO-GNT and SDG-2.2 for each country [11,12]. There is a pressing need for robust forecasting models that can better evaluate progress toward achieving the GNT and SDG-2.2 for each country [11,13]. Therefore, this study forecasted the trends of nutritional outcome of children below five years at national, regional and global level by employing Generalized linear regression (GzLM) model.
2. Methodology
2.1. Study Design and Data Source
This is a community-based study, in which nationally representative datasets retrieved from the Demographic and Health Surveys (DHS) & Multiple Indicator Cluster Surveys (MICS) databases were utilized for tracking and forecasting the malnutrition burden among children under five years of age. The DHS programmed was first promulgated in 1984 by the United States Agency for International Development (USAID), while the MICS survey programme was started in 1995 by the UNICEF [14,15]. Both the DHS and MICS surveys collected data related to demography, basic health, nutrition, and development indicators from over 90 LMICs [16]. These datasets provide evidence to the programme manager, policy makers and other stakeholders about the global development progress of different health and nutrition related indicators including those proposed in MDGs, Universal Health Coverage (UHC), and SDGs.
2.2. Study Population & Eligibility Criteria
This study targeted the anthropometric data of children aged between 0 to 59 months belonging to LMICs. A multistep inclusion and exclusion criteria were applied in this study. Firstly, a list of all countries of the world irrespective of their income classification was created. The list contained six different regions as per the World Health Organization (WHO) classification; the African Region (AFRO) with 47 countries, the Region of the Americas (AMRO/PAHO) with 35 countries, the South-East Asia Region (SEARO) with 11 countries, the European Region (EURO) with 53 countries, the Eastern Mediterranean Region (EMRO) with 22 countries, and the Western Pacific Region (WPRO) with 27 countries [17]. From this WHO regional classification list, LMICs were selected, as per the World Bank Income classification FY-2025 [18]. In the second step, data for all the LMICs and LICs were retrieved either from the DHS or MICS database. For inclusion, LMICs and LICs must have at least two datasets in total, with one around the year 2012 (±5 years) and the other any time after 2012. In addition, data from each country must have anthropometric variables reported to be included in the study. All Upper Income Countries (UICs) and countries which had either one dataset or incomplete anthropometry were excluded. Furthermore, data of the certain countries, which were classified as an LMIC at time of data collection but are now removed from LICs and LMICs list were also excluded.
2.3. Conceptual Framework
The analysis of this study adopted a socio-ecological approach to child malnutrition, recognising CFM arise from interactions between immediate (age, sex), household (maternal education, wealth, family size), community (urban/rural residence), and macrolevel (WHO region, temporal trends) determinants acting across the complementary feeding window and early childhood [19]. CFM is conceptualised as a marker of nutritional transition and systems failure. Chronic stunting from early linear growth faltering coincides with acute wasting due to shifting dietary quality and care practices within the same population. The framework links observed patterns to GNT thereby hypothesising that population-level progress on standalone indicators masks persistent individual-level CFM burden. This necessitates surveillance, interventions, and structural vulnerabilities captured through harmonised covariates (Figure 1).
2.4. Study Outcomes
In this study, tracking and forecasting of nutrition profile of young children below five years was carried out by measuring their anthropometric variables such as stunting, wasting and obesity. According to the WHO, a child is considered as stunted and wasted, if the z-score value for height-for-age (HAZ) and weight-for-height (WHZ) is ≤-2.00 S.D., respectively [20]. However, children with WHZ value ≥ 2.00 S.D. are considered as obese [21]. Children experiencing more than one type of nutritional disorder would be considered to have coexisting forms of malnutrition (CFM) [22,23]. The Global Nutritional Report (GNR) proposed two major types of CFM in children aged below five years, such as Coexistence of Stunting with Obesity (CSO) and Coexistence of Wasting with Stunting (CWS) [22]. Further information about different types of nutritional status in children assessed in this study is presented below in Figure 2.
Where, CWS = Coexistence of wasting with stunting, CSO= Coexistence of stunting with obesity, HAZ = Height for age z-score, WHZ = Weight for height z-score, > = Greater than, ≥ = Greater than equals to, ≤ = Less than equals to, and S.D. = Standard deviation.
2.5. Study Covariates
A wide range of biological, social, cultural, economic, ecological, and geographical factors may influence the prevalence and trends of malnutrition, including CFM. Based on data availability and completeness within the selected datasets, relevant covariates were identified and organized into a hierarchical framework comprising individual, household, and regional/community level factors.
At the individual level, covariates included the child’s age and sex (male, female). Household-level factors comprised maternal education (no education, primary, secondary, higher) and household wealth index (poorest, poorer, middle, richer, richest). Regional and community-level factors included place of residence (rural, urban) and geographical region (AFRO, AMRO, EMRO, EURO, SEARO, WPRO).
2.6. Data Handling and Management
After data retrieval, data screening was carried, in which a team of researchers (AK, BA, MR, MK) reviewed all the variables and identified variables of interest: HAZ, WHZ, and basic variables such as age, sex, education, wealth index and region. Datasheet, which contain all the variable of interest were included, while those devoid of variables of interest were excluded. Following data screening, standardization of each dataset was performed. The dataset standardization is characterized by homogenization of each variable and its categories, i.e., heterogeneous categories or differing categories of each variable were converted to homogeneous categories. Some of the variables, such as education and wealth index have non-standardized categories, and these heterogeneous categories were transformed into homogeneous categories. For example, in DHS, the wealth index has five categories: poorest, poorer, middle, richer and richest, and MICS data also has five wealth index categories: poorest, second, middle, fourth and richest. The wealth index coding and the coding order were similar in both datasets ranged from 1 to 5. Regarding the education, the DHS datasets have four categories: no education, primary education, secondary education, and higher education, while the MICS datasets showed six education categories: none, pre-primary, primary, secondary, higher and tertiary. The six education categories of MICS datasets were converted into four categories according to the DHS education categories. However, some of the variables, such as sex and region have homogenous categories and homogenous coding in all the datasets. Certain variables, such as child age and their z-score values were converted from continuous variable to categorical variable. Additional variables were created in each dataset, of which some were created from the existing variables, i.e., a new variable called ‘nutritional status’ was created from the HAZ and WAZ variable, and this new variable consists of six different types of nutritional status: normal, wasting, stunting, obesity, CWS, and CSO. However, some variables, such as survey year, dataset type (DHS and MICS), and geographical region (AFRO, AMRO, EURO, EMRO, SEARO, and WPRO) were added in each dataset for identification purposes. Finally, data merging was carried out for each country, followed by each region as defined by the WHO and finally the globe. Different steps performed for data handling and their management are summarized in Figure 3.
2.7. Statistical Analysis
The analyses of this study were conducted using pooled, nationally representative survey datasets from baseline and current rounds across 48 LMICs. Sampling weights, clustering, and stratification variables were incorporated throughout to ensure nationally representative estimates for the complex survey design.
Initially, data was analysed descriptively using Statistical Package for the Social Sciences-Version 29 (SPSS-29). The prevalence of each nutrition indicator: Stunting, wasting and obesity (Table 1) and various forms of malnutrition such as stunting, wasting, obesity, CWS, and CSO (Table 2) was calculated separately for baseline and current survey rounds. Annual Rate of Change (ARR) was calculated for each nutritional indicator and malnutrition type using Microsoft Excel-365. This assessed the temporal change between two survey rounds and is widely used global in nutrition monitoring frameworks. The UNICEF, WHO, and the World Bank JME used this technical approach ensuring methodological comparability with GNTs. ARR was derived using following formula:
ARR = ln (P2 / P1) / t
Where:
= Prevalence at baseline survey
= Prevalence at current survey
= Time interval (years) between surveys
= Natural logarithm
Based on ARR value, the projected prevalence of each nutrition indicators and each form of malnutrition was estimated using following formula:
Projected Prevalence = P2× e(ARR × t)
Where:
= Time interval (years) from the most recent survey to 2030.
The inferential analyses were performed using a Generalised Linear Model (GzLM) framework with binomial logistic regression. Six mutually exclusive nutritional states were modelled separately: Normal nutritional status (reference category), stunting, wasting, obesity, CWS and CSO. The logit link function was specified for categorical outcomes. GzLM was selected due to its flexibility in link functions, robustness for large datasets and suitability for binary and multinomial outcomes. Robust standard errors were estimated to account for clustering and heteroskedasticity. Furthermore, model assumptions of logistic regression were assessed and satisfied for independence of observations, correct model specification, absence of multicollinearity (VIF observed <5), linearity of continuous predictors, and large sample size. The model diagnostics indicated good fit and no violation of key assumptions.
To examine temporal shifts in disparities, interaction terms between each covariate and survey year (covariate × year) were incorporated. These interactions assessed whether socioeconomic, demographic, and regional gradients across two survey period for each region. Additionally, interaction terms between survey year and malnutrition type were evaluated to determine whether temporal trends differed across nutritional states. The GzLM framework enabled straightforward inclusion of these interaction terms while maintaining computational efficiency and valid inference under complex survey design.
2.8. Ethical Considerations
This study utilised published and anonymous data from the MICS and DHS databases. Hence, the ethical approval was not required for this study according to the international standards.
3. Results
3.1. Scenario-Based Projections of GNTs to 2030 Among Children Under Five Across LMICs
Table 1 described the GNT of each form of paediatric malnutrition (stunting, wasting and obesity) across two survey periods, i.e., baseline and current. Additionally, it presents the ARR of projected prevalence for each nutritional indicator to the year 2030. Of the 48 LMICs included, 15 countries (Bangladesh, Guinea, Benin, Burundi, Chad, Cote d’Ivoire, Kenya, Lesotho, Mali, Malawi, Nepal, Nigeria, Pakistan, Timor-Leste, and Yemen) did not meet any of the GNT cut-offs in the current and baseline survey. Specifically, only Timor-Leste and Yemen still show unacceptably high levels across all three key forms of child malnutrition. In Timor-Leste, the prevalence of stunting is projected to decline by 32.2% from 47.4% in the current survey by 2030. Though, the prevalence of wasting and obesity in Timor-Leste is expected to remain above the 5% threshold. By 2030, Zimbabwe and Yemen are projected to have prevalence levels of all three forms of malnutrition above the GNT cut-offs. The analysis of nutritional indicators revealed that initially thirteen countries mostly from AFRO region demonstrated compliance with the cut-off thresholds for two distinct nutritional indicators Congo, the Democratic Republic of Congo (DRC), Eswatini, Guinea-Bissau, Madagascar, Mozambique, Sao Tome & Principe, Uganda, and Zimbabwe. Haiti, Honduras from the AMRO region. Tajikistan from the EURO region. Laos from the WPRO region. Concurrently, twelve other countries met the criteria for a single nutritional indicator. These were Burkina Faso, Cameroon, Comoros, Egypt, Ghana, India, Ethiopia, Liberia, Mauritania, Zambia, Senegal, and Sudan. However, a more recent survey indicates a shift in these patterns. This subsequent assessment identified twelve countries meeting the cut-off for one nutritional indicator. Bangladesh, Burundi, Guinea-Bissau, for wasting and Cameroon, Cote d'Ivoire, Egypt, Chad, India, Mali, Senegal, Sudan, and Zimbabwe for stunting. Furthermore, a larger cohort of twenty-four countries met the threshold of two indicators in current surveys. Stunting and obesity by Benin, Burkina Faso, Congo, DRC, Eswatini, Ghana, Kenya, Lesotho, Liberia, Tajikistan, Ethiopia, Laos, Jordan, Madagascar, Mauritania, Nepal, Pakistan, Sao Tome & Principe, Mozambique, Uganda, Zambia. Stunting and wasting by Guinea and Palestine. Projections for 2030 indicate that 22 countries stand to successfully meet all the three GNT for critical indicators of child malnutrition. These were mostly from AFRO region Benin, Comoros, Congo, DRC, Eswatini, Gambia, Lesotho, Malawi, Mali, Nigeria, Rwanda, Senegal, Sierra Leone, Tunisia, Uganda, and Zambia. Haiti and Honduras specified AMRO region. One country Nepal from SEARO region. Pakistan and Tunisia from EMRO region. Kyrgyzstan and Tajikistan from EURO region. Moreover by 2030 it is expected that 14 countries will be expected to meet two cut-offs for nutritional thresholds. Bangladesh, Burkina Faso, Egypt, Ethiopia, Ghana, Kenya, Liberia, Madagascar, Mauritania, Mozambique, Sao Tome & Principe, and Togo fulfilling stunting and obesity. Guinea and Palestine fulfilling stunting and wasting targets. Ten countries (Burundi, Cameroon, Chad, Côte d’Ivoire, Guinea-Bissau, India, Laos, Sudan, and Timor-Leste, Jordan) will be expected to meet threshold of one GNT mainly stunting. At baseline around eight countries (Gambia, Jordan, Kyrgyzstan, Palestine, Sierra Leone, Togo, and Tunisia, Rwanda.) met the GNT cut-offs for all three malnutrition (stunting, wasting, and obesity) indicators. An improvement observed in the current survey where ten countries (Comoros, Gambia, Haiti, Honduras, Kyrgyzstan, Malawi, Nigeria, Rwanda, Sierra Leone, and Togo) achieved these targets. However, by 2030, Togo, which currently meets the GNT cut-offs for all forms of malnutrition is projected to no longer meet these targets due to an expected increase in wasting prevalence beyond the 5% threshold from its current prevalence of 3.8%.
From the baseline surveys around 18 countries reported a high prevalence of stunting exceeding 40%. Mostly were from AFRO region Benin, Chad, Côte d’Ivoire, Burundi, Guinea, Kenya, Lesotho, Malawi, Mali, Mauritania, Nigeria, and Zambia. Three from SEARO region Bangladesh, Nepal, Timor-Leste. Pakistan and Yemen from EMRO and Laos from WPRO. Projections to 2030 offered a substantial improvement in stunting prevalence encouragingly Pakistan (30.9%) and Timor-Leste (32.2%) putting them on a path consistent with the GNT. In stark contrast, stunting is expected to remain stubbornly above 40% in Burundi, Mauritania, and Yemen. Additionally, projections indicate that stunting prevalence may exceed 40% in Sudan and Zimbabwe by 2030. The number of countries classified in the red zone for stunting declined markedly from 18 at baseline to five in the current period. These were (Burundi (55.2%), Timor-Leste (47.4%), Mauritania (43.2%), Pakistan (38.5%) and Yemen48.8%).
Wasting remains a major public health challenge across LMICs. At baseline wasting prevalence above the global cut-off (>5%) was observed in 38 countries. Majority were from AFRO region Benin, Burundi, Comoros, Burkina Faso, Cameroon, Chad, Congo, Côte d’Ivoire, DRC, Eswatini, Ethiopia, Ghana, Guinea, Guinea-Bissau, Kenya, Lesotho, Liberia, Madagascar, Malawi, Mali, Mauritania, Mozambique, Nigeria, São Tomé and Príncipe, Senegal, Sudan, Uganda, Zambia and Zimbabwe. Four represented the SEARO region Bangladesh, Nepal, India, Timor-Leste. Egypt, Pakistan and Yemen represented the EMRO region. Haiti from AMRO and Tajikistan from EURO. However, wasting prevalence remained above the global threshold in 33 countries during the current period. Projections indicate that by 2030, more than half of LMICs (approximately 28 countries) are expected to meet the GNT for wasting. In subsequent rounds of surveys, notable advancements emerged in the fight against acute malnutrition. Six low- and middle-income countries Burundi, Comoros, Guinea, Malawi, Mauritania, and Nigeria succeeded in achieving the GNT for wasting. However, projection 2030 reveal that several countries mostly from AFRO region projected to continue experiencing a high burden of wasting beyond 2030. These were Burkina Faso, Cameroon, Chad, Côte d’Ivoire, Ethiopia, Ghana, Guinea-Bissau, Kenya, Liberia, Madagascar, Mozambique, São Tomé and Príncipe, Sudan, Togo, and Zimbabwe. Bangladesh, India and Timor-Leste from the SEARO region. Egypt, Jordan and Yemen from EMRO. Laos from WPRO. Children living in LMICs also experience obesity. Currently, 17 LMICs report obesity prevalence exceeding the global threshold of 5%. Certain LMICs had high obesity threshold at baseline now meet the GNT of <5% obesity. These included Benin, Burkina Faso, Comoros, Ethiopia, Ghana, Kenya, Lesotho, Liberia, Malawi, Nigeria from AFRO region. Nepal from SEARO and Pakistan from EMRO had high obesity threshold at baseline now meet the GNT of <5% obesity. By 2030, forward-looking projections offer some cautious optimism for curbing childhood overweight and obesity in LMICs. Projections indicate that a significant majority of LMICs specifically over 30 nations are positioned to achieve the GNT for childhood obesity. Despite this positive trajectory, a subset of 14 countries is expected to maintain an obesity prevalence exceeding the 5% threshold. This group includes AFRO countries mostly Guinea-Bissau, Sudan, Burundi, Cameroon, Chad, Côte d’Ivoire, Guinea and Zimbabwe. SEARO represented by India and Timor Leste. Jordon, Palestine and Yemen from EMRO region. Laos from WPRO. These findings highlight a persistent public health challenge in these specific regions contrasting with the broader progress observed across other LMICs.
3.2. Baseline, Current and Scenario-Based Projections of Various Forms of Malnutrition Including CFM Among Children Under Five Across LMICs
Table 2 presented prevalence of malnutrition and its various types including coexisting forms of malnutrition (CFM): coexistence of wasting with stunting (CWS) and coexistence of stunting with obesity (CSO) among under five years children of 48 LMICs at an individual level.
At baseline more than half of children under five were malnourished in 13 countries. Majority were from AFRO region Benin, Burundi, Côte d’Ivoire, Kenya, Lesotho, Mali, Nigeria. Bangladesh, Nepal, India, Timor Leste were from SEARO region. EMRO region included Pakistan and Yemen. Paediatric malnutrition exceeded 50% in four countries such as Burundi, India, Timor-Leste, and Yemen in the current surveys. Projections for 2030 suggest that nine countries are expected to have a paediatric malnutrition prevalence exceeding 50%. These were Burundi, Ethiopia, India, Laos, Mauritania, Sudan, Timor-Leste, Yemen, and Zimbabwe.
Stunting was the most prevalent form of malnutrition in 42 LMICs as found in all surveys except in Congo, Egypt, Laos, Jordan, Palestine, and Timor-Leste. In these six countries, projections to 2030 indicate that stunting prevalence will be lower than other forms of malnutrition. Specifically, the projected prevalence of wasting in Egypt, Congo, Laos, and Timor-Leste is expected to exceed that of stunting. However, in Jordan and Palestine, childhood obesity is projected to be more prevalent than other forms of malnutrition.
By 2030, most of the LMICs would be expected to control the raising prevalence of stunting despite of its high burden. However, the prevalence of stunting would be expected to rise from their current stunting level in 10 countries. These are mostly from AFRO region Benin, Burundi, Gambia, Guinea-Bissau, Mali, Mauritania, Sudan and Zimbabwe. Two countries Tunisia and Yemen from the EMRO region. The projected prevalence of wasting would be expected to increase in 15 countries. These are mostly from AFRO region Cote de I’vore, Kenya, Madagascar, Mozambique, Rwanda, Sao Tome & Principe, Sierra Leone, Togo, and Zimbabwe. SEARO region included Nepal, Timor Leste. Eygpt, Jordan and Tunisia from EMRO region. Laos from WPRO region. Similarly, the projected prevalence of obesity would be expected to rise in 2030 in 17 countries. These are mostly from AFRO region Cameron, DRC, Ethiopia, Guinea, Guinea-Bissau, Liberia, Nigeria, Uganda, Zambia and Zimbabwe. Bangladesh, India, Nepal, Timor-Leste from SEARO. EMRO included Jordan and Palestine. WPRO included Laos.
Alongside with standalone forms of malnutrition, CFM specifically the CWS and CSO were observed in 47 countries, with Kyrgyzstan as the only exception. The prevalence of CSO would be expected to rise in 12 countries by 2030. Notably observed in Burundi, Chad, Egypt, Madagascar, Mauritania, Mozambique, Nepal, Sao Tome & Principe, Sierra Leone, Sudan, Timor-Leste and Yemen. While the prevalence of CWS would be expected to rise in 2030 in 9 countries. These were Cameron, Cote de I’vore, Ethiopia, Guinea-Bissau, India, Jordan, Laos, Palestine, and Timor-Leste.
3.3. Determinants of Standalone and Coexisting Forms of Malnutrition Among Children Under Five Across LMICs
We found significantly higher odds of stunting by 15% (14 % to 15%) with each increasing month in age among children between the ranges of 0 to 59 months age. On the other hand, the odds of wasting and obesity decrease by 14% (13% to 14%) and 16% (15% to 17%) with each increasing month in age among children between the ranges of 0 to 59 months age. The odd of coexistence of wasting with stunting increased by 1.03 (1.02 to 1.03) and the coexistence of stunting with obesity decreased with 0.83 (0.82 to 0.84) with each increasing month in age among children between the ranges of 0 to 59 months age. Compared to female children, the male children are at significantly increased odds of acquiring stunting, wasting and obesity to the 1.14 (1.13 to 1.15), 1.10 (1.08 to 1.11), 1.13 (1.09 to 1.16), respectively. Similarly, the coexistence of wasting with stunting is associated with an increased odds of 1.46 (1.43 to 1.48) and the coexistence of stunting with obesity is significantly associated with an increased odds of 1.12 (1.08 to 1.15) among male children between the ranges of 0 to 59 months age.
Compared to parents who have acquired higher education, the odds of stunting and wasting were increased by approximately 1 to 2 folds among parents who have acquired less education or no education. Lower level of parents’ education was significantly associated with the lower odds of having child with obesity, ranging from 21% to 29%. The odds of coexistence of wasting with stunting increased by approximately 1.5 to 3-fold among parents who have acquired less education or no education compared to parents who have acquired higher education. The coexistence of stunting with obesity increased the odds to the 1.41 (1.33 to 1.50) among parents who have no education. On contrary, the odds of the coexistence of stunting with obesity decreased to the 0.89 (0.84 to 0.94) among parents who have acquired secondary education. However, no association was observed with the coexistence of stunting with obesity among parents who have acquired primary education when compared with parents having higher education. Overall, the level of parental educational level is significantly associated with increased odds of malnutrition among children under five across LMICs.
When compared with the richest wealth index, the odd of developing stunting and wasting increased by approximately 1-2-fold among children belonging to Richer to Poorest wealth index. The odds of obesity with each of the wealth index, namely, from poor to richer significantly decreased by 18% to 38% when compared with the children belonging to richest wealth index. The coexistence of wasting with stunting is 1 to 2-fold higher among children belonging to Richer to Poorest wealth index as compared to richest wealth index. The coexistence of stunting with obesity is associated with decreased odd to the 27% to 41% when compared with the children belonging to richest wealth index.
We found significantly higher odds of stunting and wasting to the 1.19 (1.17 to 1.21) and 1.04 (1.02 to 1.06), respectively among the children’s residents of rural areas as compared to the children’s residents of rural area. On the other hand, the odds of obesity decreased to the 0.99 (0.95 to 1.03) among the children’s residents of rural areas. The odd of coexistence of wasting with stunting increased by 1.14 (1.11 to 1.17) and the coexistence of stunting with obesity increased to the 1.13 (1.08 to 1.17) among the children’s residents of rural areas. When compared with WPRO the odds of stunting decreased to the 0.85 (0.83 to 0.87), 0.52 (0.50 to 0.54), 0.83 (0.81 to 0.86), 0.49 (0.47 to 0.51) in children belonging to the regions of AFRO, AMRO, EMRO and EURO. However, the odds of stunting increased to the 30% (27% to 34%) in children belonging to the region of SEARO. There were approximately 1-3-fold higher odds of wasting in the regions of AFRO, EMRO, EURO and SEARO when compared with WPRO. On, contrary, there were lower odds of wasting in the regions of AMRO to the 0.59 (0.46 to 0.75). Compared with WPRO, across all five LMICs the increasing odds of obesity were approximately 3 to 4.5 folds. The coexistence of wasting with stunting was associated with the increased odds to approximately 1 to 3 folds in the regions of AFRO, EMRO, and SEARO. The coexistence of wasting with stunting was significantly lower to the 0.32 (0.28 to 0.36) and 0.36 (0.30 to 0.43) in the regions of AMRO and EURO. The coexistence of stunting with obesity is associated with the increased odds of approximately 2 to 5 fold in the regions of AFRO, EMRO, EURO and SEARO. However, the coexistence of stunting with obesity is associated with the lower odds to the 0.49 (0.24 to 1.04).
The odds of stunting, wasting and obesity decreased to the approximately 3% with an increased passing year. Similarly, the odd of coexistence of wasting with stunting decreased to the 0.97 (0.97 to 0.97) and the coexistence of stunting with obesity decreased to the 0.94 (0.94 to 0.94) with an increased passing year among children under five across LMICs (Table 3).
Table 4: Interaction effects between survey year and selected covariates on SFM and CFM among children under five in LMICs
Across the two survey periods, with each increasing month in age there was 1% reduction in the odds of stunting among children under five in LMICs. Conversely, each additional month of children age was associated with 1% increase in the odds of wasting. There was no significant difference observed in the odds of child’s obesity trend over time. With each increasing month in age, there was slight but significant reduction in the odds of coexistence of wasting with stunting (OR = 0.99; CI: 0.99–0.99) and the coexistence of stunting with obesity (OR = 0.98; CI: 0.97–0.98).
The yearly change in stunting, wasting and obesity was not associated with children’s sex. The coexistence of stunting with obesity was increased in the odds of 1.01 (1.00 to 1.02) among male children as compared to female counterparts.
The odds of stunting and wasting showed a small but statistically significant reduction approximately 1% among children whose parents had lower levels of education. The odds of obesity were reduced by approximately 8% (7% to 10%) among children of parents had no formal education. There was significant reduction in the odds of coexistence of wasting with stunting approximately 2% to 7 % among children whose parents had lower levels of education. And the coexistence of stunting with obesity was reduced approximately 2% to 8% among children whose parents had primary level of education and no formal education. Conversely, the odds of coexistence of stunting with obesity were increased to approximately 2% (1% to 4%) among children whose parents had secondary level of education.
The yearly change in stunting showed a small but statistically significant reduction of approximately 2%–3% among children belonging to the richer, middle, poorer, and poorest wealth indices compared with those in the richest wealth index. Across the two survey periods, the odds of wasting increased slightly among children in the poorest wealth index (OR = 1.01; 95% CI: 1.00–1.02). No statistically significant association was observed between wealth status and wasting among children in the middle and richest wealth indices (OR = 1.00; 95% CI: 0.99–1.01). In contrast, the odds of obesity were reduced by approximately 2% (CI: 1%–3%) among children belonging to the poorest wealth index. The risk of stunting, wasting and obesity was not associated with place of residence across the two survey periods. The odds of coexistence of stunting with obesity were increased to approximately 1% to 2% among children belonging to the poorest to middle wealth index.
Children in the AFRO and EURO regions had a 2%–3% lower risk of stunting compared with WPRO region. Children of AMRO and EMRO are at increased risk of stunting approximately 2% and 7%, respectively. The risk of wasting in the Children in the AFRO and AMRO is statistically reduced by 0.95 (0.94 to 0.97) and 0.97 (0.95 to 0.99), respectively. The odds of wasting were reduced by approximately 11% (CI: 8%–12%) among children of EURO across the two survey periods. Compared with WPRO, across all four regions namely, AFRO, EMRO, EURO and SERO LMICs the odds of obesity were increasing odds of obesity were ranging from 6% to 13%, while no significant association was observed for AMRO 1.00 (0.98 to 1.02). The odds of coexistence of wasting with stunting were reduced in the region of AFRO 0.98 (0.96 to 0.98) and SEARO 0.98 (0.96 to 0.99) as compared to the region of WPRO. The odds of coexistence of wasting with stunting were significantly increased in the region of AMRO 1.02 (1.00 to 1.05) and EMRO 1.08 (1.06 to 1.09). The coexistence of stunting with obesity among children was significantly reduced to 14% to 36% across all five LMIC’s as compared to region of WPRO.
4. Discussion
This study measured the projected trajectories of stunting, wasting, obesity, and CFM among children under five across 48 LMICs to 2030. The findings revealed uneven malnutrition reduction across different regions and countries, although child mortality attributable to malnutrition has declined globally due to improvements in healthcare delivery [24,25]. The study reported that majority of the countries are projected to meet one or more GNTs by 2030, while most remain off-track to fully achieve the nutrition commitments under the SDGs [26]. The dominant pattern across indicators is widening divergence between countries with stable systems and those affected by conflict, climate shocks, or weak governance [27,28].
Among various forms of paediatric malnutrition, stunting which is also known as chronic undernutrition is responsive to long-term, multisectoral strategies. Sustained investments in maternal health, sanitation, education, and primary care have remarkably reduced the rising burden of stunting in most of on-track countries [29,30]. However, projections reveal important fragility, because the inequality gaps between the on-tracks and off-track LMICS narrowed temporarily between baseline and current surveys but are projected to widen again by 2030, i.e., stunting is expected to remain above 40% in Burundi, Mauritania, and Yemen, with Sudan and Zimbabwe at risk of joining this group (Table 1). These trajectories suggest that stunting reduction requires sustained structural transformation [31,32]. Unlike stunting, wasting responds rapidly to acute shocks, such as conflict, drought, displacement, food price volatility, and infectious disease outbreaks [27,28]. By the year 2030, more than half of LMICs are projected to meet ≤5% threshold GNT for wasting. Furthermore, the on-track countries will show gradual improvements for wasting reduction, while the off-track countries are expected to experience rising prevalence. This divergence mirrors patterns described by the Lancet Commission on the Future of Health, where improvements in stable systems coexist with deterioration in fragile states [33]. Countries such as Sudan, Yemen, Zimbabwe, Chad, and Timor-Leste demonstrate particularly concerning trajectories (Table 1). Even small absolute reductions in wasting among on-track countries represent meaningful system-level strengthening in acute malnutrition management. In contrast, minimal change or rising prevalence in fragile settings reflects structural vulnerability and repeated humanitarian shocks [27,28]. By 2030, wasting inequality between country groups is projected not merely to return to baseline levels but to surpass them.
Obesity in children under five year is an emerging nutritional problem, which presents a structurally different but equally concerning trajectory. The prevalence of obesity in more than half of the LMICs remains below the 5% threshold. By 2030, certain countries from Asia, Africa, and Middle East projected to show rising obesity trend specifically in those countries still burdened by undernutrition (Table-1 and Table-2). This reveals bidirectional movement between the on-track and off-track countries by 2030. The on-track countries show modest but consistent declines due to policy interventions targeting obesogenic environments [34]. Conversely, the off-track countries are projected to experience further increases driven by rapid dietary transitions, ultra-processed food penetration, urbanisation, and weak regulatory frameworks [35,36]. This reflects systemic food changes rather than short-term crises. The rising prevalence of obesity coexists in certain countries such as Jordan, Palestine, Sudan, Timor-Leste, and Zimbabwe coexists with undernutrition (stunting or wasting or both) (Table 1), thereby indicating the double burden of malnutrition, a phenomenon in which ultra-processed food penetration drives over nutrition even within populations still struggling with acute undernutrition [37].
CFM (CWS and CSO) was identified in nearly all LMICs, underscoring the complexity of current nutrition landscapes. Despite its global prevalence, still the targets for the reduction of CFM and its various forms are not yet defined by any local and international body. By 2030, the prevalence of both CWS and CSO is projected to rise. Countries like Ethiopia, India, Laos, and Timor-Leste indicate rising projection of CWS by 2030 (Table 2), and this depicts a complex relation between chronic deprivation and acute shocks [27,28]. However, an escalated projection of CSO in several conflict-affected countries including Yemen and Sudan (Table 2) reflects calorie-dense but micronutrient-poor diets, humanitarian food assistance dependency, and rapid market shifts toward processed foods [35,37].
Countries with deteriorating trajectories represent critical regional hotspots. Five countries are projected to have stunting prevalence persist above 40% by 2030: Burundi (54.1%), Mauritania (49.4%), Sudan (61.3%), Yemen (51.4%), and Zimbabwe (56.6%). Wasting remains the most challenging indicator across LMICs, with 33 countries currently exceeding the 5% GNT threshold and 22 projected to continue exceeding this threshold by 2030. Childhood obesity is rising globally, with 14 countries expected to exceed the 2030 threshold. We observed concerning levels of CSW, exceeding 4% in Ethiopia (20.3%), Cameroon (5.9%), Laos (5.5%), and India (4.5%). CSW represents the most lethal form of malnutrition, with mortality risk twelve times higher than well-nourished children. Moreover, the escalated project of CSO to over 5% in Timor-Leste (10.1%), Chad (9.8%), and other conflict-affected settings, highlighting the emerging double burden in fragile and transitioning contexts [27,28,37]. (Table 2).
Across regions, high-risk countries share common drivers: conflict, climate shocks, weak health systems, and structural poverty. The AFRO region remains the epicentre of global malnutrition crisis with several countries classified either as the danger zone or critical hotspots requiring emergency response. In AFRO region, Burundi, Mali, Mauritania, and Zimbabwe continue to experience stunting likely due to, suboptimal exclusive breastfeeding limited dietary diversity, infectious disease burden and limited community-based nutrition programs including poor antenatal care [24,29,38,39]. Ethiopia demonstrated unexpected CWS crisis (Projected 20.3%) secondary to the compounded effects of Tigray conflict, severe drought, locust attacks and COVID-19 pandemic. Benin presents an unusual trajectory: rising projected stunting (33.4%) despite a marked decline in wasting (from 13.3% to 0.6%), suggesting improvement in acute malnutrition management but persistent chronic determinants. In EMRO, Sudan and Yemen showed protracted humanitarian catastrophes with persistently high stunting and CSO, likely linked to prolonged nutritionally inadequate food assistance in the conflict-affected countries [40]. while Jordan and Palestine illustrate emerging childhood obesity secondary to nutrition transition and profound dietary shifts [41]. In SEARO, India and Timor-Leste showed slow progress to reach the GNTs due to poor feeding practices, lack of sanitary measures, and fragile infrastructure [42]. Similarly, in the WPRO region, Laos presents catastrophic projection of wasting (Table 2). Collectively, these countries represent danger zones where chronic deprivation intersects with acute shocks, producing persistent and, in some settings, worsening malnutrition.
In contrast, certain countries from each region achieve the GNTs and have successfully reduced the rising burden of various forms of malnutrition, including CFM. In AFRO region, Chad, Congo Ghana and Rwanda achieved substantial stunting reduction through coordinated national nutrition mechanisms [24,43]. Despite tremendous reduction in stunting, still Chad illustrates a complex pattern of stunting alongside with wasting (CWS) and obesity (CSO). Thereby, reflecting the humanitarian-induced obesity among stunting children of Chad [44]. In SEARO, Bangladesh is projected to improve paediatric nutritional status by incorporating multisectoral improvements: sanitation, dietary diversity, women’s empowerment, and health service expansion [45]. In AMRO, Honduras approaches near-elimination thresholds, whereas Haiti showed persistent challenge due to political instability and natural disaster. Within EURO, Tajikistan and Kyrgyzstan combatted the rising malnutrition prevalence by improving the health infrastructure and social protection systems (Table 2).
Child age and sex emerged as fundamental biological determinants of malnutrition. Each additional year increased in child age increase the stunting odds by 15% while decreasing wasting (14%) and obesity (16%). Different studies demonstrated that acute malnutrition peaks between 6-18 months when complementary feeding is introduced and infectious disease exposure intensifies, while the chronic growth faltering accumulates thereafter [38,46]. Between male and female children, higher odds of undernutrition particularly for CWS were observed in male children and this is in line with recent systematic review evidence [47].
Maternal education was the strongest and most consistent predictor across all forms of malnutrition. Children of mothers with no education had 2.19-fold higher odds of stunting compared with those whose mothers had higher education, and similar gradients were observed for wasting, obesity, and CFM. These findings are consistent with a 2024 meta-analysis across 35 studies demonstrating a robust inverse association between maternal education and child undernutrition [48]. Moreover, maternal education also improve the knowledge and practices for appropriate feeding practices and thereby help to reduced malnutrition [49]. Similarly, children from poorest wealth quintile exhibiting 2.00-fold higher odds of stunting compared to the richest quintile. Analysis of DHS data from 24 LMICs (2017–2022) confirms that child undernutrition remains statistically significant with wealth-related inequality across country income categories [50]. Children of rural residence have high risks of nutritional adversities (malnutrition), highlighting structural disadvantages in healthcare access, WASH infrastructure, and food systems [51].
Interaction analyses revealed that structural inequalities are narrowing too slowly to meet 2030 targets. With time, the poverty gap in stunting is closing by only 2% annually, implying that parity between poorest and richest quintiles would take approximately five decades without major policy shifts. Similarly, the rural–urban differential narrowed by just 1% per year, indicating persistent geographic disadvantage. Over time, the difference in stunting between younger and older children has reduced by about 1% each year. A similar small improvement was seen for CWS. This suggests that nutrition and child health programs may be gradually improving conditions in early childhood, although the progress is modest.
In contrast, the difference between boys and girls has remained mostly unchanged for most forms of malnutrition. However, for CSO, the gap has slowly widened, with boys becoming slightly more affected over time. This trend may reflect changing diets and broader nutrition transition patterns [52]. Regionally, EMRO demonstrated worsening trends, with stunting and obesity increasing by approximately 7% annually relative to other regions, whereas AFRO exhibited faster stunting reduction (≈2% annual acceleration). Overall, the year interaction terms capture the cumulative impact of nutrition-specific and nutrition-sensitive interventions between 2012–2023, indicating modest progress but persistent inequities unlikely to resolve under business-as-usual trajectories [3].
4.2. Strengths and Limitation
This study draws on a very large, multi-country sample of more than a million children under 5 years from 48 LMICs, using DHS and MICS surveys that employ multistage stratified cluster sampling, standardised questionnaires, experienced field workers, and validated anthropometric protocols [37,53]. Uniform procedures for data screening, cleaning, coding, and categorisation, along with sample-weight adjustments and harmonisation of key variables, enhanced the validity, precision and comparability of estimates across countries over time. By triangulating DHS and MICS datasets and standardising variable definitions, the analysis achieves broader geographical coverage and more consistent measures than studies restricted to a single survey platform. The use of regression models that include interaction terms between survey period and key covariates allows assessment of how social and regional gradients in malnutrition have evolved over time, rather than relying solely on crude prevalence differences. Despite the large sample size and inclusion of many LMICs, the findings cannot be considered fully representative of all regions because of under-representation of WPRO, EURO, and AMRO region and some parts of EMRO and SEARO region. Several countries that are no longer classified as LMICs were retained because they received development assistance or were LMICs at the time of data collection, which may complicate strict alignment with current World Bank income groupings [23,54]. The pooled data estimates and projections may not reflect the effects of recent conflicts, climate-related disasters, economic crises, or pandemics. Exclusion of around 10-15% of children due to incomplete anthropometry or outliers, while undoubtedly necessary for data quality, may lead to underestimations of malnutrition in settings with poorer measurement. Furthermore, the survey sampling frames primarily target women of reproductive age, with children under 5 nested within these samples, which can distort the representativeness of the paediatric population. Finally, the malnutrition projections measured in this study were relied on the past trajectories, therefore, they must be interpreted as indicative rather than exact forecast.
4.3. Policy Implications
Addressing paediatric malnutrition through the GNTs remains a critical global priority. However, progress in many LMICs continues to lag behind these targets, partly because current benchmarks are defined by individual anthropometric indicators rather than by the nutritional status of the child as a whole. The presence of one form of malnutrition does not preclude the coexistence of others, highlighting a key limitation of standalone indicator–based approaches. There is a clear need to expand national and regional nutrition surveillance beyond single indicators to systematically capture CFM. This would enable earlier identification and timely management of children affected by multiple nutritional deficits. In addition, redefining the GNTs to include individual-level benchmarks alongside national-level goals could help to reduce the rising burden of malnutrition, including CFM. Such an approach would also support policymakers and programme managers in designing integrated strategies that simultaneously address undernutrition and overnutrition at the individual, community, and national levels.
4.5. Future Directions
Survey frequency across LMICs remains uneven, limiting the ability to comprehensively track nutritional trends over time. More regular and systematically scheduled surveys would allow a clearer understanding of evolving nutrition profiles. DHS and MICS implementing agencies should prioritise greater inclusion of underrepresented regions particularly AMRO, EURO, and WPRO region to ensure more equitable geographic coverage. Integrating nutrition survey data with climatic, environmental, and humanitarian indicators would yield deeper insights into external determinants influencing the national nutrition targets and prevalence of each form of malnutrition including CFM. Furthermore, the adoption of longitudinal study designs including interventional studies would strengthen the identification of context-specific, underlying, and currently underexplored factors contributing to meet the national nutrition targets by combatting malnutrition including CFM in children.
4.6. Conclusion
This study demonstrates that when CFM are considered alongside traditional indicators, many LMICs are not on track to meet the 2030 child growth targets. While some countries show progress, the overall pace of improvement is slow and marked by persistent socioeconomic and regional inequalities. Without accelerated and targeted action, the burden of both standalone and CFM will remain substantial. Governments and global health partners should strengthen nutrition surveillance systems to routinely monitor CFM and implement integrated, equity-focused strategies that simultaneously prevent and manage undernutrition and overnutrition at both national and individual levels.
Author Contributions
A.K. conceptualized the study and made substantial contributions to the introduction, methodology, results, interpretation, data cleaning, data management, and critical review and editing of the manuscript. B.A. contributed to the discussion, data cleaning, results interpretation, and manuscript review and editing. A. contributed to the interpretation of results, discussion, and manuscript review and editing. S.K. contributed to the development of the methodology, data management, and interpretation of results. M.J. contributed to data cleaning, data management, making visualizations and graphical abstract. A.R.G. was responsible for drafting the study highlights and abstract, critically appraising the study strengths and limitations, and developing the conceptual framework within the methodology section. M.J.D. made substantial contributions to the results section. S.T. contributed to drafting the introduction and manuscript referencing. M.R. contributed to data cleaning and drafting of the discussion. M.K. contributed to the drafting of the introduction and data cleaning. N.A. contributed to drafting the introduction. H.A.R.A. contributed to the critical editing of the manuscript. All authors have read, critically reviewed, and approved the final version of the manuscript for submission.
Funding
Not applicable.
Institutional Review Board Statement
The data of this study were retrieved from the Demographic and Health Survey (DHS) and Multiple Indicator Clusters Surveys (MICS) data repository after formal application and registration.
Informed Consent Statement
In this study, the research team received data from DHS and UNICEF repository which was de-identified, i.e., it does not contain information in which a participant can either be identified or traced by any means. Due to this reason, this study does not involve a statement for informed consent.
Data Availability Statement
The data from this study can be retrieved from the DHS program (www.dhsprogram.com) and UNICEF (www.mics.unicef.org/surveys).
Acknowledgments
We would like to acknowledge the data archivist of the Demographic and Health Surveys (DHS) Program and UNICEF, who provided access to the datasets of all the Demographic and Health Surveys (DHS) and Multiple Indicator Cluster Surveys (MICS) implemented in Pakistan for analysis.
Conflicts of Interest
The authors declare no conflict of interest.
List of Abbreviations
| AFRO | African Region |
| AMRO/PAHO | Region of the Americas / Pan American Health Organization |
| ARR | Annual Rate of Change |
| CFM | Coexisting Forms of Malnutrition |
| COVID-19 | Coronavirus Disease 2019 |
| CSO | Coexistence of Stunting with Obesity |
| CSW / CWS | Coexistence of Stunting with Wasting / Coexistence of Wasting with Stunting |
| DHS | Demographic and Health Surveys |
| DRC | Democratic Republic of Congo |
| EMRO | Eastern Mediterranean Region |
| EURO | European Region |
| GBD | Global Burden of Disease |
| GLM/ GzLM | Generalised Linear Model |
| GNR | Global Nutritional Report |
| GNT | Global Nutrition Target |
| HAZ | Height-for-Age Z-score |
| JME | Joint Malnutrition Estimates |
| LICs | Low-Income Countries |
| LMICs | Low- and Middle-Income Countries |
| MDGs | Millennium Development Goals |
| MICS | Multiple Indicator Cluster Surveys |
| OR | Odds Ratio |
| PDHS | Pakistan Demographic and Health Surveys |
| SDGs | Sustainable Development Goals |
| SEARO | South-East Asia Region |
| SFM | Standalone Forms of Malnutrition |
| UHC | Universal Health Coverage |
| UICs | Upper Income Countries |
| UNICEF | United Nations Children's Fund |
| USAID | United States Agency for International Development |
| VIF | Variance Inflation Factor |
| WAZ | Weight-for-Age Z-score |
| WASH | Water, Sanitation and Hygiene |
| WHO | World Health Organization |
| WHZ | Weight-for-Height Z-score |
| WPRO | Western Pacific Region |
References
- Madewell, ZJ; Keita, AM; Das, PM; Mehta, A; Akelo, V; Oluoch, OB; et al. Contribution of malnutrition to infant and child deaths in Sub-Saharan Africa and South Asia. BMJ Glob Health 2024, 9(12). [Google Scholar] [CrossRef]
- Malnutrition [Internet] [Internet]. World Health Organization. 2024. Available online: https://www.who.int/news-room/fact-sheets/detail/malnutrition.
- Levels and Trends in Child Malnutrition: Key Findings of the 2023 [Internet]; World Health Organization, 2023; Available online: https://www.who.int/publications/i/item/9789240073.
- Khaliq, A; Godil, MS; Taseen, S; Usmani, IA; Chowdhury, TS. Prevalence, Trends, and Determinants of Double Burden of Malnutrition Among the Mother-Child Dyads of Pakistan. Int J Pediatr. 2025, 2025, 8816802. [Google Scholar] [CrossRef]
- Silva, NJ; Paixao, ES; Brachowicz, N; Barreix, G; Landin-Basterra, E; Rubio, FA; et al. Early life exposure to economic shocks and association with childhood malnutrition: a pooled analysis of 230 nationwide surveys from 68 low-income and middle-income countries. Lancet Glob Health 2025, 13(8), e1367–e77. [Google Scholar] [CrossRef]
- Landin Basterra, E; Gentilini, U; Cavalcanti, DM; da Silva, AF; de Oliveira Ferreira de Sales, L; Silva, NJ; Rasella, D. Impact of social protection on child malnutrition and mortality across 46 LMICs: a longitudinal study over two decades with insights from the COVID-19 pandemic. EClinicalMedicine 2025, 87, 103414. [Google Scholar] [CrossRef]
- Escher, NA; Andrade, GC; Ghosh-Jerath, S; Millett, C; Seferidi, P. The effect of nutrition-specific and nutrition-sensitive interventions on the double burden of malnutrition in low-income and middle-income countries: a systematic review. Lancet Glob Health 2024, 12(3), e419–e32. [Google Scholar] [CrossRef]
- de Hoop, T; Molotsky, A; Walcott, R; Gaitan-Rossi, P; Hernandez-Cordero, S; Laar, A; et al. The role of nutrition-sensitive interventions in improving nutritional outcomes: findings from a systematic review and meta-analysis. Int J Equity Health 2025, 24(1), 325. [Google Scholar] [CrossRef]
- Oruamabo, RS. Child malnutrition and the Millennium Development Goals: much haste but less speed? Arch Dis Child. 2015, 100 Suppl, S19–22. [Google Scholar] [CrossRef]
- Minna Sabbahi, Jiewen Li, Claire Davis, Downs SM. The Role of the Sustainable Development Goals to Reduce the Global Burden of Malnutrition. Advances in Food Security and Sustainability 2018, 3, 277–333.
- GNT, C. Global, regional, and national progress towards the 2030 GNTs and forecasts to 2050: a systematic analysis for the Global Burden of Disease Study 2021. Lancet 2025, 404(10471), 2543–83. [Google Scholar]
- Local Burden of Disease Child Growth Failure C. Mapping child growth failure across low- and middle-income countries. Nature 2020, 577(7789), 231–4. [CrossRef]
- GNTs 2030 to improve maternal, infant and young child nutrition. [Internet]. 2023. Available online: https://www.who.int/publications/m/item/global-nutrition-targets-2030.
- Description of The DHS Program. Rockville (MD): The DHS Program [Internet]. The DHS Program. Available online: https://dhsprogram.com/data/Guide-to-DHS-Statistics/Description_of_The_Demographic_and_Health_Surveys_Program.htm.
- DHS Recode Manual. Rockville (MD): The DHS Program [Internet]. Available online: https://dhsprogram.com/publications/publication-dhsg4-dhs-questionnaires-and-manuals.cfm.
- MICS — Multiple Indicator Cluster Surveys. [Internet]. 2025. Available online: https://mics.unicef.org/](https://mics.unicef.org/.
- WHO regional offices and regions. [Internet]. World Health Organization. Available online: https://www.who.int/about/who-we-are/regional-offices.
- World Bank country and lending groups (for income classification). [Internet]. Available online: https://datahelpdesk.worldbank.org/knowledgebase/articles/906519-world-bank-country-and-lending-groups.
- Khaliq, A; Ashar, B; Rehman, HA; Junaid, M; Rizwan, Y; Aijaz, N; et al. Global, regional and national estimates of coexisting forms of malnutrition among the neonates, infants and young children - A secondary data analysis of Demographic & Health Surveys (DHS) from 2006 to 2024. F1000Res 2025, 14, 1414. [Google Scholar]
- Stunting in a Nutshell [Internet]. World Health Organization, 2015. Available online: https://www.who.int/news/item/19-11-2015-stunting-in-a-nutshell.
- Daley, SF; Balasundaram, P. Obesity in Pediatric Patients; StatPearls: Treasure Island (FL), 2025. [Google Scholar]
- Khaliq, A; Wraith, D; Nambiar, S; Miller, Y. A review of the prevalence, trends, and determinants of coexisting forms of malnutrition in neonates, infants, and children. BMC Public Health 2022, 22(1), 879. [Google Scholar] [CrossRef]
- Khaliq, A. Determinants and distribution of coexisting forms of malnutrition among neonates, infants and children of Pakistan Queensland University of Technology; 2023. [Google Scholar]
- Headey, D; Heidkamp, R; Osendarp, S; Ruel, M; Scott, N; Black, R; et al. Impacts of COVID-19 on childhood malnutrition and nutrition-related mortality. Lancet 2020, 396(10250), 519–21. [Google Scholar] [CrossRef]
- Roberton, T; Carter, ED; Chou, VB; Stegmuller, AR; Jackson, BD; Tam, Y; et al. Early estimates of the indirect effects of the COVID-19 pandemic on maternal and child mortality in low-income and middle-income countries: a modelling study. Lancet Glob Health 2020, 8(7), e901–e8. [Google Scholar] [CrossRef]
- The Extension of the 2025 Maternal, Infant and Young Child Nutrition Targets to 2030 [Internet]. WHO/UNICEF. 2019. Available online: https://data.unicef.org/resources/who-unicef-discussion-paper-nutrition-targets/.
- Improving Resilience to Weather Shocks and Climate Change [Internet]. 2024. Available online: https://hdl.handle.net/10986/42793.
- Global Report on Food Crises (GRFC) 2025 [Internet]. FSIN and Global Network Against Food Crises. 2025. Available online: https://www.wfp.org/publications/global-report-food-crises-grfc.
- Gillespie, S; Haddad, L; Mannar, V; Menon, P; Nisbett, N; Maternal; Child Nutrition Study, G. The politics of reducing malnutrition: building commitment and accelerating progress. Lancet 2013, 382(9891), 552–69. [Google Scholar] [CrossRef]
- UNICEF Conceptual Framework on Maternal and Child Nutrition [Internet]. 2021. Available online: https://www.unicef.org/documents/conceptual-framework-nutrition.
- Global action plan on child wasting: a framework for action to accelerate progress in preventing and managing child wasting and the achievement of the Sustainable Development Goals [Internet]. World Health Organization, 2020. Available online: https://www.who.int/publications/m/item/global-action-plan-on-child-wasting-a-framework-for-action.
- Swinburn, BA; Kraak, VI; Allender, S; Atkins, VJ; Baker, PI; Bogard, JR; et al. The Global Syndemic of Obesity, Undernutrition, and Climate Change: The Lancet Commission report. Lancet 2019, 393(10173), 791–846. [Google Scholar] [CrossRef]
- Jamison, DT; Summers, LH; Alleyne, G; Arrow, KJ; Berkley, S; Binagwaho, A; et al. Global health 2035: a world converging within a generation. Lancet 2013, 382(9908), 1898–955. [Google Scholar] [CrossRef]
- The state of global nutrition [Internet]. 2021. Available online: https://globalnutritionreport.org/reports/2021-global-nutrition-report/.
- Hawkes, C; Ruel, MT; Salm, L; Sinclair, B; Branca, F. Double-duty actions: seizing programme and policy opportunities to address malnutrition in all its forms. Lancet 2020, 395(10218), 142–55. [Google Scholar] [CrossRef]
- Popkin, BM; Corvalan, C; Grummer-Strawn, LM. Dynamics of the double burden of malnutrition and the changing nutrition reality. Lancet 2020, 395(10217), 65–74. [Google Scholar] [CrossRef]
- Monteiro, CA; Moubarac, JC; Cannon, G; Ng, SW; Popkin, B. Ultra-processed products are becoming dominant in the global food system. Obes Rev. 2013, 14 2 Suppl, 21–8. [Google Scholar] [CrossRef]
- Black, RE; Victora, CG; Walker, SP; Bhutta, ZA; Christian, P; de Onis, M; et al. Maternal and child undernutrition and overweight in low-income and middle-income countries. Lancet 2013, 382(9890), 427–51. [Google Scholar] [CrossRef]
- de Pee, S; Bloem, MW. Current and potential role of specially formulated foods and food supplements for preventing malnutrition among 6- to 23-month-old children and for treating moderate malnutrition among 6- to 59-month-old children. Food Nutr Bull. 2009, 30((3) Suppl, S434–63. [Google Scholar] [CrossRef]
- Akseer, N; Bhatti, Z; Rizvi, A; Salehi, AS; Mashal, T; Bhutta, ZA. Coverage and inequalities in maternal and child health interventions in Afghanistan. BMC Public Health 2016, 16 Suppl 2(Suppl 2), 797. [Google Scholar] [CrossRef]
- Musaiger, AO. Overweight and obesity in eastern mediterranean region: prevalence and possible causes. J Obes. 2011, 2011, 407237. [Google Scholar] [CrossRef]
- Spears, D; Ghosh, A; Cumming, O. Open defecation and childhood stunting in India: an ecological analysis of new data from 112 districts. PLoS One 2013, 8(9), e73784. [Google Scholar] [CrossRef]
- Collaborators GBDD. Health effects of dietary risks in 195 countries, 1990-2017: a systematic analysis for the Global Burden of Disease Study 2017. Lancet 2019, 393(10184), 1958–72. [CrossRef]
- Jomaa, L; Naja, F; Cheaib, R; Hwalla, N. Household food insecurity is associated with a higher burden of obesity and risk of dietary inadequacies among mothers in Beirut, Lebanon. BMC Public Health 2017, 17(1), 567. [Google Scholar] [CrossRef]
- Derek Headey, DS; You, Liangzhi; Guo, Zhe. Remoteness, urbanization, and child nutrition in sub-Saharan Africa. Agricultural Economics 2018, 49(6), 765–75. [Google Scholar] [CrossRef]
- Victora, CG; de Onis, M; Hallal, PC; Blossner, M; Shrimpton, R. Worldwide timing of growth faltering: revisiting implications for interventions. Pediatrics 2010, 125(3), e473-80. [Google Scholar] [CrossRef]
- Dassie, GA; Chala Fantaye, T; Charkos, TG; Sento Erba, M; Balcha Tolosa, F. Factors influencing concurrent wasting, stunting, and underweight among children under five who suffered from severe acute malnutrition in low- and middle-income countries: a systematic review. Front Nutr. 2024, 11, 1452963. [Google Scholar] [CrossRef]
- Rezaeizadeh, G; Mansournia, MA; Keshtkar, A; Farahani, Z; Zarepour, F; Sharafkhah, M; et al. Maternal education and its influence on child growth and nutritional status during the first two years of life: a systematic review and meta-analysis. EClinicalMedicine 2024, 71, 102574. [Google Scholar] [PubMed]
- Katoch, OR. Determinants of malnutrition among children: A systematic review. Nutrition 2022, 96, 111565. [Google Scholar] [CrossRef] [PubMed]
- Birhanu, F; Yitbarek, K; Bobo, FT; Atlantis, E; Woldie, M. Undernutrition in children under five associated with wealth-related inequality in 24 low- and middle-income countries from 2017 to 2022. Sci Rep. 2024, 14(1), 3326. [Google Scholar] [PubMed]
- Caleyachetty, R; Kumar, NS; Bekele, H; Manaseki-Holland, S. Socioeconomic and urban-rural inequalities in the population-level double burden of child malnutrition in the East and Southern African Region. PLOS Glob Public Health 2023, 3(4), e0000397. [Google Scholar] [CrossRef]
- Popkin, BM; Ng, SW. The nutrition transition to a stage of high obesity and noncommunicable disease prevalence dominated by ultra-processed foods is not inevitable. Obes Rev. 2022, 23(1), e13366. [Google Scholar] [CrossRef]
- Prentice, AM; Ward, KA; Goldberg, GR; Jarjou, LM; Moore, SE; Fulford, AJ; Prentice, A. Critical windows for nutritional interventions against stunting. Am J Clin Nutr. 2013, 97(5), 911–8. [Google Scholar] [CrossRef]
- Harvey, CA; Rakotobe, ZL; Rao, NS; Dave, R; Razafimahatratra, H; Rabarijohn, RH; et al. Extreme vulnerability of smallholder farmers to agricultural risks and climate change in Madagascar. Philos Trans R Soc Lond B Biol Sci. 2014, 369(1639), 20130089. [Google Scholar]
Figure 1.
Conceptual framework of Coexisting forms of malnutrition.

Figure 2.
Nutritional outcome and their types assessed in this study.

Figure 3.
Steps for handling and managing the Demographic Health Surveys (DHS) and Multiple Indicator Cluster Surveys (MICS) dataset.
Figure 3.
Steps for handling and managing the Demographic Health Surveys (DHS) and Multiple Indicator Cluster Surveys (MICS) dataset.


Table 1.
Scenario-based projections of GNTs to 2030 among children under five across LMICs.
| Survey period | Stunting | Wasting | Obesity | ||||
|---|---|---|---|---|---|---|---|
| Prevalence | Status | Prevalence | Status | Prevalence | Status | ||
| African Region (AFRO) | |||||||
| Benin | 2012 | 44.6 | ↓ | 26.1 | ↓ | 9 | ↓ |
| 2018 | 32.7 | 5.3 | 3.8 | ||||
| 2030 | 17.6 | 0.2 | 0.7 | ||||
| Burundi | 2010 | 55.7 | ↑ | 5.3 | ↓ | 5.4 | ↑ |
| 2016 | 55.2 | 3.4 | 5.4 | ||||
| 2030 | 54.1 | 1.2 | 5.4 | ||||
| Burkina Faso | 2014 | 35.2 | ↓ | 12.9 | ↓ | 6.4 | ↓ |
| 2021 | 22.4 | 9.3 | 3.8 | ||||
| 2030 | 13.3 | 6.1 | 1.9 | ||||
| Cameron | 2011 | 32.7 | ↓ | 7.1 | ↑ | 6.6 | ↑ |
| 2022 | 29.2 | 7.9 | 8.3 | ||||
| 2030 | 27.8 | 8.5 | 9.8 | ||||
| Chad | 2010 | 40.1 | ↓ | 9.8 | ↓ | 6.3 | ↑ |
| 2019 | 31.9 | 12.4 | 7.7 | ||||
| 2030 | 25.9 | 16.4 | 9.8 | ||||
| Comoros | 2012 | 28.6 | ↓ | 15.4 | ↓ | 6.8 | ↓ |
| 2022 | 16.9 | 4 | 0.8 | ||||
| 2030 | 12.9 | 1.4 | 0.1 | ||||
| Congo | 2012 | 31.1 | ↓ | 7.8 | ↓ | 4.3 | ↓ |
| 2015 | 21 | 6 | 2.2 | ||||
| 2030 | 4.7 | 1.6 | 0.1 | ||||
| Cote de Ivore | 2012 | 44.9 | ↓ | 9 | ↑ | 6.3 | ↑ |
| 2021 | 37.5 | 10.2 | 5.8 | ||||
| 2030 | 30.5 | 11.6 | 5.3 | ||||
|
DRC |
2010 | 27.1 | ↓ | 11.7 | ↓ | 4.6 | ↓ |
| 2018 | 19.7 | 5.6 | 3.3 | ||||
| 2030 | 12.4 | 1.9 | 2 | ||||
|
Eswatini |
2010 | 28.4 | ↓ | 11.1 | ↓ | 4.9 | ↓ |
| 2022 | 19.9 | 5.7 | 3.8 | ||||
| 2030 | 14.6 | 3.7 | 3.2 | ||||
| Ethiopia | 2011 | 32.2 | ↓ | 10.2 | ↑ | 5.3 | ↓ |
| 2016 | 32 | 11.2 | 4.8 | ||||
| 2030 | 31.5 | 14.6 | 3.6 | ||||
|
Gambia |
2013 | 26.7 | ↓ | 3.7 | ↓ | 2.1 | ↓ |
| 2020 | 26.9 | 3.1 | 1.8 | ||||
| 2030 | 27.4 | 2.4 | 1.4 | ||||
|
Ghana |
2014 | 34.8 | ↓ | 9.6 | ↓ | 5.3 | ↓ |
| 2022 | 18.4 | 7.4 | 4.4 | ||||
| 2030 | 10.6 | 5.7 | 3.7 | ||||
| Guinea | 2012 | 40.5 | ↓ | 7.7 | ↓ | 5.8 | ↑ |
| 2018 | 38.4 | 4.4 | 5.9 | ||||
| 2030 | 34.9 | 1.4 | 6.1 | ||||
|
Guinea-Bissau |
2014 | 32.1 | ↑ | 7.7 | ↓ | 4.1 | ↑ |
| 2019 | 33.1 | 5.8 | 5 | ||||
| 2030 | 35.7 | 3.1 | 7.7 | ||||
|
Kenya |
2014 | 48.9 | ↓ | 8 | ↑ | 8.1 | ↓ |
| 2022 | 39.6 | 6.4 | 4.6 | ||||
| 2030 | 33.5 | 5.1 | 2.6 | ||||
| Lesotho | 2014 | 47.2 | ↓ | 9 | ↓ | 5.1 | ↓ |
| 2024 | 36.1 | 5.3 | 4.1 | ||||
| 2030 | 30.9 | 3.9 | 3.6 | ||||
|
Liberia |
2013 | 38.7 | ↓ | 11 | ↓ | 5.5 | ↓ |
| 2020 | 27.9 | 9 | 4.6 | ||||
| 2030 | 17.5 | 6.8 | 3.6 | ||||
|
Madagascar |
2009 | 27 | ↓ | 9.3 | ↑ | 4.1 | ↑ |
| 2021 | 25.8 | 10.5 | 4.3 | ||||
| 2030 | 25 | 11.5 | 4.5 | ||||
| Malawi | 2010 | 40.3 | ↓ | 9.4 | ↓ | 5.6 | ↓ |
| 2016 | 33.9 | 4.5 | 4.2 | ||||
| 2030 | 29.2 | 0.8 | 2.1 | ||||
| Mali | 2013 | 43.2 | ↓ | 16.9 | ↓ | 8.1 | ↓ |
| 2018 | 37.2 | 5.6 | 5.1 | ||||
| 2030 | 35 | 0.4 | 1.7 | ||||
| Mauritania | 2011 | 41 | ↑ | 5.4 | ↓ | 2.7 | ↓ |
| 2015 | 43.2 | 4.3 | 2.8 | ||||
| 2030 | 49.4 | 1.8 | 3.2 | ||||
| Mozambique | 2011 | 28.1 | ↓ | 6.9 | ↑ | 3.8 | ↓ |
| 2023 | 25.6 | 6.1 | 2 | ||||
| 2030 | 24.9 | 5.7 | 1.4 | ||||
| Nigeria | 2013 | 44.5 | ↓ | 6.3 | ↓ | 5.4 | ↓ |
| 2018 | 34.7 | 4 | 4.8 | ||||
| 2030 | 21.9 | 1.3 | 3.6 | ||||
| Rwanda | 2013 | 17 | ↓ | 2.9 | ↑ | 1.2 | ↓ |
| 2020 | 13.2 | 3.5 | 0.7 | ||||
| 2030 | 9.42 | 4.6 | 0.3 | ||||
|
Sao Tome & Principe |
2014 | 21.5 | ↓ | 8.9 | ↑ | 4.2 | ↑ |
| 2019 | 20.5 | 9.5 | 4.2 | ||||
| 2030 | 19 | 11.1 | 4.2 | ||||
| Senegal | 2011 | 35.2 | ↓ | 14.8 | ↓ | 7.1 | ↓ |
| 2023 | 31.6 | 6.8 | 5.4 | ||||
| 2030 | 30.3 | 4.3 | 4.6 | ||||
| Sierra Leone | 2013 | 30.2 | ↓ | 0.5 | ↑ | 0.3 | ↑ |
| 2019 | 20.2 | 1.4 | 0.4 | ||||
| 2030 | 11.38 | 4.5 | 0.7 | ||||
| Togo | 2010 | 33.7 | ↓ | 2.6 | ↑ | 3 | ↓ |
| 2017 | 24.6 | 3.8 | 2 | ||||
| 2030 | 17.34 | 5.7 | 0.9 | ||||
| Uganda | 2011 | 33.5 | ↓ | 6.6 | ↓ | 4.8 | ↓ |
| 2019 | 29.5 | 5.2 | 4.1 | ||||
| 2030 | 25.3 | 3.8 | 3.3 | ||||
| Zambia | 2013 | 40.4 | ↓ | 9.1 | ↓ | 4.6 | ↓ |
| 2018 | 35.5 | 7 | 4.2 | ||||
| 2030 | 29 | 4.4 | 3.4 | ||||
| Zimbabwe | 2011 | 32.6 | ↑ | 6.2 | ↑ | 4.6 | ↑ |
| 2015 | 36.6 | 6.7 | 5.2 | ||||
| 2030 | 56.6 | 8.8 | 8.2 | ||||
| American Region (AMRO) | |||||||
| Haiti | 2012 | 23.7 | ↓ | 6.2 | ↓ | 4.2 | ↓ |
| 2017 | 22.9 | 5.4 | 3.7 | ||||
| 2030 | 21.3 | 3.77 | 2.7 | ||||
| Honduras | 2012 | 27 | ↓ | 3.1 | ↓ | 5.4 | ↓ |
| 2019 | 19.8 | 1.3 | 0.5 | ||||
| 2030 | 12.9 | 0.5 | 0.1 | ||||
| Eastern Mediterranean Region (EMRO) | |||||||
|
Egypt |
2008 |
29.4 |
↓ |
17.7 |
↑ |
9 |
↓ |
| 2014 | 21 | 17.2 | 7.3 | ||||
| 2030 | 9.3 | 30.5 | 4.2 | ||||
| Jordan | 2012 | 8.8 | ↓ | 3 | ↑ | 4.3 | ↑ |
| 2023 | 9.3 | 4.6 | 7 | ||||
| 2030 | 10.66 | 6.6 | 9.5 | ||||
| Pakistan | 2012 | 45.2 | ↓ | 11.1 | ↓ | 6.3 | ↓ |
| 2017 | 38.5 | 6.9 | 4.2 | ||||
| 2030 | 30.9 | 3.6 | 1.5 | ||||
| Palestine | 2010 | 11 | ↓ | 4.4 | ↓ | 4.2 | ↑ |
| 2020 | 8.8 | 3 | 8.2 | ||||
| 2030 | 7.23 | 2.4 | 16.1 | ||||
| Sudan | 2010 | 35.8 | ↑ | 9.9 | ↓ | 6.3 | ↑ |
| 2014 | 39.8 | 8.7 | 6.7 | ||||
| 2030 | 61.3 | 5.2 | 8.6 | ||||
| Tunisia | 2011 | 10.5 | ↑ | 2.3 | ↑ | 0.2 | ↑ |
| 2023 | 12.6 | 2.9 | 0.2 | ||||
| 2030 | 14 | 3.3 | 0.2 | ||||
| Yemen | 2013 | 46.8 | ↑ | 12.1 | ↓ | 7.7 | ↑ |
| 2023 | 48.8 | 9.5 | 8.9 | ||||
| 2030 | 51.4 | 8.7 | 9.8 | ||||
| European Region (EURO) | |||||||
| Kyrgyzstan | 2014 | 13.2 | ↓ | 2 | ↑ | 0.2 | ↓ |
| 2018 | 10.8 | 2 | 0 | ||||
| 2030 | 6.2 | 2 | 0 | ||||
|
Tajikistan |
2012 | 26.2 | ↓ | 12.9 | ↓ | 4.3 | ↓ |
| 2017 | 19.6 | 8.6 | 3.4 | ||||
| 2030 | 9.4 | 3 | 1.8 | ||||
| Southeast Asian Region (SEARO) | |||||||
|
Bangladesh |
2011 |
41.5 |
↓ |
10.2 |
↑ |
8.6 |
↓ |
| 2022 | 24.5 | 9.5 | 5.2 | ||||
| 2030 | 16.7 | 9.1 | 3.6 | ||||
| India | 2015 | 39.4 | ↓ | 16.2 | ↑ | 8 | ↓ |
| 2021 | 36.8 | 16.7 | 6.8 | ||||
| 2030 | 34.7 | 18.4 | 5.3 | ||||
| Nepal | 2011 | 42.9 | ↓ | 7.8 | ↓ | 5.6 | ↓ |
| 2022 | 28.4 | 5.8 | 4.5 | ||||
| 2030 | 21 | 4.7 | 3.8 | ||||
|
Timor-Leste |
2010 | 57.9 | ↓ | 16.3 | ↑ | 8.9 | ↑ |
| 2016 | 47.4 | 20.4 | 10.1 | ||||
| 2030 | 32.2 | 35.2 | 13.6 | ||||
| Western Pacific Region (WPRO) | |||||||
| Laos | 2012 | 46.2 | ↓ | 3.6 | ↑ | 3 | ↑ |
| 2017 | 33.3 | 7.4 | 3.1 | ||||
| 2030 | 19.5 | 48.6 | 3.4 | ||||
Where, ↓ = projected malnutrition prevalence will likely reach GNT by 2030, ↓ = projected malnutrition prevalence will be trending down but will likely be above the defined GNTs, ↑ = projected malnutrition prevalence will likely be above the defined GNTs, and ↑ = projected malnutrition prevalence will likely increase but would remain under the defined GNTs.
Table 2.
Scenario-based projections of standalone and coexisting forms of malnutrition to 2030 among children under five across LMICs.
Table 2.
Scenario-based projections of standalone and coexisting forms of malnutrition to 2030 among children under five across LMICs.
| Survey period | Malnutrition | Stunting | Wasting | Obesity | CSO | CWS | |
|---|---|---|---|---|---|---|---|
| Prevalence | Prevalence | Prevalence | Prevalence | Prevalence | Prevalence | ||
| Benin | 2012 | 62.7 | 27.6 | 13.3 | 4.8 | 4.2 | 12.8 |
| 2018 | 38.5 | 29.4 | 4.6 | 1.2 | 2.6 | 0.7 | |
| 2030 | 35.4 | 33.4 | 0.6 | 0.4 | 1 | 0 | |
| Burundi | 2010 | 59.9 | 49.2 | 3.3 | 0.9 | 4.5 | 2 |
| 2016 | 58.6 | 49.8 | 2.6 | 0.8 | 4.6 | 0.8 | |
| 2030 | 58.3 | 51.0 | 1.8 | 0.6 | 4.8 | 0.1 | |
| Burkina Faso | 2014 | 47.8 | 28.5 | 11.5 | 1.1 | 5.3 | 1.4 |
| 2021 | 31.7 | 18.6 | 8.5 | 0.8 | 3 | 0.8 | |
| 2030 | 19.6 | 11.5 | 5.8 | 0.5 | 1.4 | 0.4 | |
| Cameron | 2011 | 41.1 | 27.4 | 4.5 | 3.9 | 2.7 | 2.6 |
| 2022 | 39.6 | 23.4 | 3.7 | 6.7 | 1.6 | 4.2 | |
| 2030 | 41 | 20.8 | 3.2 | 10 | 1.1 | 5.9 | |
| Chad | 2010 | 49.9 | 33.8 | 9.8 | 0 | 6.3 | 0 |
| 2019 | 44.3 | 24.2 | 12.4 | 0 | 7.7 | 0 | |
| 2030 | 33.5 | 16.1 | 7.6 | 0 | 9.8 | 0 | |
| Comoros | 2012 | 43.6 | 21.4 | 10.8 | 4.2 | 2.6 | 4.6 |
| 2022 | 20.9 | 16.1 | 4 | 0.0 | 0.8 | 0 | |
| 2030 | 14.5 | 12.6 | 1.6 | 0 | 0.3 | 0 | |
| Congo | 2012 | 39.1 | 27 | 6.4 | 1.6 | 2.7 | 1.4 |
| 2015 | 27 | 18.8 | 6 | 0 | 2.2 | 0 | |
| 2030 | 9.3 | 3.9 | 4.6 | 0 | 0.8 | 0 | |
| Cote de Ivore | 2012 | 53.9 | 38.6 | 8.1 | 0.9 | S | 0.9 |
| 2021 | 47.9 | 31.9 | 9.2 | 1.2 | 4.6 | 1 | |
| 2030 | 43.2 | 25.5 | 11.1 | 1.6 | 3.9 | 1.1 | |
| DRC |
2010 | 38.2 | 21.9 | 10 | 1.1 | 3.5 | 1.7 |
| 2018 | 26.5 | 17.6 | 5.3 | 1.5 | 1.8 | 0.3 | |
| 2030 | 17.2 | 11.8 | 2.4 | 2.4 | 0.6 | 0 | |
| Eswatini |
2010 | 39.8 | 23.8 | 8.8 | 2.6 | 2.3 | 2.3 |
| 2022 | 26.7 | 17.2 | 5.3 | 1.5 | 2.3 | 0.4 | |
| 2030 | 18.9 | 12.2 | 3.3 | 1 | 2.3 | 0.1 | |
| Ethiopia | 2011 | 42.6 | 27.1 | 8.5 | 1.9 | 3.4 | 1.7 |
| 2016 | 42.1 | 26.1 | 7.9 | 2.2 | 2.6 | 3.3 | |
| 2030 | 55 | 23.5 | 6.7 | 3.3 | 1.2 | 20.3 | |
| Gambia |
2013 | 30.4 | 24.6 | 3.7 | 0 | 2.1 | 0 |
| 2020 | 30 | 25.1 | 3.1 | 0 | 1.8 | 0 | |
| 2030 | 29.9 | 26.0 | 2.5 | 0 | 1.4 | 0 | |
| Ghana |
2014 | 44.2 | 29.3 | 6.9 | 2.5 | 2.8 | 2.7 |
| 2022 | 27.3 | 15.5 | 6.8 | 2.1 | 2.3 | 0.6 | |
| 2030 | 19 | 8.6 | 6.7 | 1.7 | 1.9 | 0.1 | |
| Guinea | 2012 | 49 | 35.5 | 4.4 | 4.1 | 1.7 | 3.3 |
| 2018 | 44.5 | 34.2 | 1.9 | 4.2 | 1.7 | 2.5 | |
| 2030 | 40 | 31.8 | 0.7 | 4.4 | 1.7 | 1.4 | |
| Guinea-Bissau |
2014 | 40 | 28.2 | 6.3 | 1.6 | 2.5 | 1.4 |
| 2019 | 39.8 | 29 | 4.1 | 2.6 | 2.4 | 1.7 | |
| 2030 | 46 | 30.9 | 2.9 | 7.4 | 2.2 | 2.6 | |
| Kenya |
2014 | 53.9 | 37.8 | 3.9 | 1.1 | 7 | 4.1 |
| 2022 | 45.9 | 34.9 | 5.4 | 0.9 | 3.7 | 1 | |
| 2030 | 41.7 | 31.4 | 7.5 | 0.7 | 1.9 | 0.2 | |
| Lesotho | 2014 | 54 | 39.9 | 3.9 | 2.9 | 2.2 | 5.1 |
| 2024 | 41.8 | 32.4 | 3.3 | 2.4 | 1.7 | 2 | |
| 2030 | 35.9 | 28.4 | 2.9 | 2.1 | 1.4 | 1.1 | |
| Liberia |
2013 | 49.1 | 32.6 | 9.6 | 0.8 | 4.7 | 1.4 |
| 2020 | 36.7 | 23.1 | 7.8 | 1 | 3.6 | 1.2 | |
| 2030 | 25 | 14.2 | 6.1 | 1.4 | 2.4 | 0.9 | |
| Madagascar |
2009 | 36.3 | 22.9 | 9.3 | 0 | 4.1 | 0 |
| 2021 | 36.3 | 21.5 | 10.5 | 0 | 4.3 | 0 | |
| 2030 | 37.1 | 20.5 | 12.1 | 0 | 4.5 | 0 | |
| Malawi | 2010 | 48.6 | 33.6 | 4.9 | 3.4 | 2.2 | 4.5 |
| 2016 | 39.2 | 30.5 | 3.1 | 2.2 | 2 | 1.4 | |
| 2030 | 31.8 | 27.5 | 1.9 | 0.7 | 1.6 | 0.1 | |
| Mali | 2013 | 57.4 | 32.4 | 11 | 3.2 | 4.9 | 5.9 |
| 2018 | 43.2 | 32.5 | 4.8 | 1.2 | 3.9 | 0.8 | |
| 2030 | 36.8 | 32.8 | 1.7 | 0.1 | 2.2 | 0 | |
| Mauritania | 2011 | 46.4 | 38.3 | 5.4 | 0 | 2.7 | 0 |
| 2015 | 47.5 | 40.4 | 4.3 | 0 | 2.8 | 0 | |
| 2030 | 55.4 | 49.3 | 2.9 | 0 | 3.2 | 0 | |
| Mozambique | 2011 | 35.4 | 24.7 | 5.4 | 1.9 | 1.9 | 1.5 |
| 2023 | 31.7 | 23.6 | 6.1 | 0 | 2 | 0.0 | |
| 2030 | 31.5 | 22.9 | 6.6 | 0 | 2 | 0 | |
| Nigeria | 2013 | 50.6 | 38.9 | 2.7 | 3.4 | 2 | 3.6 |
| 2018 | 40.4 | 31.6 | 2 | 3.7 | 1.1 | 2.0 | |
| 2030 | 27.7 | 21.2 | 1.3 | 4.5 | 0.2 | 0.5 | |
| Rwanda | 2013 | 19.9 | 15.8 | 2.9 | 0 | 1.2 | 0 |
| 2020 | 16.7 | 12.5 | 3.5 | 0 | 0.7 | 0 | |
| 2030 | 14.02 | 9.1 | 4.6 | 0 | 0.32 | 0 | |
| Sao Tome & Principe | 2014 | 31.2 | 18.1 | 8.6 | 1.1 | 3.1 | 0.3 |
| 2019 | 30.6 | 16.9 | 9.3 | 0.8 | 3.4 | 0.2 | |
| 2030 | 30.4 | 14.8 | 11.0 | 0.4 | 4.1 | 0.1 | |
| Senegal | 2011 | 49 | 27.1 | 9.6 | 4.2 | 2.9 | 5.2 |
| 2023 | 38.9 | 26.7 | 4.7 | 2.6 | 2.8 | 2.1 | |
| 2030 | 34.8 | 26.4 | 2.6 | 1.9 | 2.7 | 1.2 | |
| Sierra Leone | 2013 | 30.7 | 29.9 | 0.5 | 0 | 0.3 | 0 |
| 2019 | 21.6 | 19.8 | 1.4 | 0 | 0.4 | 0 | |
| 2030 | 15.88 | 10.8 | 4.5 | 0 | 0.58 | 0 | |
| Togo | 2010 | 36.3 | 30.7 | 2.6 | 0 | 3 | 0 |
| 2017 | 28.4 | 22.6 | 3.8 | 0 | 2 | 0 | |
| 2030 | 23.04 | 16.4 | 5.7 | 0 | 0.94 | 0 | |
| Uganda | 2011 | 40.5 | 29.1 | 4.8 | 2.2 | 2.6 | 1.8 |
| 2019 | 36 | 26.7 | 3.9 | 2.6 | 1.5 | 1.3 | |
| 2030 | 31.5 | 23.8 | 3 | 3.2 | 0.7 | 0.8 | |
| Zambia | 2013 | 48.7 | 35 | 5.8 | 2.5 | 2.1 | 3.3 |
| 2018 | 42.5 | 31.3 | 4.4 | 2.6 | 1.6 | 2.6 | |
| 2030 | 34.8 | 26.8 | 3 | 2.8 | 0.8 | 1.4 | |
| Zimbabwe | 2011 | 39.6 | 28.8 | 3.8 | 3.2 | 1.4 | 2.4 |
| 2015 | 44.8 | 32.9 | 4.3 | 3.9 | 1.3 | 2.4 | |
| 2030 | 68.3 | 50.3 | 6.4 | 8.2 | 1.0 | 2.4 | |
| Haiti | 2012 | 30.9 | 20.5 | 4.9 | 2.3 | 1.9 | 1.3 |
| 2017 | 29.4 | 20.3 | 4.2 | 2.3 | 1.4 | 1.2 | |
| 2030 | 26.4 | 19.7 | 2.8 | 2.3 | 0.63 | 0.97 | |
| Honduras | 2012 | 33.5 | 25.0 | 2.3 | 4.2 | 1.2 | 0.8 |
| 2019 | 21.1 | 19.3 | 1.3 | 0 | 0.5 | 0 | |
| 2030 | 13.4 | 12.8 | 0.5 | 0 | 0.1 | 0 | |
| Egypt | 2008 | 45 | 18.3 | 7.5 | 8.1 | 0.9 | 10.2 |
| 2014 | 38.1 | 13.6 | 10.8 | 6.3 | 1 | 6.4 | |
| 2030 | 41.2 | 6.2 | 28.7 | 3.2 | 1.3 | 1.8 | |
| Jordan | 2012 | 15 | 7.7 | 2.1 | 4.1 | 0.2 | 0.9 |
| 2023 | 18.5 | 6.9 | 2.3 | 6.9 | 0.1 | 2.3 | |
| 2030 | 22.66 | 6.4 | 2.4 | 9.6 | 0.06 | 4.2 | |
| Pakistan | 2012 | 52.8 | 35.4 | 5.9 | 1.7 | 4.6 | 5.2 |
| 2017 | 44.9 | 33.8 | 5.1 | 1.3 | 2.9 | 1.8 | |
| 2030 | 35 | 29.9 | 3.5 | 0.6 | 0.9 | 0.1 | |
| Palestine | 2010 | 17.8 | 9.2 | 2.9 | 3.9 | 0.3 | 1.5 |
| 2020 | 18.3 | 7.1 | 1.4 | 8.1 | 0.1 | 1.6 | |
| 2030 | 25.53 | 5.5 | 0.7 | 17.6 | 0.03 | 1.7 | |
| Sudan | 2010 | 45.7 | 29.5 | 9.9 | 0 | 6.3 | 0 |
| 2014 | 48.5 | 33.1 | 8.7 | 0 | 6.7 | 0 | |
| 2030 | 66.5 | 52.7 | 5.2 | 0 | 8.6 | 0 | |
| Tunisia | 2011 | 12.8 | 10.3 | 2.3 | 0 | 0.2 | 0 |
| 2023 | 15.5 | 12.4 | 2.9 | 0 | 0.2 | 0 | |
| 2030 | 17.3 | 13.8 | 3.3 | 0 | 0.2 | 0 | |
| Yemen | 2013 | 58.2 | 38.4 | 10.7 | 0.7 | 7 | 1.4 |
| 2023 | 58.3 | 39.9 | 9.5 | 0 | 8.9 | 0 | |
| 2030 | 60.1 | 40.9 | 8.7 | 0 | 10.5 | 0 | |
| Kyrgyzstan | 2014 | 15.2 | 13 | 2 | 0 | 0.2 | 0 |
| 2018 | 12.8 | 10.8 | 2 | 0 | 0 | 0 | |
| 2030 | 8.2 | 6.2 | 2 | 0 | 0 | 0 | |
| Tajikistan |
2012 | 38.6 | 21.4 | 10.0 | 2.4 | 1.9 | 2.9 |
| 2017 | 28.7 | 16.7 | 6.9 | 2.2 | 1.2 | 1.7 | |
| 2030 | 13.7 | 8.7 | 2.6 | 1.7 | 0.3 | 0.4 | |
| Bangladesh | 2011 | 51.9 | 33.1 | 9.5 | 0.9 | 7.7 | 0.7 |
| 2022 | 34.7 | 20.0 | 9.1 | 1.1 | 4.1 | 0.4 | |
| 2030 | 26.9 | 13.9 | 8.9 | 1.3 | 2.6 | 0.2 | |
| India | 2015 | 55 | 30.8 | 14.7 | 0.9 | 7.1 | 1.5 |
| 2021 | 52.5 | 29 | 14.4 | 1.3 | 5.5 | 2.3 | |
| 2030 | 50.8 | 26.5 | 13.9 | 2.2 | 3.7 | 4.5 | |
| Nepal | 2011 | 50.7 | 37.3 | 7.2 | 0.6 | 5.0 | 0.6 |
| 2022 | 35 | 24.7 | 5.6 | 1 | 3.5 | 0.2 | |
| 2030 | 27 | 18.2 | 4.6 | 1.4 | 2.7 | 0.1 | |
| Timor-Leste |
2010 | 71.7 | 46.5 | 12.9 | 0.9 | 8 | 3.4 |
| 2016 | 65.6 | 35.1 | 16.8 | 1.4 | 8.7 | 3.6 | |
| 2030 | 67.6 | 18.1 | 31.2 | 4.2 | 10.1 | 4.0 | |
| Laos | 2012 | 49.8 | 43.2 | 3.4 | 0.2 | 2.8 | 0.2 |
| 2017 | 40.7 | 30.2 | 6.9 | 0.5 | 2.6 | 0.5 | |
| 2030 | 68.1 | 11.9 | 43.1 | 5.5 | 2.1 | 5.5 |
Table 3.
Cross survey temporal assessment of standalone and coexisting forms of malnutrition among children under five across LMICs.
Table 3.
Cross survey temporal assessment of standalone and coexisting forms of malnutrition among children under five across LMICs.
| Variables | Stunting | Wasting | Obesity | CWS | CSO |
| Individual factors | |||||
| Age of child (in year) | 1.15 (1.14 to 1.15) * | 0.86 (0.86 to 0.87) * | 0.84 (0.83 to 0.85) * | 1.03 (1.02 to 1.03) * | 0.83 (0.82 to 0.84) * |
| Child sex: Female (reference) Male |
Ref 1.14 (1.13 to 1.15) * |
Ref 1.10 (1.08 to 1.11) * |
Ref 1.13 (1.09 to 1.16) * |
Ref 1.46 (1.43 to 1.48) * |
Ref 1.12 (1.08 to 1.15) * |
| Household factors | |||||
| Education: None Primary Secondary Higher (reference) |
2.19 (2.14 to 2.23) * 1.99 (1.94 to 2.03) * 1.41 (1.39 to 1.44) * Ref |
1.54 (1.50 to 1.59) * 1.19 (1.15 to 1.22) * 1.10 (1.07 to 1.12) * Ref |
0.79 (0.74 to 0.84) * 0.74 (0.69 to 0.78) * 0.71 (0.68 to 0.75) * Ref |
2.94 (2.79 to 3.09) * 2.21 (2.10 to 2.33) * 1.51 (1.44 to 1.59) * Ref |
1.41 (1.33 to 1.50) * 1.03 (0.96 to 1.09) 0.89 (0.84 to 0.94) * Ref |
| Wealth index Poorest Poorer Middle Richer Richest (reference) |
2.00 (1.96 to 2.04) * 1.73 (1.71 to 1.77) * 1.51 (1.48 to 1.54) * 1.27 (1.25 to 1.30) * Ref |
1.48 (1.26 to 1.73) * 1.24 (1.05 to 1.47) * 1.30 (1.10 to 1.54) * 1.20 (1.01 to 1.42) * Ref |
0.62 (0.59 to 0.69) * 0.68 (0.64 to 0.72) * 0.79 (0.75 to 0.83) * 0.82 (0.78 to 0.86) * Ref |
2.59 (2.48 to 2.70) * 1.95 (1.87 to 2.04) * 1.58 (1.51 to 1.65) * 1.29 (1.23 to 1.34) * Ref |
0.73 (0.44 to 1.21) 0.64 (0.37 to 1.11) 0.59 (0.33 to 1.05) 0.69 (0.40 to 1.18) Ref |
| Regional & Community factors | |||||
| Place of residence Rural Urban (reference) |
1.19 (1.17 to 1.21) * Ref |
1.04 (1.02 to 1.06) * Ref |
0.99 (0.95 to 1.03) Ref |
1.14 (1.11 to 1.17) * Ref |
1.13 (1.08 to 1.17) * Ref |
| Geographical regions AFRO AMRO EMRO EURO SEARO WPRO (reference) |
0.85 (0.83 to 0.87) * 0.52 (0.50 to 0.54) * 0.83 (0.81 to 0.86) * 0.49 (0.47 to 0.51) * 1.30 (1.27 to 1.34) * Ref |
1.24 (1.08 to 1.40) * 0.59 (0.46 to 0.75) * 1.73 (1.50 to 1.98) * 1.65 (1.39 to 1.97) * 3.65 (3.21 to 4.15) * Ref |
4.82 (3.99 to 5.84) * 6.00 (4.95 to 7.45) * 6.65 (5.49 to 8.06) * 3.00 (2.39 to 3.78) * 4.56 (3.76 to 5.51) * Ref |
1.05 (0.98 to 1.13) 0.32 (0.28 to 0.36) * 1.64 (1.51 to 1.76) * 0.36 (0.30 to 0.43) * 3.27 (3.05 to 3.51) * Ref |
2.70 (1.89 to 3.86) * 0.49 (0.24 to 1.04) 5.13 (3.58 to 7.36) * 3.90 (2.58 to 5.92) * 5.10 (3.59 to 7.28) * Ref |
| Temporal factor | |||||
| Year | 0.97 (0.97 to 0.98) * | 0.98 (0.98 to 0.98) * | 0.98 (0.97 to 0.98) * | 0.97 (0.97 to 0.97) * | 0.94 (0.94 to 0.94) * |
Table 4.
Interaction effects between survey year and selected covariates on standalone and coexisting forms of malnutrition among children under five in low- and middle-income countries (LMICs).
Table 4.
Interaction effects between survey year and selected covariates on standalone and coexisting forms of malnutrition among children under five in low- and middle-income countries (LMICs).
| Variables | Stunting | Wasting | Obesity | CWS | CSO |
| Individual factors | |||||
| Year * Age of child (in year) | 0.99 (0.99 to 0.99) * | 1.01 (1.01 to 1.01) * | 1.00 (0.99 to 1.00) | 0.99 (0.99 to 0.99) * | 0.98 (0.97 to 0.98) * |
| Child sex * Year Female (reference) Male |
Ref 0.99 (0.99 to 1.01) |
Ref 1.01 (0.99 to 1.01) |
Ref 1.00 (0.99 to 1.01) |
Ref 0.99 (0.99 to 1.00) |
Ref 1.01 (1.00 to 1.02) * |
| Household factors | |||||
| Education * Year None Primary Secondary Higher (reference) |
0.99 (0.99 to 1.00) 0.99 (0.98 to 0.99) * 0.99 (0.98 to 0.99) * Ref |
0.99 (0.98 to 0.99) * 0.99 (0.98 to 0.99) * 1.00 (0.99 to 1.01) Ref |
0.92 (0.90 to 0.93) * 0.99 (0.97 to 1.00) 1.00 (0.99 to 1.01) Ref |
0.95 (0.93 to 0.96) * 0.93 (0.92 to 0.95) * 0.98 (0.96 to 0.99) * Ref |
0.92 (0.91 to 0.94) * 0.98 (0.96 to 0.99) * 1.02 (1.01 to 1.04) * Ref |
| Wealth index * Year Poorest Poorer Middle Richer Richest (reference) |
0.98 (0.97 to 0.98) * 0.98 (0.97 to 0.98) * 0.98 (0.97 to 0.99) * 0.97 (0.96 to 0.97) * Ref |
1.01 (1.00 to 1.02) * 1.01 (0.99 to 1.01) 1.00 (0.99 to 1.01) * 1.00 (0.99 to 1.01) Ref |
0.98 (0.97 to 0.99) * 0.99 (0.98 to 1.01) 1.00 (0.99 to 1.01) 0.99 (0.98 to 1.00) Ref |
1.01 (0.99 to 1.05) 0.99 (0.99 to 1.00) 0.99 (0.99 to 1.00) 0.99 (0.99 to 1.00) Ref |
1.02 (1.01 to 1.04) * 1.01 (1.00 to 1.03) * 1.02 (1.00 to 1.03) * 1.00 (0.98 to 1.02) Ref |
| Regional & Community factors | |||||
| Place of residence * Year Rural Urban (reference) |
0.99 (0.99 to 1.00) Ref |
0.99 (0.99 to 1.00) Ref |
0.99 (0.99 to 1.00) Ref |
1.88 (1.88 to 1.89) * Ref |
1.01 (0.99 to 1.01) Ref |
| Geographical regions * Year AFRO AMRO EMRO EURO SEARO WPRO (reference) |
0.98 (0.97 to 0.99) * 1.02 (1.01 to 1.03) * 1.07 (1.06 to 1.08) * 0.97 (0.96 to 0.99) * 1.00 (0.99 to 1.01) Ref |
0.95 (0.94 to 0.97) * 0.97 (0.95 to 0.99) * 1.01 (0.99 to 1.02) 0.89 (0.88 to 0.92) * 0.99 (0.98 to 1.01) Ref |
1.10 (1.08 to 1.11) * 1.00 (0.98 to 1.02) * 1.07 (1.06 to 1.09) * 1.06 (1.03 to 1.10) * 1.13 (1.11 to 1.14) * Ref |
0.98 (0.96 to 0.98) * 1.02 (1.00 to 1.05) * 1.08 (1.06 to 1.09) * 0.99 (0.96 to 1.02) 0.98 (0.96 to 0.99) * Ref |
0.72 (0.67 to 0.76) * 0.69 (0.64 to 0.75) * 0.71 (0.66 to 0.76) * 0.64 (0.59 to 0.71) * 0.86 (0.81 to 0.92) * Ref |
Disclaimer/Publisher’s Note: The statements, opinions and data contained in all publications are solely those of the individual author(s) and contributor(s) and not of MDPI and/or the editor(s). MDPI and/or the editor(s) disclaim responsibility for any injury to people or property resulting from any ideas, methods, instructions or products referred to in the content. |
© 2026 by the authors. Licensee MDPI, Basel, Switzerland. This article is an open access article distributed under the terms and conditions of the Creative Commons Attribution (CC BY) license (http://creativecommons.org/licenses/by/4.0/).
Copyright: This open access article is published under a Creative Commons CC BY 4.0 license, which permit the free download, distribution, and reuse, provided that the author and preprint are cited in any reuse.


