Submitted:
03 March 2026
Posted:
04 March 2026
You are already at the latest version
Abstract
Tropical forests are predicted to become carbon sources by mid-century under climate change. However, this trajectory may not be inevitable for forests under long-term protection. Using 12 years of eddy covariance flux data from a strictly protected tropical forest in Xishuangbanna, China, we develop an explainable machine learning framework (SHAP + Structural Equation Modeling) to disentangle the environmental drivers of net ecosystem exchange (NEE) and evapotranspiration (ET), and project their future trajectories under four CMIP6 climate scenarios. We find a fundamental divergence: while conventional climate models predict a sink-to-source transition by 2050–2066, our data-driven model—trained on conservation-era observations—projects a persistent carbon sink through 2100 across all scenarios. This divergence suggests that long-term protection may buffer tropical forests against climate-driven decline, challenging the prevailing narrative of inevitable carbon loss. We further identify critical environmental thresholds—solar radiation (~200 W m⁻²) and air temperature (~25°C)—beyond which carbon uptake efficiency declines. Our findings provide empirical support for nature-based climate solutions and highlight the need to integrate conservation legacies into Earth system models.
Keywords:
Xishuangbanna Tropical Rainforest
; carbon and water fluxes
; explainable machine learning
; SHAP
; Structural Equation Modeling (SEM)
; CMIP6
1. Introduction
Tropical rainforest ecosystems serve as natural buffers against global climate change, playing a dual core role in the global carbon and water cycles Almeida. On one hand, tropical rainforests sequester approximately 1.6±0.5 Pg of carbon annually, constituting a critical carbon sink for the planet Xu. On the other hand, the intense evapotranspiration from tropical trees acts as a biological “pump”, transporting deep soil water to the atmosphere, which is irreplaceable for sustaining regional precipitation patterns and the global hydrological cycle Luiz. However, global warming and deforestation are diminishing the carbon sink strength and evapotranspiration of major rainforests, such as the Amazon Doughty. Rising temperatures not only increase plant respiratory carbon loss Du, and alter species composition Zhu, but also exacerbate atmospheric aridity and trigger extreme climatic events like heatwaves and droughts, thereby impacting rainforest ecological functions. For instance, soil moisture depletion due to excessive evaporation can induce water stress, potentially reducing photosynthetic rates Guan, and altering precipitation regimes and increased frequency of extreme droughts can lead to tree mortality Hubau. Extensive observational and modeling studies warn that if current trends persist, the functional degradation of rainforests driven by warming could transform them from carbon sinks into carbon sources by the mid-21st century Katharyn.
The Xishuangbanna tropical rainforest shares core characteristics with typical tropical rainforests, such as community structure and species composition Zhu. However, located at the northernmost edge of the Indo-Malayan rainforest region Zhou, it exhibits significant marginal and transitional properties. Consequently, it is more sensitive to climate change and is often regarded as a critical indicator for global rainforest ecosystems Alistair. Notably, against the backdrop of widespread functional decline in global tropical rainforests, the carbon sequestration capacity of the pristine Xishuangbanna rainforest ecosystem has maintained a steady annual increase of approximately 3.4% over the past two decades Liu. This observed phenomenon presented by Xishuangbanna offers a unique case for re-examining the responses of global tropical rainforests to future climate change.
The response of tropical forest carbon and water fluxes to environmental variables is highly complex. Previous studies have attributed the enhanced carbon sink in the Xishuangbanna rainforest to improved carbon use efficiency, highlighting increased dry-season solar radiation as a primary driver Liu. However, the enhancement of carbon sequestration capacity likely stems from more intricate physical processes driven by the synergistic effects of multiple environmental factors. Beyond the direct regulation of forest carbon uptake via photosynthesis by solar radiation Aguilos, meteorological factors such as air temperature, humidity, and wind speed also significantly influence ecosystem CO₂ exchange Wang. For instance, prolonged dry seasons Esquivel may induce drought stress, yet simultaneously lengthen the carbon absorption window, leading to divergent potential impacts on carbon sink capacity Dai. Warmer soils may also enhance soil carbon emissions Zhang. Furthermore, under global climate change, increased evaporative demand from a warmer atmosphere may accelerate soil moisture depletion, leading to surface drying Leander. Deforestation drastically reduces land surface evapotranspiration (ET), decreasing regional atmospheric moisture content and subsequently diminishing rainfall Qin. These changes not only affect the water balance of rainforests but may also fundamentally compromise rainforest functionality by altering vegetation structure Xu.
Although long-term in situ monitoring data from eddy covariance (EC) systems provide a foundation for analyzing the environmental responses of carbon and water fluxes Chang, disentangling the complex, non-linear influences of environmental variables on these fluxes remains challenging, specifically net ecosystem exchange (NEE) and evapotranspiration (ET). This is due to the high-dimensional interactions among variables, which obscure the identification of key drivers. Moreover, while physics-based models like those from CMIP6 offer crucial frameworks for projecting future ecosystem trajectories, their simulations of key ecological parameters (e.g., NEE, ET) at regional scales carry substantial uncertainties Shen, For example, CMIP6 models generally overestimate global ET, showing only a 55% consensus rate with the ERA5 dataset Sun, Direct reliance on uncorrected CMIP6 outputs can thus lead to biased conclusions.
Therefore, this study proposes an integrated analytical framework that combines explainable machine learning (ML), structural equation modeling (SEM), and CMIP6 data. We apply this framework to a two-decade-long dataset of carbon-water fluxes and multi-source environmental data from the Xishuangbanna tropical rainforest. The framework proceeds in three steps: First, we employ Pearson correlation coefficients to filter parameters within similar groups, then use explainable ML to quantitatively parse the independent contributions and interactive effects of multiple environmental drivers on NEE and ET. Second, based on the identified key variables, we construct SEMs to solve for the path coefficients representing their directed influences on NEE and ET. Finally, we predict the future trajectories of NEE and ET under different climate scenarios by applying the validated ML models to bias-corrected CMIP6 environmental variable data.
2. Materials and Methods
2.1. Study Site and Data Sources
The study was conducted in the Xishuangbanna Tropical Rainforest Nature Reserve, Yunnan Province, China (Figure 1), The reserve harbors four primary forest types: tropical rainforest, riparian tropical monsoon forest, tropical low-mountain evergreen broad-leaved forest on slopes, and tropical seasonal moist forest Zhu. A comprehensive soil-rainforest-atmosphere flux observation station was established within the reserve. This station integrates an eddy covariance (EC) flux system, a conventional meteorological measurement system, and a soil temperature and moisture monitoring network Liu, The station is situated in a relatively flat area within an approximately 2-km-long valley Zhang.
Carbon-water flux data and associated meteorological and soil data for Xishuangbanna from 2003 to 2015 were obtained from a publicly available dataset hosted by the National Ecosystem Science Data Center, China (http://www.nesdc.org.cn). This dataset comprises 28 variables, including evapotranspiration (ET), net ecosystem exchange (NEE), solar radiation, and air temperature above the canopy, with a temporal resolution of 30 minutes, amounting to over 200,000 records.
Meteorological data for the period 2015 to 2022 were acquired from the same center under a data use agreement . This dataset includes six categories of variables: radiation, air temperature, and relative humidity, among others, with a daily temporal resolution.
Climate projection data were sourced from the publicly accessible Coupled Model Intercomparison Project Phase 6 (CMIP6) archive (https://aims2.llnl.gov/search). We selected two global climate models (GCMs): MPI-ESM1-2-HR (at~1.875°×1.865°resolution) and BCC-CSM2-MR (at~1.125°×1.12°resolution). For each model, we utilized historical simulation data (covering 2003–2014) and future projections under four Shared Socioeconomic Pathways (SSPs): SSP1-2.6, SSP2-4.5, SSP3-7.0, and SSP5-8.5.
Appendix Table1 presents a cross-reference list of the abbreviations and full meanings for the variables used from the flux observation station data.
2.2. Study Framework
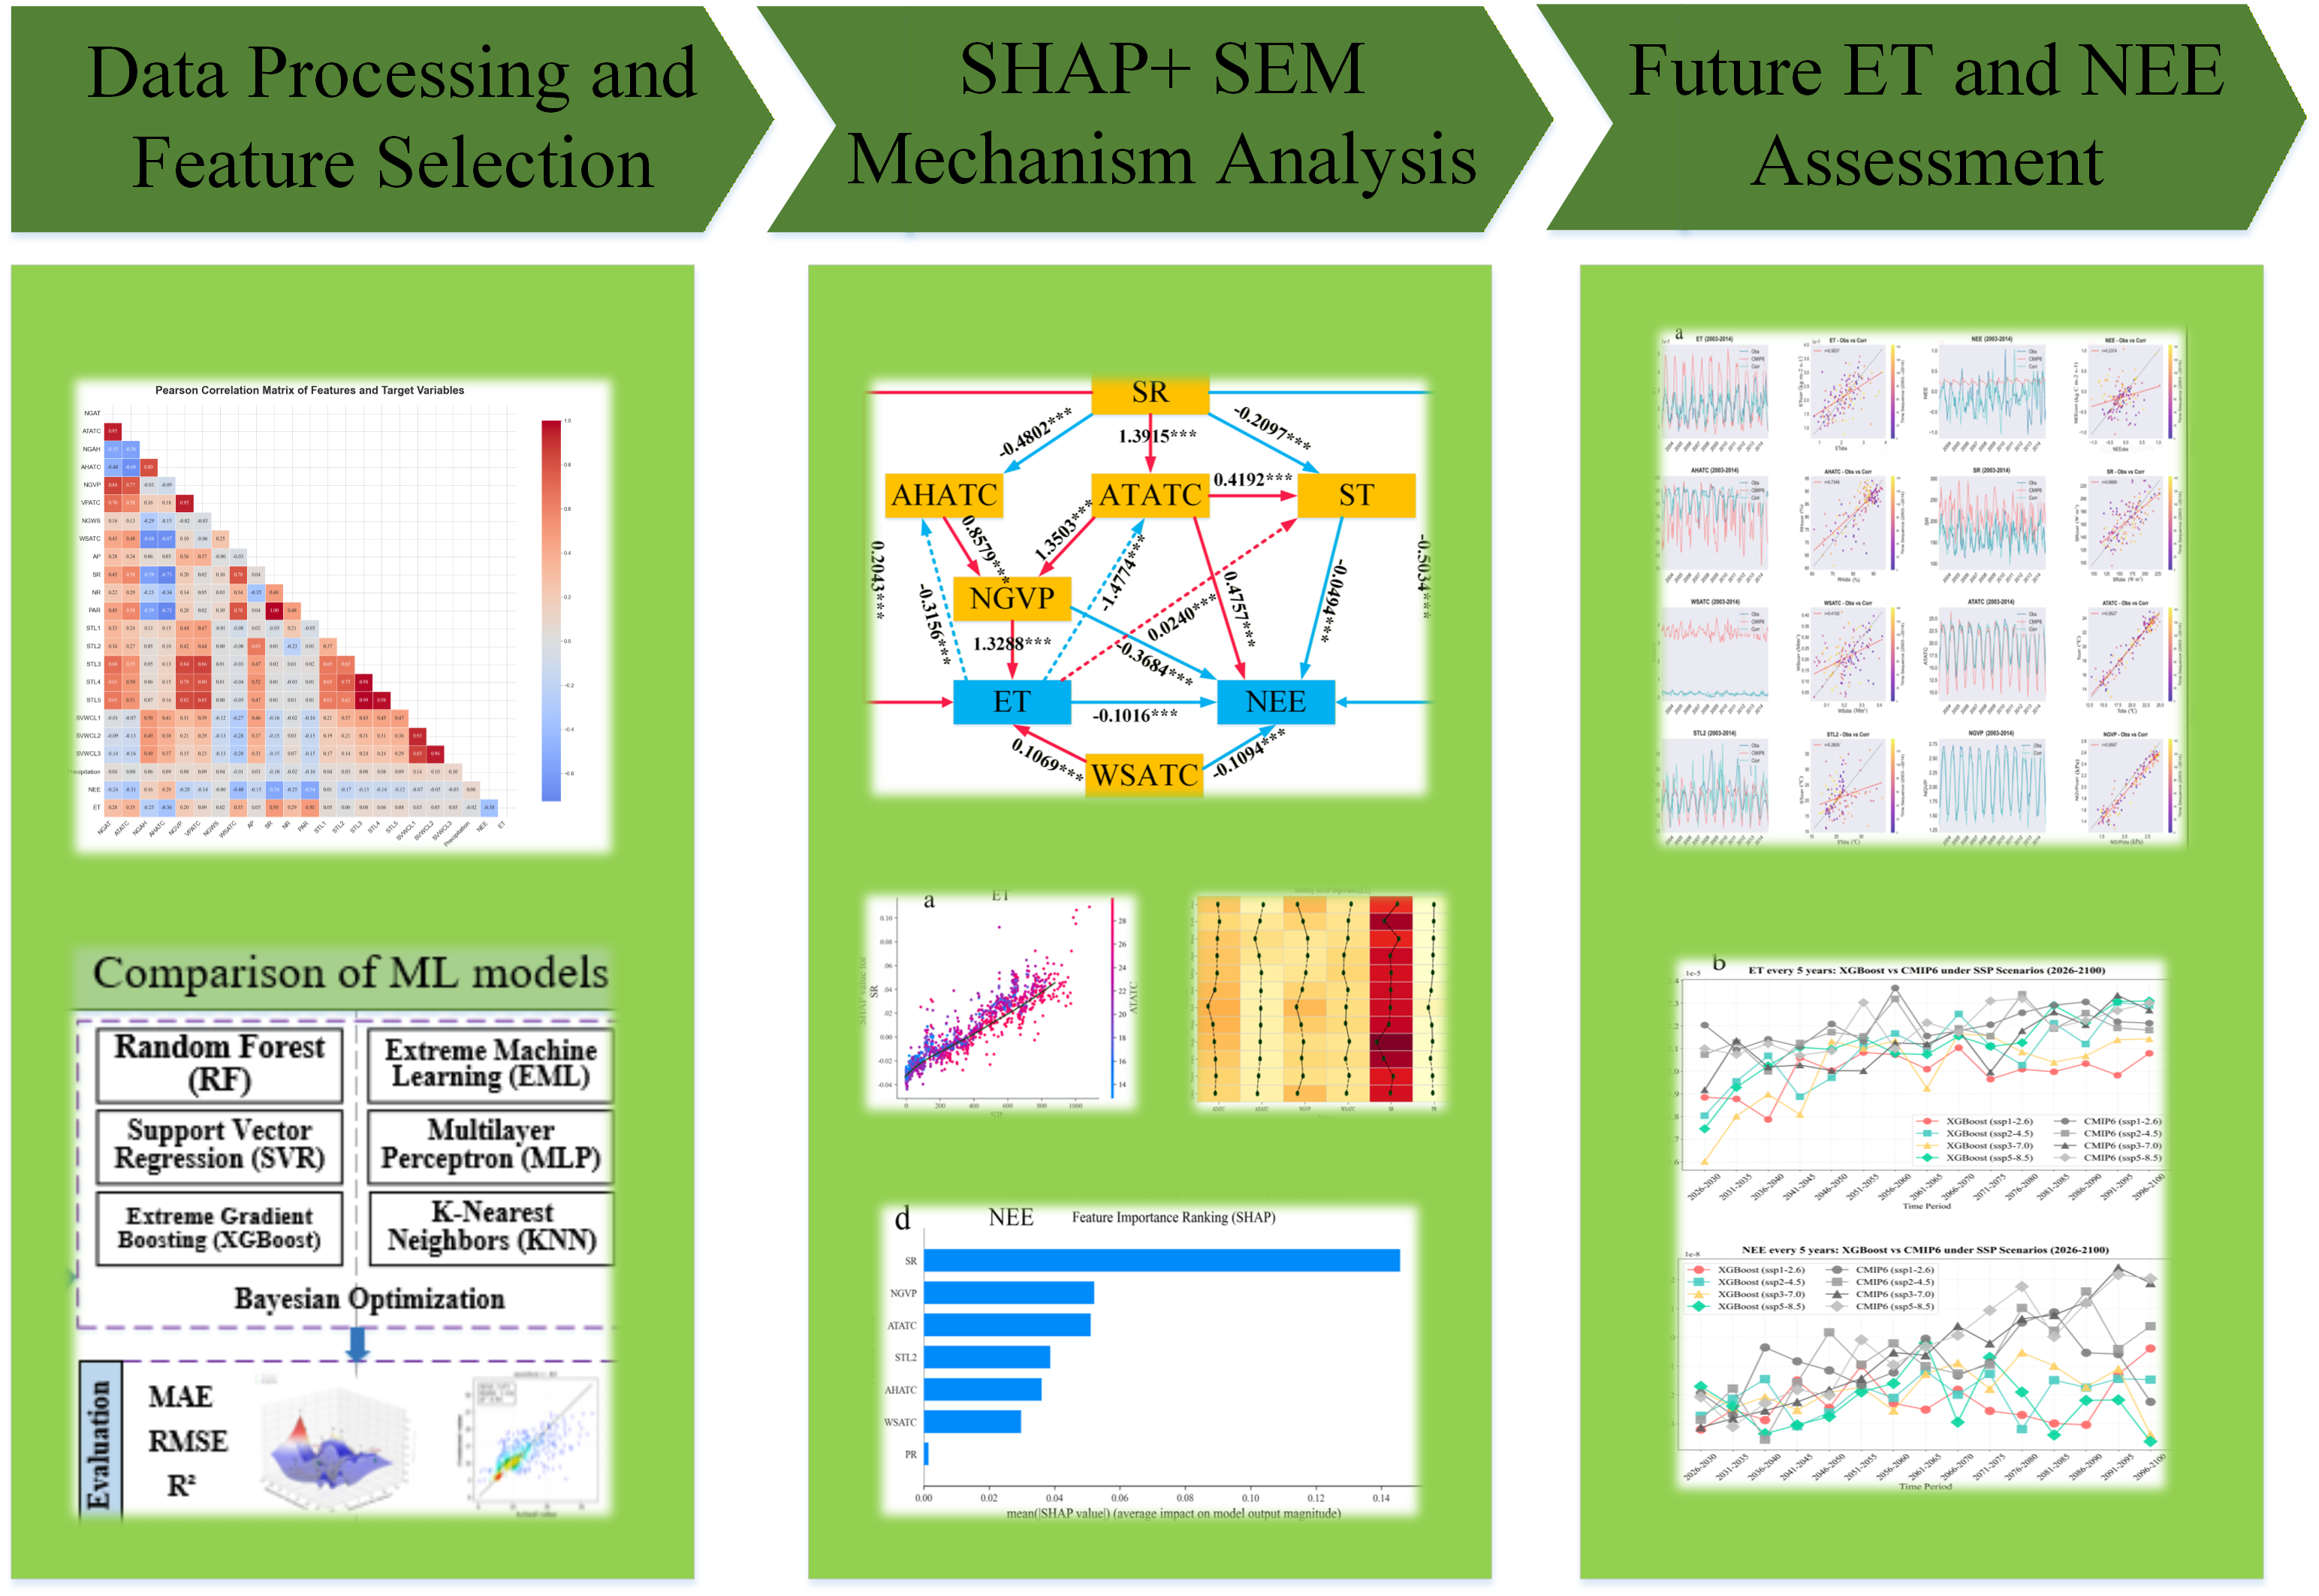
As illustrated in Figure 2, the analytical framework was divided into four parts: data collection and preprocessing, comparison of machine learning models, SHAP analysis, and prediction of future carbon sink and evapotranspiration capacity. Firstly, in situ carbon and water flux data, soil environmental data, and atmospheric environmental data were integrated. Data cleaning was performed to remove null values and anomalous data (e.g., -9999). After standardization, Pearson correlation coefficients (AppendixA(1)), were calculated among all variables. From variables of the same type, the one with the highest correlation with the target variable (ET or NEE) was selected as the representative feature for subsequent analysis; Subsequently, six machine learning models—RF, ELM, SVR, MLP, XGBoost, and KNN—were used to fit the dataset. The representative features served as input, with ET and NEE as separate outputs. All models employed Bayesian hyperparameter optimization to ensure a fair comparison. Model performance was evaluated using the root mean square error (RMSE), mean absolute error (MAE), and coefficient of determination (R²) (AppendixA formula , (2), (4)); The optimal model was selected to calculate sample SHAP values. Stratified sampling was used to accelerate the computation, and Jensen-Shannon (JS) divergence was applied to measure the consistency between the distribution of the sampled subset and the full dataset (JS < 0.05 indicated that the sample could represent the overall population). SHAP analysis and Partial Dependence Plots (PDP) were used to analyze the local contribution of individual variables to the prediction results and the interactions between variables. Feature importance ranking plots were used to screen key variables and analyze their monthly importance changes. Structural Equation Modeling (SEM) was employed to solve for the path coefficients of the impact of key variables on ET and NEE, clarifying the mechanism of environmental influences on the carbon sink and water cycle; Finally, based on environmental data from 2003 to 2022, probability distribution correction was applied to the environmental variables in CMIP6. Data after 2030 were input into the machine learning model to predict future ET and NEE, and the results were compared and evaluated with the original CMIP6 outputs.
2.3. SHAP Analysis and SEM-Based Causal Analysis
SHapley Additive exPlanations (SHAP) is a widely used analytical tool for interpreting the prediction mechanism of machine learning models. It calculates the marginal contribution (the SHAP value) of each variable to the prediction outcome for every individual sample Scott. The formula for calculating the SHAP value is as follows:
Where S is a subset of all features excluding xi, n is the total number of features, and f(x) is the model output. used to adjust the weights of different features to ensure fairness in the model.
The statistical characteristics of SHAP values were analyzed through visualization to interpret interactions among variables. Common graphical tools include the SHAP Summary Plot (SP), which ranks features by their global importance, and Partial Dependence Plots (PDPs), which illustrate the marginal effect of one or two variables with different values on the model predictions.
Structural Equation Modeling (SEM) is a causal analysis method commonly employed in ecology Grace, It constructs candidate models based on theoretical understanding, which are then iteratively validated and optimized to derive a path diagram that reflects causal relationships. This technique integrates factor analysis and path analysis to examine and estimate complex causal relationships among multiple variables Kenneth. SEM evaluates whether the proposed network of influence paths fits the observed data through fit indices, moving beyond merely testing individual coefficients. Explainable machine learning provides powerful, data-driven prior insights for establishing causal testing models by pre-screening and prioritizing the most critical driving factors Sun. Therefore, we combined SHAP analysis with SEM to uncover the key response mechanisms of environmental variables on ET and NEE.
2.4. Stratified Sampling and Jensen-Shannon Divergence
The computation of SHAP values for the entire large data size imposes a substantial computational burden. Therefore, a stratified sampling approach was adopted to alleviate this load. Following the rule of randomly sampling 100 data points per month, a subset of 1,200 samples was selected from the massive dataset to form a representative sub-dataset. A schematic of the sampling procedure is provided in Appendix Figure 1a.
The Jensen-Shannon (JS) divergence is a method commonly used in machine learning to measure the similarity between two probability distributions Pedro, It is derived from the Kullback-Leibler (KL) divergence and addresses the asymmetry issue inherent in the KL divergence (KL(P||Q)≠KL(Q||P), providing a more accurate reflection of distributional similarity. The formulas are defined as follows:
Here, Q represents the original sample population, with Q(x) denoting its probability distribution. P represents the stratified sampling subset, with P(x) denoting its probability distribution. The value range of JS divergence is [0, 1]. A value closer to 0 indicates greater similarity between the two distributions, while a value of 1 indicates complete dissimilarity.
2.5. Probability Distribution Correction of CMIP6 Data
In climate change impact studies, direct use of raw outputs from CMIP6 global climate models is subject to systematic biases. Therefore, applying bias correction to the data is a necessary step for generating reliable regional climate information Syukri. The core objective is to adjust the probability distribution of the CMIP6-simulated variables to align with the distribution of observed data.
In this study, quantile delta mapping was employed to achieve this goal, with the procedure illustrated in Appendix Figure 1b. A transfer function was constructed by matching quantiles between historical observed data and CMIP6-simulated historical data. For any future CMIP6 data point, its quantile position τ within the future simulated data series is first determined. Based on τ, the corresponding value from the historical CMIP6 simulations is identified. This value is then mapped to its observational counterpart. Finally, the difference between the future simulated value and its corresponding historical simulated value at quantile τ is added Qin. The formula is expressed as:
This method corrects the probability distribution of the simulated values to match the observations while preserving the relative climate change signal predicted by the model. Here, xcorris the bias-corrected future value, x is the raw future CMIP6 simulated value, F denotes the cumulative distribution function, and F−1 denotes the quantile function. The subscripts obs, hist, and fut denote historical observations, historical CMIP6 simulations, and future CMIP6 simulations, respectively.
3. Results and Analysis
3.1. Representative Feature Selection
Pearson correlation coefficients were calculated among the 23 observed variables. Figure 3 presents the correlation matrix heatmap. The 21 variables (excluding ET and NEE) were categorized into nine types: air temperature, air humidity, vapor pressure, wind speed, atmospheric pressure, radiation, soil temperature, soil moisture, and precipitation. The heatmap reveals high correlation coefficients among variables within the same group, indicating strong linear dependencies.
To reduce multicollinearity and model complexity, a representative feature was selected from each variable type for subsequent modeling. The selection criterion was based on the feature's absolute correlation coefficient with the target variable (ET or NEE). The variable exhibiting the strongest correlation within each group was chosen. A correlation threshold of |ρ| < 0.1 was applied to exclude features considered uncorrelated with the target. Based on this process, the following representative features were selected:
For ET: ATATC (ρ = 0.35), AHATC (ρ = -0.36), NGVP (ρ = 0.20), WSATC (ρ = 0.35), SR (ρ = 0.50), and PR (ρ = 0.08).
For NEE: ATATC (ρ = -0.31), AHATC (ρ = 0.29), NGVP (ρ = -0.20), WSATC (ρ = -0.40), AP (ρ = -0.15), SR (ρ = -0.54), STL2 (ρ = -0.17), and PR (ρ = -0.02).
The ET dataset and NEE dataset are constructed based on the representative features and target variables.
3.2. Optimal Model Selection for ML
The ET and NEE datasets were split into training and test sets with an 8:2 ratio. The training set was used for model fitting and optimization, while the test set was reserved for evaluating model performance. As shown in Figure 4, XGBoost outperformed the other models for predicting both ET and NEE. For ET prediction, XGBoost achieved a mean absolute error (MAE) of 0.025, a root mean square error (RMSE) of 0.037, and a coefficient of determination (R²) of 0.403. For NEE prediction, it achieved an MAE of 0.171, an RMSE of 0.240, and an R² of 0.464, indicating a reasonably good fit. To ensure a fair comparison and avoid bias in model selection due to parameter settings, Bayesian hyperparameter optimization was employed during training to automatically search for the optimal performance of each model. The search spaces for the hyperparameters are detailed in Appendix A Table 2. Based on its superior performance, XGBoost was selected as the optimal model for all subsequent explainability analysis. The optimized hyperparameter set identified for XGBoost was used for its final training.
3.3. Explainable ML Analysis
Based on the stratified sampling method, a subset of 1,200 samples was selected, and their SHAP values were computed to analyze the marginal contributions of environmental variables to the predictions of ET and NEE. Figure 5 illustrates the distribution of the sampled data compared to the full dataset. The distribution of ET is markedly right-skewed with a long tail, exhibiting a skewness of 2.17. The Jensen-Shannon (JS) divergence between the sampled subset and the full ET dataset is 0.05, indicating a high degree of distributional similarity. In contrast, the distribution of NEE approximates a normal distribution, with a skewness of only -0.07. The JS divergence for the NEE distributions is 0.0426, also confirming a high degree of similarity. Therefore, the stratified sample of 1,200 instances is representative of the original dataset.
Based on the stratified sample, SHAP values were calculated to rank the marginal contributions of each variable to the model predictions, Figure 6 presents this ranking. For ET prediction, the four most influential variables are Solar Radiation (SR), Air Temperature Above the Canopy (ATATC), Near-Ground Vapor Pressure (NGVP), and Wind Speed Above the Canopy (WSATC). For NEE prediction, the top four contributors are SR, NGVP, ATATC, and Soil Temperature at 10 cm depth (STL2). The key variables for both fluxes show significant overlap. Notably, the marginal contribution of SR to both ET and NEE predictions far exceeds that of all other variables, while Precipitation (PR) shows the smallest marginal contribution (Figure6b, d). Furthermore, Figure 6a, bindicate that, aside from SR and PR which exhibit a generally positive contribution to ET, other environmental variables do not show a consistent directional bias (positive or negative) in their marginal contributions to the target predictions. To elucidate the ecological significance of this ranking, we interpret the results in the context of established ecophysiological processes. In rainforest ecosystems, SR serves as the primary energy source, driving both the water and carbon cycles Yu. This driving force operates through two principal pathways: i) the direct effect of SR on vegetation physiology, and ii) indirect effects mediated through SR-induced changes in atmospheric and soil thermal conditions.
Firstly, SR directly governs evaporation and photosynthesis, thereby influencing ET and NEE Marcos. The atmosphere acts as a medium for radiation transfer; its temperature and humidity are directly affected by radiation Wazwaz, Vapor pressure (VP), a latent variable derived from temperature and relative humidity, influences stomatal aperture in rainforest plants. This, in turn, affects transpiration and photosynthesis, thereby impacting ET and NEE Qie, forming two indirect influence pathways. While SR influences wind speed at larger spatial scales Lin, its effect on local wind speed variations is minimal. Nevertheless, wind facilitates the diffusion of water vapor and CO₂ in the atmosphere, affecting both ET and NEE Li. Soil temperature (ST) increases both by directly absorbing radiation and through heat transfer from the warmed atmosphere Wu, ST subsequently influences plant growth and soil microbial respiration, thereby affecting NEE Zhu. Furthermore, ET itself influences NEE. Transpiration cools leaf surfaces and regulates plant water status, which can promote carbon assimilation Pauline. ET also provides feedback to atmospheric humidity and temperature, and ST can be lowered through evaporative cooling effects, representing another indirect pathway affecting NEE Wang. These key variables thus form a complex network of direct and indirect interactions.
Figure 7 further illustrates the marginal contributions of the four most critical variables to the predictions of ET and NEE under specific conditions. The 8 subplots reveal that, with the exception of STL2 for NEE which shows no distinct threshold, all other variables exhibit contribution thresholds in their predictions of the target variables. The threshold for SR's contribution to rainforest ET prediction is approximately 400 W m⁻². Below this value, its contribution is negative, turning positive above it. In contrast, the threshold for SR's contribution to NEE prediction is around 200 W m⁻², which aligns with the light saturation point commonly observed in plant photosynthesis Zhang. Beyond this point, SR's marginal contribution to NEE becomes negative, highlighting a unique aspect of the light-response mechanism in this tropical rainforest ecosystem. The patterns of marginal contribution for ATATC to both ET and NEE are similar, with a threshold near 25°C. Contributions are positive below and negative above this temperature. The marginal contributions of NGVP to ET and NEE predictions show opposite trends, with a threshold around 2.5 kPa. When NGVP > 2.5 kPa, its contribution to ET prediction is positive but negative to NEE; the opposite is true when NGVP < 2.5 kPa. For WSATC's contribution to NEE prediction, the threshold lies within an interval of 0.25 to 0.75 m s⁻¹. Contributions are generally positive when WSATC < 0.25 m s⁻¹ and negative when WSATC > 0.75 m s⁻¹. While a threshold for STL2's contribution to NEE is indicated at 25°C, the threshold effect is extremely subtle. It is noteworthy that the contribution thresholds of these variables are largely consistent for both ET and NEE predictions. This finding serves as key evidence for the coupled nature of carbon and water cycles in rainforests Naoya. The changes in ET and NEE are likely driven by a shared set of fundamental biophysical processes that operate within common optimal environmental ranges and share critical stress points. This observation reinforces the tight coupling of photosynthesis and transpiration mediated by stomatal behavior [Wang0,51]; Furthermore, these shared thresholds may represent critical tipping points where the functional state of the rainforest ecosystem undergoes transition. If future climate conditions persistently exceed these thresholds, it could simultaneously trigger a decline in carbon sink strength and an exacerbation of water loss through evapotranspiration, underscoring the importance of studying rainforest carbon-water coupling mechanisms in a changing environment.
Analysis of feature interactions indicates that the interaction between SR and ATATC is the strongest. High SR attenuates the positive contribution of high ATATC, while low ATATC mitigates the negative contribution of low SR (Figure 7a, e), interactions between other variable pairs are less pronounced. Nevertheless, the partial dependence plots align with established physical relationships, showing that high SR is associated with high ATATC (Figure 7a, e), and high ATATC coincides with high VP (Figure 7b, d, f).
Climatic conditions vary across months of the year. To investigate the seasonal dynamics in the environmental responses of ET and NEE, Figure 8 presents the monthly marginal contributions of each variable to their predictions. The marginal contributions exhibit pronounced seasonal variations. The marginal contributions of ATATC, AHATC, and NGVP to both ET and NEE show broadly similar seasonal patterns. The contribution of ATATC is lower in winter than in summer, peaking for ET in July and for NEE in September. The contribution of AHATC is greater during February, March, and April. NGVP shows higher contributions in winter and summer compared to spring and autumn. Notably, the marginal contribution of SR to ET prediction peaks in March, September, and October. These months coincide with the critical dry-to-wet and wet-to-dry transition periods in the Xishuangbanna rainforest climate Zafar, characterized by rapid rebalancing of energy, water, and plant physiological activity. In contrast, the influence of SR on NEE is greater in January, February, July, September, and November. This indicates that, despite the overall strong coupling, seasonal carbon-water decoupling occurs in the Xishuangbanna rainforest. The marginal contribution of STL2 to NEE prediction is greater from June to October, which aligns closely with the local rainy season (May to October). This provides important evidence that soil microbial respiration becomes a dominant factor in the carbon cycle under the warm and humid conditions prevalent during the rainy season. The marginal contributions of WS and PR to both ET and NEE predictions show relatively minor seasonal variation.
4. Discussion
4.1. Pathway Analysis of Environmental Impac(SEM)
While machine learning is effective in identifying key environmental variables influencing ET and NEE and capturing complex nonlinear relationships among them, it has limitations in establishing explicit causal links between external energy sources, atmospheric properties, soil characteristics, and the fluxes Sun. SEM addresses this limitation by quantifying the direct and indirect effects of environmental variables on ET and NEE. Figure 9 illustrates the pathways and standardized strengths of the effects of SR, AHATC, ATATC, ST, NGVP, and WS on ET and NEE. The analysis reveals that the energy provided by SR exerts a predominantly direct effect on NEE, with a path coefficient of -0.5034***, Other influential pathways on NEE are primarily indirect, mediated either through temperature or via the sequence from ATATC and AHATC to NGVP. The indirect pathway mediated through soil is relatively weaker, with a coefficient of only -0.4094***. For ET within the water cycle, the dominant influence occurs through the indirect pathway from ATATC and AHATC to NGVP. The direct effect of SR on ET is comparatively smaller, with a coefficient of 0.2043***. The feedback from evapotranspiration to environmental variables is most substantial in regulating ATATC, showing a strong negative coefficient of -1.4774***, The feedback to AHATC is weaker (-0.3156***), and the feedback to ST is minimal (0.0240***). The effects of ET and WSATC on NEE are relatively minor compared to other pathways, with coefficients of -0.1016*** and -0.1094*** respectively, The influence of WSATC on ET is of a similar magnitude (0.1069***). Overall, ATATC emerges as the most critical environmental variable through which SR indirectly regulates both ET and NEE.
4.2. Reliability of the Explainable Machine Learning Framework: Bridging Data Patterns and Biophysical Mechanisms
A key insight from this study is that the explainable machine learning (ML) framework successfully captured the complex response patterns of tropical rainforest carbon-water fluxes to environmental drivers—patterns that are intricately coupled with seasonal phenology. For instance, the model identified that the period of peak solar radiation influence on evapotranspiration coincided precisely with the transitional phases between dry and wet seasons. Similarly, the enhanced influence of soil temperature during the rainy season aligned with the period when soil microbial activity typically dominates carbon cycling dynamics. The high degree of consistency between the model-derived patterns and established, independent ecological knowledge demonstrates that the ML approach is not an impenetrable “black box.” Rather, it serves as a powerful tool for effectively revealing and quantifying known ecophysiological processes. More importantly, by using ML to identify key variables and their effects, and subsequently integrating these insights with confirmatory methods like Structural Equation Modeling (SEM), we were able to further disentangle the intrinsic quantitative relationships and causal pathways underlying these processes. Therefore, this work not only deepens the understanding of ecosystem functional dynamics in the Xishuangbanna tropical rainforest but also provides a robust paradigm for applying and validating data-driven methodologies in the study of complex ecosystems. The integrated framework presented here offers a replicable approach to generate mechanistically interpretable insights from high-dimensional observational data, bridging the gap between pattern detection and causal understanding.
4.3. Forecasting of ET and NEE Under Different Carbon Emission Scenarios in the Future
Utilizing the selected key variables, we retrained the optimal machine learning model and combined it with the monthly CMIP6 future key variable data corrected via quantile mapping to predict future ET and NEE. Figure 10(a) shows the historical actual values and CMIP6 simulated values for each variable. Using these values, we constructed mapping functions to correct the CMIP6 simulations. Compared to the uncorrected CMIP6 simulations, the corrected CMIP6 values show a higher degree of overlap with the actual observed curves, with Pearson correlation coefficients reaching: ET-0.5037, NEE-0.2374, AHATC-0.7349, SR-0.6689, WSATC-0.4100, ATATC-0.9527, STL2-0.2609, and NGVP-0.9597. Key input variables AHATC, SR, ATATC, and NGVP all achieved good correction results (with NGVP calculated based on the Magnus formula). We used the mapping functions to correct all variable simulations from CMIP6 under four future climate scenarios. Based on the corrected input variable data and the trained XGBoost model, we output the machine learning predictions for future ET and NEE. Figure 10(b) shows the changes in machine learning-predicted and CMIP6-corrected ET and NEE from 2026 to 2100.
It can be observed that, based on CMIP6 data, the Xishuangbanna rainforest will complete the transition from a carbon sink to a carbon source (NEE turning from negative to positive) between 2046 and 2066, depending on the future climate scenario; the higher the carbon emissions, the earlier this transition occurs. This result is consistent with predictions from previous studies Katharyn. However, the XGBoost predictions indicate that under all four scenarios, the carbon sink capacity of the Xishuangbanna rainforest will gradually decline (negative NEE increases), but it will not transition to a carbon source. This outcome aligns more closely with the flux observation trends over the past 20 years (increasing carbon sink) Liu, likely because the strict conservation policies implemented over the past few decades have introduced positive effects into the data Wang. It also suggests that, under the current level of protection, the Xishuangbanna rainforest ecosystem will continue to stably maintain its carbon sink function until the end of this century. For ET, the XGBoost predictions show a similar trend to the CMIP6 results, though CMIP6 values are slightly higher than those from XGBoost.
Overall, for human-intervened ecosystems like the Xishuangbanna rainforest, which have been under long-term strict protection, their future trajectory may not simply follow the path predicted by purely climate-driven models. Proactive and sustainable local management actions should be considered a critical, non-negligible variable in determining the fate of global ecosystems. Future research needs to further quantify the boundaries and mechanisms of this protective effect and more effectively integrate it into Earth System Models to enhance the completeness of global change predictions and the precision of policy responses.
5. Conclusions
This study elucidates the complex environmental regulation of carbon and water fluxes in the Xishuangbanna tropical rainforest, a unique ecosystem under long-term strict protection, and projects their future trajectories of ET and NEE under various climate scenarios. Our integrative analysis reveals three layers of understanding:
Firstly, at the mechanistic level, we have decoded the core biophysical drivers. Solar radiation (SR) serves as the paramount energy source but regulates carbon uptake (NEE) and water loss (ET) through distinctly different pathways: it directly controls NEE, while indirectly mediating ET via its influence on atmospheric variables. This dual role explains the observed tight coupling yet seasonal decoupling between the forest's carbon and water cycles. Building upon this mechanistic understanding, we then identified the critical environmental thresholds that govern overall ecosystem function, such as for air temperature (~25°C) and vapor pressure (~2.5 kPa). The quantification of these thresholds is essential for diagnosing vulnerability and predicting systemic stability under future climate regimes.
Most significantly, integrated machine learning and bias-corrected CMIP6 framework provides a novel resilience assessment. It reveals a fundamental divergence: traditional climate models project a mid-century sink-to-source transition, while our ML model, trained on conservation-era data, projects a persistent carbon sink. This indicates that sustained protection may buffer ecosystems against a purely climate-driven decline.
Author Contributions
All authors contributed to the study conception and design. Material preparation, data collection and analysis were performed by Chenjia Zhang, Dingman Li, Luping Zhang, Yuxuan Zhu, Zhengquan Zhou, Feiri Ali and Yusheng Han. The first draft of the manuscript was written by Chenjia Zhang, and all authors commented on previous versions of the manuscript. Daokun Ma supervised the project and were responsible for the funding acquisition. All authors have read and agreed to the published version of the manuscript.
Funding
This research was funded by Silk Road Economic Belt Innovation-Driven Development Pilot Zone, WuChangShi National Independent Innovation Demonstration Zone Project, grant number 2022LQ04001; Science and Technology Program of Jiangxi Province, grant number BE2023340; Sichuan Provincial Science and Technology Program Project (Sichuan Natural Science Foundation), grant number 2024YFHZ0139.
Data Availability Statement
The authors are not allowed to share data except for publicly available data.
Acknowledgments
Dataset is provided by National Ecosystem Science Data Center, National Science & Technology Infrastructure of China. ( http://www.nesdc.org.cn).
Conflicts of Interest
The authors declare no conflicts of interest. The funders had no role in the design of the study; in the collection, analyses, or interpretation of data; in the writing of the manuscript; or in the decision to publish the results.
Appendix A
The Pearson correlation coefficient is a statistic that measures the strength and direction of the linear relationship between two continuous variables. Its value ranges from -1 to 1, where an absolute value |ρ| closer to 1 indicates a stronger correlation, and a value closer to 0 indicates a weaker or no linear correlation Almeida Cassiano D’, Charles J. Vörösmarty, José A. Marengo, George C. Hurtt, S. Lawrence Dingman, Barry D. Keim. A water balance model to study the hydrological response to different scenarios of deforestation in Amazonia.
where E(XY) is the expected value of the product of variables X and Y, E(X) and E(Y) are the expected values of X and Y respectively, and E(X²) and E(Y²) are the expected values of the squares of X and Y.
The performance of the machine learning model fitting is quantified using the Root Mean Square Error (RMSE), Mean Absolute Error (MAE), and the Coefficient of Determination (R²). A value of R² closer to 1 indicates a better fitNathalie, These metrics are defined as follows:
where yi is the predicted output, is the true value of theoutput, is the mean of the output values,and n is thenumber of data samples in the testing datasets.
Figure A1.
a. Schematic diagram of the stratified sampling procedure; b. Flowchart of the quantile mapping (bias correction) process.
Figure A1.
a. Schematic diagram of the stratified sampling procedure; b. Flowchart of the quantile mapping (bias correction) process.


Table A1.
Comprehensive Table of Observed Variables. (Include descriptive statistics of flux from 2003 to 2015).
Table A1.
Comprehensive Table of Observed Variables. (Include descriptive statistics of flux from 2003 to 2015).
| Variable | Unit | Variable Description |
|---|---|---|
|
NEE |
mg CO2 m-2 s-1 |
Net flux of CO₂ between the ecosystem and the atmosphere. Negative values indicate net uptake by the ecosystem (carbon sink). |
| ET | g m-2 s-1 | Sum of evaporation and plant transpiration |
| NGAT | ℃ | Air temperature measured close to the ground |
| ATATC | ℃ | Air temperature measured above the forest canopy |
| NGAH | % | Relative humidity measured close to the ground |
| AHATC | % | Relative humidity measured above the forest canopy |
| NGVP | kPa | Partial pressure of water vapor in air near the ground |
| VPATC | kPa | Partial pressure of water vapor in air above the canopy |
| NGWS | M s-1 | Horizontal wind speed measured close to the ground |
| WSATC | M s-1 | Horizontal wind speed above the canopy |
| AP | kpa | Pressure exerted by the atmosphere at the measurement site |
| SR | W m-2 | Incoming shortwave radiation |
| NR | W m-2 | Net all-wave radiation balance (incoming-outgoing shortwave and longwave) |
| PAR | Μmol m-2 s-1 | Flux density of photons in the 400-700 nm waveband |
| STL1 | ℃ | Soil temperature at 5cm depth |
| STL2 | ℃ | Soil temperature at 10cm depth |
| STL3 | ℃ | Soil temperature at 20cm depth |
| STL4 | ℃ | Soil temperature at 50cm depth |
| STL5 | ℃ | Soil temperature at 100cm depth |
| SWCL1 | m3 m-3 | Volumetric soil moisture at 10cm depth |
| SWCL2 | m3 m-3 | Volumetric soil moisture at 20cm depth |
| SWCL3 | m3 m-3 | Volumetric soil moisture at 30cm depth |
| PR | mm | Total depth of liquid water equivalent from rainfall |
Table A2.
Hyperparameter Search Space Configuration for Each Model.
| Model | Hyperparameter | Search range | Description |
|---|---|---|---|
|
RF |
n | (50, 200) | number of decision trees |
| max_depth | (5, 30) | Maximum depth of a single decision tree | |
| min_samples_split | (2, 10) | Minimum number of samples required to split an internal node | |
| min_samples_leaf | (1, 5) | Minimum number of samples required to be at a leaf node | |
|
XGBoost |
n | (50, 200) | Number of boosting rounds (weak learners) |
| max_depth | (3, 15) | Maximum depth of a tree | |
| learning_rate | (0.01, 0.3) | Step size shrinkage used in weight updates | |
| subsample | (0.6, 1.0) | Fraction of samples used for fitting each tree | |
|
MLP |
layer_sizes1 | (50, 200) | Number of neurons in the first hidden layer |
| layer_sizes2 | (20, 100) | Number of neurons in the second hidden layer | |
| ɑ | (0.0001, 0.01) | L2 regularization (penalty) term | |
| learning_rate | (0.001, 0.01) | Initial learning rate for the optimizer | |
|
SVR |
C | (0.1, 10.0) | Regularization parameter |
| γ | (0.001, 0.1) | Kernel coefficient for the RBF kernel | |
| ℇ | (0.01, 0.5) | Epsilon-tube parameter in the loss function | |
|
ELM |
layer_sizes | (50, 200) | Number of neurons in the single hidden layer |
| ɑ | (0.0001, 0.01) | L2 regularization (penalty) term | |
| learning_rate | (0.001, 0.01) | Initial learning rate for the optimizer | |
|
KNN |
n | (3, 15) | Number of nearest neighbors considered for prediction |
| weights | (0, 1) | < 0.5:equal weight; ≥0.5: weighted by inverse distance | |
| p | (1, 2) | Manhattan distance (p=1); Euclidean distance (p=2) |
References
- 1. Journal of Hydrology. 2006, Volume 331, Issues 1–2, Pages 125-136. [CrossRef]
- Cramer W, Bondeau A, Schaphoff S, Lucht W, Smith B, Sitch S. Tropical forests and the global carbon cycle: impacts of atmospheric carbon dioxide, climate change and rate of deforestation. Philosophical transactions of the Royal Society of London. Series B, Biological sciences. 2004, 359(1443):331-343. doi:10.1098/rstb.2003.1428.
- Xu Hao et al. Rising ecosystem water demand exacerbates the lengthening of tropical dry seasons. Nature Communications. 2022, 13, 4093. https://doi.org/10.1038/s41467-022- 31826-y.
- Pan Yude et al. A Large and Persistent Carbon Sink in the World’s Forests. Science. 2011, 333, 988-993. DOI:10.1126/science.1201609.
- Saatchi SS et al. Benchmark map of forest carbon stocks in tropical regions across three continents. Proceedings of the National Academy of Sciences of the United States of America. 2011, 108(24): 9899-9904. doi:10.1073/pnas.1019576108.
- Luiz E. O. C. Aragão. The rainforest's water pump. Nature. 2012, 489, 217–218. https://doi. org/10.1038/nature11485.
- Silva M. Tree hydrodynamic modelling of the soil–plant–atmosphere continuum using FETCH3, Geoscientific Model Development. 2022, 15, 2619–2634. [CrossRef]
- Doughty C.E et al. Tropical forests are approaching critical temperature thresholds. Nature. 2023, 621, 105–111. [CrossRef]
- David M. Lapola et al. 2023. The drivers and impacts of Amazon forest degradation. Science. 2018, 379, eabp8622. DOI:10.1126/science. abp8622.
- Chayawat C et al. Environmental controls on net CO2 exchange over a young rubber plantation in northeastern Thailand. Science Asia. 2019, 45. [CrossRef]
- Du Ying, Erqian Cui, Songbo Tang, Kun Huang, Jianyang Xia. Widespread negative impact of daytime warming on vegetation productivity. One Earth. 2025, Volume 8, Issue 5, 2025, 101284. [CrossRef]
- Zhu Juntao et al. Warming alters plant phylogenetic and functional community structure. Journal of Ecology. 2020, Volume108, Issue6 Pages 2406-2415. https://doi.org/10.1111/1365-2745.13448.
- Guan K. et al. Photosynthetic seasonality of global tropical forests constrained by hydroclimate. Nature Geoscience. 2015, 8, 284–289.
- Zhou Liguo, Xiang Zhang, Yiping Zhang, Qinghai Song, Sai Tay Zar Myo, Ruiwu Zhou, Youxing Lin, Yuntong Liu, Kechen Bai, Palingamoorthy Gnanamoorthy, D. Balasubramanian. The cumulative drought exert disruptive effects on tropical rainforests in the northern edge of Asia - Based on decadal dendrometric measurements and eddy covariance method. Agricultural and Forest Meteorology. 2022, Volume 316,2022,108858. [CrossRef]
- Hubau W. et al. Asynchronous carbon sink saturation in African and Amazonian tropical forests. Nature. 2020, 579, 80–87. [CrossRef]
- Schuur E.A.G. Productivity and global climate revisited: the sensitivity of tropical forest growth to precipitation. Ecology. 2003. 84, 1165–1170. [CrossRef]
- Katharyn A. Duffy et al. How close are we to the temperature tipping point of the terrestrial biosphere?. Science Advances. 2021. 7, eaay1052. DOI:10.1126/sciadv. aay1052.
- Zhu Hua. The tropical rainforest vegetation in Xishuangbanna. Chinese Geographical Science. 1992, 2, 64–73. [CrossRef]
- Alistair W. R. Seddon, Macias-Fauria M., Peter R. Long, David Benz, Kathy J. Willis. Sensitivity of global terrestrial ecosystems to climate variability. Nature. 2016, 531, 229–232. [CrossRef]
- Liu Yaqi et al, Increase in carbon sink in a protected tropical seasonal rainforest in southwestern China over 20 years. Agricultural and Forest Meteorology. 2025, Volume 375, 110851. [CrossRef]
- Lu ji et al. Empirical Study on Evaluation of Forestry Green Transformation and Development in the Context of Natural Forests Protection Project. Forestry Science and Technology Communications. 2022. 11 (2022): 9-17. https://doi:10.13456/j.cnki.lykt.2022.09. 09.0002.(in Chinese).
- Aguilos Maricar, Bruno Hérault, Benoit Burban, Fabien Wagner, Damien Bonal. What drives long-term variations in carbon flux and balance in a tropical rainforest in French Guiana?. Agricultural and Forest Meteorology. 2018, Volumes 253–254, Pages 114-123. [CrossRef]
- Wolf Sebastian, Werner Eugster, Catherine Potvin, Nina Buchmann. Strong seasonal variations in net ecosystem CO2 exchange of a tropical pasture and afforestation in Panama. Agricultural and Forest Meteorology. 2011, Volume 151, Issue 8, Pages 1139-1151. [CrossRef]
- Wang Yuan, Junjie Liu, Paul O. Wennberg, Liyin He, Damien Bonal, Philipp Köhler, Christian Frankenberg, Stephen Sitch, Pierre Friedlingstein. Elucidating climatic drivers of photosynthesis by tropical forests. Global Change Biology. 2023, Volume29, Issue17 Pages 4811-4825. [CrossRef]
- Peng Jinlong et al. Evidence for the acclimation of ecosystem photosynthesis to soil moisture. Nature Communications. 2024, 15, 9795. [CrossRef]
- Wu Haohao et al. Significant sensitivity of global vegetation productivity to terrestrial surface wind speed changes. Nature Communications. 2025, 16, 9315. [CrossRef]
- Dai Aiguo, Zhao Tianbao, Chen Jiao. Climate Change and Drought: a Precipitation and Evaporation Perspective. Current Climate Change Reports, 4, 301–312. [CrossRef]
- Zhang Xinag. Influence of Precipitation Decrease on Major Processes of Carbon and Water Vapor Cycle in a Tropical Rainforest. University of Chinese Academy of Sciences, Beijing. https://ir.xtbg.ac.cn/handle/353005/10564.
- Leander Moesinger, Wouter Dorigo, Richard de Jeu, Robin van der Schalie, Tracy Scanlon, Irene Teubner, Matthias Forkel. The global long-term microwave Vegetation Optical Depth Climate Archive (VODCA). Earth System Science Data. 2020, Volume 12, issue 1, 12, 177–196. [CrossRef]
- Qin Yingzuo, Dashan Wang, Alan D. Ziegler, Bojie Fu, Zhenzhong Zeng. Impact of Amazonian deforestation on precipitation reverses between seasons. Nature. 2025, 639, 102–108. [CrossRef]
- Zhou Yan, Liu Shiliang, Xie Miaomiao, Sun Yongxiu, An Yi. Dynamics of regional vegetation changes under the disturbance of human activities: A case study of Xishuangbanna. Acta Ecologica Sinica. 2021, 41(2): 565-574.
- Chang Shih-Chieh , Taku M. Saitoh, Hideaki Shibata, Satoshi N. Suzuki. Recent advances in the understanding of ecosystem processes at eddy covariance CO2 flux sites in East Asian forest ecosystems: a review. Journal of Agricultural Meteorology. 2021, Volume 77, 2022 Issue 1. [CrossRef]
- Shen Hui, Li Jianduo, Wu Guocan, Ye Aizhong , Mao Yuna. Can CMIP6 Models Accurately Reproduce Terrestrial Evapotranspiration Across China?. International Journal of Climatology. 2025, Volume45, Issue6. [CrossRef]
- Sun Shanshan, Xu Shiqin, Li Lingchen, Lin Yihua, Liu Hongbo,Viviana Maggioni, Xu Yan, Fu Congsheng. Global assessment of terrestrial precipitation and evapotranspiration in CMIP6 simulations using observation-based estimates. Frontiers Water. 2025, Volume 7 - 2025. [CrossRef]
- Zhu Hua, Wang Hong, Li Bao-Gui, Zhou Shi-Shun, Zhang Jian-Hou. Studies on the Forest Vegetation of Xishuangbanna. Plant Science Journal. 2015, 33(5): 641-726. DOI: 10.11913/PSJ-2095-0837.2015.50641.
- Zhang Xiaoyan, Ci Xiuqin, Hu Ling, Zhang Shifang, Hu Jianlin , Li Jie. Plant Diversity Patterns and Their Determinants Across a North-Edge Tropical Area in Southwest China. Diversity. 2025, 17, no. 12: 833. [CrossRef]
- Zhang Yiping, Tan Zhenghong, Song Qinghai, Yu Guirui, Sun Xiaomin. 2010. Respiration controls the unexpected seasonal pattern of carbon flux in an Asian tropical rain forest. Atmospheric Environment. 2017, Volume 44, Issue 32, Pages 3886-3893. [CrossRef]
- Scott M Lundberg, Su-In Lee. A unified approach to interpreting model forecastions. In Proceedings of the 31st International Conference on Neural Information Processing Systems (NIPS'17). 2017, Curran Associates Inc., Red Hook, NY, USA, 4768–4777.
- Grace James B., T. Michael Anderson, Han Olff, and S.M. Scheiner. On the specification of structural equation models for ecological systems. Ecological Monographs. 2010, v. 80, no. 1, p. 67-87. [CrossRef]
- Kenneth A. Bollen. Structural Equations with Latent Variables. 1989. John Wiley & Sons, Inc. Hoboken, America.
- Sun Xuan, Du Zhaolin, Ding Jian, Zheng Shunan, Yao Yanpo, Wu Lina, Chen Hongan, An Yi, Luo Yongming. Machine Learning Integrated with a Causal Pathway Framework Unravels Differential Mechanisms of Biochar-Driven Soil Organic Carbon Dynamics under Cadmium Stress. Environmental science & technology. 2026, 10.1021/acs.est.5c12567.
- Pedro W. Lamberti, Ana P. Majtey, Marcos Madrid, María E. Pereyra. Jensen-Shannon Divergence: A Multipurpose Distance for Statistical and Quantum Mechanics. AIP Conference Proceedings. 2007, 913, 32–37. [CrossRef]
- Syukri Arif Rafhida, Sri Nurdiati, Retno Budiarti, Mohamad Khoirun Najib. Bias correction of CMIP6 rainfall projection for the Lake Toba region, Indonesia, using quantile delta mapping with monthly distribution fitting. Vietnam Journal of Earth Sciences. 2025. [CrossRef]
- Li Xinyi, Li Zhong. Assessment of bias correction methods for high resolution daily precipitation projections with CMIP6 models: A Canadian case study. Journal of Hydrology: Regional Studies. 2025, Volume 58, 102223. [CrossRef]
- Qin Xiaosheng, Dai Chao. Comparison of different quantile delta mapping schemes in frequency analysis of precipitation extremes over mainland Southeast Asia under climate change. Journal of Hydrology. 2021, Volume 606, 127421. [CrossRef]
- Yu Hui, Song Qinghai, Zhang Yiping, Gnanamoorthy Palingamoorthy, Zhang Jing, Sadia Bibi. Long-term variation characteristics of radiation in the tropical seasonal rainforest in Xishuangbanna, southwestern China. Journal of Beijing Forestry University. 2021, 43(4): 56-67. DOI: 10.12171/j.1000-1522.20200270.
- Marcos H. Costa, Márcia C. Biajoli, Luciana Sanches, Ana C. M. Malhado, Lucy R. Hutyra, Humberto R. da Rocha, Renata G. Aguiar, Alessandro C. de Araújo. Atmospheric versus vegetation controls of Amazonian tropical rain forest evapotranspiration: Are the wet and seasonally dry rain forests any different?. Journal of Geophysical Research: Biogeosciences. 2010, Volume115, IssueG4. [CrossRef]
- Zhang Mi, Yu Guirui, Zhang Leiming, Sun Xiaomin, Han Shijie, Yan Junhua. Impact of cloudiness on net ecosystem exchange of carbon dioxide in different types of forest ecosystems in China. Biogeosciences. 2010, 7: 711–722.
- Wazwaz Aref, Mohd S. Khan. Variation in Direct Solar Trradiation with Relative Humidity and Atmospheric Temperature. Journal of Ecological Engineering. 2019, 20: 38–43. doi:10.12911/22998993/112341.
- Qie Yadong ,Zhang Qiwei, Scott A.M. McAdam, Cao Kunfang. Stomatal dynamics are regulated by leaf hydraulic traits and guard cell anatomy in nine true mangrove species. Plant Diversity. 2024, Volume 46, Issue 3 2024, Pages 395-405. [CrossRef]
- Wang Zhaoguo, Slot M., Wang Chuanuan. Decoupling of stomatal conductance, transpiration and photosynthesis in terrestrial plants under elevated temperature: a meta-analysis. Nature Communications. 2026, Article number: (2026). [CrossRef]
- Lin Changgui, Yang Kun, Huang Jianping, Tang Wenjun, Qin Jun, Niu Xiaolei, Chen Yingying, Chen Deliang, Lu Ning, Fu Rong. Impacts of wind stilling on solar radiation variability in China. Scientific Reports. 2015, 5, 15135. [CrossRef]
- Li Cheng, Wang Ranghui, Li Zhaozhe, Xu Yang. 2022. Characteristics and Influencing Factors of Evapotranspiration and Net CO2 Exchange in Winter Wheat-Summer Maize Field. Transactions of the Chinese Society for Agricultural Machinery. 2022, 53(1):331-339.
- Wu Fuyu, Tan Kun, Wang Xue, Ding Jianwei, Liu Zhaoxian, Han Bo. A semi-analytical radiative transfer model for explaining soil spectral features. International Journal of Applied Earth Observation and Geoinformation. 2023, Volume 118,103250. [CrossRef]
- Zhu Kehui, Chen Jinchao, Zhao Long, He Chongsheng, Doris Wagner, Xiao Jun. Dynamic control of H2A.Zub and H3K27me3 by ambient temperature during cell fate determination in Arabidopsis. Developmental Cell. 2025, Volume 60, Issue 16, 2192 - 2208.e5.
- Li Jinquan, Pei Junmin, Fang Changming, Li Bo, Nie Ming. Thermal adaptation of microbial respiration persists throughout long-term soil carbon decomposition. Ecology Letters. 2023, Volume26, Issue10. [CrossRef]
- Pauline Seeburger, Stanislaus J. Schymanski. Experimental Assessment of Optimal Stomatal Control under Drought and Heat Stress. EGU General Assembly 2025. 2025, Vienna, Austria. [CrossRef]
- Ding Junjie, Qin Longjun, Tan Shenglin, Yu Xiaohui, Zou Zhendong, Qiu Guoyu, Yan Chunhua. Study on Characteristics of Transpiration, Cooling Effect and Carbon-Reduction Effect of Ficus concinna, a Native Tree Species in Subtropical Cities. Acta Scientiarum Naturalium Universitatis Pekinensis. 2022, Vol. 58, Issue (3): 537-545. DOI: 10.13209/j.0479-8023.2022.040.
- Zhang Jiaolin, Cao Kunfang. Light energy utilization and dissipation in seedlings of three tropical rain forest tree species with different ecological habits. Chinese Journal of Applied Ecology. 2003, 2004, Vol. Issue (3): 372-376.
- Naoya Takamura, Yoshiaki Hata, Kazuho Matsumoto, Tomo’omi Kumagai. El Niño-Southern Oscillation forcing on carbon and water cycling in a Bornean tropical rainforest. Proceedings of the National Academy of Sciences (PNAS). 2023, 120 (42) e2301596120. [CrossRef]
- Zafar Siddiq, Zhang Yongjiang. Cool-dry season depression in gas exchange of canopy leaves and water flux of tropical trees at the northern limit of Asian tropics. Plant Ecology. 2022, 223, 171–183. [CrossRef]
- Wang Jie, Bai Yang, Huang Zhongde, Ashraf Anam, Maroof Ali, Fang Zhou, Lu Xue. Identifying ecological security patterns to prioritize conservation and restoration:A case study in Xishuangbanna tropical region, China. Journal of Cleaner Production. 2024, Volume 444, 141222. [CrossRef]
- Almeida Cassiano D’, Charles J. Vörösmarty, José A. Marengo, George C. Hurtt, S. Lawrence Dingman, Barry D. Keim. A water balance model to study the hydrological response to different scenarios of deforestation in Amazonia. Journal of Hydrology. 2006, Volume 331, Issues 1–2, Pages 125-136. [CrossRef]
- Cramer W, Bondeau A, Schaphoff S, Lucht W, Smith B, Sitch S. Tropical forests and the global carbon cycle: impacts of atmospheric carbon dioxide, climate change and rate of deforestation. Philosophical transactions of the Royal Society of London. Series B, Biological sciences. 2004, 359(1443):331-343. doi:10.1098/rstb.2003.1428.
- Xu Hao et al. Rising ecosystem water demand exacerbates the lengthening of tropical dry seasons. Nature Communications. 2022, 13, 4093. https://doi.org/10.1038/s41467-022-31826-y.
- Pan Yude et al. A Large and Persistent Carbon Sink in the World’s Forests. Science. 2011, 333, 988-993. DOI:10.1126/science.1201609.
- Saatchi SS et al. Benchmark map of forest carbon stocks in tropical regions across three continents. Proceedings of the National Academy of Sciences of the United States of America. 2011, 108(24): 9899-9904. doi:10.1073/pnas.1019576108.
- Luiz E. O. C. Aragão. The rainforest's water pump. Nature. 2012, 489, 217–218. https://doi. org/10.1038/nature11485.
- Silva M. Tree hydrodynamic modelling of the soil–plant–atmosphere continuum using FETCH3, Geoscientific Model Development. 2022, 15, 2619–2634. [CrossRef]
- Doughty C.E et al. Tropical forests are approaching critical temperature thresholds. Nature. 2023, 621, 105–111. [CrossRef]
- David M. Lapola et al. 2023. The drivers and impacts of Amazon forest degradation. Science. 2018, 379, eabp8622. DOI:10.1126/science. abp8622.
- Chayawat C et al. Environmental controls on net CO2 exchange over a young rubber plantation in northeastern Thailand. Science Asia. 2019, 45. [CrossRef]
- Du Ying, Erqian Cui, Songbo Tang, Kun Huang, Jianyang Xia. Widespread negative impact of daytime warming on vegetation productivity. One Earth. 2025, Volume 8, Issue 5, 2025, 101284. [CrossRef]
- Zhu Juntao et al. Warming alters plant phylogenetic and functional community structure. Journal of Ecology. 2020, Volume108, Issue6 Pages 2406-2415. https://doi.org/10.1111/1365-2745.13448.
- Guan K. et al. Photosynthetic seasonality of global tropical forests constrained by hydroclimate. Nature Geoscience. 2015, 8, 284–289.
- Zhou Liguo, Xiang Zhang, Yiping Zhang, Qinghai Song, Sai Tay Zar Myo, Ruiwu Zhou, Youxing Lin, Yuntong Liu, Kechen Bai, Palingamoorthy Gnanamoorthy, D. Balasubramanian. The cumulative drought exert disruptive effects on tropical rainforests in the northern edge of Asia - Based on decadal dendrometric measurements and eddy covariance method. Agricultural and Forest Meteorology. 2022, Volume 316,2022,108858. [CrossRef]
- Hubau W. et al. Asynchronous carbon sink saturation in African and Amazonian tropical forests. Nature. 2020, 579, 80–87. [CrossRef]
- Schuur E.A.G. Productivity and global climate revisited: the sensitivity of tropical forest growth to precipitation. Ecology. 2003. 84, 1165–1170. [CrossRef]
- Katharyn A. Duffy et al. How close are we to the temperature tipping point of the terrestrial biosphere?. Science Advances. 2021. 7, eaay1052. DOI:10.1126/sciadv. aay1052.
- Zhu Hua. The tropical rainforest vegetation in Xishuangbanna. Chinese Geographical Science. 1992, 2, 64–73. [CrossRef]
- Alistair W. R. Seddon, Macias-Fauria M., Peter R. Long, David Benz, Kathy J. Willis. Sensitivity of global terrestrial ecosystems to climate variability. Nature. 2016, 531, 229–232. [CrossRef]
- Liu Yaqi et al, Increase in carbon sink in a protected tropical seasonal rainforest in southwestern China over 20 years. Agricultural and Forest Meteorology. 2025, Volume 375, 110851. [CrossRef]
- Lu ji et al. Empirical Study on Evaluation of Forestry Green Transformation and Development in the Context of Natural Forests Protection Project. Forestry Science and Technology Communications. 2022. 11 (2022): 9-17. https://doi:10.13456/j.cnki.lykt.2022.09. 09.0002.(in Chinese).
- Aguilos Maricar, Bruno Hérault, Benoit Burban, Fabien Wagner, Damien Bonal. What drives long-term variations in carbon flux and balance in a tropical rainforest in French Guiana?. Agricultural and Forest Meteorology. 2018, Volumes 253–254, Pages 114-123. [CrossRef]
- Wolf Sebastian, Werner Eugster, Catherine Potvin, Nina Buchmann. Strong seasonal variations in net ecosystem CO2 exchange of a tropical pasture and afforestation in Panama. Agricultural and Forest Meteorology. 2011, Volume 151, Issue 8, Pages 1139-1151. [CrossRef]
- Wang Yuan, Junjie Liu, Paul O. Wennberg, Liyin He, Damien Bonal, Philipp Köhler, Christian Frankenberg, Stephen Sitch, Pierre Friedlingstein. Elucidating climatic drivers of photosynthesis by tropical forests. Global Change Biology. 2023, Volume29, Issue17 Pages 4811-4825. [CrossRef]
- Peng Jinlong et al. Evidence for the acclimation of ecosystem photosynthesis to soil moisture. Nature Communications. 2024, 15, 9795. [CrossRef]
- Wu Haohao et al. Significant sensitivity of global vegetation productivity to terrestrial surface wind speed changes. Nature Communications. 2025, 16, 9315. [CrossRef]
- Dai Aiguo, Zhao Tianbao, Chen Jiao. Climate Change and Drought: a Precipitation and Evaporation Perspective. Current Climate Change Reports, 4, 301–312. [CrossRef]
- Zhang Xinag. Influence of Precipitation Decrease on Major Processes of Carbon and Water Vapor Cycle in a Tropical Rainforest. University of Chinese Academy of Sciences, Beijing. https://ir.xtbg.ac.cn/handle/353005/10564.
- Leander Moesinger, Wouter Dorigo, Richard de Jeu, Robin van der Schalie, Tracy Scanlon, Irene Teubner, Matthias Forkel. The global long-term microwave Vegetation Optical Depth Climate Archive (VODCA). Earth System Science Data. 2020, Volume 12, issue 1, 12, 177–196. [CrossRef]
- Qin Yingzuo, Dashan Wang, Alan D. Ziegler, Bojie Fu, Zhenzhong Zeng. Impact of Amazonian deforestation on precipitation reverses between seasons. Nature. 2025, 639, 102–108. [CrossRef]
- Zhou Yan, Liu Shiliang, Xie Miaomiao, Sun Yongxiu, An Yi. Dynamics of regional vegetation changes under the disturbance of human activities: A case study of Xishuangbanna. Acta Ecologica Sinica. 2021, 41(2): 565-574.
- Chang Shih-Chieh , Taku M. Saitoh, Hideaki Shibata, Satoshi N. Suzuki. Recent advances in the understanding of ecosystem processes at eddy covariance CO2 flux sites in East Asian forest ecosystems: a review. Journal of Agricultural Meteorology. 2021, Volume 77, 2022 Issue 1. [CrossRef]
- Shen Hui, Li Jianduo, Wu Guocan, Ye Aizhong , Mao Yuna. Can CMIP6 Models Accurately Reproduce Terrestrial Evapotranspiration Across China?. International Journal of Climatology. 2025, Volume45, Issue6. [CrossRef]
- Sun Shanshan, Xu Shiqin, Li Lingchen, Lin Yihua, Liu Hongbo,Viviana Maggioni, Xu Yan, Fu Congsheng. Global assessment of terrestrial precipitation and evapotranspiration in CMIP6 simulations using observation-based estimates. Frontiers Water. 2025, Volume 7 - 2025. [CrossRef]
- Zhu Hua, Wang Hong, Li Bao-Gui, Zhou Shi-Shun, Zhang Jian-Hou. Studies on the Forest Vegetation of Xishuangbanna. Plant Science Journal. 2015, 33(5): 641-726. DOI: 10.11913/PSJ-2095-0837.2015.50641.
- Zhang Xiaoyan, Ci Xiuqin, Hu Ling, Zhang Shifang, Hu Jianlin , Li Jie. Plant Diversity Patterns and Their Determinants Across a North-Edge Tropical Area in Southwest China. Diversity. 2025, 17, no. 12: 833. [CrossRef]
- Zhang Yiping, Tan Zhenghong, Song Qinghai, Yu Guirui, Sun Xiaomin. 2010. Respiration controls the unexpected seasonal pattern of carbon flux in an Asian tropical rain forest. Atmospheric Environment. 2017, Volume 44, Issue 32, Pages 3886-3893. [CrossRef]
- Scott M Lundberg, Su-In Lee. A unified approach to interpreting model forecastions. In Proceedings of the 31st International Conference on Neural Information Processing Systems (NIPS'17). 2017, Curran Associates Inc., Red Hook, NY, USA, 4768–4777.
- Grace James B., T. Michael Anderson, Han Olff, and S.M. Scheiner. On the specification of structural equation models for ecological systems. Ecological Monographs. 2010, v. 80, no. 1, p. 67-87. [CrossRef]
- Kenneth A. Bollen. Structural Equations with Latent Variables. 1989. John Wiley & Sons, Inc. Hoboken, America.
- Sun Xuan, Du Zhaolin, Ding Jian, Zheng Shunan, Yao Yanpo, Wu Lina, Chen Hongan, An Yi, Luo Yongming. Machine Learning Integrated with a Causal Pathway Framework Unravels Differential Mechanisms of Biochar-Driven Soil Organic Carbon Dynamics under Cadmium Stress. Environmental science & technology. 2026, 10.1021/acs.est.5c12567.
- Pedro W. Lamberti, Ana P. Majtey, Marcos Madrid, María E. Pereyra. Jensen-Shannon Divergence: A Multipurpose Distance for Statistical and Quantum Mechanics. AIP Conference Proceedings. 2007, 913, 32–37. [CrossRef]
- Syukri Arif Rafhida, Sri Nurdiati, Retno Budiarti, Mohamad Khoirun Najib. Bias correction of CMIP6 rainfall projection for the Lake Toba region, Indonesia, using quantile delta mapping with monthly distribution fitting. Vietnam Journal of Earth Sciences. 2025. [CrossRef]
- Li Xinyi, Li Zhong. Assessment of bias correction methods for high resolution daily precipitation projections with CMIP6 models: A Canadian case study. Journal of Hydrology: Regional Studies. 2025, Volume 58, 102223. [CrossRef]
- Qin Xiaosheng, Dai Chao. Comparison of different quantile delta mapping schemes in frequency analysis of precipitation extremes over mainland Southeast Asia under climate change. Journal of Hydrology. 2021, Volume 606, 127421. [CrossRef]
- Yu Hui, Song Qinghai, Zhang Yiping, Gnanamoorthy Palingamoorthy, Zhang Jing, Sadia Bibi. Long-term variation characteristics of radiation in the tropical seasonal rainforest in Xishuangbanna, southwestern China. Journal of Beijing Forestry University. 2021, 43(4): 56-67. DOI: 10.12171/j.1000-1522.20200270.
- Marcos H. Costa, Márcia C. Biajoli, Luciana Sanches, Ana C. M. Malhado, Lucy R. Hutyra, Humberto R. da Rocha, Renata G. Aguiar, Alessandro C. de Araújo. Atmospheric versus vegetation controls of Amazonian tropical rain forest evapotranspiration: Are the wet and seasonally dry rain forests any different?. Journal of Geophysical Research: Biogeosciences. 2010, Volume115, IssueG4. [CrossRef]
- Zhang Mi, Yu Guirui, Zhang Leiming, Sun Xiaomin, Han Shijie, Yan Junhua. Impact of cloudiness on net ecosystem exchange of carbon dioxide in different types of forest ecosystems in China. Biogeosciences. 2010, 7: 711–722.
- Wazwaz Aref, Mohd S. Khan. Variation in Direct Solar Trradiation with Relative Humidity and Atmospheric Temperature. Journal of Ecological Engineering. 2019, 20: 38–43. doi:10.12911/22998993/112341.
- Qie Yadong ,Zhang Qiwei, Scott A.M. McAdam, Cao Kunfang. Stomatal dynamics are regulated by leaf hydraulic traits and guard cell anatomy in nine true mangrove species. Plant Diversity. 2024, Volume 46, Issue 3 2024, Pages 395-405. [CrossRef]
- Wang Zhaoguo, Slot M., Wang Chuanuan. Decoupling of stomatal conductance, transpiration and photosynthesis in terrestrial plants under elevated temperature: a meta-analysis. Nature Communications. 2026, Article number: (2026). [CrossRef]
- Lin Changgui, Yang Kun, Huang Jianping, Tang Wenjun, Qin Jun, Niu Xiaolei, Chen Yingying, Chen Deliang, Lu Ning, Fu Rong. Impacts of wind stilling on solar radiation variability in China. Scientific Reports. 2015, 5, 15135. [CrossRef]
- Li Cheng, Wang Ranghui, Li Zhaozhe, Xu Yang. 2022. Characteristics and Influencing Factors of Evapotranspiration and Net CO2 Exchange in Winter Wheat-Summer Maize Field. Transactions of the Chinese Society for Agricultural Machinery. 2022, 53(1):331-339.
- Wu Fuyu, Tan Kun, Wang Xue, Ding Jianwei, Liu Zhaoxian, Han Bo. A semi-analytical radiative transfer model for explaining soil spectral features. International Journal of Applied Earth Observation and Geoinformation. 2023, Volume 118,103250. [CrossRef]
- Zhu Kehui, Chen Jinchao, Zhao Long, He Chongsheng, Doris Wagner, Xiao Jun. Dynamic control of H2A.Zub and H3K27me3 by ambient temperature during cell fate determination in Arabidopsis. Developmental Cell. 2025, Volume 60, Issue 16, 2192 - 2208.e5.
- Li Jinquan, Pei Junmin, Fang Changming, Li Bo, Nie Ming. Thermal adaptation of microbial respiration persists throughout long-term soil carbon decomposition. Ecology Letters. 2023, Volume26, Issue10. [CrossRef]
- Pauline Seeburger, Stanislaus J. Schymanski. Experimental Assessment of Optimal Stomatal Control under Drought and Heat Stress. EGU General Assembly 2025. 2025, Vienna, Austria. [CrossRef]
- Ding Junjie, Qin Longjun, Tan Shenglin, Yu Xiaohui, Zou Zhendong, Qiu Guoyu, Yan Chunhua. Study on Characteristics of Transpiration, Cooling Effect and Carbon-Reduction Effect of Ficus concinna, a Native Tree Species in Subtropical Cities. Acta Scientiarum Naturalium Universitatis Pekinensis. 2022, Vol. 58, Issue (3): 537-545. DOI: 10.13209/j.0479-8023.2022.040.
- Zhang Jiaolin, Cao Kunfang. Light energy utilization and dissipation in seedlings of three tropical rain forest tree species with different ecological habits. Chinese Journal of Applied Ecology. 2003, 2004, Vol. Issue (3): 372-376.
- Naoya Takamura, Yoshiaki Hata, Kazuho Matsumoto, Tomo’omi Kumagai. El Niño-Southern Oscillation forcing on carbon and water cycling in a Bornean tropical rainforest. Proceedings of the National Academy of Sciences (PNAS). 2023, 120 (42) e2301596120. [CrossRef]
- Zafar Siddiq, Zhang Yongjiang. Cool-dry season depression in gas exchange of canopy leaves and water flux of tropical trees at the northern limit of Asian tropics. Plant Ecology. 2022, 223, 171–183. [CrossRef]
- Wang Jie, Bai Yang, Huang Zhongde, Ashraf Anam, Maroof Ali, Fang Zhou, Lu Xue. Identifying ecological security patterns to prioritize conservation and restoration:A case study in Xishuangbanna tropical region, China. Journal of Cleaner Production. 2024, Volume 444, 141222. [CrossRef]
- Ai Xinbo. Adjust Pearson’s r to Measure Arbitrary Monotone Dependence. arXiv. 2024, 2205.04571v7. https://arxiv.org/html/2205.04571v7.
- Esquivel-Muelbert A. et al. Compositional response of Amazon forests to climate change. Global Change Biology. 2019, 25, 39–56.
- Nathalie Japkowicz, Mohak Shah. Evaluating Learning Algorithms-A Classification Perspective. 2011. Cambridge University Press, London. [CrossRef]
- Xu Jing, Liu Feipeng, Wang Jianxiong, Bian Lin. Change Trend of Vegetation Cover in Xishuangbanna Based on MODIS NDVI. Journal of Southwest Forestry University. 2018, 38(5): 145-153. DOI: 10.11929/j.issn.2095-1914.2018.05.023.
Figure 1.
Study site: Xishuangbanna Tropical Rainforest Nature Reserve Eddy Covariance Flux Tower, Yunnan Province.
Figure 1.
Study site: Xishuangbanna Tropical Rainforest Nature Reserve Eddy Covariance Flux Tower, Yunnan Province.

Figure 2.
Schematic of the framework combining Explainable Machine Learning, SEM and CMIP6 for analyzing climate responses and projecting future carbon-water fluxes.
Figure 2.
Schematic of the framework combining Explainable Machine Learning, SEM and CMIP6 for analyzing climate responses and projecting future carbon-water fluxes.

Figure 3.
Heatmap of Pearson correlation coefficients among environmental variables and target fluxes (NEE and ET), and the red and black boxes mark the same type of parameters.
Figure 3.
Heatmap of Pearson correlation coefficients among environmental variables and target fluxes (NEE and ET), and the red and black boxes mark the same type of parameters.

Figure 4.
Comparison of predictive performance (R², MAE and RMSE) for six machine learning models before and after Bayesian hyperparameter optimization. The optimal performance metrics are highlighted in red box.
Figure 4.
Comparison of predictive performance (R², MAE and RMSE) for six machine learning models before and after Bayesian hyperparameter optimization. The optimal performance metrics are highlighted in red box.

Figure 5.
Distribution similarity between the full dataset of ET and NEE and stratified random sampled subsets, where a Jensen-Shannon (JS) divergence<0.05 indicates an extremely high degree of distributional similarity.
Figure 5.
Distribution similarity between the full dataset of ET and NEE and stratified random sampled subsets, where a Jensen-Shannon (JS) divergence<0.05 indicates an extremely high degree of distributional similarity.

Figure 6.
Global feature importance derived from SHAP values for NEE/ET prediction using the optimized XGBoost model.
Figure 6.
Global feature importance derived from SHAP values for NEE/ET prediction using the optimized XGBoost model.

Figure 7.
Local SHAP-based feature attribution for NEE/ET prediction using the optimized XGBoost model (Top four environmental variables in terms of marginal contribution to predict NEE/ET values).
Figure 7.
Local SHAP-based feature attribution for NEE/ET prediction using the optimized XGBoost model (Top four environmental variables in terms of marginal contribution to predict NEE/ET values).

Figure 8.
Monthly Dynamics of SHAP-based Feature Importance for NEE/ET Prediction (In the scatter plot, data points positioned further to the left exhibit larger SHAP values).
Figure 8.
Monthly Dynamics of SHAP-based Feature Importance for NEE/ET Prediction (In the scatter plot, data points positioned further to the left exhibit larger SHAP values).

Figure 9.
Direct and indirect effects of key environmental variables on rainforest ET and net ecosystem exchange NEE (SEM). Solid arrows indicate hypothesized causal pathways; dashed lines represent feedback paths of ET, red indicates a positive impact, blue indicates a negative impact..with standardized path coefficients displayed adjacent to each arrow. Significance levels are denoted by asterisks (***: p < 0.001).

Figure 10.
(a) Comparison between observed ET, NEE and environmental variables and CMIP6 simulated data from 2003 to 2022; (b) Comparison of future carbon and water flux projections between machine learning and CMIP6 models under four SSP scenarios (ssp1-2.6, ssp2-4.5, ssp3-7.0, ssp5-8.5 ), from 2026 to 2100.

Disclaimer/Publisher’s Note: The statements, opinions and data contained in all publications are solely those of the individual author(s) and contributor(s) and not of MDPI and/or the editor(s). MDPI and/or the editor(s) disclaim responsibility for any injury to people or property resulting from any ideas, methods, instructions or products referred to in the content. |
© 2026 by the authors. Licensee MDPI, Basel, Switzerland. This article is an open access article distributed under the terms and conditions of the Creative Commons Attribution (CC BY) license.
Copyright: This open access article is published under a Creative Commons CC BY 4.0 license, which permit the free download, distribution, and reuse, provided that the author and preprint are cited in any reuse.


