Submitted:
02 March 2026
Posted:
04 March 2026
You are already at the latest version
Abstract
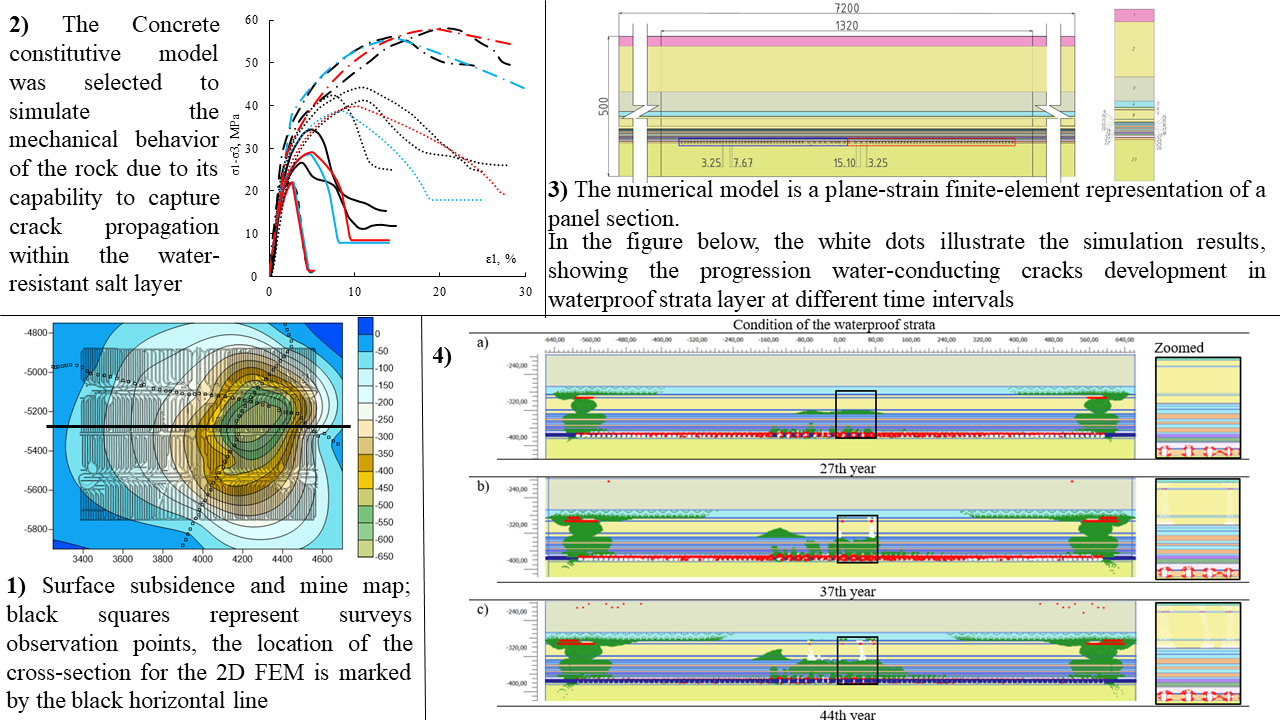
Maintaining the integrity of waterproof strata (WPS) between mine workings and overlying aquifers is critical, because water-conducting cracks (WCC) may cause mine flooding and surface subsidence. In the Upper-Kama potash deposit, the WPS is a 50-140 m thick stratified sequence of evaporites and clays overlying mined-out cham-bers. Under long-term loading, salt rocks tend to creep, soften, and localize damage, which can cause WPS failure.
In this paper the Concrete damage-plasticity model, supplemented by the N2PC-MCT viscoplastic creep model, is applied to simulate WCC initiation and evolution in the Upper-Kama WPS. Model parameters are obtained from published laboratory tests, in-cluding uniaxial and triaxial compression and tension, and then validated using ob-served ground-surface subsidence. A plane-strain finite-element model incorporates stratified lithology, interface elements between layers, and stepwise excavation. Long-term simulations up to 50 years investigate two operational scenarios: with and without backfilling.
The calibrated model reproduces the main stages of surface subsidence and chamber closure. Without backfilling, simulations indicate that tensile damage localizes mainly in a stiff central salt layer of the WPS. Most cracks appear approximately between 33 and 37 years after the beginning of mining. With backfill, tensile crack propagation stops and damage remains stable. A hypothetical homogeneous WPS case confirms that the observed central-layer cracking is associated with stiffness contrasts and composite bending in the stratified system. An approximate analytical multilayer beam solution, based on energy minimization, predicts bending stress concentration in stiff intermediate layers and is consistent with the numerical stress distribution.
The combined numerical and analytical results clarify the mechanisms of long-term WCC initiation in stratified WPS and may be used for hazard assessment and planning of mitigation measures, including backfilling and focused monitoring of stiff central layers.
Keywords:
waterproof strata
; water-conducting cracks
; numerical modeling
; constitutive model
; creep
; Upper-Kama potash deposit
1. Introduction
The rock mass between excavated mine workings and overlying water-bearing horizons is commonly called the waterproof strata (WPS) [1,2,3]. Water-conducting crack (WCC) formation in the WPS is a critical hazard in potash mining because it can cause flooding and surface subsidence or karst formation [4].
The Upper-Kama deposit WPS is a stratified sequence (50-140 m thick) located between mine workings and a weakly mineralized aquifer [5]. Salt rocks tend to undergo time-dependent deformation under long-term loading [6,7,8,9], while clayey and dolomitic interbeds may slip along salt interfaces. As a result, creep, softening, and damage localization are dominant mechanisms of long-term WPS failure [5,10], and their adequate representation in constitutive models is essential for reliable WCC prediction [11,12].
Many numerical analyses of WPS behavior have used elastic or elastoplastic constitutive models with Mohr-Coulomb or Drucker-Prager failure criteria. In such approaches, tensile cracking is often assumed to occur when the maximum principal tensile stress reaches the tensile strength, after which ideal plastic flow is allowed. However, geomaterials typically exhibit post-peak softening and progressive damage localization, accompanied by stiffness degradation and energy dissipation. Neglecting these effects may lead to inaccurate estimates of crack initiation, propagation and the extent of fractured zones.
At the same time, the WPS can be considered as a composite beam system under bending induced by mining-related subsidence. Layer thicknesses, stiffness contrasts, and interlayer bonding conditions strongly affect the stress distribution and potential crack locations. Studies of multilayer beams and functionally graded materials in civil engineering show that tensile stresses can concentrate in stiff intermediate layers if the composite action between layers is preserved. Similar mechanisms can occur in stratified WPS.
In this context, the principal objective of the present work is to assess whether the Concrete damage plasticity model [13,14], combined with the N2PC-MCT viscoplastic creep model, can reproduce the laboratory behavior of evaporites and accurately predict locations of WCC initiation in the stratified WPS of the Upper-Kama potash deposit.
The application of a Concrete damage-plasticity model to evaporite rocks is justified by fundamental similarities in mechanical behavior of quasi-brittle materials: for both material classes, the concepts of isotropic damaged elasticity combined with isotropic tensile and compressive plasticity provide an appropriate representation of inelastic behavior, including creep and a transition from brittle to ductile failure under confinement. The specific formulation by Schütz et al. (2011) was selected because it integrates these universal traits with two mechanisms critical for salt rocks—time-dependent creep and a brittle-ductile transition—within a single constitutive framework. This offers a distinct advantage over other common softening-capable models. For instance, while a Hoek-Brown model with softening [15] can simulate post-peak behavior, it typically reproduces only perfectly elastic behavior up to the yield surface and lacks an intrinsic creep formulation and brittle-ductile transition. Similarly, the standard Concrete model in Abaqus focuses on uniaxial stress states (Abaqus/CAE ver. 6-12.2, Dassault Systemes Simulia Corp. 2012.) and is significantly less capable of reliably describing mechanical behavior under high lateral compression. The implementation by Schütz [14] therefore provides a more comprehensive and physically realistic basis for simulating the coupled long-term deformation and fracture processes governing WPS integrity.
The main contributions of the paper are:
- Calibration of Concrete damage plasticity model parameters for sylvinite, carnallite, and rock salt using published laboratory data on strength, deformation, and fracture energy.
- Development of a plane-strain finite-element model of a mining panel that couples Concrete damage plasticity for WPS with N2PC-MCT viscoplastic creep for long-term pillar deformation, and validation of this model against observed ground-surface subsidence and chamber convergence.
- Analysis of stress-strain evolution and crack localization in the stratified WPS under scenarios with and without backfilling, and comparison with a hypothetical homogeneous WPS representation to isolate the role of stiffness contrasts and interlayer bonding.
- An approximate analytical model of a multilayer beam is used to compare with numerical results and to additionally confirm stress concentration in stiff intermediate layers of WPS.
The paper is organized as follows. Section 2 gives a short theoretical background on multilayer systems and formulates the problem. Section 3 describes laboratory data, constitutive models, numerical model and calibration procedure, and also the analytical multilayer beam model. Section 4 presents numerical and analytical results. Section 5 discusses the results and limitations of the approach. Section 6 contains the main conclusions.
1.1. Multilayer Systems and Bending Behavior
The mechanical behavior of stratified rock masses under bending loads is often compared to composite beams made of different materials [16,17,18]. Analogies with reinforced concrete, layered timber, and bituminous pavements highlight three key factors controlling the response of such systems under bending:
Extensive analytical, experimental [21,23], and numerical studies [24,25] of multilayer beams and functionally graded materials show that interfacial slip and creep can significantly modify displacements and stress distributions over time [18,26]. A similar behavior occurs in WPS when salt layers slip along clay seams. When the layers are well bonded, the system works as a composite beam with a single neutral axis; as a result, bending stresses can concentrate in thin, stiff layers, bringing them to tensile failure earlier than adjacent softer layers. If interlayer shear strength is low or interfaces creep, slip reduces stress transfer and may limit tensile cracking in stiff layers but increases displacements.
In the context of WPS, alternating salt and clay or dolomite layers resemble multilayer beams. Clay-salt interfaces may behave as viscoelastic interlayers, permitting slip and altering bending-induced stresses. Deflection and crack formation above large-scale excavations have been studied using numerical [27] and physical modeling [28,29]. Laboratory and numerical studies of strata deformation above large excavations show that tensile cracks can form both in roofs and in central layers, depending on stiffness contrasts, layer thicknesses and bonding [27,29,30]. Simulations using ABAQUS [12,30] show that tensile cracks can form not only in the roof above excavations but also within central layers. Similar results were reported in numerical studies on WPS integrity [31].
Hybrid discrete-continuum models reproduce delamination, stratification, and WCC formation observed in the field [32,33,34], whereas continuum finite-element models with interface elements can approximate interlayer interaction but do not fully resolve discrete delamination. Nevertheless, continuum models remain practical tools for large-scale WPS analysis when combined with appropriate constitutive laws and interface elements.
Hybrid discrete-continuum models have been applied to analyze interlayer bonding during roof collapse [32,33]. These approaches reproduce delamination and stratification mechanisms observed both directly above mined-out areas [16,34] and within the central layers of the section [32]. Delamination and subsequent cracking are promoted by: (1) a large bending-stiffness contrast between adjacent layers, and (2) weak interlayer bonding [29].
Once delaminated, such segments of the rock mass behave as independent multilayer beams. Each segment carries load proportional to its relative stiffness and has a unique neutral axis that aligns with its centroid. Tensile cracks initiate below this axis when the tensile stress exceeds the tensile strength of the rock.
Modern geomechanical models implemented using the finite element method (FEM) in continuous settings typically simulate interlayer interaction using interface elements. However, this method cannot explicitly reproduce the delamination mechanism, which casts doubt on its ability to predict WCC formation within the central WPS layers—unlike findings for coal-bearing strata [29,30]. This indicates the need to explore alternative mechanisms of crack formation unrelated to delamination.
The analytical multilayer-beam approach helps explain two effects: (i) shifts of the neutral axis and (ii) stress jumps at interfaces. For bonded layers, the neutral axis shifts toward the stiffer layers, which increases tensile stresses in thin stiff layers and can trigger failure earlier than in the surrounding rocks. This mechanism is central to understanding crack initiation in stratified WPS when delamination is limited or interlayer bonds remain intact.
1.2. Problem Statement
During mining, the stress-strain state of the WPS evolves progressively due to stress redistribution, creep, and damage accumulation [2]. The main factors influencing WPS behavior include:
time-dependent deformation of strong sylvinite pillars, which induces bending in the overlying WPS [6,7];
insoluble residue (IR) content, which reduces WPS strength and contributes to asymmetry in subsidence [2];
clay-salt contact mechanics, including possible slip at interfaces.
Significant attention has been given to modeling pillar rheology. For example, A. Baryakh & Tsayukov (2024) and Kashnikov et al. (2019) developed constitutive rheological models implemented in various finite-element codes; viscoelastic models [35] are also used. It can be concluded that to model the behavior of pillars it is necessary to use constitutive models with an advanced description of long-term deformation.
Geomechanical models of WPS continuity frequently use elastic [31] or elastic-plastic [36,37] constitutive laws with Mohr-Coulomb failure, sometimes enhanced with simple damage mechanics. These approaches typically assume that tensile cracks appear when local tensile stress reaches the material tensile strength [36,37,38], after which ideal plastic flow is allowed. However, post-peak softening, residual strength, and damage localization play a crucial role in geomaterials and must be represented to realistically simulate crack initiation and growth.
The present study evaluates whether the Concrete damage-plasticity model can represent WPS salt-layer mechanics and more accurately localize potential WCC zones when combined with a viscoplastic creep model for pillars. The methodology includes:
obtaining input parameters for the Concrete model for sylvinite, carnallite, and rock salt from published laboratory data;
implementing Concrete damage-plasticity (for fracture and softening) together with N2PC-MCT viscoplastic creep (for long-term pillar deformation) in a plane-strain finite-element model of a mining panel;
validating numerical results against measured surface subsidence and chamber convergence;
analyzing stress-strain evolution and crack localization for stratified and homogeneous WPS representations;
cross-validating numerical results with an analytical multilayer beam bending solution.
2. Materials and Methods
2.1. Site Description and Geological Setting
The case study focuses on a panel of the Upper-Kama potash deposit. The WPS is located between the mined-out chambers and a weakly mineralized aquifer in the overburden, with thickness varying from approximately 50 to 140 m and overburden thickness between about 150 and 350 m. The stratigraphy comprises alternating layers of sedimentary rocks, clayey-marl units, rock salt, carnallite, and sylvinite.
In the numerical model, the cross-section includes:
- Layer 1: sedimentary rocks (0-36 m),
- Layers 2-8: alternating clayey-marl strata and rock salt (36-319.2 m),
- Layers 9-23: alternating carnallite and rock salt (319.2-366 m),
- Layers 24-26: sylvinite (366-379.6 m),
- Layer 27: underlying sylvinite and rock salt (379.6-500 m).
Figure 1 represents the main structural features of WPS and adjacent rocks above and below the chambers.
2.2. Laboratory Data and Calibration of Concrete Model Parameters
Mechanical properties of sylvinite, carnallite and rock salt are taken from published laboratory tests [39,40,41,42,43,44,45]. These include uniaxial and triaxial compression, tensile tests and creep tests. These data are used to calibrate the Concrete damage-plasticity model parameters: elastic modulus, Poisson’s ratios, compressive and tensile strengths, fracture energies in tension and compression, and parameters controlling post-peak softening and residual strength.
The calibration procedure consists of three stages:
- Virtual tests and iterative optimization. The Concrete model parameters are iteratively adjusted using virtual simulations of uniaxial compression, tension, and triaxial compression. Numerical curves are fitted to experimental envelopes, with particular attention to lateral compression conditions representing in situ stress states. Figure 2 illustrates averaged uniaxial compression curves (a) and failure envelopes (b) for sylvinite, carnallite, and rock salt used in calibration.
- Verification against laboratory data. After calibration, model performance is verified by comparing simulated and experimental stress-strain diagrams for sylvinite and rock salt under uniaxial and triaxial loading. The calibrated model reproduces the dependence of peak strength on confining pressure and post-peak softening behavior. All calibrated parameters are summarized in Table 1.
2.3. Numerical Model of the Panel
The numerical model is a plane-strain finite-element representation of a panel section (Figure 1) containing two main entries and 86 chambers (44 in the eastern block and 42 in the western block). The domain geometry and stratigraphy are based on field information. Chamber width is 3.25 m and height is 6 m. The spacing varies from 6 to 15 m.
The model uses third-order triangular elements with local mesh refinement: element sizes are about 0.8 m in active zones (around chambers and within the WPS) and up to 130 m near model boundaries. Lateral boundaries are fixed in the horizontal direction, and the base is fixed both horizontally and vertically. Gravity loading is applied as vertical stress; horizontal stresses are specified using lateral pressure coefficients: 1.0 for salt, 0.6 for dolomite and anhydrite, and 0.75 for other units.
Excavation is simulated stepwise following the actual mining sequence: each chamber excavation is represented as a separate calculation step. This approach reproduces the temporal evolution of stresses and deformations in pillars and WPS as mining advances.
Interlayer interactions are represented by interface (discontinuity) elements with normal and shear friction parameters that approximate bonding and potential slip between layers. Although these elements do not explicitly model discrete delamination, they allow relative sliding and stress redistribution along layer interfaces.
The effect of insoluble residue (IR) content, which significantly influences pillar deformation and WPS strength, is captured using a coefficient that reduces compressive and tensile strength and pillar cohesion [49]. The IR coefficient is taken as the average between available data for the eastern and western blocks of the panel.
2.4. Constitutive Models
Two constitutive models are used:
- Concrete damage-plasticity model [13,14]. The built-in Concrete damage-plasticity model is used for WPS layers and other rock units where crack formation is of interest. Key features include separate tensile and compressive fracture energies (Gt and Gc), a brittle-ductile transition parameter, a post-peak softening law tied to fracture energy, and damage variables linked to plastic strain and energy dissipation. Tensile cracking is assumed to initiate when local tensile stress reaches the tensile strength. Thereafter, damage and softening govern stiffness degradation and fracture energy dissipation. Crack propagation in the finite-element model is represented by progressive damage localization and loss of stiffness, consistent with continuum damage mechanics.
- N2PC-MCT viscoplastic model. The N2PC-MCT viscoplastic creep model, implemented as a user-defined soil model in the finite-element code, is used to represent long-term pillar creep. It includes a power-law creep component and a plastic failure mechanism calibrated to reproduce long-term subsidence. Creep parameters are validated so that simulated surface subsidence matches field measurements.
2.5. Damage, Crack, and Interface Slip Criteria
Within the Concrete model, compressive, tensile, and shear damage mechanisms are distinguished. Tensile damage is evaluated when tensile strength is exceeded; compressive failure is governed by a Mohr-Coulomb condition, and shear plasticity accounts for inelastic shear deformation. Damage variables track the degree of stiffness degradation. If damage grows sufficiently in adjacent elements/integration points, a continuous tensile damage zone (interpreted as a crack) forms. Fracture energy control (Gt) is applied to prevent mesh sensitivity: post-peak softening is related to Gt so that energy dissipated per unit crack area is bounded.
Interlayer slip at interfaces is governed by a Coulomb-type shear strength criterion, and usually modelled with Goodman joint elements. When interface shear stress exceeds the available shear strength, slip or partial delamination occurs. In the model, interface slip consumes energy and may redirect deformation away from tensile fracture. Consequently, tensile crack formation in stiff layers is favored when interlayer shear stress remains below bond strength, ensuring strong composite action.
2.6. Model Calibration and Validation Against Subsidence
Surface subsidence data above the panel (Figure 3) is used as the primary calibration target for N2PC-MCT creep parameters and for the combined cracking-creep representation of the WPS. The observed subsidence history exhibits three stages [2,50]: initial (I), active (II), and decaying deformation (III) (Figure 4).
The calibrated numerical model reproduces both the timing and magnitude of these stages, as well as the peak subsidence values. The transition to increased settlement rate after approximately 1330 days is associated with decreased pillar strength due to hydraulic piling, which is represented by time-dependent changes in pillar properties. The transition to the decaying stage after about 1700 days corresponds to the completion of active pillar deformation, compaction of broken rock mass, and activation of backfill, and is similarly reproduced in the simulations.
As shown in Figure 4 and Figure 5, the numerical model captures the eastward shift of the subsidence trough observed in the field data, though with attenuated curvature due to the simplified representation of overburden properties. This asymmetric subsidence, with peak displacement shifted eastward, is attributed to the non-uniform insoluble residue (IR) distribution between the eastern and western blocks, the earlier excavation of the eastern block, and the use of dry backfill in early western chambers.
While the numerical model reproduces this trend, the simulated asymmetry is less pronounced, likely due to the assumption of a uniform IR distribution. Furthermore, compared to field data, the model yields smaller curvatures for the left and right branches of the trough and differences in the areas under the settlement curves. These discrepancies are primarily related to insufficient constraints on the mechanical properties of the geological elements above the WPS and the consequent use of less sophisticated constitutive models for these strata.
2.7. Computational Scenarios
Using the subsidence-calibrated numerical model, long-term simulations are performed for a 50-year period, corresponding to the design requirement for WPS continuity. Two main operational scenarios are investigated: (A) with backfill, representing current practice where mined-out chambers are filled; (B) without backfill, representing a hypothetical case to evaluate the role of backfilling.
For both scenarios, calculations are made for 50 years from the beginning of mining. Additionally, to isolate the influence of stratification, a homogeneous WPS case is modeled in which the WPS is represented as a single rock salt material with properties equal to appropriately averaged values of the stratified layers. Comparison of stratified and homogeneous models helps to separate the effect of stratification and stiffness contrasts.
2.8. Analytical Multilayer Beam Model
As an additional validation, an approximate analytical model of a multilayer beam is used. If interlayer bonds are strong, the WPS can be treated as a composite beam with one neutral axis. Its position and curvature are found from the condition of minimum total deformation energy of bending under given bending moment and loading.
where - the deformation energy, - the work of external forces, - the radius of curvature of the neutral line, - the cross-sectional area of the i-th layer, - elastic modulus of i-th layer, - the coordinate of the neutral line, - the total number of layers, - the maximum bending moment, for a parabolic approximation of the earth surface displacement subsidence trough:
where - the deformation modulus of the layer selected as the reference layer, - the maximum displacement of the earth surface subsidence at the moment in question, and - the moment of inertia of the composite section.
where are the width, height, and area of the layer, respectively, reduced to .
Relative to the geometric center, the neutral axis shifts toward the stiffer (stronger) layers. Under bending, stresses can differ markedly between adjacent layers, especially at interfaces where stiffness changes. Therefore, we evaluate bending stresses directly at the layer boundaries and account for stress jumps at material contrasts.
When bending, stress variance may occur between adjacent layers, at the boundary between the i-th and j-th layers:
where - boundary coordinates relative to . The value is also the effective shear stress between the layers - .
The bending moment is evaluated from the shape and depth of the subsidence trough, which is approximated by a parabola. The bottom layer in the beam model corresponds to the roof above the chambers. Stress profiles from the analytical model are compared with numerical results for the same times.
3. Results
3.1. Laboratory Test Data Verification
The calibrated Concrete model reproduces key features of experimental stress-strain curves for sylvinite and rock salt. Simulated curves under uniaxial and triaxial compression match laboratory data in terms of initial elastic stiffness, dependence of peak strength on confining pressure, post-peak softening and residual strength levels.
3.2. Long-Term WPS Response and Damage Evolution
The calibrated model reproduces the observed subsidence history and is used to simulate WPS behavior over a 50-year period for scenarios with and without backfill.
In both cases displacements and damage gradually increase as mining progresses and pillars creep. After about 15,000 days (≈41 years), numerous chamber sidewalls approach contact, which complicates long-term predictions because contact interactions are only approximately represented in continuum FEM.
Figure 7 illustrates the evolution of peak ground-surface displacements and highlights the reduced reliability of predictions after widespread chamber contact. Despite these limitations, the model provides insight into WPS damage evolution leading up to and shortly beyond the design lifetime.
Scenario with backfill. In the 55-year simulation with backfill, simulated failure maps show no significant propagation of tensile cracks after mining is completed. Existing damage zones remain stable and do not evolve into continuous WCC pathways. Backfill accelerates stress redistribution, reduces tensile stress accumulation in the WPS, and limits further crack growth.
Scenario without backfill. In the hypothetical scenario without backfill, failure maps reveal distinct stages of tensile crack development in the WPS:
- At about 27 years, there is practically no tensile failure in WPS.
- At about 37 years, initial tensile failure zones appear in rock salt layers at depths −286.5 to −328.3 m, indicating crack initiation. Deformation in peripheral zones extends into overlying clay-dolomite layers.
- By around 44 years, failure zone density increases markedly within the same depth interval, representing progressive crack formation in a stiff central salt layer. This period coincides with significant chamber wall closure, which tends to slow down further crack development due to increased confinement and contact.
Failure maps use a common legend at integration points: red indicates compressive failure (Mohr-Coulomb exceeded), green indicates plastic shear, blue indicates volumetric plastic strain related to N2PC-MCT creep, and white indicates tensile failure. Red and white areas are interpreted as disturbed zones within the WPS. A summary of WPS conditions at selected times is provided in Table 2, which documents the stress-strain state and Failure patterns at 27, 37, and 44 years.
The interpretation of tensile failure zones (represented by white integration points in failure maps) as hydraulically significant ‘cracks’ (WCCs) is based on the modeled mechanical behavior of evaporite rocks. In the WPS, tensile failure is characterized by a brittle post-peak response: upon reaching the tensile strength , the material transitions immediately to its residual strength with minimal prolonged softening. Consequently, a connected zone of integration points flagged for tensile failure represents a discrete loss of cohesion and a sharp reduction in stiffness. The damage parameter in these areas thus approaches unity, indicating complete loss of tensile integrity. Therefore, these white failure points correspond to damaged zones within the WPS that act as preferential pathways for fluid flow.
This interpretation is quantified by the progressive connectivity of these failure zones. For instance, the model shows that by year 34, tensile cracks initiate in the chamber roof with a maximum length of 4.8 m. Subsequently, cracking propagates within the central stiff layer, increasing the cumulative crack thickness within the 105.2 m thick WPS to 40.8 m by year 37 and 41.8 m by year 44.
Overall, the simulations suggest that without backfill, tensile damage tends to concentrate in a stiff central salt layer of the WPS, whereas with backfill, tensile crack propagation is minimal and damage remains largely stable after the completion of mining.
3.3. Homogeneous Versus Stratified WPS and Stress Concentration
To test the hypothesis that central-layer cracking is driven by stiffness contrasts in the stratified WPS, a homogeneous WPS model is analyzed in parallel. In this model, the WPS is represented by a single salt material with averaged properties (Figure 8).
At 44 years, comparisons of integration-point states between stratified and homogeneous models show that:
In the stratified WPS, tensile failure (white zones) concentrates in the stiff central salt layer at depths of about -286.5 to -328.3 m.
In the homogeneous WPS, tensile failure is more closely associated with roof regions above pillars, and damage is more uniformly distributed.
This contrast supports the interpretation that stiffness contrasts and composite action in the stratified WPS promote central-layer cracking. The homogeneous case serves as a control, demonstrating that the observed central-layer damage in the stratified model is not a numerical artifact but a structural effect of layered bending.
Stress concentration analysis indicates higher tensile stresses and greater damage indices in the stiff central layer in the stratified case compared with the corresponding region in the homogeneous model. This is consistent with multilayer beam theory, where bending stresses concentrate in stiff layers when composite action is maintained.
Horizontal stress concentration factors along a vertical section were calculated for both the real stratified (heterogeneous) profile and the homogeneous case and shown in Figure 9. These factors represent changes in stress relative to the initial stress field, take negative values in the tension zone and is calculated with the formula:
where - current horizontal stresses, i.e. those acting at a given step; - horizontal stresses of the natural field of the stress-strain state.
3.4. Comparison with Analytical Multilayer Beam Solution
The analytical multilayer beam model is used to evaluate the distribution of bending stresses across the WPS thickness for selected times (e.g., 27, 37, and 44 years). Surface subsidence amplitudes and approximate trough shapes provide input for estimating bending moments, which are then distributed across the composite section using energy-based formulas.
The analytical solution predicts that:
the neutral axis tends to shift toward stiffer layers with higher flexural rigidity;
bending stress jumps occur at interfaces where stiffness changes;
thin, stiff layers experience larger tensile stress increments than neighboring softer layers.
When the bottom layer of the analytical beam corresponds to the roof above mined-out chambers, the computed bending stress profiles indicate that tensile stresses peak in an intermediate stiff layer, in qualitative agreement with the numerical stratified WPS model. Figure 10 compares analytical and numerical bending stress distributions. Dotted lines represent analytical results, while solid lines represent finite-element results at 27, 37, and 44 years.
To move beyond a qualitative assessment and provide robust validation, a quantitative comparison between the analytical and numerical stress distributions was performed. The analysis focused on key interfaces (B, B’, C, C’) and major stratigraphic sections (A–B, B’–C, C–D), as demarcated by the black horizontal lines in Figure 10. The magnitude of the bending stress jump (Δσ) at each interface, calculated using Eq. (6), was extracted from both models. The absolute difference in Δσ and the relative difference in the correspondingstress concentration factor () are presented in Table 3. Furthermore, to evaluate the overall agreement of the stress profiles within each homogeneous section, the root mean square error (RMSE) and the coefficient of determination (R²) were computed. Additionally, the elastic bending energy per unit beam length, defined as the integral of the stress profile (, MPa·m), was calculated for corresponding sections. The difference in this energy and its percentage relative to the FEM solution are detailed in Table 4. It is important to note that for this comparative analysis, the stratigraphic column was simplified, treating the rock mass as homogeneous between the control sections, and the FEM data was interpolated onto the analytical model’s depth coordinates.
The quantitative data in Table 3 and Table 4 substantiate the qualitative agreement observed in Figure 10. The discrepancies are systematic and physically explicable. The analytical model, being purely linear-elastic, distributes the bending moment solely into elastic stress. In contrast, the FEM solution accounts for inelastic processes such as plastic deformation, creep, and, critically, progressive crack formation and propagation within the WPS. This is the primary reason for the consistently higher elastic energy in the analytical model (Table 4). The best agreement in both stress jumps (Table 3) and profile shape (RMSE, R²) is observed for the initial state (27 years), prior to significant crack development. The largest deviations occur in the B’–C section by 44 years, where the FEM model indicates extensive cracking and plasticity, leading to substantial stress redistribution and energy dissipation not captured by the analytical solution. Consequently, while the analytical multilayer beam theory correctly predicts the mechanism of tensile stress amplification in stiff central layers due to composite bending, the numerical model provides a more realistic magnitude by incorporating the stress-relaxing effects of inelastic damage. This combined qualitative and quantitative analysis strongly validates the core finding that stiffness contrasts govern the initial location and mechanism of tensile failure, even as subsequent damage modifies the stress field.
4. Discussion
The combined numerical and analytical analysis clarifies the mechanisms governing WCC initiation in stratified WPS above potash mine workings.
Locus of crack initiation and growth. In stratified WPS with a stiff intermediate salt layer, tensile failure localizes and coalesces into cracks within that layer due to the concentration of bending stresses in areas of high flexural rigidity. In contrast, in the homogeneous WPS model, tensile damage is more strongly associated with the roof immediately above pillars. This behavior is consistent with multilayer beam theory and highlights the importance of explicitly representing stratification in WPS models.
Role of interlayer bonds. Interlayer bonding controls whether layers act compositely or deform more independently. If the interface shear strength and stiffness are high, the layers remain coupled, and composite bending increases stresses in stiff layers. If they are low, or if slip/delamination develops early, deformation localizes at interfaces, energy is dissipated there, and tensile stresses in stiff layers are reduced. The continuum model with interface elements can approximate this behavior, but does not explicitly represent discrete blocks or open joints. For later stages of failure, more detailed discrete or combined models may be required.
Effect of creep and backfilling. Time-dependent deformation redistributes loads between pillars, WPS layers, and overburden. When the creep rate and plastic energy dissipation is slow relative to stress accumulation from mining process, tensile stresses can build up and fractures can form in the WPS. Backfilling provides additional support and modifies stress paths, accelerating stress redistribution and limiting tensile stress growth. Numerical simulations indicate that backfilling prevents the development of new tensile cracks in the WPS after mining, while cracks are accumulated in the central salt layer if there is no backfill.
Modeling implications and limitations. The present continuum finite-element model, combining Concrete damage-plasticity for WPS and N2PC-MCT creep for pillars, is able to reproduce observed subsidence and capture key qualitative features of WPS damage evolution. However, several limitations should be noted:
- plane-strain simplification doesn’t reflect three-dimensional effects associated with panel geometry and local structural features;
- IR content and mechanical properties of overburden and WPS layers are represented in a simplified manner, with limited site-specific calibration data;
- interface elements approximate interlayer slip but do not explicitly model through-going delamination;
- predictions beyond the onset of widespread chamber contact (after about 41 years) are less reliable because contact mechanics are not fully represented.
Quantitative discrepancies between simulated and observed subsidence curves, particularly in trough curvature, likely arise from these simplifications and the limited availability of detailed mechanical property data for overburden units.
From a practical standpoint, the results indicate that stiff central layers inside the WPS can be potentially dangerous zones where WCC may appear in the long term, especially if backfill is not applied or is incomplete.
5. Conclusions
- The identification of layers prone to WCC initiation should be based on their capacity to concentrate tensile stress during bending. This is governed by two factors: (1) a high stiffness contrast relative to neighboring layers and (2) sufficient layer thickness. Together, these parameters control the contribution to the composite section’s moment of inertia (Eq. 4) and, consequently, the resulting bending stresses (Eq. 5). Prior to mining, integrated geophysical profiling – using surface seismic reflection calibrated with acoustic broadband borehole logging – should be employed to construct a geological-geomechanical model (GGM) to map such critical layers [2]. During mining operations, routine surface subsidence measurements, specifically the maximum displacement , provide direct input for the analytical multilayer-beam solution (Eqs. 2–6). This model estimates the evolving tensile stress ,bending within the pre-identified stiff, thick layers. When the calculated safety factor approaches a critical value, a non-invasive monitoring protocol should be initiated, which could include enhanced monitoring (e.g., repeat seismic surveys) or measures to reduce bending effects in the WPS layers (e.g., prioritized backfilling of corresponding chambers). To mitigate the risk of crack development in the WPS, surface settlement above the mined-out chambers should be kept as uniform as possible, avoiding pronounced local extremes.
- The Concrete damage-plasticity model, combined with the N2PC-MCT viscoplastic creep model, reproduces laboratory behavior of sylvinite, carnallite, and rock salt and provides a realistic representation of WPS stress-strain evolution when calibrated to subsidence measurements at the Upper-Kama potash deposit.
- Long-term numerical simulations up to 50 years show that, without backfill, tensile damage in the WPS is mainly localized in a stiff central salt layer at depths of about -286.5 to -328.3 m. Most cracks appear roughly between 33 and 37 years after mining begins. In the case with backfill, propagation of tensile cracks in WPS practically stops after termination of mining.
- Comparison of stratified and homogeneous WPS models and results of an analytical multilayer beam model demonstrates that stiffness contrasts and composite bending of the WPS cause concentration of tensile stresses in stiff intermediate layers. That explains central-layer cracking observed in numerical simulations.
- For more detailed analysis of late failure stages and possible delamination, further development of models is needed, including three-dimensional simulations, improved characterization of rock properties and, possibly, hybrid discrete-continuum approaches.
Supplementary Materials
The following supporting information can be downloaded at the website of this paper posted on Preprints.org.
Author Contributions
Conceptualization, Gregorii Iovlev and Anna Andreeva; Data curation, Gregorii Iovlev and Andrey Katerov; Formal analysis, Andrey Katerov; Investigation, Gregorii Iovlev and Anna Andreeva; Methodology, Gregorii Iovlev; Project administration, Gregorii Iovlev; Resources, Anna Andreeva and Alisa Ageeva; Software, Gregorii Iovlev; Supervision, Gregorii Iovlev; Validation, Andrey Katerov and Alisa Ageeva; Visualization, Anna Andreeva; Writing – original draft, Andrey Katerov and Alisa Ageeva; Writing – review & editing, Gregorii Iovlev and Anna Andreeva.
Conflicts of Interest
The authors declare no conflicts of interest.
References
- Baryakh, A. A.; Gubanova, E. A. On flood protection measures for potash mines. Journal of Mining Institute 2019, 240, 613–620. [Google Scholar] [CrossRef]
- Kashnikov, Y.; Ermashov, А.; Efimov, А. Geological and geomechanical model of the verkhnekamsk potash deposit site. Journal of Mining Institute 2019, 237, 259–267. [Google Scholar] [CrossRef]
- Lomakin, I.; Tsayukov, A.; Evseev, A. Physical and mathematical modeling of rib pillar deformation and failure processes. Perm Scientific Center Journal 2021, 14(1), 47–53. [Google Scholar] [CrossRef]
- Pankov, I.; Anikin, V.; Beltyukov, N.; Evseev, A.; Kuzminykh, V.; Lomakin, I.; Morozov, I.; Toksarov, V.; Udartsev, A. Studying the deformation and failure of salt rocks for geomechanical assessing the stability of elements of the system for the mining at potash deposits. Perm Scientific Center Journal 2022, 3, 14–24. [Google Scholar] [CrossRef]
- Tatarkin, A. V. Prediction procedure for sinkholes in terms of the Upper Kama potassium-magnesium salt deposit. Mining Informational and Analytical Bulletin 2020, 2020(1), 121–132. [Google Scholar] [CrossRef]
- Konstantinova, S. A.; Spirkov, V. L.; Kartashov, Yu. M. Creep of rock salt samples under uniaxial compression. Journal of Mining Science 1979. [Google Scholar]
- Konstantinova, S.A.; Pestrenin, V.M.; Pestrenina, I.V. On various types of approximation of creep curves of salt rock samples. University Bulletin. Mining Journal 2007, 4. [Google Scholar]
- Petrov, D. N.; Abashin, V. I.; Karasev, M. A; Selikhov, A. A. Non-destructive testing applicability in rock mass strength estimation in underground mine at the Gremyachinsk deposit. MIAB. Mining Inf. Anal. Bull. 2024, 12–1. [Google Scholar] [CrossRef]
- Pulatsu, B.; Gonen, S.; Erdogmus, E.; Lourenço, P. B.; Lemos, J. V.; Hazzard, J. Tensile Fracture Mechanism of Masonry Wallettes Parallel to Bed Joints: A Stochastic Discontinuum Analysis. Modeling 2020, 1(2). [Google Scholar] [CrossRef]
- Zherlygina, E.S.; Kuranova, M.E.; Gusev, V.N.; Odintsov, E.E. Identification of hazardous sites based on studying the development of man-made fractures within the rock mass. Russian Mining Industry 2025, 1, 162–169. [Google Scholar] [CrossRef]
- Belyakov, N. A.; Emelyanov, I. A. Inclusion of rock mass fracturing in determina tion of in situ stress state by overcoring using multi-component displacement sensor. MIAB. Mining Inf. Anal. Bull. 2024, 12(1). [Google Scholar]
- Demenkov, P. A.; Basalaeva, P. Regularities of Brittle Fracture Zone Formation in the Zone of Dyke Around Horizontal Mine Workings. Eng 2025, 6(5), 91. [Google Scholar] [CrossRef]
- Lubliner, J.; Oliver, J.; Oller, S.; Oñate, E. A plastic-damage model for concrete. International Journal of Solids and Structures 1989, 25(3), 299–326. [Google Scholar] [CrossRef]
- Schütz, R.; Potts, D. M.; Zdravkovic, L. Advanced constitutive modeling of shotcrete: Model formulation and calibration. Computers and Geotechnics 2011, 38(6), 834–845. [Google Scholar] [CrossRef]
- Marinelli, F.; Zalamea, N.; Vilhar, G.; Brasile, S.; Cammarata, G.; Brinkgreve, R. Modeling of brittle failure based on Hoek & Brown yield criterion: parametric studies and constitutive validation. 53rd US Rock Mechanics/Geomechanics Symposium, 2019. [Google Scholar]
- Gusev, V. N. Forecast of safe conditions for the development of a suite of coal seams under water bodies based on the geomechanics of man-made water-conducting cracks. Journal of Mining Institute 2016. [Google Scholar] [CrossRef]
- Wu, P.; Zhou, D.; Liu, W. 2-D elasticity solution of layered composite beams with viscoelastic interlayers. Mechanics of Time-Dependent Materials 2016, 20(1), 65–84. [Google Scholar] [CrossRef]
- Yang, Z.; Wu, P.; Liu, W. Time-dependent behavior of laminated functionally graded beams bonded by viscoelastic interlayer based on the elasticity theory. Archive of Applied Mechanics 2020, 90(7), 1457–1473. [Google Scholar] [CrossRef]
- Girhammar, U. A. A simplified analysis method for composite beams with interlayer slip. International Journal of Mechanical Sciences 2009, 51(7), 515–530. [Google Scholar] [CrossRef]
- Sousa, J. B. M.; da Silva, A. R. Analytical and numerical analysis of multilayered beams with interlayer slip. Engineering Structures 2010, 32(6), 1671–1680. [Google Scholar] [CrossRef]
- Xie, B.; Tian, R.; Zhao, H.; Ye, T.; Zhang, Y.; Hu, N. Controlling crack propagation in layered beams with architected lattice-reinforced composite interlayer designs. Construction and Building Materials 2024, 426, 136174. [Google Scholar] [CrossRef]
- Olmedo, F. I.; Valivonis, J.; Cobo, A. Experimental Study of Multilayer Beams of Lightweight Concrete and Normal Concrete. Procedia Engineering 2017a, 172, 808–815. [Google Scholar] [CrossRef]
- Olmedo, F. I.; Valivonis, J.; Cobo, A. Experimental Study of Multilayer Beams of Lightweight Concrete and Normal Concrete. Procedia Engineering 2017b, 172, 808–815. [Google Scholar] [CrossRef]
- Kim, H.-J.; Yoon, K.; Lee, P.-S. Continuum mechanics based beam elements for linear and nonlinear analyses of multi-layered composite beams with interlayer slips. Composite Structures 2020, 235, 111740. [Google Scholar] [CrossRef]
- Protosenya, A. G.; Katerov, A. M. Development of stress and strain state of combined support for a vertical shaft driven in salt massif. Mining Informational and Analytical Bulletin 2022, 6-1, 100–113. [Google Scholar] [CrossRef]
- Wu, P.; Zhou, D.; Liu, W.; Fang, H. Time-dependent behavior of layered arches with viscoelastic interlayers. Mechanics of Time-Dependent Materials 2018, 22(3), 315–330. [Google Scholar] [CrossRef]
- Ju, M.; Wang, D.; Shi, J.; Li, J.; Yao, Q.; Li, X. Physical and numerical investigations of bedding adhesion strength on stratified rock roof fracture with longwall coal mining. Geomechanics and Geophysics for Geo-Energy and Geo-Resources 2021, 7(1), 24. [Google Scholar] [CrossRef]
- Chen, J.; Zhao, J.; Zhang, S.; Zhang, Y.; Yang, F.; Li, M. An Experimental and Analytical Research on the Evolution of Mining Cracks in Deep Floor Rock Mass. Pure and Applied Geophysics 2020, 177(11), 5325–5348. [Google Scholar] [CrossRef]
- Ju, J.; Xu, J. Structural characteristics of key strata and strata behaviour of a fully mechanized longwall face with 7.0m height chocks. International Journal of Rock Mechanics and Mining Sciences 2013, 58, 46–54. [Google Scholar] [CrossRef]
- Dawei, Z.; Kan, W.; Zhihui, B.; Zhenqi, H.; Liang, L.; Yuankun, X.; Xinpeng, D. Formation and development mechanism of ground crack caused by coal mining: effects of overlying key strata. Bulletin of Engineering Geology and the Environment 2019, 78(2), 1025–1044. [Google Scholar] [CrossRef]
- Belikov, A.A.; Belyakov, N.A. Method for ensuring geomechanical safety during undermining of water-protective strata. Sustainable Development of Mountain Territories 2025, 17(1), 115–125. [Google Scholar] [CrossRef]
- Shi, Q.; Mishra, B. Discrete Element Modeling of Delamination in Laboratory Scale Laminated Rock. Mining, Metallurgy & Exploration 2021, 38(1), 433–446. [Google Scholar] [CrossRef]
- Zhang, J.; Wu, J.; Yang, T.; Yang, S.; He, Y.; Gao, S.; Peng, B. Analysis of Fracture Evolution Characteristics and Formation Mechanism of Inter-Layer Rock Under Different Mining Areas. Rock Mechanics and Rock Engineering 2024, 57(5), 3787–3811. [Google Scholar] [CrossRef]
- Karasev, M. A.; Petrushin, V. V.; Rysin, A. I. The hybrid finite/discrete element method in description of macrostructural behavior of salt rocks. Mining Informational and Analytical Bulletin 2023, 4, 48–66. [Google Scholar] [CrossRef]
- Rybak, J.; Khayrutdinov, M. M.; Kuziev, D. A.; Kongar-Syuryun, C. B.; Babyr, N. V. Prediction of the geomechanical state of the rock mass when mining salt deposits with stowing. Journal of Mining Institute 2022, 253(1), 61–70. [Google Scholar] [CrossRef]
- Kovalskii, E. R.; Gromtsev, K. V. Development of the technology of stowing the developed space during mining. Journal of Mining Institute 2022, 254, 202–209. [Google Scholar] [CrossRef]
- Baryakh, A. A.; Devyatkov, S. Y.; Denkevich, E. T. Mathematical modeling of displacement during the potash ores mining by longwall faces. Journal of Mining Institute 2023, 259, 13–20. [Google Scholar] [CrossRef]
- Baryakh, A. A.; Samodelkina, N. A. Water-Tight Stratum Rupture under Large-Scale Mining. Part II. Journal of Mining Science 2012, 48(6), 12–20. [Google Scholar]
- Asanov, V. A.; Pankov, I.L.; Evseev, V.S. Evaluation of strength and deformation properties of salt rocks under tension. In Geology, Geophysics and Development of Oil and Gas Deposits; 2010. [Google Scholar]
- Baryah, A. A.; Asanov, V. A.; Pankov, I. L. Physical and mechanical properties of salt rocks of the Upper-Kama potash deposit. 2008. [Google Scholar]
- Höfer, K. H.; Thoma, K. Triaxial tests on salt rocks. International Journal of Rock Mechanics and Mining Sciences & Geomechanics Abstracts 1968, 195–196. [Google Scholar]
- Konstantinova, S. A.; Aptukov, V. N. Some problems of mechanics of deformation and fracture of salt rocks. In OAO Galurgiya; 2013. [Google Scholar]
- Proskuryakov, N. M.; Permyakov, R. S.; Chernikov, A. K. Physical and mechanical properties of salt rocks; Nedra., 1973. [Google Scholar]
- Silberschmidt, V.G.; Timofeev, V.V. Study of the strength of salt rock mass using fracture mechanics methods. Journal of Mining Science 1987, 9, 22–25. [Google Scholar]
- Solovyev, V. A.; Aptukov, V. N.; Vaulina, I. B. Mine workings maintenance in salt rocks. Mining Informational and Analytical Bulletin (Scientific and Technical Journal) 2017, №2, 344–356. [Google Scholar]
- Protosenya, A.G.; Kumov, V. V. Effect of soil body structure of mixed-type tunnel face on shape and size of subsidence trough on ground surface. Mining Informational and Analytical Bulletin (Scientific and Technical Journal) 2024, 4, 5–21. [Google Scholar] [CrossRef]
- Pankov, I.L.; Garaeva, Yu.I. Study of mechanical properties of salt rocks under tension. In Mining Informational and Analytical Bulletin (Scientific and Technical Journal); 2011. [Google Scholar]
- Vodopyanov, V. L.; Urazzoova, A. M. Some results of the study of carnallite deformability over time. Proceedings PerNIUI, 1964; 7. [Google Scholar]
- Rysin, A. I.; Lebedeva, A. M.; Otkupshchikova, I. A.; Nurtdinov, A. S. Strength variation patterns in salt rocks owing to increased halopelite content. Gornyi Zhurnal 2025, 3, 19–27. [Google Scholar] [CrossRef]
- Ermashov, A.O. Geomechanical justification of calculations of ground surface subsidence during the extraction of potassium-magnesium ores (using the example of the Verkhnekamskoye deposit of potassium-magnesium salts). thesis abstract. 2015. [Google Scholar]
- Baryakh, A.; Tsayukov, A. Elastic-viscoplastic deformation models of salt rocks. Frattura Ed Integrità Strutturale 2024, 18(70), 191–209. [Google Scholar] [CrossRef]
- Demenkov, P. A.; Romanova, E. L. Regularities of Plastic Deformation Zone Formation Around Unsupported Shafts in Tectonically Disturbed Massive Rock. Geosciences 2025, 15(1), 23. [Google Scholar] [CrossRef]
- Fedooseev, A. K. On the possibility of minimizing the risk of disturbance of the continuity of the waterproof layer in potentially hazardous sites. Mining Echo 2021, 2, 27–31. [Google Scholar] [CrossRef]
- Kashnikov, Yu. A.; Ermashov, A.O.; Lebedeva, O.O. 3D geomechanical modeling as the basis for solving complex problems of potassium salt development safety. In Minerals and Mining Engineering; 2019. [Google Scholar] [CrossRef]
- Pankov, I. L.; Garaeva, Yu. I. Study of mechanical properties of salt rocks under tension. Mining Informational and Analytical Bulletin (Scientific and Technical Journal) 2011, 9, 154–157. [Google Scholar]
- User Defined Soil Models: N2PC-MCT a Viscoplastic Creep Model Including a Plastic Failure Mechanism for Rocks. 2022.
Figure 1.
The calculation scheme of the plane strain model with stratigraphy.

Figure 2.
Laboratory test data used for calibration: (a) averaged uniaxial compression curves [47], where the red segment indicates the elastic portion; (b) failure envelope under different confinements. Red points indicate salt, blue dots indicate sylvinite, and black points indicate carnallite. Solid lines of the corresponding colors show linear fits.

Figure 3.
Mine map and surface subsidence in mm; black squares represent surveys observation points, the location of the cross-section for the 2D FEM is marked by the black horizontal line.
Figure 3.
Mine map and surface subsidence in mm; black squares represent surveys observation points, the location of the cross-section for the 2D FEM is marked by the black horizontal line.

Figure 4.
Observed and simulated ground-surface subsidence (solid blue curves - numerical simulations; black dashed lines - individual field measurements; grey dashed lines - mine development stages).
Figure 4.
Observed and simulated ground-surface subsidence (solid blue curves - numerical simulations; black dashed lines - individual field measurements; grey dashed lines - mine development stages).

Figure 5.
Comparison of field measurements of ground-surface displacement with numerical results at different time periods. Dashed lines represent in situ data, and solid lines represent numerical modeling results. Curves of the same color correspond to the same forecast period.
Figure 5.
Comparison of field measurements of ground-surface displacement with numerical results at different time periods. Dashed lines represent in situ data, and solid lines represent numerical modeling results. Curves of the same color correspond to the same forecast period.

Figure 6.
Verification of Concrete model parameters for (a) sylvinite and (b) rock salt. Black lines represent uniaxial and triaxial compression tests at different confining pressures. Blue lines show numerical simulations using analytically selected parameters, whereas red lines show simulations using optimized parameters.

Figure 7.
Predicted peak-to-trough displacement over a 50-year period. Forecast reliability decreases after year 41 due to chamber-wall contact. The black dashed line indicates in situ measurements of chamber sidewall closure (with backfill); the blue line indicates the 50-year numerical forecast of sidewall closure with backfill; the red line indicates the 50-year numerical forecast of sidewall closure without backfill; and the gray dashed line indicates the numerical forecast that does not account for sidewall contact.

Figure 8.
Integration-point conditions at year 44 on the top and zoomed part of model with history integration points on the bottom.
Figure 8.
Integration-point conditions at year 44 on the top and zoomed part of model with history integration points on the bottom.

Figure 9.
Distribution of horizontal stress concentration factors along a vertical section constructed at coordinate x = 140 m a) - for a real lithological section; b) - for a lithological section composed of homogeneous materials; green line represents data for the 27th year, red line - for the 37th year, blue line - for the 44th year.

Figure 10.
An example of an analytical solution for the distribution of stresses during bending of a multilayer beam on two supports under the action of its own weight and the distribution of bending stresses in a geological section, dotted lines represent analytical treatment, solid lines - finite element modeling, green lines represent data for the 27th year, red lines - for the 37th year, blue lines - for the 44th year.


Table 1.
Concrete model input data after parameter optimization.
| Parameter | Parameter design | Recommended value | Dimension | ||
| Silvinite (S) | Carnallite | Rock salt | |||
| Elastic parameters | |||||
| Young’s modulus | E28 | 0.877 | 0.6 | 1.467 | GPa |
| Poisson’s ratio | ν | 0.3 | 0.3 | 0.3 | |
| Compression parameters | |||||
| Uniaxial compressive strength | fc.28 | 21.96 | 6.54 | 22.88 | MPa |
| Normalized elastic limit, fcy/fc | fc0n | 0.683 | 0.925 | 0.81 | - |
| Normalized ultimate strength, fcf/fc | fcfn | 0.07 | 0.081 | 0.056 | - |
| Normalized residual strength, fcu/fc | fcun | 0.05 | 0.05 | 0.051 | - |
| Compressive fracture energy | Gc.28 | 245 | 150 | 367 | kN/m |
| Internal friction angle at fracture fcf | φmax | 50.43 | 47.55 | 55.05 | º |
| Tensile parameters | |||||
| Uniaxial tensile strength | ft.28 | 0.27 - 2.00 | 0.19 - 0.85 | 0.56 - 2.26 | MPa |
| Normalized residual tensile strength, ftu/ft | Ftun | 0.01 | 0.01 | 0.01 | - |
| Tensile fracture energy | Gt.28 | 0.12 - 0.15 | 0.06 | 0.18 | kN/m |
| Creep parameters | |||||
| Relationship between elasticity and creep deformation | 6 | 4.17 | 1.4 | degrees | |
| Time at which 50% creep occurs | 11.25 | 9 | 6.25 | day | |
Table 2.
Integration points state of the WPS over a long period of time after the start of tunneling. (black square shows the selected and enlarged zone on the right, where the selected integration points shown from the initial phase).
Table 2.
Integration points state of the WPS over a long period of time after the start of tunneling. (black square shows the selected and enlarged zone on the right, where the selected integration points shown from the initial phase).
| WPS condition | ||
| a) |  |
Zoomed
|
| 27th year | ||
| b) |  |
 |
| 37th year | ||
| c) |  |
 |
| 44th year | ||
Table 3.
Quantitative comparison of bending stress jumps (Δσ) and stress concentration factors at key interfaces.
Table 3.
Quantitative comparison of bending stress jumps (Δσ) and stress concentration factors at key interfaces.
| Inter. | (yr) | (MPa) | |
| B | 27 | 0.61 | 0.09 |
| 37 | 0.51 | 0.07 | |
| 44 | 0.31 | 0.05 | |
| B’ | 27 | 2.76 | 0.39 |
| 37 | 2.84 | 0.4 | |
| 44 | 2.5 | 0.36 | |
| C | 27 | 1.71 | 0.22 |
| 37 | 3.64 | 0.46 | |
| 44 | 4.74 | 0.6 | |
| C’ | 27 | 0.33 | 0.04 |
| 37 | 0.46 | 0.06 | |
| 44 | 0.38 | 0.05 |
Table 4.
Section-wise quantitative assessment of stress profile agreement and elastic bending energy. .
Table 4.
Section-wise quantitative assessment of stress profile agreement and elastic bending energy. .
| Section | Year (yr) | Data comparing | Energy comparing | |||
| RMSE (MPa) | Energy difference () | Dissipated Energy (%) | ||||
| A-B | 27 | 0.412 | 0.647 | -6.948 | 9.04 | |
| 37 | 0.441 | 0.753 | 11.787 | 10.36 | ||
| 44 | 0.615 | 0.724 | 35.031 | 23.75 | ||
| B’-C | 27 | 2.571 | -2.09 | -95.209 | 34.82 | |
| 37 | 3.264 | -6.241 | -118.682 | 35.95 | ||
| 44 | 4.261 | -20.803 | -172.685 | 53.6 | ||
| C’-D | 27 | 0.393 | -4.747 | 13.598 | 17.99 | |
| 37 | 0.607 | -4.688 | 21.123 | 21.87 | ||
| 44 | 0.797 | -5.094 | 27.891 | 25.1 | ||
Disclaimer/Publisher’s Note: The statements, opinions and data contained in all publications are solely those of the individual author(s) and contributor(s) and not of MDPI and/or the editor(s). MDPI and/or the editor(s) disclaim responsibility for any injury to people or property resulting from any ideas, methods, instructions or products referred to in the content. |
© 2026 by the authors. Licensee MDPI, Basel, Switzerland. This article is an open access article distributed under the terms and conditions of the Creative Commons Attribution (CC BY) license (http://creativecommons.org/licenses/by/4.0/).
Copyright: This open access article is published under a Creative Commons CC BY 4.0 license, which permit the free download, distribution, and reuse, provided that the author and preprint are cited in any reuse.


