
Submitted:
01 March 2026
Posted:
03 March 2026
You are already at the latest version
Abstract
Background/Objectives: Age-related changes in body composition (bone, muscle, and adipose tissue) are often assumed to follow linear, sex-specific patterns. Some evidence suggests that these trajectories are nonlinear, and their timing and dynamics remain poorly characterized. Osteosarcopenic adiposity/obesity (OSA), defined by the coexistence of osteopenia/osteoporosis, sarcopenia, and excess/redistributed adiposity, is recognized as a body composition disorder associated with multiple morbidities, but its impact on age-related body composition trajectories has not been fully explored. We aimed to delineate sex-specific, age-related trajectories of bone, muscle, fat mass, and intramuscular adipose tissue (IMAT), identify inflection points across adulthood, and compare patterns in individuals without and with OSA. Methods: Cross-sectional data from 9717 healthy Caucasian adults (aged 20–90 years) enrolled in a multicenter Italian study were analyzed. Body composition was measured using validated bioelectrical impedance analysis. LOESS regression was employed to identify age-related inflection points. Standard diagnostic criteria defined osteopenia/osteoporosis, sarcopenia, adiposity, and OSA. Results: Men exhibited earlier peaks and midlife stability in bone and muscle mass, followed by later decline. Women showed lower baseline values, multiple early-life inflection points, and sharper midlife downturns, particularly around menopause. Fat mass increased steadily in men but followed a multi-phasic pattern in women. IMAT rose progressively with age in both sexes. Adults with OSA, identified in participants even as young as 20 years, demonstrated destabilized trajectories, earlier downturns in bone and muscle, and more complex body fat and IMAT patterns. Conclusions: Distinct sex-specific patterns and mitigating effect of OSA on body composition trajectories were identified. Early detection of OSA may be crucial for preventing acceleration of musculoskeletal decline and rise in adiposity.
Keywords:
body composition
; osteopenia/osteoporosis
; sarcopenia
; adipose tissue
; intramuscular adipose tissue
; osteosarcopenic adiposity
1. Introduction
Recent studies have refuted the longstanding notion that physiological processes associated with aging and contributing to the development of chronic diseases, follow a linear progression. Instead, the studies revealed the greater complexity inherent in age-related physiological changes [1,2]. The assumption of linearity has also been extended to changes in primary body composition components. Traditionally, it has been posited that reductions in bone and muscle mass and increases in adipose tissue among women are linked to menopause, whereas the timing and progression of analogous body composition changes in men have remained insufficiently characterized.
While women experience significant bone loss around menopause resulting in osteopenia or osteoporosis [3,4,5,6], the onset and progression of such changes in men, as well as the nuances of these processes in both sexes, are less clear. Age-related risks similarly influence muscle tissue loss and fat accumulation and redistribution in both men and women [7,8]. Notably, fat redistribution may manifest as increased visceral adiposity [9] or ectopic fat infiltration into bone and muscle, the latter known as intramuscular adipose tissue (IMAT), ultimately contributing to deterioration of each tissue [10,11]. However, the precise timing of muscle mass/strength loss (resulting in sarcopenia) and fat accumulation or redistribution has not been clearly established in either sex, aside from the common belief that these changes in women are menopause-related [4,12,13].
An increasingly recognized impairment in body composition is the osteosarcopenic adiposity/obesity (OSA/OSO) syndrome. This condition represents the concurrent, predominantly age-related alterations in bone, muscle, and adipose tissues, resulting in a cumulative effect characterized by reduction in bone and muscle mass alongside an increase and/or redistribution of adipose tissue [14]. Global research across diverse populations indicates that OSA constitutes a significant body composition disorder, exhibiting a bidirectional association with cardiometabolic abnormalities such as dyslipidemia, hypertension, and elevated inflammatory markers [15]. Furthermore, evidence suggests potential links between OSA and certain malignancies, as well as multiple chronic conditions [16]. Consequently, the identification of OSA and the determination of inflection points where trajectories of body composition components shift direction, as well as their sex-specific variations across ageing may enhance understanding of these physiological changes. Such insights could inform more specific diagnostic assessments and facilitate targeted interventions for both the younger and ageing populations.
Given the critical role of body composition in health and disease, we aimed to delineate the relationship between chronological age and body composition components (bone, muscle, and adipose tissue) in healthy adults. We mapped age-related trajectories and identified inflection points for each component, keeping in mind biological triggers such as hormonal changes, and possible shifts in metabolic functions that occur during ageing. Additionally, we assessed the presence of OSA in both sexes and compared trajectories in individuals without and with OSA. To our knowledge, this is the first study to comprehensively characterize these trajectories across the adult lifespan in a healthy population.
2. Materials and Methods
2.1. Participants and Study Design
Participants in this study comprised men and women of Caucasian ancestry, aged between 20 and 90 years, who were enrolled in a larger multicenter cross-sectional investigation conducted in Italy from 2010 to 2014. Informed consent was obtained from all participants, and all completed a comprehensive medical history questionnaire. The study protocol received approval from the Consortium for the Science and Technology Research (AREA), Trieste, Italy, and adhered to the ethical principles outlined in the Declaration of Helsinki. Individuals were excluded if they had a history or current diagnosis of any chronic disease, recent fractures, heavy alcohol consumption, use of medications affecting bone metabolism or other long-term pharmacological treatments, established or suspected pregnancy, or the presence of metal prostheses or implanted electronic devices. Further methodological details are available in Cvijetic et al. [17].
2.2. Anthropometric and Bioimpedance Measurements
Body height (cm) and weight (kg) were measured in indoor clothing and without shoes. Body mass index (BMI; kg/m²) was subsequently calculated. Body composition was evaluated using bioelectrical impedance analysis (BIA-ACC; BioTekna®, Marcon–Venice, Italy). In addition to quantifying soft tissues (lean/muscle and adipose), the BIA-ACC device provides a unique capability to measure total bone mass (kg). The device has been validated against dual-energy X-ray absorptiometry (DXA) [18]. All measurements were conducted with participants in a supine position, using two electrodes placed on the right hand (metacarpal and wrist regions) and two on the right foot (metatarsal and ankle regions). The parameters obtained included: total bone mass (kg); lean mass (expressed as a % of body weight); muscle mass (expressed as a % of lean mass); fat mass (FM, expressed as a % of body weight); and intramuscular adipose tissue (IMAT, expressed as a % of body fat). Osteopenia and osteoporosis were diagnosed based on T-score thresholds (≤ −1.0 for osteopenia and ≤ −2.5 for osteoporosis). Sarcopenia was defined by an S-score ≤ −1.0 for muscle mass, while overweight/adiposity was classified according to total body fat percentage (≥ 25% for men and ≥ 32% for women) [19]. The concurrent presence of osteopenia/osteoporosis, sarcopenia, and overweight/adiposity constituted the diagnostic criterion for OSA syndrome.
2.3. Statistical Analysis
This is a retrospective cross-sectional study. The results are presented as mean and standard deviation for continuous variables and as percentages for categorical variables. The normality of the distribution was tested using the Kolmogorov–Smirnov test. Since the majority of variables were not normally distributed, the differences between mean values were tested with the Wilcoxon rank-sum test (PROC NPAIRWAY in SAS). The inflexion points for each outcome (dependent variable) were calculated against the age, as the independent variable from PROC LOESS in SAS. The outcomes included bone mass as a T-Score, muscle mass as an S-Score, FM as % of body weight, and IMAT as % of body fat. The analytic approach was based on estimating the points where a regression curve has zero slope, using the linear interpolation between age points where slope is zero [20].
3. Results
A total of 9717 participants (n=6412 women, 65.9%) were included, with the mean age of 47.7 years. All body composition parameters, except FM%, were higher in men than in women (P<0.001) (Table 1 and Table 2). According to BMI, more than half of women (55.2%) had a normal body weight, while more than half of men were overweight or obese (57.9%). Also, more women than men were “undernourished” according to BMI < 18.5 kg/m2 (3.5% vs. 0.6%, respectively; P < 0.001). Compared to the normal reference, mean values for FM% and IMAT% were higher in both men and women, while mean T-Scores were lower in women but within the normal range in men. Similar values were observed regarding the muscle mass and S-scores. The values of the anthropometric measurements and other body composition components in all men and women, as well as in those without and with OSA are presented in Table 1 and Table 2.
Osteoporosis was detected in 3.9% women and none in men, and osteopenia in 58.5% women and in 20.4% men (P<0.001). More women (54.9%) than men (28.1%) had sarcopenia (P<0.001). Obesity based on FM%, was detected in 65.1% women and 86.1% men (P<0.001). In all age groups, men had higher prevalence of obesity than women but a lower prevalence of sarcopenia and osteopenia/osteoporosis, with the exception in the oldest age group. The prevalence of overweight/obesity according to BMI (≥25.0 kg/m2) was lower than according to FM% in all age groups and was also higher in men than in women, except in the oldest age group (all P≤0.001). As expected, OSA prevalence was higher in women, except in the youngest group. Surprisingly, the prevalence of OSA in men and women between 20-30 years was at 4.6% (out of n=436) and 2.6% (out of n=776), respectively.
3.1. Bone Mass Trajectories for Men and Women
Trajectories with inflexion points in men and women are presented in Figure 1 and Figure 2 (A, B, C), respectively. Based on the presented trends, men showed earlier peak bone mass, greater midlife stability, and delayed acceleration of bone loss, compared to women. Women exhibited lower baseline values for bone mass, more complex early pattern in changes, and menopause-related trend toward rapid loss. The presence of OSA destabilized male bone loss (with alternate minima and maxima) and speeded up female bone loss.
3.2. Muscle/Lean Mass Trajectories for Men and Women
Trajectories with inflexion points in men and women are presented in Figure 3 and Figure 4 (A, B, C), respectively. Overall patterns in men showed clear early-mid adulthood peak, extended plateau, then gradual decline, while patterns in women were irregular with multiple inflection points, slow decline until ~60 years, and then progressive downturn. The presence of OSA in men reflected a fluctuating pattern with two midlife inflections then continuous decline, while in women, there was no significant inflection -- just a steady downward trend with age. Similar to bone mass patterns, female trajectories showed greater complexity and a steady decline, particularly with advancing age.
3.3. Fat Mass (%) Trajectories for Men and Women
Trajectories with inflexion points in men and women are presented in Figure 5 and Figure 6 (A, B, C), respectively. Overall, men exhibited a generally flat, age-progressive FM% increase, while women exhibited multiple inflection points between ~26–55 years, early local minima (~26 years, ~28% FM), then upward trend into the mid-70ties, followed by plateau and subsequent slight rise. In the presence of OSA, trajectories in men showed multiple inflection points between ~52–69 years with FM ~32–35%, and then continuous increase. Trajectory in women showed early maxima (~42 years, 34.9% FM), rise to late peak (~73 years, 39.2% FM), slight dip (~78 years, 38.% FM), and then steep increase. Briefly, OSA in men resulted in late, clustered fluctuations with flat increase afterward, while in women there was a prolonged multi-phase pattern with late-life dip and subsequent rebound.
3.4. Intramuscular Adipose Tissue (%) Trajectories for Men and Women
Trajectories with inflexion points in men and women are presented in Figure 7 and Figure 8 (A, B, C), respectively. Overall patterns in men showed almost linear upward trend across age, while in women, there was also an upward trend, but with some early- and late-life inconsistencies, suggesting greater age-specific variability. In the presence of OSA, patterns in men showed minor late inflections between ~64–67 years, then an upward trend, while in women, there was a late local maxima (~74 years), slight dip, and then continued upward trend.
4. Discussion
Our results show sex-specific inflexion points and changes with ageing for bone, muscle, and body fat in generally healthy men and women ranging in age from 20 to 90 years. The data also revealed early presence of OSA and distinct trajectories between those without and with OSA, implying possible adverse outcomes of the latter.
4.1. Bones
In general, bone turnover (resorption and formation) is in balance between the ages 30-50 years in both men and women. After the age of ~50 years, bone resorption surpasses bone formation; mostly due to hormonal (estrogen and testosterone) decline, particularly pronounced in women [13,21,22,23] and implicated for men. Importantly, the peak bone mass along with the age-related bone loss are main determinants of resistance or susceptibility to bone fractures and timing of both are important. This applies mostly to trabecular bone (predominantly in spine and femoral neck) which starts to decline immediately after the peak has been reached in late tennage years [21]. This does not necessarily indicate a decrease in bone strength, since bone mass expansion also reflects the periosteal expansion in young adulthood; thus the maintenance of bone mass at these sites may compensate for the changes in trabecular density. As was previously shown in women [21], the other regions of skeletal sites show minimal change or slight gain in bone mass during young adulthood, again due to continuous periosteal expansion.
Congruent with these findings, our data show precise timing and the shifts with age in both men and women. However, in our study, only the total bone mass (kg) was measured, thus we could not distinguish between different skeletal sites and those with predominantly cortical or trabecular bone. Nevertheless, our data show that the maximum bone mass in all men was achieved by the age of 35 years (with T-Score of -0.2), plateauing to early fifties and then declining. However, men without OSA showed more stable and higher bone mass with the maximum inflexion point at 42 years (T-Score -0.1) and slower decline, starting at about 55 years. In contrast, men with OSA, had a minimum inflexion point already at age 42 years (T-Score -1.4), followed by some maintenance and then rapid decline after age 78 years. These fluctuations indicate less stable bone mass/T-Scores, possibly because of the osteoarthritic changes precluding accurate analyses of the scans. As expected, and in contrast to men, women experienced lower bone mass overall, and even those without OSA had multiple inflexion points between 29 and 46 years. The early dip at 29 years (T-Score -0.9) rebounded at ~ 37 years. At about 60 years, the T-Scores dropped below -1 and the downward trend continued with age. Women with OSA exhibited a continuous downward trend starting at age 20 years with T-Score at about -1.4 and continuing further with no identified inflexion point.
4.2. Muscle
Muscle mass was assumed to increases from birth until 30-35 years with subsequent maintenance until about the age of 65 years for women and 70 years for men. Specifically, as per earlier report, muscle mass peaks between the second and fourth decades of life [24]. The results from a study investigating lean/muscle mass in 471 healthy Caucasian women, revealed that in premenopausal women an average lean mass was 63.0% of body weight, while in postmenopausal women it was 52.4% (p<0.05) [25]. This study showed a significant decline in muscle mass after women went through menopause (on average at ~50 years).
In our study, the changes in muscle/lean mass with age in men showed an upward trend to about 35 years (with local maxima, S-Score 0.1), then plateauing to ~48 years, and then declining with advancing age. Men without OSA reached the maximum muscle mass (S-Score 0.2) at about 38 years and after sustaining this level to about age of 50 years, experienced a slight downturn with ageing. There was no identified inflexion point in men with OSA -- just a continuous downturn which started from the age of 20 years (S-Score below -1), carrying the downturn trend in all men. Based on our data, all women experienced several inflexion points between 29-35 years, with a S-Score of about -0.5. Subsequently, a slow downturn occurred to the age of 60 years, and then a steeper downturn continued with ageing. When analyzing separately women without and with OSA, clearer picture is revealed, indicating that those with OSA drove the downward trends in all women. The women without OSA experienced inflexion points between 27-60 years with S-Scores from -0.5 and -0.8. After about 70 years, the S-Scores assumed steeper downward trend. Women with OSA experienced a continuous downturn in muscle/lean mass starting at 20 years (S-Score -1) with no identified inflexion point.
4.3. Body Fat and IMAT
Body fat change and distribution are also different between men and women throughout the age. Although women tend to have more overall body fat compared to men, when it comes to visceral adipose tissue, men accumulate more, resulting in the well-known “pear vs. apple” (women vs. men) body shape, even with equal BMIs [26]. A wealth of research addressed detrimental effects of visceral and ectopic fat and their relations to metabolic syndrome, cardiovascular risk factors, cancers, and other chronic diseases, due to the secretion of proinflammatory cytokines and creation of higher inflammatory environment [10,27,28]. Additionally, adipose tissue, an energy reservoir and endocrine organ, undergoes significant changes and redistribution during ageing also causing physiological declines and age-related disease, such as dyslipidemia, chronic inflammation, insulin resistance, and type 2 diabetes [29,30,31,32]. Furthermore, adipose stem cells decrease their effectiveness with age, which may be a reason why there is a decrease in subcutaneous fat, but increase in intramuscular fat with ageing [33].
Our data show a steady increase in fat mass in all men, as well as in those without OSA, who experienced maximum inflexion point at ~61 years (FM 35.6%) and then further upward trend. Men with OSA exhibited multiple maxima and minima between 52-69 years, driving this instability in the data with all men. There was a steady increase in body fat with age in all women, as well. The women without OSA experienced the upward trend with the first maxima at 39 years (31.6% FM). After the upward trend, and some fluctuations, the last maxima occurred at 69 years (FM 38.5%), with subsequent slight downward trend, possibly explained by the decreased activity of adipocytes with ageing [33]. Those with OSA experienced the first maxima at 42 years with 34.9% FM, with continued upward trend to ~73 years, reaching 39.2% FM. Subsequently there was a short downturn at ~78 years (38.2% FM) followed by a further steep upward trend.This group carried the upward trend in all women.
The rise in IMAT with age had a similar trend in both men and women and in those without and with OSA. Men without OSA started at about 1.5% IMAT followed by the upward trend with age to about 2.9% IMAT without identified inflexion point. Men with OSA started at about 1.8% IMAT and experienced maximal inflexion point at ~64 years (2.6% IMAT), followed by the upward trend to ~3% IMAT. Similarly, women started at ~1.5% IMAT and experienced a steady increase to about 3%, but there was no identifiable inflexion point, except in those with OSA. It is interesting to note that men had higher IMAT% compared to women (normal should be ≤2%), despite that men have larger muscle mass and typically exhibit higher muscle exertion than women.
As clearly shown here, sex-specific differences exist in the age-related changes of bone, muscle, and fat tissue distribution. Importantly, as addressed earlier, their respective impacts on health outcomes are sex specific as well [26,34]. Increased muscle mass does not universally confer health benefits, nor does greater fat mass invariably result in adverse outcomes among older adults. For example, men consistently possess higher bone and muscle mass than women across the lifespan, while women (particularly in mid age) tend to have greater fat mass. However, the functional significance of these tissues is contingent upon both their absolute volume and regional distribution. In men, higher muscle mass is generally associated with improved physical function, reduced risk of falls, and better cognitive outcomes. Conversely, in women, a moderate increase in fat mass may be more advantageous for BMD, metabolic health, and cognitive function than equivalent increases in muscle mass [34]. These findings underscore the importance of considering age, sex and tissue distribution when evaluating the health implications of body composition in aging populations.
4.4. Limitations
Body fat mass % cut-offs in our analysis to identify OSA were ≥25% for men and ≥32% for women. While this cutoff for overweight in men has reached consensus, this is not the case for women. Although the proposed cutoffs range between 30% to 42% of body fat for overweight/obesity, we opted for 32% based on the percentage that showed detrimental effect on bone in our previous study in postmenopausal women [25], and to align with subsequent recommendations [17,19]. This slightly higher percentage cutoff (compared to 30%) could have underestimated the number of women with overweight and thus those with OSA. Nevertheless, the number of participants was high enough to counteract this possible underestimation, showing the right trend. Regarding the bone, the BIA-ACC device measures total bone mass in kg, thus we could not determine inflexions and peak or nadir in different skeletal sites.
Some of the powerful physiological mediators/hormones affecting each aspect of body composition, also undergo major changes during ageing processes. However, they were not controlled for in our analysis, due to the absence of their measurement in this data set. These include calcitriol (active form of vitamin D), estrogen, and testosterone. Each of these hormones is involved in body composition maintenance, including bone turnover, regulation of intestinal calcium absorption, muscle proliferation and strength, as well as in regulation of adipose tissue metabolism, blood lipid regulation, and insulin resistance [35,36,37] and they all decrease with age. Despite the lack of these hormonal influencers as confounders, we believe that the data still show the overall trend in general population as our sample included healthy men and women, excluding those with any chronic diseases or other endocrine conditions, or younger women with pregnancy.
We did not have data for the participants’ long-time lifestyle habits, including their diet and regular and/or sporadic physical activity engagement, that might have slightly mitigated our analyses. As these were all healthy men and women, we could assume that they all followed typical regimens for that geographic area and their age groups. If some abrupt changes occurred just before the study’s onset, they probably would be irrelevant for the assessment conducted at the onset of the study.
5. Conclusions and Implications
The trajectory for bone mass demonstrated age-related declines with distinct sex-specific patterns and differences between those without and with OSA. Participants without OSA generally displayed more stable trajectories, although multiple inflection points were evident in females. The trajectories in males with OSA showed greater instability, whereas those in females showed a more pronouced downward trend. Collectively, these patterns suggest sex-specific timing and magnitude of peak bone mass and subsequent loss, with further adverse modification in the presence of OSA.
Male and female trajectories in muscle mass also revealed distinct patterns. In participants without OSA, males showed a single, well-defined peak and modest subsequent declines, in contrast to females who presented numerous, widely distributed inflection points across midlife. Men with OSA displayed slightly fluctuating inflection patterns, while females showed no significant inflection, but a continuous downward trajectory. Overall, these findings suggest more stable peak and plateau phases in men, and more complex, gradually deteriorating patterns in women, with OSA further amplifying instability in males and accelerating continuous loss in females.
While male and female patterns of age-related inflection in IMAT % showed similar trends (the upward trend throughout), the patterns in FM% diverged substantially. In males, FM% trajectories showed late-onset fluctuations, with inflections concentrated in the sixth and seventh decades, followed by a continuous upward trend with age. In contrast, females exhibited multiple, earlier, and more frequent inflections spanning through young and mid-adulthood, accompanied by alternating local minima and maxima, broader plateaus, and late-life reversals. These sex-specific patterns suggest that fat accumulation in males increases more steadily across ageing, whereas in females it follows a more complex, multi-phase trajectory that begins earlier and shows greater temporal variability, particularly in the presence of OSA.
The major takeaway is that both men and women identified with OSA had adverse processes with bone and muscle started from as early as 20 years of age. These findings implicate the need for early OSA identification (especially with so many young adults with obesity), and implementation of appropriate measures as the alteration in body composition may lead to adverse complications. The results of our study have several important implications for health, research, and clinical practice and indicate:
- The need for earlier risk assessment, because the nonlinear, sex-specific age-related trajectories indicate that risk for osteoporosis, sarcopenia, and obesity cannot be predicted by age and/or sex alone, highlighting the importance to monitor body composition from early adulthood, especially if OSA is identified. Early detection of adverse trends can prompt timely lifestyle (nutrition and physical activity) or even medical interventions.
- Recognizing that bone, muscle, and fat mass do not change at a constant rate allows for more precise timing of preventive or therapeutic strategies. For example, interventions for bone health in women may need to be intensified earlier in life, not just around menopause. Comparable situation holds for both muscle and adipose tissue
- These findings also support the shift toward personalized approaches in managing age-related changes. Treatment and monitoring plans can be tailored based on an individual’s unique body composition trajectory rather than relying on generalized age-based guidelines
- Understanding these nonlinear changes informs the design of research studies and public health policies, warranting that recommendations are based on actual physiological patterns rather than oversimplified linear models.
Briefly, recognizing nonlinear changes in body composition enables more accurate risk prediction, earlier and more effective interventions, and the development of personalized strategies for healthy aging.
Author Contributions
Conceptualization, J.Z.I., S.C., D.B., J.M., J.H. and S.G.; methodology, D.B., and J.Z.I.; formal analysis, J.M., J.H., J.Z.I.; investigation, J.Z.I. and D.B.; data curation, D.B.; writing—original draft preparation, J.Z.I.; J.M., J.H., S.G., and E.M.B. writing—reviewing and editing, J.Z.I., S.C. All authors have read and agreed to the published version of the manuscript.
Funding
This retrospective post hoc analysis was supported by the European Union—Next Generation EU (Program Contract of 8 December 2023, Class: 643-02/23-01/00016, Reg. No. 533-03-23-0006).
Institutional Review Board Statement
The original study was approved in Italy by the Consortium for the Science and Technology Research AREA, Trieste, Italy, and conformed to the standards set by the Declaration of Helsinki. Our retrospective post hoc study was conducted in accordance with the Declaration of Helsinki and approved by the Ethics Committee of the Institute for Medical Research and Occupational Medicine (protocol code: 100-21/18-10; date of approval: 23 October 2018).
Informed Consent Statement
Informed consent was obtained from all subjects as each one was recruited to the study.
Data Availability Statement
Original data generated during the study for this article will be made available by the authors upon request.
Acknowledgments
The authors express their deep appreciation to all participants in the study. The GenAI has NOT been used in any aspect of the preparation of this manuscript/study. All authors have reviewed and edited the manuscript and take full responsibility for the content of this publication.”
Conflicts of Interest
The authors declare no conflicts of interest.
References
- Shen, X.; Wang, C.; Zhou, X.; Zhou, W.; Hornburg, D.; Wu, S.; Snyder, M.P. Nonlinear dynamics of multi-omics profiles during human aging. Nat. Aging 2024, 4, 1619–1634. [Google Scholar] [CrossRef]
- Li, J.; Xiong, M.; Fu, X.-H.; Fan, Y.; Dong, C.; Sun, X.; Zheng, F.; Wang, S.-W.; Liu, L.; Xu, M.; et al. Determining a multimodal aging clock in a cohort of Chinese women. Med 2023, 4, 825–848.e13. [Google Scholar] [CrossRef]
- Kanis, J.A. Estrogens, the menopause, and osteoporosis. Bone 1996, 19, 185S–190S. Available online: https://www.sciencedirect.com/science/article/pii/S8756328296002578. [CrossRef] [PubMed]
- Shieh, A.; Ruppert, K.M.; Greendale, G.A.; Lian, Y.; A Cauley, J.; Burnett-Bowie, S.-A.; Karvonen-Guttierez, C.; Karlamangla, A.S. Associations of Age at Menopause With Postmenopausal Bone Mineral Density and Fracture Risk in Women. J. Clin. Endocrinol. Metab. 2021, 107, e561–e569. [Google Scholar] [CrossRef] [PubMed]
- de Villiers, T.J. Bone health and menopause: Osteoporosis prevention and treatment. Best Pr. Res. Clin. Endocrinol. Metab. 2023, 38, 101782. [Google Scholar] [CrossRef]
- Walker, M.D.; Shane, E. Postmenopausal Osteoporosis. New Engl. J. Med. 2023, 389, 1979–1991. [Google Scholar] [CrossRef] [PubMed]
- Chidi-Ogbolu, N.; Baar, K. Effect of Estrogen on Musculoskeletal Performance and Injury Risk. Front. Physiol. 2019, 9, 1834. [Google Scholar] [CrossRef]
- Barone, B.; Napolitano, L.; Abate, M.; Cirillo, L.; Reccia, P.; Passaro, F.; Turco, C.; Morra, S.; Mastrangelo, F.; Scarpato, A.; et al. The Role of Testosterone in the Elderly: What Do We Know? Int. J. Mol. Sci. 2022, 23, 3535. [Google Scholar] [CrossRef]
- Frank, A.P.; Santos, R.d.S.; Palmer, B.F.; Clegg, D.J. Determinants of body fat distribution in humans may provide insight about obesity-related health risks. J. Lipid Res. 2019, 60, 1710–1719. [Google Scholar] [CrossRef]
- Hu, K.; Edelen, E.D.; Zhuo, W.; Khan, A.; Orbegoso, J.; Greenfield, L.; Rahi, B.; Griffin, M.; Ilich, J.Z.; Kelly, O.J. Understanding the Consequences of Fatty Bone and Fatty Muscle: How the Osteosarcopenic Adiposity Phenotype Uncovers the Deterioration of Body Composition. Metabolites 2023, 13, 1056. [Google Scholar] [CrossRef]
- Zhu, Y.; Hu, Y.; Pan, Y.; Li, M.; Niu, Y.; Zhang, T.; Sun, H.; Zhou, S.; Liu, M.; Zhang, Y.; et al. Fatty infiltration in the musculoskeletal system: Pathological mechanisms and clinical implications. Front. Endocrinol. 2024, 15, 1406046. [Google Scholar] [CrossRef]
- Davis, S.R.; Pinkerton, J.; Santoro, N.; Simoncini, T. Menopause—Biology, consequences, supportive care, and therapeutic options. Cell 2023, 186, 4038–4058. [Google Scholar] [CrossRef] [PubMed]
- Cauley, J.A. Estrogen and bone health in men and women. Steroids 2015, 99, 11–15. [Google Scholar] [CrossRef] [PubMed]
- Ilich, J.Z.; Kelly, O.J.; Inglis, J.E.; Panton, L.B.; Duque, G.; Ormsbee, M.J. Interrelationship among muscle, fat, and bone: Connecting the dots on cellular, hormonal, and whole body levels. Ageing Res. Rev. 2014, 15, 51–60. [Google Scholar] [CrossRef] [PubMed]
- Ilich, J.Z.; Pokimica, B.; Ristić-Medić, D.; Petrović, S.; Arsić, A.; Vasiljević, N.; Vučić, V.; Kelly, O.J. Osteosarcopenic adiposity (OSA) phenotype and its connection with cardiometabolic disorders: Is there a cause-and-effect? Ageing Res. Rev. 2024, 98, 102326. [Google Scholar] [CrossRef]
- Ilich, J.Z.; Pokimica, B.; Ristić-Medić, D.; Petrović, S.; Arsić, A.; Vasiljević, N.; Vučić, V.; Kelly, O.J. Osteosarcopenic adiposity and its relation to cancer and chronic diseases: Implications for research to delineate mechanisms and improve clinical outcomes. Ageing Res. Rev. 2024, 103, 102601. [Google Scholar] [CrossRef]
- Cvijetić, S.; Keser, I.; Boschiero, D.; Ilich, J.Z. Prevalence of Osteosarcopenic Adiposity in Apparently Healthy Adults and Appraisal of Age, Sex, and Ethnic Differences. J. Pers. Med. 2024, 14, 782. [Google Scholar] [CrossRef]
- Peppa, M.; Stefanaki, C.; Papaefstathiou, A.; Boschiero, D.; Dimitriadis, G.; Chrousos, G.P. Bioimpedance analysis vs. DEXA as a screening tool for osteosarcopenia in lean, overweight and obese Caucasian postmenopausal females. Hormones 2017, 16, 181–193. [Google Scholar] [CrossRef]
- Kelly, O.J.; Gilman, J.C.; Boschiero, D.; Ilich, J.Z. Osteosarcopenic Obesity: Current Knowledge, Revised Identification Criteria and Treatment Principles. Nutrients 2019, 11, 747. [Google Scholar] [CrossRef]
- Wicklin, R. Find points where a regression curve has zero slope. The DO Loop (SAS blog). 13 May 2020. Available online: https://blogs.sas.com/content/iml/2020/05/13/regression-curve-zero-slope.html (accessed on 1 December 2025).
- Matkovic, V.; Jelic, T.; Wardlaw, G.M.; Ilich, J.Z.; Goel, P.K.; Wright, J.K.; Andon, M.B.; Smith, K.T.; Heaney, R.P. Timing of peak bone mass in Caucasian females and its implication for the prevention of osteoporosis. Inference from a cross-sectional model. J. Clin. Investig. 1994, 93, 799–808. [Google Scholar] [CrossRef]
- Demontiero, O.; Vidal, C.; Duque, G. Aging and bone loss: New insights for the clinician. Ther. Adv. Musculoskelet. Dis. 2012, 4, 61–76. [Google Scholar] [CrossRef]
- Rühling, S.; Dittmann, J.; Müller, T.; El Husseini, M.; Bodden, J.; Petzsche, M.R.H.; Löffler, M.T.; Sollmann, N.; Baum, T.; Seifert-Klauss, V.; et al. Sex differences and age-related changes in vertebral body volume and volumetric bone mineral density at the thoracolumbar spine using opportunistic QCT. Front. Endocrinol. 2024, 15, 1352048. [Google Scholar] [CrossRef] [PubMed]
- Lauretani, F.; Russo, C.R.; Bandinelli, S.; Bartali, B.; Cavazzini, C.; Di Iorio, A.; Corsi, A.M.; Rantanen, T.; Guralnik, J.M.; Ferrucci, L. Age-associated changes in skeletal muscles and their effect on mobility: An operational diagnosis of sarcopenia. J. Appl. Physiol. 2003, 95, 1851–1860. [Google Scholar] [CrossRef] [PubMed]
- Liu, P.-Y.; Ilich, J.Z.; Brummel-Smith, K.; Ghosh, S. New insight into fat, muscle and bone relationship in women: Determining the threshold at which body fat assumes negative relationship with bone mineral density. Int. J. Prev. Med. 2014, 5, 1452–1463. [Google Scholar] [PubMed]
- Karastergiou, K.; Smith, S.R.; Greenberg, A.S.; Fried, S.K. Sex differences in human adipose tissues – the biology of pear shape. Biol. Sex Differ. 2012, 3, 1–12. [Google Scholar] [CrossRef]
- Kim, J.-M.; Chung, E.; Cho, E.-S.; Lee, J.-H.; Shin, S.-J.; Lee, H.S.; Park, E.J.; Baik, S.H.; Lee, K.Y.; Kang, J. Impact of subcutaneous and visceral fat adiposity in patients with colorectal cancer. Clin. Nutr. 2021, 40, 5631–5638. [Google Scholar] [CrossRef]
- Shapira, N. Women’s higher health risks in the obesogenic environment: A gender nutrition approach to metabolic dimorphism with predictive, preventive, and personalised medicine. EPMA J. 2013, 4, 1. [Google Scholar] [CrossRef]
- Kahn, B.B.; Flier, J.S. Obesity and insulin resistance. J. Clin. Investig. 2000, 106, 473–481. [Google Scholar] [CrossRef]
- Tchkonia, T.; Thomou, T.; Zhu, Y.; Karagiannides, I.; Pothoulakis, C.; Jensen, M.D.; Kirkland, J.L. Mechanisms and Metabolic Implications of Regional Differences among Fat Depots. Cell Metab. 2013, 17, 644–656. [Google Scholar] [CrossRef]
- Franceschi, C.; Campisi, J. Chronic Inflammation (Inflammaging) and Its Potential Contribution to Age-Associated Diseases. J. Gerontol. A Ser. Biol. Sci. Med. Sci. 2014, 69 (Suppl. 1), S4–S9. [Google Scholar] [CrossRef]
- Zhao, Y.; Yue, R. Aging adipose tissue, insulin resistance, and type 2 diabetes. Biogerontology 2023, 25, 53–69. [Google Scholar] [CrossRef]
- Chinnapaka, S.; Malekzadeh, H.; Tirmizi, Z.; Ejaz, A. Caloric restriction mitigates age-associated senescence characteristics in subcutaneous adipose tissue-derived stem cells. Aging 2024, 16, 7535–7552. [Google Scholar] [CrossRef]
- Kim, S.; Won, C.W. Sex-different changes of body composition in aging: A systemic review. Arch. Gerontol. Geriatr. 2022, 102, 104711. [Google Scholar] [CrossRef]
- Peppone, L.J.; Hebl, S.; Purnell, J.Q.; Reid, M.E.; Rosier, R.N.; Mustian, K.M.; Palesh, O.G.; Huston, A.J.; Ling, M.N.; Morrow, G.R. The efficacy of calcitriol therapy in the management of bone loss and fractures: A qualitative review. Osteoporos. Int. 2009, 21, 1133–1149. [Google Scholar] [CrossRef]
- Książek, A.; Zagrodna, A.; Słowińska-Lisowska, M. Vitamin D, Skeletal Muscle Function and Athletic Performance in Athletes—A Narrative Review. Nutrients 2019, 11, 1800. [Google Scholar] [CrossRef]
- Szymczak-Pajor, I.; Miazek, K.; Selmi, A.; Balcerczyk, A.; Śliwińska, A. The Action of Vitamin D in Adipose Tissue: Is There the Link between Vitamin D Deficiency and Adipose Tissue-Related Metabolic Disorders? Int. J. Mol. Sci. 2022, 23, 956. [Google Scholar] [CrossRef]
Figure 1.
Inflexion points estimates for age in bone mineral density (expressed as T-Score) in males. A, all males (n=3305); data show local maxima at age 35.0 years with T-Score of -0.2, with a slight increase/ plateauing in T-Score to early fifties (~53 years) and then declining with advancing age. B, males without osteosarcopenic adiposity (n=2843); data show local maxima at age 42.4 years with T-Score of -0.1 and then a slight decline with advancing age and a bit steeper decline around 55 years. C, males with osteosarcopenic adiposity (n=464); data show fluctuations and multiple inflexion points, indicating less stable BMD/T-Scores. The table with the fluctuations is presented below the corresponding graph and elaborated more in the Discussion.
Figure 2.
Inflection points estimates for age in bone mineral density (expressed as T-Score) in females. A, all females (n=6413); data show local minima at age 28.7 years with T-Score of -0.91 and local maxima at age 35.9 years with T-Score of -0.88. There is slow downturn until the age of 55 years, and then a steeper downturn continues with advancing age. B, females without osteosarcopenic adiposity (n=5053); there are multiple inflection points presented in the table with the corresponding graph and elaborated more in the Discussion. C, females with osteosarcopenic adiposity (n=1359); there was no significant T-score but a downward trend starting at about menopause with T-score at approximately -1.4.
Figure 3.
Inflexion point estimates for age in muscle/lean tissue (expressed as S-Score) in males. A, all males (n=3305); data show local maxima at age 34.7 years with S-Score of 0.1, showing an increase in muscle mass to the age of 34.7, plateauing at about ~53 years and then declining with advancing age. B, males without osteosarcopenic adiposity (n=2843); data show local maxima at 37.5 years with S-Score of 0.2, plateauing until about 50 years, with subsequent slight downturn with ageing. C, males with osteosarcopenic adiposity (n=464); data show the fluctuations with age with two inflexion points between ages of 45 and 49 years and an S-Score around -1.6, followed by a continuous downward trend with ageing.
Figure 4.
Inflexion point estimates for age in muscle/lean tissue (expressed as S-Score) in females. A, all females (n=6413); data show multiple inflection points, presented in the table below the corresponding graph, indicate a slow downturn until about age 60 years, then a steeper decline continuing with age. B, females without osteosarcopenic adiposity (n=5053); multiple infection points (table with the corresponding graph) also indicate significant multiple points between 27 and 67 years with S-Scores of -0.5 to -1.05, and a steeper downward trend after age of 70 years. C, females with osteosarcopenic adiposity (n=1359); there was no significant inflection point but a continuous downward trend with ageing.
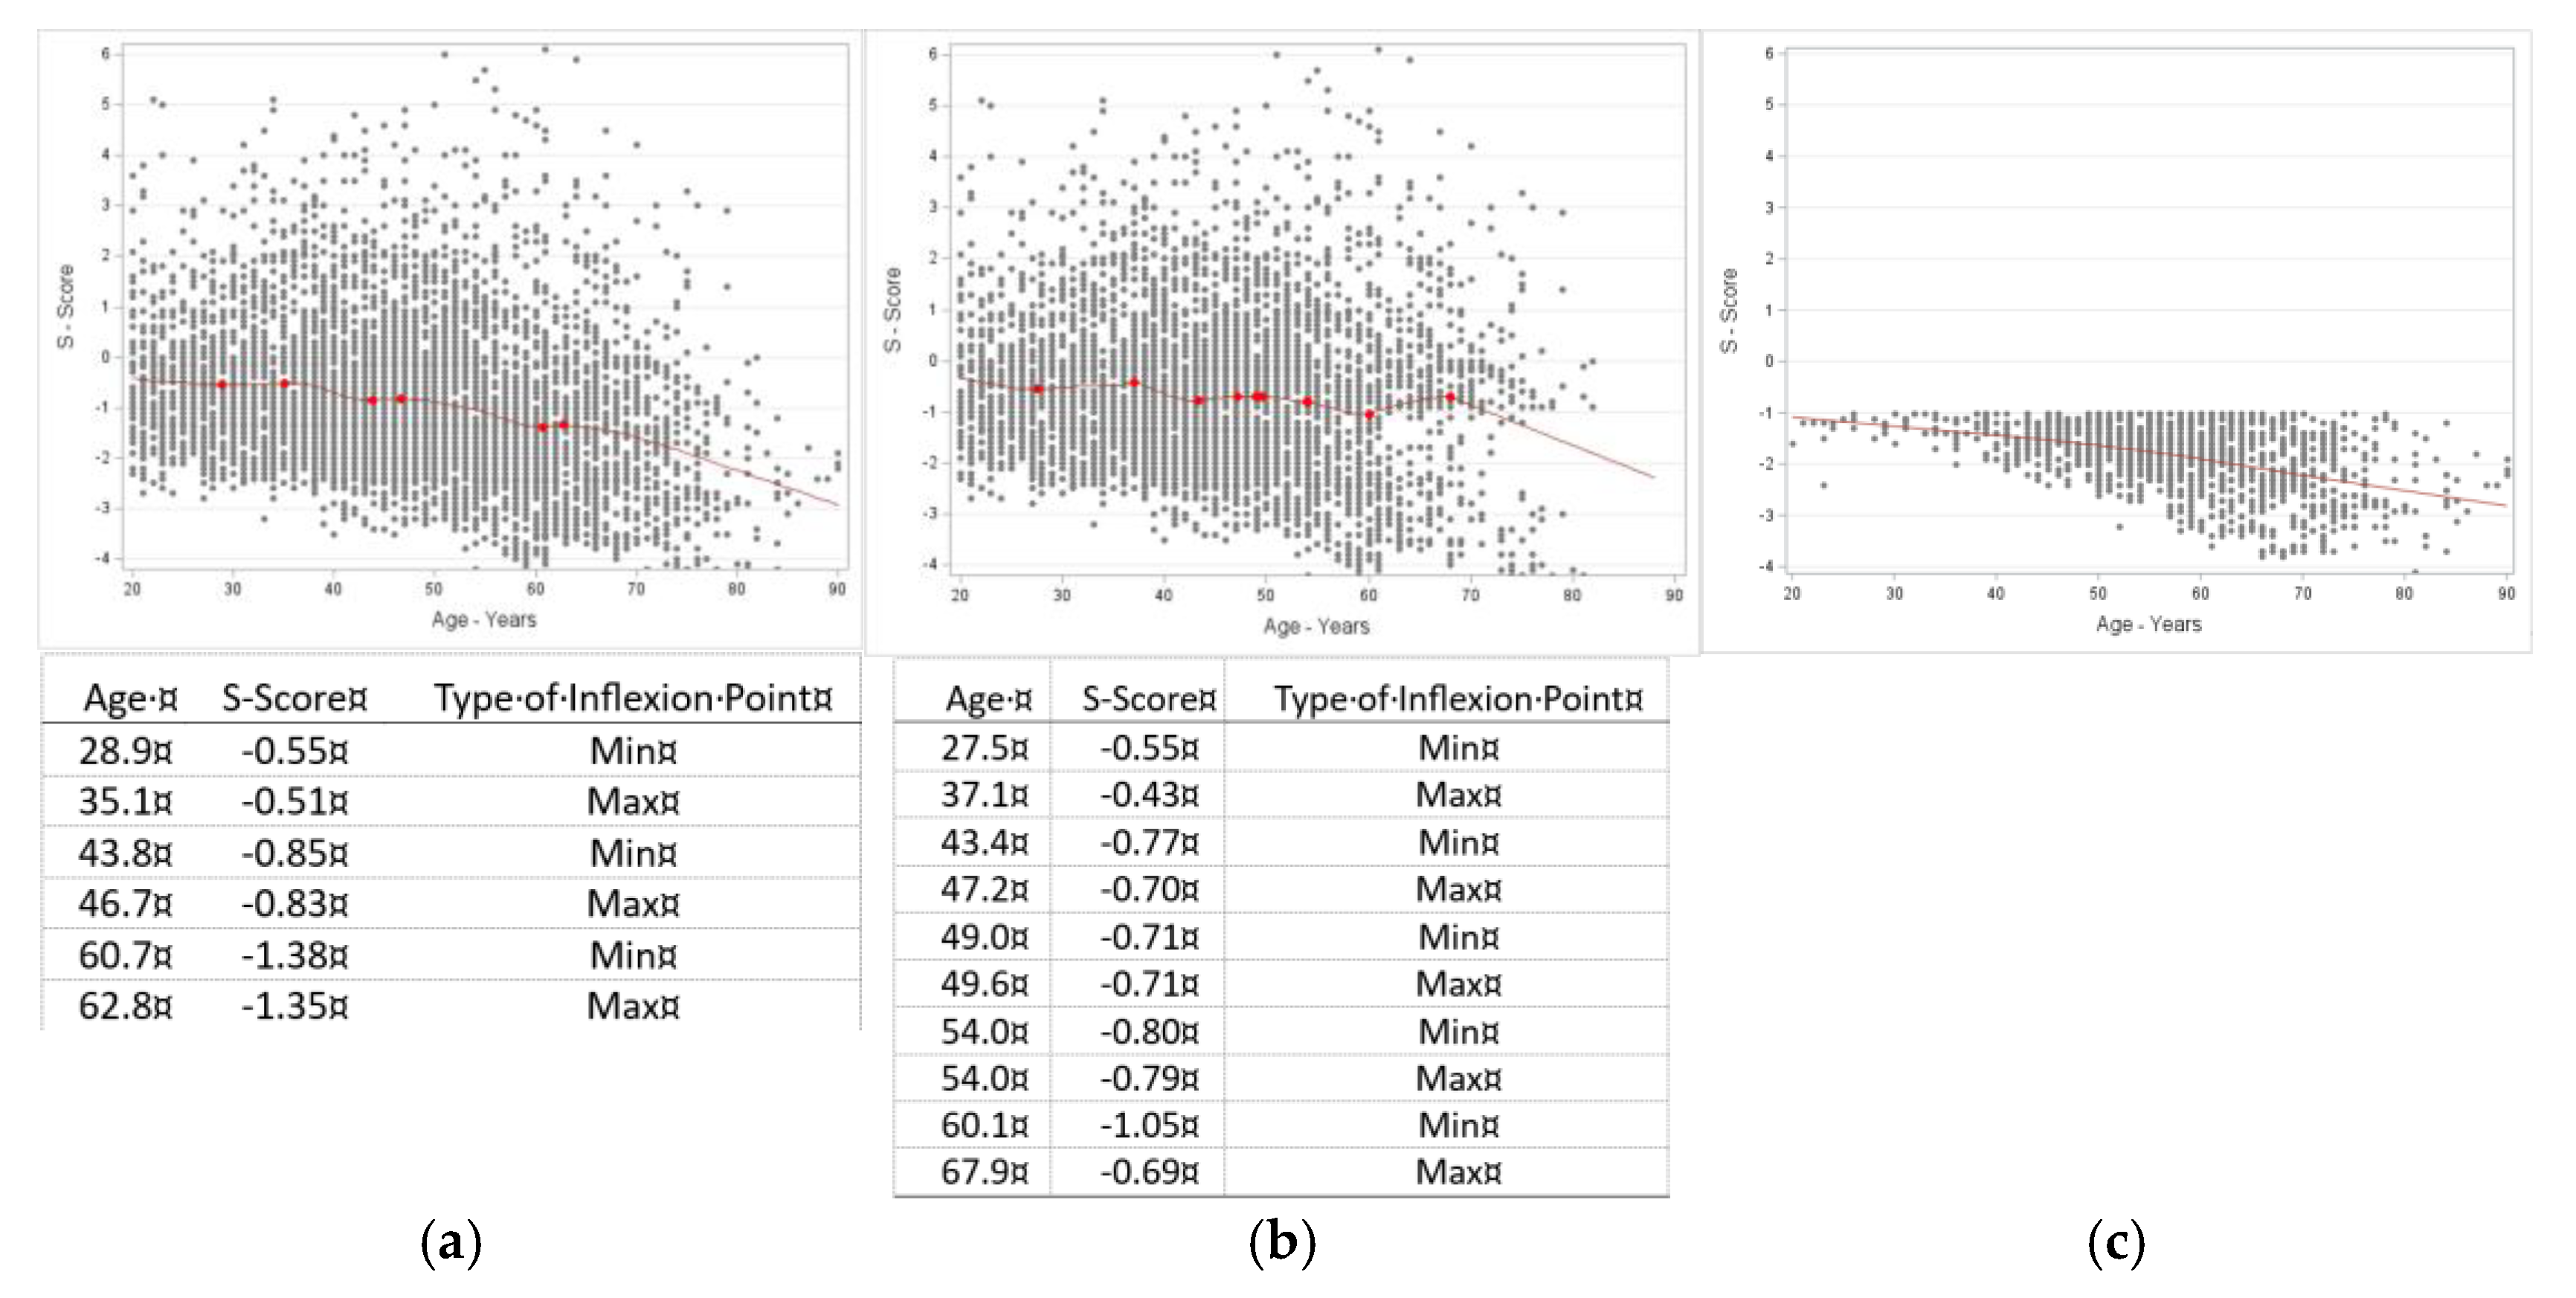
Figure 5.
Inflexion point estimates for age in fat mass percentage (FM%) in males. A, all males (n=3305); data show the fluctuations with age with two inflexion points between ages of 62-68 years and FM of around 35%, followed by a continuous upward trend with ageing. B, males without osteosarcopenic adiposity (n=2843); data show local maxima at 61.5 years with FM of 35.6% continuing with a slight upward trend. C, males with osteosarcopenic adiposity (n=464); data show fluctuations with age with multiple inflexion points between ages of 52-69 years and FM% ranging from 32% to 35% and a continuous upward trend with ageing. The table with the fluctuations is presented below the corresponding graph and elaborated more in the Discussion.
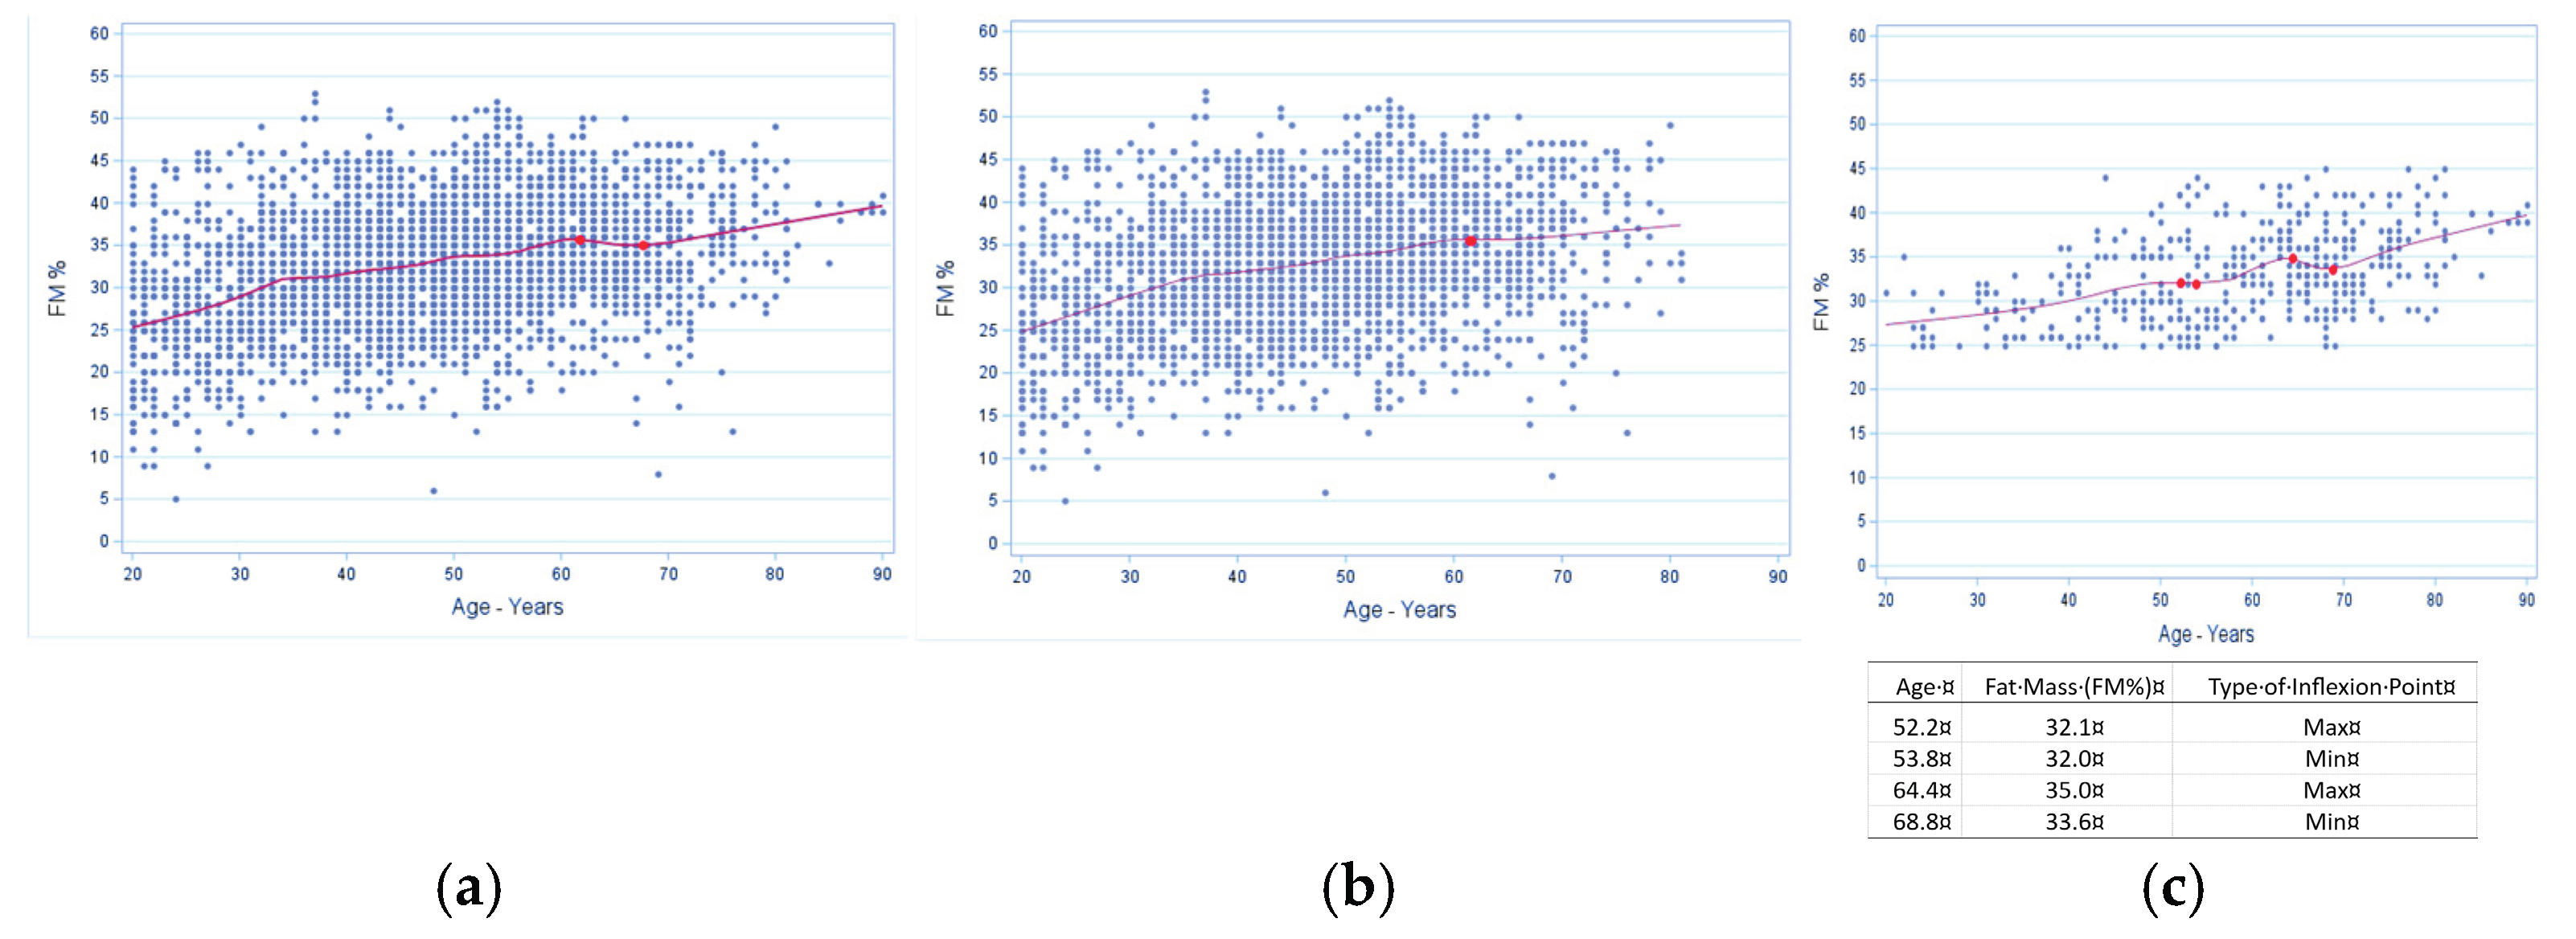
Figure 6.
Inflexion point estimates for age in fat mass percentage (FM%) for females. A, all females (n=6413); data show multiple inflection points between age 26 and 55 years with a local minima of 28.0% FM, then an upward trend to age 76.2 with another local minima of 38.6%. Subsequently, there is almost a plateau at age of 76.2 years, with 38.6% FM and then a slight upward trend. B, females without osteosarcopenic adiposity (n=5053); data show multiple inflection points with first local maxima at about 39 years and 31.6% FM. There is a subsequent upward trend until age 69 years and a local maxima of 38.5% FM, with further slight downward trend. C, females with osteosarcopenic adiposity (n=1359); data show first inflection point starting at age 42 years with a local maxima at 34.9% FM. There is a slight upward trend until the age of 73 years and local maxima of 39.2% FM, with a slight dip at about 78 years and local minima of 38.2% FM. Subsequently there is a steep upward trend with ageing. All significant inflection points are marked in the graphs with corresponding tables and elaborated further in the Discussion.
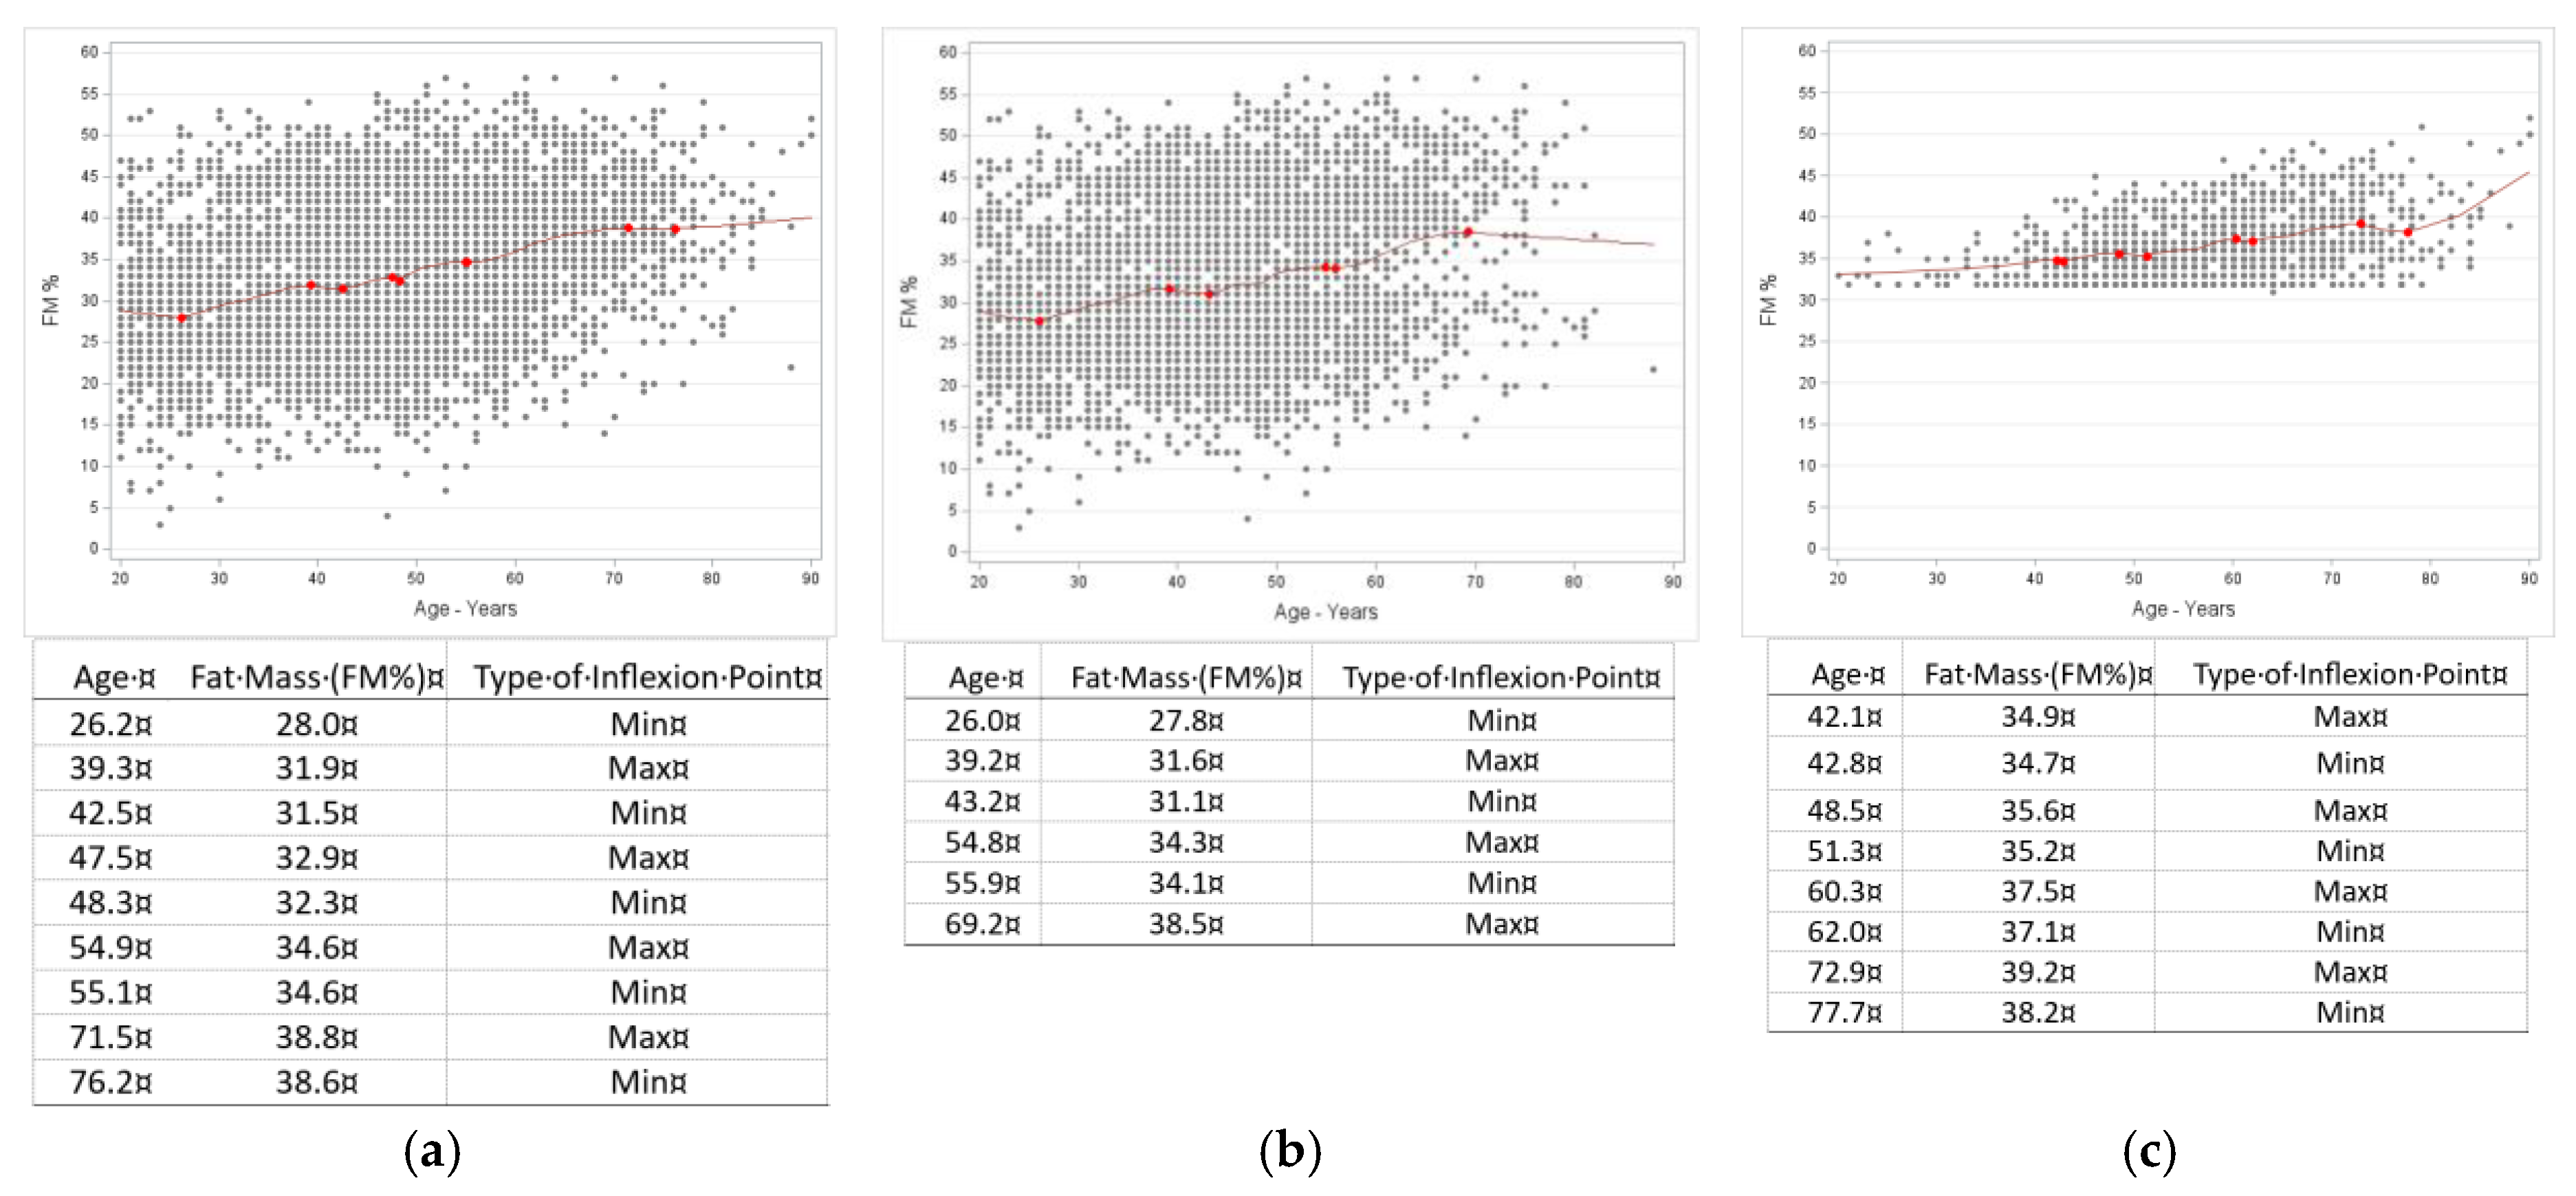
Figure 7.
Inflexion point estimates for age in intramuscular adipose tissue (IMAT%) in males. A, all males (n=3305); data show the upward trend over the age range without identified inflexion point. B, males without osteosarcopenic adiposity (n=2843); there is also an upward trend over the age range without identified significant inflexion point. C, males with osteosarcopenic adiposity (n=464); data show the local maxima and minima between 64 and 67 years with IMAT of about 2.6% and subsequent upward trend.
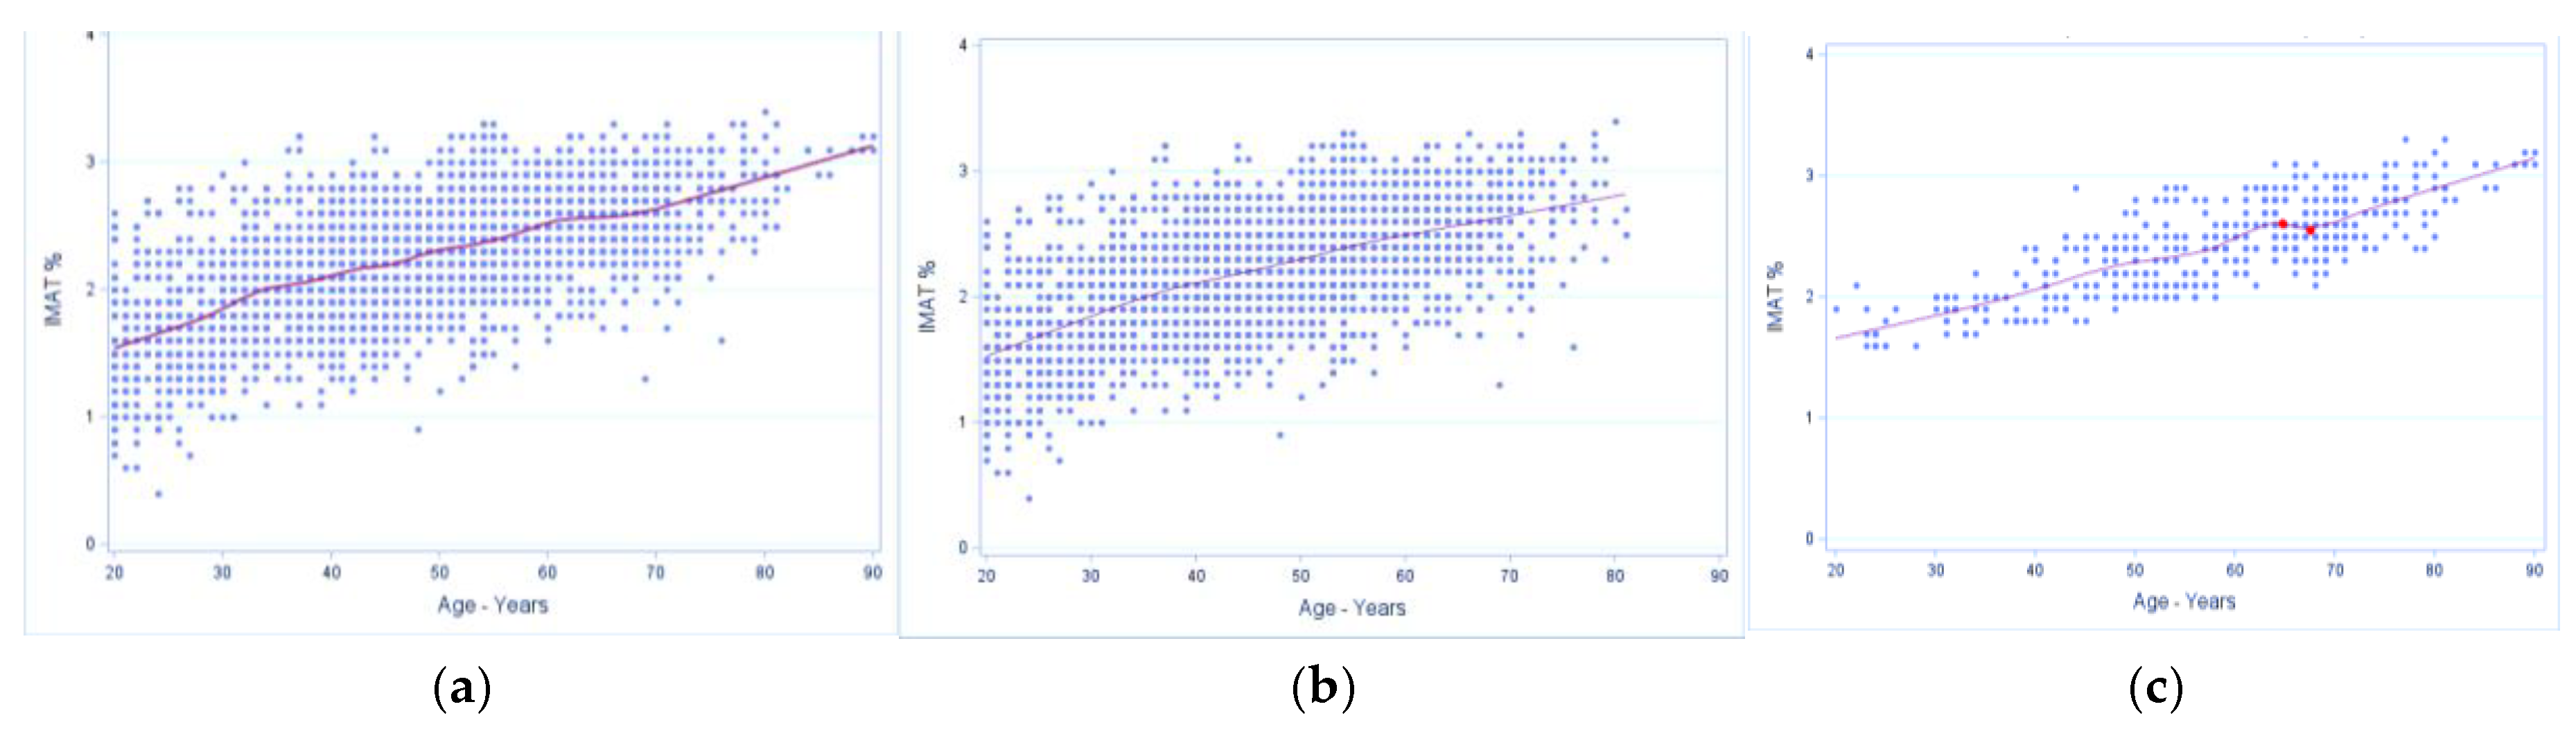
Figure 8.
Inflexion point estimates for age in intramuscular adipose tissue (IMAT%) for females. A, all females (n=6413); data show a continuous upward trend and a local maxima at age 21.6 years with IMAT of 1.5%. B, females without osteosarcopenic adiposity (n=5053); data show an upward trend with age and no identifiable inflection point. C, females with osteosarcopenic adiposity (n=1359); data show overall upward trend with age with a local maxima between 73.5 and 75.0 years with IMAT of 2.7%.
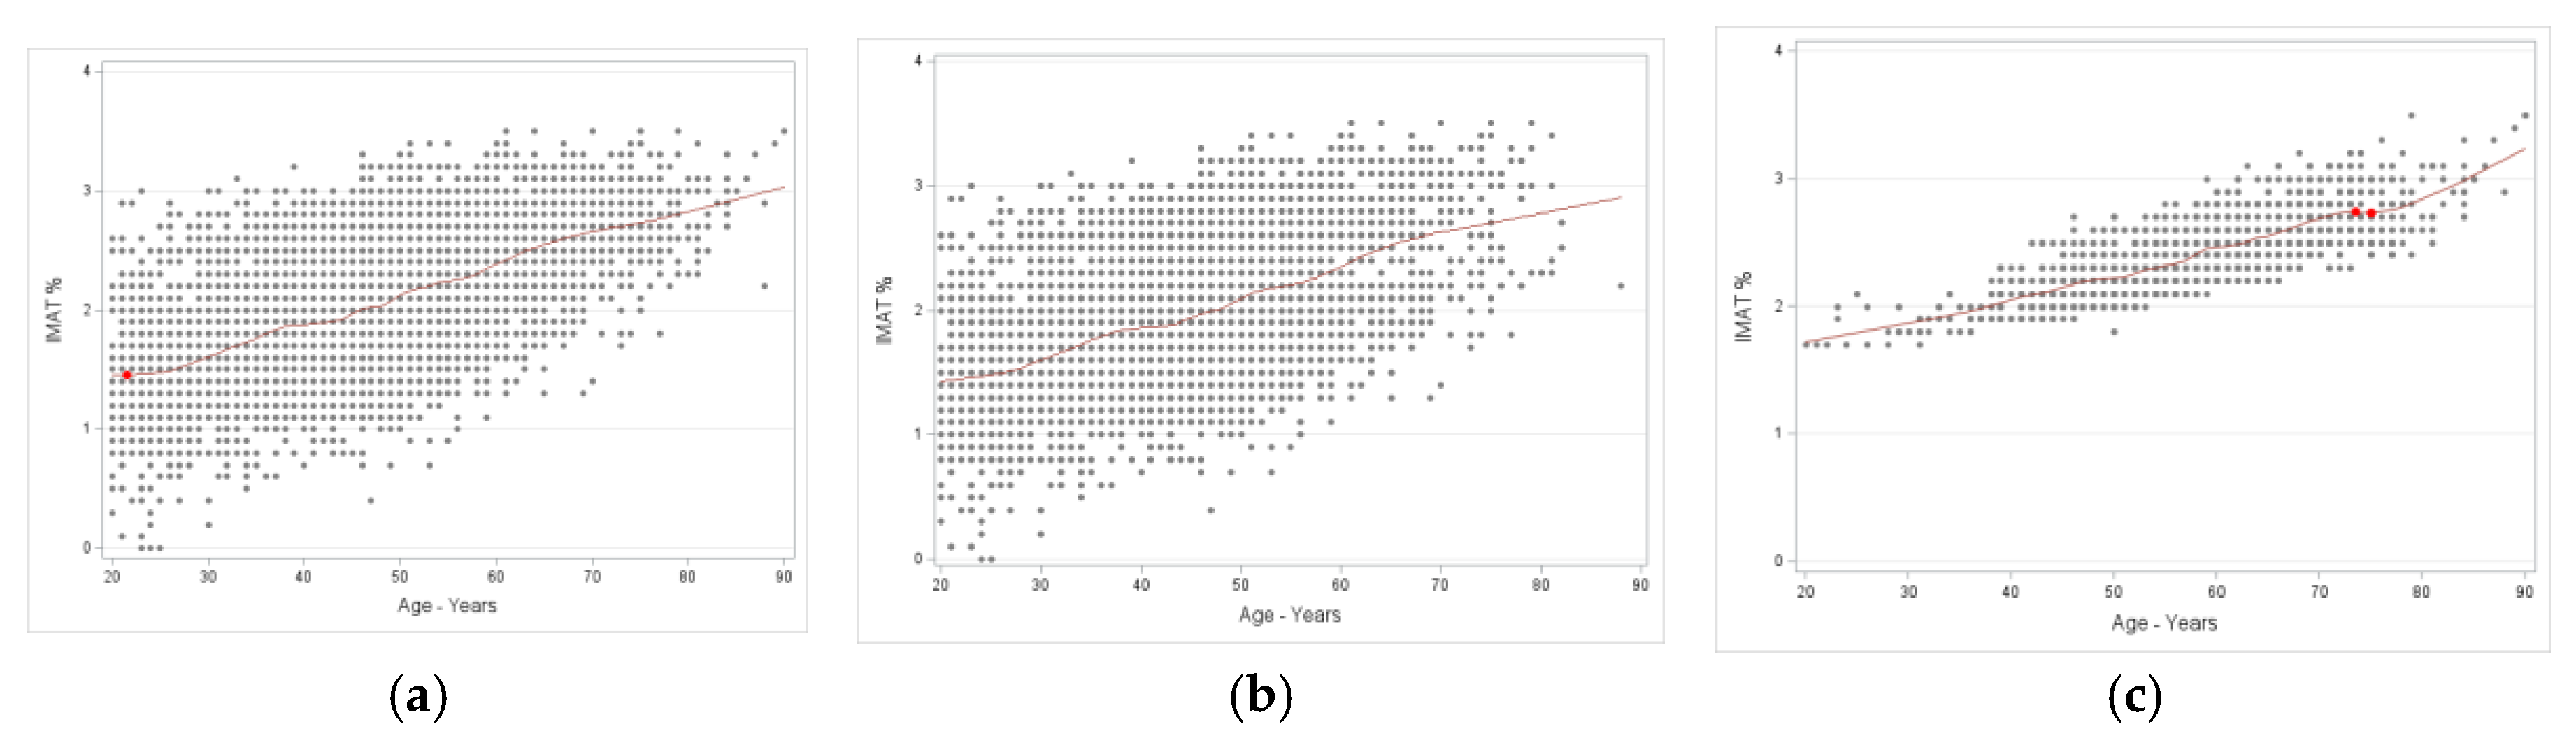

Table 1.
Age, anthropometry, and body composition in men with reference values.
| All Men (n=3305) | Men without OSA (n=2843; 86%) |
Men with OSA (n=462; 14%) |
||||||
|---|---|---|---|---|---|---|---|---|
| Variables | Mean | 95% CI | Mean | 95% CI | Mean | 95% CI | P a | Ref. |
|
Age (years) |
47.8 | (47.4 – 48.4) | 58.3 | (57.0 – 59.6) | 46.2 | (45.7 – 46.7) | <0.0001 | |
| Weight (kg) | 83.0 | (82.5 – 83.5) | 70.4 | (69.8 – 71.1) | 85.0 | (84.3 – 85.3) | <0.0001 | |
| Height (cm) | 176.4 | (176.2 –176.7) | 171.0 | (170.4 – 171.7) | 177.3 | (177.1 – 177.6) | <0.0001 | |
| BMI (kg/m2) | 26.6 | (26.5 – 26.8) | 24.1 | (23.9 – 24.3) | 27.1 | (26.9 – 27.2) | <0.0001 | 18.5 – 24.9 |
| T-Score (SD of normal bone mass | -0.3 | (-0.34 – -0.29) |
-1.4 | (-1.4 – -1.3) |
-0.1 | (-0.2 – -0.1) |
<0.0001 |
> -1.0 |
| S-Score (SD of normal muscle mass) | -0.1 | (-0.23 – -0.15) |
-1.7 | (-1.7 – -1.6) |
0.1 | (0.0 – -0.1) |
<0.0001 |
> -1.0 |
| Fat mass (% of total body weight) | 32.5 | (32.3 – 32.8) | 33.1 | (32.2 – 33.6) | 32.5 | (32.2 – 32.8) | 0.272 | 7.0 – 24.9 |
| IMAT (% of total body fat) | 2.2 | (2.2 – 2.3) | 2.4 | (2.3 – 2.5) | 2.2 | (2.2 – 2.2) | <0.0001 | < 2.0 |
a Difference in means assessed with Wilcoxon rank-sum test from PROC NPAIRWAY in SAS; OSA = osteosarcopenic adiposity; CI = confidence intervals; Ref. = reference for normal values; BMI = body mass index; SD = standard deviation; FM = fat mass; IMAT = intramuscular adipose tissue.
Table 2.
Age, anthropometry, and body composition in women with reference values.
| All Women (n=6412) |
Women without OSA (n=5053; 78.8%) | Women with OSA (n=1359; 21.2%) | ||||||
|---|---|---|---|---|---|---|---|---|
| Variables | Mean | 95% CI | Mean | 95% CI | Mean | 95% CI | P a | Ref. |
| Age (years) | 47.6 | (47.3 – 48.0) | 58.2 | (57.6 – 58.8) | 44.8 | (44.4 – 45.1) | <0.0001 | |
| Weight (kg) | 66.7 | (66.4 –67.1) | 63.8 | (63.5 – 64.1) | 67.6 | (67.1 – 68.0) | 0.003 | |
| Height (cm) | 163.1 | (163.0 –163.4) | 160.8 | (160.5 – 161.1) | 163.8 | (163.6 – 164.0) | <0.0001 | |
| BMI (kg/m2) | 25.1 | (25.0 – 25.2) | 24.7 | (24.6 – 24.8) | 25.2 | (25.1 – 25.4) | <0.0001 | 18.5 – 24.9 |
| T-Score (SD of normal bone mass | -1.13 | (-1.15 – -1.12) | -1.76 | (-1.78 – -1.74) |
-0.96 | (-0.98 – -0.94) |
<0.0001 | > -1.0 |
| S-Score (SD of normal muscle mass) | -0.94 | (-0.98 – -0.90) | -1.87 | (-1.90 – -1.84) |
-0.70 | (-0.69 – -0.73) |
<0.0001 | > -1.0 |
| Fat mass (% of total weight) | 33.2 | (33.0 –33.5) | 36.8 | (36.6 – 37.0) | 32.3 | (32.0 – 32.5) | <0.0001 | 12.0 –31.9 |
| IMAT (% of total body fat) | 2.0 | (2.05 – 2.08) | 2.41 | (2.39 – 2.42) | 1.97 | (1.95 – 1.99) | <0.0001 | < 2.0 |
a Difference in means assessed with Wilcoxon rank-sum test from PROC NPAIRWAY in SAS; OSA = osteosarcopenic adiposity; CI = confidence intervals; Ref = reference for normal values; BMI = body mass index; SD = standard deviation; FM = fat mass; IMAT = intramuscular adipose tissue.
Disclaimer/Publisher’s Note: The statements, opinions and data contained in all publications are solely those of the individual author(s) and contributor(s) and not of MDPI and/or the editor(s). MDPI and/or the editor(s) disclaim responsibility for any injury to people or property resulting from any ideas, methods, instructions or products referred to in the content. |
© 2026 by the authors. Licensee MDPI, Basel, Switzerland. This article is an open access article distributed under the terms and conditions of the Creative Commons Attribution (CC BY) license.
Copyright: This open access article is published under a Creative Commons CC BY 4.0 license, which permit the free download, distribution, and reuse, provided that the author and preprint are cited in any reuse.


