
Submitted:
01 March 2026
Posted:
02 March 2026
You are already at the latest version
Abstract
This study evaluated IndiMix JOE with intype IC-RNA as an alternative PCR chemistry to the National Animal Health Laboratory Network (NAHLN) Influenza A virus (IAV) PCR surveillance assay using AgPath-ID One Step PCR reagents in avian swabs and tissues and bovine milk. In avian samples, IndiMix JOE with intype IC-RNA using a fast reduced-volume (FRV, 20 µL) protocol had comparable results to NAHLN standard PCR assays (with and without intype IC) using standard NAHLN thermocycling conditions (25 µL). Precision was high, with coefficients of variation ≤ 2.61% for IAV targets and ≤ 2.03% for intype IC-RNA. Following detection of IAV in U.S. dairy cattle, a six-way comparison of PCR chemistries and exogenous internal controls in milk illustrated no significant differences in mean CT values (ANOVA, p = 0.9938). Additional experiments in avian, milk and semen samples were performed, resulting in comparable analytical sensitivity in limits of detection (LOD), linearity (R² > 0.977), and PCR efficiencies, and lacked significant differences in mean CT values (ANOVA, p > 0.05). Diagnostic sensitivity and specificity were 100% across matrices. These findings validate IndiMix JOE and intype IC-RNA as a reliable alternative reagents that enhances testing flexibility, efficiency, and outbreak response capacity.
Keywords:
influenza A virus surveillance
; highly pathogenic avian influenza
; exogeneous internal controls
; PCR inhibition
; outbreak response
; IndiMix JOE
; intype IC-RNA
; AgPath-ID One-Step RT-PCR reagents
1. Introduction
Highly pathogenic avian influenza (HPAI) H5N1 clade 2.3.4.4b has emerged as a significant threat to animal health globally, especially across the Americas since late 2021. From January 2022 through February 2026, the virus has spread widely in poultry, causing extensive mortality and economic losses in the United States with over 2,080 commercial and backyard flocks were affected, resulting in the loss of more than 195 million birds across 50 states and one territory [1]. In South America, outbreaks began in Ecuador in late 2022 and rapidly spread to 11 South American countries, affecting both commercial and backyard operations, and reached Antarctica in 2024 [2,3,4]. The virus has circulated extensively in wild birds, spanning 104 species, including waterfowl, raptors, seabirds, and shorebirds, with repeated introductions via migratory flyways linking North and South America [4,5,6]. Spillover into mammals including cats, foxes, sea lions, seals, and other terrestrial species has been documented across multiple countries, highlighting the virus’s expanding host range and ecological impact [4,5,6,7,8].
Recent detections in dairy cattle have added a novel dimension to HPAI H5N1 epidemiology. In March 2024, the B3.13 genotype virus was first identified in U.S. dairy herds and rapid spread to over 1,080 infected operations across 19 states as of February 2026 [9,10,11]. The virus was detected in raw milk and mammary tissue, and experimental studies confirmed tropism for the bovine mammary gland, leading to mastitis and reduced milk production [10]. Emerging genotypes, such as D1.1, were detected in early 2025, emphasizing ongoing viral evolution and the potential for continued spillover into mammalian livestock [12,13]. In January 2026, HPAI H5N1 antibodies were identified from five cows in the Netherlands, highlighting the potential global ramification of HPAI in milk [14,15,16]. These findings underscore the importance of integrated surveillance across poultry, wildlife, and livestock, as well as preparedness strategies to mitigate economic losses and zoonotic risk.
Detection of HPAI H5N1 in bovine biological materials raises questions about potential viral shedding in semen and implications for reproduction and herd health [17]. Semen is a challenging matrix for molecular diagnostics due to the presence of inhibitors such as proteins, lipids, and other compounds that can interfere with nucleic acid extraction and PCR amplification [18,19,20,21]. These factors complicate reliable detection of viral RNA, necessitating optimized extraction protocols and exogenous internal controls (IC) to ensure assay sensitivity and specificity [18]. Understanding the prevalence of HPAI in semen and overcoming these technical hurdles is critical for informed biosecurity measures, surveillance programs, and risk assessments in dairy and beef operations.
National Animal Health Laboratory Network (NAHLN) laboratories provide the backbone for HPAI surveillance in the United States, using standardized RT-PCR assays for rapid detection in poultry, wild birds, and livestock [1,5,11]. Alternative detection strategies, including multiplex PCRs, positive internal controls (IC), and improved extraction methods for complex matrices such as semen, are being explored to enhance sensitivity and reliability [18,22]. In this study, Indical’s IndiMix JOE master mix (IndiMix JOE) and intype IC-RNA (intype IC) were evaluated as alternative detection options to AgPath-ID One-Step RT-PCR Reagents (AgPath-ID) and VetMAX Xeno Internal Positive Control RNA (Xeno) to assess their performance in the presence of inhibitory compounds. Integrating these approaches allows laboratories to expand testing capabilities, maintain assay performance despite inhibitory compounds, and provide timely information for outbreak management and regulatory decision-making.
2. Materials and Methods
2.1. Field and Reference Samples
Avian swabs or tissues (avian) and bovine milk and semen samples are routinely submitted to the Wisconsin Veterinary Diagnostic Laboratory (WVDL) for pathogen screening. The avian and semen samples were described in previous studies [18,23]. The avian and semen samples were spiked with three low pathogenic influenza A strains (LPAI) as described in previous studies for analytical sensitivity. The negative milk samples were pooled together and spiked with serial dilutions of three LPAI strains similar to the previous studies to determine the Limit of Detection (LOD). Fifty-three avian samples (20 positive and 33 negative) and 57 semen samples (27 spiked positives and 30 negative) from previous studies were used for the diagnostic sensitivity and specificity tests [18,23]. For milk samples, the diagnostic sensitivity and specificity tests were performed using 100 previously positive field milk samples and 231 previously negative samples. Samples were frozen in an ultralow freezer at −80 °C upon receipt and in between studies.
2.2. Extraction Chemistries and Equipment
The avian samples (swabs and tissues) were extracted using 50 μL of sample input and 150 μL of 1× phosphate-buffered saline (PBS) with the various versions of the NAHLN-approved prefilled IndiMag Pathogen Kit (INDICAL BIOSCIENCE, Leipzig, Germany) on the IndiMag 48s, IndiMag 2 (INDICAL BIOSCIENCE, Leipzig, Germany), and the KingFisher Flex (Thermo Fisher Scientific, Waltham, MA, USA), as previously described [23]. Milk samples were extracted using 50 μL of sample input and 150 μL of 1x PBS with the prefilled IndiMag Pathogen Kit on the KingFisher Flex [24]. The semen samples were extracted using 100 μL of sample input and 100 μL of 1x PBS on the KingFisher Flex as previously described [18]. For all sample matrices, 1 µL of intype IC-RNA (intype IC, INDICAL BIOSCIENCE, Leipzig, Germany) and 2 µL of VetMAX Xeno Internal Positive Control RNA (Xeno, Thermo Fisher Scientific, Waltham, MA, USA) were spiked into the lysis buffers for all extractions. The extracted RNA was stored in an ultralow freezer at −80 °C between studies to minimize RNA degradation.
2.3. Polymerase Chain Reactions (PCR)
The nucleic acid extracts were run on various PCR assays for comparison. For avian samples, the NAHLN IAV protocol (NVSL-SOP-0068) was employed using the AgPath-ID One Step PCR reagents (AgPath-ID, Thermo Fisher Scientific, Waltham, MA, USA) either without IC (AgPath-ID/without IC) [24] or with intype IC primers (forward and reverse at 160 nM each) and probe (fluorescent dye of JOE at 80 nM) at 25 µL reaction volume (AgPath-ID/intype IC). The IndiMix JOE master mix (IndiMix JOE, INDICAL BIOSCIENCE, Leipzig, Germany) contains the primers and probe to identify intype IC was tested at 20 µL reaction volume using the NAHLN standard thermocycling parameters (IndiMix JOE/intype IC). In addition, IndiMix JOE was also evaluated using fast thermocycling protocol with a 20 µL reaction volume (IndiMix JOE FRV/intype IC). The thermocycling conditions consisted of one cycle of 50ºC for 10 minutes and 95ºC for 2 minutes and 40 cycles of 95ºC for 5 seconds and 57ºC for 30 seconds. The same concentration of IAV primers and probes was used in IndiMix JOE master mix as described in the NAHLN-approved protocols [24]. Comparison was performed as outlined by the NAHLN Methods Technical Working Group (MTWG).
For milk, a six-way LOD comparison of various PCR chemistry and internal control combinations was conducted per request by the United States Department of Agriculture (USDA) IAV reference laboratory. The comparison consisted of the gold standard assay for milk per NVSL-SOP-0068 using AgPath-ID with Xeno Internal Positive control-VIC assay (Xeno) (AgPath-ID/Xeno) [24], AgPath-ID/without IC, AgPath-ID/intype IC, IndiMix JOE FRV/intype IC, IndiMix JOE with Xeno Internal Positive control-LIZ assay (Xeno (LIZ), Thermo Fisher Scientific, Waltham, MA, USA, IndiMix JOE FRV/Xeno (LIZ)), and an IndiMix TAMRA master mix (INDICAL BIOSCIENCE, Leipzig, Germany) with Xeno assay (IndiMix TAMRA FRV/Xeno). Xeno (LIZ) was used with IndiMix JOE instead of Xeno and IndiMix TAMRA was used with Xeno instead of IndiMix JOE to avoid the competing signal in the same fluorescent channel in the thermocycler. The Xeno and Xeno (LIZ) assays were used at 0.8 µL per reaction. IndiMix TAMRA contains the primers and probe to identify intype IC. All AgPath-ID assays were tested at 25 µL reaction volume under the NAHLN standard thermocycling protocol, while the IndiMix fast thermocycling protocol with a 20 µL reaction volume (FRV) protocol was used in all IndiMix assays.
The milk and semen extractions were evaluated using the NAHLN AgPath-ID/Xeno assay at 25 µL reaction volume per NVSL-SOP-0068 [24], and the IndiMix JOE FRV/intype IC assay using the fast thermocycling protocol and 20 µL reaction volume. Lastly, a proficiency panel of sixteen inactivated milk samples, with known HPAI status, produced by the Veterinary Laboratory Investigation and Response Network were used for inter-laboratory comparison.
The PCRs were performed on the ABI 7500 or QuantStudio 5 (Thermo Fisher Scientific, Waltham, MA, USA) following the NAHLN-approved parameters or the FRV protocol [24]. The IAV, Xeno, and intype IC targets were analyzed at 5% of the maximum amplitude of their positive amplification control to account for any variation between PCR runs. The 5% was selected as the midpoint of the amplification curve. The NAHLN-approved protocols can be accessed online at: https://www.aphis.usda.gov/animal_health/lab_info_services/downloads/ApprovedSOPList.pdf (accessed February 8th, 2026). Full protocol details are managed by the NAHLN program office and may be requested by contacting NAHLN@usda.gov.
2.4. Statistical Analysis
For statistical analysis, samples lacking amplification for the IAV or ICs were assigned a cycle threshold (CT) value of 40, corresponding to the maximum number of assay cycles. Assay performance was assessed by determining the LOD, requiring at least two of the three replicates had CT values; coefficient of determination (R²); PCR efficiency; and diagnostic sensitivity and specificity. Precision was evaluated by calculations of standard deviation and percent coefficient of variation (CV). Statistical differences between methods were examined using either a T-test or ANOVA test. All statistical analyses were performed in GraphPad Prism version 10.6.0 (GraphPad, Boston, MA, USA), and figures were created with Tableau, Public Edition (Salesforce, San Francisco, CA, USA).
3. Results
Initially, this study was to compare IndiMix JOE to AgPath-ID without IC (gold standard), with the goal of IndiMix JOE becoming an alternative PCR chemistry for the IAV NAHLN surveillance in avian samples. The initial study also included intype IC, an exogenous internal control, to monitor inhibition and to prepare for a possible requirement change of an exogenous internal control for NAHLN avian IAV surveillance. In the avian study, the IndiMix JOE fast thermocycling condition at reduced 20 ul volume (FRV) protocol were investigated to decrease the PCR thermocycler time and reduce the assay cost with a lower PCR volume.
3.1. LOD and Precision of Avian Samples
Three IAV reference strains were tested in triplicate, and the results were compared across four protocols: AgPath-ID/without IC, AgPath-ID/intype IC, IndiMix JOE/intype IC, and IndiMix JOE FRV/intype IC (Table 1, Figure A1 and supplemental data S1). The addition of intype IC to AgPath-ID resulted in a reduced LOD by one log in reference strain 2 but no change for the other two reference strains. The IndiMix JOE FRV protocol had a one log reduction in sensitivity in reference strain 1 but not in the other two reference strains. A significant difference was lacking in mean CT values between the four PCR protocols (ANOVA, p = 0.4597). The R2 values were highly similar (>0.977 to 1.000) across the four PCR protocols. Greater variability occurred with the percent PCR efficiencies within replicates and across the various PCR protocols.
Low and high concentrations of IAV were used to assess the precision of AgPath-ID/ intype IC and IndiMix JOE/intype IC protocols (Figure 1 and supplemental data S2). The high concentration of IAV had a lower coefficient of variation (1.43% and 1.56% for AgPath-ID and IndMix JOE, respectively) compared to the low concentration of IAV (2.61% and 2.09% for AgPath-ID and IndMix JOE, respectively). The intype IC at the high concentrations of IAV also had lower coefficient of variation (1.27% and 1.28% for AgPath-ID and IndiMix JOE, respectively) compared to the lower concentration of IAV (1.55% and 2.03% for AgPath-ID and IndiMix JOE, respectively).
Additional experiments for diagnostic sensitivity and specificity, repeatability, and reproducibility were conducted in the avian study and are reported later with the milk and semen matrices.
3.2. AgPath-ID and IndMix JOE with Xeno and Intype IC Comparison in Milk Samples
After the IndiMix JOE validation for NAHLN IAV avian surveillance was completed, IAV was identified in dairy cattle in the United States, and NAHLN IAV surveillance in milk required the addition of Xeno with AgPath-ID. The USDA IAV reference laboratory requested a six-way comparison of the two exogenous internal controls in both PCR chemistries.
The overall LOD was consistent using a single replicate across the IAV reference strains for the six PCR protocols (Table 2, Figure A2 and supplemental data S3). Compared to the gold standard AgPath-ID/Xeno, a single log reduction in LOD occurred for reference 2 and 3 for all protocols. However, reference 1 had a one log increase in sensitivity when intype IC was added to AgPath-ID. The R2 values consistently ranged between 0.977 and 1.000 regardless of exogenous internal control or PCR chemistry, but an increased fluctuation occurred in the percent PCR efficiency, ranging between 90.2 and 133.7. The exogenous controls were within the NAHLN’s acceptable range (<34.5).
While the LOD differed slightly compared to the NAHLN method of AgPath-ID/Xeno, there was no significant difference (ANOVA, p = 0.9938) in mean CT values of all six PCR protocols. The variance for IAV CT value of the PCR protocols was compared to the gold standard, and the mean variance ranged between -0.78 and 0.37 (Figure 2). The AgPath-ID/without IC had a 0.37 lower in mean variance, while the IndiMix TAMRA FRV/Xeno assay was very comparable to the gold standard (only 0.09 mean CT higher). While not significant, the AgPath-ID/intype IC, the IndiMix JOE FRV/intype IC, and the IndiMix JOE FRV/Xeno (LIZ) had higher variances of 0.78, 0.51 and 0.70, respectively compared to the gold standard.
3.3. LOD in Milk and Semen Samples
After establishing a lack of significant difference between exogenous controls and PCR protocols, extended semen was added to the study of IndiMix JOE FRV/intype IC as an alternative method for IAV surveillance. Semen is difficult to extract due the numerous inhibitors, illustrating the need for an exogenous internal control to verify accuracy of results. In addition, due to the IAV outbreak in dairy and unclear understanding of the viral tropism, IAV testing in semen could become a potential screening tool, especially for U.S. exports. To achieve this, previously extracted nucleic acid was tested with AgPath-ID/Xeno and IndiMix JOE FRV/intype IC [17]. The results from milk and semen are presented together in the following paragraphs.
The three IAV reference strains were tested in triplicate (similar to the avian study) with NAHLN’s gold standard (AgPath-ID/Xeno) and IndiMix JOE FRV/intype IC (Table 3, Figure A3 and Figure A4, and supplemental data S4). Compared to the gold standard, the LOD for IndiMix JOE FRV/intype IC was the same for milk and had a single log increased sensitivity with reference strain 2 for semen. A significant difference in mean CT values was lacking between IndiMix JOE FRV/intype IC compared to the gold standard in milk and semen matrices (T-test, p = 0.7011 and p = 0.7578 respectively).
3.4. Exogenous Internal Control Comparison from the Previous Triplicate LOD PCR Methods with Avian, Milk, and Semen Samples
The exogenous internal controls from the triplicate LOD from avian, milk, and semen samples (Table 1 and Table 3) were evaluated using the NAHLN acceptance CT cut off value of 34.5 (Figure 3 and Supplemental data S5). The mean intype IC CT values for AgPath-ID, IndiMix JOE, and IndiMix JOE FRV in the avian samples were 29.69, 27.72 and 28.09, respectively, with a significant difference (ANOVA, p = <0.0001) between the AgPath-ID and IndiMix JOE assays (Figure 3). Statistical analysis was unavailable for milk and semen, as replicates of each IC in the matrices were lacking. The mean intype IC CT values with IndiMix JOE FRV were 28.14 and 29.23 in milk and semen samples, respectively. The coefficient of variation for intype IC ranged from 2.15% to 2.48% for avian, and 0.5% and 5.85% for milk and semen, respectively. A significant CT shift in the spiked reference strain 1 contributed to the high coefficient of variation in semen (Figure 3). The mean Xeno CT values were 31.01 and 30.57 in milk and semen samples, respectively. The coefficients of variation for Xeno were 1.00% and 1.88% in milk and semen samples, respectively.
3.5. Diagnostic Sensitivity and Specificity in Avian, Milk, and Semen
Next, the diagnostic sensitivity and specificity of the IndiMix JOE/intype IC was compared to AgPath-ID/without IC (NAHLN gold standard) and AgPath-ID/intype IC for avian samples, and to AgPath-ID/Xeno (NAHLN gold standard) for milk and semen samples. The number of positive and negative samples varied by sample type given the availability of sample matrices. There were 53 avian samples (20 positive and 33 negative), 331 milk samples (100 positive and 231 negative), and 57 semen samples (27 spiked positives and 30 negative) (supplemental data S6).
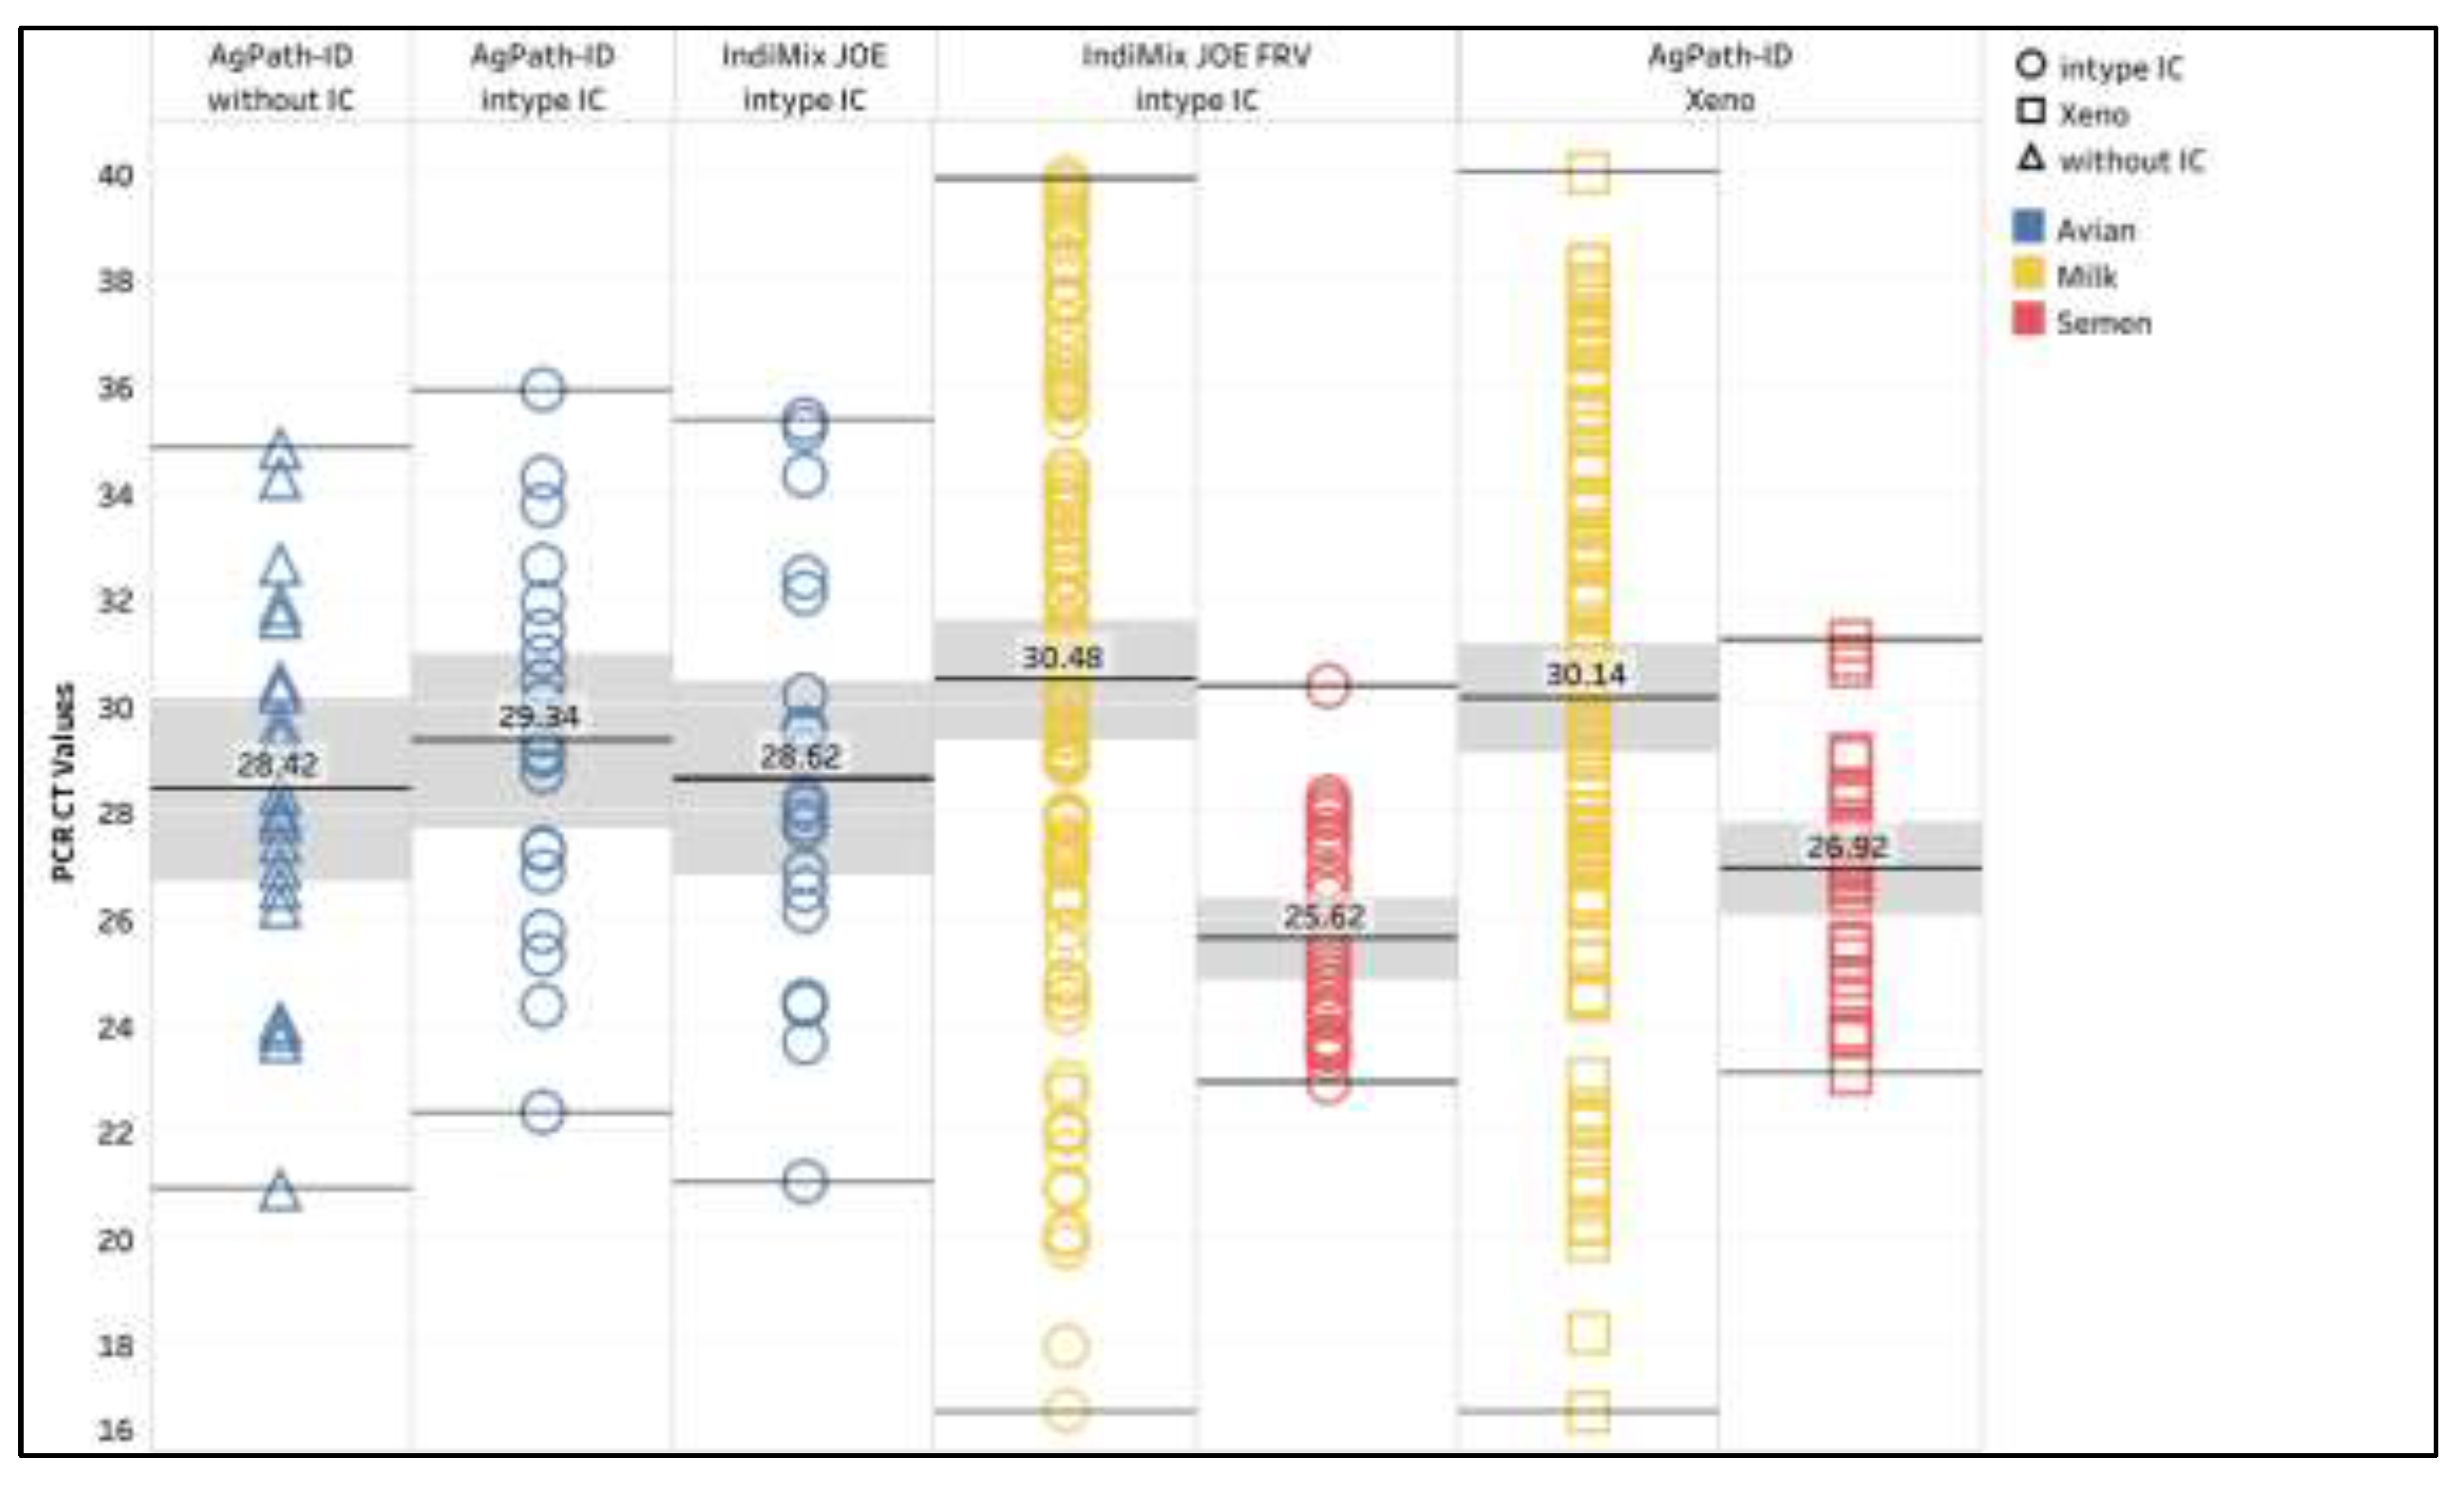
AgPath-ID/intype IC and IndiMix JOE/intype IC for the avian samples and IndiMix JOE FRV/intype IC for the milk and semen samples had a 100% diagnostic sensitivity and specificity for the three sample matrices compared to the NAHLN gold standard PCRs. The mean IAV CT values for the avian positive samples were 28.42 (95% CI: 26.71 - 30.14), 29.34 (95% CI: 27.70 - 30.97), and 28.62 (95% CI: 26.81 - 30.43) for AgPath-ID/without IC, AgPath-ID/intype IC, and IndiMix JOE/intype IC, respectively. The mean IAV CT values for the positive milk samples were 30.14 (95% CI: 29.10 - 31.18) and 30.48 (95% CI: 29.35 - 31.61) for AgPath-ID/Xeno and IndiMix JOE FRV/intype IC, respectively. The mean IAV CT values for the positive semen samples were 26.92 (95% CI: 26.04 - 27.79) and 25.62 (95% CI:24.84 - 26.39) for AgPath-ID/Xeno and IndiMix JOE FRV/intype IC (Figure A5). Significance was lacking between the mean IAV CT values for the PCR protocols (avian, ANOVA p = 0.7181, and milk T test, p = 0.1094). However, the mean IAV CT for semen by IndiMix JOE FRV/intype IC was significantly lower than the AgPath-ID/Xeno (T-test, p = 0.0265).
The exogenous internal controls in the positive and negative diagnostic sensitivity and specificity samples were investigated using the NAHLN acceptance CT cut off value of 34.5 (Figure 4 and supplemental data S7). The mean intype IC CT values were 30.29 (95% CI: 29.61 - 30.97), 28.98 (95% CI: 28.08 - 29.87), 28.26 (95% CI: 28.22 - 28.30), and 28.10 (95% CI: 27.73 - 28.46) for the various PCR assays. The mean Xeno CT values were 30.90 (95% CI: 30.85 - 30.95) and 30.66 (95% CI: 30.39 - 30.92) for milk and semen, respectively. A significant CT shift in the intype IC was observed in two negative and two positive avian tissue samples, indication of inhibitory effects in those sample matrices (supplementary data S7).
3.6. Assay Repeatability and Reproducibility
The inter-run repeatability and reproducibility was investigated with 53 avian samples (20 positives and 33 negatives), 32 positive milk samples, and 57 semen samples (27 spiked-IAV positives and 30 negatives) (supplemental data S6). The positive and negative results were 100% in agreement with cross-classification analysis. The mean variance between replicates ranged between 0.056 and 1.153, illustrating excellent correlations, with Pearson correlation coefficients r = 0.9944, r = 0.9974, r = 0.9351, and r = 0.8921 for the positive avian (AgPath-ID and IndiMix JOE), milk, and semen data sets, respectively (Figure 5). A significant difference was lacking between the replicates (T test, p = 0.3366, p = 0.8456, p = 0.7569 and p = 0.9164 for avian (AgPath-ID and IndiMix JOE), milk, and semen, respectively).
Next, variability in intype IC with the inter-run repeatability and reproducibility data set was investigated (supplemental data S7). With the replicates, the mean intype IC CT values were 29.35 (95% CI: 28.61 - 30.09), 29.42, (95% CI: 28.55 - 30.28), 28.29 (95% CI: 28.00 - 28.59), and 28.22 (95% CI: 27.89 - 28.54) for AgPath-ID and IndiMix JOE with avian, and IndiMix JOE FRV with milk and semen samples, respectively. The variances in the mean intype IC CT values were -0.94 (AgPath-ID, avian), 0.44 (IndiMix JOE, avian), 0.16 (IndiMix JOE FRV, milk), and 0.12 (IndiMix JOE FRV, semen).
3.7. Interlaboratory Comparison
Lastly, a proficiency panel of sixteen inactivated milk samples produced by the Veterinary Laboratory Investigation and Response Network was tested by WVDL and the Ohio Department of Agriculture (ODA) with the gold standard (AgPath-ID/Xeno) and IndiMix JOE FRV/intype IC (supplemental data S8) protocols. The repeatable LOD was 284 copies per 50 µL of milk for both the gold standard (CT values from 34.46 to 36.96) and IndiMix JOE FRV/intype (CT values from 34.29 to 35.83). Both PCR protocols detected samples at 28 copies per 50 µL of milk in 2 of the 3 tests per PCR protocol (CT value >36.38). The mean variances between replicates were 0.498 and 0.225, illustrating excellent correlations, with Pearson correlation coefficients r = 0.9552 and r = 0.9702 for the CT values of positive samples using the gold standard (AgPath-ID/Xeno) and IndiMix JOE FRV/intype IC respectively (Figure 6). The mean Xeno CT values for individual comparisons were 30.84 and 29.30, while the mean intype IC CT values were 28.59 and 28.50 for WVDL and ODA, respectively.
4. Discussion
The performance of IndiMix JOE/intype IC using the standard NAHLN thermocycling conditions was highly comparable to the NAHLN gold standard AgPath-ID assay, with or without the addition of the intype IC for testing avian samples. A significant difference was lacking in mean CT values at the limit of detection (LOD), and precision was excellent for both IAV and intype IC targets (CV 1.56 – 2.06% for IAV; 1.28 – 2.03% for intype IC). The laboratories have additional flexibility in using IndiMix JOE with the same thermocycling parameters as the NAHLN assays, thus making the master mix interchangeable without workflow modification. The availability of validated alternative reagents is particularly important during high-demand outbreak situations or supply chain disruptions, which were experienced during the COVID-19 pandemic [25].
IndiMix JOE was also evaluated using a manufacturer-recommended fast reduced-volume protocol (IndiMix JOE FRV protocol). This approach reduced thermocycling time by approximately 30 minutes and decreased reagent consumption by 20% without compromising analytical sensitivity. The NAHLN MTWG approved this methodology for avian surveillance based on a large data set (data not known). The reduced time-to-result and lower reagent usage provides meaningful operational and economic advantages, particularly in high-throughput surveillance settings.
Following detection of HPAI in U.S. dairy cattle, NAHLN implemented the addition of the Xeno exogenous internal control to the AgPath-ID assay for milk testing [24]. A six-way comparison of PCR chemistries and internal control configurations demonstrated no significant differences in mean CT values (ANOVA, p = 0.9938), with CT variance ranging from −0.78 to 0.37 relative to the gold standard. Further evaluation of the IndiMix JOE FRV/intype IC protocol in milk and semen also showed no significant differences compared to AgPath-ID/Xeno. These findings support inclusion of IndiMix JOE FRV/intype IC as an alternative NAHLN IAV protocol, providing additional flexibility during periods of elevated testing demand and supporting rapid decision-making in outbreak response.
Evaluation of avian clinical samples with known inhibitory effects (supplementary data S7) highlights the importance of incorporating an exogenous internal control to monitor PCR inhibition and prevent false-negative results, particularly in complex matrices rich in proteins and other inhibitory substances, such as milk and semen. The World Organisation for Animal Health indicates a internal control must be included inhibitor matrixes to avoid a false-negative result [26]. It’s well documented at inhibitor matrices including tissues, milk, and semen have been well documented [18,21]. The MIQE guidelines further emphasize the necessity of internal controls to ensure assay validity and reliability in diagnostic PCR [27]. Our comparison of intype IC and Xeno in milk demonstrated equivalent performance (ANOVA, p = 0.9938), supporting flexibility in internal control configuration while maintaining analytical integrity. Comparable performance between internal control systems reinforces quality assurance principles in molecular diagnostics.
5. Conclusions
Overall, validation of IndiMix JOE and intype IC as alternative reagents strengthens testing resilience within the NAHLN framework for a variety of sample types. AgPath-ID and IndiMix JOE with intype IC illustrated excellent precision, diagnostic performance, repeatability, a low coefficient of variation, and consistent interlaboratory performance, therefore confirming their robustness and reliability. The availability of interchangeable, performance-verified reagents ensures continuity of diagnostic capacity during outbreak response, mitigates risks associated with supply chain disruptions, and supports rapid, reliable decision-making in animal health emergencies.
Supplementary Materials
The following supporting information can be downloaded at: https://www.mdpi.com/article/doi/s1, Supplemental data S1. Influenza A virus (IAV) CT values for AgPath-ID with and without intype IC and IndiMix JOE with intype IC using the NAHLN and the FRV protocols with avian IAV-spiked serial diluted samples. Supplemental data S2. Precision of avian influenza A virus (IAV) at high and low concentration with AgPath-ID and IndiMix JOE with intype IC. Supplemental data S3. Influenza A virus (IAV), Xeno, and intype IC CT values using six different assay combinations with IAV-spiked serial diluted milk samples. Supplemental data S4. CT values for AgPath-ID with Xeno and IndiMix JOE with intype IC using the NAHLN and FRV protocols with IAV-spiked serial diluted milk and semen samples. Supplemental data S5. Xeno and intype IC CT values from AgPath-ID with Xeno and IndiMix JOE with intype IC using the NAHLN and FRV protocols with IAV-spiked serial diluted avian, milk and semen samples. Supplemental data S6. Influenza A virus (IAV) CT values from AgPath-ID with or without Xeno and IndiMix JOE with intype IC using the NAHLN and FRV protocols with avian, milk and semen positive and negative samples. Supplemental data S7. Xeno and intype IC CT values from AgPath-ID with or without an internal control and IndiMix JOE FRV with intype IC using the NAHLN and FRV protocols with avian, milk and semen positive and negative samples. Supplemental data S8. Influenza A virus (IAV), Xeno, and intype IC CT values with the known status of IAV milk samples tested at Wisconsin Veterinary Diagnostic Laboratory (WVDL) and Ohio Department of Agriculture (ODA).
Author Contributions
Conceptualization, D.G.M. and A.L.; methodology, A.H., A.V.C, S.V., D.G.M., and A.L.; software, A.V.C. and A.L.; validation, A.H., A.V.C, S.V., D.G.M., and A.L.; formal analysis, A.H., A.V.C, D.G.M., and A.L.; investigation, A.H., A.V.C., S.V., D.G.M., and A.L.; resources, M.P., D.G.M., A.L.; data curation, A.H., A.V.C., S.V., and A.L.; writing—original draft preparation, A.H., A.V.C., D.G.M., and A.L.; writing—review and editing, A.H., A.V.C, S.V., Q.Z., M.P., D.G.M., and A.L.; visualization, A.V.C. and A.L.; supervision, Q.Z., A.L.; project administration, M.P., A.L.; funding acquisition, A.L.
Funding
WVDL and ODA funded the personnel and reagents for the study. INDICAL BIOSCIENCE provided funding for part of the study.
Institutional Review Board Statement
Not applicable.
Informed Consent Statement
Not applicable.
Data Availability Statement
Raw data and the supporting information can be downloaded at: www.mdpi.com/xxx/s1.
Acknowledgments
We thank the U.S. Department of Agriculture National Veterinary Services Laboratory for providing reference materials for this study; the U.S. Geological Survey National Wildlife Health Center for providing positive field samples; and the Vet-LIRN program for providing the milk proficiency panel.
Conflicts of Interest
The authors (A.Z., A.V.C., S.V., Q.Z., M.P., and A.L.) declare no conflicts of interest. D.G.M. is employed by INDICAL BIOSCIENCE, which partially funded the project, and participates in the design of the study; in the analysis of data; and in the writing of the manuscript.
Abbreviations
The following abbreviations are used in this manuscript:
| AgPath-ID | AgPath-ID One-Step RT-PCR Reagents |
| ANOVA | Analysis of Variance |
| CT | Cycle threshold |
| CV | Correlation of variance |
| FRV | Fast thermocycling and reduced volume |
| HPAI | Highly Pathogenic Avian Influenza |
| IAV | Influenza A virus |
| IC | Internal control |
| IM2 | IndiMag 2 |
| IM48s | IndiMag 48s |
| intype IC | intype IC-RNA |
| LOD | Limit of detection |
| LPAI | Low Pathogenic Avian Influenza |
| NAHLN | National Animal Health Laboratory Network |
| ODA | Ohio Department of Agriculture |
| PBS | Phosphate-buffered saline |
| PCR | Polymerase chain reactions |
| R² | Coefficient of determination |
| USDA | United States Department of Agriculture |
| U.S. | United States |
| Vet-LIRN | Veterinary Laboratory Investigation and Response Network |
| WVDL | Wisconsin Veterinary Diagnostic Laboratory |
| Xeno | VetMAX Xeno Internal Positive Control RNA with VIC assay |
| Xeno (LIZ) | VetMAX Xeno Internal Positive Control RNA with LIZ assay |
Appendix A
Figure A1.
The influenza A virus (IAV) CT values across dilutions of three reference strains for AgPath-ID/without IC, AgPath-ID/intype IC, IndiMix JOE/intype IC, and the IndiMix JOE fast, reduced volume (FRV) with intype IC in avian samples.
Figure A1.
The influenza A virus (IAV) CT values across dilutions of three reference strains for AgPath-ID/without IC, AgPath-ID/intype IC, IndiMix JOE/intype IC, and the IndiMix JOE fast, reduced volume (FRV) with intype IC in avian samples.
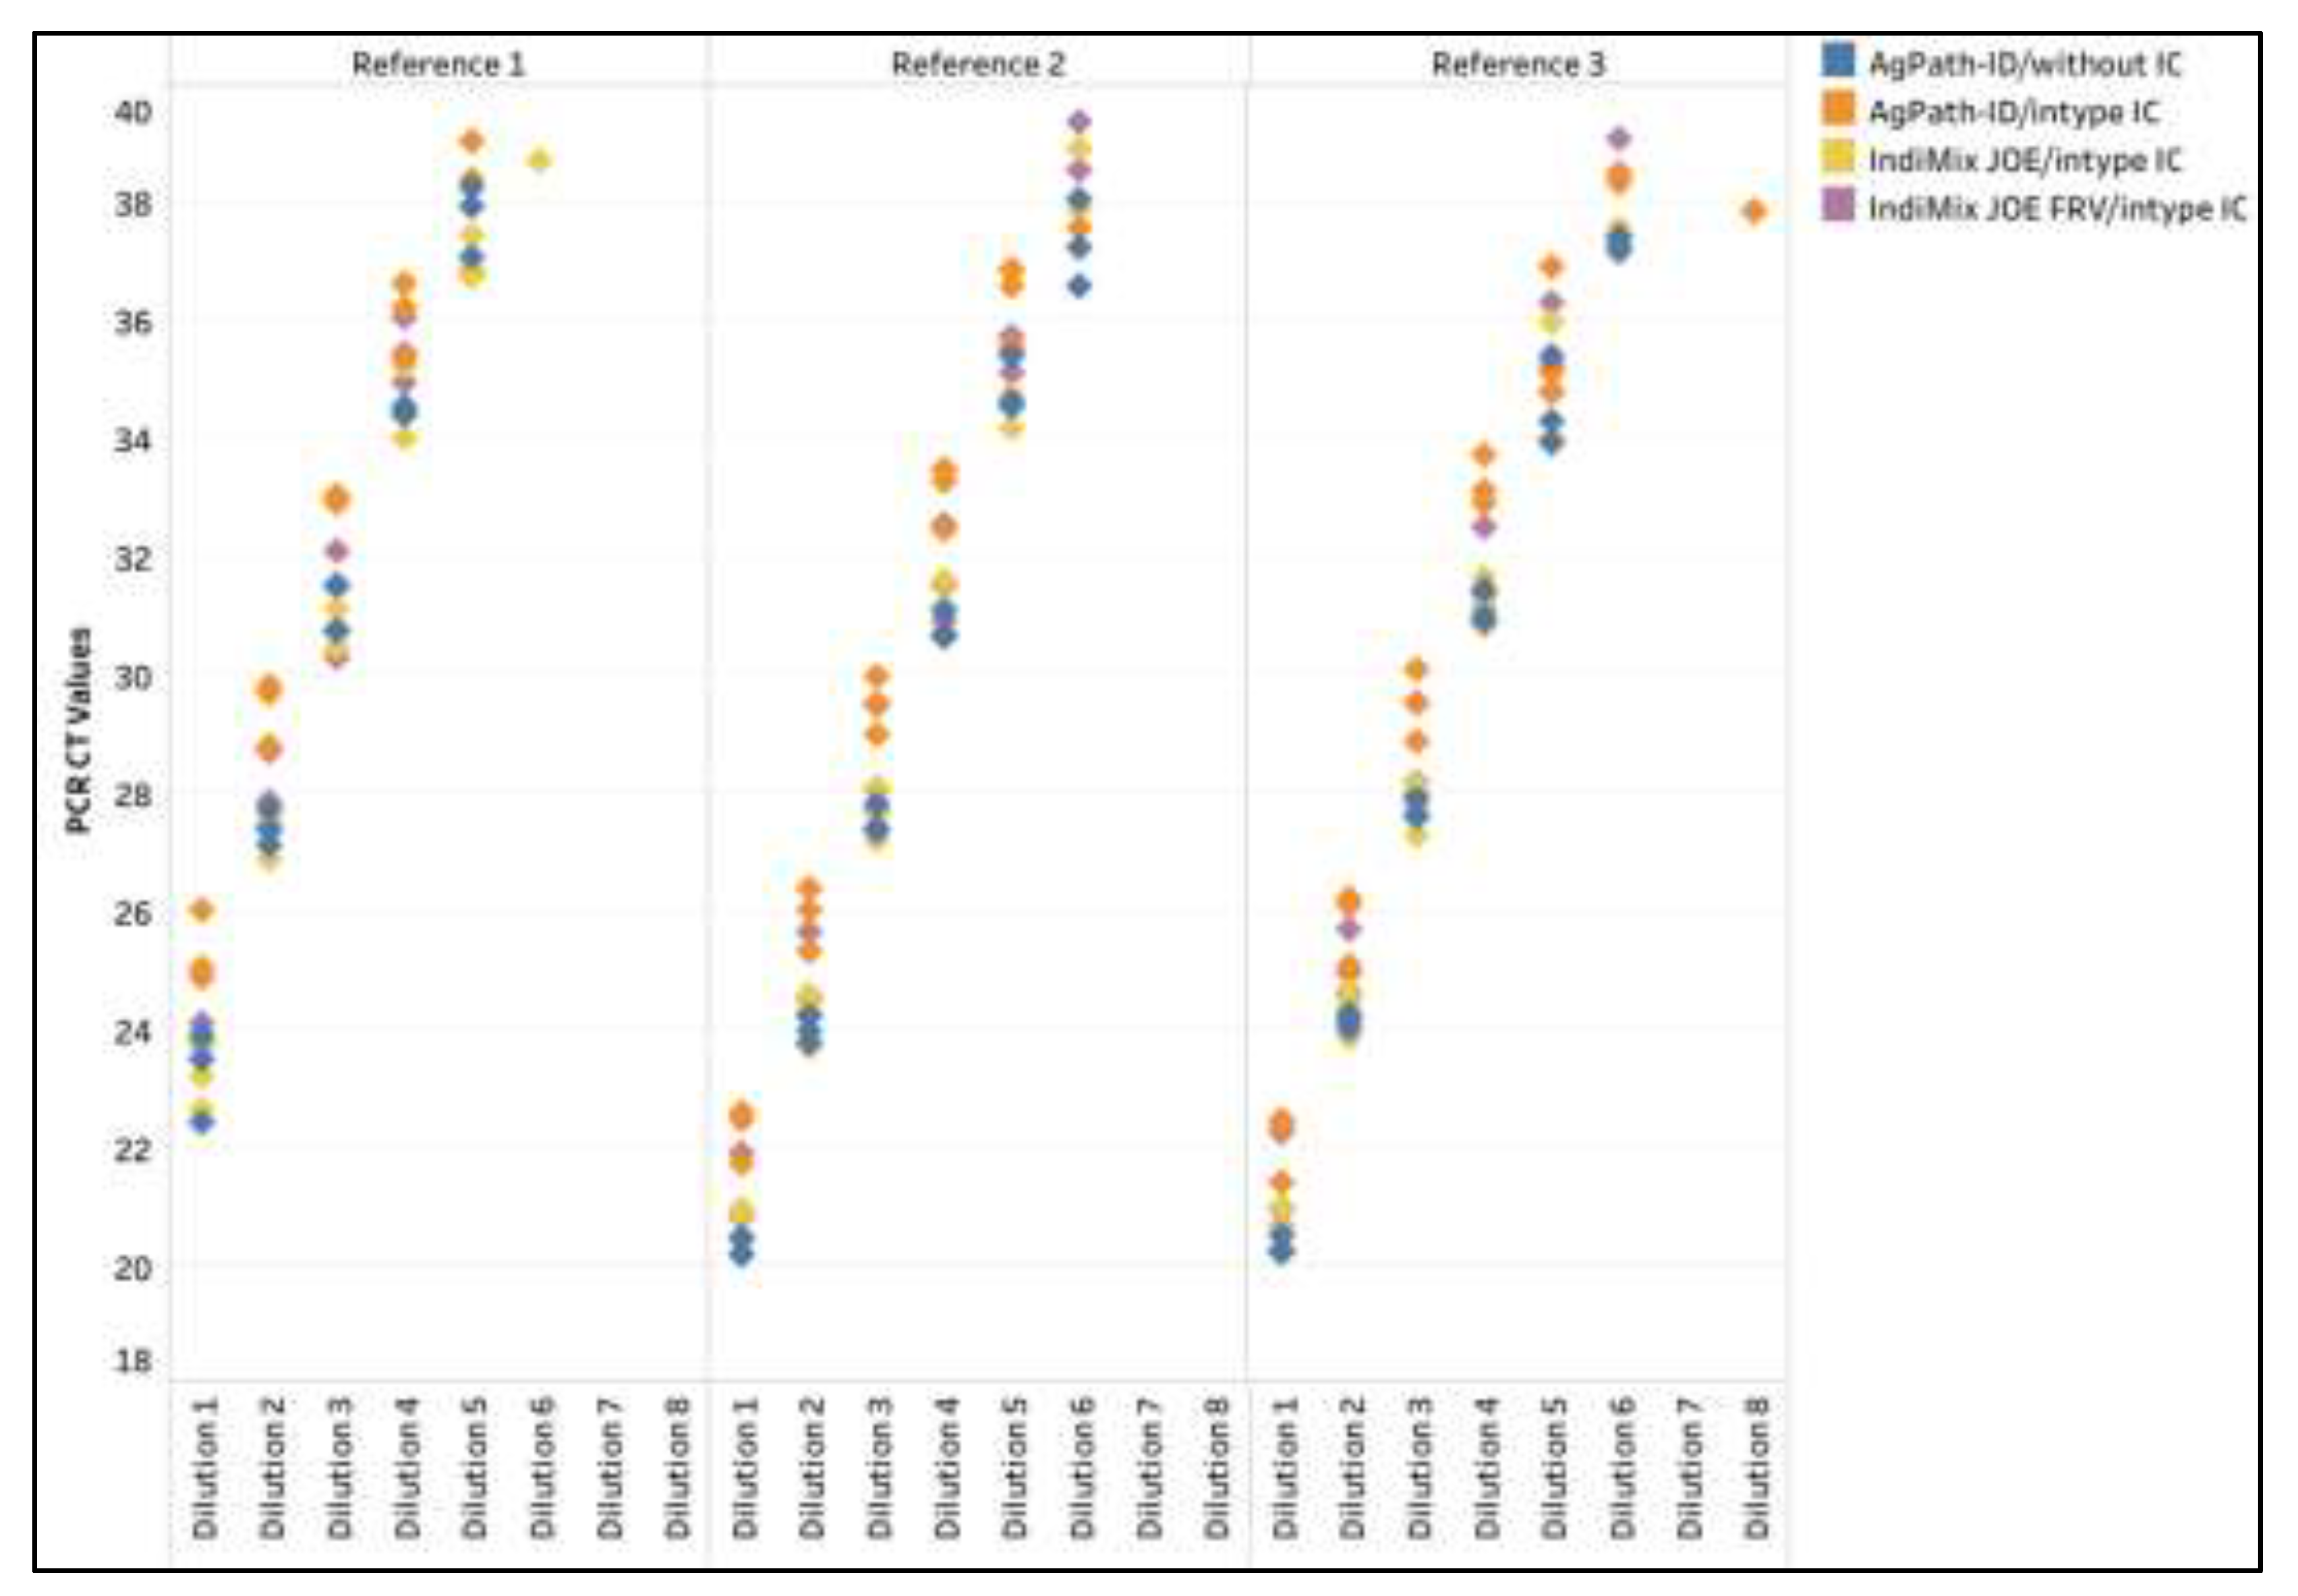
Figure A2.
The influenza A virus CT values across dilutions of three reference strains for AgPath-ID/without IC, AgPath-ID/intype IC, IndiMix JOE FRV/intype IC, IndiMix JOE FRV/Xeno (LIZ), and IndiMix TAMRA FRV/Xeno compared to AgPath-ID/Xeno as the gold standard in milk.
Figure A2.
The influenza A virus CT values across dilutions of three reference strains for AgPath-ID/without IC, AgPath-ID/intype IC, IndiMix JOE FRV/intype IC, IndiMix JOE FRV/Xeno (LIZ), and IndiMix TAMRA FRV/Xeno compared to AgPath-ID/Xeno as the gold standard in milk.
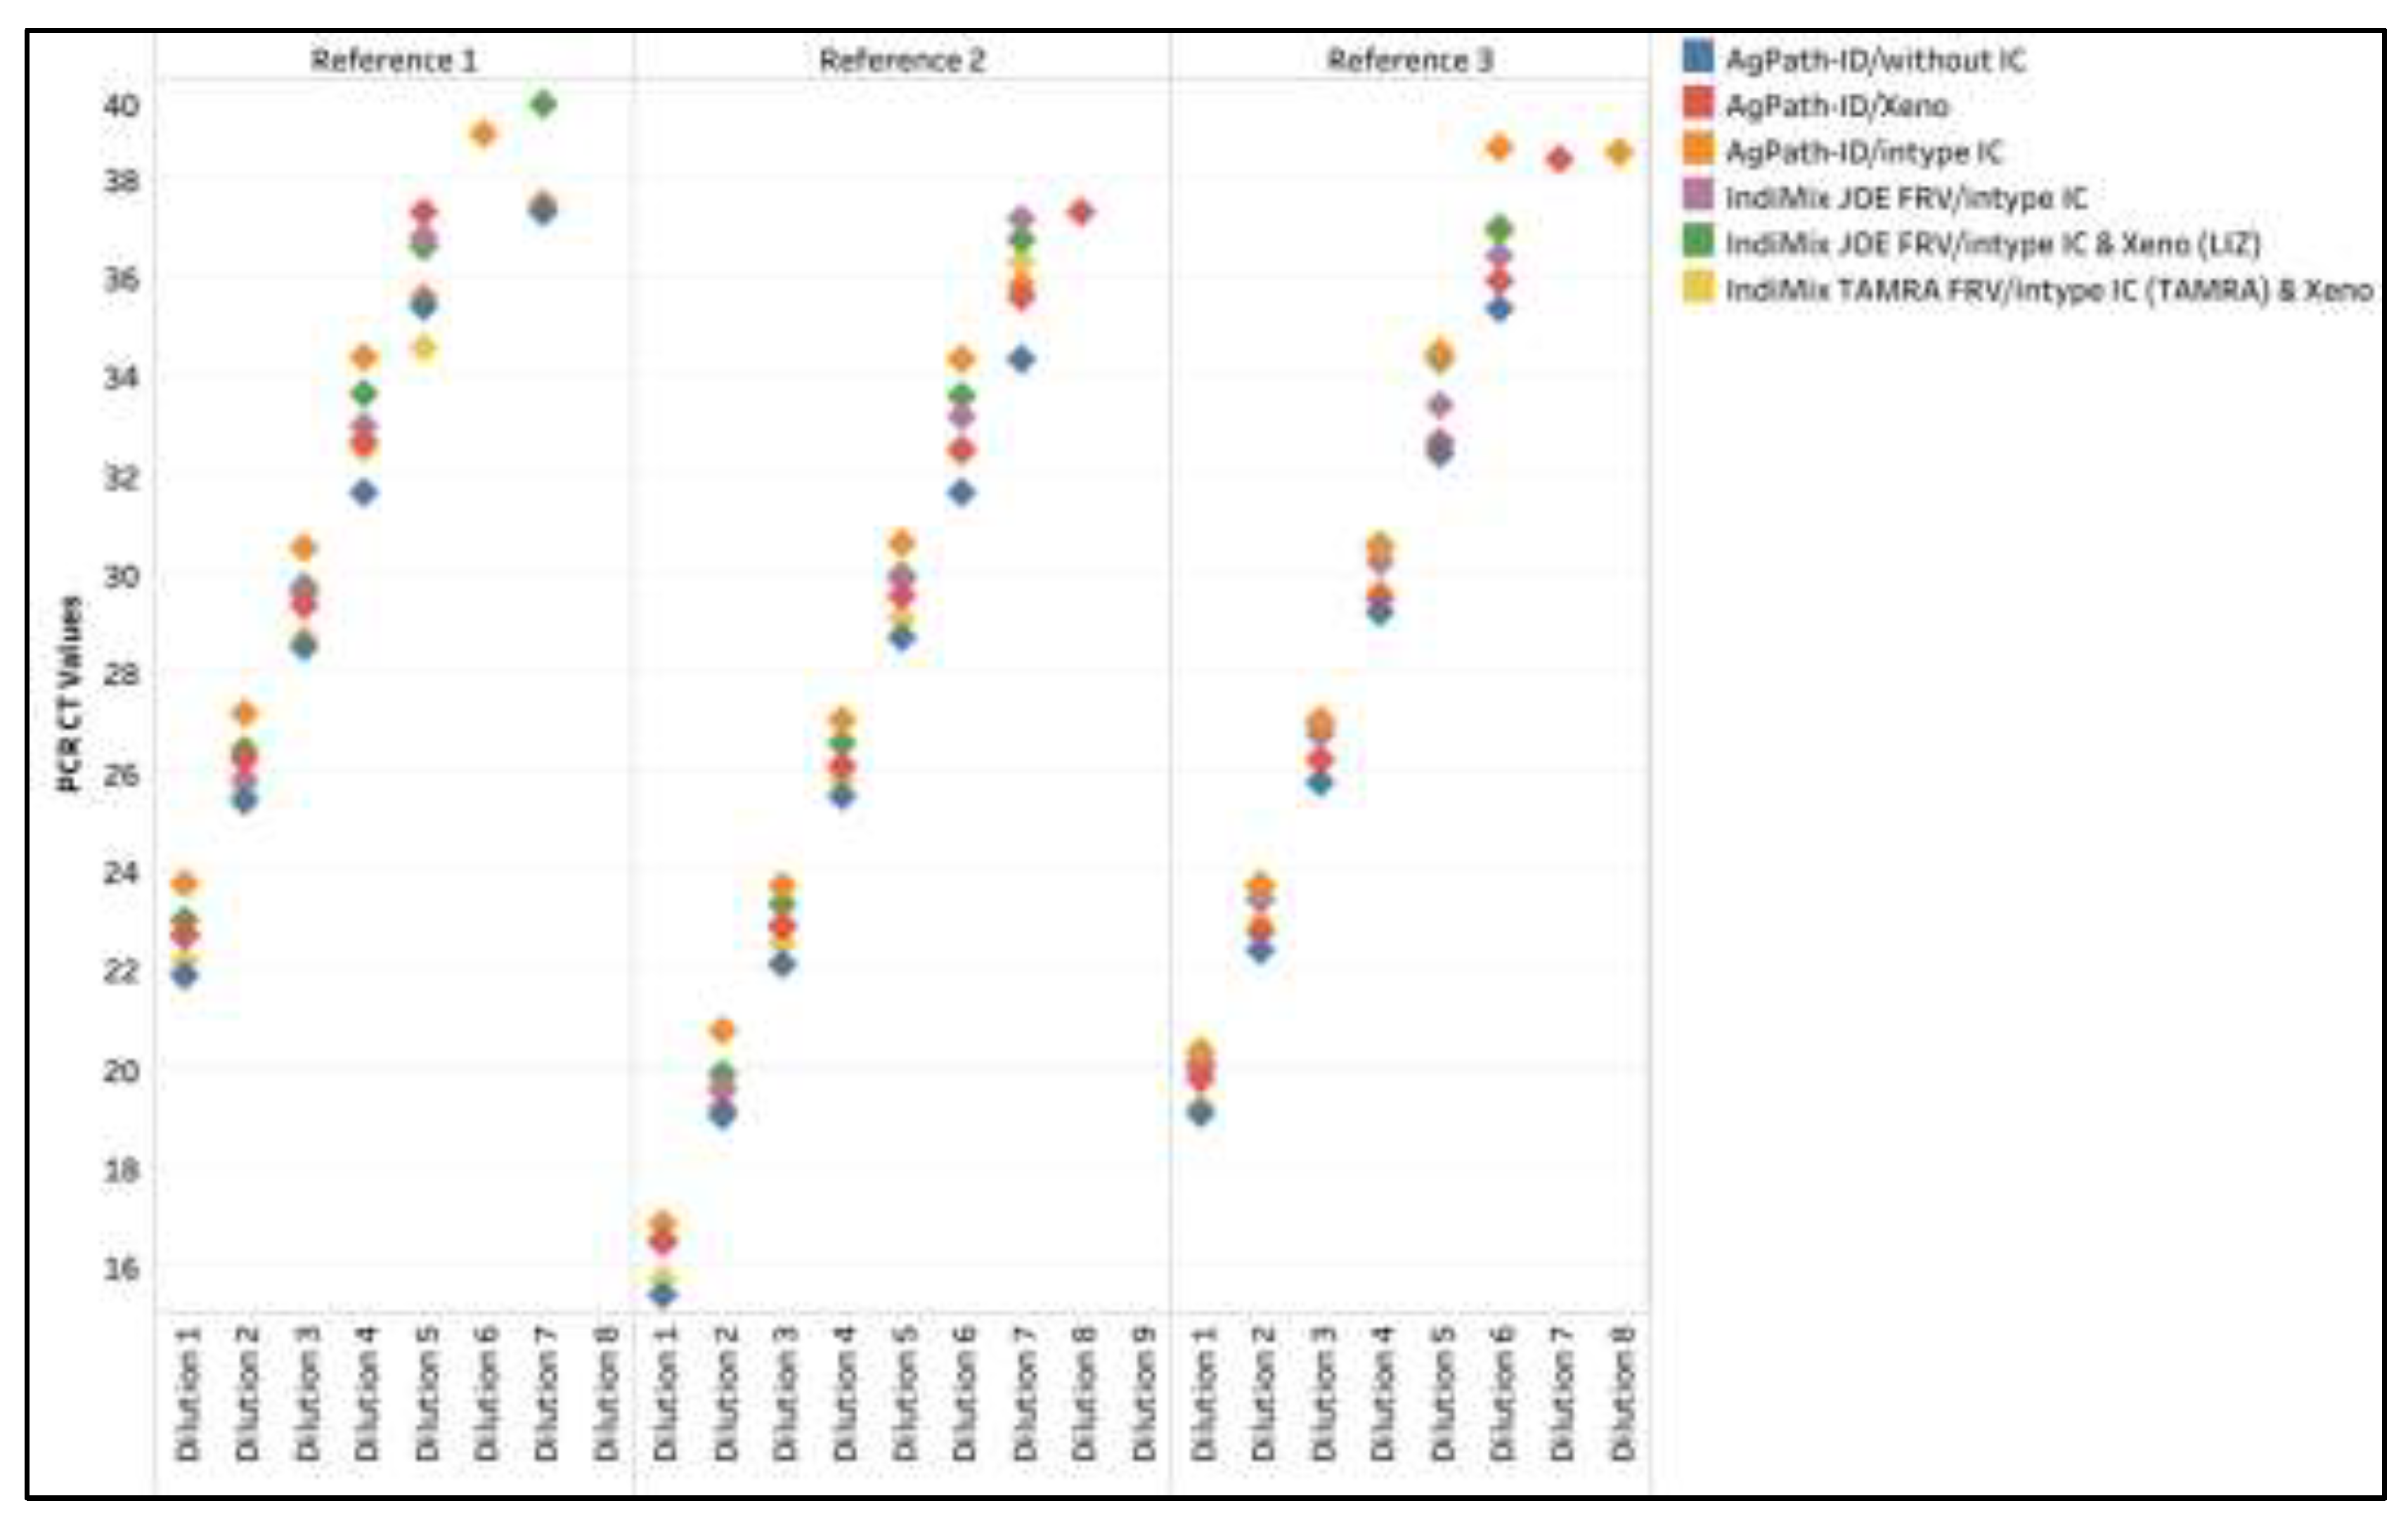
Figure A3.
The influenza A virus (IAV) CT values across dilutions of three reference strains for the AgPath-ID/Xeno and the IndiMix JOE fast, reduced volume (FRV) with intype IC in milk samples.
Figure A3.
The influenza A virus (IAV) CT values across dilutions of three reference strains for the AgPath-ID/Xeno and the IndiMix JOE fast, reduced volume (FRV) with intype IC in milk samples.
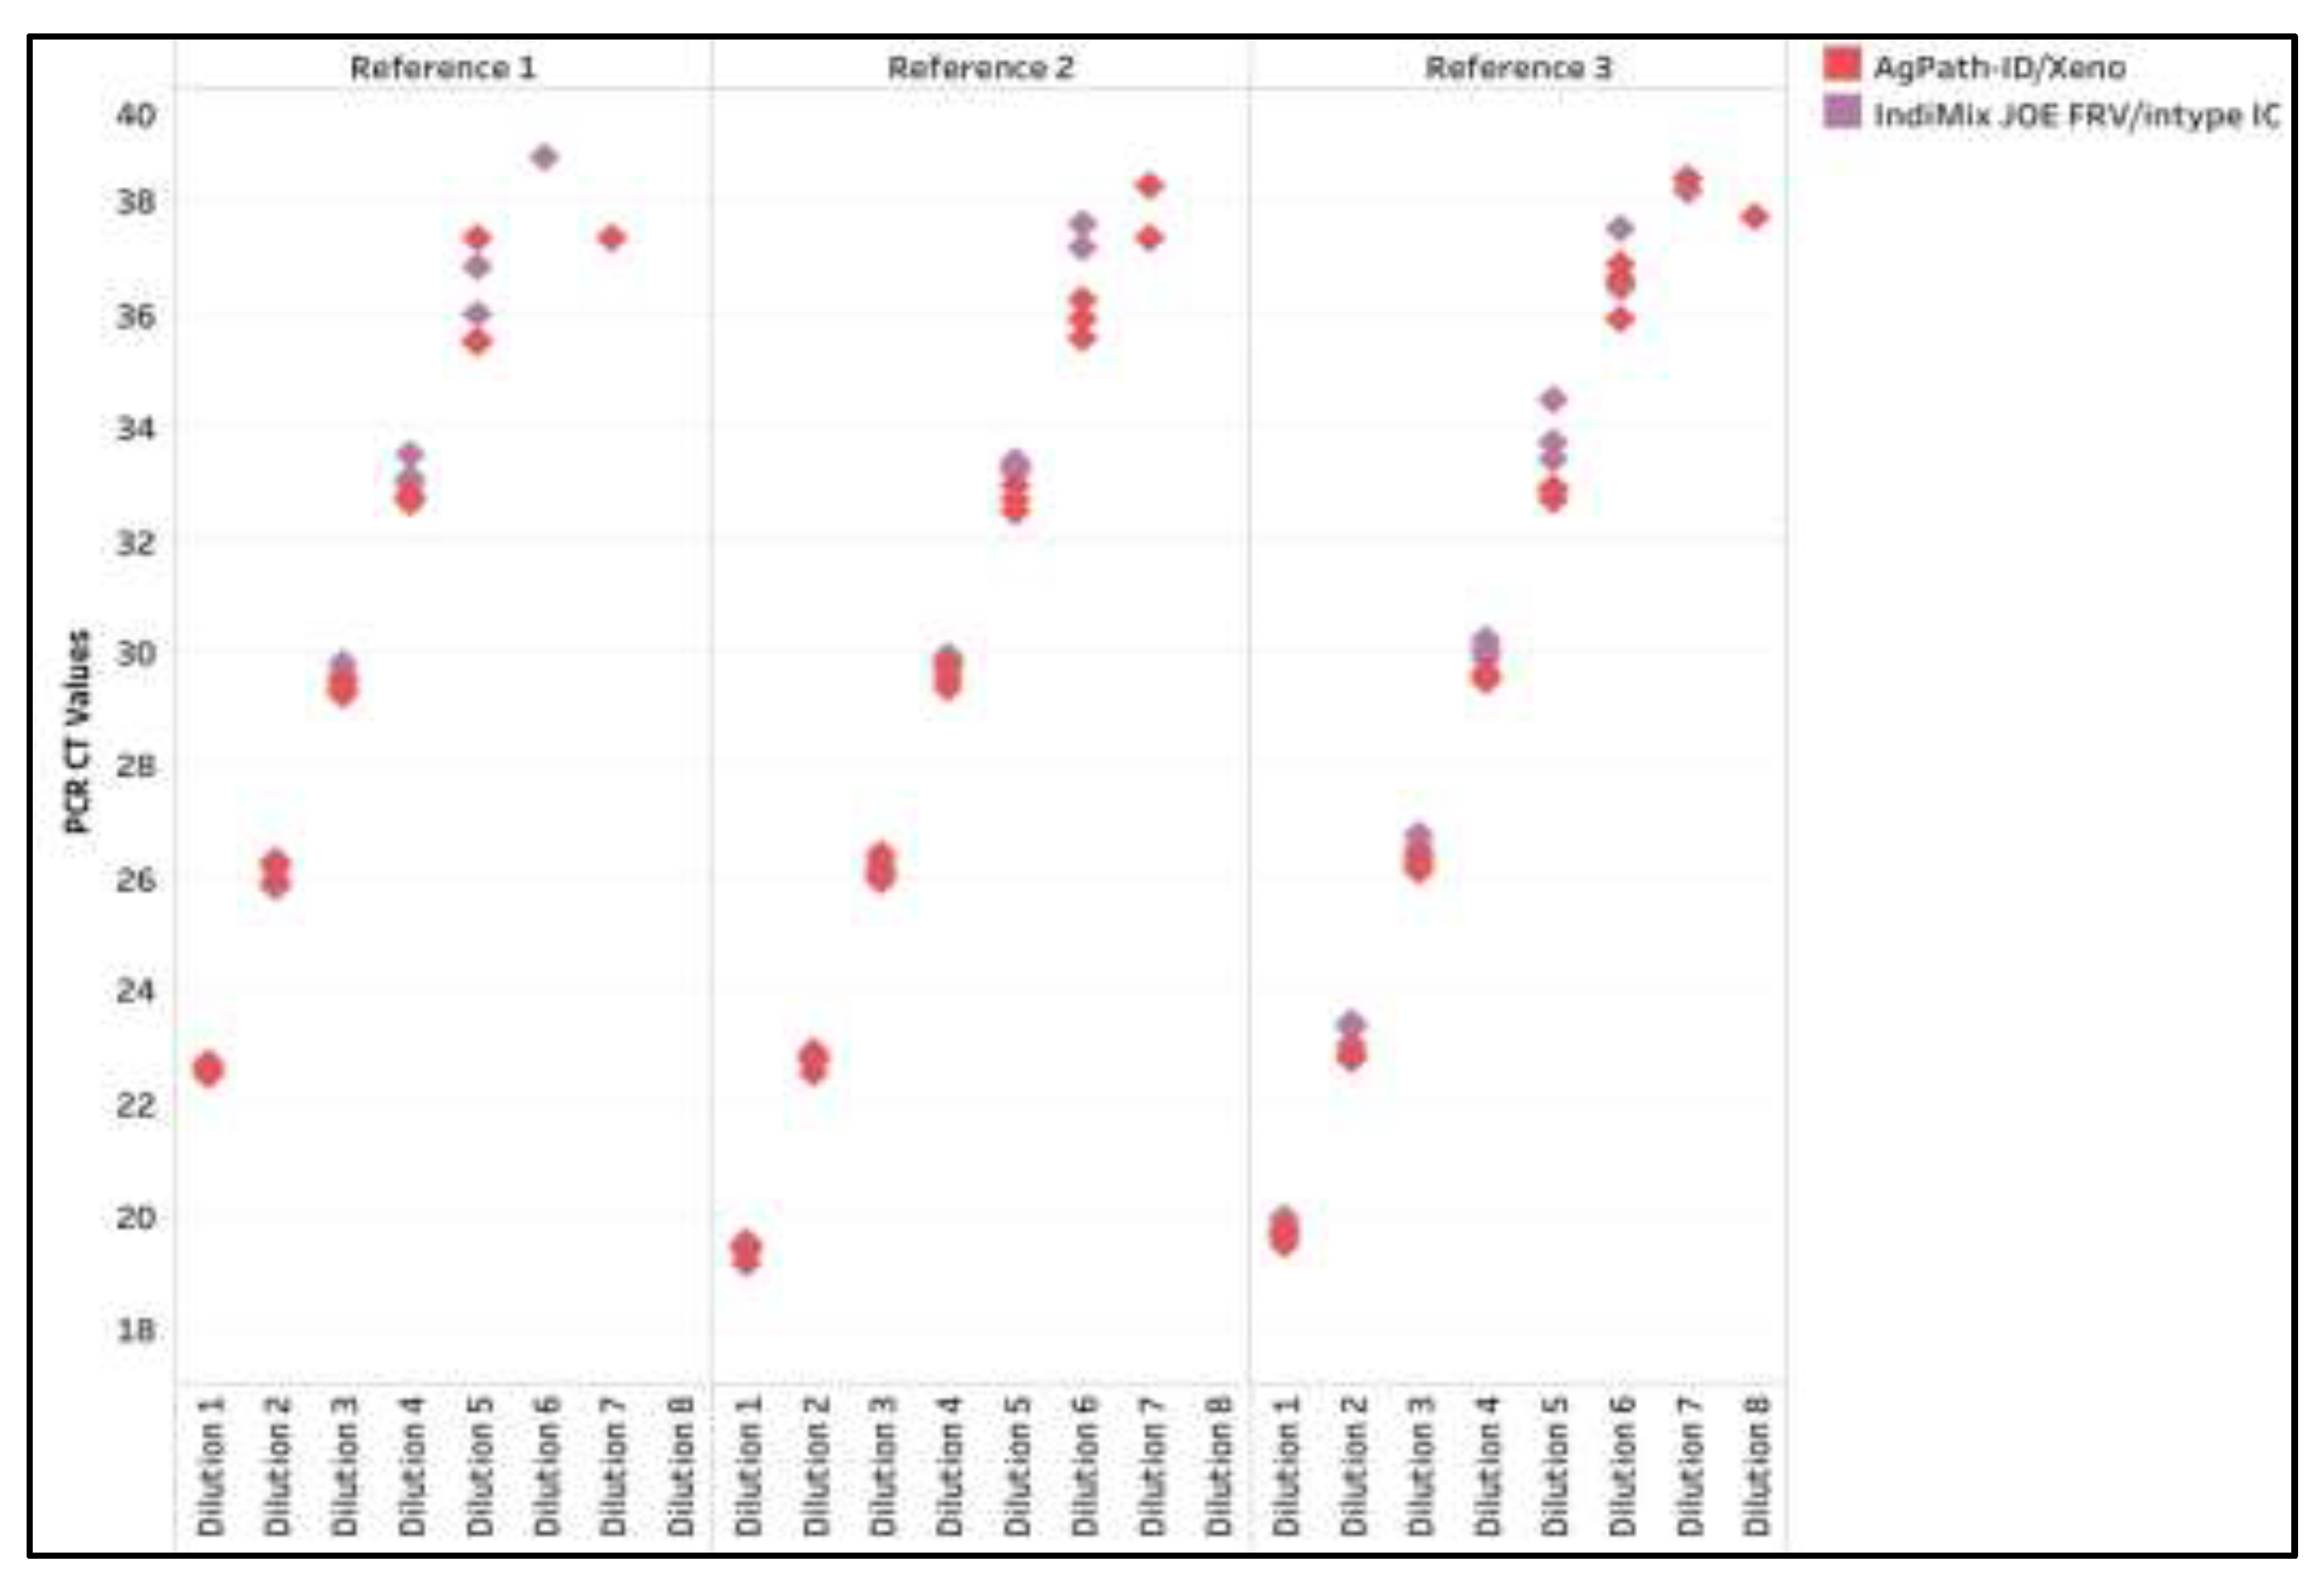
Figure A4.
The influenza A virus (IAV) CT values across dilutions of three reference strains for AgPath-ID/Xeno and the IndiMix JOE fast, reduced volume (FRV) with intype IC in semen samples.
Figure A4.
The influenza A virus (IAV) CT values across dilutions of three reference strains for AgPath-ID/Xeno and the IndiMix JOE fast, reduced volume (FRV) with intype IC in semen samples.
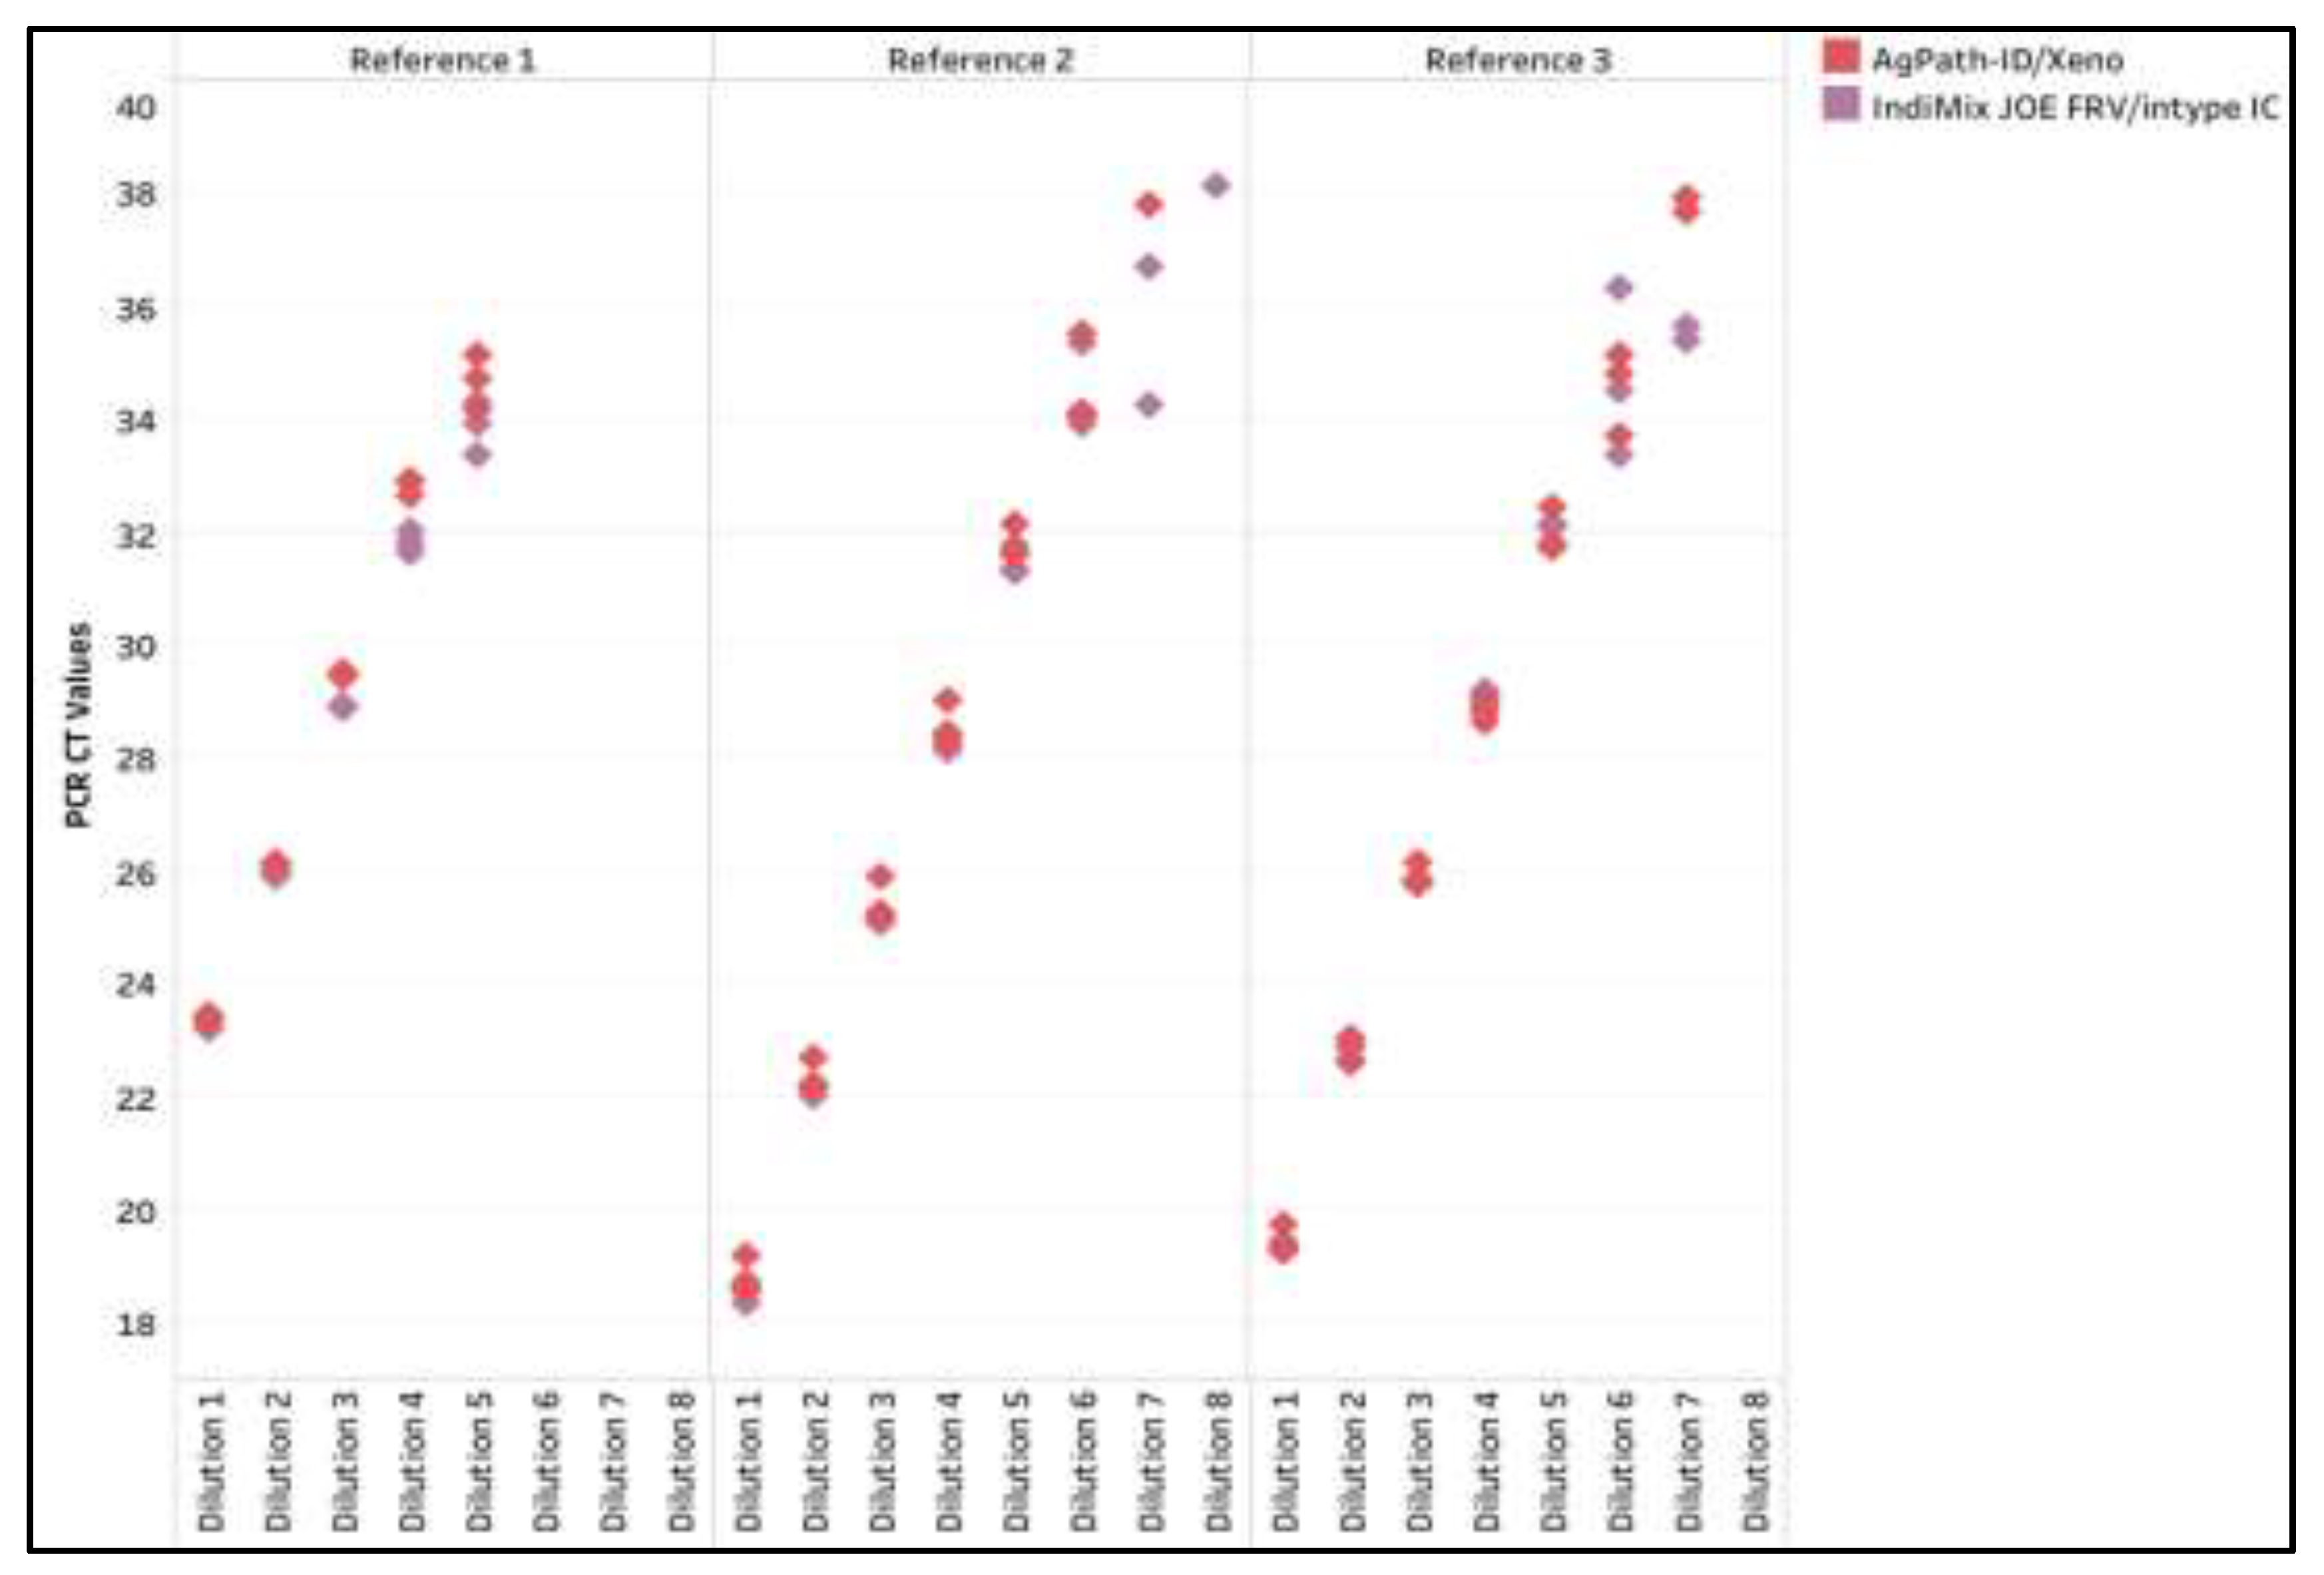
Figure A5.
The influenza A virus (IAV) CT values in AgPath-ID and IndiMix JOE for avian, milk, and semen positive samples. The mean CT value is illustrated with the gray shaded area representing the lower and upper 95% confidence interval.
Figure A5.
The influenza A virus (IAV) CT values in AgPath-ID and IndiMix JOE for avian, milk, and semen positive samples. The mean CT value is illustrated with the gray shaded area representing the lower and upper 95% confidence interval.
References
- U.S. DEPARTMENT OF AGRICULTURE. Confirmations of Highly Pathogenic Avian Influenza in Commercial and Backyard Flocks. Confirmations of Highly Pathogenic Avian Influenza in Commercial and Backyard Flocks. Available online: www.aphis.usda.gov/livestock-poultry-disease/avian/avian-influenza/hpai-detections/commercial-backyard-flocks (accessed on 21 February 2026).
- Bruno, A; de Mora, D; Olmedo, M; Garcés, J; Marzal, A; Garcia-Bereguiain, MA. Highly pathogenic avian influenza A (H5N1) virus outbreaks in South America in 2022–2024: a comprehensive review of an ongoing panzootic. Virology 2025, 610, 110602. [Google Scholar] [CrossRef]
- Pan American Health Organization; World Health Organization. Epidemiological Update Avian Influenza A(H5N1) in the Americas Region. 24 January 2025. Available online: https://www.paho.org/sites/default/files/2025-11/2025-nov-24-phe-avian-influenza-updateenfinal.pdf (accessed on 8 February 2026).
- Sánchez-Rodríguez, F; Diaz-Gavidia, C; Ruíz, S; Jimenez Bluhm, P. Highly pathogenic avian influenza (HPAI) in South America, 2022-2025: temporality, affected species, and the southwards expansion to the Antarctic region. bioRxiv. [CrossRef]
- CDC. H5N1 Bird Flu: Current Situation. Avian Influenza (Bird Flu). Available online: www.cdc.gov/bird-flu/situation-summary/index.html (accessed on 27 February 2025).
- Tipih, T; Mariappan, V; Yinda, KC; et al. Highly pathogenic avian influenza H5N1 clade 2.3.4.4b genotype B3.13 is highly virulent for mice, rapidly causing acute pulmonary and neurologic disease. Nat Commun. 2025, 16(1), 5738. [Google Scholar] [CrossRef]
- U.S. DEPARTMENT OF AGRICULTURE. Detections of Highly Pathogenic Avian Influenza in Mammals. Detections of Highly Pathogenic Avian Influenza in Mammals. Available online: https://www.aphis.usda.gov/livestock-poultry-disease/avian/avian-influenza/hpai-detections/mammals (accessed on 21 February 2026).
- Elsmo, EJ; Wünschmann, A; Beckmen, KB; et al. Highly Pathogenic Avian Influenza A(H5N1) Virus Clade 2.3.4.4b Infections in Wild Terrestrial Mammals, United States, 2022. Emerg Infect Dis. 2023, 29(12). [Google Scholar] [CrossRef]
- Sanchez-Rojas, IC; Bonilla-Aldana, DK; Solarte-Jimenez, CL; Bonilla-Aldana, JL; Acosta-España, JD; Rodriguez-Morales, AJ. Highly Pathogenic Avian Influenza (H5N1) Clade 2.3.4.4b in Cattle: A Rising One Health Concern. Animals 2025, 15(13), 1963. [Google Scholar] [CrossRef]
- Baker, AL; Arruda, B; Palmer, MV; et al. Dairy cows inoculated with highly pathogenic avian influenza virus H5N1. Nature 2025, 637(8047), 913–920. [Google Scholar] [CrossRef] [PubMed]
- U.S. DEPARTMENT OF AGRICULTURE. HPAI Confirmed Cases in Livestock. HPAI Confirmed Cases in Livestock. Available online: https://www.aphis.usda.gov/livestock-poultry-disease/avian/avian-influenza/hpai-detections/hpai-confirmed-cases-livestock (accessed on 21 February 2026).
- Animal and Plant Health Inspection Service; U.S. DEPARTMENT OF AGRICULTURE. The Occurrence of Another Highly Pathogenic Avian Influenza (HPAI) Spillover from Wild Birds into Dairy Cattle. Available online: https://www.aphis.usda.gov/sites/default/files/dairy-cattle-hpai-tech-brief.pdf (accessed on 8 February 2026).
- American Veterinary Medical Association. Avian influenza virus type A (H5N1) in U.S. dairy cattle. Available online: https://www.avma.org/resources-tools/animal-health-and-welfare/animal-health/avian-influenza/avian-influenza-virus-type-h5n1-us-dairy-cattle (accessed on 21 February 2026).
- Wageningen University and Research. First case of avian influenza antibodies in cow in Europe. First case of avian influenza antibodies in cow in Europe. Available online: www.wur.nl/en/news/first-case-avian-influenza-antibodies-cow-europe (accessed on 21 February 2026).
- Vijf koeien met antistoffen tegen vogelgriep in Noardeast-Fryslân. NOS. 29 January 2026. Available online: https://nos.nl/regio/friesland/artikel/720638-vijf-koeien-met-antistoffen-tegen-vogelgriep-in-noardeast-fryslan (accessed on 21 February 2026).
- Beacon. Herd screening identifies four additional dairy cows with HPAI (H5N1) antibodies in Northeast Friesland, Netherlands. Herd screening identifies four additional dairy cows with HPAI (H5N1) antibodies in Northeast Friesland, Netherlands. 31 January 2026. Available online: https://beaconbio.org/en/report/?reportid=77e03415-7b8f-4018-9542-9a4a4505011c&eventid=1ec4fefc-93d8-4f33-ad46-619bcee7ba3b (accessed on 21 February 2026).
- Lim, A; Poulsen, K; Caserta, LC; et al. Unexpected Detection of Highly Pathogenic Avian Influenza (HPAI) H5N1 virus in bovine semen from a bull used for natural breeding on an affected dairy farm. bioRxiv 2025, 2025.10.16.682947. [CrossRef]
- Zimmerman, A; Vandenburg-Carroll, A; Marthaler, DG; Lim, A. Optimizing Nucleic Acid Extraction from Extended Bovine Semen for Endemic and High-Consequence Pathogens. Animals 2025, 15(23), 3411. [Google Scholar] [CrossRef] [PubMed]
- Yan, L; Toohey-Kurth, KL; Crossley, BM; et al. Inhibition monitoring in veterinary molecular testing. J Vet Diagn Invest. 2020, 32(6), 758–766. [Google Scholar] [CrossRef] [PubMed]
- Faber, KL; Person, EC; Hudlow, WR. PCR inhibitor removal using the NucleoSpin® DNA Clean-Up XS kit. In Genetics; Forensic Science International, 2013; Volume 7, 1, pp. 209–213. [Google Scholar] [CrossRef]
- Schrader, C; Schielke, A; Ellerbroek, L; Johne, R. PCR inhibitors – occurrence, properties and removal. Journal of Applied Microbiology 2012, 113(5), 1014–1026. [Google Scholar] [CrossRef] [PubMed]
- Krueger, K; Main, R; Zimmerman, J. ASF and CSF Negative Cohort Study - Partnering to Expand Testing Capacities, Support Further Evaluation and Validation of Four Commercially Available ASF and CSF PCR Assays, and Enhance Preparedness Across the NAHLN. Proceeding presented at: NAHLN Farm Bill Showcase- 2021 NAHLN Farm Bill (FY22) Funded Projects; November 9, 2023; Virtual. Available online: www.aphis.usda.gov/sites/default/files/farm-bill-showcase-proceedings-2021.pdf (accessed on 21 February 2026).
- Vandenburg-Carroll, A; Marthaler, DG; Lim, A. Enhancing Diagnostic Resilience: Evaluation of Extraction Platforms and IndiMag Pathogen Kits for Rapid Animal Disease Detection. Microbiology Research 2025, 16(4), 80. [Google Scholar] [CrossRef]
- National Animal Health Laboratory Network. Standard operating procedure for Real-time RT-PCR Detection of Influenza A and Avian Paramyxovirus Type-1. (NVSL-SOP-0068). Available online: https://www.aphis.usda.gov/media/document/15399/file (accessed on 8 February 2026).
- Xu, Z; Elomri, A; Kerbache, L; El Omri, A. Impacts of COVID-19 on Global Supply Chains: Facts and Perspectives. IEEE Eng Manag Rev. 2020, 48(3), 153–166. [Google Scholar] [CrossRef]
- World Organisation of animal Health. Manual of Diagnostic Tests and Vaccines for Terrestrial Animals, thirteenth edition 2024. Manual of Diagnostic Tests and Vaccines for Terrestrial Animals, thirteenth edition 2024. Available online: https://www.woah.org/fileadmin/Home/eng/Health_standards/tahm/A_summry.htm (accessed on 28 February 2026).
- Bustin, SA; Benes, V; Garson, JA; et al. The MIQE Guidelines: Minimum Information for Publication of Quantitative Real-Time PCR Experiments. Clinical Chemistry 2009, 55(4), 611–622. [Google Scholar] [CrossRef] [PubMed]
Figure 1.
Precision of the high and low concentrations of influenza A virus (IAV) and intype IC for avian samples. The mean CT value is illustrated with the gray shaded area representing the lower and upper 95% confidence interval. .
Figure 1.
Precision of the high and low concentrations of influenza A virus (IAV) and intype IC for avian samples. The mean CT value is illustrated with the gray shaded area representing the lower and upper 95% confidence interval. .
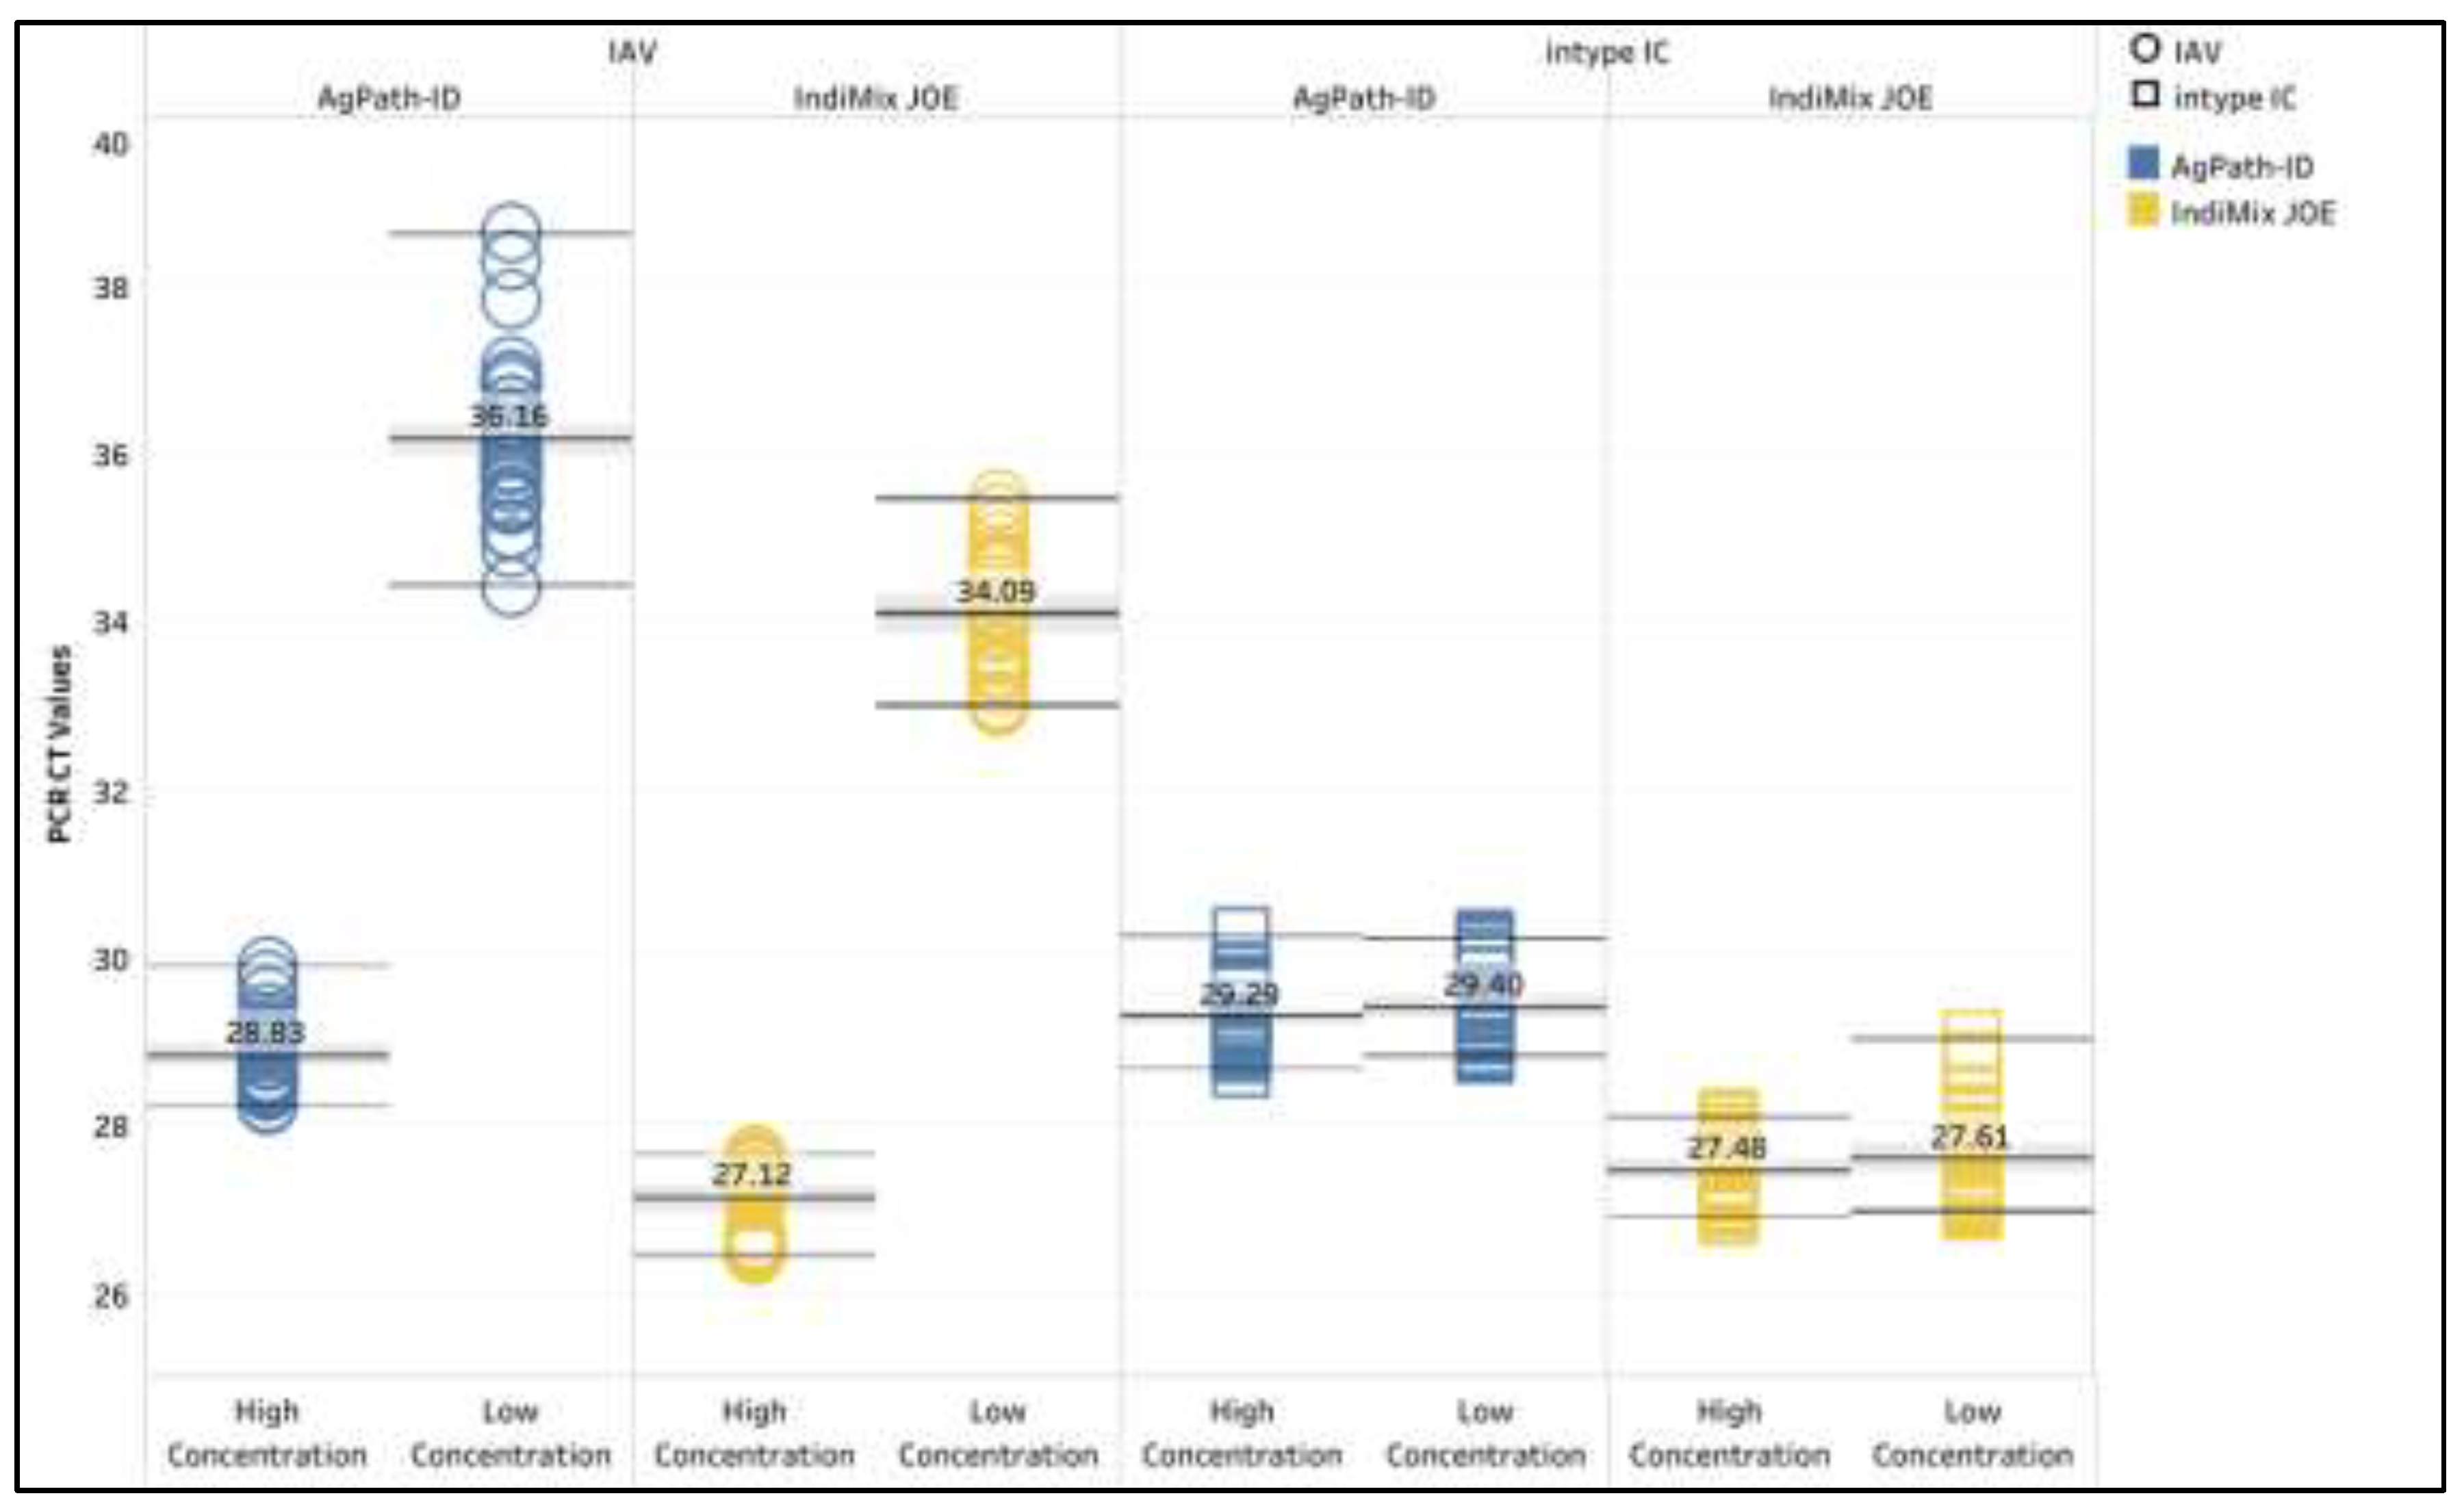
Figure 2.
The Influenza A virus CT variation across dilutions of three reference strains for AgPath-ID/without IC, AgPath-ID/intype IC, IndiMix JOE FRV/intype IC, IndiMix JOE FRV/Xeno (LIZ), and IndiMix TAMRA FRV/Xeno compared to AgPath-ID/Xeno as the gold standard in milk. Negative variances indicate better performance (lower CT), while positive variances indicate higher mean CT compared to the gold standard.
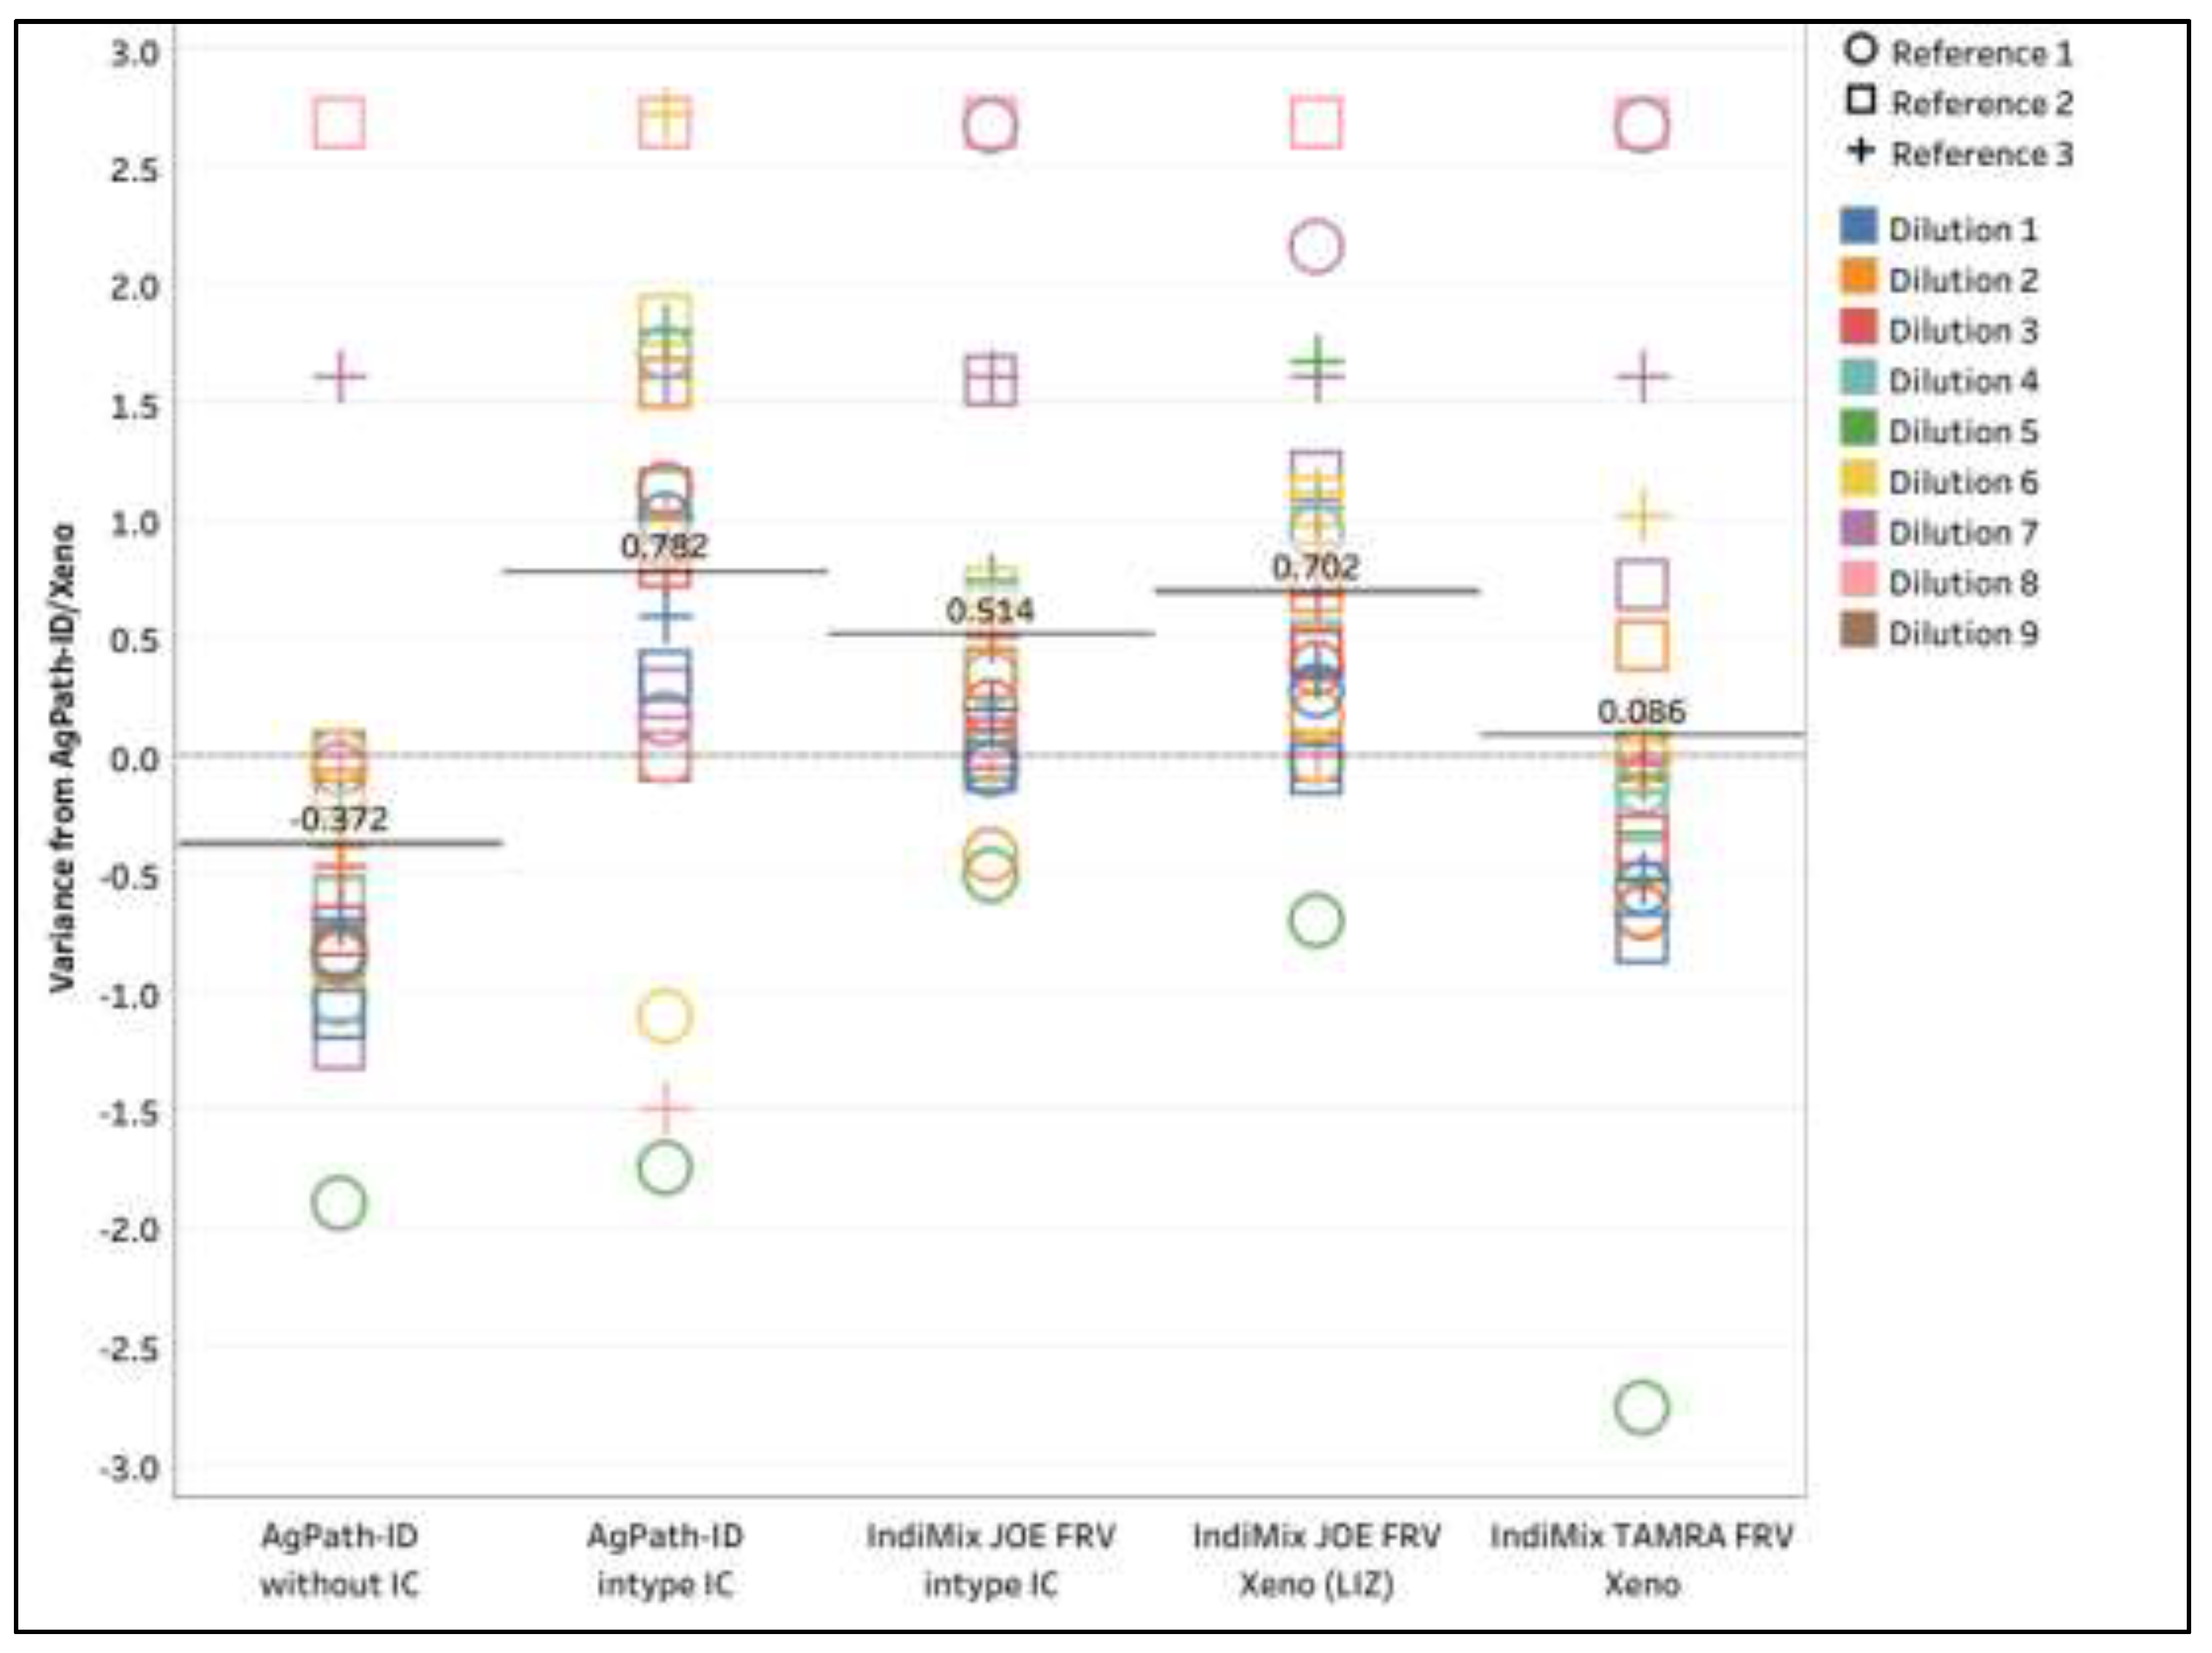
Figure 3.
The intype IC and Xeno CT values in AgPath-ID and IndiMix JOE assays for avian, milk, and semen samples from the limit of detection section. The mean CT value is illustrated with the gray shaded area representing the lower and upper 95% confidence interval.
Figure 3.
The intype IC and Xeno CT values in AgPath-ID and IndiMix JOE assays for avian, milk, and semen samples from the limit of detection section. The mean CT value is illustrated with the gray shaded area representing the lower and upper 95% confidence interval.
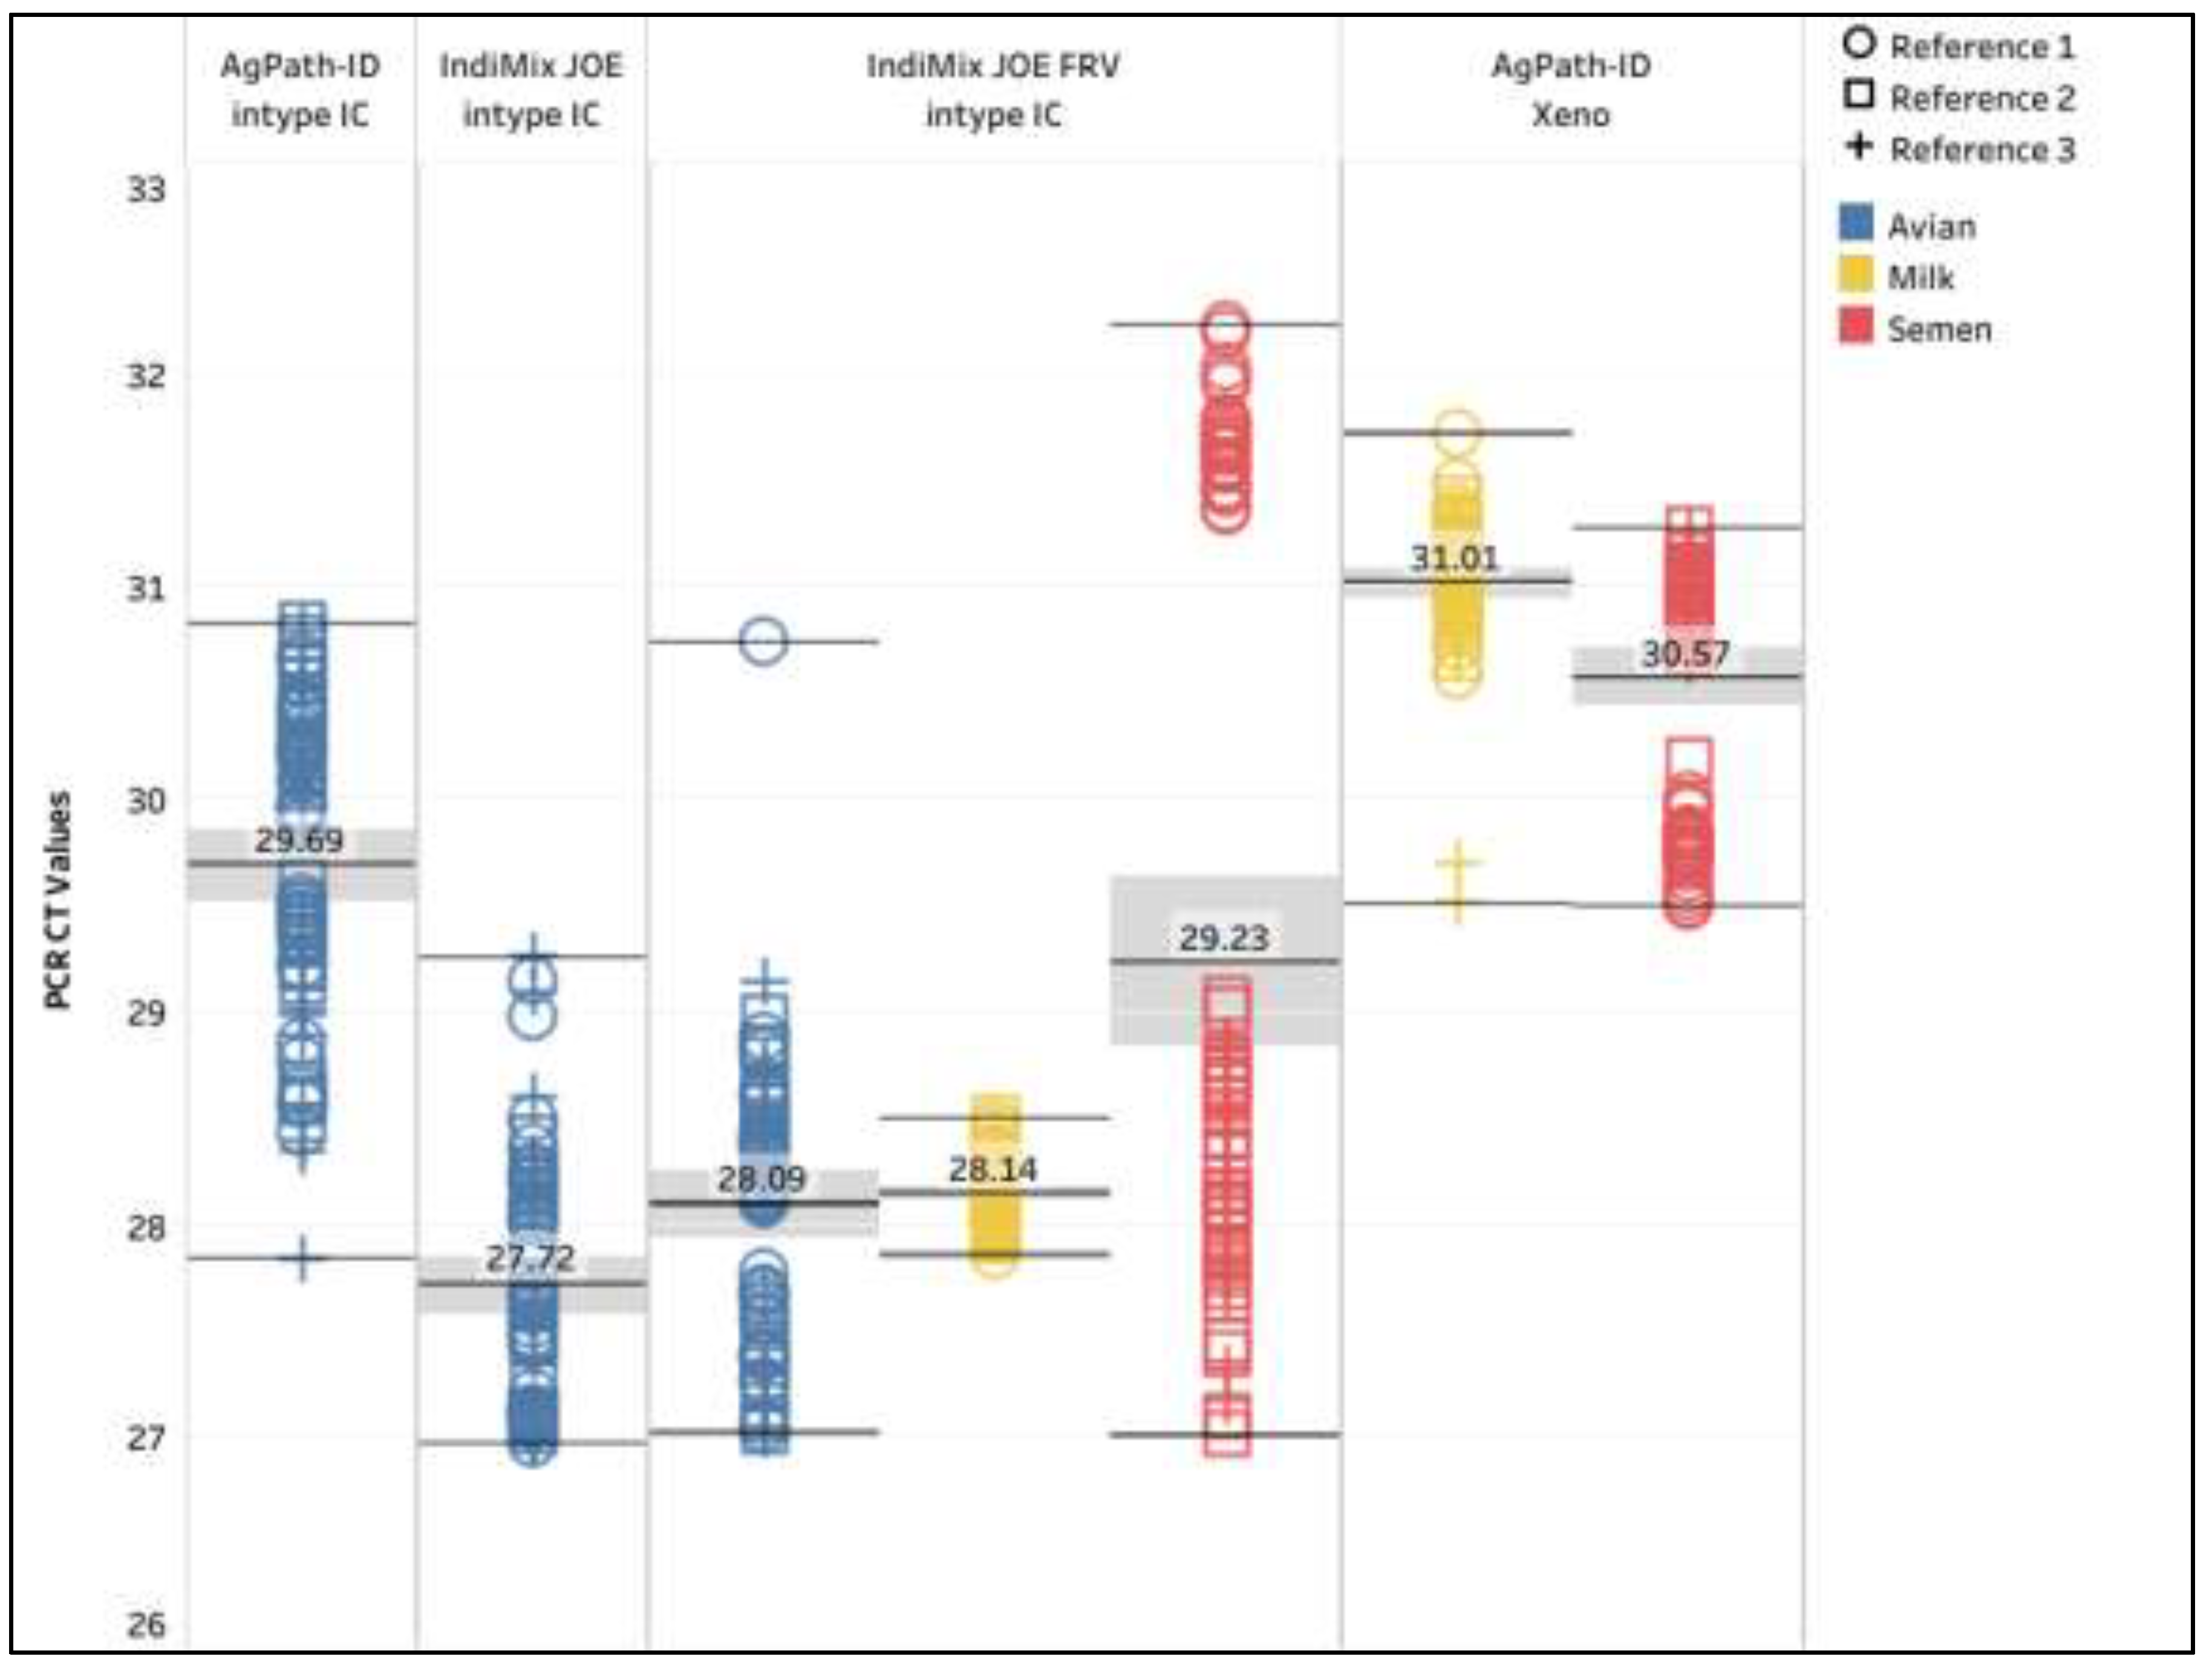
Figure 4.
The intype IC and Xeno CT values in AgPath-ID and IndiMix JOE for avian, milk, and semen samples from the diagnostic sensitivity and specificity section. The mean CT value is illustrated with the gray shaded area representing the lower and upper 95% confidence interval.
Figure 4.
The intype IC and Xeno CT values in AgPath-ID and IndiMix JOE for avian, milk, and semen samples from the diagnostic sensitivity and specificity section. The mean CT value is illustrated with the gray shaded area representing the lower and upper 95% confidence interval.
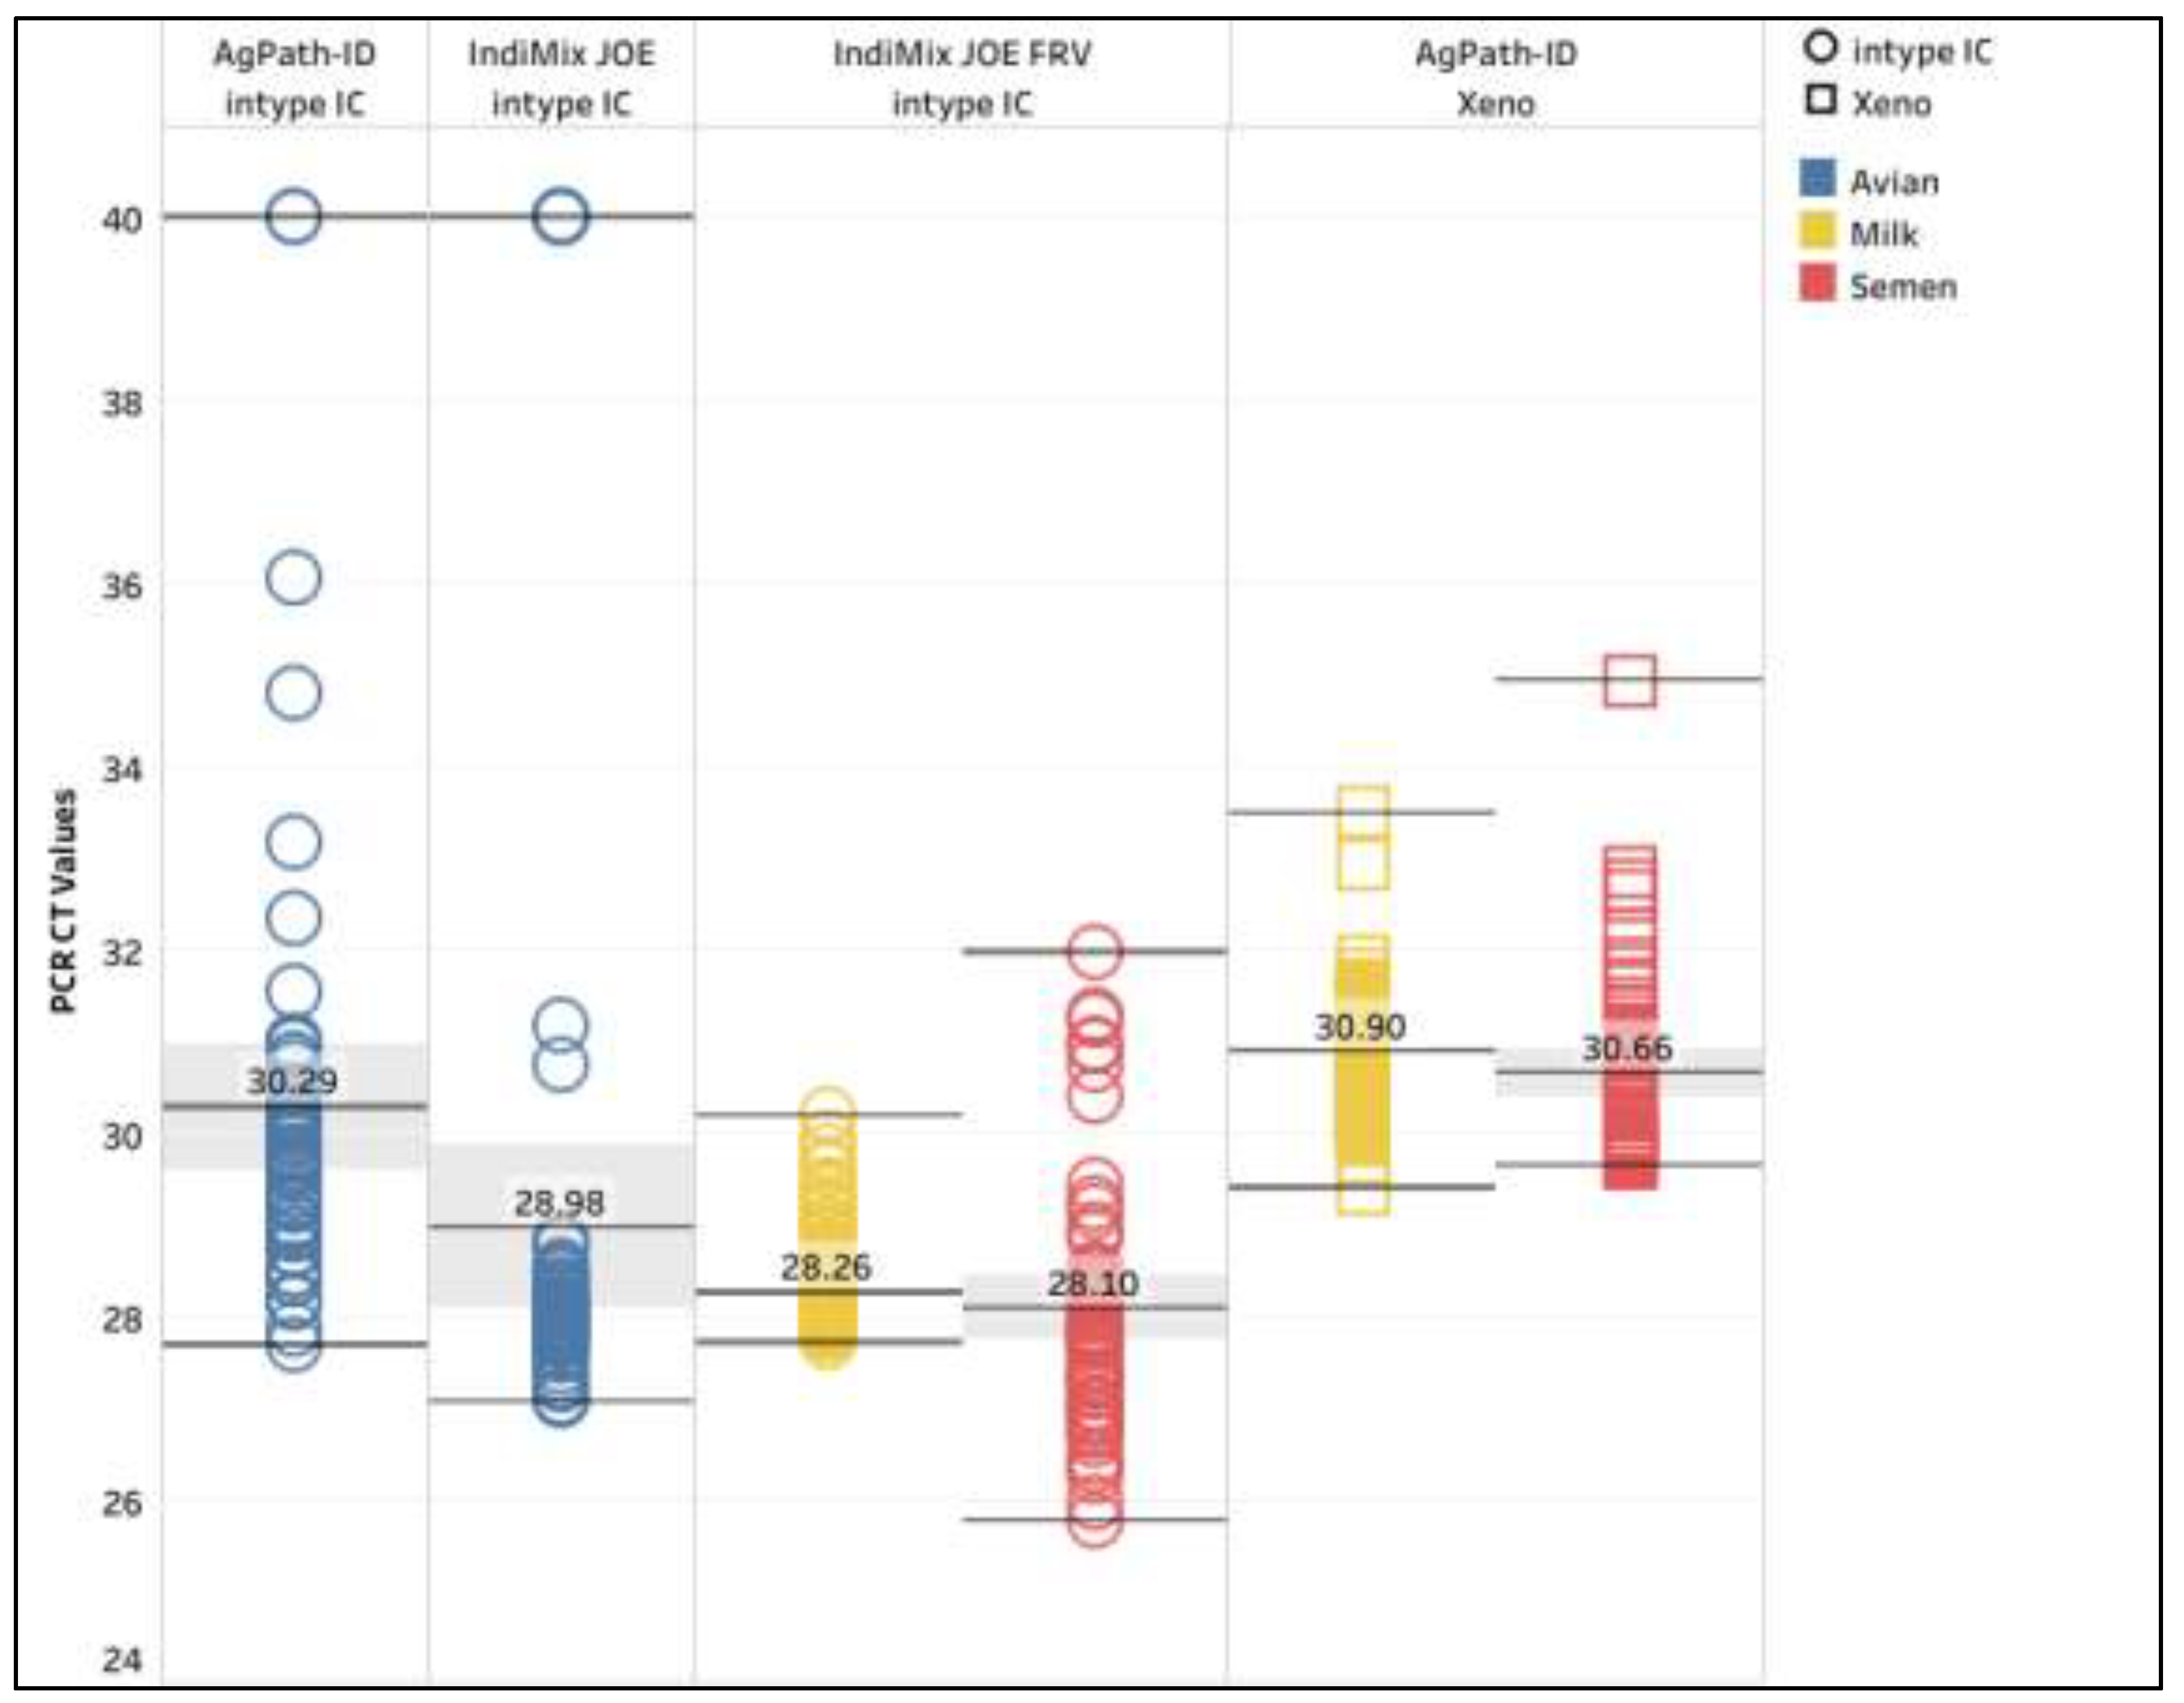
Figure 5.
Inter-run repeatability for avian, milk, and semen samples. The mean variance between replicates is shown with the gray shaded area representing the 95% confidence interval.
Figure 5.
Inter-run repeatability for avian, milk, and semen samples. The mean variance between replicates is shown with the gray shaded area representing the 95% confidence interval.
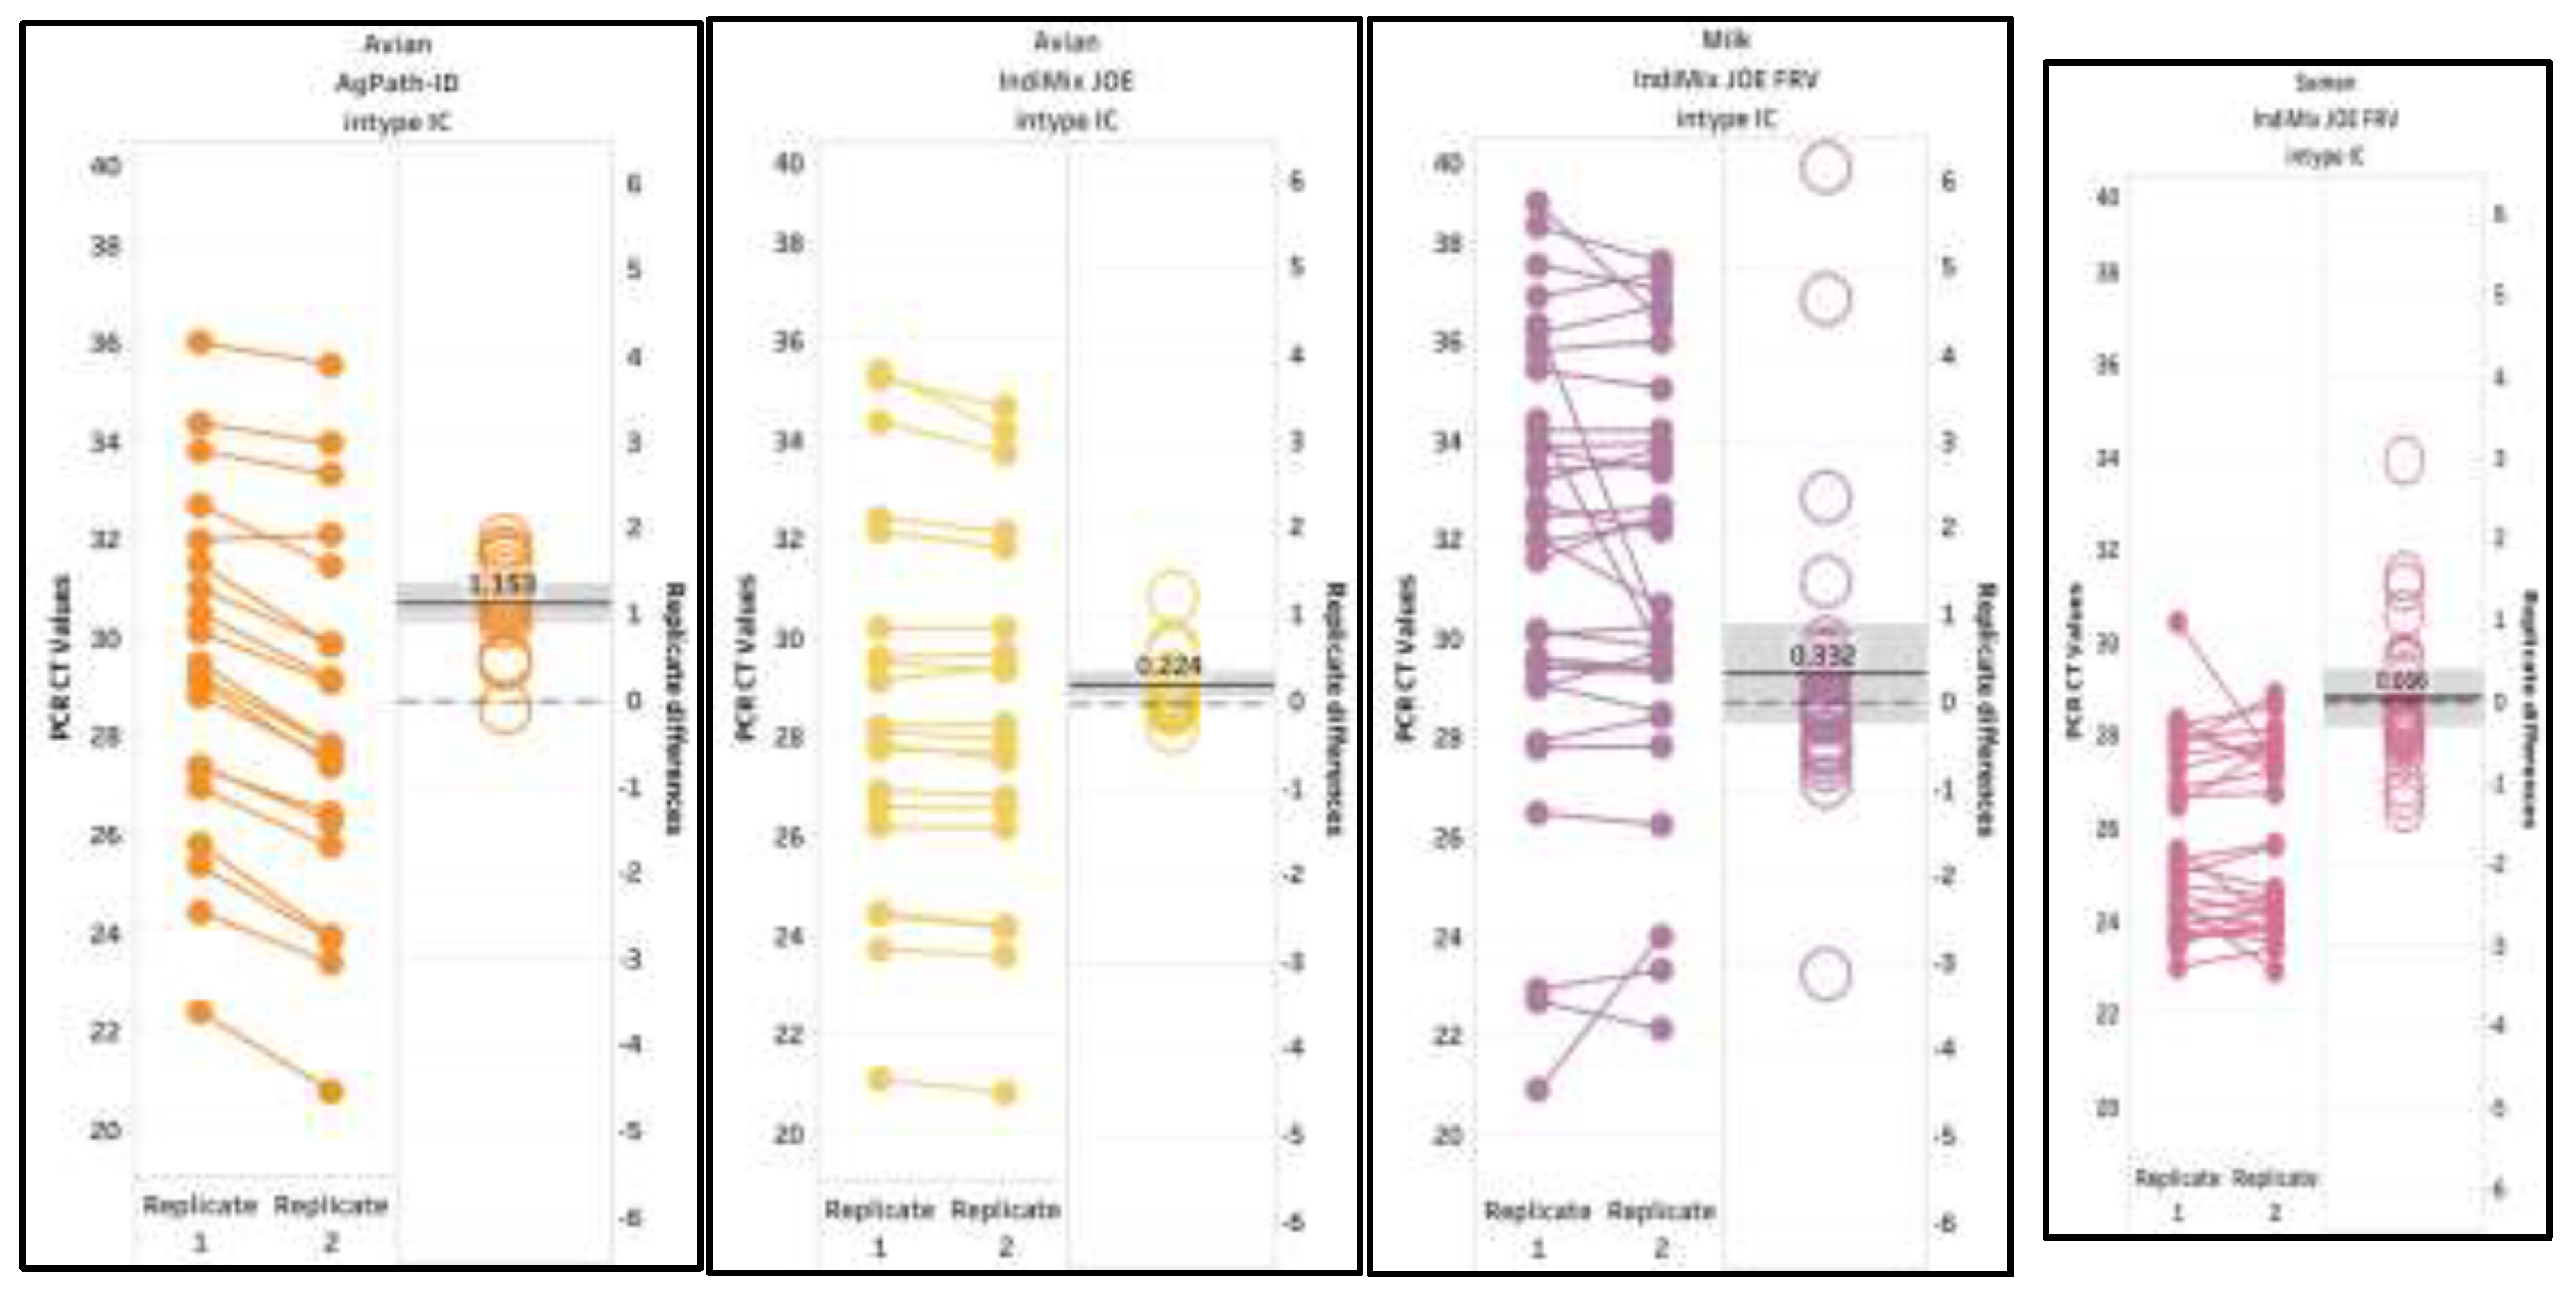
Figure 6.
Interlaboratory comparison of milk samples with AgPath-ID/Xeno and IndiMix JOE FRV/intype IC at the Wisconsin Veterinary Diagnostic Laboratory (WVDL) and the Ohio Department of Agriculture (ODA). The mean CT value is illustrated with the gray shaded area representing the lower and upper 95% confidence interval.
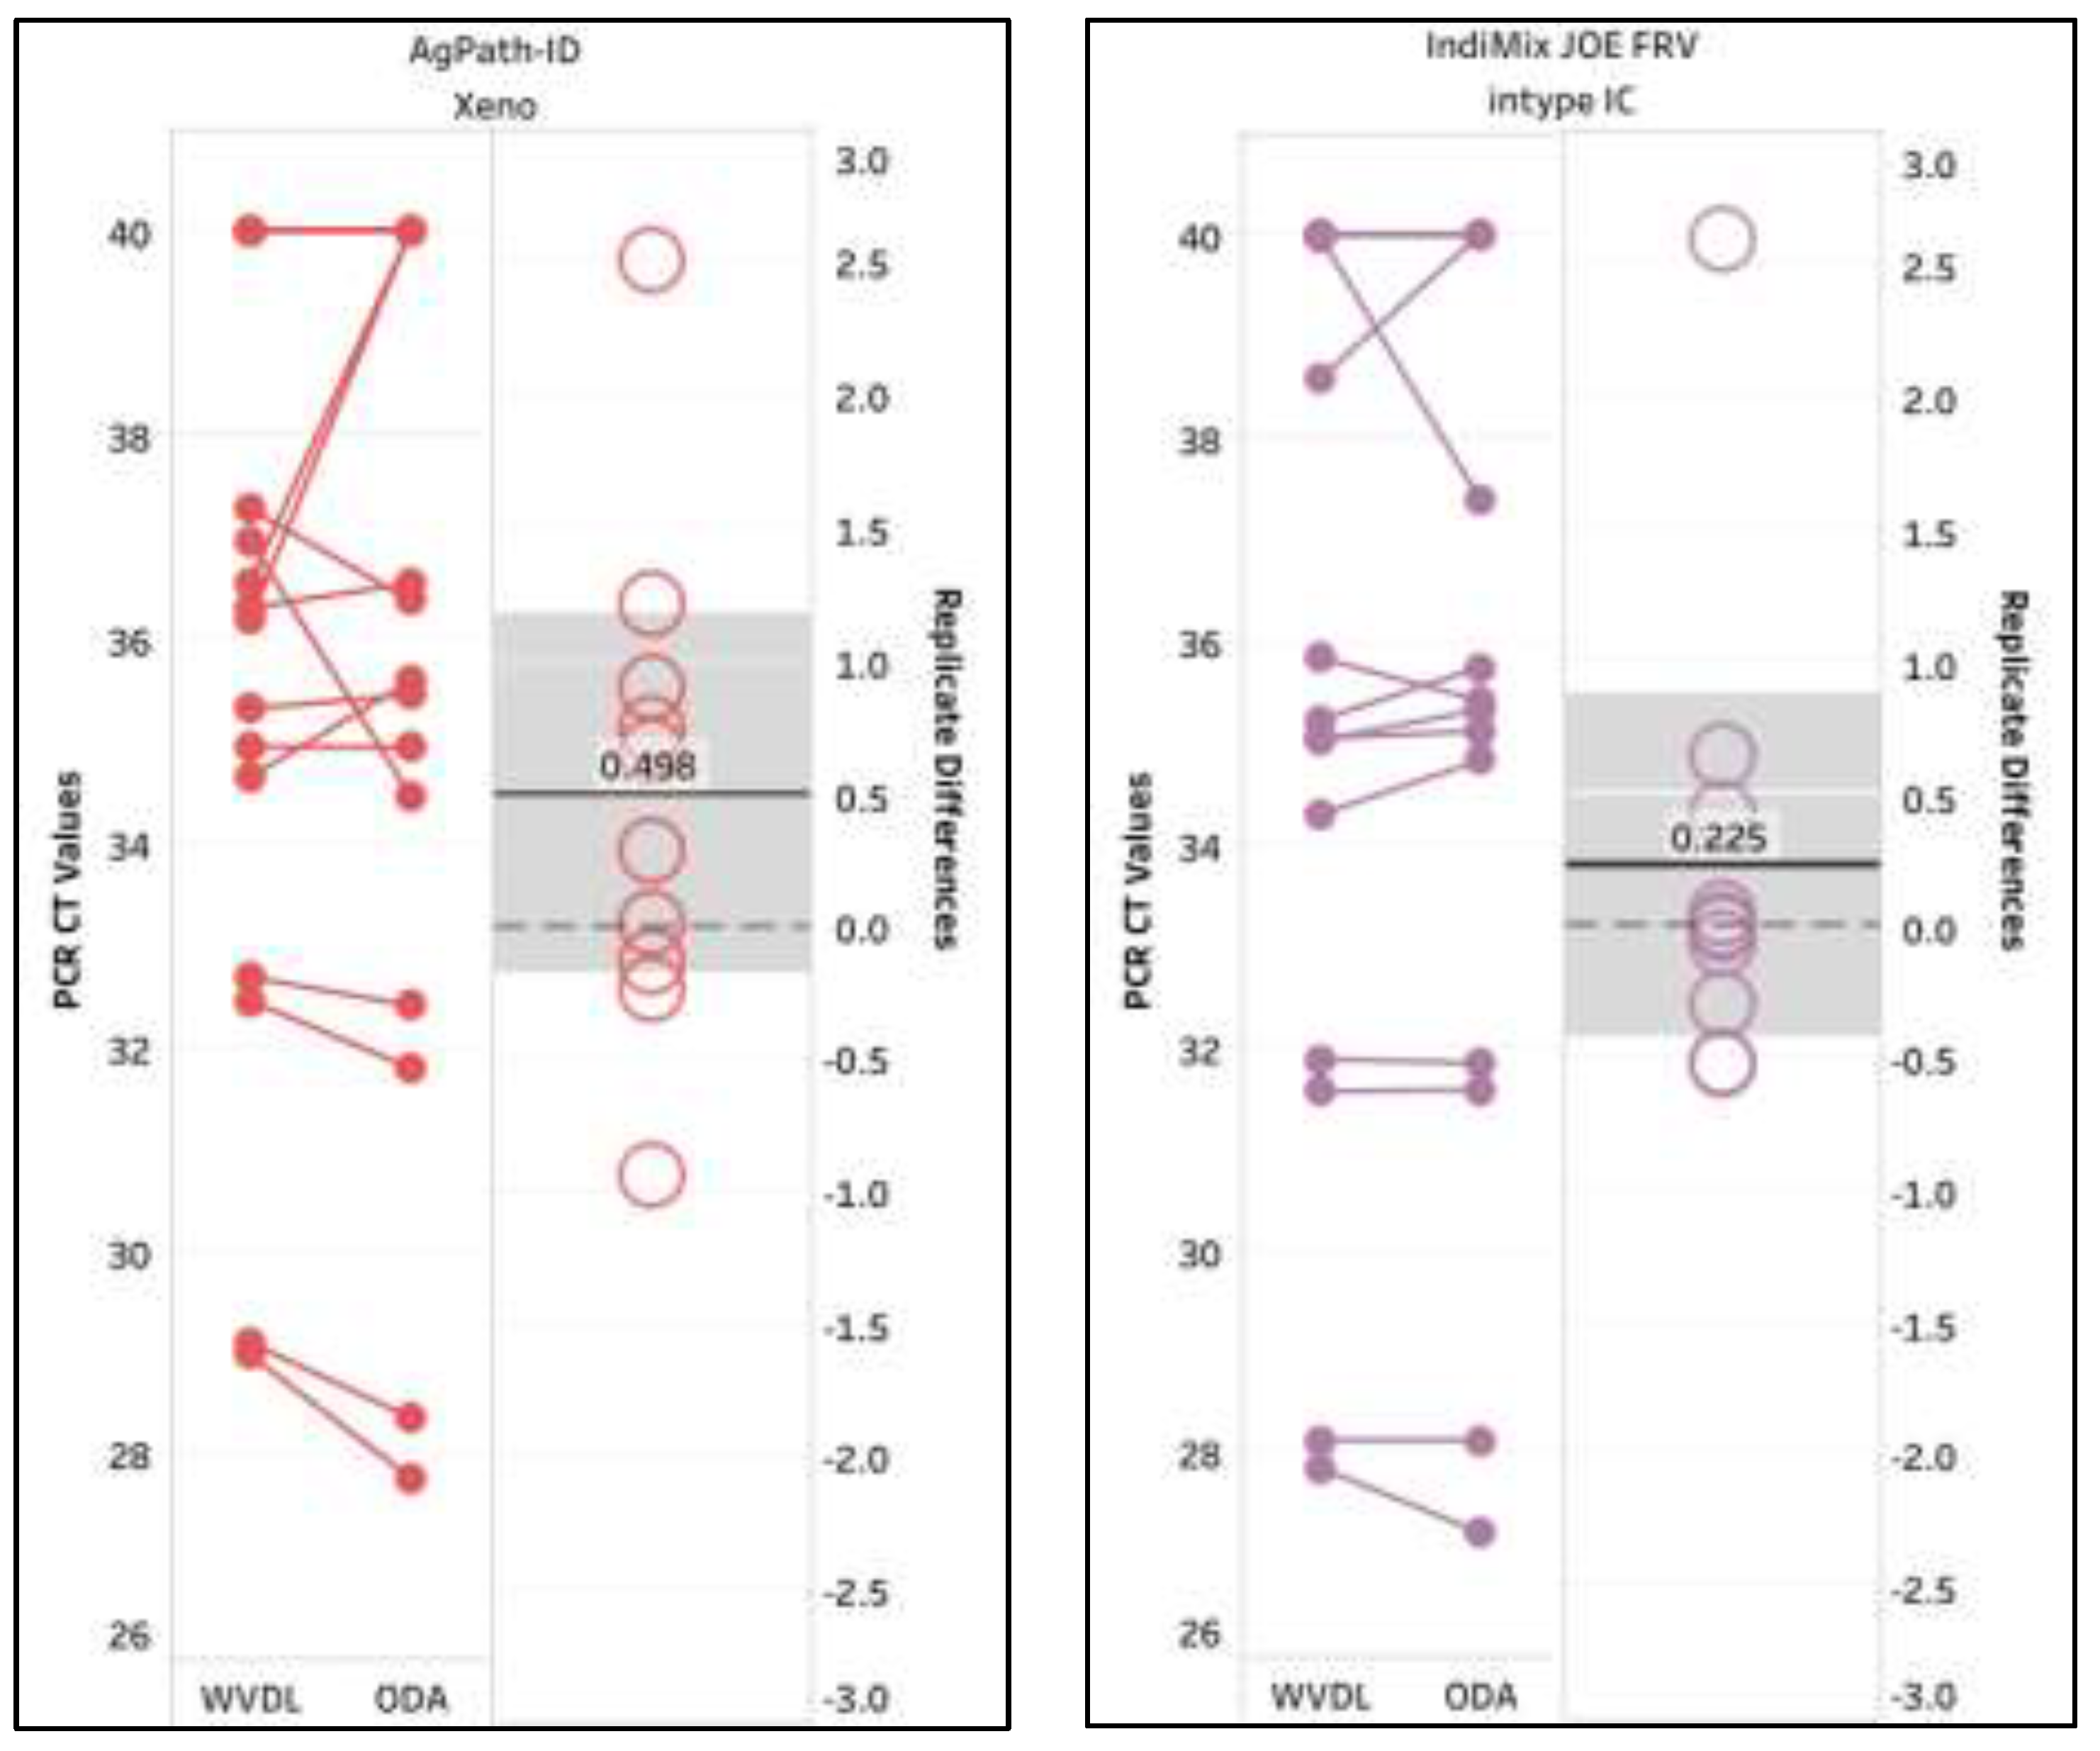

Table 1.
The influenza A virus (IAV) limit of detection, coefficient of correlation of the standard curve (R2), and percent PCR efficiency for AgPath-ID/without IC, AgPath-ID/intype IC, IndiMix JOE/intype IC, and IndiMix JOE fast, reduced volume (FRV)/intype IC in avian samples.
Table 1.
The influenza A virus (IAV) limit of detection, coefficient of correlation of the standard curve (R2), and percent PCR efficiency for AgPath-ID/without IC, AgPath-ID/intype IC, IndiMix JOE/intype IC, and IndiMix JOE fast, reduced volume (FRV)/intype IC in avian samples.
| RT-PCR Chemistry | AgPath-ID | AgPath-ID | IndiMix JOE | IndiMix JOE FRV | |
| Internal Control | without IC | intype IC | intype IC | intype IC | |
| Category | Reference strain | avian | |||
| Limit of Detection (2 of 3) |
1 | 5 | 5 | 5 | 4 |
| 2 | 6 | 5 | 6 | 6 | |
| 3 | 6 | 6 | 6 | 6 | |
| R2 value (range) | 1 | 0.995-0.998 | 0.986-1.000 | 0.993-0.998 | 0.979-1.0000 |
| 2 | 0.993-1.000 | 0.977-0.998 | 0.993-0.998 | 0.998-1.000 | |
| 3 | 0.993-0.998 | 0.992-1.000 | 0.999-1.00 | 0.997-0.999 | |
| Percent PCR Efficiency (range) | 1 | 82.5-93.3 | 80.9-102.1 | 75.6-82.6 | 85.8-96.4 |
| 2 | 93.0-97.6 | 82.7-108.8 | 81.1-92.8 | 90.3-95.8 | |
| 3 | 92.5-96.8 | 80.1-92.2 | 90.9-94.1 | 89.6-99.4 | |
Table 2.
The influenza A virus (IAV) limit of detection, coefficient of correlation of the standard curve (R2), and percent PCR efficiency for AgPath-ID/Xeno as the gold standard, AgPath-ID/without IC, AgPath-ID/intype IC, IndiMix JOE FRV/intype IC, IndiMix JOE FRV/Xeno (LIZ), and IndiMix TAMRA FRV/Xeno in milk.
| RT-PCR Chemistry | AgPath-ID | IndiMix JOE FRV | IndiMix TAMRA FRV | ||||
| Internal Control (IC) | without IC | Xeno | intype IC | intype IC | intype IC & Xeno (LIZ) | intype IC (TAMRA) & Xeno | |
| Category | Reference strain | milk | |||||
| Limit of Detection (2 of 3) |
1 | 5 | 5 | 6 | 5 | 5 | 5 |
| 2 | 7 | 8 | 7 | 7 | 7 | 7 | |
| 3 | 6 | 7 | 6 | 6 | 6 | 6 | |
| R2 value | 1 | 0.999 | 0.994 | 0.977 | 0.999 | 0.992 | 0.990 |
| 2 | 0.998 | 1.000 | 0.990 | 0.999 | 0.998 | 0.999 | |
| 3 | 0.999 | 0.999 | 1.000 | 0.999 | 0.994 | 0.999 | |
| Percent PCR Efficiency | 1 | 99.4 | 90.2 | 124.5 | 100.3 | 133.7 | 99.2 |
| 2 | 106.5 | 105.2 | 110.0 | 95.4 | 115.4 | 94.5 | |
| 3 | 101.2 | 106.2 | 99.2 | 91.2 | 118.0 | 93.0 | |
Table 3.
The influenza A virus (IAV) limit of detection, coefficient of correlation of the standard curve (R2), and percent PCR efficiency for AgPath-ID/Xeno and IndiMix JOE FRV/intype IC in milk and semen.
Table 3.
The influenza A virus (IAV) limit of detection, coefficient of correlation of the standard curve (R2), and percent PCR efficiency for AgPath-ID/Xeno and IndiMix JOE FRV/intype IC in milk and semen.
| RT-PCR Chemistry | AgPath-ID | IndiMix JOE FRV | AgPath-ID | IndiMix JOE FRV | |
| Internal Control | Xeno | intype IC | Xeno | intype IC | |
| Category | Reference strain | milk | semen | ||
| Limit of Detection (2 of 3) |
1 | 5 | 5 | 5 | 5 |
| 2 | 6 | 6 | 6 | 7 | |
| 3 | 6 | 6 | 7 | 7 | |
| R2 value (range) | 1 | 0.994-0.998 | 0.996-0.999 | 0.990-0.997 | 0.995-0.997 |
| 2 | 1.000-1.000 | 0.999-0.999 | 0.998-0.999 | 0.998-0.999 | |
| 3 | 0.998-1.000 | 0.998-0.999 | 0.995-0.999 | 0.997-0.998 | |
| Percent PCR Efficiency (range) | 1 | 90.2-103.5 | 96.5-101.9 | 110.6-118.0 | 116.3-118.9 |
| 2 | 97.9-105.2 | 89.3-95.4 | 98.5-109.0 | 98.5-114.6 | |
| 3 | 95.3-106.2 | 90.2-95.8 | 100.6-120.7 | 100.6-116.9 | |
The R2 values were excellent (>0.99) across the various PCR protocols and the two sample matrices. The variability in the percent PCR efficiencies was higher than expected but highly similar when comparing the two PCR protocols. For milk, the gold standard ranged from 90.2 to 106.2, compared to 89.3 to 101.9 with IndiMix JOE FRV/intype IC. For semen, the gold standard ranged from 98.5 to 120.7 compared to 98.5 to 118.9 with IndiMix JOE FRV/intype IC.
Disclaimer/Publisher’s Note: The statements, opinions and data contained in all publications are solely those of the individual author(s) and contributor(s) and not of MDPI and/or the editor(s). MDPI and/or the editor(s) disclaim responsibility for any injury to people or property resulting from any ideas, methods, instructions or products referred to in the content. |
© 2026 by the authors. Licensee MDPI, Basel, Switzerland. This article is an open access article distributed under the terms and conditions of the Creative Commons Attribution (CC BY) license (http://creativecommons.org/licenses/by/4.0/).
Copyright: This open access article is published under a Creative Commons CC BY 4.0 license, which permit the free download, distribution, and reuse, provided that the author and preprint are cited in any reuse.


