
Submitted:
27 February 2026
Posted:
28 February 2026
You are already at the latest version
Abstract
Introduction: With age and injury, the infiltration of fat in the paraspinal muscles can cause degeneration, disorganizing the structural integrity of the connective tissue, causing lower back pain (LBP). Human umbilical cord tissue allografts (UCTa) have a collagen-rich matrix with various ECM components that can replace damaged connective tissue. The objective of this study is to evaluate preliminary findings on the safety and efficacy of UCTa for the supplementation of degenerated tissue in thoracic and lumbar paraspinal muscles refractory to standard conservative methods. Materials and Methods: A total of 141 patients from an observational repository were identified with paraspinal muscle degeneration. Patients received one to three applications of UCTa, outcomes were tracked using the Numeric Pain Rating Scale, the Western Ontario and McMaster University Arthritis Index, and the Quality-of-Life Scale. Results: All groups showed positive improvement in the NPRS and WOMAC scales. Multi-application groups revealed statistically significant differences in the analyses. No adverse events or complications were reported. Discussion: Limitations included a lack of a control group and the increase of recall and response bias due to using patient-reported measures. Conclusion: This pilot investigation highlights the need for continued research through randomized controlled trials to validate efficacy, establish optimal dosage protocols, and compare UCTa to other conservative interventions.
Keywords:
thoracic paraspinal muscles
; lumbar paraspinal muscles
; paraspinal muscle degeneration
; paraspinal entheses
; umbilical cord tissue
; regenerative medicine
1. Introduction
Lower back pain (LBP) is prevalent across all age groups, and increasing evidence suggests that atrophy of the paraspinal muscles may serve as an underlying source of pain (Wan, 2015; Noonan, 2021; Gu, 2024). This association has gained growing attention in recent years, as degeneration and functional decline of these muscles are increasingly recognized as essential contributors to symptom persistence (Wan, 2015; Huang, 2022; Gu, 2024). These muscles attach to most of the spine, especially the thoracolumbar spine, and are fundamental elements of the spine and the whole body (Noonan, 2021). Significant spinal instability and reduced health can occur when paraspinal muscles are injured through trauma, surgery, fatty infiltration, or repeated facet denervation, subsequently causing postural issues and various low back pain disorders (Noonan, 2021; Garcia, 2025). LBPDs are complex, multifactorial conditions and are the number one cause of disability, affecting populations of all ages, income statuses, and regions (Noonan, 2021; Anstruther, 2024). However, older populations and patients with spine-related factors are at an increased risk of developing LBPDs (Noonan, 2021). While symptoms of back fatigue, stiffness, pain, and weakness may be attributed to nonspecific lower back pain, these symptoms can also indicate paraspinal injury (Anthierens, 2024). The presence of these symptoms may cause individuals to adopt sedentary lifestyles, further deteriorating their spine and overall quality of life. On account of the similarity between low back pain and paraspinal injury symptoms, MRI imaging is recommended to evaluate a patient’s fat content within the paraspinal muscles to identify fatty degeneration/fatty infiltration (Giaccone, 2024; Osti, 2014). High signal intensity in MRI assessments indicates areas of high fatty infiltration, where adipose tissue grows in non-adipose tissues (Zhu, 2024). Fatty infiltration is related to loss of muscle function, impairment of musculature integrity, and disruption of the extracellular matrix, which leads to muscle degeneration and atrophy (Giaccone, 2024; Zhu, 2024; Osti, 2014). Several classifications for the severity of paraspinal muscle degeneration have been proposed. Recent literature commonly uses the Goutallier classification, a five-stage grading scale (Grades 0-4) that utilizes MRI to assess fatty infiltration in muscle (Mandelli, 2021; Kızılgöz, 2023; Ozer, 2024). Grade 0 indicates normal muscle mass with no fatty infiltration; Grade 1 shows a few fatty streaks within the muscle; Grade 2 reflects less than 50% fat infiltration; Grade 3 represents approximately 50% fat infiltration; and Grade 4 denotes more than 50% fat infiltration (Mandelli, 2021; Ozer, 2024). While MRI imaging is preferred, ultrasound may also be utilized to identify muscular degeneration of the thoracic and lumbar paraspinal muscles through the detection of fatty infiltration (Rummens, 2020). Upon confirmation of the diagnosis, paraspinal injury interventions can either be conservative or surgical, depending on the severity.
Standard of care procedures for paraspinal injuries are initially conservative methods. Currently, the primary initial approach for any musculoskeletal disorders is exercise-based physical therapy, including lumbar stabilization exercise programs (LSEP), which is recommended to increase stability and maintain proper posture (Silişteanu, 2024; George, 2021). Other non-invasive modalities include high-frequency ultrasound wave therapy, NSAIDs, or low-level laser therapy (Silişteanu, 2024). However, most non-invasive approaches focus on the symptoms and not the fundamental problem the patient suffers from. Considerations for surgical options regarding spinal muscle injuries are rare and are only offered when over half of the muscle area has been compromised with fat (Ramos, 2015). Surgical interventions are not recommended for muscle repair because of the complications that can arise postoperatively (Gengyu, 2021). Complications regarding muscle repair include severe muscle hematoma, myositis ossificans, and compartmental syndrome (Ramos, 2015). Other invasive methods that do not focus on muscle repair, such as Restorative Neurostimulation (ReActv8), have shown durable results at 3 years, but carry various complications related to device implantation, including infection, migration, and malposition (Gilligan, 2023; Koushik, 2021; Goudman, 2024). Conventional management of paraspinal injuries is typically limited to conservative approaches, and the need for alternative methods that provide effective and long-term improvements is essential in standard patient care for paraspinal injuries.
Recurrence of symptoms following conservative management of paraspinal injuries remains a significant concern for both clinicians and patients, prompting efforts to evaluate more effective and lasting approaches. One alternative non-invasive method to consider is umbilical cord tissue (UCT), an umbilical cord-derived connective tissue with extracellular components to supplement and replace homologous tissues around the body (Gupta, 2020; Main, 2021). UCT primarily comprises glycosaminoglycans, proteoglycans, hyaluronic acid, various growth factors, and collagen types I, II, III, IV, V, VI, XII, and XIV, with type I being the most abundant (Gupta, 2020; Roy, 2022). The utilized allograft adheres to FDA regulations for minimal manipulation, thereby preserving all of the tissue’s biochemical and biophysical attributes in the final allograft. The distinctive biological characteristics of perinatal tissues like UCT, including their anti-inflammatory, anti-fibrotic, anti-microbial, and immune-privileged nature, position them as ideal low-risk transplantable tissue, mainly owing to their diminished immune reactions (Deus, 2020). The collagen fibers in the extracellular matrix of UCT mirror the extracellular matrix of cartilage, dermal tissues, and tendons (Main, 2021). The structural similarities of UCT to the entheses and fascia support its applicability in various musculoskeletal regions. Studies have shown promising results using UCTa in over 180 homologous use sites, including the rotator cuff and the sacroiliac (SI) joint (Lai, 2024; Lai, 2023). Both studies observed statistically significant results, showing improvements in joint function, mobility, quality of life, and pain alleviation (Lai, 2024; Lai, 2023). Current literature lacks published data on the safety and efficacy of umbilical cord tissue for the management of paraspinal muscle injuries. The primary function, structural composition, and components in UCTa are consistent with functional properties relevant to paraspinal muscle tissues. This observational case study aims to evaluate the efficacy of umbilical cord tissue in patients with structural degeneration in the paraspinal muscles.
2. Materials and Methods
Study Design
The data from the observational repository at Regenative Labs was utilized in this study and has been maintained in compliance with the Declaration of Helsinki and approved by the Institutional Review Board of the Institute of Regenerative and Cellular Medicine (IRCM-2022-311) since January 2022. The study design of the repository and methods for UCTa processing are described in detail in other publications derived from the database (Davis, 2022; Lai, 2024). Informed consent was obtained from all patients before any applications were received. Multiple observers at multiple clinical sites were utilized to reduce observer bias. The inclusion criteria for patients in this study included patients with lumbar or thoracic paraspinal degeneration, which was verified via MRI or ultrasound, depending on the provider, who received UCTa applications and had complete initial and follow-up data. Patients were excluded if they were lost to follow-up, if their data were out of time range (± 15 days for 30-day follow-up, ± 30 days for 90-day, 120-day, 150-day, and 180-day follow-ups), had multifaceted defects, or received more than three applications. No exclusions were made based on gender, body mass index (BMI), or age. One hundred forty-one patients met the criteria, and the final group sizes by number of applications for patients with one, two, and three applications are 46, 64, and 31, respectively. Figure 1 displays a flow chart of this study’s design.
Patient Procedures
Procedures were performed using aseptic technique with ultrasound guidance. Patients were instructed to refrain from using anti-inflammatory drugs (NSAIDs) and corticosteroids for a minimum of two weeks before application and to avoid intra-articular corticosteroid injections within 90 days prior to the procedure. Before proceeding, physicians verified correct patient identity, the planned procedure, the proper side and site, patient positioning, the availability of necessary implants, and any additional equipment or procedural requirements. Each clinical site maintained the right to perform its own technique, resulting in slight variation in application protocols. The application site was prepared using sterile technique. Anesthetic selection included either a topical coolant anesthetic or a local anesthetic such as Ropivicane that was either added to the UCTa or administered intramuscularly prior to the UCTa. Using a 23 to 25-gauge 1.5-inch needle, two cc of 150 mg of umbilical cord tissue allograft, ProText™ (Regenative Labs, Pensacola, FL, USA) was applied into the targeted degeneration sites within the paraspinal muscles of the lumbar or thoracic region, identified by ultrasound. Following application, the area was gently mobilized through its full range of motion, and a sterile dressing was placed. Post-procedure, patients were advised to apply ice or heat as needed for discomfort and to avoid strenuous activity for several days. For patients with multiple applications, the timing of subsequent applications was determined at the physician’s discretion within the designated evaluation period. In the double application cohort, the second application was applied anytime from the first week following their initial application to the 90-day visit. Patients in the third application group received their second and third applications between the first week following their initial visit to the 210-day follow-up.
Data Analysis
Patient-reported measures, including the Numeric Pain Rating Scale (NPRS), the Western Ontario and McMaster University Arthritis Index (WOMAC: Pain, Stiffness, Physical Function subscales, and Total), and the Quality of Life Scale (QOLS), assessed outcomes at initial and follow-up visits. Descriptive statistics (mean, minimum, maximum, and standard deviation) were calculated for all scales across all intervals for each application group. Two normality tests (Kolmogorov-Smirnov and Shapiro-Wilk) were performed to identify statistically significant p-values, where p ≤ 0.05 indicated deviation from a normal distribution. Repeated measures ANOVA was performed in each scale to determine whether there were significant differences in mean scores over time. Tukey’s post-hoc test was applied if statistical significance was found to identify specific interval comparisons driving the observed differences.
Between-group effects for dosage were evaluated using a multivariate analysis of variance (MANOVA). Dependent variables included initial measures (e.g., pain [P1], stiffness [S1], physical function [PF1]), final follow-up scores (e.g., pain [FP], stiffness [FS], WOMAC [FW]), and the change in scores was calculated from initial to final visit (e.g., difference in pain [DP], difference in stiffness [DS], difference in physical function [DPF], and overall WOMAC change [DW]). Variables were coded to allow consistent interpretation across categories:
- Initial scores (e.g., P1, S1, PF1): higher values reflected worse initial symptoms
- Final scores (e.g., FP, FS, FW): higher values reflected worse outcomes at the last visit
- Change scores (e.g., DP, DS, DPF, DW): calculated as Final – Initial, such that more negative values reflected greater improvement, whereas values closer to zero indicated less improvement. Only positive DQ scores represented greater improvement.
Pairwise comparisons were performed using a Bonferroni adjustment to control for multiple testing. Interpretation of mean differences (I-J) followed variable coding: (1) for change scores, negative values indicated greater improvement in Group I compared with Group J (except for DQ, which positive values indicated greater improvement in Group I compared with Group J); (2) for final scores, negative values indicated better outcomes in Group I compared with Group J; and (3) for initial scores, positive values indicated worse initial symptoms in Group I compared with Group J.
To evaluate dosage-dependent differences in application responses, an inferential outcome range analysis was conducted using the change scores (Δ-values) for all WOMAC scales, including pain (DP), stiffness (DS), physical function (DPF), and total WOMAC (DW). Change scores were calculated as the difference between final and initial visits, where more negative values indicated greater clinical improvement. For each dosage group (one, two, and three applications), descriptive outcome ranges (minimum, maximum, median, and interquartile range) were calculated to quantify the distributional pattern of improvement. To test whether these outcome ranges differed across dosage groups, a one-way multivariate analysis of variance (MANOVA) was conducted using the four WOMAC Δ-measures as dependent variables and dosage as the fixed factor. Follow-up Bonferroni-adjusted pairwise comparisons were used to determine which groups differed significantly. Visual inspection of score distributions was performed using box-and-whisker plots to illustrate dosage-dependent shifts in median improvement and variability.
Between-subject effects were analyzed to evaluate the influence of demographic factors (age, BMI, and gender) and dosage-related predictors on overall change in WOMAC scores. A univariate analysis of variance (UNIANOVA) was applied to test for main effects across categories of each predictor. When significant effects were observed, pairwise comparisons were conducted to identify specific group differences. These comparisons were bootstrapped with 3,000 resamples, thereby producing bias-corrected and accelerated (BCa) confidence intervals to account for potential sample variation and increase the stability of the estimates. Pairwise tests were performed for dosage groups (single, double, and triple applications), BMI categories (normal, overweight, and obese), age categories (30-39, 40-49, 50-59, 60-69, 70-79, 80-89, and 90-99), and gender (male and female). All statistical analyses were performed using SPSS Statistics (Version 31, IBM Corp, Armonk, New York). Statistical tests were two-tailed, and the threshold of significance was set to p < 0.05. Significant values are bolded in the tables below.
3. Results
The patient cohort of 141 participants had 55% male participants, 44% female participants, and 1% unreported gender participants. The cohort was divided into three groups based on dosage frequency. Table 1 summarizes the patient characteristics. The mean ages were 69, 72, and 70 years for single, double, and triple applications, respectively. The mean BMI for single, double, and triple applications was 27.52, 29.29, and 27.78, respectively.
It is important to note that a reduction in NPRS and WOMAC scores indicates improvement, and an increase in QOLS scores indicates improvement. In the single application group, 24 out of 40 patients reported improvement in NPRS scores, 27 out of 46 patients reported improvement in total WOMAC scores, and 21 out of 46 patients reported improvement in QOLS scores. Twenty-four out of 51 patients in the double application cohort reported improvement in NPRS scores, 49 out of 64 patients reported improvement in total WOMAC scores, and 35 out of 64 patients reported improvement in QOLS scores. The triple application group reported that 16 out of 15 patients experienced improvements in NPRS scores, 28 out of 31 patients reported improvements in total WOMAC scores, and 15 out of 31 patients reported improvements in QOLS scores. While fluctuations in the multi-application groups over time are typical due to rises in pain, indicating the need for a reapplication, reductions in overall score differences are still observed from the initial to final follow-up. Table 2 presents the average percent improvement in each scale from the initial to final visit across all dosage groups, and Figure 2 displays the average scores from initial to final visit in all dosage groups.
Mean scores for NPRS, WOMAC (Pain, Stiffness, Physical Function subscales, and Total), and QOLS, across initial, 30-day, 90-day, and final visit scores, demonstrate a positive trend of improvement in all application groups. Descriptive statistics are presented in Appendix A. Across all dosage groups, NPRS and WOMAC scores decreased from the initial to the final visits. QOLS scores increased from baseline to final assessment in the multi-application groups, but in the single application group, a slight decrease was observed. A summary of WOMAC and QOLS scores from initial to endpoint is as follows:
-
WOMAC Total scores decreased from:
- ○
- 44.1 to 26.0 (Single application)
- ○
- 41.9 to 24.4 (Double application)
- ○
- 44.3 to 24.8 (Triple application)
-
WOMAC Pain dropped from:
- ○
- 9.4 to 8.3 (Single application)
- ○
- 8.6 to 6.4 (Double application)
- ○
- 9.5 to 5.5 (Triple application)
-
WOMAC Stiffness reduced from:
- ○
- 4.5 to 3.7 (Single application)
- ○
- 4.1 to 3.1 (Double application)
- ○
- 4.7 to 3.1 (Triple application)
-
WOMAC Functionality improved from:
- ○
- 30.2 to 26.0 (Single application)
- ○
- 29.2 to 20.1 (Double application)
- ○
- 30.0 to 17.9 (Triple application)
-
QOLS scores increased from
- ○
- 78.3 to 78.0 (Single application)
- ○
- 82.0 to 83.3 (Double application)
- ○
- 78.3 to 79.5 (Triple application)
Tukey’s post-hoc tests confirmed statistically significant improvements in the WOMAC (subscales and total) and QOLS scales between initial, 30-day, 90-day, and endpoint intervals for all three application groups. Significant differences were not identified in the single application, but multiple significant differences were identified in the multi-application groups, specifically in the WOMAC subscales and total (Table 3).
The multivariate analysis of variance (MANOVA) revealed multiple significant pairwise differences between dosage groups (Table 4). Patients in the single application group had significantly higher initial NPRS scores compared to both double (p < 0.001) and triple (p = 0.007) applications. No other significant differences were found in initial scores. In final visit scores, several significant differences were identified across dosage groups. Compared to single application groups, double application patients reported lower final pain (p = 0.020), stiffness (p = 0.023), physical function (p = 0.028), and total WOMAC (p = 0.022) scores. Triple application patients reported lower final NPRS (p = 0.005), pain (p = 0.003), stiffness (p = 0.002), physical function (p = 0.006), and total WOMAC scores (p = 0.003) than single application patients. In comparisons between single and triple application patients for overall change in scores, significant differences were found in total WOMAC and all subscales, indicating that triple application patients experienced better outcomes than single application patients. Significant differences between double and triple applications are identified in the overall change in pain, stiffness, and total WOMAC scores, suggesting that triple application patients had greater improvement.
Table 5, Table 6 and Table 7 and Figure 3 summarize the outcome range analysis of WOMAC score changes across all dosage groups. Participants in the single application group were observed to have the greatest outcome range in all WOMAC scales, indicating the large patient response variability. The mean change for the WOMAC total in the single application group was -6.17, with responses ranging from -52 to 50 (outcome range: 102). In the other WOMAC scales, the mean change in pain score was -1.17 (outcome range: 23), the mean change score for stiffness was -0.83 (outcome range: 10), and the mean change score for physical function was -4.17 (outcome range: 74). In the multi-application cohorts, both groups demonstrated less variability, exhibited by the narrower outcome ranges. In the double application group, the mean changes for the WOMAC Total, Pain, Stiffness, and Physical Function were -12 (outcome range: 95), -2.17 (outcome range: 24), -0.95 (outcome range: 10), and -8.88 (outcome range: 70), respectively. In the triple application, the mean changes for WOMAC Total, Pain, Stiffness, and Physical Function were -22.52 (outcome range: 78), -4.94 (outcome range: 26), -2.13 (outcome range: 7), and -15.45 (outcome range: 56). These findings indicate a dose-responsive effect, with multi-applications producing the most consistent magnitude of improvement.
A univariate analysis for variance (UNIANOVA) was conducted to examine whether dosage and demographic factors (age, BMI, and gender) were associated with overall change in total WOMAC (DW) scores (Table 8). The overall model was significant, F (10, 49) = 2.35, p = 0.023, with an adjusted R² of 0.187, indicating that the included factors explained approximately 18.7% of the variance in DW. Dosage demonstrated a statistically significant main effect, F(2, 49) = 4.91, p = 0.011, suggesting that changes in DW differed by the number of applications patients received. BMI categories approached significance, F(2, 49) = 3.11, p = .053, indicating a possible trend toward differences across BMI groups. Age category, (F(5, 49) = 0.62, p = .683) and gender, (F(1, 49) = 0.54, p = .464) were not significant predictors of DW.
In addition to the UNIANOVA, all bootstrapped pairwise comparisons of overall score changes in total WOMAC across various factors are presented in the tables below (Table 9, Table 10, Table 11 and Table 12). Significant differences in dosage (single, double, and triple applications) were identified in the comparisons between single and triple applications, as well as double and triple applications, suggesting that triple application patients performed better than the other application groups (Table 9). The results in BMI categories (Underweight, Normal weight, Overweight, and Obese) indicated a statistically significant difference between obese and normal-weight patients (mean difference = -16.49, SE = 5.58, p = .014), with obese patients demonstrating significantly greater improvement in overall WOMAC score changes (Table 8). No other significant differences were observed in other comparisons for BMI. Despite observing that age did not have a significant effect on overall change in total WOMAC scores, pairwise comparisons across age categories (30-39, 40-49, 50-59, 60-69, 70-79, 80-89, and 90-99) reported significant differences between 30-39 and 60-69, 30-39 and 70-79, as well as 30-39 and 90-99, observing that younger patients significant experienced better results than older patients (Table 11). As confirmed by Table 8, gender displayed no significant comparisons in overall total WOMAC score changes (Table 12).
4. Discussion
The findings from this observational research study demonstrate the clinical potential of umbilical cord tissue (UCT) allografts to supplement paraspinal muscle and enthesis defects in the thoracic and lumbar spinal region. All patient groups reported lower average NPRS and WOMAC scores by the final visit compared to the initial visit. The multi-application groups also reported higher average QOLS scores at the final follow-up compared to the initial visit. Due to the normally distributed data confirmed by the normality tests conducted on the dataset, Tukey’s test was performed to identify statistically significant differences in all dosage groups at initial, 30-day, 90-day, and final visit intervals. Due to the limited data for the NPRS, only the WOMAC subscales, total WOMAC, and QOLS were analyzed. The single application group displayed no significant differences in any scales; however, average reductions were reported in the descriptive statistics (Appendix A). This suggests that although improvements were observed, a single application is not sufficient to achieve significant patient improvement. Statistically significant differences were found in the double and triple application groups, most notably in the WOMAC subscales and total, confirming the benefits of a multi-application protocol. The double application patient group demonstrated significant differences across all WOMAC scales from the initial to the final visit (p < 0.001), establishing that double application patients experienced substantial improvement in pain, stiffness, and functionality. Patients in the triple application group also demonstrated statistically significant improvements from the initial to the final visit, with p < 0.001 for pain, physical function, and total WOMAC scores, and p = 0.021 for the stiffness subscale, further confirming that multi-application protocols can provide better outcomes.
To identify differences between dosage groups, the parametric multivariate analysis of variance (MANOVA) was performed on the data set (Table 4). The MANOVA analyzed pairwise comparisons between dosage groups for initial scores, final scores, and the difference between initial and final scores across all six patient-reported measures. The pairwise comparisons highlighted a dosage-dependent relationship between UCTa applications and clinical outcomes in thoracic or lumbar paraspinal defects. Triple applications were consistently associated with the most improvements across pain, stiffness, physical function, and total WOMAC scores compared to single and double application groups. These results suggested that a single or double application may not sustain symptom relief, increasing the need for reapplication to provide better, lasting outcomes. It is interesting to note that double applications demonstrated some superiority over single applications, but the effects were less pronounced than those observed in the triple application cohort. These observations suggest that two applications may provide better outcomes than the single application group, while three applications demonstrated the best outcomes from this study. The observed trends align with previous studies, where repeated exposure may reinforce and sustain outcomes in regenerative applications (Baravarian, 2025; Zhuang, 2024; Mociu, 2025). Future studies focused on long-term benefits and increased dosage applications greater than three would benefit the solidification of optimal dosage protocols and durability of the allografts in patients with treatment-resistant thoracic or lumbar paraspinal defects.
Beyond statistical significance shown through parametric testing, the outcome range analysis provided additional insight into dosage-response relationships. The larger outcome ranges observed in the single-application group suggested greater variability in individual responsiveness, whereas higher dosage groups demonstrated narrower ranges, indicating a more consistent application response. As shown in Figure 3, changes in score distributions for multi-application protocols not only improved outcomes but did so with greater consistency, as evidenced by the lower ranges. The multi-application cohorts exhibited the most consistent improvement across all WOMAC scales, as shown from the narrower outcome range, supporting a dose-dependent response to UCTa supplementation in paraspinal defects. Multiple applications appeared to support a more sustained response, paralleling the progressive improvements observed across the higher-dosage groups in other statistical testing. When combined with the MANOVA findings, the outcome range analysis strengthened the interpretation that triple applications provide the greatest overall improvement within the patient population.
This study also evaluated whether demographic and clinical factors, including age, BMI, and gender, significantly affected the overall change in total WOMAC scores. The evaluation of dosage with parametric testing was also included in the univariate analysis of variance (UNIANOVA) to broaden the scope of the analysis. The present model identified dosage as a significant predictor of overall change in total WOMAC scores, indicating that patients receiving more UCTa applications experienced better outcomes, confirming the MANOVA reports. While no significance was found in BMI, the near-significance (p = 0.053) suggested that individuals with higher BMI may experience different responses. In the pairwise analysis, patients categorized as obese showed greater improvement compared with those of healthy weight. Although this finding goes against some existing research, a possible reason for improved WOMAC scores is that patients with a higher BMI initially recorded higher scores than those with normal weight, thus enabling more significant progress (Bosler, 2023). Furthermore, leaner individuals may have had a baseline closer to the most desirable outcome, consequently offering fewer opportunities for notable improvements (Giesinger, 2021). However, the lack of significance between the overweight and normal-weight groups suggests that BMI alone may not fully capture the weight-related influences and other factors, such as metabolic health, physical activity, and fat distribution, may play an important role (Johnson, 2024; Blüher, 2020; Liechti, 2024). Age-related effects were not determined to be a main effect for the overall change in total WOMAC scores, but the pairwise comparisons reported some significant differences, indicating that younger patients (30–39 years) responded more favorably than older groups, particularly those aged 60 years and above. This conclusion is consistent with prior literature showing biological and structural limitations, such as slower tissue healing, that become prominent as individuals age (Gianfredi, 2025; Khalid, 2022). Gender was the only factor that was not significant in any analysis; nonetheless, gender was analyzed given its frequent consideration in musculoskeletal research and its potential influence on functional recovery (Overstreet, 2023; Tosi, 2024; Zhou, 2024). Exploring multiple factors, even in the absence of significant associations, provides a more comprehensive understanding of patient characteristics and ensures that possible demographic trends in paraspinal muscle defect management are not overlooked.
The encouraging outcomes from this pilot investigation should be interpreted within the context of several considerations. The design of this study was observational-based without a randomized control group, which limits direct comparisons with standard interventions and does not fully account for potential placebo effects. The follow-up duration was relatively short, preventing conclusions about long-term durability, sustained benefits, or late complications due to its focus on early responses. Patient procedural timing for multi-application was not standardized, resulting in variability in intervals of subsequent applications. Clinical outcome measures utilized were patient-reported, which are valuable for capturing subjective improvements in pain and function, but may increase the possibility of response and recall bias. In addition, baseline and follow-up imaging, which would have strengthened the interpretation of structural changes, were not provided by the observers in this study. Future randomized controlled studies incorporating imaging and longer follow-ups are warranted to validate these preliminary findings.
While these considerations should be accounted for in interpreting the results, the analogous collagenous composition found in the paraspinal muscle and UCTa strongly supports the biological plausibility of UCTa when used in homologous locations. In paraspinal muscles, the primary component of the extracellular matrix (ECM) is type I collagen, with other minor types including III, V, IX, and XI (Wohlgemuth, 2023; Csapo, 2020). When these muscles are affected by injury, collagen III appears in the early wound healing phase because of its loosely arranged fibrous network, providing elasticity and compliance (Ge, 2025; Singh, 2023). As healing progresses, the cross-linking collagen I fibers, which provide mechanical strength and stability, replace collagen III fibers (Ge, 2025). However, injured tissues rarely reach their maximum potential, regaining only 50-80% of the initial tensile strength (Singh, 2023). ECM remodeling may become dysregulated, leading not to functional tissue restoration but to fibrotic repair characterized by excessive collagen deposition and abnormal cross-linking (Ge, 2025). In the aging skeletal muscle, pathways associated with ECM remodeling are further impaired, resulting in an accumulation of densely cross-linked collagen type I fibers and increased tissue stiffness rather than improved structural integrity (Ge, 2025). The increased collagen may reflect degenerative changes and fatty infiltration in paraspinal muscles, suggesting impaired adaptive ECM remodeling rather than insufficient collagen (Anderson, 2022). UTC allograft supplementation does not alter underlying ECM remodeling; instead, it provides structural support within compromised tissue. In UCT, the primary collagen found is type I, with others including types II, III, IV, V, VI, XII, and XIV (Roy, 2022). The collagen-rich matrix in UCT forms a network of thin collagen fibers that create a mesh-like scaffold (Vizza, 1996). Other ECM components in UCT include proteoglycan-rich components that provide the ground substance, modulating viscoelastic properties, and hyaluronic acid, a glycosaminoglycan that contributes to water retention and tissue hydration (Dubus, 2022). Moreover, the structural similarities between the paraspinal muscles and UCT provide a framework for their functions in resisting unwanted movement in their respective locations (Suryadevara, 2024; Roy, 2022). The confirmation of the homologous use of UCTa in addressing paraspinal muscle defects in the thoracic and lumbar regions is found in this study’s favorable findings and its biological similarities, which observe the tessellation of healthy collagen structures with native matrices.
While the lack of comparison groups is present in this study’s design, the preliminary results observed that UCT allografts may provide more consistent outcomes in patients than other alternative interventions. The widely known autologous regenerative medicine, platelet-rich plasma (PRP) therapy, has been most commonly observed in thoracic and lumbar discs, epidural space, and facet joints, with emerging literature revealing applications in paraspinal muscles (Song, 2025; Zienlinski, 2022; Zhang, 2022; Wongjarupong, 2023; Ai, 2025; Li, 2024). Case reports in small clinical series have described PRP injections into paraspinal muscles with improvements in pain and function and no serious complications (Ai, 2025; Li, 2024; Hussein, 2016). Because PRP is not widely studied for paraspinal uses, the current literature stresses the imperative for standardized protocols in PRP therapy, as multiple studies have documented inconsistent outcomes in different areas of application (Rahman, 2024; Collins, 2021). These variations might arise from the requirement for specific platelet concentrations, underscoring the influence of individual patient health on application efficacy (Rahman, 2024; Boffa, 2024). Because PRP is prepared from the patient’s own blood, variability in baseline platelet counts can markedly affect the final product and, consequently, therapeutic response (Rossi, 2023). Because of the collection and processing methods used for human UCTa, the final product is not dependent on patient health. Human UCTa are rigorously screened using processing protocols that provide a high level of confidence that tissue quality remains consistent across products. These allografts have shown consistency across various homologous use sites, offering pain relief and increased functionality by replacing damaged tissue, as reported in previous publications from the same repository (Lai, 2024; Lai, 2023). As an emerging conservative approach, UCTa applications could be a standardized option before surgical intervention to preserve muscle integrity. Continued research advocates for study designs including comparative analyses and randomized clinical trials, and the safety, feasibility, and efficacy of these initial findings might be confirmed. Such confirmation would provide definitive evidence for the clinical application of UCTa supplementation in addressing paraspinal muscle defects in the thoracic and lumbar spine that are refractory to standard practices.
5. Conclusions
A total of 141 participants were evaluated after receiving either a single, double, or triple application of umbilical cord allografts. The results revealed no adverse events or complications with improvements in pain, stiffness, functionality, and quality of life over a 90-180 day period with statistical significance in multiple tests. Although the findings are promising, the use of patient-reported outcomes, the lack of a control group, variation between timing of subsequent UCTa applications, and the short observation period preclude conclusive proof of the effectiveness of UCTa application. These preliminary findings strongly suggest that UCTa for paraspinal muscle defects in the thoracic and lumbar regions are safe, feasible, and clinically applicable before surgical intervention is considered. Further investigation is warranted to determine the specific role of this regenerative approach when clinically managing degeneration of the thoracic and lumbar paraspinal muscles.
Author Contributions
Conceptualization, C.T., J.B., J.C., T.G., H.J., L.P., and T.B.; methodology, C.T., J.B., J.C., T.G., H.J., L.P., and T.B.; software, T.B.; validation, N.L, A.L., T.B.; formal analysis, C.T., J.B., J.C., T.G., H.J., L.P., N.L., A.L., and T.B.; investigation, C.T., J.B., J.C., T.G., H.J., and L.P.; resources, N.L. and A.L.; data curation, C.T., J.B., J.C., T.G., H.J., L.P., N.L., A.L., and T.B.; writing—original draft preparation, C.T., J.B., J.C., T.G., H.J., L.P., N.L., A.L., and T.B.; writing—review and editing, C.T., J.B., J.C., T.G., H.J., L.P., N.L., A.L., and T.B.; visualization, N.L. and A.L.; supervision, N.L. and T.B.; project administration, R.D. and T.B.; funding acquisition, C.T., J.B., J.C., T.G., H.J., L.P., and T.B. All authors have read and agreed to the published version of the manuscript.
Funding
This research received no external funding.
Institutional Review Board Statement
This study was conducted in accordance with the Declaration of Helsinki and approved by the Institutional Review Board of the Institute of Regenerative and Cellular Medicine (protocol code IRCM-2022-311; Approval date: 12 January 2022).
Informed Consent Statement
Written informed consent was obtained from all subjects involved in the study.
Data Availability Statement
Data available upon request.
Acknowledgments
The authors would like to thank the staff at each clinic that participated in the repository for their assistance in data collection and submission.
Conflicts of Interest
Naomi Lambert, Alexis Lee, and Tyler Barrett are associated with Regenative Labs. Regenerative Labs was involved in the design of the study, data analysis, and writing. Regenative Labs influenced the decision to publish.
Abbreviations
The following abbreviations are used in this manuscript:
| MDPI | Multidisciplinary Digital Publishing Institute |
| UCT | Umbilical cord tissue |
| UCTa | Umbilical cord tissue allografts |
| WOMAC | Western Ontario and McMaster University Arthritis Index |
| NPRS | Numeric Pain Rating Scale |
| QOLS | Quality of Life Scale |
Appendix A

Table A1.
day, 90-day, and endpoint time intervals across all application groups.
| N | Mean | Std. Deviation | Std. Error | 95% Confidence Interval for Mean | Minimum | Maximum | |||
| Lower Bound | Upper Bound | ||||||||
| P1 | Single Application | 46 | 9.4348 | 5.52832 | .81511 | 7.7931 | 11.0765 | .00 | 19.00 |
| Double Application | 64 | 8.6406 | 4.15710 | .51964 | 7.6022 | 9.6790 | .00 | 17.00 | |
| Triple Application | 31 | 9.5484 | 5.50659 | .98901 | 7.5286 | 11.5682 | .00 | 27.00 | |
| Total | 141 | 9.0993 | 4.92705 | .41493 | 8.2789 | 9.9196 | .00 | 27.00 | |
| S1 | Single Application | 46 | 4.5217 | 2.38271 | .35131 | 3.8142 | 5.2293 | .00 | 8.00 |
| Double Application | 64 | 4.0938 | 2.23052 | .27881 | 3.5366 | 4.6509 | .00 | 8.00 | |
| Triple Application | 31 | 4.7097 | 1.79246 | .32193 | 4.0522 | 5.3672 | .00 | 7.00 | |
| Total | 141 | 4.3688 | 2.19549 | .18489 | 4.0033 | 4.7343 | .00 | 8.00 | |
| PF1 | Single Application | 46 | 30.1522 | 17.43173 | 2.57017 | 24.9756 | 35.3288 | .00 | 57.00 |
| Double Application | 64 | 29.2188 | 13.48658 | 1.68582 | 25.8499 | 32.5876 | .00 | 63.00 | |
| Triple Application | 31 | 30.0000 | 15.39264 | 2.76460 | 24.3539 | 35.6461 | 3.00 | 57.00 | |
| Total | 141 | 29.6950 | 15.18173 | 1.27853 | 27.1673 | 32.2228 | .00 | 63.00 | |
| W1 | Single Application | 46 | 44.1087 | 24.66867 | 3.63720 | 36.7830 | 51.4344 | .00 | 83.00 |
| Double Application | 64 | 41.9531 | 19.12733 | 2.39092 | 37.1753 | 46.7310 | .00 | 83.00 | |
| Triple Application | 31 | 44.2581 | 21.15493 | 3.79954 | 36.4984 | 52.0178 | 6.00 | 81.00 | |
| Total | 141 | 43.1631 | 21.38612 | 1.80104 | 39.6024 | 46.7239 | .00 | 83.00 | |
| Q1 | Single Application | 46 | 78.2609 | 19.90135 | 2.93429 | 72.3509 | 84.1708 | 31.00 | 112.00 |
| Double Application | 64 | 82.0156 | 16.28076 | 2.03510 | 77.9488 | 86.0824 | 38.00 | 110.00 | |
| Triple Application | 31 | 78.3226 | 14.89829 | 2.67581 | 72.8578 | 83.7873 | 57.00 | 110.00 | |
| Total | 141 | 79.9787 | 17.25169 | 1.45285 | 77.1064 | 82.8511 | 31.00 | 112.00 | |
| P2 | Single Application | 46 | 8.6522 | 4.18578 | .61716 | 7.4092 | 9.8952 | .00 | 19.00 |
| Double Application | 64 | 7.1719 | 3.76515 | .47064 | 6.2314 | 8.1124 | .00 | 16.00 | |
| Triple Application | 31 | 7.3226 | 4.44513 | .79837 | 5.6921 | 8.9531 | .00 | 18.00 | |
| Total | 141 | 7.6879 | 4.08680 | .34417 | 7.0075 | 8.3684 | .00 | 19.00 | |
| S2 | Single Application | 46 | 4.0217 | 1.85579 | .27362 | 3.4706 | 4.5728 | .00 | 8.00 |
| Double Application | 64 | 3.3125 | 2.03052 | .25382 | 2.8053 | 3.8197 | .00 | 8.00 | |
| Triple Application | 31 | 3.9677 | 2.08940 | .37527 | 3.2013 | 4.7341 | .00 | 7.00 | |
| Total | 141 | 3.6879 | 2.00405 | .16877 | 3.3543 | 4.0216 | .00 | 8.00 | |
| PF2 | Single Application | 46 | 27.9565 | 13.87557 | 2.04584 | 23.8360 | 32.0771 | 2.00 | 57.00 |
| Double Application | 64 | 22.8594 | 11.80781 | 1.47598 | 19.9099 | 25.8089 | 3.00 | 52.00 | |
| Triple Application | 31 | 25.5161 | 13.92569 | 2.50113 | 20.4081 | 30.6241 | 2.00 | 57.00 | |
| Total | 141 | 25.1064 | 13.08418 | 1.10189 | 22.9279 | 27.2849 | 2.00 | 57.00 | |
| W2 | Single Application | 46 | 40.6304 | 19.16056 | 2.82507 | 34.9405 | 46.3204 | 4.00 | 83.00 |
| Double Application | 64 | 33.3438 | 16.65925 | 2.08241 | 29.1824 | 37.5051 | 4.00 | 75.00 | |
| Triple Application | 31 | 36.8065 | 19.79296 | 3.55492 | 29.5463 | 44.0666 | 2.00 | 81.00 | |
| Total | 141 | 36.4823 | 18.35818 | 1.54604 | 33.4257 | 39.5389 | 2.00 | 83.00 | |
| Q2 | Single Application | 44 | 73.0000 | 16.49665 | 2.48696 | 67.9846 | 78.0154 | 40.00 | 107.00 |
| Double Application | 64 | 82.8438 | 21.39887 | 2.67486 | 77.4985 | 88.1890 | 39.00 | 174.00 | |
| Triple Application | 31 | 77.4839 | 13.63542 | 2.44899 | 72.4824 | 82.4854 | 47.00 | 107.00 | |
| Total | 139 | 78.5324 | 18.78533 | 1.59335 | 75.3818 | 81.6829 | 39.00 | 174.00 | |
| P3 | Single Application | 46 | 8.2609 | 3.91825 | .57771 | 7.0973 | 9.4244 | .00 | 17.00 |
| Double Application | 64 | 7.1250 | 4.28545 | .53568 | 6.0545 | 8.1955 | .00 | 17.00 | |
| Triple Application | 31 | 7.5484 | 4.44101 | .79763 | 5.9194 | 9.1774 | .00 | 18.00 | |
| Total | 141 | 7.5887 | 4.20386 | .35403 | 6.8887 | 8.2886 | .00 | 18.00 | |
| S3 | Single Application | 46 | 3.6957 | 1.36414 | .20113 | 3.2906 | 4.1008 | .00 | 6.00 |
| Double Application | 64 | 3.5938 | 2.11359 | .26420 | 3.0658 | 4.1217 | .00 | 8.00 | |
| Triple Application | 31 | 3.7419 | 2.06507 | .37090 | 2.9845 | 4.4994 | .00 | 7.00 | |
| Total | 141 | 3.6596 | 1.87780 | .15814 | 3.3469 | 3.9722 | .00 | 8.00 | |
| PF3 | Single Application | 46 | 25.9783 | 12.98288 | 1.91422 | 22.1228 | 29.8337 | .00 | 54.00 |
| Double Application | 64 | 24.4375 | 14.68924 | 1.83616 | 20.7682 | 28.1068 | .00 | 59.00 | |
| Triple Application | 31 | 24.8387 | 15.50505 | 2.78479 | 19.1514 | 30.5260 | .00 | 58.00 | |
| Total | 141 | 25.0284 | 14.25680 | 1.20064 | 22.6546 | 27.4021 | .00 | 59.00 | |
| W3 | Single Application | 46 | 37.9348 | 17.81810 | 2.62713 | 32.6435 | 43.2261 | 2.00 | 75.00 |
| Double Application | 64 | 35.1563 | 20.33155 | 2.54144 | 30.0776 | 40.2349 | .00 | 83.00 | |
| Triple Application | 31 | 36.1290 | 21.51858 | 3.86485 | 28.2360 | 44.0221 | .00 | 82.00 | |
| Total | 141 | 36.2766 | 19.71733 | 1.66050 | 32.9937 | 39.5595 | .00 | 83.00 | |
| Q3 | Single Application | 46 | 77.9565 | 14.66054 | 2.16158 | 73.6029 | 82.3102 | 42.00 | 109.00 |
| Double Application | 64 | 81.8125 | 16.37737 | 2.04717 | 77.7216 | 85.9034 | 42.00 | 112.00 | |
| Triple Application | 31 | 77.5806 | 17.10901 | 3.07287 | 71.3050 | 83.8563 | 40.00 | 107.00 | |
| Total | 141 | 79.6241 | 16.01675 | 1.34885 | 76.9574 | 82.2909 | 40.00 | 112.00 | |
| FP | Single Application | 46 | 8.2609 | 3.91825 | .57771 | 7.0973 | 9.4244 | .00 | 17.00 |
| Double Application | 64 | 6.4063 | 4.28996 | .53625 | 5.3346 | 7.4779 | .00 | 16.00 | |
| Triple Application | 31 | 5.4516 | 3.91441 | .70305 | 4.0158 | 6.8874 | .00 | 13.00 | |
| Total | 141 | 6.8014 | 4.20411 | .35405 | 6.1014 | 7.5014 | .00 | 17.00 | |
| FS | Single Application | 46 | 3.6957 | 1.36414 | .20113 | 3.2906 | 4.1008 | .00 | 6.00 |
| Double Application | 64 | 3.1250 | 1.97203 | .24650 | 2.6324 | 3.6176 | .00 | 7.00 | |
| Triple Application | 31 | 3.0968 | 3.31013 | .59452 | 1.8826 | 4.3109 | .00 | 18.00 | |
| Total | 141 | 3.3050 | 2.18417 | .18394 | 2.9413 | 3.6686 | .00 | 18.00 | |
| FPF | Single Application | 46 | 25.9783 | 12.98288 | 1.91422 | 22.1228 | 29.8337 | .00 | 54.00 |
| Double Application | 64 | 20.1094 | 13.56948 | 1.69618 | 16.7198 | 23.4989 | .00 | 58.00 | |
| Triple Application | 31 | 17.8710 | 13.02751 | 2.33981 | 13.0924 | 22.6495 | .00 | 43.00 | |
| Total | 141 | 21.5319 | 13.55705 | 1.14171 | 19.2747 | 23.7891 | .00 | 58.00 | |
| FW | Single Application | 46 | 37.9348 | 17.81810 | 2.62713 | 32.6435 | 43.2261 | 2.00 | 75.00 |
| Double Application | 64 | 29.6406 | 19.27361 | 2.40920 | 24.8262 | 34.4550 | .00 | 80.00 | |
| Triple Application | 31 | 26.4194 | 19.22633 | 3.45315 | 19.3671 | 33.4716 | .00 | 72.00 | |
| Total | 141 | 31.6383 | 19.21728 | 1.61839 | 28.4387 | 34.8379 | .00 | 80.00 | |
| FQ | Single Application | 46 | 77.9565 | 14.66054 | 2.16158 | 73.6029 | 82.3102 | 42.00 | 109.00 |
| Double Application | 64 | 83.3125 | 16.31230 | 2.03904 | 79.2378 | 87.3872 | 42.00 | 112.00 | |
| Triple Application | 31 | 79.4839 | 17.30100 | 3.10735 | 73.1378 | 85.8299 | 45.00 | 106.00 | |
| Total | 141 | 80.7234 | 16.08997 | 1.35502 | 78.0445 | 83.4024 | 42.00 | 112.00 | |
Key: NPRS: Numerical Pain Rating Scale, P: WOMAC—Pain, S: WOMAC—Stiffness, PF: WOMAC—Physical Function, W: WOMAC—Total, Q: Quality of life scale, 1: Initial Visit, 2: 30-Day Visit, F: Last Visit Submitted.
References
- Wan Q, Lin C, Li X, Zeng W, Ma C. MRI assessment of paraspinal muscles in patients with acute and chronic unilateral low back pain. Br J Radiol. 2015;88(1053):20140546. [CrossRef]
- Noonan AM, Brown SHM. Paraspinal muscle pathophysiology associated with low back pain and spine degenerative disorders. JOR Spine. 2021;4(3):e1171. Published 2021 Sep 15. [CrossRef]
- Huang Y, Wang L, Zeng X, et al. Association of Paraspinal Muscle CSA and PDFF Measurements With Lumbar Intervertebral Disk Degeneration in Patients With Chronic Low Back Pain. Front Endocrinol (Lausanne). 2022;13:792819. Published 2022 May 26. [CrossRef]
- Gu H, Hong J, Wang Z, et al. Association of MRI findings with paraspinal muscles fat infiltration at lower lumbar levels in patients with chronic low back pain: a multicenter prospective study. BMC Musculoskelet Disord. 2024;25(1):549. Published 2024 Jul 16. [CrossRef]
- Garcia AJ, Lee DW, Leavitt L, Tieppo Francio V. Evidence of Multifidus Changes Post-Lumbar Radiofrequency Ablation: A Narrative Literature Review. Journal of Clinical Medicine. 2025; 14(18):6462. [CrossRef]
- Anstruther M, Sean M, Tétreault P, Fortin M. Paraspinal Muscle Changes in Individuals with and without Chronic Low Back Pain over 4 months: A Longitudinal MRI Study. Medicina. 2024; 60(3):490. [CrossRef]
- Anthierens A, Thevenon A, Olivier N, Mucci P. Paraspinal muscle oxygenation and mechanical efficiency are reduced in individuals with chronic low back pain. Sci Rep. 2024;14(1):4943. Published 2024 Feb 28. [CrossRef]
- Giaccone P, D’Antoni F, Russo F, et al. Fully automated evaluation of paraspinal muscle morphology and composition in patients with low back pain. Intelligence-Based Medicine. 2024;9:100130. [CrossRef]
- Osti L, Buda M, Del Buono A. Fatty infiltration of the shoulder: diagnosis and reversibility. Muscles Ligaments Tendons J. 2014;3(4):351-354. Published 2014 Feb 24.
- Zhu Y, Hu Y, Pan Y, et al. Fatty infiltration in the musculoskeletal system: pathological mechanisms and clinical implications. Front Endocrinol (Lausanne). 2024;15:1406046. Published 2024 Jun 28. [CrossRef]
- Mandelli F, Nüesch C, Zhang Y, et al. Assessing Fatty Infiltration of Paraspinal Muscles in Patients With Lumbar Spinal Stenosis: Goutallier Classification and Quantitative MRI Measurements. Front Neurol. 2021;12:656487. Published 2021 Sep 3. [CrossRef]
- Kızılgöz V, Aydın S, Karavaş E, Kantarcı M, Kahraman Ş. Are paraspinal muscle quantity, lumbar indentation value, and subcutaneous fat thickness related to disc degeneration? An MRI-based study. Radiography (Lond). 2023;29(2):428-435. [CrossRef]
- Ozer FF, Güler E. Relation of bone mineral density with fat infiltration of paraspinal muscles: The Goutallier classification. Osteoporos Sarcopenia. 2024;10(2):84-88. [CrossRef]
- Rummens S, Robben E, De Groef A, et al. Factors Associated With the Ultrasound Characteristics of the Lumbar Multifidus: A Systematic Review. PM R. 2020;12(1):82-100. [CrossRef]
- Silişteanu SC, Antonescu E, Duică L, Totan M, Cucu AI, Costea AI. Lumbar Paravertebral Muscle Pain Management Using Kinesitherapy and Electrotherapeutic Modalities. Healthcare. 2024; 12(8):853. [CrossRef]
- George SZ, Fritz JM, Silfies SP, et al. Interventions for the Management of Acute and Chronic Low Back Pain: Revision 2021. J Orthop Sports Phys Ther. 2021;51(11):CPG1-CPG60. [CrossRef]
- Ramos LA, de Carvalho RT, Abdalla RJ, Ingham SJ. Surgical treatment for muscle injuries. Curr Rev Musculoskelet Med. 2015;8(2):188-192. [CrossRef]
- Gengyu H, Jinyue D, Chunjie G, et al. The predictive value of preoperative paraspinal muscle morphometry on complications after lumbar surgery: a systematic review. Eur Spine J. 2022;31(2):364-379. [CrossRef]
- Gilligan C, Volschenk W, Russo M, et al. Three-Year Durability of Restorative Neurostimulation Effectiveness in Patients With Chronic Low Back Pain and Multifidus Muscle Dysfunction. Neuromodulation. 2023;26(1):98-108. [CrossRef]
- Koushik SS, Raghavan J, Saranathan S, Slinchenkova K, Viswanath O, Shaparin N. Complications of Spinal Cord Stimulators-A Comprehensive Review Article. Curr Pain Headache Rep. 2024;28(1):1-9. [CrossRef]
- Goudman L, Moens M, Kelly S, Young C, Pilitsis JG. Incidence of Infections, Explantations, and Displacements/Mechanical Complications of Spinal Cord Stimulation During the Past Eight Years. Neuromodulation. 2024;27(6):1082-1089. [CrossRef]
- Gupta A, El-Amin SF 3rd, Levy HJ, Sze-Tu R, Ibim SE, Maffulli N. Umbilical cord-derived umbilical cord tissue for regenerative medicine applications. J Orthop Surg Res. 2020;15(1):49. Published 2020 Feb 13. [CrossRef]
- Main BJ, Maffulli N, Valk JA, Rodriguez HC, Gupta M, El-Amin SF III, Gupta A. Umbilical Cord-Derived umbilical cord tissue for Regenerative Medicine Applications: A Systematic Review. Pharmaceuticals. 2021; 14(11):1090. [CrossRef]
- Roy A, Mantay M, Brannan C, Griffiths S. Placental Tissues as Biomaterials in Regenerative Medicine. Biomed Res Int. 2022;2022:6751456. Published 2022 Apr 21. [CrossRef]
- Deus IA, Mano JF, Custódio CA. Perinatal tissues and cells in tissue engineering and regenerative medicine. Acta Biomater. 2020;110:1-14. [CrossRef]
- Lai A, Tamea C, Shou J, Okafor A, Sparks J, Dodd R, Woods C, Lambert N, Schulte O, Barrett T. Safety and Efficacy of umbilical cord tissue Connective Tissue Allograft for Rotator Cuff Tears: Findings from a Retrospective Observational Study. Biomedicines. 2024; 12(4):710. [CrossRef]
- Lai A, Shou J, Traina SA, Barrett T. The Durability and Efficacy of Cryopreserved Human Umbilical Cord Tissue Allograft for the Supplementation of Cartilage Defects Associated with the Sacroiliac Joint: A Case Series. Reports. 2023; 6(1):12. [CrossRef]
- Baravarian B, Kwon G, Shou J, Lambert N, Lee A, Castle E, Barrett T. An Observational Cohort Study of Wharton’s Jelly Tissue Allografts for Posterior Tibial Tendon Degeneration. Biomedicines. 2025; 13(10):2398. [CrossRef]
- Zhuang W, Li T, Li Y, Zhang Y, Gao J, Wang X, Ding Q, Li W. The varying clinical effectiveness of single, three and five intraarticular injections of platelet-rich plasma in knee osteoarthritis. J Orthop Surg Res. 2024 May 8;19(1):284. [CrossRef]
- Mociu S-I, Nedelcu A-D, Lupu A-A, Uzun A-B, Iliescu D-M, Ionescu E-V, Iliescu M-G. Prolotherapy as a Regenerative Treatment in the Management of Chronic Low Back Pain: A Systematic Review. Medicina. 2025; 61(9):1588. [CrossRef]
- Bosler AC, Deckard ER, Buller LT, Meneghini RM. Obesity is Associated With Greater Improvement in Patient-Reported Outcomes Following Primary Total Knee Arthroplasty. J Arthroplasty. 2023;38(12):2484-2491. [CrossRef]
- Giesinger K, Giesinger JM, Hamilton DF, Rechsteiner J, Ladurner A. Higher body mass index is associated with larger postoperative improvement in patient-reported outcomes following total knee arthroplasty. BMC Musculoskelet Disord. 2021;22(1):635. Published 2021 Jul 24. [CrossRef]
- Johnson AJ, Peterson JA, Vincent HK, Manini T, Cruz-Almeida Y. Body composition and body mass index are independently associated with widespread pain and experimental pain sensitivity in older adults: a pilot investigation. Front Pain Res (Lausanne). 2024;5:1386573. Published 2024 Jul 1. [CrossRef]
- Blüher M. Metabolically Healthy Obesity. Endocr Rev. 2020;41(3):bnaa004. [CrossRef]
- Liechti M, Menegon M, Schurz AP, et al. Association between pain intensity and body composition in adults with chronic non-specific low back pain: A systematic review and meta-analysis. Obes Rev. 2025;26(4):e13875. [CrossRef]
- Gianfredi V, Nucci D, Pennisi F, Maggi S, Veronese N, Soysal P. Aging, longevity, and healthy aging: the public health approach. Aging Clin Exp Res. 2025 Apr 17;37(1):125. [CrossRef]
- Khalid KA, Nawi AFM, Zulkifli N, Barkat MA, Hadi H. Aging and Wound Healing of the Skin: A Review of Clinical and Pathophysiological Hallmarks. Life (Basel). 2022 Dec 19;12(12):2142. [CrossRef]
- Overstreet DS, Strath LJ, Jordan M, Jordan IA, Hobson JM, Owens MA, Williams AC, Edwards RR, Meints SM. A Brief Overview: Sex Differences in Prevalent Chronic Musculoskeletal Conditions. International Journal of Environmental Research and Public Health. 2023; 20(5):4521. [CrossRef]
- Tosi LL, Templeton K, Pennington AM, Reid KA, Boyan BD. Influence of Sex and Gender on Musculoskeletal Conditions and How They Are Reported. J Bone Joint Surg Am. 2024;106(16):1512-1519. [CrossRef]
- Zhou J, Xie S, Xu S, et al. From Pain to Progress: Comprehensive Analysis of Musculoskeletal Disorders Worldwide. J Pain Res. 2024;17:3455-3472. Published 2024 Oct 24. [CrossRef]
- Wohlgemuth RP, Brashear SE, Smith LR. Alignment, cross linking, and beyond: a collagen architect’s guide to the skeletal muscle extracellular matrix. Am J Physiol Cell Physiol. 2023;325(4):C1017-C1030. [CrossRef]
- Csapo R, Gumpenberger M, Wessner B. Skeletal Muscle Extracellular Matrix - What Do We Know About Its Composition, Regulation, and Physiological Roles? A Narrative Review. Front Physiol. 2020;11:253. Published 2020 Mar 19. [CrossRef]
- Ge X, Jin Y, He J, Jia Z, Liu Y, Xu Y. Extracellular matrix in skeletal muscle injury and atrophy: mechanisms and therapeutic implications. J Orthop Translat. 2025;52:404-418. Published 2025 May 16. [CrossRef]
- Singh D, Rai V, Agrawal DK. Regulation of Collagen I and Collagen III in Tissue Injury and Regeneration. Cardiol Cardiovasc Med. 2023;7(1):5-16. [CrossRef]
- Anderson B, Ordaz A, Zlomislic V, et al. Paraspinal Muscle Health is Related to Fibrogenic, Adipogenic, and Myogenic Gene Expression in Patients with Lumbar Spine Pathology. BMC Musculoskelet Disord. 2022;23(1):608. Published 2022 Jun 24. [CrossRef]
- Vizza E, Correr S, Goranova V, et al. The collagen skeleton of the human umbilical cord at term. A scanning electron microscopy study after 2N-NaOH maceration. Reprod Fertil Dev. 1996;8(5):885-894. [CrossRef]
- Dubus M, Scomazzon L, Chevrier J, et al. Decellularization of umbilical cord tissue Increases Its Bioactivity and Antibacterial Properties. Front Bioeng Biotechnol. 2022;10:828424. [CrossRef]
- Suryadevara M, Mishra GV, Parihar P, et al. Role of End Plate Changes and Paraspinal Muscle Pathology in Lower Back Pain: A Narrative Review. Cureus. 2024;16(5):e61319. Published 2024 May 29. [CrossRef]
- Song H, Zhang Y. The clinical efficacy of percutaneous endoscopic lumbar discectomy combined with platelet-rich plasma injection for lumbar disc herniation: a systematic review and meta-analysis. Front Surg. 2025;12:1601772. Published 2025 May 27. [CrossRef]
- Zielinski MA, Evans NE, Bae H, et al. Safety and Efficacy of Platelet Rich Plasma for Treatment of Lumbar Discogenic Pain: A Prospective, Multicenter, Randomized, Double-blind Study. Pain Physician. 2022;25(1):29-34.
- Zhang J, Liu D, Gong Q, Chen J, Wan L. Intradiscal Autologous Platelet-Rich Plasma Injection for Discogenic Low Back Pain: A Clinical Trial. Biomed Res Int. 2022;2022:9563693. Published 2022 Oct 10. [CrossRef]
- Wongjarupong A, Pairuchvej S, Laohapornsvan P, et al. “Platelet-Rich Plasma” epidural injection an emerging strategy in lumbar disc herniation: a Randomized Controlled Trial. BMC Musculoskelet Disord. 2023;24(1):335. Published 2023 Apr 28. [CrossRef]
- Ai S, Xiang XN, Yu X, et al. Ultrasound-guided injection of platelet-rich plasma alleviated pain and improved function for individuals with myofascial pain syndrome: a retrospective case series study. BMC Musculoskelet Disord. 2025;26(1):648. Published 2025 Jul 4. [CrossRef]
- Li N, Wang Q, Ai S, He H, He J, Jiang N. Effects of platelet-rich plasma injection on electrical activity and biomechanics of the erector spinae muscles in lumbar myofascial pain syndrome. Scientific Reports. 2024;14(1). [CrossRef]
- Hussein M, Hussein T. Effect of autologous platelet leukocyte rich plasma injections on atrophied lumbar multifidus muscle in low back pain patients with monosegmental degenerative disc disease. SICOT J. 2016;2:12. Published 2016 Mar 22. [CrossRef]
- Rahman E, Rao P, Abu-Farsakh HN, Thonse C, Ali I, Upton AE, Baratikkae SY, Carruthers JDA, Mosahebi A, Heidari N, et al. Systematic Review of Platelet-Rich Plasma in Medical and Surgical Specialties: Quality, Evaluation, Evidence, and Enforcement. Journal of Clinical Medicine. 2024; 13(15):4571. [CrossRef]
- Collins T, Alexander D, Barkatali B. Platelet-rich plasma: a narrative review. EFORT Open Rev. 2021;6(4):225-235. [CrossRef]
- Boffa A, De Marziani L, Andriolo L, et al. Influence of Platelet Concentration on the Clinical Outcome of Platelet-Rich Plasma Injections in Knee Osteoarthritis. Am J Sports Med. 2024;52(13):3223-3231. [CrossRef]
- Rossi L, Ranalletta M, Pasqualini I, et al. Substantial Variability in Platelet-Rich Plasma Composition Is Based on Patient Age and Baseline Platelet Count. Arthrosc Sports Med Rehabil. 2023;5(3):e853-e858. Published 2023 May 20. [CrossRef]
Figure 1.
Flow chart of this study’s design.
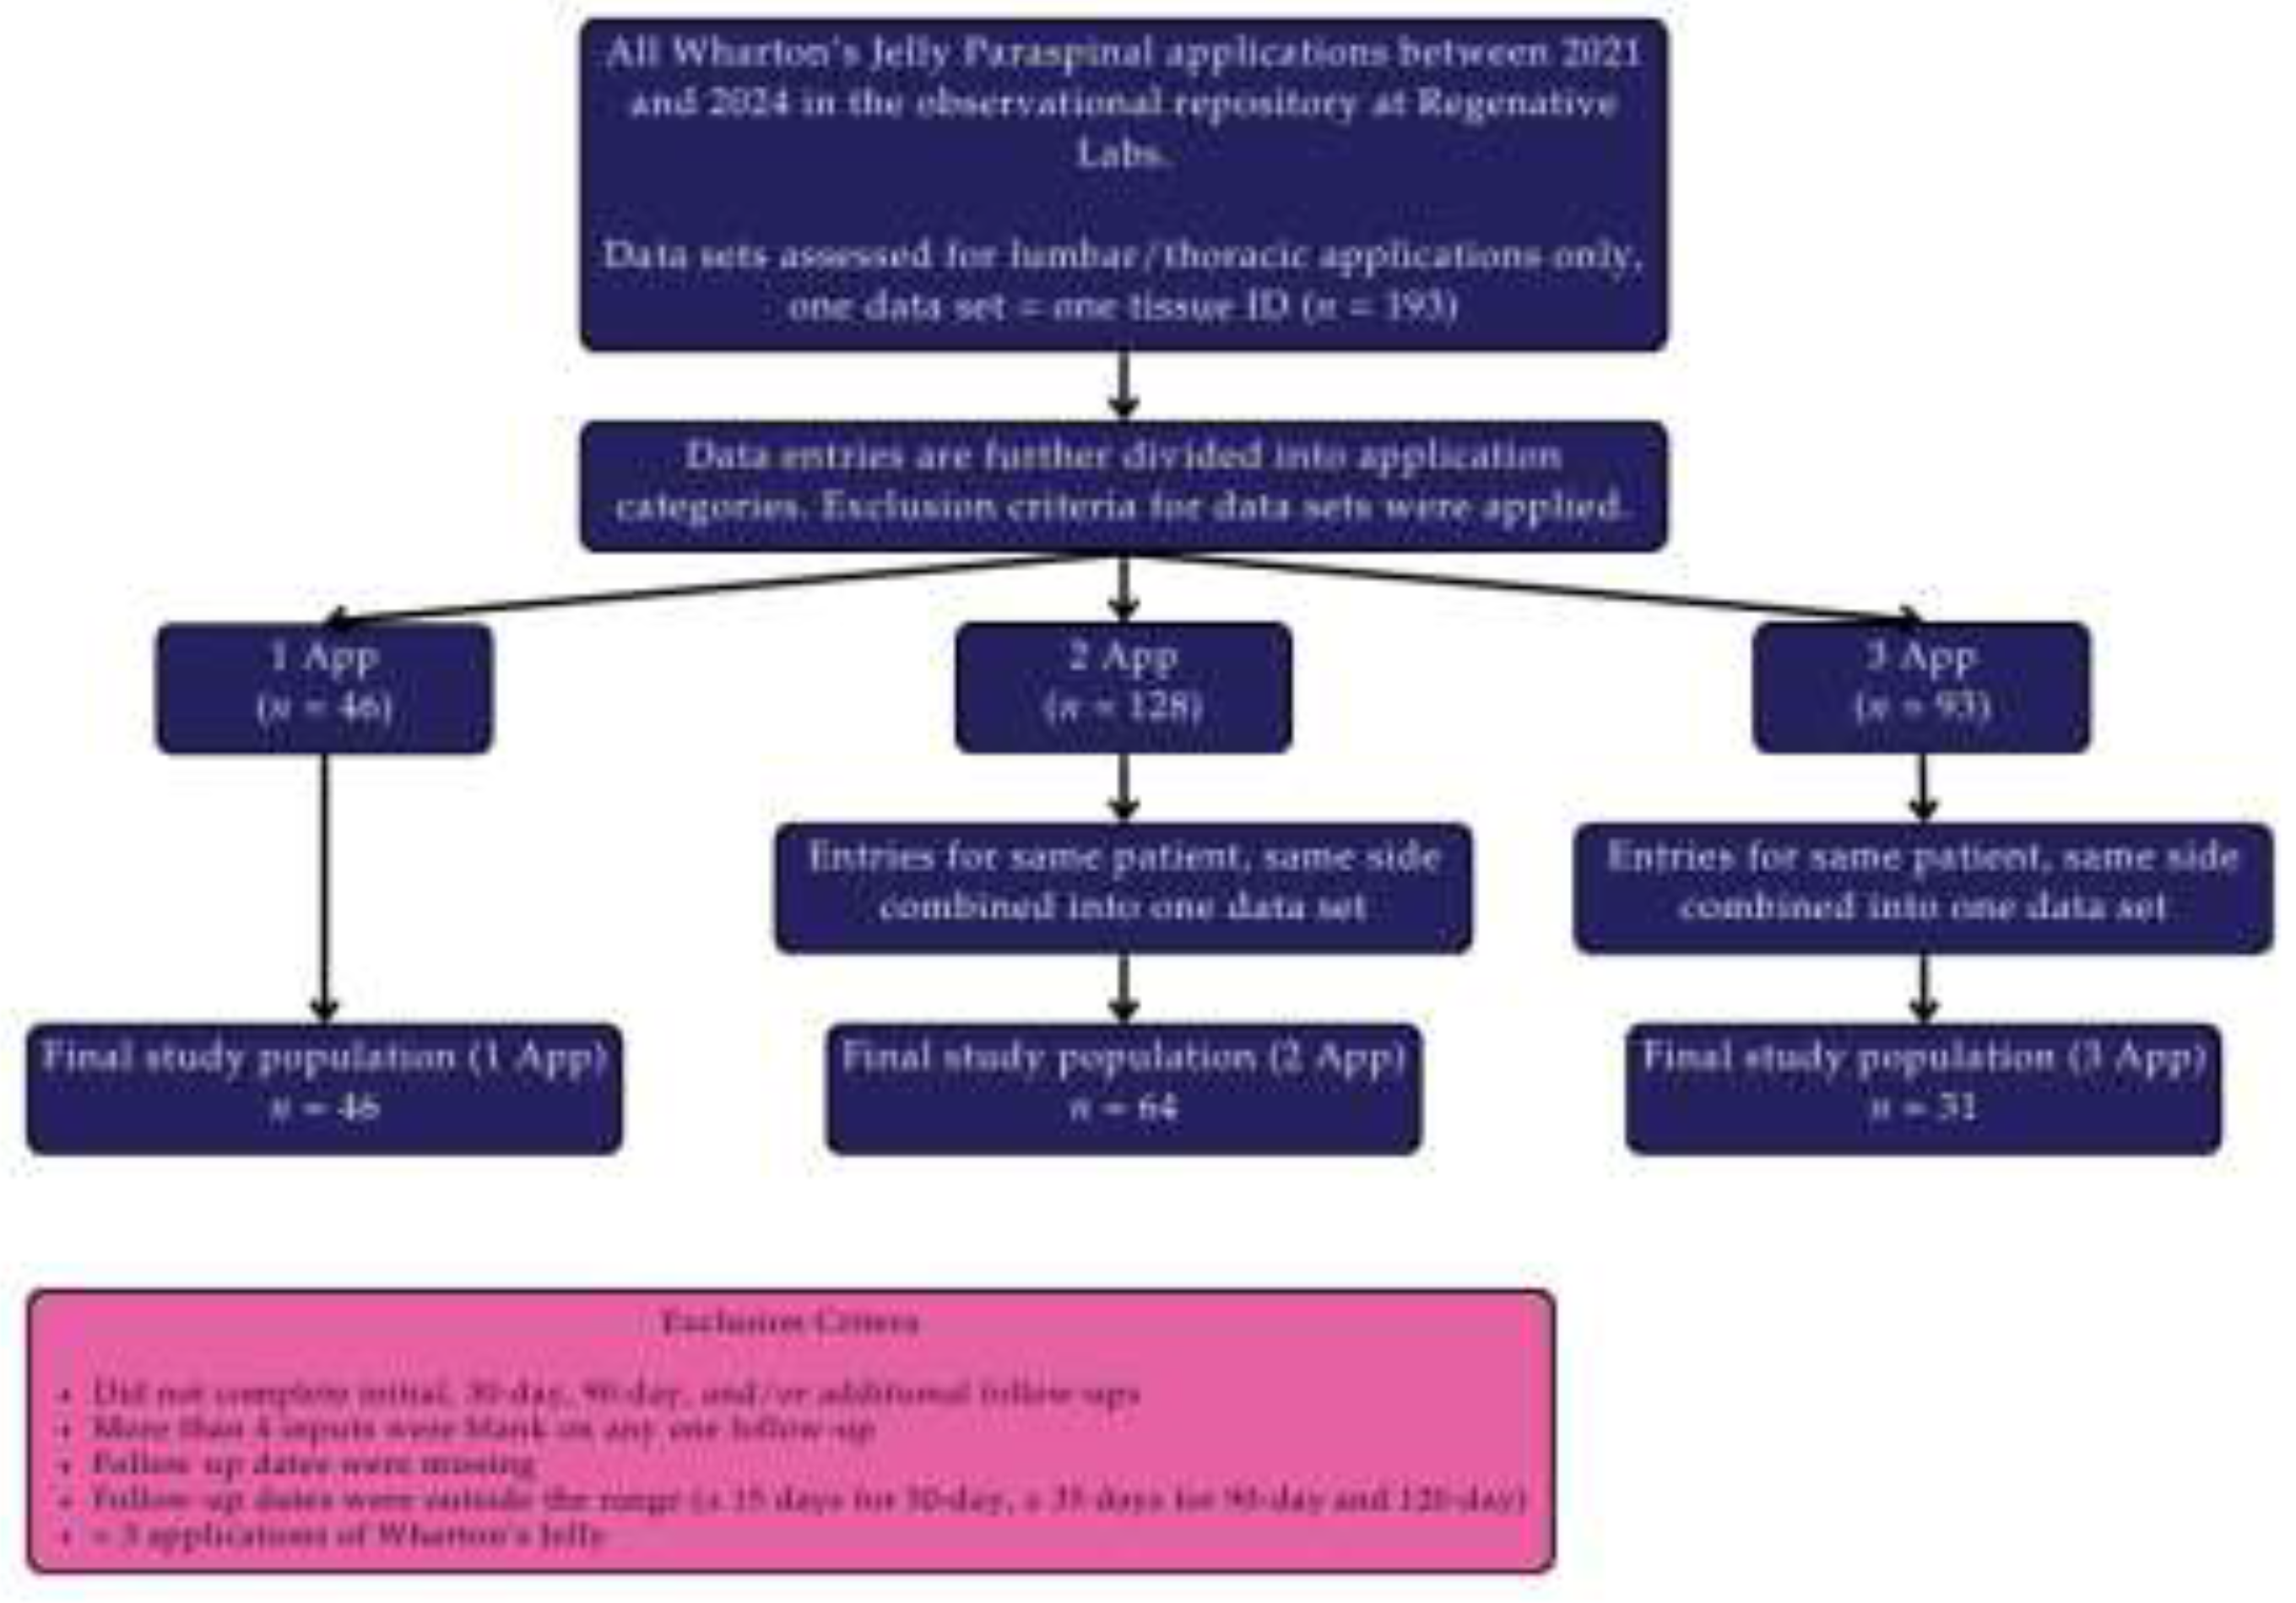
Figure 2.
Average score improvement of all application groups in all scales from initial to final visit.
Figure 2.
Average score improvement of all application groups in all scales from initial to final visit.
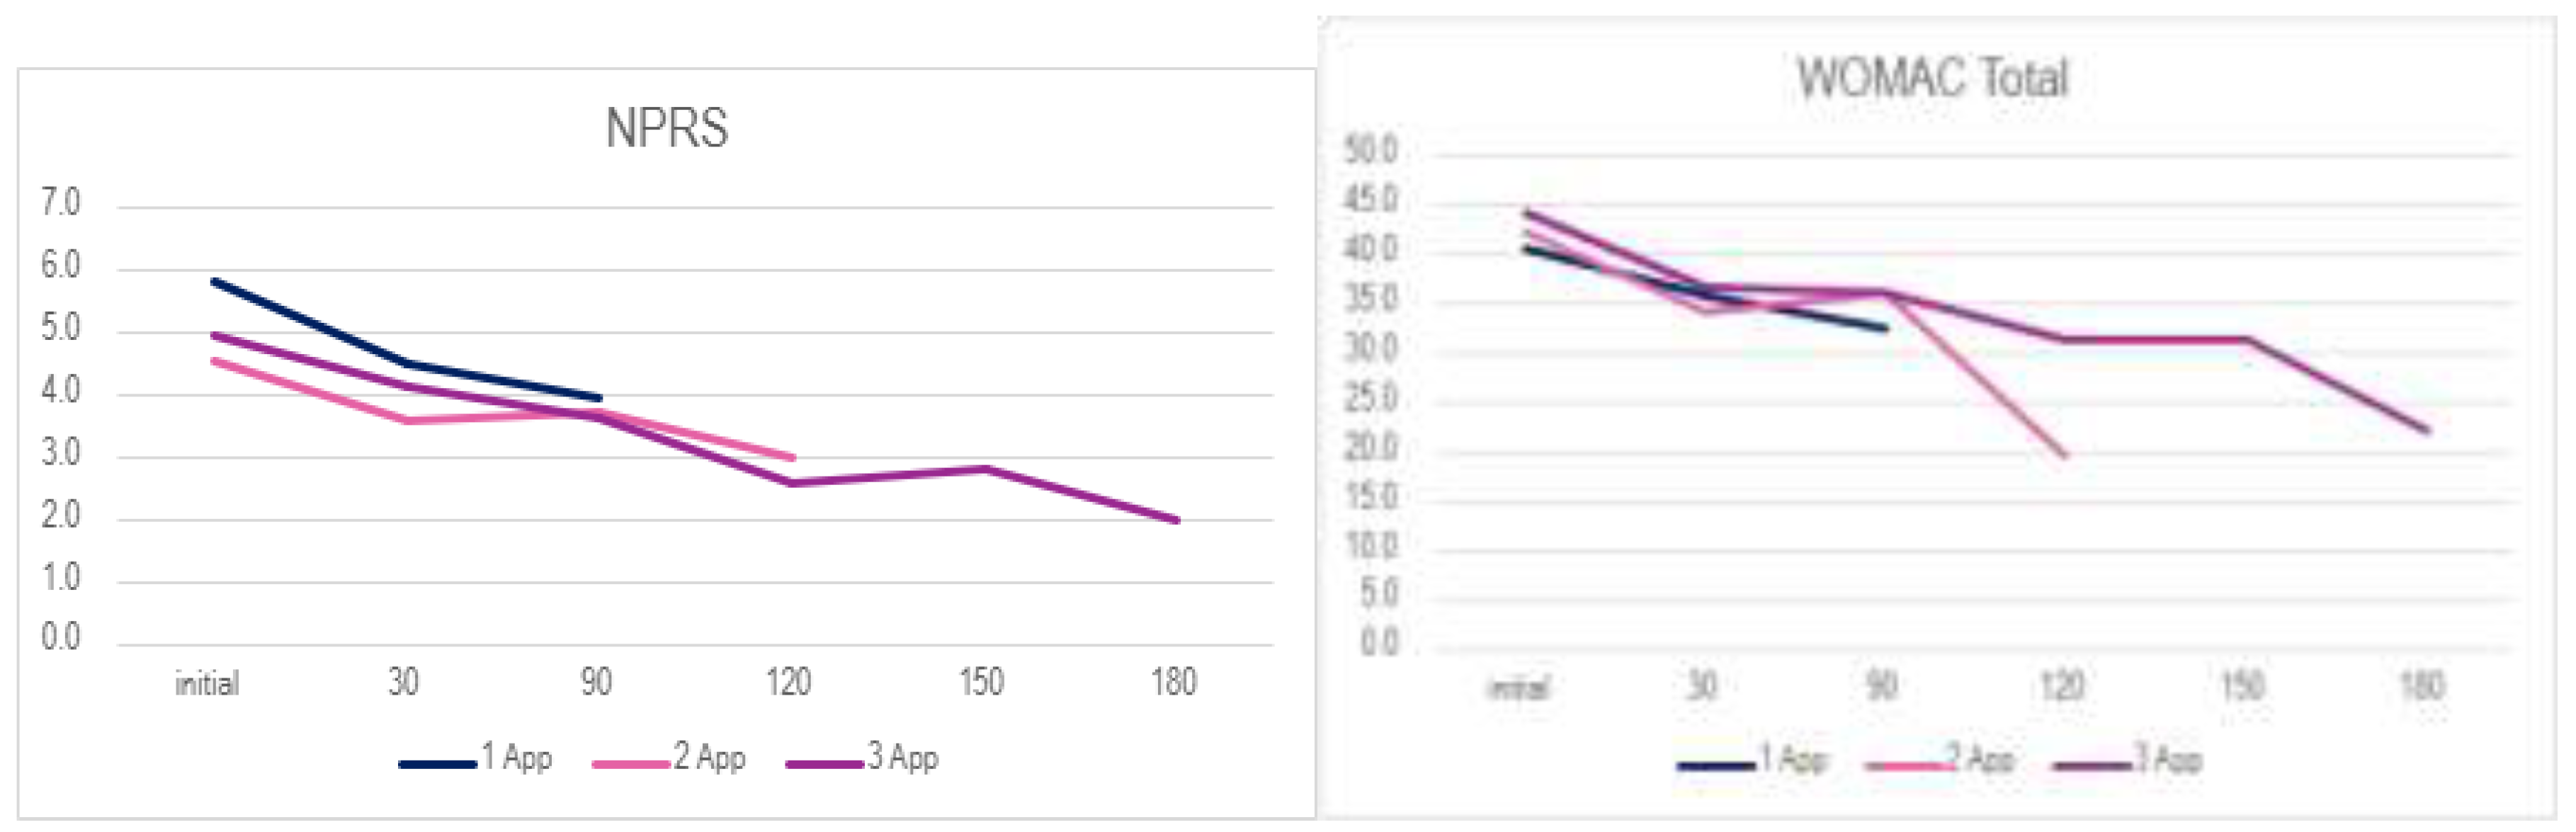
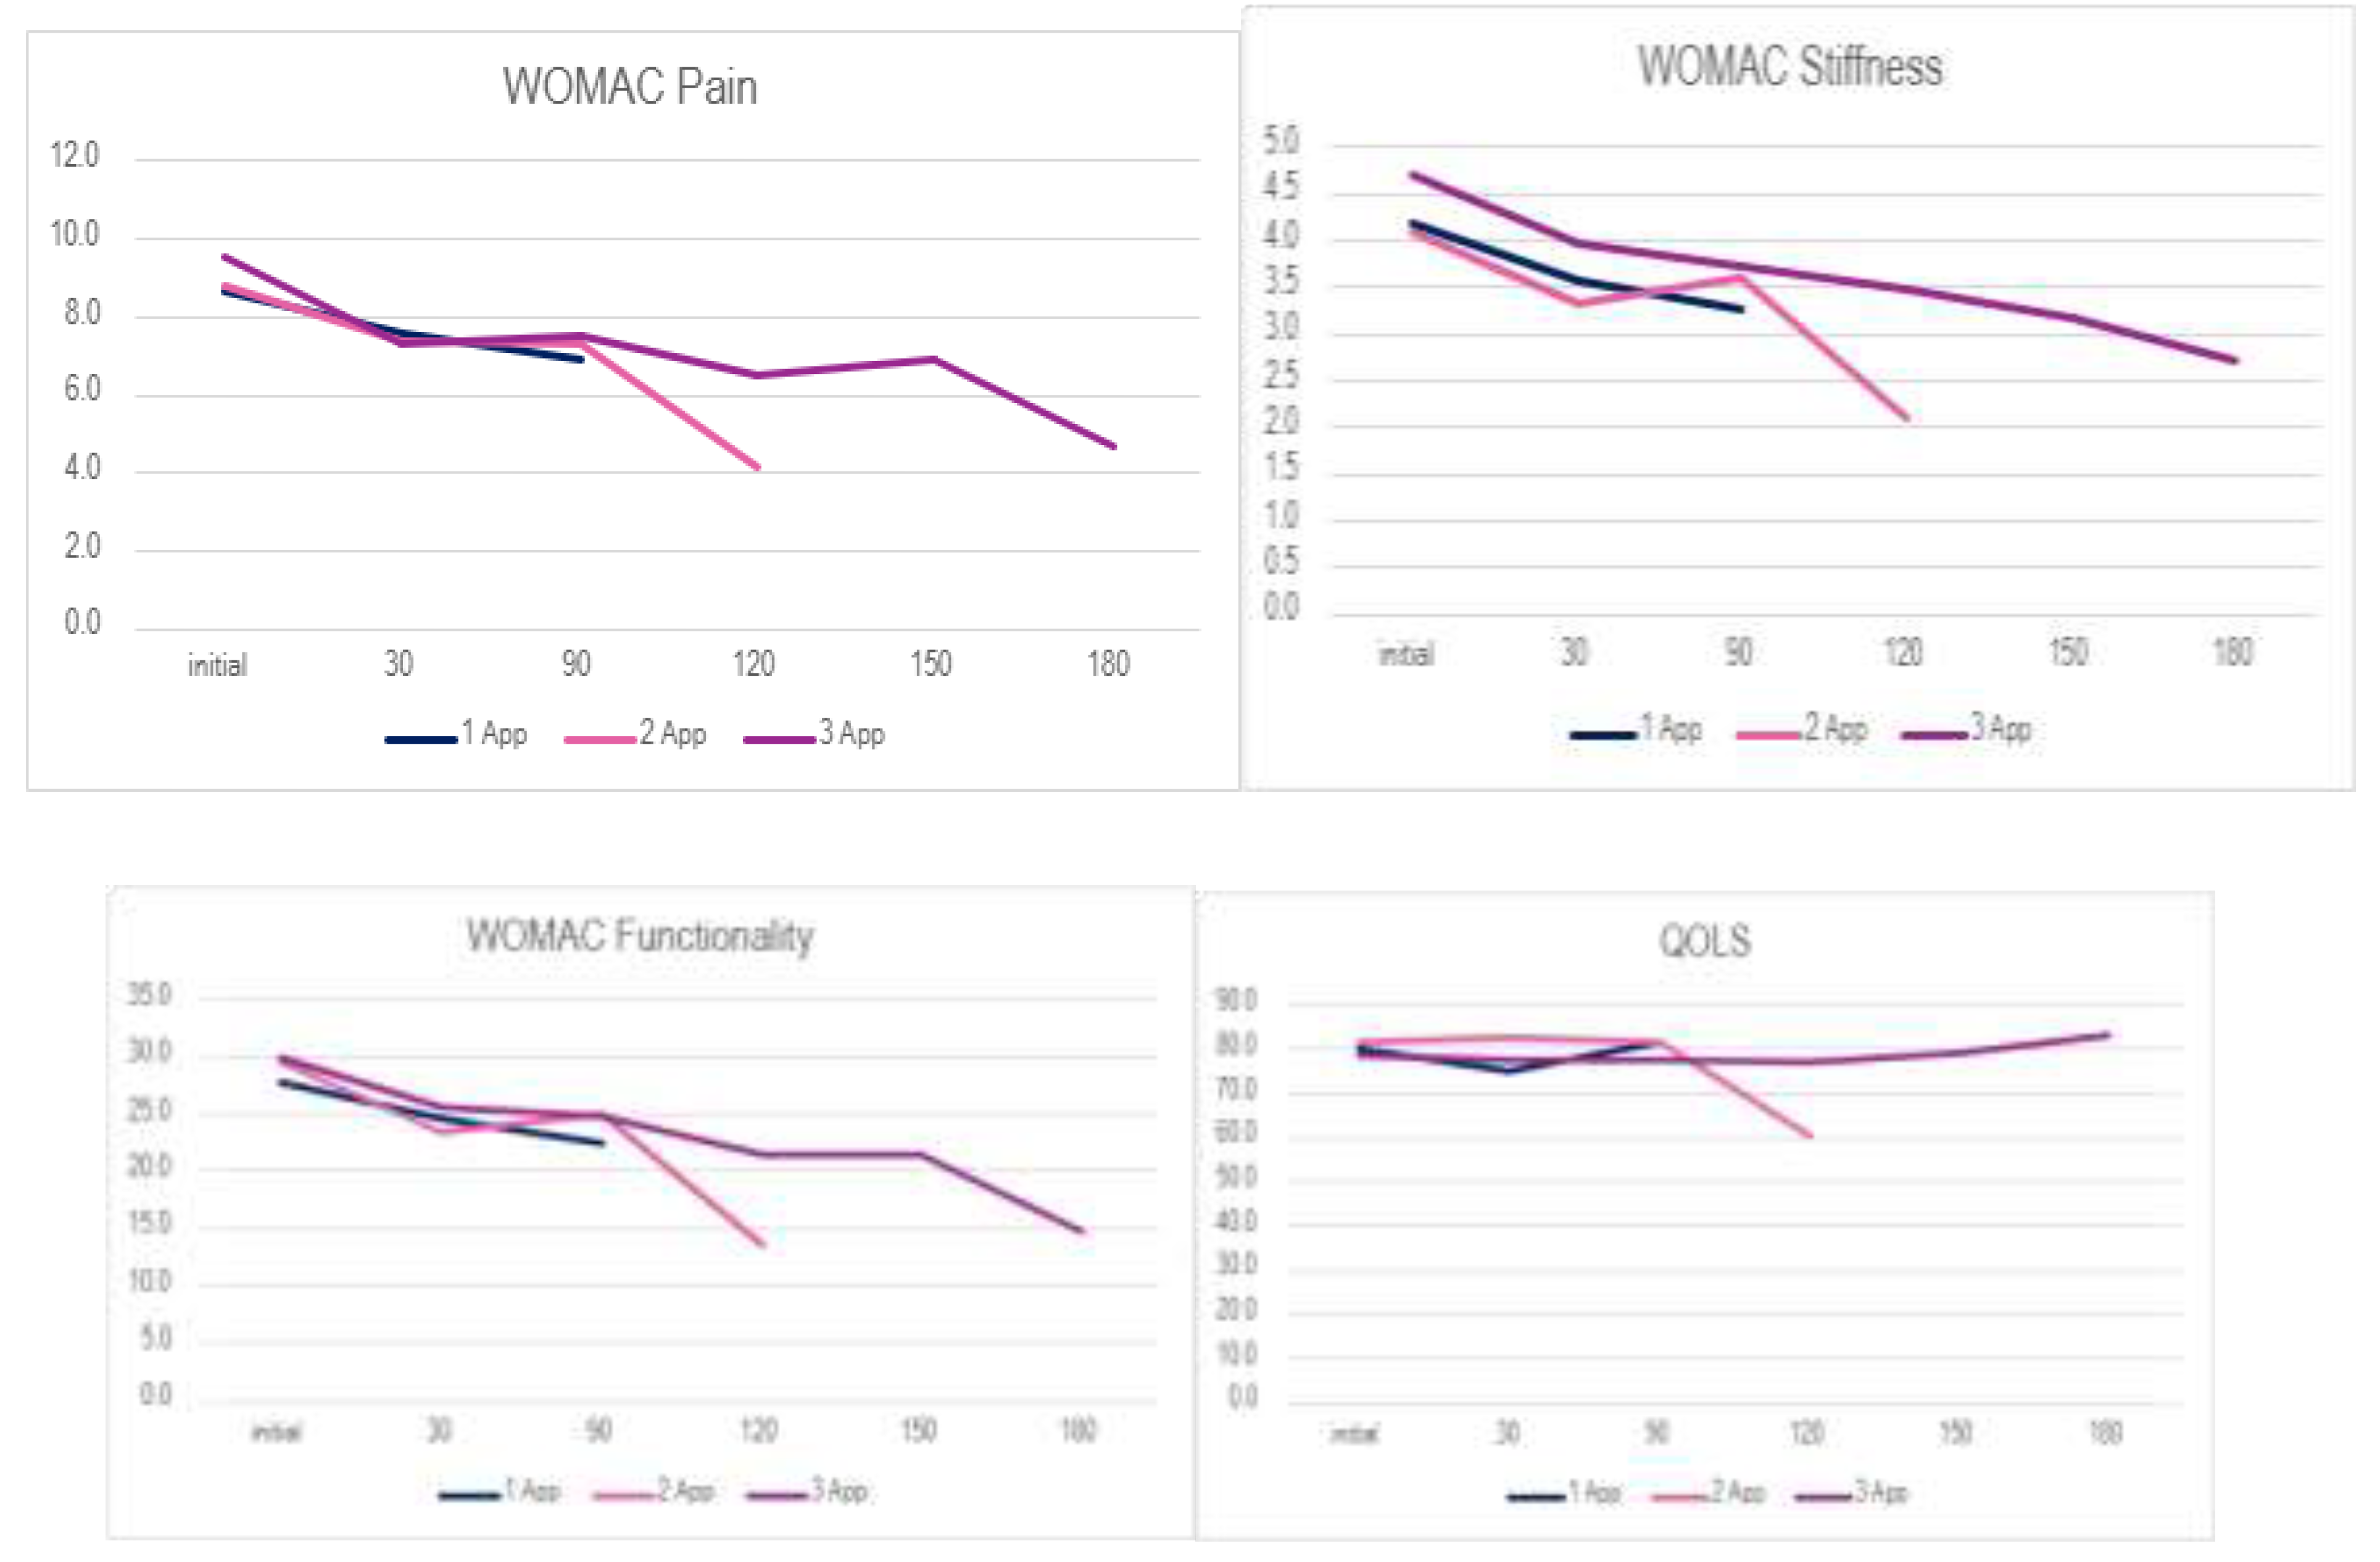
Figure 3.
Distribution of Change Scores Across Application Frequencies (Boxplots depict change scores (final minus initial) for DP, DS, DPF, and DW across participants receiving 1, 2, or 3 applications.).
Figure 3.
Distribution of Change Scores Across Application Frequencies (Boxplots depict change scores (final minus initial) for DP, DS, DPF, and DW across participants receiving 1, 2, or 3 applications.).
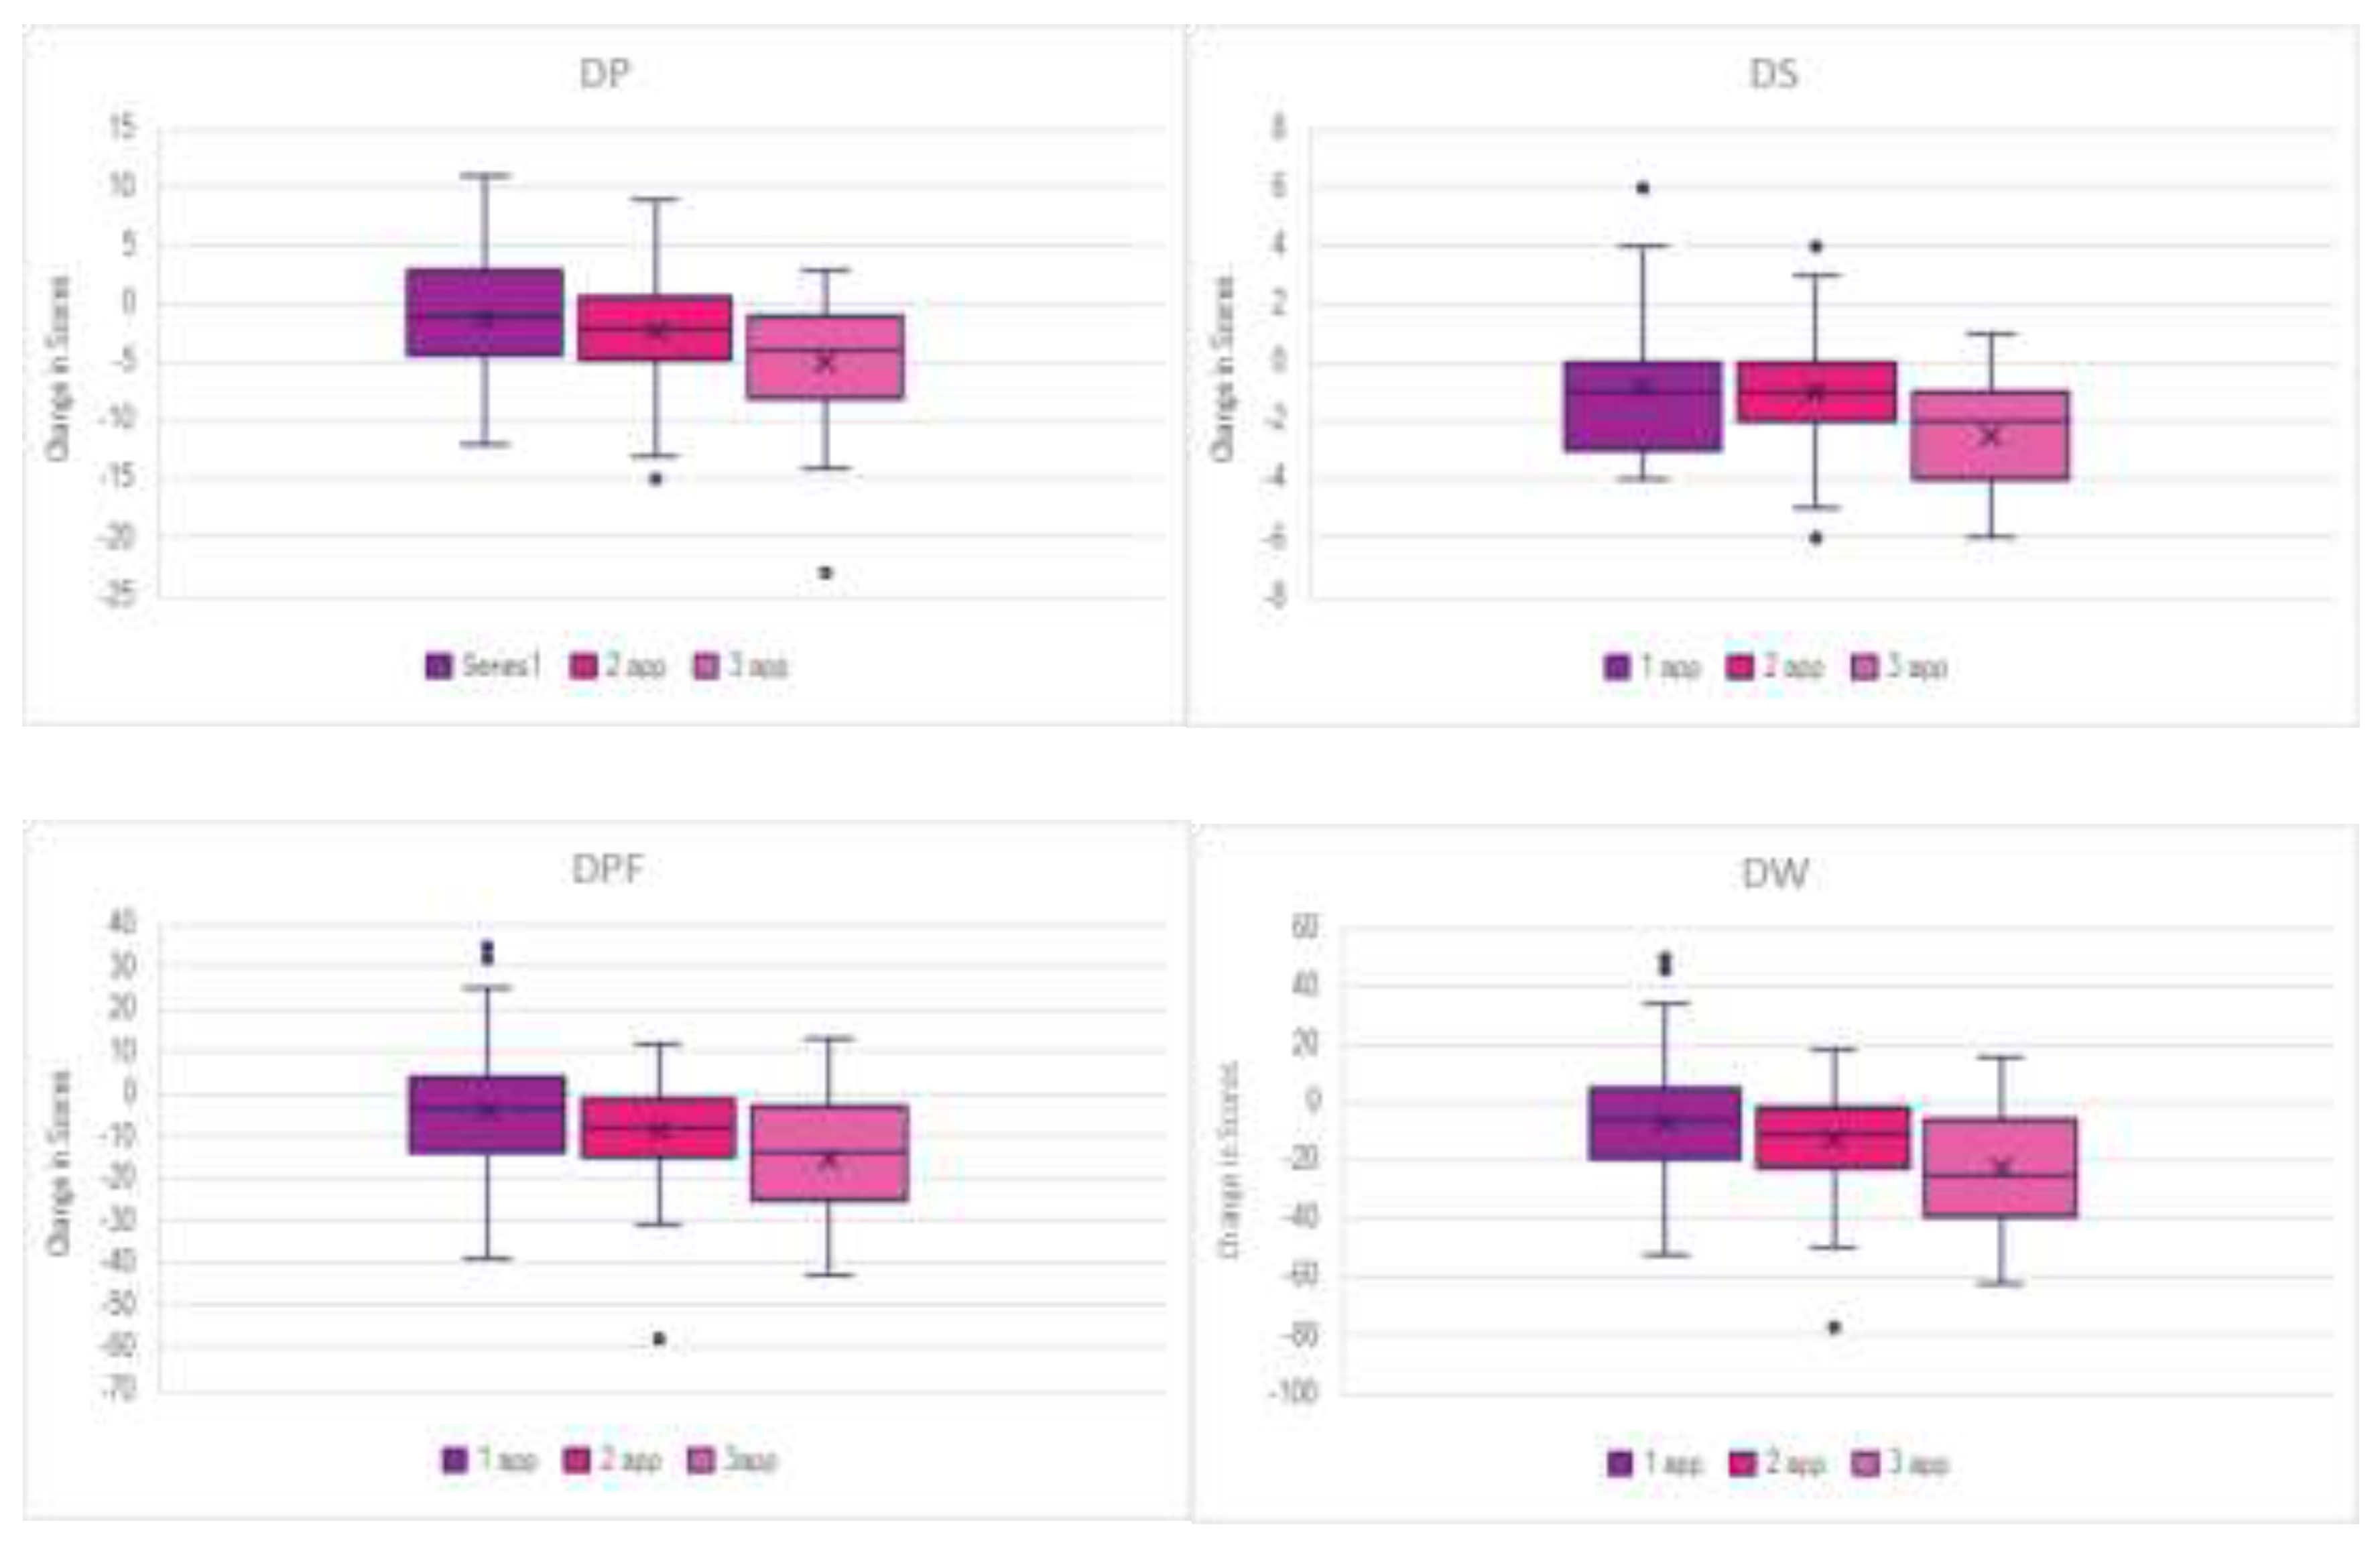
Table 1.
Patient age, BMI, and gender by application amount and their mean age and BMI for each application category.
Table 1.
Patient age, BMI, and gender by application amount and their mean age and BMI for each application category.
| Age Range | 1 app | 2 app | 3 app | total | BMI in range | 1 app | 2 app | 3 app | total |
| 20-29 | 0 | 0 | 0 | 0 | Underweight (<18.5) | 0 | 0 | 0 | 0 |
| 30-39 | 1 | 2 | 1 | 4 | Healthy weight (18.5-24.9) | 11 | 4 | 7 | 22 |
| 40-49 | 2 | 1 | 0 | 3 | Overweight (25.0-29.9) | 2 | 6 | 1 | 9 |
| 50-59 | 1 | 0 | 2 | 3 | Obese (>30.0) | 7 | 13 | 6 | 26 |
| 60-69 | 19 | 12 | 8 | 39 | NA* | 26 | 41 | 17 | 84 |
| 70-79 | 20 | 40 | 17 | 77 | Mean BMI | 27.53 | 29.29 | 27.78 | |
| 80-89 | 3 | 7 | 2 | 12 | Gender | 1 app | 2 app | 3 app | total |
| 90-99 | 0 | 2 | 1 | 3 | Male | 26 | 33 | 19 | 78 |
| NA* | 0 | 0 | 0 | 0 | Female | 20 | 30 | 12 | 62 |
| Mean Age | 69 | 72 | 70 | NA* | 0 | 1 | 0 | 1 |
* NA - patient did not report.
Table 2.
Percentage improvement in each scale by number of applications from the initial to the last data set reported.
Table 2.
Percentage improvement in each scale by number of applications from the initial to the last data set reported.
| Scale | 1 app | 2 app | 3 app |
| NPRS | 33.07% | 28.91% | 65.05% |
| WOMAC Total | 14.00% | 24.95% | 46.89% |
| Pain | 12.44% | 21.76% | 37.06% |
| Stiffness | 18.27% | 30.11% | 46.79% |
| Functionality | 13.84% | 28.23% | 45.77% |
| QOLS | -0.39% | 1.28% | 3.60% |
Table 3.
Tukey’s test for WOMAC and QOLS between intervals.
| Dosage | Measure | (I) Intervals | (J) Intervals | Mean Difference (I-J) | Std. Error | 95% Confidence Interval for Differencea | Sig.a | |
| Lower Bound | Upper Bound | |||||||
| Single Application | Pain | Initial | 30Day | .636 | .675 | -1.231 | 2.503 | 1.000 |
| 90Day | 1.364 | .732 | -.661 | 3.389 | .416 | |||
| Endpoint | 1.364 | .732 | -.661 | 3.389 | .416 | |||
| 30Day | Endpoint | .727 | .536 | -.754 | 2.209 | 1.000 | ||
| Stiffness | Initial | 30Day | .409 | .357 | -.577 | 1.395 | 1.000 | |
| 90Day | .818 | .343 | -.130 | 1.767 | .129 | |||
| Endpoint | .818 | .343 | -.130 | 1.767 | .129 | |||
| 30Day | Endpoint | .409 | .235 | -.241 | 1.060 | .535 | ||
| Functionality | Initial | 30Day | 1.523 | 2.128 | -4.363 | 7.408 | 1.000 | |
| 90Day | 4.386 | 2.441 | -2.364 | 11.137 | .476 | |||
| Endpoint | 4.386 | 2.441 | -2.364 | 11.137 | .476 | |||
| 30Day | Endpoint | 2.864 | 1.588 | -1.529 | 7.257 | .470 | ||
| WOMAC total | Initial | 30Day | 2.568 | 3.021 | -5.787 | 10.923 | 1.000 | |
| 90Day | 6.568 | 3.404 | -2.845 | 15.982 | .361 | |||
| Endpoint | 6.568 | 3.404 | -2.845 | 15.982 | .361 | |||
| 30Day | Endpoint | 4.000 | 2.247 | -2.215 | 10.215 | .493 | ||
| QOLS | Initial | 30Day | 5.932 | 2.498 | -.977 | 12.841 | .133 | |
| 90Day | 1.023 | 2.329 | -5.420 | 7.465 | 1.000 | |||
| Endpoint | 1.023 | 2.329 | -5.420 | 7.465 | 1.000 | |||
| 30Day | Endpoint | -4.909 | 2.191 | -10.969 | 1.151 | .182 | ||
| Double Application | Pain | Initial | 30Day | 1.469* | .405 | .367 | 2.571 | .003 |
| 90Day | 1.516* | .500 | .152 | 2.879 | .021 | |||
| Endpoint | 2.234* | .506 | .855 | 3.614 | <.001 | |||
| 30Day | Endpoint | .766 | .415 | -.366 | 1.897 | .420 | ||
| 90Day | Endpoint | .719* | .169 | .259 | 1.179 | <.001 | ||
| Stiffness | Initial | 30Day | .781* | .183 | .283 | 1.280 | <.001 | |
| 90Day | .500 | .237 | -.145 | 1.145 | .232 | |||
| Endpoint | .969* | .231 | .338 | 1.599 | <.001 | |||
| 30Day | Endpoint | .188 | .197 | -.348 | .723 | 1.000 | ||
| 90Day | Endpoint | .469* | .111 | .166 | .772 | <.001 | ||
| Functionality | Initial | 30Day | 6.359* | 1.155 | 3.214 | 9.505 | <.001 | |
| 90Day | 4.781* | 1.517 | .649 | 8.914 | .015 | |||
| Endpoint | 9.109* | 1.537 | 4.922 | 13.297 | <.001 | |||
| 30Day | Endpoint | 2.750 | 1.184 | -.476 | 5.976 | .141 | ||
| 90Day | Endpoint | 4.328* | .699 | 2.424 | 6.232 | <.001 | ||
| WOMAC total | Initial | 30Day | 8.609* | 1.586 | 4.290 | 12.929 | <.001 | |
| 90Day | 6.797* | 2.100 | 1.077 | 12.517 | .012 | |||
| Endpoint | 12.313* | 2.144 | 6.472 | 18.153 | <.001 | |||
| 30Day | Endpoint | 3.703 | 1.669 | -.843 | 8.250 | .181 | ||
| 90Day | Endpoint | 5.516* | .879 | 3.120 | 7.911 | <.001 | ||
| QOLS | Initial | 30Day | -.828 | 2.175 | -6.753 | 5.097 | 1.000 | |
| 90Day | .203 | 1.599 | -4.152 | 4.558 | 1.000 | |||
| Endpoint | -1.297 | 1.522 | -5.442 | 2.848 | 1.000 | |||
| 30Day | Endpoint | -.469 | 2.475 | -7.211 | 6.273 | 1.000 | ||
| 90Day | Endpoint | -1.500* | .527 | -2.934 | -.066 | .036 | ||
| Triple Application | Pain | Initial | 30Day | 2.226 | .793 | -.015 | 4.467 | .052 |
| 90Day | 2.000 | .810 | -.288 | 4.288 | .117 | |||
| Endpoint | 4.097* | .927 | 1.479 | 6.715 | <.001 | |||
| 30Day | Endpoint | 1.871* | .645 | .048 | 3.694 | .042 | ||
| 90Day | Endpoint | 2.097* | .405 | .952 | 3.241 | <.001 | ||
| Stiffness | Initial | 30Day | .742* | .254 | .025 | 1.459 | .039 | |
| 90Day | .968* | .339 | .010 | 1.926 | .047 | |||
| Endpoint | 1.613* | .509 | .174 | 3.052 | .021 | |||
| 30Day | Endpoint | .871 | .538 | -.650 | 2.392 | .697 | ||
| 90Day | Endpoint | .645 | .441 | -.601 | 1.892 | .925 | ||
| Functionality | Initial | 30Day | 4.484* | 1.555 | .092 | 8.875 | .043 | |
| 90Day | 5.161 | 2.000 | -.488 | 10.811 | .090 | |||
| Endpoint | 12.129* | 2.335 | 5.533 | 18.725 | <.001 | |||
| 30Day | Endpoint | 7.645* | 2.110 | 1.685 | 13.606 | .006 | ||
| 90Day | Endpoint | 6.968* | 1.213 | 3.541 | 10.395 | <.001 | ||
| WOMACtotal | Initial | 30Day | 7.452* | 2.238 | 1.129 | 13.774 | .014 | |
| 90Day | 8.129* | 2.771 | .303 | 15.955 | .038 | |||
| Endpoint | 17.839* | 3.294 | 8.535 | 27.142 | <.001 | |||
| 30Day | Endpoint | 10.387* | 3.047 | 1.780 | 18.994 | .011 | ||
| 90Day | Endpoint | 9.710* | 1.728 | 4.827 | 14.592 | <.001 | ||
| QOLS | Initial | 30Day | .839 | 1.679 | -3.903 | 5.580 | 1.000 | |
| 90Day | .742 | 2.556 | -6.479 | 7.963 | 1.000 | |||
| Endpoint | -1.161 | 2.136 | -7.196 | 4.873 | 1.000 | |||
| 30Day | Endpoint | -2.000 | 2.545 | -9.190 | 5.190 | 1.000 | ||
| 90Day | Endpoint | -1.903 | 2.086 | -7.797 | 3.990 | 1.000 | ||
| Based on estimated marginal means | ||||||||
| *. The mean difference is significant at the .05 level. | ||||||||
| a. Adjustment for multiple comparisons: Bonferroni. | ||||||||
Table 4.
Results of Bonferroni-adjusted pairwise comparisons following MANOVA for dosage groups (single, double, and triple applications) across all scale measures for initial (1), final (F), and difference between initial and final visits (D).
Table 4.
Results of Bonferroni-adjusted pairwise comparisons following MANOVA for dosage groups (single, double, and triple applications) across all scale measures for initial (1), final (F), and difference between initial and final visits (D).
| Multiple Comparisons | |||||||
| Bonferroni | |||||||
| Dependent Variable | (I) Dosage | (J) Dosage | Mean Difference (I-J) | Std. Error | Sig. | 95% Confidence Interval | |
| Lower Bound | Upper Bound | ||||||
| NPRS1 | Single Application | Double Application | 2.5116* | .61430 | <.001 | 1.0136 | 4.0096 |
| Triple Application | 2.4444* | .78026 | .007 | .5418 | 4.3471 | ||
| Double Application | Triple Application | -.0672 | .75146 | 1.000 | -1.8996 | 1.7653 | |
| P1 | Single Application | Double Application | 2.2811 | 1.13862 | .144 | -.4955 | 5.0577 |
| Triple Application | 1.7320 | 1.44622 | .702 | -1.7946 | 5.2587 | ||
| Double Application | Triple Application | -.5491 | 1.39284 | 1.000 | -3.9456 | 2.8474 | |
| S1 | Single Application | Double Application | 1.0356 | .49179 | .114 | -.1637 | 2.2348 |
| Triple Application | .7810 | .62464 | .643 | -.7422 | 2.3043 | ||
| Double Application | Triple Application | -.2545 | .60159 | 1.000 | -1.7215 | 1.2125 | |
| PF1 | Single Application | Double Application | 4.3379 | 3.40301 | .617 | -3.9605 | 12.6363 |
| Triple Application | 5.4477 | 4.32232 | .632 | -5.0925 | 15.9879 | ||
| Double Application | Triple Application | 1.1098 | 4.16280 | 1.000 | -9.0413 | 11.2610 | |
| W1 | Single Application | Double Application | 7.6546 | 4.81886 | .347 | -4.0964 | 19.4056 |
| Triple Application | 7.9608 | 6.12066 | .590 | -6.9647 | 22.8863 | ||
| Double Application | Triple Application | .3062 | 5.89477 | 1.000 | -14.0684 | 14.6808 | |
| Q1 | Single Application | Double Application | -4.4364 | 4.11548 | .852 | -14.4721 | 5.5994 |
| Triple Application | -4.4183 | 5.22726 | 1.000 | -17.1652 | 8.3286 | ||
| Double Application | Triple Application | .0181 | 5.03434 | 1.000 | -12.2584 | 12.2945 | |
| FNPRS | Single Application | Double Application | 1.0971 | .56362 | .164 | -.2773 | 2.4715 |
| Triple Application | 2.2974* | .71588 | .005 | .5517 | 4.0431 | ||
| Double Application | Triple Application | 1.2003 | .68946 | .255 | -.4810 | 2.8815 | |
| FP | Single Application | Double Application | 2.5643* | .92347 | .020 | .3124 | 4.8162 |
| Triple Application | 4.0294* | 1.17294 | .003 | 1.1691 | 6.8897 | ||
| Double Application | Triple Application | 1.4651 | 1.12965 | .594 | -1.2896 | 4.2198 | |
| FS | Single Application | Double Application | 1.0527* | .38547 | .023 | .1127 | 1.9927 |
| Triple Application | 1.7516* | .48961 | .002 | .5577 | 2.9456 | ||
| Double Application | Triple Application | .6990 | .47154 | .425 | -.4509 | 1.8488 | |
| FPF | Single Application | Double Application | 7.8372* | 2.95158 | .028 | .6397 | 15.0348 |
| Triple Application | 12.0000* | 3.74894 | .006 | 2.8580 | 21.1420 | ||
| Double Application | Triple Application | 4.1628 | 3.61058 | .756 | -4.6418 | 12.9673 | |
| FW | Single Application | Double Application | 11.4542* | 4.16950 | .022 | 1.2867 | 21.6217 |
| Triple Application | 17.7810* | 5.29588 | .003 | 4.8668 | 30.6953 | ||
| Double Application | Triple Application | 6.3269 | 5.10043 | .654 | -6.1107 | 18.7645 | |
| FQ | Single Application | Double Application | -6.1108 | 3.89426 | .360 | -15.6071 | 3.3855 |
| Triple Application | -6.4183 | 4.94628 | .593 | -18.4800 | 5.6434 | ||
| Double Application | Triple Application | -.3075 | 4.76373 | 1.000 | -11.9241 | 11.3091 | |
| DNPRS | Single Application | Double Application | -1.4145 | .68028 | .121 | -3.0734 | .2444 |
| Triple Application | .4085 | .86405 | 1.000 | -1.6985 | 2.5155 | ||
| Double Application | Triple Application | 1.8230 | .83216 | .093 | -.2063 | 3.8523 | |
| DP | Single Application | Double Application | .2832 | 1.10968 | 1.000 | -2.4228 | 2.9892 |
| Triple Application | 3.7974* | 1.40946 | .025 | .3604 | 7.2344 | ||
| Double Application | Triple Application | 3.5142* | 1.35744 | .034 | .2040 | 6.8244 | |
| DS | Single Application | Double Application | .0171 | .45679 | 1.000 | -1.0968 | 1.1310 |
| Triple Application | 1.6928* | .58020 | .013 | .2780 | 3.1076 | ||
| Double Application | Triple Application | 1.6757* | .55878 | .010 | .3131 | 3.0383 | |
| DPF | Single Application | Double Application | 3.4993 | 3.29168 | .872 | -4.5276 | 11.5262 |
| Triple Application | 12.4967* | 4.18092 | .011 | 2.3014 | 22.6921 | ||
| Double Application | Triple Application | 8.9974 | 4.02662 | .084 | -.8217 | 18.8165 | |
| DW | Single Application | Double Application | 3.7996 | 4.60737 | 1.000 | -7.4357 | 15.0349 |
| Triple Application | 17.9869* | 5.85204 | .008 | 3.7165 | 32.2574 | ||
| Double Application | Triple Application | 14.1873* | 5.63606 | .041 | .4436 | 27.9311 | |
| DQ | Single Application | Double Application | -1.6744 | 4.08963 | 1.000 | -11.6472 | 8.2983 |
| Triple Application | 8.6667 | 5.19443 | .296 | -4.0002 | 21.3335 | ||
| Double Application | Triple Application | 10.3411 | 5.00273 | .125 | -1.8583 | 22.5404 | |
| Key: NPRS: Numerical Pain Rating Scale, P: WOMAC—Pain, S: WOMAC—Stiffness, PF: WOMAC—Physical Function, W: WOMAC—Total, Q: Quality of life scale, 1: Initial Visit, F: Last Visit, D: Difference (Final - Initial) Based on observed means. The error term is Mean Squared (Error) = 195.083. *. The mean difference is significant at the .05 level. | |||||||
Table 5.
Outcome ranges for WOMAC outcome domains across the single application group.
| Scale | Best Response (Max Δ) | Worst Response (Min Δ) | Mean Change (Δ) | Outcome Range (Δ) |
| WOMAC Total | -52 | 50 | -6.17 | 102 |
| Pain | -12 | 11 | -1.17 | 23 |
| Stiffness | -4 | 6 | -0.83 | 10 |
| Functionality | -39 | 35 | -4.17 | 74 |
Table 6.
Outcome ranges for WOMAC outcome domains across the double application group.
| Scale | Best Response (Max Δ) | Worst Response (Min Δ) | Mean Change (Δ) | Outcome Range (Δ) |
| WOMAC Total | -77 | 18 | -12 | 95 |
| Pain | -15 | 9 | -2.17 | 24 |
| Stiffness | -6 | 4 | -0.95 | 10 |
| Functionality | -58 | 12 | -8.88 | 70 |
Table 7.
Outcome ranges for WOMAC outcome domains across the triple application group.
| Scale | Best Response (Max Δ) | Worst Response (Min Δ) | Mean Change (Δ) | Outcome Range (Δ) |
| WOMAC Total | -62 | 16 | -22.52 | 78 |
| Pain | -23 | 3 | -4.94 | 26 |
| Stiffness | -6 | 1 | -2.13 | 7 |
| Functionality | -43 | 13 | -15.45 | 56 |
Table 8.
Results of the univariate analysis of variance (ANOVA) for the overall chance in total WOMAC scores (DW), examining the effects of dosage, age category, BMI category, and gender.
Table 8.
Results of the univariate analysis of variance (ANOVA) for the overall chance in total WOMAC scores (DW), examining the effects of dosage, age category, BMI category, and gender.
| Tests of Between-Subjects Effects | |||||
| Dependent Variable: DW | |||||
| Source | Type III Sum of Squares | df | Mean Square | F | Sig. |
| Corrected Model | 8299.056a | 10 | 829.906 | 2.354 | .023 |
| Intercept | 4097.082 | 1 | 4097.082 | 11.619 | .001 |
| Dosage | 3461.125 | 2 | 1730.563 | 4.908 | .011 |
| Age_Category | 1097.739 | 5 | 219.548 | .623 | .683 |
| BMI_category | 2193.995 | 2 | 1096.998 | 3.111 | .053 |
| Gender | 191.650 | 1 | 191.650 | .544 | .464 |
| Error | 17277.927 | 49 | 352.611 | ||
| Total | 39653.000 | 60 | |||
| Corrected Total | 25576.983 | 59 | |||
| a. R Squared = .324 (Adjusted R Squared = .187) | |||||
Table 9.
Pairwise comparisons of overall changes in total WOMAC scores across dosage groups with Bonferroni adjustment. .
Table 9.
Pairwise comparisons of overall changes in total WOMAC scores across dosage groups with Bonferroni adjustment. .
| Bootstrap for Pairwise Comparisons | |||||||
| Dependent Variable: DW | |||||||
| (I) Dosage | (J) Dosage | Mean Difference (I-J) | Bootstrapa | ||||
| Bias | Std. Error | Sig. (2-tailed) | BCa 95% Confidence Interval | ||||
| Lower | Upper | ||||||
| Single Application | Double Application | -1.335 | -.045 | 5.780 | .819 | -12.683 | 10.100 |
| Triple Application | 16.860 | -.508 | 6.859 | .023 | 3.622 | 28.470 | |
| Double Application | Triple Application | 18.196 | -.463 | 6.669 | .008 | 5.394 | 29.625 |
| a. Unless otherwise noted, bootstrap results are based on 3000 bootstrap samples | |||||||
Table 10.
Pairwise comparisons of overall changes in total WOMAC scores across BMI categories with Bonferroni adjustment.
Table 10.
Pairwise comparisons of overall changes in total WOMAC scores across BMI categories with Bonferroni adjustment.
| Bootstrap for Pairwise Comparisons | |||||||
| Dependent Variable: DW | |||||||
| (I) BMI_category | (J) BMI_category | Mean Difference (I-J) | Bootstrapa | ||||
| Bias | Std. Error | Sig. (2-tailed) | BCa 95% Confidence Interval | ||||
| Lower | Upper | ||||||
| Healthy Weight | Overweight | 6.537 | -.705b | 7.503b | .367b | -7.260b | 17.998b |
| Obese | 15.078 | -.232 | 7.029 | .042 | 1.541 | 28.293 | |
| Overweight | Obese | 8.541 | .474b | 6.491b | .190b | -4.396b | 24.429b |
| a. Unless otherwise noted, bootstrap results are based on 3000 bootstrap samples | |||||||
| b. Based on 2998 samples | |||||||
Table 11.
Pairwise comparisons of overall changes in total WOMAC scores across age categories with Bonferroni adjustment.
Table 11.
Pairwise comparisons of overall changes in total WOMAC scores across age categories with Bonferroni adjustment.
| Bootstrap for Pairwise Comparisons | |||||||
| Dependent Variable: DW | |||||||
| (I) Age_Category | (J) Age_Category | Mean Difference (I-J) | Bootstrapa | ||||
| Bias | Std. Error | Sig. (2-tailed) | BCa 95% Confidence Interval | ||||
| Lower | Upper | ||||||
| 30-39 | 40-49 | -16.374 | -.289b | 8.817b | .130b | -34.249b,c | .359b |
| 60-69 | -19.347 | -.009d | 8.499d | .033d | -35.800d | -2.752d | |
| 70-79 | -14.279 | .133d | 6.204d | .038d | -25.769d | -.925d | |
| 80-89 | -19.238 | -.659e | 10.370e | .064e | -38.940e | -1.216e | |
| 90-99 | -16.155 | .596f | 7.208f | .028f | -28.325c,f | .354f | |
| 40-49 | 60-69 | -2.972 | .176g | 9.280g | .784g | -20.985c,g | 15.801g |
| 70-79 | 2.095 | .479g | 6.956g | .830g | -10.357c,g | 16.858g | |
| 80-89 | -2.864 | -.256h | 7.100h | .730h | -14.766c,h | 12.930h | |
| 90-99 | .219 | 1.089i | 9.400i | .989i | -16.483c,i | 20.112i | |
| 60-69 | 70-79 | 5.068 | .177 | 8.008 | .519 | -10.503 | 21.985 |
| 80-89 | .109 | -.631j | 11.483j | .992j | -22.112j | 20.630j | |
| 90-99 | 3.192 | .662k | 10.332k | .742k | -15.823c,k | 25.163k | |
| 70-79 | 80-89 | -4.959 | -.807j | 9.023j | .595j | -22.210j | 9.760j |
| 90-99 | -1.876 | .437k | 6.612k | .758k | -13.612c,k | 12.699k | |
| 80-89 | 90-99 | 3.083 | 1.271l | 10.574l | .764l | -15.042c,l | 25.063l |
| a. Unless otherwise noted, bootstrap results are based on 3000 bootstrap samples | |||||||
| b. Based on 1883 samples | |||||||
| c. Some results could not be computed from jackknife samples, so this confidence interval is computed by the percentile method rather than the BCa method. | |||||||
| d. Based on 2946 samples | |||||||
| e. Based on 2937 samples | |||||||
| f. Based on 2819 samples | |||||||
| g. Based on 1912 samples | |||||||
| h. Based on 1906 samples | |||||||
| i. Based on 1828 samples | |||||||
| j. Based on 2991 samples | |||||||
| k. Based on 2871 samples | |||||||
| l. Based on 2862 samples | |||||||
Table 12.
Pairwise comparisons of overall changes in total WOMAC scores in gender (male and female) with Bonferroni adjustment.
Table 12.
Pairwise comparisons of overall changes in total WOMAC scores in gender (male and female) with Bonferroni adjustment.
| Bootstrap for Pairwise Comparisons | |||||||
| Dependent Variable: DW | |||||||
| (I) Gender | (J) Gender | Mean Difference (I-J) | Bootstrapa | ||||
| Bias | Std. Error | Sig. (2-tailed) | BCa 95% Confidence Interval | ||||
| Lower | Upper | ||||||
| Male | Female | 4.053 | -.054 | 6.324 | .521 | -8.312 | 16.649 |
| a. Unless otherwise noted, bootstrap results are based on 3000 bootstrap samples | |||||||
Disclaimer/Publisher’s Note: The statements, opinions and data contained in all publications are solely those of the individual author(s) and contributor(s) and not of MDPI and/or the editor(s). MDPI and/or the editor(s) disclaim responsibility for any injury to people or property resulting from any ideas, methods, instructions or products referred to in the content. |
© 2026 by the authors. Licensee MDPI, Basel, Switzerland. This article is an open access article distributed under the terms and conditions of the Creative Commons Attribution (CC BY) license (http://creativecommons.org/licenses/by/4.0/).
Copyright: This open access article is published under a Creative Commons CC BY 4.0 license, which permit the free download, distribution, and reuse, provided that the author and preprint are cited in any reuse.


