
Submitted:
28 February 2026
Posted:
28 February 2026
You are already at the latest version
Abstract
Social sustainability, encompassing equitable development, livable urban construction, and inclusive social governance, has become a core dimension of sustainable development goals (SDGs) and urban planning practice in the context of rapid urbanization. Taking the Yangtze River Delta (YRD) urban agglomeration—the most economically developed and urbanized region in China—as the study area, this research constructed a comprehensive evaluation index system of social sustainability from three dimensions: equitable resource allocation, livable urban environment, and inclusive social development. Based on multi-source data from 2010 to 2020 (including socioeconomic statistics, remote sensing imagery, and open geospatial data), the entropy weight-TOPSIS model was used to measure the spatiotemporal evolution characteristics of social sustainability in the YRD. Additionally, the GeoDetector model was employed to identify the key driving factors and their interactive effects on the spatial differentiation of social sustainability, and the future development trends of social sustainability under three scenarios (urban expansion, ecological priority, and coordinated development) were predicted using the PLUS model. The results showed that the overall social sustainability of the YRD presented a steady upward trend from 2010 to 2020, with a spatial pattern of "high in the core, low in the periphery" and significant inter-city disparities. Equitable resource allocation was the primary constraint on social sustainability in peripheral cities, while livable urban environment was the main advantage of core cities such as Shanghai, Nanjing, and Hangzhou. The driving factor detection indicated that per capita GDP, urban green space rate, and the number of medical and educational institutions per 10,000 people were the top three key factors affecting social sustainability, with the interactive effect of any two factors showing a dual-factor enhancement pattern. Under the coordinated development scenario, the social sustainability of the YRD will achieve the most balanced and high-quality growth by 2030, with the peripheral cities narrowing the development gap with the core cities significantly. These findings imply that future urban development in the YRD should adhere to the concept of coordinated and inclusive development, optimize the spatial allocation of public resources, and promote the integrated construction of livable cities, so as to realize the high-quality social sustainability of the urban agglomeration. This study provides a quantitative method and empirical reference for the evaluation and optimization of social sustainability in China’s urban agglomerations and even in other rapidly urbanizing regions worldwide.
Keywords:
social sustainability
; equitable development
; sustainable city
; urban agglomeration
; spatiotemporal evolution
; Yangtze River Delta
1. Introduction
1.1. Research Background
Sustainable development, as a global development strategy, consists of three interdependent and mutually restrictive dimensions: economic, ecological, and social sustainability [1]. In the early stage of urbanization, most countries and regions focused on economic growth and ecological protection, while social sustainability was relatively neglected [2]. With the deepening of urbanization, a series of social problems such as uneven distribution of public resources, urban-rural income gap, and deterioration of living environment have become prominent, which have severely restricted the high-quality development of cities and the realization of SDGs [3]. Social sustainability, which takes equity, livability, and inclusion as the core connotations, aims to build a social system that meets the needs of current residents without compromising the ability of future generations to meet their own needs, and has gradually become the focus of academic research and urban governance practice [4].
China is in the critical stage of transitioning from rapid urbanization to high-quality urbanization. By 2023, China’s urbanization rate has reached 66.16%, and urban agglomerations have become the main spatial carrier of urbanization development [5]. However, the unbalanced and inadequate development of urban agglomerations is still prominent: the core cities gather a large number of high-quality public resources such as education, medical care, and culture, while the peripheral cities face the problems of resource shortage, talent loss, and low urban livability [6]. The Yangtze River Delta (YRD) urban agglomeration, as a national strategic hub of China’s economic and social development, has the characteristics of high urbanization level, dense population, and close economic ties, and its social sustainability development level is a typical representative of China’s urban agglomerations [7]. Exploring the spatiotemporal evolution characteristics and driving mechanisms of social sustainability in the YRD is of great significance for promoting the integrated development of urban agglomerations, narrowing the urban-rural and inter-city development gaps, and realizing the goal of “people-centered” urbanization.
1.2. Research Progress
International research on social sustainability originated in the 1980s, and scholars have carried out in-depth research on its connotation, evaluation index system, and measurement methods. The early research focused on the definition of the connotation of social sustainability, and the International Union for Conservation of Nature (IUCN) pointed out that social sustainability should include social equity, cultural diversity, and social cohesion [8]. In the follow-up research, scholars constructed different evaluation index systems from different perspectives: for example, Dempsey et al. [9] built an index system from the dimensions of social equity, quality of life, and social capital; while Sharifi and Murayama [10] focused on urban physical space and constructed an evaluation system including housing, transportation, and public services. In terms of measurement methods, the main methods used in existing studies are the comprehensive index method, fuzzy comprehensive evaluation method, and principal component analysis method [11].
Domestic research on social sustainability started relatively late, and the research content is mainly focused on the evaluation of social sustainability in a single city, and the research on urban agglomerations is relatively insufficient. For example, some scholars measured the social sustainability of Beijing, Shanghai, and other megacities from the perspectives of public service supply and urban livability [12]; others analyzed the coupling coordination relationship between social sustainability and economic-ecological sustainability in the Pearl River Delta urban agglomeration [13]. In terms of driving factors, existing studies mostly focus on the single impact of economic development, urbanization level, and policy factors, and lack an in-depth analysis of the interactive effect of multiple factors [14]. In addition, most studies focus on the historical evolution of social sustainability, and the prediction of future development trends under different scenarios is relatively scarce [15].
1.3. Research Objectives and Framework
Aiming at the deficiencies of existing research, this study takes the YRD urban agglomeration as the research area, and the main research objectives are: (1) Construct a comprehensive evaluation index system of social sustainability suitable for China’s urban agglomerations; (2) Analyze the spatiotemporal evolution characteristics and spatial differentiation pattern of social sustainability in the YRD from 2010 to 2020; (3) Identify the key driving factors of social sustainability and their interactive effects; (4) Predict the development trend of social sustainability under different scenarios and put forward targeted optimization strategies.
The research framework of this paper is as follows: first, sort out the relevant research progress of social sustainability and construct the evaluation index system; second, collect and process multi-source data, and use the entropy weight-TOPSIS model to measure the social sustainability level of the YRD; third, use spatial analysis methods to analyze its spatiotemporal evolution characteristics, and use the GeoDetector model to identify the key driving factors; fourth, use the PLUS model to predict the social sustainability under three scenarios; finally, put forward the optimization strategy of social sustainability development in the YRD based on the research results.
2. Materials and Methods
2.1. Study Area
The Yangtze River Delta urban agglomeration is located in the eastern coastal area of China (30°05′–33°20′N, 115°46′–122°10′E), covering 27 cities in Shanghai, Jiangsu Province, Zhejiang Province, and Anhui Province, with a total land area of about 358,000 square kilometers (Figure 1). As the most economically developed, most densely populated, and most open urban agglomeration in China, the YRD has a GDP of 30.2 trillion yuan in 2020, accounting for 28.2% of China’s total GDP, and an urbanization rate of 68.5%, which is far higher than the national average. The YRD is in the critical stage of integrated development, and the core cities (Shanghai, Nanjing, Hangzhou, Hefei) have strong radiation-driven capacity, but the development gap between the core and peripheral cities is still obvious, which is a typical research area for studying the social sustainability of urban agglomerations.
2.2. Data Sources
The research data used in this paper are multi-source data from 2010 to 2020, including socioeconomic statistical data, geospatial data, and remote sensing monitoring data, and all data are standardized and processed to ensure consistency and accuracy (Table 1). The specific data sources are as follows:
1.Socioeconomic statistical data: Derived from China City Statistical Yearbook (2011–2021), Jiangsu Statistical Yearbook, Zhejiang Statistical Yearbook, Anhui Statistical Yearbook, and the statistical bulletins of national economic and social development of each city, including indicators such as per capita GDP, disposable income of urban and rural residents, and the number of medical and educational institutions.
2.Geospatial data: Derived from the Resource and Environmental Science Data Platform(https://www.resdc.cn/)and Open Street Map (https://www.openstreetmap.org/), including urban built-up area, road network, and urban green space data.
3.Remote sensing monitoring data: Derived from the Geospatial Data Cloud (http://www.gscloud.cn/), including nighttime light data (NPP-VIIRS) and land use/cover data, used to characterize urban development intensity and land use structure.
4.Survey data: Supplementary survey data of public service satisfaction in partial cities of the YRD, used to verify the rationality of the evaluation index system.
2.3. Research Methods
2.3.1. Construction of Social Sustainability Evaluation Index System
Based on the connotation of social sustainability and the actual development characteristics of China’s urban agglomerations, following the principles of scientificity, comprehensiveness, operability, and typicality, this paper constructs a three-level evaluation index system of social sustainability from three primary dimensions: equitable resource allocation (A1), livable urban environment (A2), and inclusive social development (A3) (Table 2). The primary dimensions are decomposed into 10 secondary indicators and 28 tertiary indicators, including both positive indicators (the higher the value, the better the social sustainability) and negative indicators (the lower the value, the better the social sustainability).
2.3.2. Entropy Weight-TOPSIS Model
The entropy weight-TOPSIS model combines the entropy weight method (objective weighting) and the TOPSIS method (multi-objective decision-making), which can avoid the subjectivity of artificial weighting and accurately measure the relative proximity of the evaluation object to the ideal solution. The specific calculation steps are as follows:
Data standardization: Eliminate the dimensional difference of indicators, using the extreme value standardization method for positive and negative indicators respectively:
where is the original value of the j-th indicator of the i-th city; is the standardized value; and are the maximum and minimum values of the j-th indicator.
Calculate the entropy weight of indicators:
First, calculate the proportion of the i-th city in the j-th indicator:
Then, calculate the entropy value of the j-th indicator:
where , is the number of evaluation objects.
Finally, calculate the weight of the j-th indicator:
where is the number of indicators.
Construct the weighted standardized decision matrix:
Determine the positive ideal solution () and negative ideal solution ():
Calculate the Euclidean distance from each evaluation object to the ideal solution:
Calculate the relative proximity degree (social sustainability index, SSI): , the value range is [0, 1], the larger the value, the higher the social sustainability level.
2.3.3. Spatial Analysis Methods
Using ArcGIS 10.8 software, the spatial autocorrelation analysis and spatial interpolation analysis are used to analyze the spatial pattern and evolution characteristics of social sustainability in the YRD:
Global Moran’s I: Measure the overall spatial correlation of social sustainability, the value range is [[-1,1]. I>0 indicates positive spatial correlation (agglomeration distribution), I<0 indicates negative spatial correlation (dispersion distribution), I=0 indicates random distribution.
Local Moran’s I: Identify the local spatial agglomeration pattern of social sustainability, including high-high agglomeration (core cities with high social sustainability), low-low agglomeration (peripheral cities with low social sustainability), high-low agglomeration, and low-high agglomeration.
Kriging interpolation: Simulate the spatial continuous distribution of social sustainability in the YRD, and visually display the spatial differentiation characteristics.
2.3.4. GeoDetector Model
The GeoDetector model is a spatial statistical model used to identify the driving factors of spatial differentiation and their interactive effects, which can effectively avoid the multicollinearity of variables [16]. This paper uses two modules of the model: factor detector and interaction detector.
Factor detector: Measure the explanatory power of a single factor on the spatial differentiation of social sustainability, expressed by the q value:.
where is the number of partitions of the driving factor; and are the number of samples in the h-th partition and the total number of samples; and are the variance of social sustainability in the h-th partition and the total variance; SSW is the sum of within-group variance, SST is the total variance. The q value range is [0, 1], the larger the value, the stronger the explanatory power of the factor.
Interaction detector: Identify the interactive effect of two factors (X1, X2) on the spatial differentiation of social sustainability, by comparing the q values of X1, X2, and X1∩X2, the interaction types are divided into: dual-factor enhancement, non-linear enhancement, single-factor weakening, and independent action.
2.3.5. PLUS Model for Scenario Prediction
The Patch-generating Land Use Simulation (PLUS) model is a land use simulation model that combines the random forest algorithm and cellular automata, which can accurately simulate the land use change under different scenarios [17]. Based on the land use data of 2020, this paper sets three scenarios to predict the land use change of the YRD in 2030, and then combines the social sustainability evaluation index system to predict the social sustainability level under different scenarios:
Urban expansion scenario (UES): Prioritize economic development and urban expansion, relax the control of urban built-up area expansion, and the transition probability of non-construction land to construction land increases by 60%.
Ecological priority scenario (EPS): Prioritize ecological environmental protection, strictly control urban expansion, and the transition probability of construction land to ecological land (green space, wetland) increases by 50%, and the urban green space rate is guaranteed to be not less than 40%.
Coordinated development scenario (CDS): Balance economic development, ecological protection, and social equity, optimize the spatial layout of urban land use, increase the supply of public resources in peripheral cities, and the transition probability of non-construction land to construction land is controlled within 20%, while the ecological land area is increased by 30%.Table 3. Land use transfer matrix for Dongting Lake Basin, 2000–2020, in km2.
3. Results
3.1. Temporal Evolution Characteristics of Social Sustainability in the YRD
From 2010 to 2020, the overall social sustainability index (SSI) of the YRD urban agglomeration showed a steady upward trend, increasing from 0.326 in 2010 to 0.415 in 2015 and then to 0.538 in 2020, with an average annual growth rate of 5.21% . The development of social sustainability in the YRD can be divided into two stages:
Slow growth stage (2010–2015): The SSI increased by 0.089, with an average annual growth rate of 4.42%. During this period, the YRD focused on economic growth and industrial upgrading, and the investment in social construction and public resource allocation was relatively insufficient, resulting in the slow growth of social sustainability.
Rapid growth stage (2015–2020): The SSI increased by 0.123, with an average annual growth rate of 5.92%. Since the national strategy of the YRD integrated development was put forward in 2016, the local government has increased investment in public services, ecological environment, and urban-rural integration, which has significantly improved the social sustainability level.
From the perspective of the three primary dimensions , the development trends of each dimension are consistent with the overall trend, but the growth rate is different:
- Inclusive social development (A3) has the fastest growth rate, with the index increasing from 0.301 in 2010 to 0.568 in 2020, mainly due to the continuous improvement of residents’ income level, the expansion of social security coverage, and the deepening of urban-rural integration.
- Livable urban environment (A2) has a medium growth rate, with the index increasing from 0.345 in 2010 to 0.542 in 2020, benefiting from the improvement of urban ecological environment and the optimization of urban living facilities.
- Equitable resource allocation (A1) has the slowest growth rate, with the index only increasing from 0.298 in 2010 to 0.486 in 2020, which is the primary constraint on the improvement of social sustainability in the YRD, due to the persistent unbalanced distribution of education, medical care and other public resources between core and peripheral cities.
3.2. Spatial Differentiation Pattern of Social Sustainability in the YRD
3.2.1. Overall Spatial Pattern
The social sustainability of the YRD presents a clear spatial pattern of “high in the core, low in the periphery” , and the spatial differentiation is significant:
High-value areas (SSI > 0.6): Mainly concentrated in the core cities of the YRD, including Shanghai, Nanjing, Hangzhou, and Hefei. These cities have strong economic strength, abundant high-quality public resources, and a good urban livable environment, so the social sustainability level is significantly higher than other cities.
Medium-value areas (0.4 < SSI ≤ 0.6): Mainly distributed in the sub-core cities around the core cities, such as Suzhou, Wuxi, Changzhou, Ningbo, and Jiaxing. These cities have a certain economic foundation and relatively complete public services, and the social sustainability level is in the middle level.
Low-value areas (SSI ≤ 0.4): Mainly concentrated in the peripheral cities of the YRD, such as Suqian, Lianyungang in Jiangsu Province, Quzhou, Lishui in Zhejiang Province, and Fuyang, Suzhou in Anhui Province. These cities have relatively weak economic strength, insufficient public resource supply, and low urban livability, resulting in a low social sustainability level.
3.2.2. Spatial Agglomeration Characteristics
The global Moran’s I of social sustainability in the YRD from 2010 to 2020 are 0.325, 0.368, and 0.412, all of which are significant at the 1% level, indicating that the social sustainability presents a significant positive spatial agglomeration characteristic, and the agglomeration degree is continuously increasing (Table 3).
The local Moran’s I analysis shows that the spatial agglomeration pattern of social sustainability in the YRD is relatively stable , mainly including:
High-high (H-H) agglomeration: Mainly distributed in the core area of the YRD (Shanghai, southern Jiangsu, northern Zhejiang), and the agglomeration range is gradually expanding, indicating that the radiation-driven capacity of core cities is continuously enhanced.
Low-low (L-L) agglomeration: Mainly concentrated in the northern Jiangsu, southern Zhejiang, and western Anhui of the YRD, and the agglomeration range is gradually narrowing, indicating that the social sustainability of peripheral cities is continuously improved, and the development gap with core cities is narrowing.
High-low (H-L) and low-high (L-H) agglomeration: The distribution range is small, mainly in the junction areas of core and peripheral cities, indicating that there is a “border effect” in the spatial development of social sustainability, and the radiation-driven effect of core cities on peripheral cities is not fully exerted.
3.3. Driving Factors of Social Sustainability in the YRD
3.3.1. Single Factor Detection
The factor detector results show that there are significant differences in the explanatory power of different driving factors on the spatial differentiation of social sustainability in the YRD (Table 4). According to the average q value from high to low, the top 10 key driving factors are: per capita GDP (X1, q=0.725), urban green space rate (X2, q=0.689), number of medical institutions per 10,000 people (X3, q=0.658), number of educational institutions per 10,000 people (X4, q=0.642), public transportation coverage rate (X5, q=0.615), urban-rural income ratio (X6, q=0.598), endowment insurance coverage rate (X7, q=0.582), per capita park green space area (X8, q=0.567), road network density (X9, q=0.541), and air quality excellent days ratio (X10, q=0.526).
It can be seen that economic development level and public resource supply are the most important driving factors of social sustainability in the YRD, followed by urban livable environment and social security level. The q values of economic and public resource factors are all above 0.6, indicating that these factors are the main reasons for the spatial differentiation of social sustainability. In contrast, the explanatory power of population density (X11, q=0.325) and industrial structure (X12, q=0.386) is relatively weak, indicating that the impact of these factors on social sustainability is limited.
3.3.2. Interactive Effect Detection
The interaction detector results show that the interactive effect of any two driving factors on the spatial differentiation of social sustainability in the YRD is dual-factor enhancement , that is, the explanatory power of the combination of two factors is greater than the single factor, and there is no single-factor weakening or independent action.
The top five combinations of interactive explanatory power are:
Per capita GDP ∩ urban green space rate (q=0.812)
Per capita GDP ∩ number of medical institutions per 10,000 people (q=0.798)
Urban green space rate ∩ number of educational institutions per 10,000 people (q=0.785)
Number of medical institutions per 10,000 people ∩ public transportation coverage rate (q=0.769)
Per capita GDP ∩ urban-rural income ratio (q=0.756)
This indicates that the social sustainability of the YRD is the result of the combined action of multiple factors, and the combination of economic development factor + public resource factor and economic development factor + livable environment factor has the strongest explanatory power for the spatial differentiation of social sustainability.
3.4. Scenario Prediction of Social Sustainability in the YRD in 2030
The prediction results of the PLUS model show that the social sustainability of the YRD in 2030 shows significant differences under different scenarios (Table 5), and the overall level is higher than 2020, but the development quality and spatial pattern are different:
Urban expansion scenario (UES): The overall SSI of the YRD in 2030 is 0.586, an increase of 0.048 compared with 2020. Under this scenario, the core cities continue to expand, and the public resources are more concentrated in the core, resulting in the further expansion of the social sustainability gap between core and peripheral cities, and the spatial pattern of “high in the core, low in the periphery” is more prominent. The livable urban environment index of partial core cities even shows a slight decline due to excessive urban expansion.
Ecological priority scenario (EPS): The overall SSI is 0.612, an increase of 0.074 compared with 2020. The urban ecological environment of the YRD is significantly improved, and the livable urban environment index increases rapidly, but the economic development speed is relatively slow, and the investment in public resources is insufficient, resulting in the slow growth of equitable resource allocation index, and the social sustainability of peripheral cities is still at a low level.
Coordinated development scenario (CDS): The overall SSI reaches 0.689, an increase of 0.151 compared with 2020, which is the highest among the three scenarios. Under this scenario, the economic development, ecological protection, and social equity are balanced, the high-quality public resources of core cities are radiated to peripheral cities, the urban-rural and inter-city development gaps are significantly narrowed, and the spatial pattern of social sustainability tends to be balanced. The three primary dimension indexes all achieve rapid and coordinated growth, especially the equitable resource allocation index, which has the largest growth rate.
4. Discussion
4.1. Key Findings and Interpretation
This study reveals the spatiotemporal evolution characteristics and driving mechanisms of social sustainability in the YRD urban agglomeration from 2010 to 2020, and predicts the future development trend under different scenarios. The key findings are as follows:
The social sustainability of the YRD has achieved steady growth, but there are obvious stage characteristics, and the equitable resource allocation is the primary constraint factor. This is consistent with the research conclusion of Li et al. [13] on the Pearl River Delta urban agglomeration, indicating that the unbalanced distribution of public resources is a common problem in China’s urban agglomerations in the process of urbanization.
The social sustainability presents a spatial pattern of “high in the core, low in the periphery” with significant positive spatial agglomeration, and the agglomeration degree is continuously increasing. The radiation-driven capacity of core cities is enhanced, but the “border effect” is still obvious, which is due to the administrative division barriers and the unbalanced spatial allocation of public resources in the YRD [7].
Economic development level, public resource supply, and urban livable environment are the top three key driving factors of social sustainability, and the interactive effect of any two factors is dual-factor enhancement. This shows that social sustainability is a complex system affected by multiple factors, and the single factor cannot fully explain its spatial differentiation [14].
The coordinated development scenario is the optimal path for the social sustainability development of the YRD in the future, which can realize the balanced and high-quality growth of social sustainability and narrow the development gap between core and peripheral cities.
4.2. Comparison with International Research
International research on social sustainability mainly focuses on developed countries, and the research results show that the social sustainability of developed urban agglomerations (such as the European Union urban agglomeration and the Tokyo metropolitan area) is at a high level, and the spatial distribution is relatively balanced [10,11]. The main reasons are the high level of economic development, the perfect public service system, and the sound urban governance mechanism. In contrast, the social sustainability of the YRD has a large gap with the international advanced level, and the spatial differentiation is more significant, which is due to the late start of China’s urbanization, the unbalanced economic development, and the imperfect public resource allocation mechanism. However, the YRD has a strong economic foundation and policy support, and its social sustainability has a huge room for improvement. By learning from the experience of international advanced urban agglomerations in public resource allocation and urban governance, the YRD can quickly improve its social sustainability level.
4.3. Limitations of the Study
This study still has some limitations that need to be improved in the follow-up research:
The evaluation index system is mainly constructed from objective indicators, and the subjective indicators (such as residents’ subjective satisfaction with social sustainability) are relatively insufficient, which may lead to a certain deviation between the evaluation results and the actual situation.
The research time series is relatively short (2010–2020), and the long-term evolution characteristics and historical driving mechanisms of social sustainability cannot be fully revealed.
The scenario prediction only considers three typical scenarios, and the setting of more detailed scenarios (such as different policy intensity scenarios) can make the prediction results more accurate.
The research only focuses on the YRD urban agglomeration, and the comparative research with other urban agglomerations (such as the Pearl River Delta and the Beijing-Tianjin-Hebei) is insufficient, which cannot fully reflect the regional differences of social sustainability in China’s urban agglomerations.
4.4. Implications for Urban Governance
Based on the research results, the following policy implications for promoting the social sustainability development of the YRD urban agglomeration are put forward:
Optimize the spatial allocation of public resources: Break the administrative division barriers, establish a cross-regional public resource allocation mechanism, and promote the radiation of high-quality education, medical care, and other resources from core cities to peripheral cities, so as to improve the level of equitable resource allocation.
Adhere to the coordinated development of economic and social construction: While maintaining steady economic growth, increase investment in social construction, focus on improving the income level of residents in peripheral cities, expand the coverage of social security, and promote the inclusive development of society.
Build a livable urban environment in the whole region: Strengthen the ecological environmental protection and governance of the YRD, increase the construction of urban green space, park, and other ecological facilities, optimize the urban transportation and commercial service facilities, and improve the overall livable level of the urban agglomeration.
Improve the integrated governance mechanism of urban agglomerations: Establish a cross-regional coordinated governance mechanism for social sustainability, formulate a unified development plan, and realize the sharing of resources, complementary advantages, and coordinated development of core and peripheral cities.
Take the coordinated development as the core strategy: In the future urban planning and development, take the coordinated development scenario as the optimal path, balance economic development, ecological protection, and social equity, and avoid the one-sided development of urban expansion or ecological priority.
5. Conclusions
Taking the Yangtze River Delta urban agglomeration as the study area, this paper constructs a comprehensive evaluation index system of social sustainability from three dimensions of equitable resource allocation, livable urban environment, and inclusive social development, and uses the entropy weight-TOPSIS model, spatial analysis methods, GeoDetector model, and PLUS model to analyze the spatiotemporal evolution characteristics, driving mechanisms, and scenario prediction of social sustainability from 2010 to 2020. The main conclusions are as follows:
The overall social sustainability of the YRD showed a steady upward trend from 2010 to 2020, with an average annual growth rate of 5.21%, and the development process was divided into slow growth stage (2010–2015) and rapid growth stage (2015–2020). Among the three primary dimensions, inclusive social development had the fastest growth rate, while equitable resource allocation had the slowest growth rate and became the primary constraint factor.
The social sustainability of the YRD presented a clear spatial pattern of “high in the core, low in the periphery”, with significant positive spatial agglomeration characteristics, and the agglomeration degree was continuously increasing. The high-value areas were concentrated in core cities such as Shanghai, Nanjing, and Hangzhou, while the low-value areas were concentrated in peripheral cities of northern Jiangsu, southern Zhejiang, and western Anhui.
Economic development level (per capita GDP), public resource supply (number of medical and educational institutions per 10,000 people), and urban livable environment (urban green space rate) were the top three key driving factors of social sustainability, with q values all above 0.65. The interactive effect of any two driving factors was dual-factor enhancement, and the combination of economic development factor and public resource factor had the strongest explanatory power.
The social sustainability of the YRD in 2030 showed significant differences under different scenarios: the urban expansion scenario had the lowest growth rate and the core-periphery gap expanded; the ecological priority scenario had a medium growth rate and the peripheral areas improved slowly; the coordinated development scenario had the highest growth rate (SSI=0.689) and the whole region achieved balanced development, which was the optimal development path.
This study enriches the research on social sustainability of China’s urban agglomerations, and provides a quantitative method and empirical reference for the evaluation and optimization of social sustainability in other rapidly urbanizing regions worldwide. In the follow-up research, we will expand the research time series, supplement the subjective evaluation indicators, and carry out comparative research with other urban agglomerations, so as to further improve the research depth and
Author Contributions
Huanxi Wang:Writing – original draft, Methodology, Software, Visualization, Investigation. Weihong Chen:A third level professor, doctoral supervisor, and head of the Department of Agriculture and Forestry Economics and Management at the School of Economics, Guizhou University, mainly engaged in research and practice in the fields of agriculture and forestry economic management, climate change, and low-carbon economy. Funding acquisition, Writing–review, Project administration..
References
- WCED. Our Common Future; Oxford University Press: Oxford, UK, 1987. [Google Scholar]
- Sharifi, A.; Murayama, Y. Indicators of social sustainability in urban regeneration projects. Int. J. Sustain. Dev. World Ecol. 2013, 20, 274–289. [Google Scholar] [CrossRef]
- United Nations. Transforming Our World: The 2030 Agenda for Sustainable Development; United Nations: New York, NY, USA, 2015. [Google Scholar]
- Dempsey, N.; Bramley, G.; Power, S.; Brown, C. The social dimension of sustainable development: Defining urban social sustainability. Sustain. Dev. 2011, 19, 289–300. [Google Scholar] [CrossRef]
- National Development and Reform Commission. The Development Plan of the Yangtze River Delta Urban Agglomeration; National Development and Reform Commission: Beijing, China, 2016. [Google Scholar]
- Liu, Y.; Chen, Y. Spatial-temporal evolution of urban social sustainability in China and its driving factors. Acta Geogr. Sin. 2020, 75, 1235–1252. (in Chinese). [Google Scholar]
- Zhang, L.; Wang, F. Integrated development of the Yangtze River Delta urban agglomeration: Progress, problems and countermeasures. Geogr. Res. 2021, 40, 2681–2696. (in Chinese). [Google Scholar]
- IUCN. Caring for the Earth: A Strategy for Sustainable Living; IUCN: Gland, Switzerland, 1991. [Google Scholar]
- Dempsey, N.; Brown, C.; Bramley, G. Social sustainability: A catchword between urban utopia and everyday life. Environ. Plan. A 2009, 41, 2907–2923. [Google Scholar] [CrossRef]
- Sharifi, A.; Murayama, Y. A systematic review of social sustainability in urban context: Towards a comprehensive framework and research agenda. Sustain. Cities Soc. 2016, 25, 189–203. [Google Scholar] [CrossRef]
- Choguill, C.L. Social sustainability and urban form: Evidence from European cities. Int. J. Sustain. Dev. World Ecol. 2011, 18, 364–378. [Google Scholar] [CrossRef]
- Wang, X.; Li, J. Evaluation of social sustainability of megacities in China: A case study of Beijing and Shanghai. City Plan. Rev. 2019, 43, 38–46. (in Chinese). [Google Scholar]
- Li, M.; Zhang, H. Coupling coordination relationship between economic, ecological and social sustainability in the Pearl River Delta urban agglomeration. J. Geogr. Sci. 2022, 32, 1657–1676. [Google Scholar] [CrossRef]
- He, C.; Wu, Q. Driving factors of social sustainability in China’s resource-based cities: Based on the GeoDetector model. Resour. Sci. 2023, 45, 1234–1247. (in Chinese). [Google Scholar]
- Chen, W.; Liu, X. Scenario prediction of urban social sustainability in the Beijing-Tianjin-Hebei region based on the System Dynamics model. J. Urban Plan. 2022, 46, 45–54. (in Chinese). [Google Scholar]
- Wang, J.F.; Li, X.H.; Christakos, G. Geographical detectors-based health risk assessment and its application in the neural tube defects study of the Heshun region, China. Int. J. Geogr. Inf. Sci. 2010, 24, 107–127. [Google Scholar] [CrossRef]
- Liang, X.; Guan, Q.; Clarke, K.C. Understanding the drivers of sustainable land expansion using a patch-generating land use simulation (PLUS) model: A case study in Wuhan, China. Comput. Environ. Urban Syst. 2021, 85, 101569. [Google Scholar] [CrossRef]
Figure 1.
Geographical location map of the Yangtze River Delta urban agglomeration.
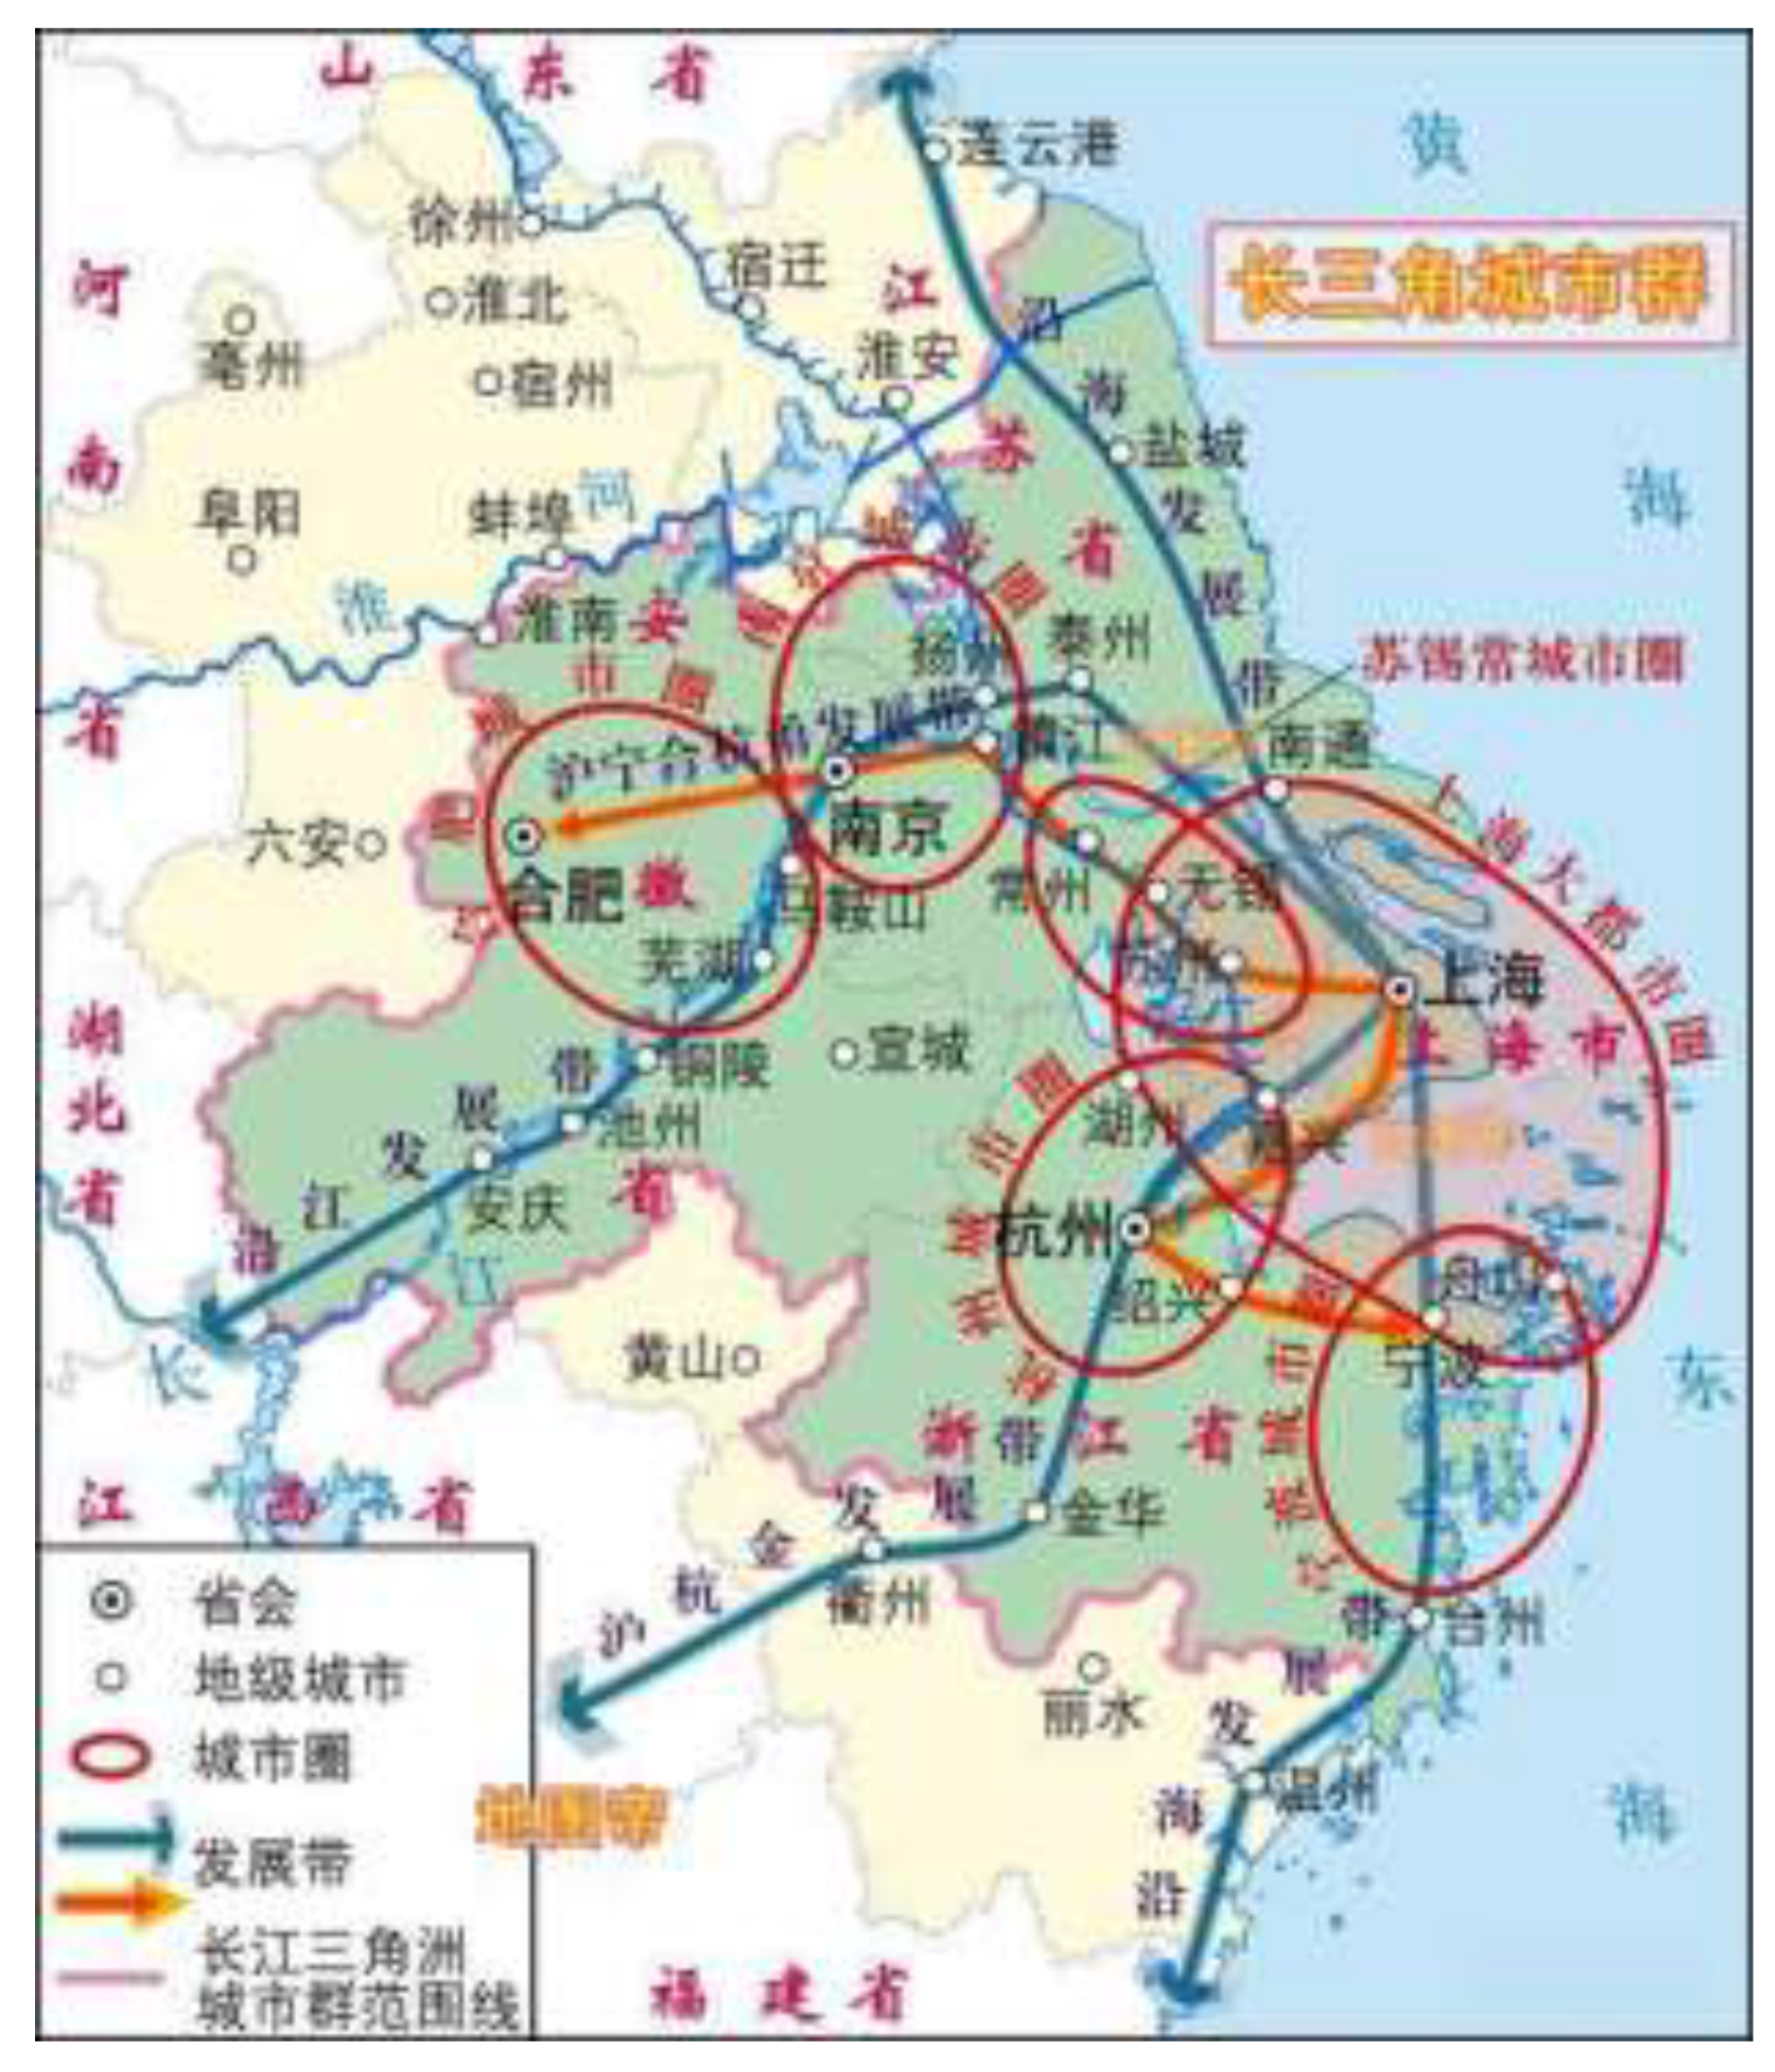

Table 1.
Data information.
| Data Type | Data Name | Time Series | Data Source |
|---|---|---|---|
| Socioeconomic Statistics | City statistical indicators | 2010,2015,2020 | China City Statistical Yearbook, provincial statistical yearbooks, municipal statistical bulletins |
| Geospatial Data | Urban built-up area, road network, green space | 2010,2015,2020 | Resource and Environmental Science Data Platform, Open Street Map |
| Remote Sensing Data | Nighttime light data, land use/cover data | 2010,2015,2020 | Geospatial Data Cloud, Institute of Tibetan Plateau Research |
| Survey Data | Public service satisfaction | 2020 | Field survey and online questionnaire |
Table 2.
Evaluation index system of social sustainability in the Yangtze River Delta urban agglomeration.
Table 2.
Evaluation index system of social sustainability in the Yangtze River Delta urban agglomeration.
| Primary Indicator (A) | Secondary Indicator (B) | Tertiary Indicator (C) | Attribute | Weight |
|---|---|---|---|---|
| Equitable resource allocation (A1) | Educational resource equity (B1) | Per capita number of primary and secondary school teachers (C1); Education expenditure as a proportion of fiscal expenditure (C2); Urban-rural education resource allocation ratio (C3) | +/+/− | Calculated by entropy weight method |
| Medical resource equity (B2) | Per capita number of medical beds (C4); Per capita number of doctors (C5); Urban-rural medical resource allocation ratio (C6) | +/+/− | ||
| Infrastructure equity (B3) | Per capita road area (C7); Urban-rural road density ratio (C8); Per capita water supply capacity (C9) | +/+/+ | ||
| Livable urban environment (A2) | Ecological environment quality (B4) | Urban green space rate (C10); Per capita park green space area (C11); Air quality excellent days ratio (C12) | +/+/+ | |
| Urban living convenience (B5) | Number of commercial service facilities per 10,000 people (C13); Public transportation coverage rate (C14); Logistics distribution capacity (C15) | +/+/+ | ||
| Urban safety guarantee (B6) | Public security case incidence rate (C16); Urban flood control capacity (C17); Emergency shelter coverage rate (C18) | −/+/+ | ||
| Inclusive social development (A3) | Income equity (B7) | Per capita disposable income of residents (C19); Urban-rural income ratio (C20); Gini coefficient of residents’ income (C21) | +/−/− | |
| Employment and social security (B8) | Urban registered unemployment rate (C22); Endowment insurance coverage rate (C23); Medical insurance coverage rate (C24) | −/+/+ | ||
| Social cohesion (B9) | Cultural and sports facilities per 10,000 people (C25); Volunteer service participation rate (C26) | +/+ | ||
| Urban-rural integration (B10) | Urban-rural consumption ratio (C27); Rural tap water popularization rate (C28) | −/+ |
Table 3.
Global Moran’s I of social sustainability in the YRD (2010–2020).
| Year | Moran’s I | Z-value | P-value | Spatial Correlation |
|---|---|---|---|---|
| 2010 | 0.325 | 4.821 | 0.000 | Significant positive correlation |
| 2015 | 0.368 | 5.367 | 0.000 | Significant positive correlation |
| 2020 | 0.412 | 6.015 | 0.000 | Significant positive correlation |
Table 4.
Factor detector results of driving factors for social sustainability in the YRD (2020).
| Driving Factor | Code | q Value | Rank |
|---|---|---|---|
| Per capita GDP | X1 | 0.725 | 1 |
| Urban green space rate | X2 | 0.689 | 2 |
| Number of medical institutions per 10,000 people | X3 | 0.658 | 3 |
| Number of educational institutions per 10,000 people | X4 | 0.642 | 4 |
| Public transportation coverage rate | X5 | 0.615 | 5 |
| Urban-rural income ratio | X6 | 0.598 | 6 |
| Endowment insurance coverage rate | X7 | 0.582 | 7 |
| Per capita park green space area | X8 | 0.567 | 8 |
| Road network density | X9 | 0.541 | 9 |
| Air quality excellent days ratio | X10 | 0.526 | 10 |
| Population density | X11 | 0.325 | 12 |
| Industrial structure (tertiary industry proportion) | X12 | 0.386 | 11 |
Table 5.
Social sustainability index of the YRD under different scenarios in 2030.
| Scenario | Overall SSI | Equitable Resource Allocation (A1) | Livable Urban Environment (A2) | Inclusive Social Development (A3) | Spatial Pattern Characteristics |
|---|---|---|---|---|---|
| Urban expansion (UES) | 0.586 | 0.512 | 0.578 | 0.625 | Core-periphery gap expansion |
| Ecological priority (EPS) | 0.612 | 0.508 | 0.689 | 0.635 | Slow improvement of peripheral areas |
| Coordinated development (CDS) | 0.689 | 0.625 | 0.698 | 0.726 | Balanced development of the whole region |
Disclaimer/Publisher’s Note: The statements, opinions and data contained in all publications are solely those of the individual author(s) and contributor(s) and not of MDPI and/or the editor(s). MDPI and/or the editor(s) disclaim responsibility for any injury to people or property resulting from any ideas, methods, instructions or products referred to in the content. |
© 2026 by the authors. Licensee MDPI, Basel, Switzerland. This article is an open access article distributed under the terms and conditions of the Creative Commons Attribution (CC BY) license (http://creativecommons.org/licenses/by/4.0/).
Copyright: This open access article is published under a Creative Commons CC BY 4.0 license, which permit the free download, distribution, and reuse, provided that the author and preprint are cited in any reuse.