
Submitted:
26 February 2026
Posted:
27 February 2026
You are already at the latest version
Abstract
With the increasing cost of labor, smart agriculture has emerged as a key trend for the future of agricultural development. This paper presents an integrated approach for tomato maturity clas-sification and yield estimation using both RGB and multispectral images. The proposed approach consists of three main components: tomato detection, tomato tracking and counting, and maturity classification of tomatoes. YOLOv8 combined with OSNet is first employed to detect tomatoes, while StrongSORT is then adopted to track consistent identities across image sequences. For maturity classification, multiple vegetation indices, including NDVI, GNDVI, and GRRI, are first transformed using principal component analysis, followed by classification using support vector machines, k-nearest neighbors, and neural networks. Tomatoes are categorized into three ma-turity levels: immature, almost mature, and mature. Results demonstrate that the proposed ap-proach can effectively estimate yield of tomatoes at each maturity stage. This capability provides practical support for harvest planning and labor allocation in precision agriculture.
Keywords:
object detection
; multi-object tracking
; maturity classification
; yield estimation
1. Introduction
The continuous rise in minimum wage has significantly increased the cost of hiring temporary labor for harvesting operations. This challenge is further intensified by the decreasing availability of agricultural workers, leading to increased competition for labor resources among farmers. As a result, effective workforce planning requires farmers to carefully balance labor costs with the expected quantity or total weight of the harvest. Consequently, reliable estimation of crop maturity and yield has become essential. To address this issue, image-based techniques have been extensively adopted to support both field monitoring and automated crop inspection and classification. By using learning-based models, various crop characteristics can be analyzed to assess crop maturity and quality levels.
Several existing approaches to crop maturity classification rely on the spectral response of fruits across different wavelength bands. Zhang et al. [1] analyzed spectral variations in strawberries at multiple developmental stages to determine maturity, while infrared reflectance from the fruit surface was used to evaluate the maturity of blueberries [2]. In addition to spectral characteristics, visual changes associated with fruit development provide important cues for quality assessment and can be exploited using conventional classification methods. Ashtiani et al. [3] presented an approach for the classification of mulberry fruit ripening stages using convolutional neural networks (CNNs). Transfer learning was used to fine-tune the CNNs for reducing the training cost and improving the accuracy of classification. They categorized blackberries and raspberries into four maturity stages: unripe, partially ripe, ripe, and overripe. Yang et al. [4] proposed image processing techniques to assess the growth status of crops and predict the harvest time of strawberries in a greenhouse. They used object detection and classification with machine learning models to classify the growth stages of strawberries.
In addition to evaluating fruit quality and maturity, vision-based approaches have been widely applied to fruit detection and localization for both yield estimation and automated harvesting systems. Liu et al. [5] introduced a multi-ellipse boundary representation in the Cr–Cb color space to effectively distinguish citrus fruits and tree trunks from complex backgrounds. Tanigaki et al. [6] developed an autonomous robotic system for cherry harvesting. Their system integrated thermal imaging was used to discriminate infrared reflectance between ripe cherries and surrounding foliage and can obtain more accurate localization of mature fruits. Their approach can improve the accuracy of identifying fruits suitable for harvesting. Niedbała et al. [7] integrated a diverse set of maturity-related indicators, including over 30 multispectral vegetation indices, meteorological data collected between the 121st and 181st days of the year, and bee foraging activity density. DeLong et al. [8] focused on temporal monitoring of fruit chlorophyll content to determine the optimal harvest initiation time. The adoption of intelligent agricultural technologies allowed growers to optimize orchard management and apply timely measures to control pests and diseases. Consequently, both fruit quality and overall yield were significantly improved.
Several methods rely on single-image analysis without tracking individual fruits over time. This limitation often results in duplicated counting and unstable maturity predictions. Moreover, numerous approaches based solely on spectral indices or visual features may lack capability for distinguishing visually similar maturity stages. To overcome these challenges, this paper proposes an integrated approach that combines tomato detection, tomato tracking and counting, and maturity classification of tomatoes. By associating individual tomatoes across image sequences and jointly analyzing RGB and multispectral features, the proposed approach facilitates consistent maturity classification and accurate counting of tomatoes at different maturity stages. This integrated approach provides a practical solution for supporting data-driven harvest planning in real agricultural environments [9].
The main contributions of this paper are summarized as follows. First, we present an integrated approach for tomato maturity classification and yield estimation using RGB and multispectral images. Second, tomato maturity is categorized into three maturity levels by jointly exploiting RGB color information and multispectral vegetation indices. Finally, the proposed approach provides quantitative statistics of tomatoes at various maturity levels, supporting accurate yield estimation and efficient labor allocation.
2. Related Works
2.1. Fruit Counting
Afonso et al. [10] employed the Mask R-CNN algorithm to simultaneously detect and segment tomatoes in images. To enhance depth perception, a RealSense camera was used to measure the distance between the tomatoes and the imaging system, thereby facilitating effective foreground-background separation. For the detection backbone, ResNet50, ResNet101, and ResNeXt101 were integrated with Mask R-CNN and comparatively evaluated. The incorporation of depth-assisted foreground segmentation using the RealSense camera significantly improved tomato detection accuracy and robustness in complex scenes. Vasconez et al. [11] investigated fruit detection for counting applications using Faster R-CNN with Inception V2 and SSD with MobileNet. Their approach considered multiple fruit types, including avocados, lemons, and apples, which exhibit substantial variability in color, size, and shape. To address overfitting and improve model generalization, two data augmentation strategies were adopted: horizontal image flipping and the use of images with varying pixel resolutions. These augmentations effectively enhanced detection performance across diverse visual conditions.
Liu et al. [12] proposed an aggregation-based approach for tracking small objects. Initially, discriminative features were extracted from regions surrounding each object, including local appearance features, gradient information, and edge cues. The local descriptors consisted of histogram-based representations, texture measures, and shape features, which were combined to form a comprehensive feature vector. Aggregation techniques, such as hash-based functions, were then applied to compress these representations into compact signatures. The resulting signatures were stored in a memory bank to facilitate efficient and reliable tracking over time. Rincon et al. [13] introduced a unified representation technique for highly occluded agricultural environments using multi-view perception and 3D multi-object tracking. Multiple cameras captured tomato plants from different viewpoints, and 3D tracking algorithms associated fruit instances across sequential frames. By exploiting geometric constraints and computer vision techniques, their system reconstructed detailed 3D models of the fruits. This reconstruction allowed accurate estimation of fruit size, volume, and shape, thereby supporting more precise counting and phenotypic analysis.
Zhao and Tao [14] proposed a tracking approach based on color correlograms as the primary feature descriptor. A simplified color correlogram was used to represent target appearance while preserving essential spatial information. Gradient descent optimization and the mean-shift algorithm served as the core localization mechanisms and were extended to operate in three-dimensional space. Through iterative mean-shift refinement, the method estimated the most probable target position and orientation with improved stability. Zhao et al. [15] focused on enhancing the conventional two-stage detection-and-tracking architecture by developing a correlation filter-based tracker built on compressed deep convolutional neural network features. By integrating CNN representations with a correlation filter tracker and embedding target-specific semantic information into the compressed features, their method reduced computational overhead while maintaining high tracking performance. The approach was validated on standard benchmarks, including the MOT [16] and KITTI [17] datasets.
2.2. Maturity Classification
Castro et al. [18] applied an image-based recognition technique to classify gooseberry maturity into seven distinct levels. In addition to RGB images, HSV and L*a*b* color spaces were incorporated, and principal component analysis (PCA) was performed to extract discriminative color features. Several classifiers, including support vector machines (SVMs), k-nearest neighbors (KNNs), artificial neural networks (ANNs), and decision trees, were evaluated for maturity prediction. Prior to training, the gooseberry images were segmented to remove background noise, and the resulting color components from the three-color spaces were used as feature inputs. This multi-color space strategy enhanced the separability of maturity stages. El-Bendary et al. [19] investigated tomato maturity evaluation using machine learning techniques. After segmenting the tomato regions from the captured images, the ratio of green to non-green surface areas was computed to categorize maturity into five levels. PCA was conducted on the HSV hue component to reduce feature dimensionality. For classification, SVM and linear discriminant analysis (LDA) were employed, with the SVM models implemented using both one-against-one and one-against-all strategies. Their approach demonstrated that color distribution features are effective indicators of tomato ripeness.
Martins et al. [20] proposed a vegetation index-based approach for monitoring coffee maturity using aerial multispectral images. A multispectral camera was used to capture coffee bean datasets under controlled illumination. Reflectance values at different wavelengths were analyzed to compute vegetation indices [21,22]. These indices, derived from spectral combinations, were used to evaluate the sensitivity of coffee beans across developmental stages. The resulting spectral signatures allowed estimation of the proportion of mature beans and facilitated the construction of maturity datasets. Nandi et al. [23] developed a machine vision system for predicting mango maturity to support automated sorting of harvested fruit. Each mango variety was categorized into four shelf-life-based maturity levels (M1–M4). For PCA-based feature extraction, each fruit was divided into apex, equator, and stalk regions. Mean RGB histogram values, inter-channel differences, and vertical color gradients were computed for each region. An SVM classifier combined with recursive feature elimination (SVM-RFE) was used to rank the 27 extracted features and select the most informative subset. Classification performance was assessed using confusion matrix analysis, demonstrating effective maturity discrimination.
Tan et al. [24] introduced an approach to determine blueberry maturity. An initial HOG-based SVM classifier yielded limited performance, prompting the integration of HSV color features. The hue channel was extracted to capture maturity-related color variations, while HOG descriptors represented texture information. These complementary features were fused into a unified representation. KNN and template matching with weighted Euclidean distance (TMWE) classifiers were subsequently applied, resulting in improved classification accuracy. Waseem et al. [25] proposed an automated tomato maturity estimation approach based on an optimized residual neural network enhanced with pruning and quantization techniques. A residual network backbone first classified tomatoes into discrete maturity stages using image inputs. Structured pruning eliminated redundant parameters, and weight quantization reduced numerical precision, thereby decreasing model size, memory consumption, and inference latency. This optimization enabled efficient deployment in agricultural applications. However, the model’s performance remained sensitive to illumination variations and dataset diversity, indicating potential limitations in real-world environments.
3. Proposed Approach
The flowchart of the proposed approach is shown in Figure 1, comprising three major stages: tomato detection, tomato tracking and counting, and maturity classification of tomatoes. Initially, sequences of RGB images are processed by an object detection algorithm to identify tomatoes. Subsequently, we use a tracking algorithm to assign a distinct identity (ID) to each detected tomato across consecutive frames. These IDs are used for tomato counting. Finally, the proposed approach facilitates consistent maturity classification and accurate counting of tomatoes at different maturity stages. The maturity of each tomato is classified into three categories: mature, almost mature, and immature. With the image frame associated with each identified tomato, the proposed approach facilitates consistent maturity classification and accurate counting of tomatoes at different maturity stages.
3.1. Tomato Detection
Tomatoes in the images are detected using a detection network that integrates YOLOv8 with the omni-scale network (OSNet) architecture [26]. The OSNet is a convolutional neural network originally developed for person re-identification tasks. The OSNet employs depth-wise separable convolution operations. A standard 3×3 convolution is factorized into a 1×1 convolution followed by a depth-wise 3×3 separable convolution. This design improves computational efficiency. Within its omni-scale residual block, multiple bottleneck pathways composed of lightweight 3×3 convolutional layers at different scales are jointly constructed to capture multi-scale feature representations. These bottleneck features are subsequently aggregated through a unified aggregation gate, which dynamically combines the information extracted from the individual bottleneck branches.
3.2. Tomato Tracking and Counting
We employ the tracking algorithm StrongSORT [27] for individual tomato tracking because it can achieve superior results in terms of multi-object tracking accuracy (MOTA) and ID consistency. The tracking algorithm assigns a distinct ID to each detected tomato across consecutive frames. These unique IDs were subsequently used to count the total number of tomatoes. StrongSORT extends the DeepSORT framework [28] by introducing AFLink, an appearance-independent trajectory association module that merges fragmented tracklets into longer and continuous trajectories. AFLink utilizes spatiotemporal features from pairs of tracklets to estimate their likelihood of association, with confidence scores generated through a multilayer perceptron (MLP).
To eliminate disturbance from occluding branches, the tomato segmentation technique [29] is adopted. Initially, the acquired tomato images are transformed from the RGB color space into the YUV representation. Binary segmentation is subsequently performed on the V channel using Otsu’s thresholding method [30]. This process enables the exclusion of background regions and specular highlights unrelated to the tomato surface. Given the dense distribution of tomatoes and frequent occlusions from foliage, stems, or adjacent fruits, rectangular detection regions are further approximated as elliptical shapes. Although this approach may encompass partially occluded or neighboring tomatoes, it effectively reduces segmentation-induced pixel inaccuracies and improves the robustness of subsequent feature computation.
3.3. Maturity Classification
The maturity of tomatoes is classified into three categories: mature, almost mature, and immature. During different developmental phases, crops exhibit distinct spectral reflectance characteristics across multiple wavelength bands [20]. Multispectral imaging systems capture crop spectral responses across multiple wavelength bands. This information enables the extraction of essential growth-related attributes, including leaf coverage, chlorophyll concentration, and vegetation indices. By examining the temporal variation of these indicators, crop maturity levels can be determined. These features are generally derived from either RGB or multispectral images. In the proposed approach, three spectral indices [21,31], namely, normalized difference vegetation index (NDVI), green normalized difference vegetation index (GNDVI), and green-red ratio index (GRRI), are adopted to assess tomato maturity.
Furthermore, tomato maturity classification is performed using three machine learning models, namely SVMs, KNNs, and ANNs. The performance of these classifiers may vary depending on parameter configurations, affecting aspects such as classification accuracy, robustness, and generalization capability. Moreover, the way in which the dataset is divided into training and validation subsets can further influence the outcomes. During the parameter optimization process, the SVM penalty parameter is varied from 10 to 40 with a step size of 2. Meanwhile, the neighborhood size in KNN is adjusted from 2 to 30 using the same increment. To enhance the reliability of the classification results, a cross-validation technique is employed for all models, allowing repeated training and evaluation across different data partitions. Specifically, a 10-fold cross-validation scheme is adopted for SVM, KNN, and ANN under each parameter configuration to identify the optimal settings.
After determining the optimal model parameters, the trained classifiers are applied to the test dataset to produce the final classification outcomes. The specific parameter configurations and kernel selections for the three learning algorithms are summarized in Table 1. The dimensionality of the feature space is dictated by the number of indicators incorporated in the classification process. For instance, when NDVI and GNDVI are selected as input features, the resulting feature space is two-dimensional.
4. Results
4.1. Data Collection and Maturity Label
For experimental data acquisition, a Parrot Sequoia+ imaging system was employed. This platform was widely adopted in precision agriculture and integrated both a multispectral imaging unit and an ambient light sensor. The multispectral module consisted of five individual cameras, enabling the capture of images across multiple wavelength bands. In addition to standard RGB images, the system recorded near-infrared, red, green, and red-edge bands, thereby offering enriched spectral information for vegetation analysis. In parallel, the integrated sunshine sensor monitored incident solar radiation, allowing radiometric calibration of the multispectral data. This calibration process compensated for fluctuations in illumination conditions, ensuring consistent and reliable image outputs under varying sunlight intensities.
The acquired tomato image sequences were converted into the IRIS dataset structure [32]. Within this format, frame-by-frame information for each tomato was stored, including unique IDs, RGB images, multispectral images, and corresponding maturity labels. The multispectral features additionally comprised NDVI, GNDVI, and GRRI values. Apart from the tomato ID and maturity labels, all remaining attributes were computed by averaging pixel intensities over the unmasked regions inside each tomato’s bounding box. Each dataset contained the complete image sequences, the converted IRIS-formatted data, test sequences organized according to the MOT dataset specification, and the trained model parameters obtained from SVM, KNN, and ANN classifiers.
Tomato maturity labeling was conducted on a weekly basis by examining image data acquired at identical locations across consecutive weeks to assess harvest readiness. When a tomato appears green and remains unharvested during week n, turns red in week n+1, and is collected in week n+2, it is assigned a label of −2 for week n (corresponding to n − (n+2)) and −1 for week n+1 (corresponding to (n+1) − (n+2)). Tomatoes that are expected to require three or more additional weeks before harvest exhibit negligible variations in appearance. Therefore, these samples are uniformly assigned a label of −3, including those exactly three weeks from harvesting. In summary, labels −1, −2, and −3 represent tomatoes that are harvest-ready, one week away from harvest, and two or more weeks away from harvest, respectively.
4.2. Maturity Classification
Using the proposed maturity labeling strategy in conjunction with the selected classification models, tomato maturity levels were determined for the test image sequences. Classification performance was evaluated by computing accuracy as the ratio of correctly predicted tomato bounding boxes, after applying a voting scheme across frames, to the total number of bounding boxes present in all frames. At this stage, tracking information was excluded from the evaluation, and all bounding boxes in both the training and test datasets were derived from ground-truth labels. The distribution of tomato bounding boxes across the training and testing splits for the three datasets was summarized in Table 2.
Within image sequences, a single tomato may be captured across multiple frames, often under varying conditions such as partial occlusion by leaves or slight shifts in detection location. These factors can cause discrepancies in classification outcomes across frames. To address this issue, a voting strategy inspired by ensemble learning was adopted. Predictions from multiple frames were aggregated, and the class receiving the highest number of votes was selected as the final maturity label for each tomato. Consequently, the maturity decision was determined by majority consensus among the frame-level classifications. The summarized classification outcomes were presented in Table 3, where accuracy was calculated as the proportion of correctly identified tomatoes relative to the total number of bounding boxes across all frames.
The results indicate that, except for the nineteenth tomato dataset, RGB-based methods outperformed multispectral approaches in the remaining two datasets. To investigate the underlying reasons for this performance difference, the relative influence of individual features was examined, as depicted in Figure 2. The analysis revealed that the green spectral component consistently contributed the most to accurate maturity discrimination. In contrast, the impact of multispectral indices, along with red and blue channels, varied across datasets. These findings suggested that the superior performance achieved by RGB images can largely be attributed to the strong discriminative capability of the green channel in maturity assessment.
To further validate the preceding observations, classification accuracy was evaluated by comparing the use of complete RGB features against configurations that included only the red and blue channels. As reported in Table 4, the results demonstrated that, aside from the nineteenth tomato dataset, incorporating all RGB components leaded to markedly improved performance relative to excluding the green channel. In addition, omitting the green component resulted in accuracy levels that fell below those achieved using multispectral data. For the nineteenth dataset, however, the contribution of green light to classification was less dominant than in the other two cases. As illustrated in Figure 2, although the green channel remained the most influential feature, its margin over the second most significant indicator was considerably narrower. This reduced disparity may explain why multispectral approaches yielded comparatively better results for the nineteenth tomato dataset than RGB-based methods.
4.3. Change in Maturity Label Cycle
In addition to overall performance comparisons, the classification behavior of different maturity levels was further analyzed by inspecting the confusion matrices presented in Figure 3. The results indicated relatively high discriminative accuracy between the −1 (mature) and −2 (nearly mature) categories, whereas substantial misclassification occurred between the −2 (nearly mature) and −3 (immature) classes. This confusion can be attributed to the close visual resemblance in skin coloration between nearly mature and immature tomatoes, which limits the effectiveness of color-based features for reliable separation.
Initially, image acquisition was conducted on a weekly basis due to the large scale of the tomato cultivation area. Based on observations from the first two datasets, tomato coloration remained largely unchanged until approximately one and a half weeks prior to full maturity. In contrast, a rapid and pronounced color transition occurred during the final one and a half weeks before maturity. Consequently, the sampling frequency for the third dataset was increased to twice per week rather than maintaining the original weekly schedule.
4.4. Maturity-Based Yield Estimation
Tomato tracking was integrated with the maturity classification to estimate both the yield and distribution of tomatoes across different maturity stages. The resulting counts for each maturity category in all test image sequences were summarized in Table 5. Figure 4 presented visual examples of the combined detection and classification outcomes, where tomatoes classified as mature, nearly mature, and immature were denoted by red, orange, and yellow bounding boxes, respectively.
5. Discussion
The comparative analysis between RGB-based and multispectral features indicated that RGB information, particularly the green channel, played a dominant role in tomato maturity classification. In two of the three datasets, RGB features outperformed multispectral vegetation indices. Hence, visible color changes associated with tomato maturity provided highly discriminative cues for maturity classification. Although multispectral indices such as NDVI, GNDVI, and GRRI were designed to capture physiological and chlorophyll-related variations, their advantage may be reduced when strong color transitions were already present in the visible spectrum. In practical agricultural environments, low-cost RGB imaging systems may be adequate for many maturity assessment tasks, thereby potentially lowering deployment costs.
The introduction of a voting mechanism across multiple frames significantly stabilized maturity predictions. Because individual tomatoes appeared in multiple frames with varying occlusions and viewpoints, frame-level predictions can fluctuate. Aggregating predictions through majority voting reduced the impact of transient errors and produced more consistent tomato-level classifications. This strategy demonstrated the value of integrating tracking information with classification. By associating observations over time, the proposed approach effectively exploited temporal redundancy to enhance robustness.
The maturity-based yield estimation experiments revealed that tracking accuracy and detection reliability directly influence counting performance. In sequences with heavy occlusion or dense foliage, the predicted tomato counted deviate more substantially from ground truth. These errors propagated to yield estimation, especially in the lin_tomato dataset, where large discrepancies were observed. Although StrongSORT provided strong multi-object tracking performance, agricultural environments presented unique challenges, including irregular fruit motion, partial occlusion by leaves, and similar appearance among neighboring tomatoes. Enhancing detection robustness through improved segmentation or incorporating depth information could reduce counting errors.
The change in sampling frequency from weekly to twice per week also offered valuable insights. Higher temporal resolution captured rapid color transitions occurring shortly before harvest. Increased sampling frequency improved the system’s ability to detect maturity progression and reduced uncertainty in classification. From an operational standpoint, a trade-off existed between data acquisition cost and prediction accuracy. Optimizing sampling schedules based on crop growth dynamics could improve efficiency in real-world deployment.
The proposed approach demonstrated strong potential for supporting precision agriculture. By providing quantitative statistics of tomatoes at different maturity levels, the proposed system allowed farmers to plan harvesting schedules and allocate labor resources more effectively. However, real-world adoption required consideration of scalability, computational efficiency, and environmental variability. The use of optimized machine learning classifiers and efficient detection architectures was a step toward deployable systems. The datasets used were collected under relatively controlled greenhouse conditions. Outdoor environments may introduce additional variability, including weather changes, shadows, and background complexity. Furthermore, the maturity labeling scheme relied on weekly observation and assumed consistent growth patterns, which may vary across cultivars or environmental conditions.
6. Conclusions
We have presented an integrated approach for tomato maturity classification and yield estimation by using both RGB and multispectral images. The proposed approach is composed of three main stages: tomato detection, tomato tracking and counting, and maturity classification of tomatoes. Tomato detection is performed using a combination of YOLOv8 and OSNet, after which StrongSORT is employed to consistently associate unique IDs with detected tomatoes. For maturity classification, principal component analysis is conducted on multiple spectral indices, including NDVI, GRRI, and GNDVI. Three machine learning classifiers—SVM, KNN, and ANN—are then independently utilized to categorize tomatoes into immature, nearly mature, and mature classes. The resulting maturity-based yield estimation can provide practical guidance for optimizing harvesting strategies and labor allocation.
Future research directions include integrating deep neural networks for end-to-end maturity estimation, exploring multimodal sensor fusion, and incorporating 3D spatial information to better handle occlusion. Additionally, semi-supervised or self-supervised learning techniques could reduce the burden of manual labeling while improving model adaptability.
Author Contributions
Methodology, C.-A.P. and H.-Y.L.; Supervision, H.-Y.L. and C.-C.C.; Writing—original draft, C.-A.P. and H.-Y.L.; Writing—review & editing, H.-Y.L. and C.-C.C. All authors have read and agreed to the published version of the manuscript.
Funding
The authors would like to thank the National Science and Technology Council of Taiwan for financially supporting this research under contract no. NSTC 114-2221-E-239-024-.
Institutional Review Board Statement
Not applicable.
Informed Consent Statement
Not applicable.
Data Availability Statement
The data presented in this study are available on request from the corresponding author. The data are not publicly available due to privacy.
Acknowledgments
This paper is an extended version of our paper published in: Maturity and yield estimation of tomatoes using RGB and multispectral images. In Proceedings of 2024 IEEE International Conference on Industrial Technology (ICIT 2024), Bristol, UK, March 25-27, 2024.
Conflicts of Interest
The authors declare no conflict of interest.
References
- C. Zhang, C. Guo, F. Liu, W. Kong, Y. He, B. Lou, “Hyperspectral imaging analysis for ripeness evaluation of strawberry with support vector machine,” Journal of Food Engineering, vol. 179, pp. 11–18, 2016. [CrossRef]
- C. Zhao and X. Li, “A multispectral image based object detection approach in natural scene,” in Proceedings of 2021 International Conference on Intelligent Computing and Signal Processing (ICSP), Xi’an, China, 09-11 April 2021, pp. 566–569. IEEE.
- S.H.M. Ashtiani, S. Javanmardi, M. Jahanbanifard, A. Martynenko, and F.J. Verbeek, “Detection of mulberry maturity stages using deep learning models,” IEEE Access, vol. 9, pp. 100380–100394, 2021. [CrossRef]
- M.H. Yang, W.H. Nam, T. Kim, K. Lee, and Y. Kim, “Machine learning application for predicting the strawberry harvesting time,” Korean Journal of Agricultural Science, vol. 46, no. 2, pp. 381–393, 2019. [CrossRef]
- T.H. Liu, R. Ehsani, A. Toudeshki, X. J. Zou, and H. J. Wang, “Detection of citrus fruit and tree trunks in natural environments using a multi-elliptical boundary model,” Computers in Industry, vol. 99, pp. 9–16, 2018. [CrossRef]
- K. Tanigaki, T. Fujiura, A. Akase, and J. Imagawa, “Cherry-harvesting robot,” Computers and Electronics in Agriculture, vol. 63, no. 1, pp. 65–72, 2008. [CrossRef]
- G. Niedbała, J. Kurek, B. Świderski, T. Wojciechowski, I. Antoniuk, and K. Bobran, “Prediction of blueberry (vaccinium corymbosum l.) yield based on artificial intelligence methods,” Agriculture, vol. 12, no. 12, article 2089, 2022. [CrossRef]
- J. DeLong, R. Prange, P. Harrison, D. Nichols, and H. Wright, “Determination of optimal harvest boundaries for honeycrisp™ fruit using a new chlorophyll meter,” Canadian Journal of Plant Science, vol. 94, no. 2, pp. 361–369, 2014. [CrossRef]
- T. Chen and H. Y. Lin, “Detection, counting and maturity assessment of cherry tomatoes using multi-spectral images and machine learning techniques,” in Proceedings of 15th International Joint Conference on Computer Vision, Imaging and Computer Graphics Theory and Applications (VISIGRAPP 2020), Valletta, Malta, February 27-29, 2020, pp. 759–766.
- M. Afonso, H. Fonteijn, F. S. Fiorentin, D. Lensink, M. Mooij, N. Faber, G. Polder, and R. Wehrens, “Tomato fruit detection and counting in greenhouses using deep learning,” Frontiers in Plant Science, vol. 11, 2020. [CrossRef]
- J. Vasconez, J. Delpiano, S. Vougioukas, and F. Auat Cheein, “Comparison of convolutional neural networks in fruit detection and counting: A comprehensive evaluation,” Computers and Electronics in Agriculture, vol. 173, article 105348, 2020. [CrossRef]
- C. Liu, W. Ding, J. Yang, V. Murino, B. Zhang, J. Han, and G. Guo, “Aggregation signature for small object tracking,” IEEE Transactions on Image Processing, vol. 29, pp. 1738–1747, 2019. [CrossRef]
- D.R. Rincon, E. J. van Henten, and G. Kootstra, “Development and evaluation of automated localization and reconstruction of all fruits on tomato plants in a greenhouse based on multi-view perception and 3d multi-object tracking,” arXiv, arXiv:2211.02760, 2022.
- Q. Zhao and H. Tao, “Object tracking using color correlogram,” in Proceedings of 2005 IEEE International Workshop on Visual Surveillance and Performance Evaluation of Tracking and Surveillance, Beijing, China, 15-16 October, pp. 263–270. IEEE.
- D. Zhao, H. Fu, L. Xiao, T. Wu, and B. Dai, “Multi-object tracking with correlation filter for autonomous vehicle,” Sensors, vol. 18, no. 7, article 2004, 2018. [CrossRef]
- E. Ristani, F. Solera, R. Zou, R. Cucchiara, and C. Tomasi, “Performance measures and a data set for multi-target, multi-camera tracking,” in Proceedings of 14th European Conference on Computer Vision (ECCV), Amsterdam, The Netherlands, October 11-14, 2016, pp. 17–35. [CrossRef]
- Geiger, P. Lenz, and R. Urtasun, “Are we ready for autonomous driving? the kitti vision benchmark suite,” in Proceedings of 2012 IEEE Conference on Computer Vision and Pattern Recognition, Providence, RI, USA, 16-21 June 2012, pp. 3354–3361. IEEE. [CrossRef]
- W. Castro, J. Oblitas, M. De-La-Torre, C. Cotrina, K. Bazán, and H. Avila-George, “Classificatio3n of cape gooseberry fruit according to its level of ripeness using machine learning techniques and different color spaces,” IEEE Access, vol. 7, pp. 27389–27400, 2019. [CrossRef]
- N. El-Bendary, E. El-Hariri, A.E. Hassanien, and A. Badr, “Using machine learning techniques for evaluating tomato ripeness,” Expert Systems with Applications, vol. 42, no. 4, pp. 1892–1905, 2015. [CrossRef]
- R.N. Martins, F. de A. de Carvalho Pinto, D.M. de Queiroz, D.S.M. Valente, and J.T.F. Rosas, “A novel vegetation index for coffee ripeness monitoring using aerial imagery,” Remote Sensing, vol. 13, no. 2, 2021. [CrossRef]
- J.W. Rouse, R.H. Haas, J.A. Schell and D.W. Deering, “Monitoring vegetation systems in the great plains with ERTS,” in Proceedings of Third Earth Resources Technology Satellite-1 Symposium, Greenbelt, MD, USA, 10-14 December, 1973, pp. 309–317.
- G. Fitzgerald, D. Rodriguez, L. Christensen, R. Belford, V. Sadras, and T. Clarke, “Spectral and thermal sensing for nitrogen and water status in rainfed and irrigated wheat environments,” Precision Agriculture, vol. 7, pp. 233–248, 2006. [CrossRef]
- C.S. Nandi, B. Tudu, and C. Koley, “A machine vision-based maturity prediction system for sorting of harvested mangoes,” IEEE Transactions on Instrumentation and Measurement, vol. 63, no. 7, pp. 1722–1730, 2014. [CrossRef]
- K. Tan, W. S. Lee, H. Gan, and S. Wang, “Recognising blueberry fruit of different maturity using histogram oriented gradients and colour features in outdoor scenes,” Biosystems Engineering, vol. 176, pp. 59–72, 2018. [CrossRef]
- M. Waseem, C.H. Huang, M. M. Sajjad, L. H. Naqvi, Y. Majeed, T. U. Rehman, and T. Nadeem, “Automated tomato maturity estimation using an optimized residual model with pruning and quantization techniques,” arXiv, arXiv:2503.10940, 2025.
- K. Zhou, Y. Yang, A. Cavallaro, and T. Xiang, “Omni-scale feature learning for person re-identification,” arXiv, arXiv:1905.00953, May 2019. [CrossRef]
- Y. Du, Z. Zhao, Y. Song, Y. Zhao, F. Su, T. Gong, and H. Meng, “Strongsort: Make deepsort great again,” arXiv, arXiv:2202.13514, 2023. [CrossRef]
- N. Wojke, A. Bewley, and D. Paulus, “Simple online and realtime tracking with a deep association metric,” arXiv, arXiv:1703.07402, March 2017.
- Y. A. Sari and S. Adinugroho, “Tomato ripeness clustering using 6-means algorithm based on v-channel otsu segmentation,” in Proceedings of 2017 International Symposium on Computational and Business Intelligence (ISCBI), Dubai, United Arab Emirates, 11–14 August 2017, pp. 32–36.
- P. Yang, W. Song, X. Zhao, R. Zheng, and L. Qingge, “An improved otsu threshold segmentation algorithm,” International Journal of Computational Science and Engineering, vol. 22, no. 1, pp. 146–153, 2020. [CrossRef]
- C.A. Pai and H.Y. Lin, “Maturity and yield estimation of tomatoes using RGB and multispectral images,” in Proceedings of 2024 IEEE International Conference on Industrial Technology (ICIT 2024), Bristol, UK, March 25-27, 2024.
- L. Omelina, J. Goga, J. Pavlovicova, M. Oravec, and B. Jansen, “A survey of iris datasets,” Image and Vision Computing, vol. 108, article 104109, 2021. [CrossRef]
Figure 1.
Flowchart of the proposed approach.
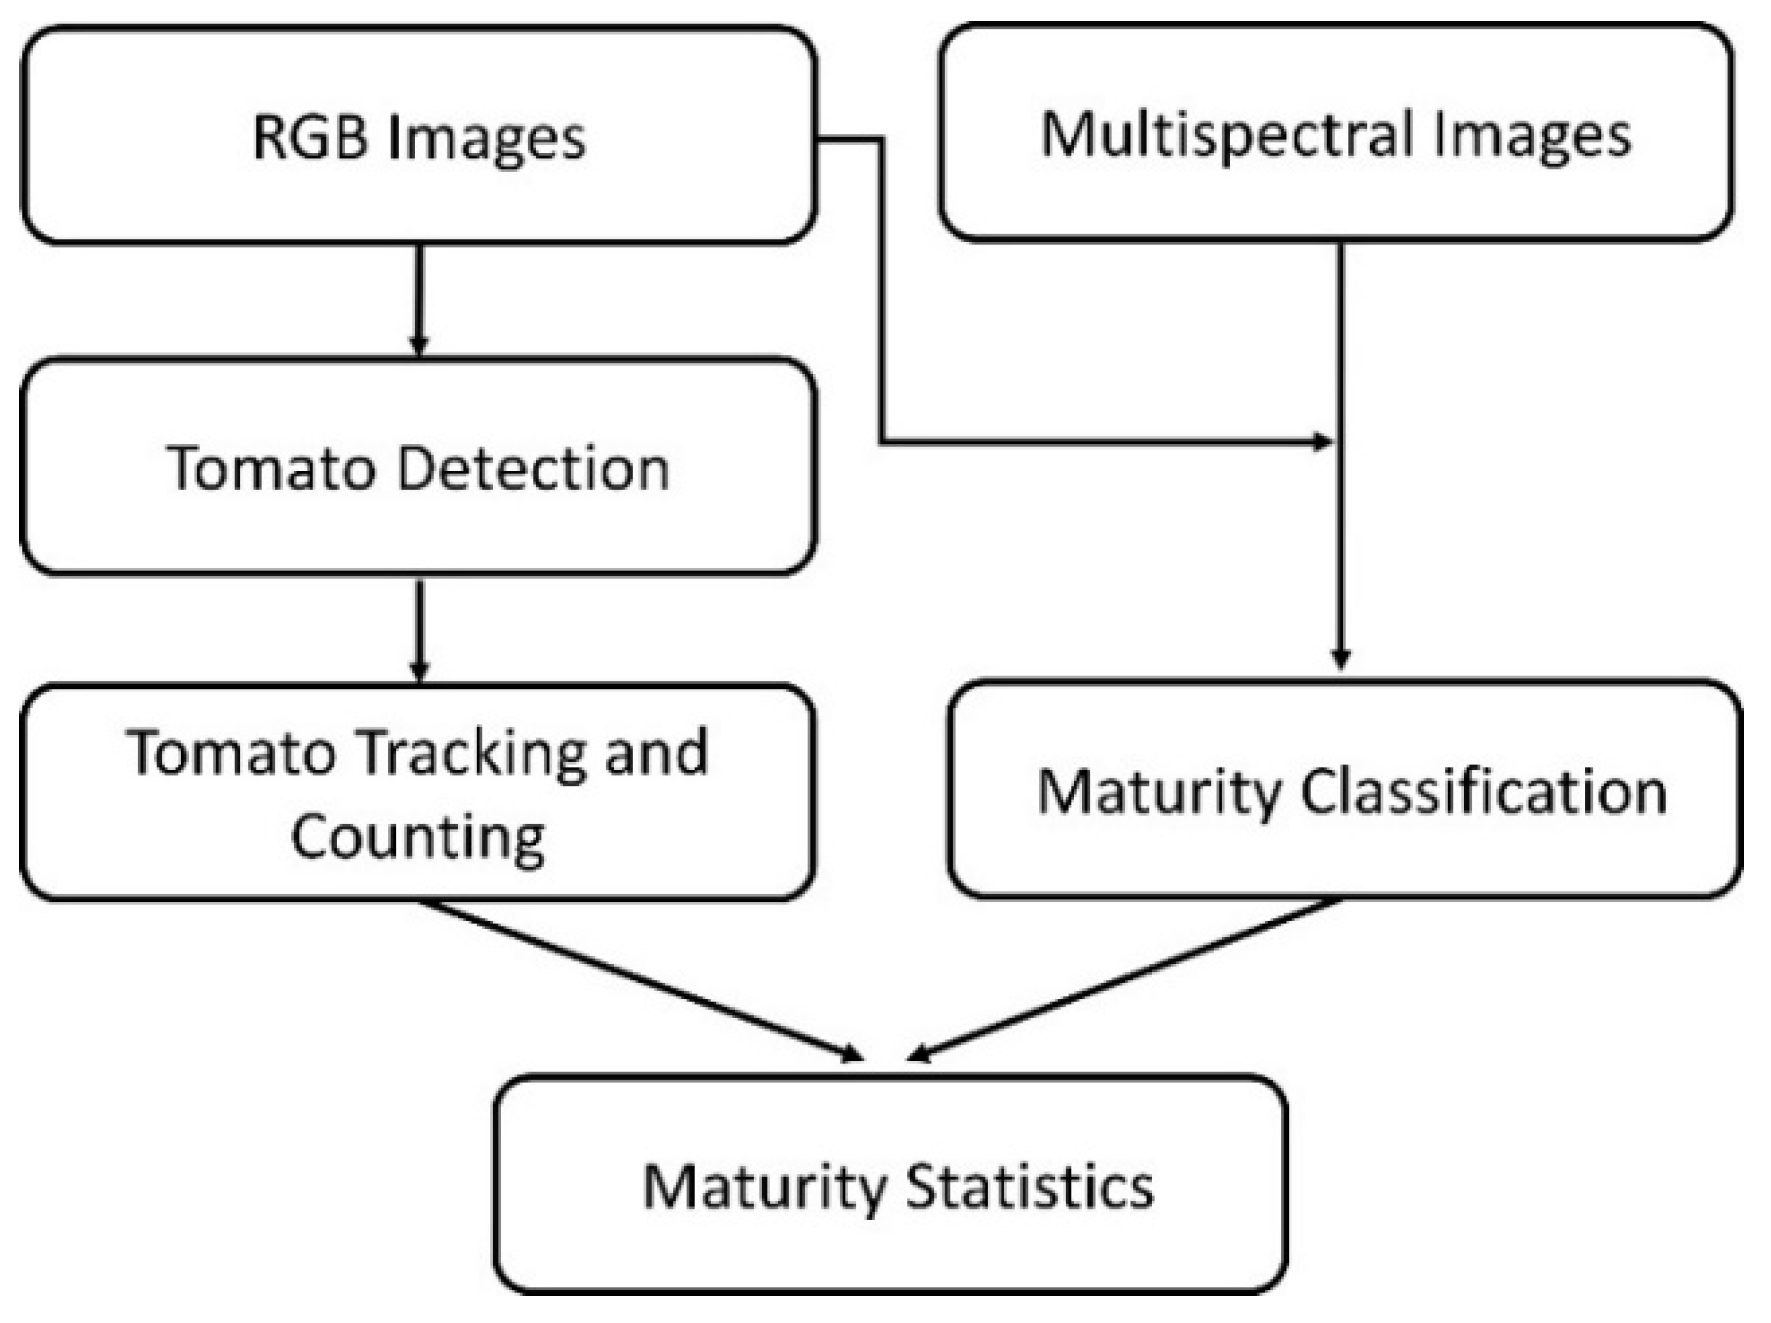
Figure 2.
Contribution of each indicator for the datasets. (a) 19th_tomato, (b) lin_tomato, (c) 19th2_tomato.
Figure 2.
Contribution of each indicator for the datasets. (a) 19th_tomato, (b) lin_tomato, (c) 19th2_tomato.
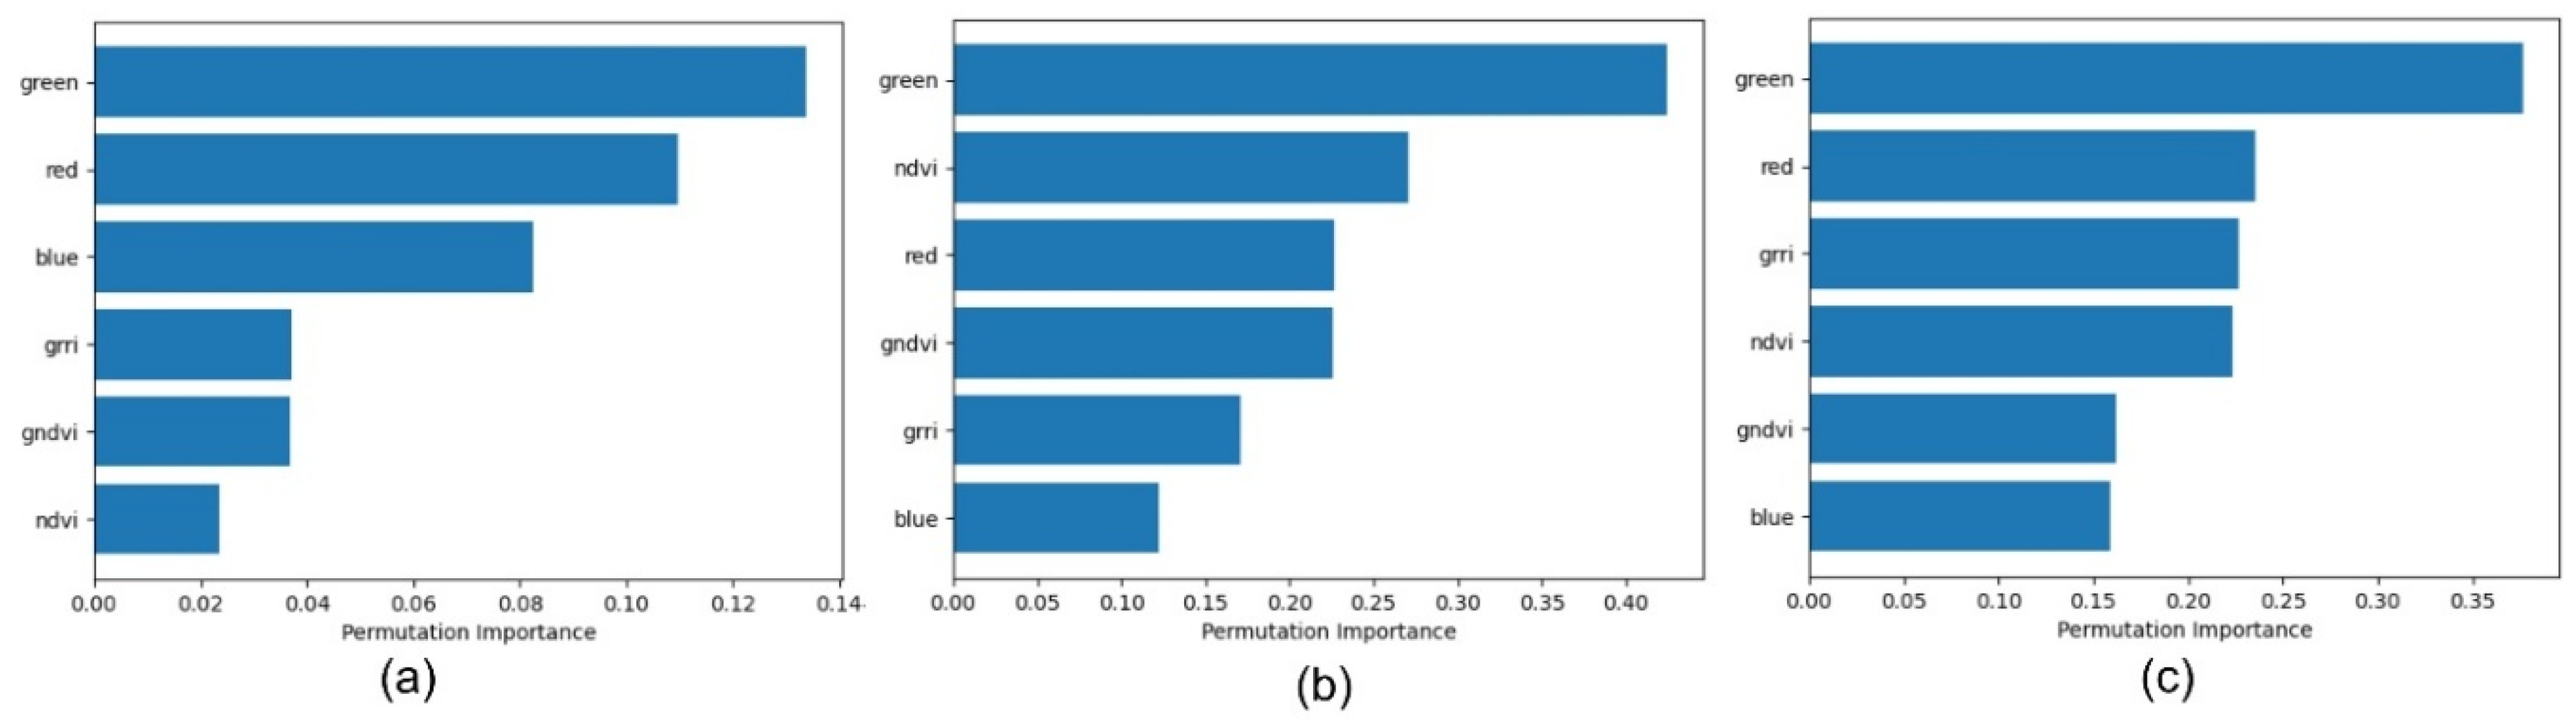
Figure 3.
Confusion matrix for three datasets using all classification indices. (a) 19th_tomato, (b) lin_tomato, (c) 19th2_tomato.
Figure 3.
Confusion matrix for three datasets using all classification indices. (a) 19th_tomato, (b) lin_tomato, (c) 19th2_tomato.
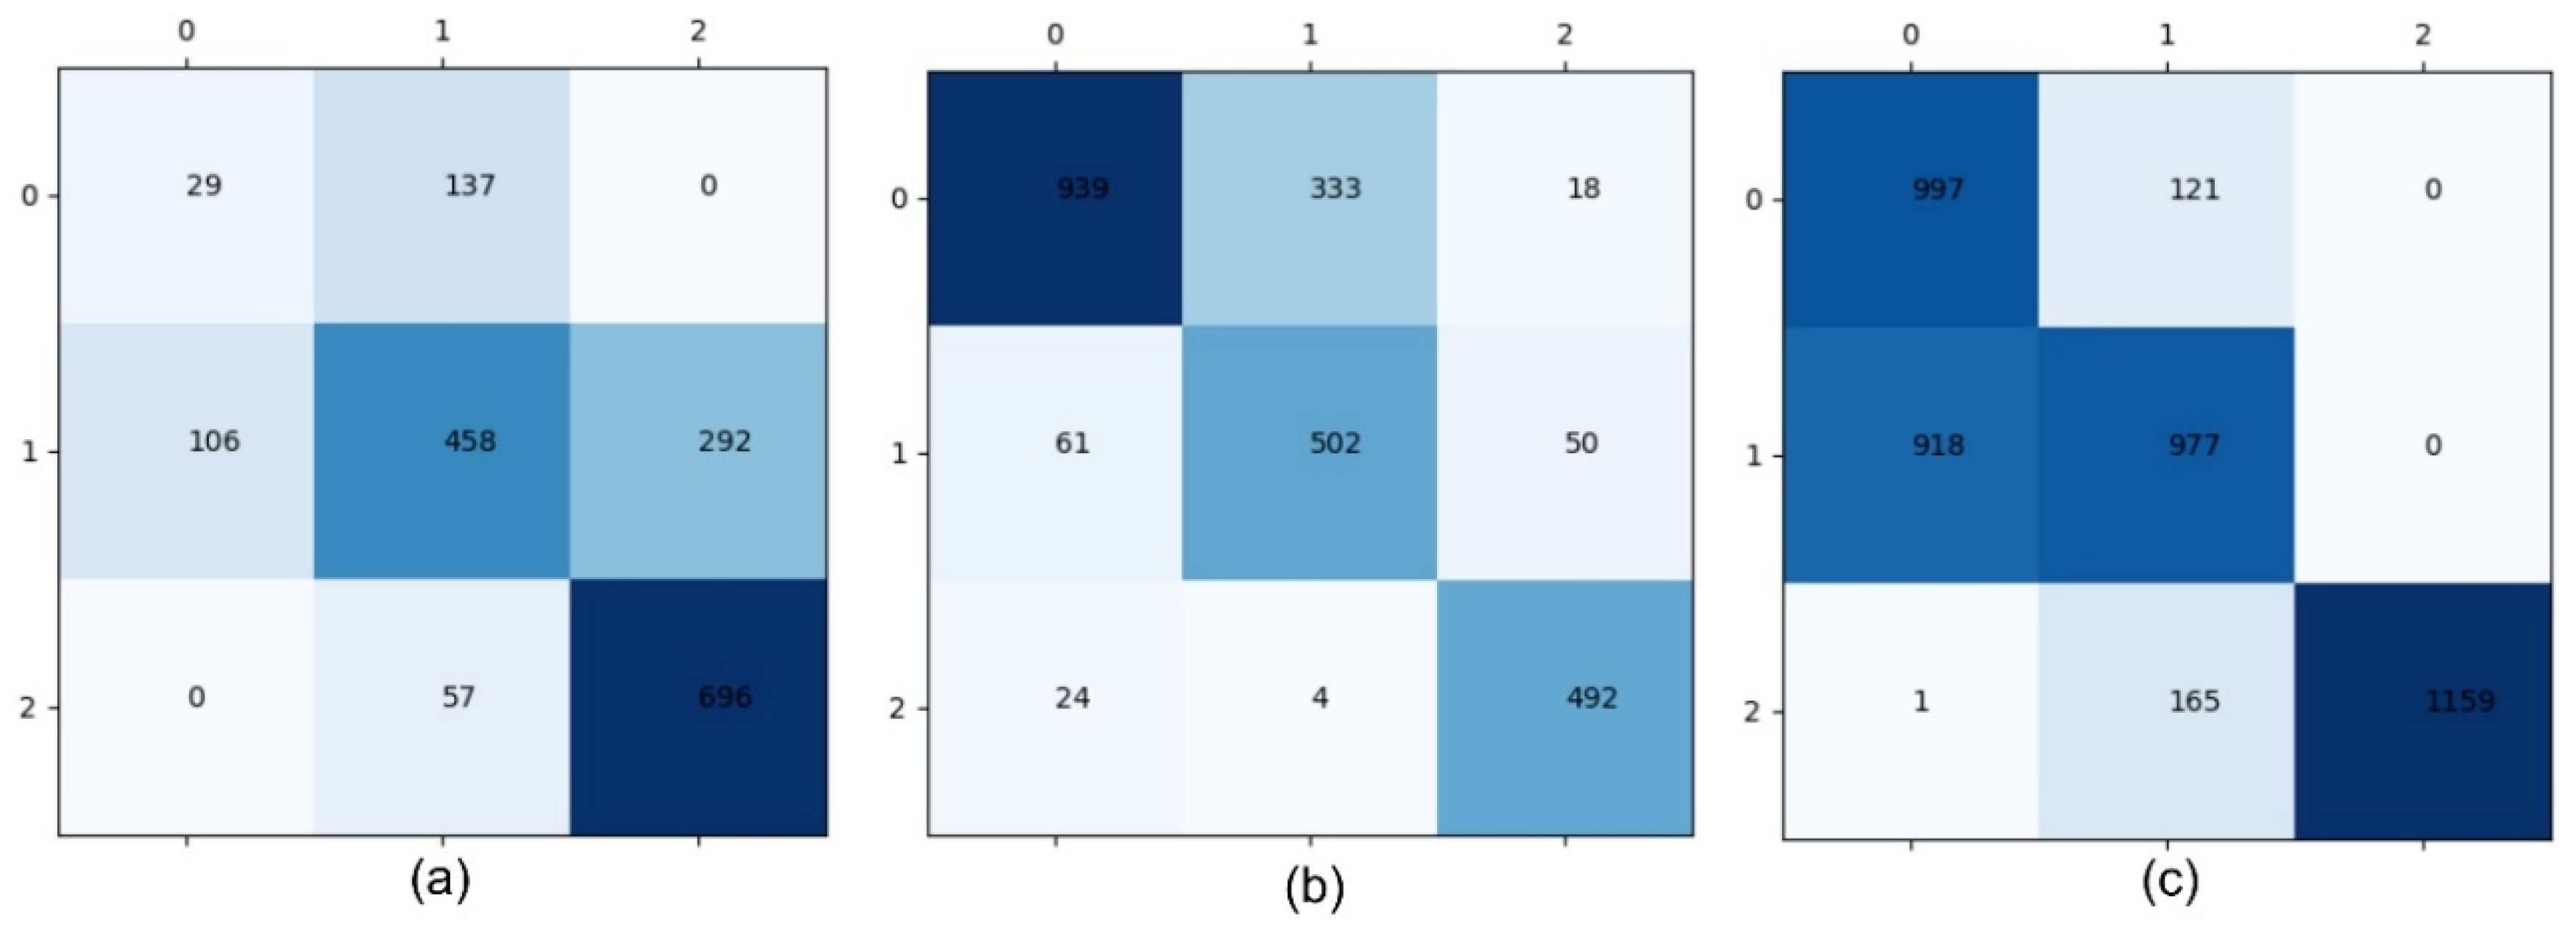
Figure 4.
Final detection and classification results.
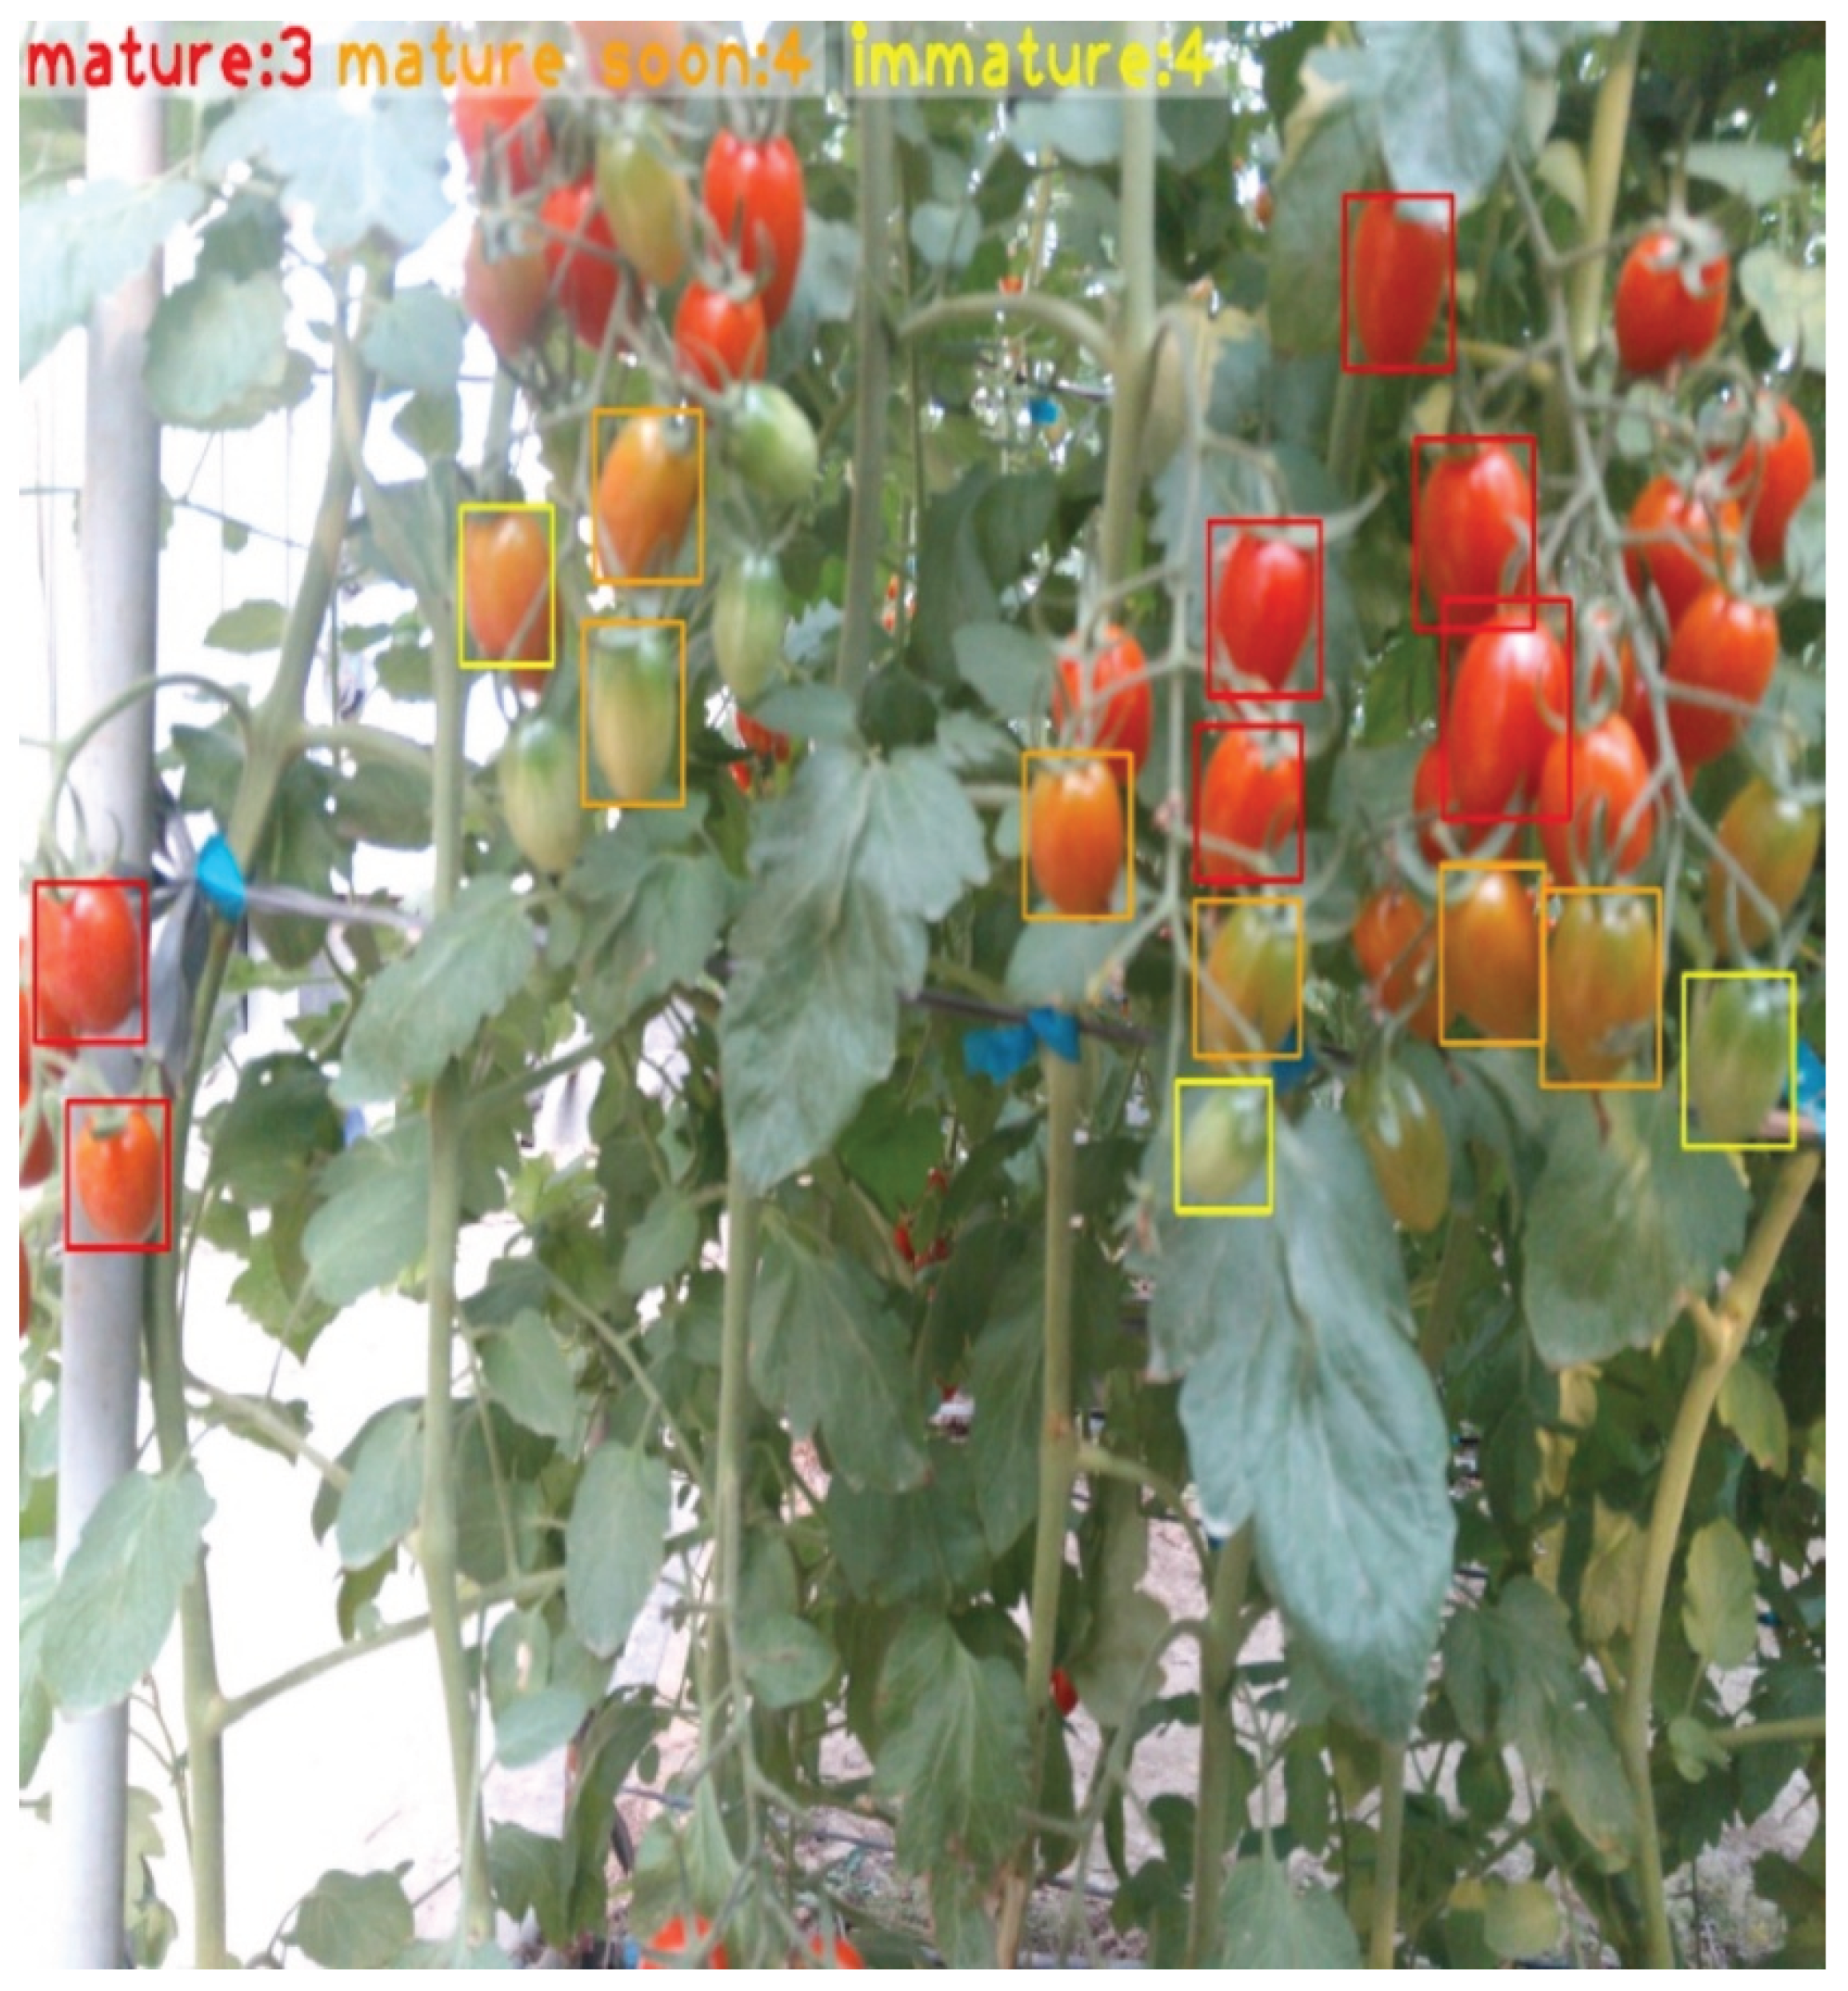

Table 1.
Parameter settings of each classification algorithm.
| Algorithm | SVM | KNN | ANN |
| Kernel function | RBF | - | - |
| Parameter | C=10∼40 | K=2∼30 | epoch=300, bat size=40 |
| Step | 2 | 2 | - |
| Cross-validation | 10-fold | 10-fold | 10-fold |
| Classification index | R,G,B, NDVI, GNDVI, GRRI | ||
Table 2.
Number of tomatoes in each dataset.
| Dataset | Training set | Testing set |
| 19th_tomato | 4247 | 1775 |
| lin_tomato | 4554 | 2423 |
| 19th2_tomato | 8720 | 4338 |
Table 3.
Classification results using different algorithms.
| Dataset | Algorithm | Classification Index | ||
| R,G,B | GNDVI, NDVI, GRRI |
R,G,B, NDVI, GNDVI, GRRI |
||
| 19th_tomato | SVM | 63% | 70% | 63% |
| 19th_tomato | KNN | 64% | 66% | 64% |
| 19th_tomato | ANN | 62% | 73% | 73% |
| lin_tomato | SVM | 64% | 55% | 65% |
| lin_tomato | KNN | 58% | 58% | 58% |
| lin_tomato | ANN | 38% | 75% | 46% |
| 19th2_tomato | SVM | 72% | 70% | 78% |
| 19th2_tomato | KNN | 81% | 59% | 81% |
| 19th2_tomato | ANN | 72% | 58% | 73% |
Table 4.
Comparison of classification results: Red-Blue channels only vs. RGB with all indices (N+G+G = NDVI+GNDVI+GRRI).
Table 4.
Comparison of classification results: Red-Blue channels only vs. RGB with all indices (N+G+G = NDVI+GNDVI+GRRI).
| Dataset | Algorithm | Classification index | ||
| R+G+B | R+B | N+G+G | ||
| 19th_tomato | SVM | 63% | 61% | 70% |
| 19th_tomato | KNN | 64% | 62% | 66% |
| 19th_tomato | ANN | 62% | 54% | 73% |
| lin_tomato | SVM | 64% | 44% | 55% |
| lin_tomato | KNN | 58% | 44% | 58% |
| lin_tomato | ANN | 38% | 50% | 75% |
| 19th2_tomato | SVM | 72% | 66% | 70% |
| 19th2_tomato | KNN | 81% | 64% | 59% |
| 19th2_tomato | ANN | 72% | 66% | 58% |
Table 5.
Results of maturity-based yield estimation.
| Dataset | Ground truth | Prediction | Total number difference | RMSE | ||||||
| -3 | -2 | -1 | total | -3 | -2 | -1 | total | |||
| once a week | ||||||||||
| 19th_tomato(6th) | 0 | 16 | 19 | 35 | 6 | 11 | 17 | 34 | -1 | 4.65 |
| 19th_tomato(7th) | 0 | 3 | 11 | 14 | 1 | 4 | 7 | 12 | -2 | 2.45 |
| lin_tomato(4th) | 16 | 11 | 2 | 29 | 1 | 6 | 0 | 7 | -22 | 9.20 |
| lin_tomato(5th) | 4 | 6 | 9 | 19 | 2 | 4 | 4 | 10 | -9 | 3.32 |
| lin_tomato(6th) | 4 | 4 | 12 | 20 | 1 | 4 | 5 | 10 | -10 | 4.40 |
| lin_tomato(7th) | 10 | 0 | 9 | 18 | 1 | 1 | 2 | 4 | -14 | 6.61 |
| lin_tomato(8th) | 2 | 4 | 1 | 7 | 3 | 2 | 1 | 6 | -1 | 1.29 |
| 19th2_tomato(5th) | 19 | 17 | 1 | 37 | 19 | 7 | 1 | 27 | -10 | 5.77 |
| 19th2_tomato(7th) | 4 | 14 | 14 | 32 | 5 | 10 | 13 | 28 | -4 | 2.45 |
| 19th2_tomato(9th) | 0 | 1 | 10 | 11 | 1 | 1 | 10 | 12 | 1 | 0.58 |
| twice a week | ||||||||||
| 19th2_tomato(5th) | 32 | 4 | 1 | 37 | 22 | 3 | 2 | 27 | -10 | 5.83 |
| 19th2_tomato(6th) | 22 | 8 | 6 | 36 | 8 | 14 | 12 | 34 | -2 | 9.45 |
| 19th2_tomato(7th) | 14 | 10 | 8 | 32 | 9 | 7 | 12 | 28 | -4 | 4.08 |
| 19th2_tomato(8th) | 4 | 10 | 29 | 43 | 2 | 7 | 26 | 35 | -8 | 2.71 |
| 19th2_tomato(9th) | 0 | 1 | 10 | 11 | 0 | 2 | 10 | 12 | 1 | 0.58 |
Disclaimer/Publisher’s Note: The statements, opinions and data contained in all publications are solely those of the individual author(s) and contributor(s) and not of MDPI and/or the editor(s). MDPI and/or the editor(s) disclaim responsibility for any injury to people or property resulting from any ideas, methods, instructions or products referred to in the content. |
© 2026 by the authors. Licensee MDPI, Basel, Switzerland. This article is an open access article distributed under the terms and conditions of the Creative Commons Attribution (CC BY) license.
Copyright: This open access article is published under a Creative Commons CC BY 4.0 license, which permit the free download, distribution, and reuse, provided that the author and preprint are cited in any reuse.


