Submitted:
26 February 2026
Posted:
28 February 2026
You are already at the latest version
Abstract
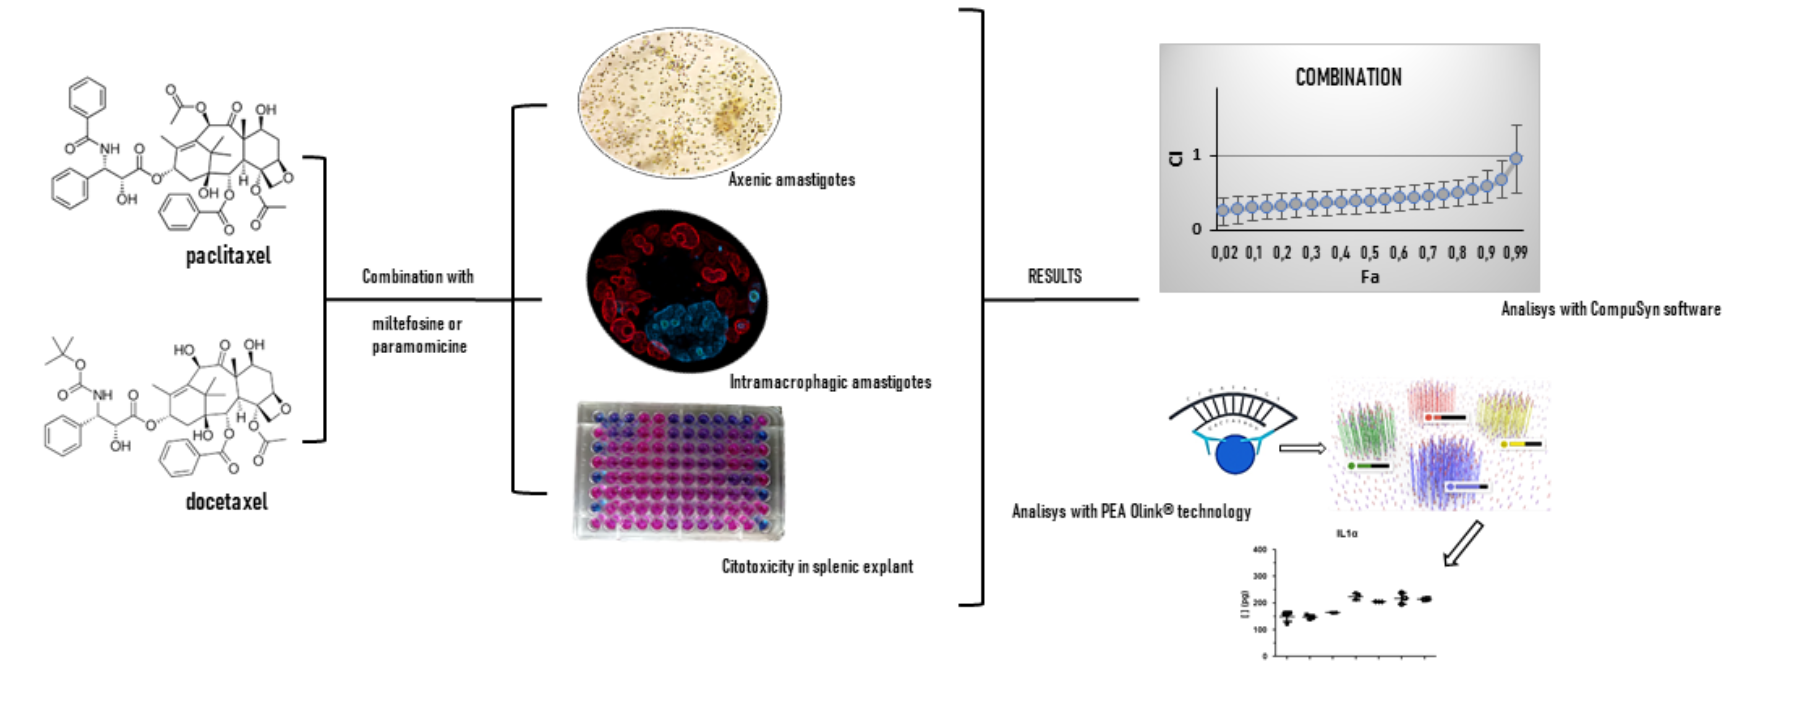
A wide range of Leishmania species, transmitted by phlebotomine, cause a group of diseases known as leishmaniasis, which present diverse clinical manifestations. Leishmaniasis has a high impact on the most vulnerable communities, primarily affecting people suffering from malnutrition or living in poor housing conditions. Due to leishmaniasis are strongly associated with poverty the access to treatment is often limited. Besides, high drug toxicity and therapeutic failure, related to the emergence of drug resistance, remain major challenges associated with currently available treatments. Therefore, there is a need for developing new therapeutic approaches safer and more effective. Drug combinations and drug repurposing are two strategies currently used in the development of new treatments targeting multiple diseases. The combination of drugs with different mechanisms of action can minimize the emergence of resistance and allow drug dosage reduction, increasing the likelihood of successful drug repurposing. The research evaluated the leishmanicidal effects of combining antitumoral agents (paclitaxel and docetaxel) with standard drugs (miltefosine and paromomycin). Results demonstrated synergistic effects at higher doses. Furthermore, the antitumoral compounds boosted the host immune response by promoting macrophage polarization toward the M1 phenotype, which is essential for parasite control. These findings highlight a promising therapeutic approach that could improve treatment efficacy and reduce resistance.
Keywords:
leishmaniasis
; drug combinations
; drug repurposing
; paclitaxel
; docetaxel
; miltefosine
; paromomycin
; cytokines
1. Introduction
According to the 2024 DNDi annual report, more than 1 billion people worldwide are at risk of suffering leishmaniasis, with children accounting for 50% of all reported cases. Leishmaniasis is a neglected tropical disease caused by approximately 20 species of the genus Leishmania, which manifests several clinical forms, depending on the parasite species involved and the host immune response [1]. Transmission occurs through the bite of infected female phlebotomine sandflies, making the disease highly sensitive to environmental and climatic conditions. The ongoing climate change is contributing to the geographical spreading of vectors into previously non-endemic areas, including northern Europe [2]. Consequently, the European Centre for Disease Prevention and Control (ECDC) has developed contingency plans, aimed to prevent the dissemination of this disease within the European Union [3]. Other such as malnutrition, inadequate housing, and population displacement play a significant role in the epidemiology of leishmaniasis, further exacerbating disease burden in vulnerable populations (dndi.org).
The heteroxenus life cycle of Leishmania involves two morphological forms, called promastigotes and amastigotes. Promastigotes develop and multiply in the gut of phlebotomine, whereas amastigotes reside and replicate in the vertebrate host.
Leishmaniasis presents with several main clinical manifestations, visceral leishmaniasis (VL) also known as kala-azar, cutaneous leishmaniasis (CL) and mucocutaneous leishmaniasis (MCL). VL is characterized by spleen and liver enlargement, fever, weigh lost, and is fatal if left untreated. It is estimated that between 50,000 and 90,000 new VL cases occur annually worldwide. CL is the most prevalent form of the disease and typically causes skin ulcers that may result in permanent scarring, which entails physical disability and social stigma. The estimated annual incidence of CL ranges from 600,000 to 1 million new cases. MCL produces the partial or total destruction of mucous membranes of the nose, mouth and throat. Post-kala-azar dermal leishmaniasis (PKDL) is a dermatological sequela of VL that may develop months to years after successful VL treatment. Although PKDL is not life-threatening, it can be disfiguring and contributes to ongoing transmission as well as social stigmatization [4].
The treatment of leishmaniasis is complex and depends on multiple factors, including the clinical form of the disease and the its geographical distribution. Regarding to VL, patients have traditionally required hospitalization due to the administration of painful and toxic im. or iv. injections of pentavalent antimonial drugs, in use for more than six decades. The introduction of iv. injections of liposomal encapsulated amphotericin B (L-AMB), significantly reduced the toxicity associated with conventional amphotericin B in the treatment of VL. However, its high cost has limited widespread implementation, particularly in low- and middle-income countries. At present, miltefosine (MTF), approved in 2004, is currently the only orally available anti-leishmanial drug, the main drawback associated is its teratogenic potential, preventing the use in pregnant women. Paromomycin (PMM) approved in 2006, shows limited efficacy in monotherapy and is therefore mainly employed in combination with antimonials or MTF [5]. Consequently, major limitations associated with the current treatments, include high cost, significant toxicity and the frequent need for hospitalization [6].
The emergence of resistance to current drugs further hinders disease eradication. Prolonged use of the pentavalent antimoniate sodium stibogluconate (SSG) in India, has led the selection of resistant parasites, severely limiting the continued use of this drug [7,8]. Similarly, resistance to MTF has been increasingly reported, particularly among patients with VL [9]. Moreover, multiple resistance events have also been observed in the Mediterranean region, underscoring the global nature of this challenge [10].
The effectiveness of the host immune system, which may be compromised by factors such as HIV co-infections or adverse environmental and/or nutritional conditions, plays a critical role in treatment outcomes and influences the risk of disease relapses [11,12,13,14]. Consequently, there is a growing interest in therapeutic strategies that promote a protective immune response, particularly those favoring macrophage polarization toward M1 phenotype and the activation of Th1-type cellular immunity [15,16,17]. The complex parasite/host interplay and the importance of the immune response in disease progression have also encouraged the realization of genome-wide association studies (GWAS), to identify risk factors associated with different clinical manifestations. These studies can contribute to the development of improved therapies and effective vaccines [18].
For all these reasons, the discovery of novel antileishmanial drugs and optimize treatment regimens is both necessary and urgent [19]. Among the strategies followed by Drugs for Neglected Diseases initiative (DNDi) the development of shorter and safer treatments based on combinations of existing drugs has been prioritized (DNDI.org). Combination therapies enhance therapeutic efficacy, reduce toxicity and limit the emergence of drug resistance [20,21].
In addition to the advantages previously described, about combination therapies increase the likelihood of identifying effective treatments based on drug repurposing strategies, as lower plasma concentration may be necessary to achieve the therapeutic efficacy. Regarding drug repurposing strategy, the prior knowledge of the safety profile and pharmacokinetic aspects of existing drugs, substantially reduces both the cost and time required for drug development and regulatory approval [22,23,24,25,26].
Taxanes stabilize cellular microtubules. Among them, paclitaxel (PTX) and docetaxel (DTX) are widely used antitumoral agents that have demonstrated antileishmanial activity [27]. In particular, PTX can induce the killing of L. major in murine macrophages, through the production of microbial mediators such as NO [28]. Based on these findings we have evaluated the antiparasitic effect of combinations of MTF and PMM with PTX and DTX, using both in vitro (free axenic amastigotes) and ex vivo (intramacrophagic amastigotes) systems. Additionally, we assessed the potential modulating effect of these drug combinations.
2. Results
The antiparasitic effect of the taxanes PTX and DTX, both alone and in combination with MTF or PMM, was evaluated using two forms of iRFP-L. infantum amastigotes. These comprised axenic and intramacrophagic amastigotes, recovered from bone marrow and splenic cells respectively, obtained from infected BALB/c mice as described in the Materials and Methods section. The infrared fluorescence emitted by the cultures exposed to drugs or drug combinations was used to calculate parasite viability following exposure.
2.1. Leishmanicidal Effect of PTX and DTX in Combination with MTF
First, the EC50 values for taxanes and MTF, when applied individually to axenic amastigotes for 72 h were determined (Figure 1). PTX and DTX exhibited similar potencies, with EC50 values of 2.74 ± 0.21 µM and 3.18 ± 0.24 µM respectively, whereas the EC50 for MTF was 1.52 ± 0.02 µM.
Given the similarity of the EC50 values, the combination ratios selected to assess the drug combinations for MTF/PTX and MTF/DTX in bone marrow axenic amastigotes were 1:1, 1:2 and 2:1. The interactions between drugs in these combinations were studied using the Chou-Talalay method implemented in the “CalcuSyn” software. Thus, the combination index was calculated (CI), with CI = 1 indicating additive effect, CI < 1 indicating synergism and CI > 1 indicating antagonism [29,30]. The software fitted the dose-response curves to determine the CI, and the conformity of the data to the fitted curves is indicated by the correlation coefficient (r). The r values obtained for each combination are presented in the Table 1.
Figure 2 and Figure 3 show the CI values for MTF combined with PTX and DTX, plotted against the fraction of dead amastigotes (fa; fraction affected). For the MTF/PTX combinations, the 1:1 ratio was slightly synergistic, with CI values close to 1 (Figure 2a), whereas the 1:2 and 2:1 ratios showed lower CI values, remaining below 1 across the entire range of fa with the 1:2 combination (Figure 2b and Figure 2c). In the case of DTX, the 1:1 combination exhibited synergism only at low fa values, while the 1:2 combination showed the most pronounced synergistic effect (Figure 3).
CalcuSyn software also determine the dose reduction index (DRI), which indicates the fold reduction in the dose of each drug achievable when used in combination compared with single-drug treatment [30]. The DRI values obtained for PTX and DTX in combination with MTX at different fa levels are presented in Table 1. Overall, MTF/PTX combinations yielded higher DRI values than those observed for MTF/DTX combinations (Table 1).
The combination effect of taxanes with MTF was further evaluated using intramacrophagic amastigotes. Based on the results obtained in the previous experiments, the combination 1:2 was selected for assessment. The EC50 values obtained for PTX and DTX were 8.21 ± 1.36 and 9.15 ± 1.21 µM respectively, whereas the EC50 value for MTF in this platform was 2.55 ± 1.01 µM (Figure 4).
2.2. Leishmanicidal Effect of PTX and DTX in Combination with PMM
Given the limited effect of PMM against axenic amastigotes [25,26], the effect of taxanes combined with PMM were evaluated exclusively in intramacrophagic amastigotes. The EC50 value for PMM in this system was 25.54 ± 1.12 µM (Figure 4b). Based on the EC50 value obtained, a 1:1 combination ratio was selected for both of taxanes. As shown in Figure 6, where CI values are presented, synergistic interactions were observed at higher fa values for both PTX and DTX. DRI values at fa values above 75% were also greater for DTX than for (Table 2).
2.3. Cytokine Evaluation
To study whether taxanes promote an immune response favourable to parasite killing, we analysed the cytokines secreted by splenocytes derived from infected BALB/c mice. Splenocytes were treated with these drugs either alone or in combination, using the previously established ratios of 1:2 for MTF/taxane and 1:1 for PMM/taxane. After 72 h of treatment, and subsequent fluorescence measurement, culture supernatants were collected from the assay plates. Two concentrations were selected for cytokine analysis based on parasite mortality and splenocyte viability data. Cytokines were therefore determined at the following concentrations of the dose-response curves: 12.5 and 6.25 µM MTF alone; 25 and 12.5 µM PMM alone; 25 and 12.5 µM taxane alone; 12.5 + 25 µM MTF/taxane; 6.5 + 12.5 µM MTF/taxane, 25 + 25 µM PMM/taxane and 12.5 + 12.5 µM PMM/taxane.
Cytotoxicity of the individual compounds and their combinations, was assessed using primary splenic cultures obtained from uninfected BALB/c mice. These cultures were exposed to drugs alone or in combination, and cell viability was determined using the alamarBlue (Invitrogen) assay as described in the Methods section. Figure 7a shows viability values obtained for the selected concentrations, meanwhile 7b shows parasite viability.
2.3.1. Effect of PTX and DTX in Combination with MTF
Figure 8 and Figure 9 show the cytokine values for which significant differences were observed in the treated samples compared with the control (splenocytes infected and treated with 0.1% DMSO), following statistical analysis using Student's t-test. Treatments involving PTX are presented in Figure 8, whereas data related to DTX are shown in Figure 9.
In samples treated with taxanes, we observed a significant increase in cytokines associated with parasite clearance, promoting macrophage polarization toward the M1 phenotype [31]. Treatments with both concentrations of PTX and DTX alone resulted in a significant increase in IL1α compared with the control; cytokine levels following the combinations were similar to those observed with taxanes alone, where MTF treatment did not induce changes in this cytokine (Figure 8a and Figure 9a). A similar pattern was observed for IL1β, with the additional observation that IL1β levels were also significantly elevated in one of the samples exposed to MTF (Figure 8b and Figure 9b).
TNFα, a key factor in disease control, that enhances macrophage activity and parasite elimination was significantly increased relative to the control in samples treated with taxanes. Combination treatments with MTF did not further enhance TNFα levels compared with taxanes alone, and MTF treatment did not induce changes compared with the control (Figure 8c and Figure 9c).
IL2 plays a central role in stimulating IFNγ production and activating T and NK cells [32,33], but its production has also been involved in limiting Th1 response establishment via a regulatory mechanism independent of conventional Treg cells [34]. In our study, IL2 levels were significantly reduced in samples treated with taxanes and their combinations compared with the control, whereas no significant changes differences were observed following MTF treatment (Figure 8d and Figure 9d).
Regarding IFNγ, treatment with taxanes and their combinations resulted in a significant decrease in its levels (Figure 8e and Figure 9e). However, the chemokine Ccl5, which is upregulated by IFNγ, was increased in three of the samples treated with PTX and in one sample treated with a DTX combination (Figure 8j and Figure 9j). Similarly, Cxcl9, another chemokine regulated by IFNγ, showed increased levels following treatment with 6.25 µM MTF and both concentrations of PTX and DTX compared with the control (Figure 8i and Figure 9i). These results suggest that IFNγ may be upregulated at an earlier stage of the experiment. Both Ccl5 and Cxcl9 have been associated with the recruitment of Th1 cells and protection against the parasite [35].
IL4 and IL5 are associated with suppression of Th1 cells and macrophage deactivation [32,33]. Regarding IL4, DTX reduced its levels, whereas MTF treatment resulted in an increase at the concentrations tested (Figure 9f). No changes were observed in samples treated with PTX alone and combinations involving PTX exhibited a pattern similar to that of MTF (Figure 8f). Concerning IL5 levels, DTX, MTF and their combinations significantly reduced the values compared to the control (Figure 9g). The effect of PTX was less consistent, without any significant differences being observed in the samples (Figure 8g).
IL3 has been associated with both disease progression and parasite clearance. In the context of disease progression, macrophages differentiated under IL3 stimulation have been reported to promote the expansion of Th2 cells [36]. Although high variability was observed in IL3 levels in some samples (12.5 µM MTF; 12.5 µM PTX), others treatments resulted in significant decreases compared with the control (Figure 8h and Figure 9h). PTX induced the expression of granulocyte colony-stimulating factor (G-CSF), which is an important regulator of neutrophil activity [37].
2.3.2. Effect of PTX and DTX in Combination with PMM
Samples exposed to PMM and its combinations with taxanes exhibited similar patterns to those described for IL1α, IL1β, IL2, IFNγ cytokines in their combinations with MTF (Figure 10 and Figure 11). In the case of IL1β, none of the sample treated with PMM/DTX combinations showed a significant increase in cytokine levels (Figure 11b). PMM and taxanes alone increased TNFα levels compared with the control, whereas combination treatments did not further enhance TNFα content (Figure 10c and Figure 11c).
No changes in IL4 levels were observed in samples treated with PMM or PMM/PTX combinations compared with the control (Figure 10f), while PMM/DTX combinations decreased IL4 levels similarly to DTX alone (Figure 11f). PMM treatment also reduced IL5 and IL3 levels at the tested concentrations (Figure 10g, Figure 10h, Figure 11g and Figure 11h). In contrast to PTX, DTX did not affect G-CSF levels (Figure 11k).
3. Discussion
Drug combination and drug repurposing are two strategies increasingly employed in the search for novel therapies across a broad range of diseases. Combination therapies can reduce the required drug dosage and help to overcome drug resistance. The goal of drug repurposing is to identify new therapeutic applications for molecules approved for other indications, thereby reducing both the time and costs associated with the development of new treatments. The dose reduction afforded by drug combination therapies may enhance the success of drug repurposing strategies [25,26].
The natural product PTX and its semisynthetic derivative DTX are widely used anticancer agents that stabilise microtubules, by preventing their depolymerisation and disrupting microtubule dynamics, with antileishmanial activity [27,38,39]. However, their therapeutic application may be limited by adverse side effects and the development of resistance as observed in oncological settings [40,41]. These limitations make taxanes suitable candidates for combination-based approaches. Accordingly, we evaluated the effects of PTX and DTX in combination with MTF and PMM – two drugs currently used for the treatment leishmaniasis – that also are associated with adverse side effects. Our in vivo and ex vivo studies demonstrated synergistic interactions between taxanes and both MTF and PMM.
In addition to direct antiparasitic activity, another important research area in the development of safer and more effective antileishmanial treatments focuses on the induction of a favourable host immune response. In this regard, previous studies have associated that exposure of murine macrophages infected with L. major to PTX enhances the parasite dead through macrophage activation mediated by NO [28].
Different aspects of both innate and adaptative immune responses are compromised during Leishmania infection. Among them the so-called “Th1-Th2 dichotomy” is particularly relevant, as the balance between the Th1 and Th2 responses largely determines the course of the infection. Resistance to the parasite has been associated with the activation of the Th1 response, mediated by IL12, which promotes the production of IFNγ and TNFα by CD4+ and CD8+ T lymphocytes, favouring the polarization of M0 macrophages towards the M1 phenotype. M1 macrophages release reactive oxygen species and NO, leading parasite killing. In contrast, activation of the Th2 response – characterised by the secretion of IL4, IL10, IL13 or TGFβ cytokines and by macrophage polarization toward M2 phenotype – has been associated with disease progression [42,43,44,45,46]. Although this dichotomy has been extensively described, accumulating evidence indicates that immune regulation is more complex than initially thought, with the roles of certain cytokines varying depending on the Leishmania species involved, as well as on the host and the affected organ [33].
In this context, macrophages and their polarization into distinct functional phenotypes are play a central role in the immune response. The expression of TNFα and INFγ cytokines by macrophages, Th1 cells and CD8+ T lymphocytes can lead to the polarization of M0 macrophages toward the M1 phenotype, which is characterised by secretion of TNFα, IL1α, IL1β, IL6, IL12 and Cxcl9 [31]. Our results suggest that PTX and DTX exert immunomodulatory effects that favour Th1 responses and M1 macrophage polarization, as evidenced by increased TNFα, IL1α and IL1β levels in samples treated with these taxanes compared with controls. Although INFγ levels were not increased at the time point analysed, we observed elevated levels chemokines regulated by INFγ, such as Cxcl9 and Ccl5 [35,47], suggesting that INFγ upregulation may occur at an early stage. Both taxanes increased Cxcl9 levels, a chemokine associated with Th1 cell recruitment and reduction of parasite load [48]. In addition, Ccl5 – elevated in PTX-treated samples – is typically produced at high levels during Th1 responses [35], and has been involved in the control of experimental infections with L. major and L. braziliensis [49,50]. The chemotactic role of Ccl5 has also been described in the development of visceral leishmaniasis. While its involvement in the resolution of canine VL remains controversial [51], it has been described its contribution in the resolution of L. donovani infection through the recruitment of mononuclear cells and effective immune control in the liver of C57BL/6 mice [47].
Our results also showed that taxanes led to a reduction in IL2. Previous studies, using experimental infection models have indicated that L. donovani decreased IL2 expression, which was initially interpreted as a mechanism contributing to disease progression due to the role of IL2 in inducing INFγ production and T-cell activation [52]. However, it has been also described that during the early phase of experimental VL, IL2 can induce both INFγ and IL10. The induction of IL10 may subsequently suppress IL2 production, leading to the establishment of infectious tolerance [52].
Limitation of Th1 responses mediated by IL2 has been also attributed to regulatory mechanisms independent of Treg cells [34]. Therefore, the reduction of IL2 induced by taxanes could be operating by inhibiting the blockage of Th1 response.
The decrease in IL4 and IL5 levels, more clearly observed in DTX-treated samples, is consistent with the proposed role of taxanes in promoting Th1 activation and M1 macrophage polarization. IL-4 has been associated with disease progression in experimental infections through the induction of humoral immune responses, macrophage deactivation and suppression of Th1 cells [33,53]. Elevated levels of IL4 and IL5 have been also been reported in samples from patients during the acute-phase of VL compared with healthy controls [54].
The role of IL3 in leishmaniasis remains controversial, as it has been linked to both progression and parasite clearance [32,43]. In the present study, reduced IL3 levels were observed in samples exposed to MTF, PMM, PTX, DTX and their combinations compared with controls, suggesting that IL-3 expression may be associated with infection progression. Previous studies have shown that macrophages differentiated under IL-3 stimulation favour the expansion of Th2 cells [36].
In response to pro-inflammatory cytokines, monocytes, T cells and macrophages produce G-CSF, which enhances neutrophil responses. However, G-CSF need to be tightly regulated to prevent excessive neutrophil activation and subsequent tissue damage [37]. As a consequence, the systemic administration of G-CSF has been shown to increase serum levels of IFNα and IL10, while inhibiting IL1β, IL12, IFNγ and TNFα expression [55]. Consequently, G-CSF has been associated with epithelialization and healing processes in CL, and has been evaluated in combination in experimental models of the disease [56]. On the other hand, in VL experimental models, G-CSF-driven neutrophilia has been associated with immune regulation and parasite persistence rather than effective parasite clearance [57]. PTX has been reported to induce G-CSF expression via NF-κB–dependent pathways [58] which may explain the increased G-CSF levels observed in PTX-treated samples, reflecting the inflammatory environment generated by this taxane, which had not yet downregulated at the time of the analysis.
4. Materials and Methods
4.1. Drugs
DTX and PTX (Thermo Fisher Scientific, USA) were dissolved in dimethyl sulfoxide (DMSO; Thermo Fisher Scientific, USA) to obtain stock solutions at the final concentration of 100 mM. MTF and PMM (Thermo Fisher Scientific, USA) were dissolved in sterile H2O to prepare stock solutions at concentrations of 50 mM and 100 mM respectively.
4.2. Experimental Animals and Ethical Statement
Six-week-old female BALB/c mice were obtained from Janvier Laboratories (St Berthevin Cedex, France) and housed in the Animal Facility of the University of León (Spain) under standard housing conditions with free access to food and water. All animal procedures were conducted in accordance with Spanish Legislation (RD 118/2021, which modifies RD 53/2013) in compliance with European Union Directive (EU 2019/1010). The experimental protocols were reviewed and approved by the Junta de Castilla y León (approval number OEBA-ULE-004-2025).
4.3. Parasites
The iRFP-L. infantum strain was used for in vitro and ex vivo studies. This strain derives from L. infantum BCN150 (MCAN/ES/96/BCN 150) t and was genetically engineered in-house to constitutively produce the infrared fluorescent protein (iRFP). This modification enables near-infrared detection of viable parasites [59]. Promastigotes were grown in Schneider's insect medium (Sigma-Aldrich, Merck, Darmstadt, Germany) supplemented with 20% fetal calf serum (FBS) and antibiotic cocktail (100 U/mL penicillin and 100 µg/mL streptomycin) at 26°C under continuous agitation. iRFP-L. infantum metacyclic promastigotes were used for mouse infection.
4.4. Experimental Infections and Set Up of Primary Cultures
Eight-week-old female Balb/c mice were inoculated intraperitoneally with 2.5 × 10⁹ metacyclic promastigotes of iRFP-L. infantum. Between eight and twelve weeks after inoculation, mice were humanely sacrificed to aseptically obtain infected spleens, as well as the femur and tibia of both hind limbs.
Femur and tibia were used for the isolation of axenic iRFP-L. infantum amastigotes. Briefly, both ends of each bone was cut and bone marrow cells were flushed from the medullary cavity using a 27-gauge needle filled with pre-warmed (37°C) 1 × PBS. The resulting cell suspension was passed through a 100 µm cell strainer and centrifuged at 3500 rpm for 10 min at room temperature. The pellet was resuspended in and incubated at 37°C and 5% CO₂ to allow differentiation into axenic amastigotes. The composition of the amastigote culture medium was: 15 mM KCl; 136 mM KH2PO4; 10 mM K2HPO4.3H2O; 0.5 mM MgSO4.7H2O; 24 mM NaHCO3; 22 mM glucose; 1 mM glutamine, 1 × RPMI 1640 vitamin mixture (Sigma-Aldrich, Merck, Darmstadt, Germany), 10 mM folic acid, 100 mM adenosine, 1 × RPMI amino acid mixture (Sigma-Aldrich, Merck, Darmstadt, Germany), 5 mg/mL hemin, antibiotic cocktail, 25 mM MES and 20% FBS.
Infected spleens were minced into small fragments and incubated for 25 min with 5 mL of 2 mg/mL collagenase D (Merck, Darmstadt, Germany) dissolved in buffer (10 mM HEPES, pH 7.4, 150 mM NaCl, 5 mM KCl, 1 mM MgCl2, and 1.8 mM CaCl2). The resulting suspension was mechanically dissociated by passage through a 100-µm cell using pre-warmed (37°C) 1 × PBS. Cells were centrifuged at 1800 rpm for 7 min at 4°C and incubated in ice for 4 min in erythrocyte lysis buffer (150 mM NH4Cl; KHCO3; EDTA 0.1 mM). The lysis reaction was stopped by adding pre-warmed (37°C) and cells were washed three times by centrifugation at 1800 rpm for 7 min at 4 °C, washing with 1 × PBS between each centrifugation.
The final cell suspension containing infected macrophages, was resuspended in RPMI medium (Gibco, Thermo Fisher Scientific, USA) supplemented with 20% FBS, 1 mM sodium pyruvate, 24 mM NaHCO3, 2 mM L-glutamine, 1× RPMI vitamins, 25 mM HEPES and the antibiotic cocktail.
4.5. Axenic and Intramacrophagic Amastigotes Viability Assays
The antileishmanial effect of the compounds, both individually and in combination, was evaluated using black 384-well microtitre plates with optical bottoms. For axenic amastigote assays, 3 × 10⁴ iRFP-L. infantum parasites were seeded per well in 40 μL of amastigotes culture medium. 40 μL of serial 1/2 or 2/3 dilutions of each compound or combinations, prepared in the same medium, were added to each well. Plates were incubated for 72 h at 37°C under 5% CO₂. Wells containing 0.1% DMSO and 10 μM AMB were used as negative and positive controls respectively.
For intramacrophagic amastigote assays, 40 μL of murine splenocyte suspensions, obtained from infected mice as described above, were mixed with 40 μL of 1/2 or 2/3 dilutions of each drug, either alone or in combination, prepared in supplemented RPMI medium. Plates were also incubated at 37°C under 5% CO₂ for a period of 72 h. As for axenic amastigote assays, negative (0.1% DMSO) and positive controls (10 μM AMB) were included in all the experiments.
Cell viability of both axenic and intramacrophagic amastigotes was assessed by quantifying the fluorescence emitted at 700 nm by the iRFP protein, which is exclusively produced by living parasites, using the LiCor Odyssey® 9120 infrared imaging system (LI-COR Biotech, LLC, USA). Fluorescence values obtained from negative control wells (0.1% DMSO), were considered as 100% parasite viability.
EC50 values for each drug or combination were calculated by plotting the fluorescence emitted by viable parasites, against drug concentration, using the non-linear fitting analysis provided by the Sigma Plot 10.1 statistical package.
4.6. Cell Cytotoxicity
Cytotoxicity assays were performed using splenic cell explants obtained from uninfected mice and prepared as previously described. Cells were counted microscopically and seeded in 96-well plates at a density of 1 × 10⁶ cells per well. Serial dilutions of the compounds and their combinations, both dissolved in supplemented RPMI medium, were added. Solutions of 0.1% H2O2 and 0.1% DMSO were used as positive and negative controls respectively. Plates were incubated for 72 h at 37°C under 5% CO₂. Cell viability was then assessed using the Alamar Blue assay (Invitrogen, Thermo Fisher Scientific, USA) following the manufacturer's instructions. Absorbance was measured using a Varioskan™ LUX Multimode Microplate Reader (Thermo Fisher Scientific, USA). Cell viability was estimated by defining the absorbance values of the negative control wells as 100% viability. Data obtained were evaluated using the non-linear regression analysis with the Sigma Plot 10.1 statistical package.
4.7. Cytokine Analysis
After 72 h of exposure to the compounds, supernatants from infected spleen explant cultures were collected for subsequent cytokine analysis. Cytokine profiling was performed by COBIOMIC (Parque Científico Tecnológico de Córdoba, Rabanales 21. C/Astrónoma Cecilia Payne ID 8.1, Edif. Centauro, 14,014 Córdoba, Spain), using Proximity Extension Assay (PEA) technology developed by Olink®.
The cytokines evaluated were:
|
Interleukin superfamily Cytokines Pro-interleukin-16 (Il16) O54824 C-C motif chemokine 22 (Ccl22) O88430 Interleukin-1 alpha (Il1a) P01582 Granulocyte-macrophage colony-stimulating factor (Csf2) P01587 Interleukin-4 (Il4) P07750 Macrophage colony-stimulating factor 1 (Csf1) P07141 Interleukin-6 (Il6) P08505 Granulocyte colony-stimulating factor (Csf3) P09920 Interleukin-1 beta (Il1b) P10749 C-C motif chemokine 2 (Ccl2) P10148 Interleukin-9 (Il9) P15247 C-C motif chemokine 4 (Ccl4) P14097 Interferon lambda-2 (Ifnl2) Q4VK74 C-C motif chemokine 5 (Ccl5) P30882 Interleukin-31 (Il31) Q6EAL8 Eotaxin (Ccl11) P48298 Interleukin-33 (Il33) Q8BVZ5 C-C motif chemokine 12 (Ccl12) Q62401 Interleukin-27 subunit alpha (Il27) Q8K3I6 C-C motif chemokine 17 (Ccl17) Q9WUZ6 Interleukin-21 (Il21) Q9ES17 Interleukin-3 (Il3) P01586 Other Interleukin-2 (Il2) P04351 Fibroblast growth factor 21 (Fgf21) Q9JJN1 Interleukin-5 (Il5) P04401 Cytotoxic T-lymphocyte protein 4 (Ctla4) P09793 Interleukin-7 (Il7) P10168 Programmed cell death 1 ligand 1 (Cd274) Q9EP73 Interleukin-10 (Il10) P18893 Tumor necrosis factor (Tnf) P06804 Interleukin-12 (Il12a, Il12b) P43431, P43432 Interferon alpha-2 (Ifna2) P01573 Interleukin-17A (Il17a) Q62386 Interferon gamma (Ifng) P01580 Interleukin-17F (Il17f) Q7TNI7 Hepatocyte growth factor (Hgf) Q08048 Interleukin-22 (Il22) Q9JJY9 Programmed cell death 1 ligand 2 (Pdcd1lg2) Q9WUL5 Chemokines C-X-C motif chemokine 2 (Cxcl2) P10889 Growth-regulated alpha protein (Cxcl1) P12850 C-X-C motif chemokine 9 (Cxcl9) P18340 Stromal cell-derived factor 1 (Cxcl12) P40224 C-X-C motif chemokine 11 (Cxcl11) Q9JHH5 |
4.8. Statistical Analysis
The type of interaction obtained for the different drug combinations against axenic and intramacrophagic iRFP-L. infantum amastigotes was analysed using CalcuSyn software version 2.1 (Biosoft, Cambridge, UK, 1996–2007). Drug interactions were characterized using the combination index (CI)-median-effect isobologram equation. Isobologram analysis requires the construction of dose-response curves for each drug alone and in combination at multiple concentrations. These curves are defined by the parameters Dm (median-effect dose producing 50% inhibition), m (coefficient signifying the shape of the dose-response curve) and r (correlation coefficient indicating the conformity of the data with the curve). The statistical analysis for cytokines was performed using the Student's t-test. Levels of statistical significance were: *p≤ 0.05; **p≤ 0.01; ***p≤ 0.001).
5. Conclusions
Taken together, our data indicate that PTX and DTX exert a favourable immunomodulatory effect by promoting M1 macrophage polarization and Th1 responses. However, combinations of taxanes with MTF or PMM did not further enhance modulation beyond that observed with taxanes alone.
Author Contributions
Conceptualization, Y.P.P., R.B.F. and R.M.R.; methodology, E.M.F.; software, E.M.F.; validation, Y.P.P. and R.B.F.; formal analysis, Y.P.P., E.M.F. and R.B.F.; investigation, E.M.F., Y.P.P. and R.B.F.; resources, R.B.F., R.M.R.,Y.P.P. and C.G.E..; data curation, E.M.F., Y.P.P., C.G.E., C.F.R. and R.B.F.; writing—original draft preparation, Y.P.P.; writing—review and editing, E.M.F., R.B.F., C.G.E., C.F.R., M.C.A.; visualization, E.M.F., M.C.A.; supervision, Y.P.P. and R.B.F.; project administration, R.M.R.; funding acquisition, R.B.F. All authors read and approved the final manuscript.
Funding
This research was partially funded by Dir. Gral. de Universidades e Investigación Junta de Castilla y León (LE017-G24).
Institutional Review Board Statement
All applicable institutional and national guidelines for care and use of animals were followed. Animal use was approved by the University of León (Subcomité para la Experimentación y Bienestar animal) and Junta de Castilla y León (Dirección General de Producción Agricola y Ganadera) according to Spanish legislation (RD 118/2021, which modifies RD 53/2013) (Code:OEBA-ULE-004-2025). No human subjects were involved.
Informed Consent Statement
Not applicable.
Data Availability Statement
The raw data generated in this study have been deposited in Zenodo repository. 10.5281/zenodo.18324944.
Acknowledgments
The authors would like to thank Irene Pilar Martínez Torres for her impeccable work preparing culture medium and other reagents.
Conflicts of Interest
The authors declare no conflicts of interest.
Abbreviations
The following abbreviations are used in this manuscript:
| AMB | amphotericin B |
| CI | combination index |
| CL | cutaneous leishmaniasis |
| Dm | median-effect dose producing 50% inhibition |
| DRI | dose reduction index |
| DTX | docetaxel |
| fa | fraction affected |
| L-AMB | liposomal encapsulated amphotericin B |
| m | coefficient signifying the shape of the dose-response curve |
| MCL | mucocutaneous leishmaniasis |
| MTF | miltefosine |
| PKDL | post-kala-azar dermal leishmaniasis |
| PMM | paromomycin |
| PTX | paclitaxel |
| r | correlation coefficient |
| VL | visceral leishmaniasis |
References
- Pareyn, M; Alves, F; Burza, S; et al. Leishmaniasis. Nat Rev Dis Primers 2025, 11, 81. [Google Scholar] [CrossRef]
- Paz, S. The potential of climatic suitability indicator for Leishmania transmission modelling in Europe: insights and suggested directions. Lancet Reg Health Eur. 2024, 43, 100995. [Google Scholar] [CrossRef]
- Surveillance, prevention and control of leishmaniases in the European Union and its neighbouring countries. Available online: https://www.ecdc.europa.eu/sites/default/files/documents/leishmaniasis-surveillance-eu.pdf (accessed on 24 february 2026).
- Leishmaniasis. Available online: https://www.who.int/news-room/fact-sheets/detail/leishmaniasis (accessed on 24 february 2026).
- Majoor, A; Michel, G; Marty, P; Boyer, L; Pomares, C. Leishmaniases: Strategies in treatment development. Leishmanioses: stratégies de développement de traitements. Parasite. 2025, 32, 18. [Google Scholar] [CrossRef]
- Zhang, H; Yan, R; Liu, Y; et al. Progress in antileishmanial drugs: Mechanisms, challenges, and prospects. PLoS Negl Trop Dis. 2025, 19, e0012735. [Google Scholar] [CrossRef]
- Hefnawy, A; Berg, M; Dujardin, JC; De Muylder, G. Exploiting Knowledge on Leishmania Drug Resistance to Support the Quest for New Drugs. Trends Parasitol. 2017, 33, 162–174. [Google Scholar] [CrossRef]
- Hefnawy, A; Cantizani, J; Peña, I; et al. Importance of secondary screening with clinical isolates for anti-leishmania drug discovery. Sci Rep. 2018, 8, 11765. [Google Scholar] [CrossRef] [PubMed]
- Khanra, S; Sarraf, NR; Das, AK; Roy, S; Manna, M. Miltefosine Resistant Field Isolate From Indian Kala-Azar Patient Shows Similar Phenotype in Experimental Infection. Sci Rep. 2017, 7, 10330. [Google Scholar] [CrossRef] [PubMed]
- Carrasco-Martin, M; Martí-Carreras, J; Gómez-Ponce, M; et al. Insights on genomic profiles of drug resistance and virulence in a cohort of Leishmania infantum isolates from the Mediterranean area. Parasit Vectors. 2025, 19, 28. [Google Scholar] [CrossRef]
- Mougneau, E; Bihl, F; Glaichenhaus, N. Cell biology and immunology of Leishmania. Immunol Rev. 2011, 240, 286–296. [Google Scholar] [CrossRef] [PubMed]
- Mirzaei, A; Maleki, M; Masoumi, E; Maspi, N. A historical review of the role of cytokines involved in leishmaniasis. Cytokine 2021, 145, 155297. [Google Scholar] [CrossRef]
- Serafim, TD; Coutinho-Abreu, IV; Dey, R; et al. Leishmaniasis: the act of transmission. Trends Parasitol. 2021, 37, 976–987. [Google Scholar] [CrossRef] [PubMed]
- Alves, NO; Oshiro, JA; Silva, YC; et al. VL-HIV co-infection with Leishmania containing skin lesions resembling para-kala-azar dermal leishmaniasis. PLoS Negl Trop Dis. 2024, 18, e0012438. [Google Scholar] [CrossRef] [PubMed]
- Ibarra-Meneses, AV; Moreno, J; Carrillo, E. New Strategies and Biomarkers for the Control of Visceral Leishmaniasis. Trends Parasitol. 2020, 36, 29–38. [Google Scholar] [CrossRef]
- Iqbal Yatoo, M; Hamid, Z; Rather, I; et al. Immunotherapies and immunomodulatory approaches in clinical trials - a mini review. Hum Vaccin Immunother. 2021, 17, 1897–1909. [Google Scholar] [CrossRef]
- Singh, VK; Tiwari, R; Rajneesh; et al. Advancing Treatment for Leishmaniasis: From Overcoming Challenges to Embracing Therapeutic Innovations. ACS Infect Dis. 2025, 11, 47–68. [Google Scholar] [CrossRef]
- Blackwell, JM; Fakiola, M; Castellucci, LC. Human genetics of leishmania infections. Hum Genet. 2020, 139, 813–819. [Google Scholar] [CrossRef]
- Oliveira, EG; Lanza, JS; Cojean, S; et al. Re-sensitization of antimony-resistant Leishmania by highly potent SbV-porphyrin through the involvement of ERG6-coding gene. Biomed Pharmacother. 2025, 187, 118059. [Google Scholar] [CrossRef]
- Uliana, SRB; Trinconi, CT; Coelho, AC. Chemotherapy of leishmaniasis: present challenges. Parasitology. 2018, 145, 464–480. [Google Scholar] [CrossRef]
- van Griensven, J; Dorlo, TP; Diro, E; Costa, C; Burza, S. The status of combination therapy for visceral leishmaniasis: an updated review. Lancet Infect Dis. 2024, 24, e36–e46. [Google Scholar] [CrossRef]
- Pushpakom, S; Iorio, F; Eyers, PA; et al. Drug repurposing: progress, challenges and recommendations. Nat Rev Drug Discov. 2019, 18, 41–58. [Google Scholar] [CrossRef] [PubMed]
- Fernández-Rubio, C; Larrea, E; Peña Guerrero, J; et al. Leishmanicidal Activity of Isoselenocyanate Derivatives. Antimicrob Agents Chemother. 2019, 63, e00904-18. [Google Scholar] [CrossRef]
- El-Dirany, R; Fernández-Rubio, C; Peña-Guerrero, J; et al. Repurposing the Antibacterial Agents Peptide 19-4LF and Peptide 19-2.5 for Treatment of Cutaneous Leishmaniasis. Pharmaceutics. 2022, 14, 2528. [Google Scholar] [CrossRef]
- Melcon-Fernandez, E; Galli, G; García-Estrada, C; Balaña-Fouce, R; Reguera, RM; Pérez-Pertejo, Y. Miltefosine and Nifuratel Combination: A Promising Therapy for the Treatment of Leishmania donovani Visceral Leishmaniasis. Int J Mol Sci. 2023, 24, 1635. [Google Scholar] [CrossRef]
- Melcón-Fernández, E; Galli, G; Balaña-Fouce, R; et al. In Vitro and Ex Vivo Synergistic Effect of Pyrvinium Pamoate Combined with Miltefosine and Paromomycin against Leishmania. Trop Med Infect Dis. 2024, 9, 30. [Google Scholar] [CrossRef]
- Domínguez-Asenjo, B; Gutiérrez-Corbo, C; Álvarez-Bardón, M; Pérez-Pertejo, Y; Balaña-Fouce, R; Reguera, RM. Ex Vivo Phenotypic Screening of Two Small Repurposing Drug Collections Identifies Nifuratel as a Potential New Treatment against Visceral and Cutaneous Leishmaniasis. ACS Infect Dis. 2021, 7, 2390–2401. [Google Scholar] [CrossRef]
- Doherty, TM; Sher, A; Vogel, SN. Paclitaxel (Taxol)-induced killing of Leishmania major in murine macrophages. Infect Immun. 1998, 66, 4553–4556. [Google Scholar] [CrossRef] [PubMed]
- Chou, TC; Talalay, P. Quantitative analysis of dose-effect relationships: the combined effects of multiple drugs or enzyme inhibitors. Adv Enzyme Regul. 1984, 22, 27–55. [Google Scholar] [CrossRef] [PubMed]
- Chou, TC. Theoretical basis, experimental design, and computerized simulation of synergism and antagonism in drug combination studies. Pharmacol Rev. 2006, 58, 621–681. [Google Scholar] [CrossRef]
- Almeida, FS; Vanderley, SER; Comberlang, FC; et al. Leishmaniasis: Immune Cells Crosstalk in Macrophage Polarization. Trop Med Infect Dis. 2023, 8, 276. [Google Scholar] [CrossRef] [PubMed]
- Bhor, R; Rafati, S; Pai, K. Cytokine saga in visceral leishmaniasis. Cytokine. 2021, 147, 155322. [Google Scholar] [CrossRef]
- Samant, M; Sahu, U; Pandey, SC; Khare, P. Role of Cytokines in Experimental and Human Visceral Leishmaniasis. Front Cell Infect Microbiol. 2021, 11, 624009. [Google Scholar] [CrossRef] [PubMed]
- Ramer-Tait, AE; Petersen, CA; Jones, DE. IL-2 limits IL-12 enhanced lymphocyte proliferation during Leishmania amazonensis infection. Cell Immunol. 2011, 270, 32–39. [Google Scholar] [CrossRef]
- Upadhyay, S; Kumar, S; Singh, VK; et al. Chemokines Signature and T Cell Dynamics in Leishmaniasis: Molecular insight and therapeutic application. Expert Rev Mol Med. 2024, 27, 1–55. [Google Scholar] [CrossRef]
- Saha, B; Saini, A; Germond, R; Perrin, PJ; Harlan, DM; Davis, TA. Susceptibility or resistance to Leishmania infection is dictated by the macrophages evolved under the influence of IL-3 or GM-CSF. Eur J Immunol. 1999, 29, 2319–2329. [Google Scholar] [CrossRef]
- Martin, KR; Wong, HL; Witko-Sarsat, V; Wicks, IP. G-CSF - A double edge sword in neutrophil mediated immunity. Semin Immunol. 2021, 54, 101516. [Google Scholar] [CrossRef]
- Havens, CG; Bryant, N; Asher, L; et al. Cellular effects of leishmanial tubulin inhibitors on L. donovani. Mol Biochem Parasitol. 2000, 110, 223–236. [Google Scholar] [CrossRef]
- Christensen, SB. Drugs That Changed Society: Microtubule-Targeting Agents Belonging to Taxanoids, Macrolides and Non-Ribosomal Peptides. Molecules. 2022, 27, 5648. [Google Scholar] [CrossRef]
- Marupudi, NI; Han, JE; Li, KW; Renard, VM; Tyler, BM; Brem, H. Paclitaxel: a review of adverse toxicities and novel delivery strategies. Expert Opin Drug Saf. 2007, 6, 609–621. [Google Scholar] [CrossRef] [PubMed]
- Abdu, SA; Caiyun, H; Asaad, WA; et al. Comparative efficacy and safety of cabazitaxel versus other taxanes: a systematic review and meta-analysis. Syst Rev. 2025, 14, 210. [Google Scholar] [CrossRef] [PubMed]
- Mills, CD. M1 and M2 Macrophages: Oracles of Health and Disease. Crit Rev Immunol. 2012, 32, 463–488. [Google Scholar] [CrossRef]
- Dayakar, A; Chandrasekaran, S; Kuchipudi, SV; Kalangi, SK. Cytokines: Key Determinants of Resistance or Disease Progression in Visceral Leishmaniasis: Opportunities for Novel Diagnostics and Immunotherapy. Front Immunol. 2019, 10, 670. [Google Scholar] [CrossRef]
- Vacas, A; Fernández-Rubio, C; Larrea, E; Peña-Guerrero, J; Nguewa, PA. LmjF.22.0810 from Leishmania major Modulates the Th2-Type Immune Response and Is Involved in Leishmaniasis Outcome. Biomedicines. 2020, 8, 452. [Google Scholar] [CrossRef] [PubMed]
- Costa-da-Silva, AC; Nascimento, DO; Ferreira, JRM; et al. Immune Responses in Leishmaniasis: An Overview. Trop Med Infect Dis. 2022, 7, 54. [Google Scholar] [CrossRef]
- Ayala, A; Llanes, A; Lleonart, R; Restrepo, CM. Advances in Leishmania Vaccines: Current Development and Future Prospects. Pathogens. 2024, 13, 812. [Google Scholar] [CrossRef]
- Murray, HW; Luster, AD; Zheng, H; Ma, X. Gamma Interferon-Regulated Chemokines in Leishmania donovani Infection in the Liver. Infect Immun. 2016, 85, e00824-16. [Google Scholar] [CrossRef] [PubMed]
- de Araújo, FF; Costa-Silva, MF; Pereira, AAS; et al. Chemokines in Leishmaniasis: Map of cell movements highlights the landscape of infection and pathogenesis. Cytokine. 2021, 147, 155339. [Google Scholar] [CrossRef]
- Santiago, HC; Oliveira, CF; Santiago, L; et al. Involvement of the chemokine RANTES (CCL5) in resistance to experimental infection with Leishmania major. Infect Immun. 2004, 72, 4918–4923. [Google Scholar] [CrossRef]
- Rêgo, FD; Fradico, JRB; Teixeira-Carvalho, A; Gontijo, CMF. Molecular variants of Leishmania (Viannia) braziliensis trigger distinct patterns of cytokines and chemokines expression in golden hamster. Mol Immunol. 2019, 106, 36–45. [Google Scholar] [CrossRef]
- Menezes-Souza, D; Guerra-Sá, R; Carneiro, CM; et al. Higher expression of CCL2, CCL4, CCL5, CCL21, and CXCL8 chemokines in the skin associated with parasite density in canine visceral leishmaniasis. PLoS Negl Trop Dis. 2012, 6, e1566. [Google Scholar] [CrossRef] [PubMed]
- Bodas, M; Jain, N; Awasthi, A; et al. Inhibition of IL-2 induced IL-10 production as a principle of phase-specific immunotherapy. J Immunol. 2006, 177, 4636–4643. [Google Scholar] [CrossRef]
- Pérez-Cabezas, B; Cecílio, P; Gaspar, TB; Gärtner, F; Vasconcellos, R; Cordeiro-da-Silva, A. Understanding Resistance vs. Susceptibility in Visceral Leishmaniasis Using Mouse Models of Leishmania infantum Infection. Front Cell Infect Microbiol. 2019, 9, 30. [Google Scholar] [CrossRef] [PubMed]
- Mulè, A; Crosato, V; Kuhns, DB; et al. Visceral Leishmaniasis in Immunocompetent Hosts in Brescia: A Case Series and Analysis of Cytokine Cascade. Microorganisms. 2024, 12, 394. [Google Scholar] [CrossRef]
- Rutella, S; Bonanno, G; Pierelli, L; et al. Granulocyte colony-stimulating factor promotes the generation of regulatory DC through induction of IL-10 and IFN-alpha. Eur J Immunol. 2004, 34, 1291–1302. [Google Scholar] [CrossRef]
- Suprien, C; Guimarães, LH; de Carvalho, LP; Machado, PRL. Pentavalent Antimony Associated with G-CSF in the Treatment of Cutaneous Leishmaniasis Caused by Leishmania (Viannia) braziliensis. Pathogens. 2024, 13, 301. [Google Scholar] [CrossRef]
- Murray, HW; Cervia, JS; Hariprashad, J; Taylor, AP; Stoeckle, MY; Hockman, H. Effect of granulocyte-macrophage colony-stimulating factor in experimental visceral leishmaniasis. J Clin Invest. 1995, 95, 1183–1192. [Google Scholar] [CrossRef] [PubMed]
- Zaks-Zilberman, M; Zaks, TZ; Vogel, SN. Induction of proinflammatory and chemokine genes by lipopolysaccharide and paclitaxel (Taxol) in murine and human breast cancer cell lines. Cytokine. 2001, 15, 156–165. [Google Scholar] [CrossRef] [PubMed]
- Calvo-Álvarez, E; Stamatakis, K; Punzón, C; et al. Infrared fluorescent imaging as a potent tool for in vitro, ex vivo and in vivo models of visceral leishmaniasis. PLoS Negl Trop Dis. 2015, 9, e0003666. [Google Scholar] [CrossRef]
Figure 1.
Dose-response curves of DTX (a), PTX (b) and MTF (c) against iRFP-L. infantum amastigotes obtained from the bone marrow cells of infected BALB/c mice. Serial dilutions of DTX and PTX (½ and ⅔ dilutions) were prepared, from a starting concentration of 100 µM. MTF was serially diluted (⅔ dilutions) from 10 µM. Dose-response curves were fitted using SigmaPlot software. Results represent the mean ± SD of three independent experiments with five technical replicates each.
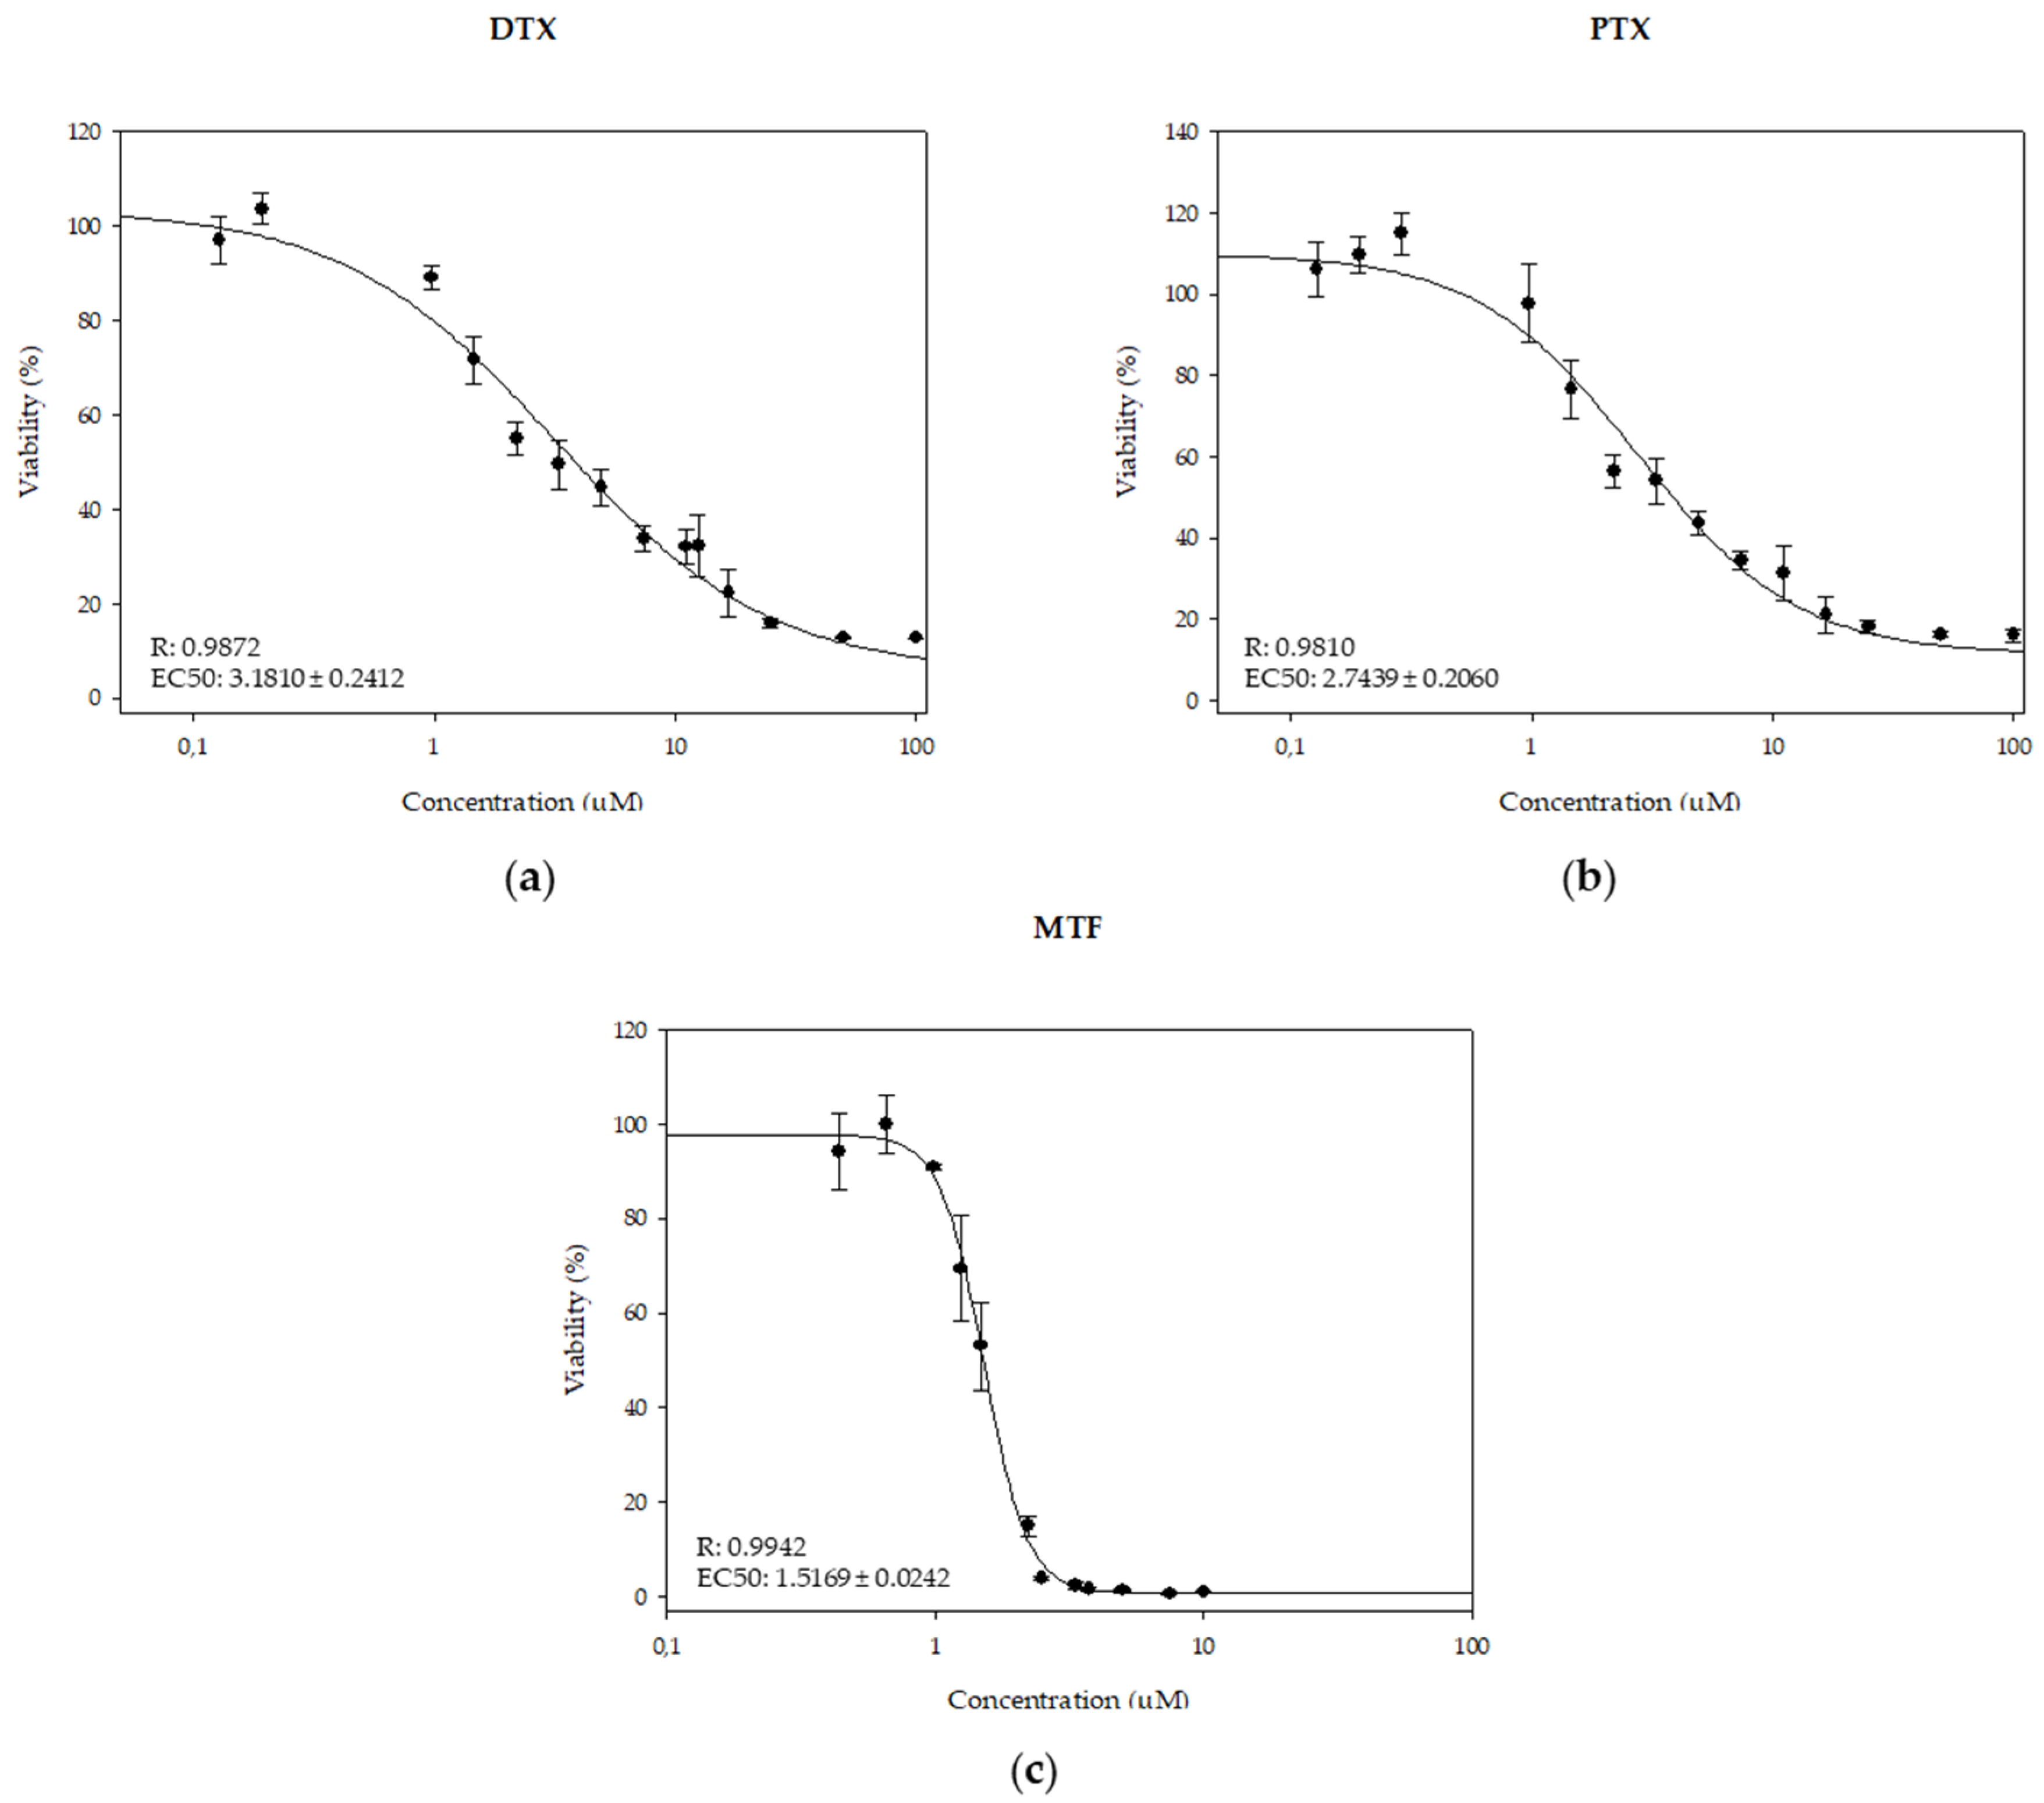
Figure 2.
Interaction effect of MTF/PTX combinations (1:1 (a), 1:2 (b) and 2:1 (c)) on iRFP-L. infantum axenic amastigotes, expressed as CI versus fa, calculated using CalcuSyn software. Data were obtained with the mean of three different experiments with three technical replicates each.
Figure 2.
Interaction effect of MTF/PTX combinations (1:1 (a), 1:2 (b) and 2:1 (c)) on iRFP-L. infantum axenic amastigotes, expressed as CI versus fa, calculated using CalcuSyn software. Data were obtained with the mean of three different experiments with three technical replicates each.
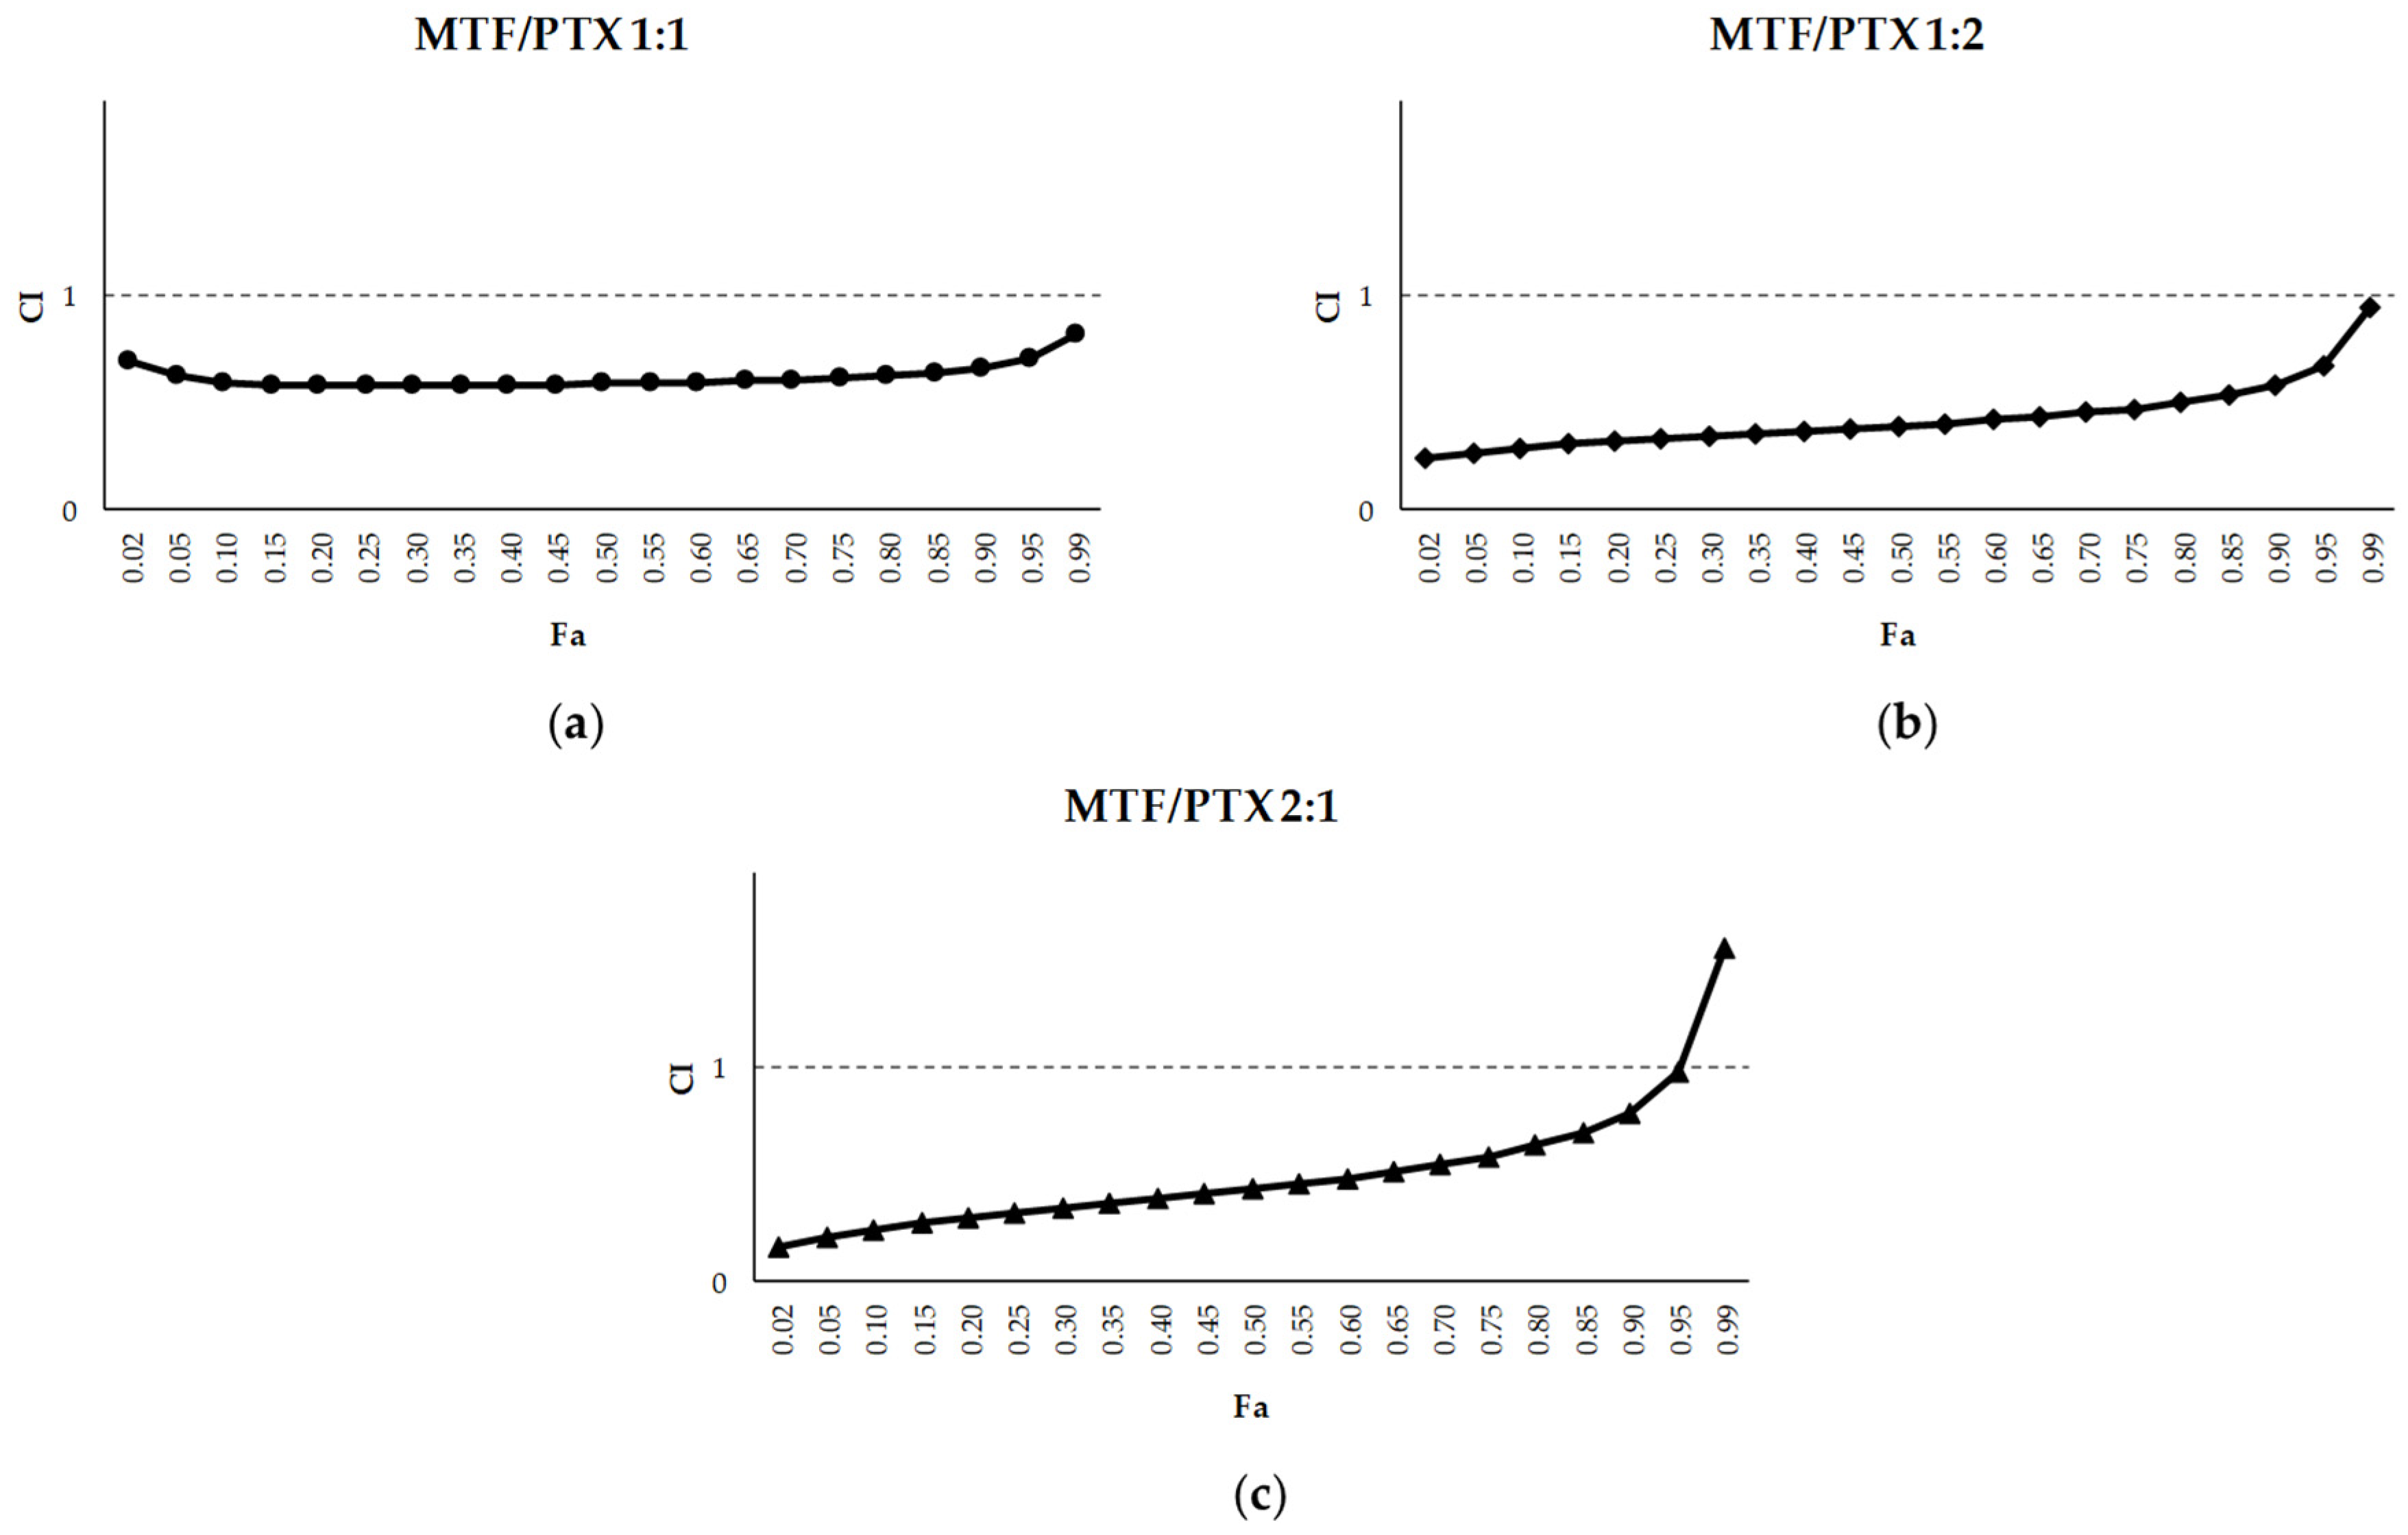
Figure 3.
Interaction effect of MTF/DTX combinations (1:1 (a), 1:2 (b) and 2:1 (c)) on iRFP-L. infantum axenic amastigotes, expressed as CI versus fa, calculated using CalcuSyn software. Data were obtained with the mean of three different experiments with three technical replicates each.
Figure 3.
Interaction effect of MTF/DTX combinations (1:1 (a), 1:2 (b) and 2:1 (c)) on iRFP-L. infantum axenic amastigotes, expressed as CI versus fa, calculated using CalcuSyn software. Data were obtained with the mean of three different experiments with three technical replicates each.
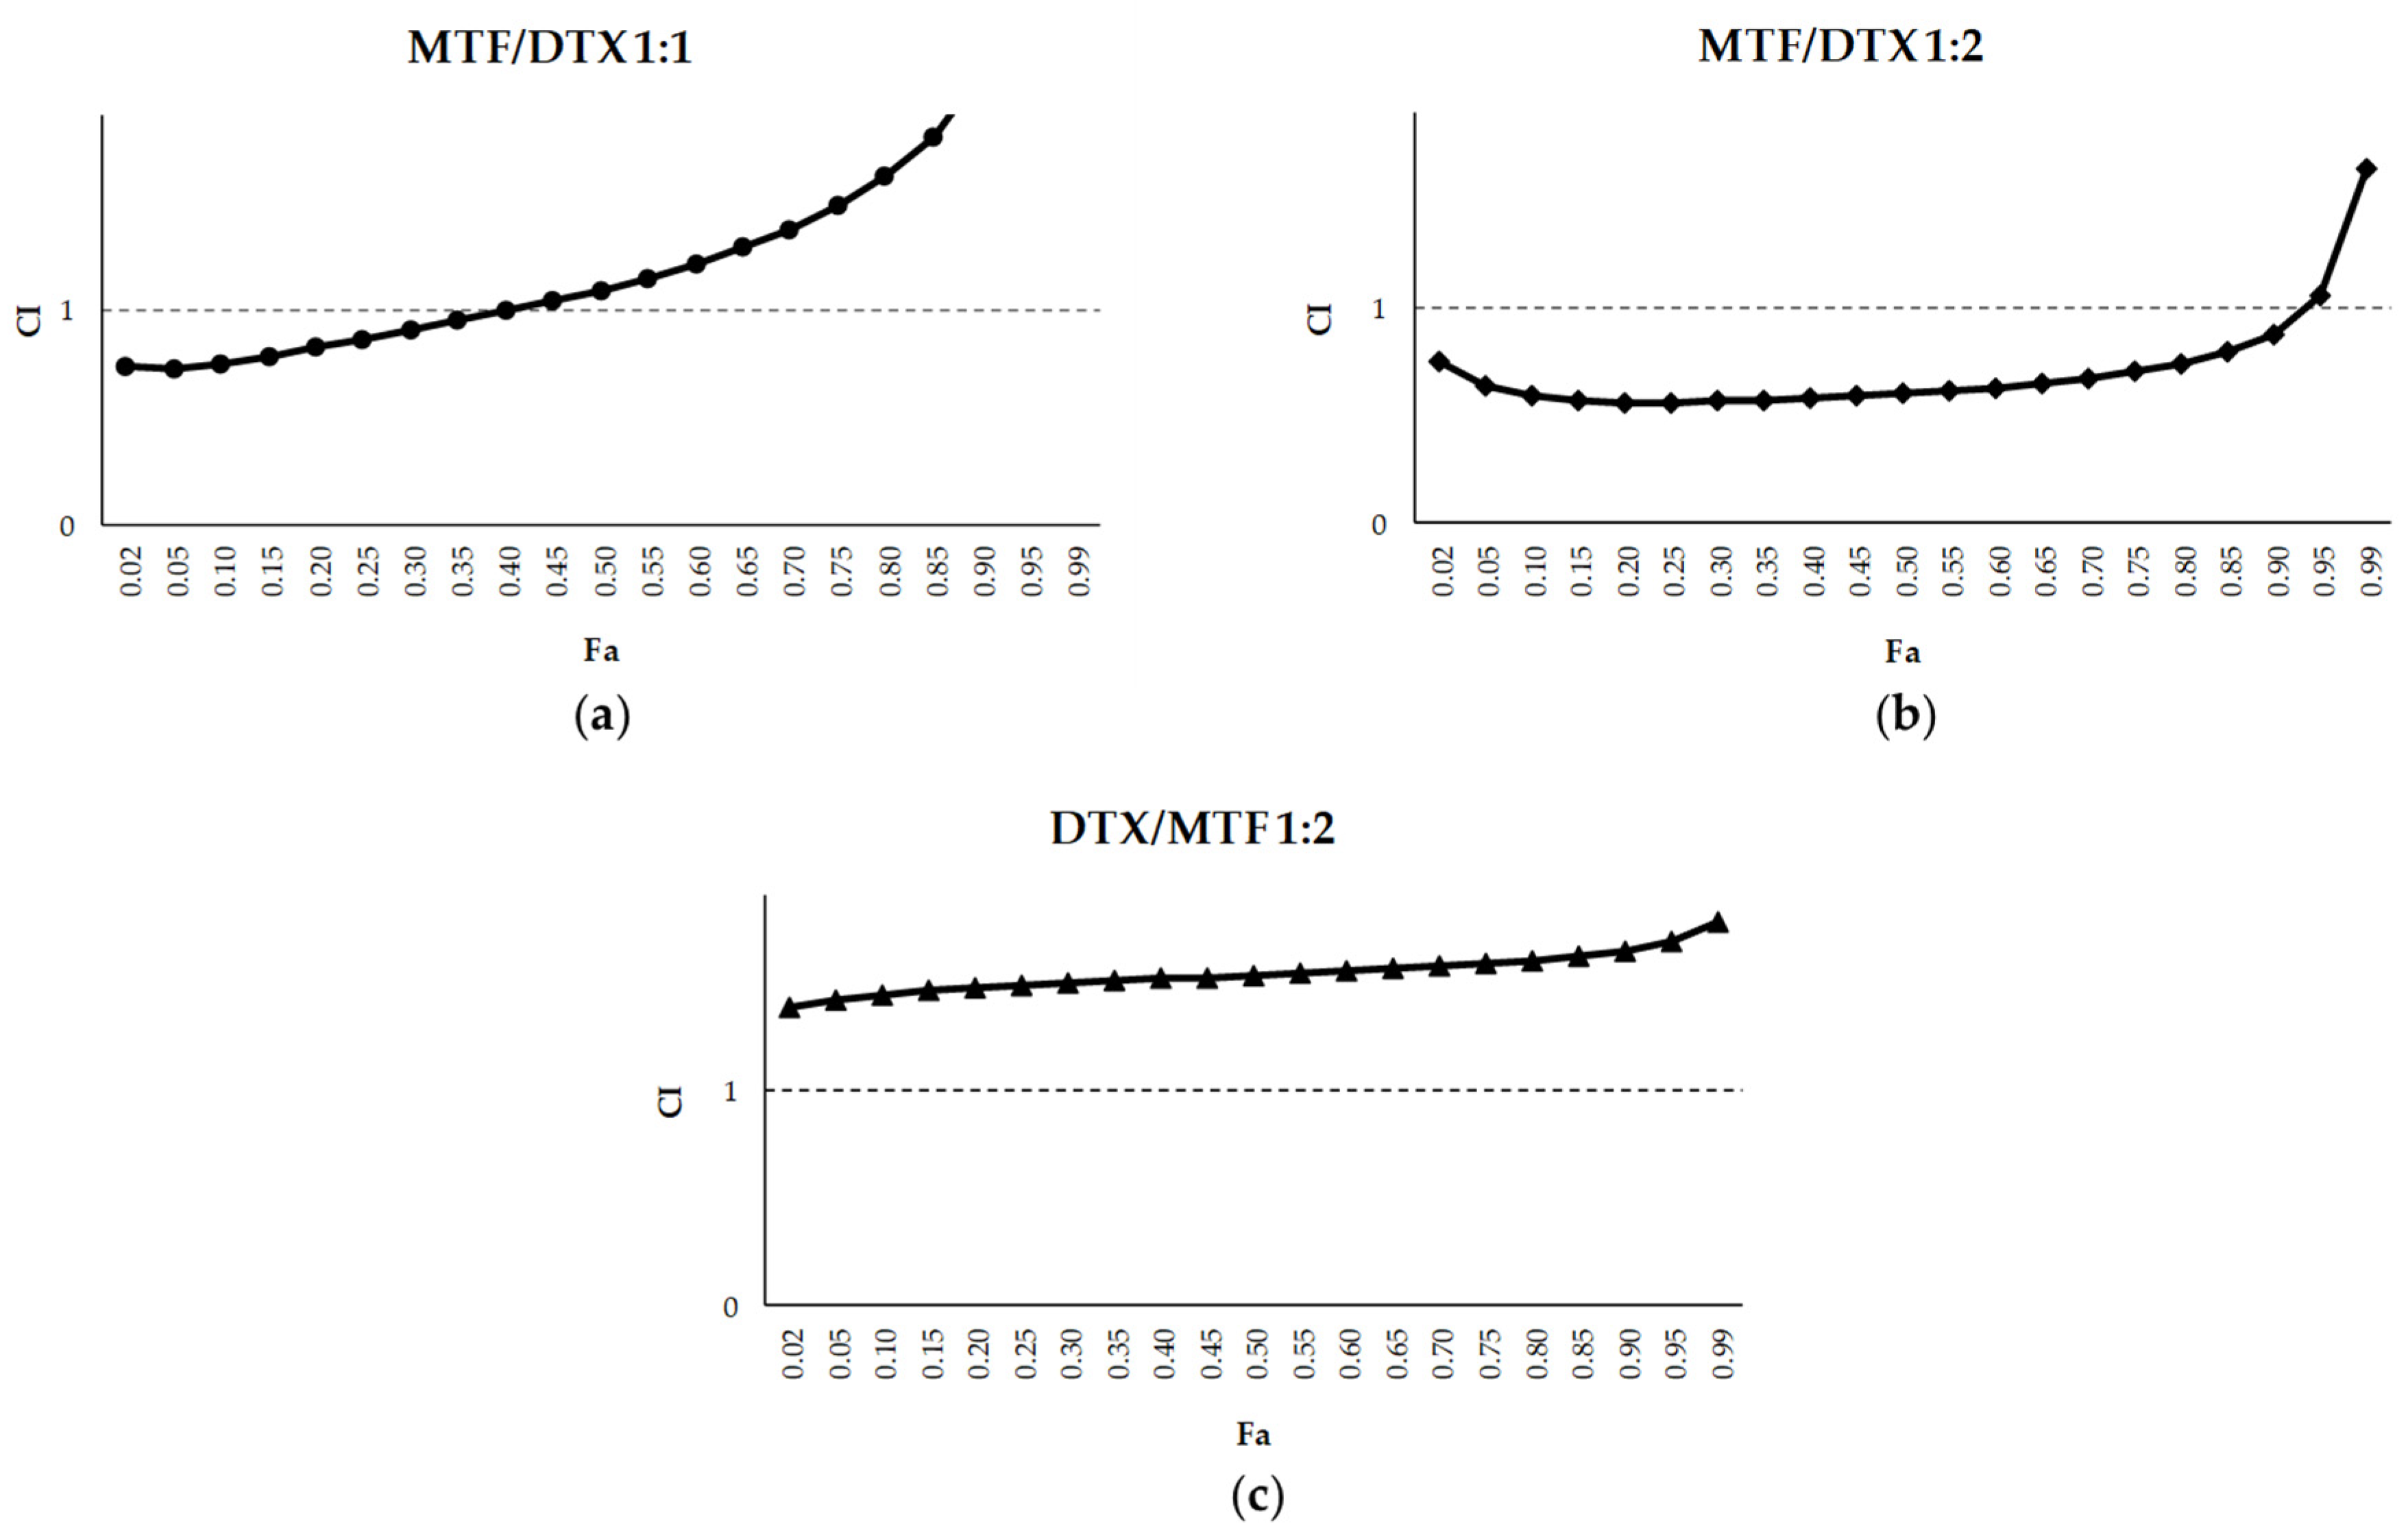
Figure 4.
Dose-response curves of MTF (a), PMM (b), DTX (c) and PTX (d) against iRFP-L. infantum intramacrophagic amastigotes obtained from splenic explants of infected BALB/c mice. Serial ½ dilutions of MTF, DTX and PTX were prepared from a starting concentration of 50 µM, while PMM was tested using both ½ and ⅔ serial dilutions starting from 150 µM. Dose-response curves were fitted using SigmaPlot software. Data are presented as mean ± SD of three independent experiments with five technical replicates each.
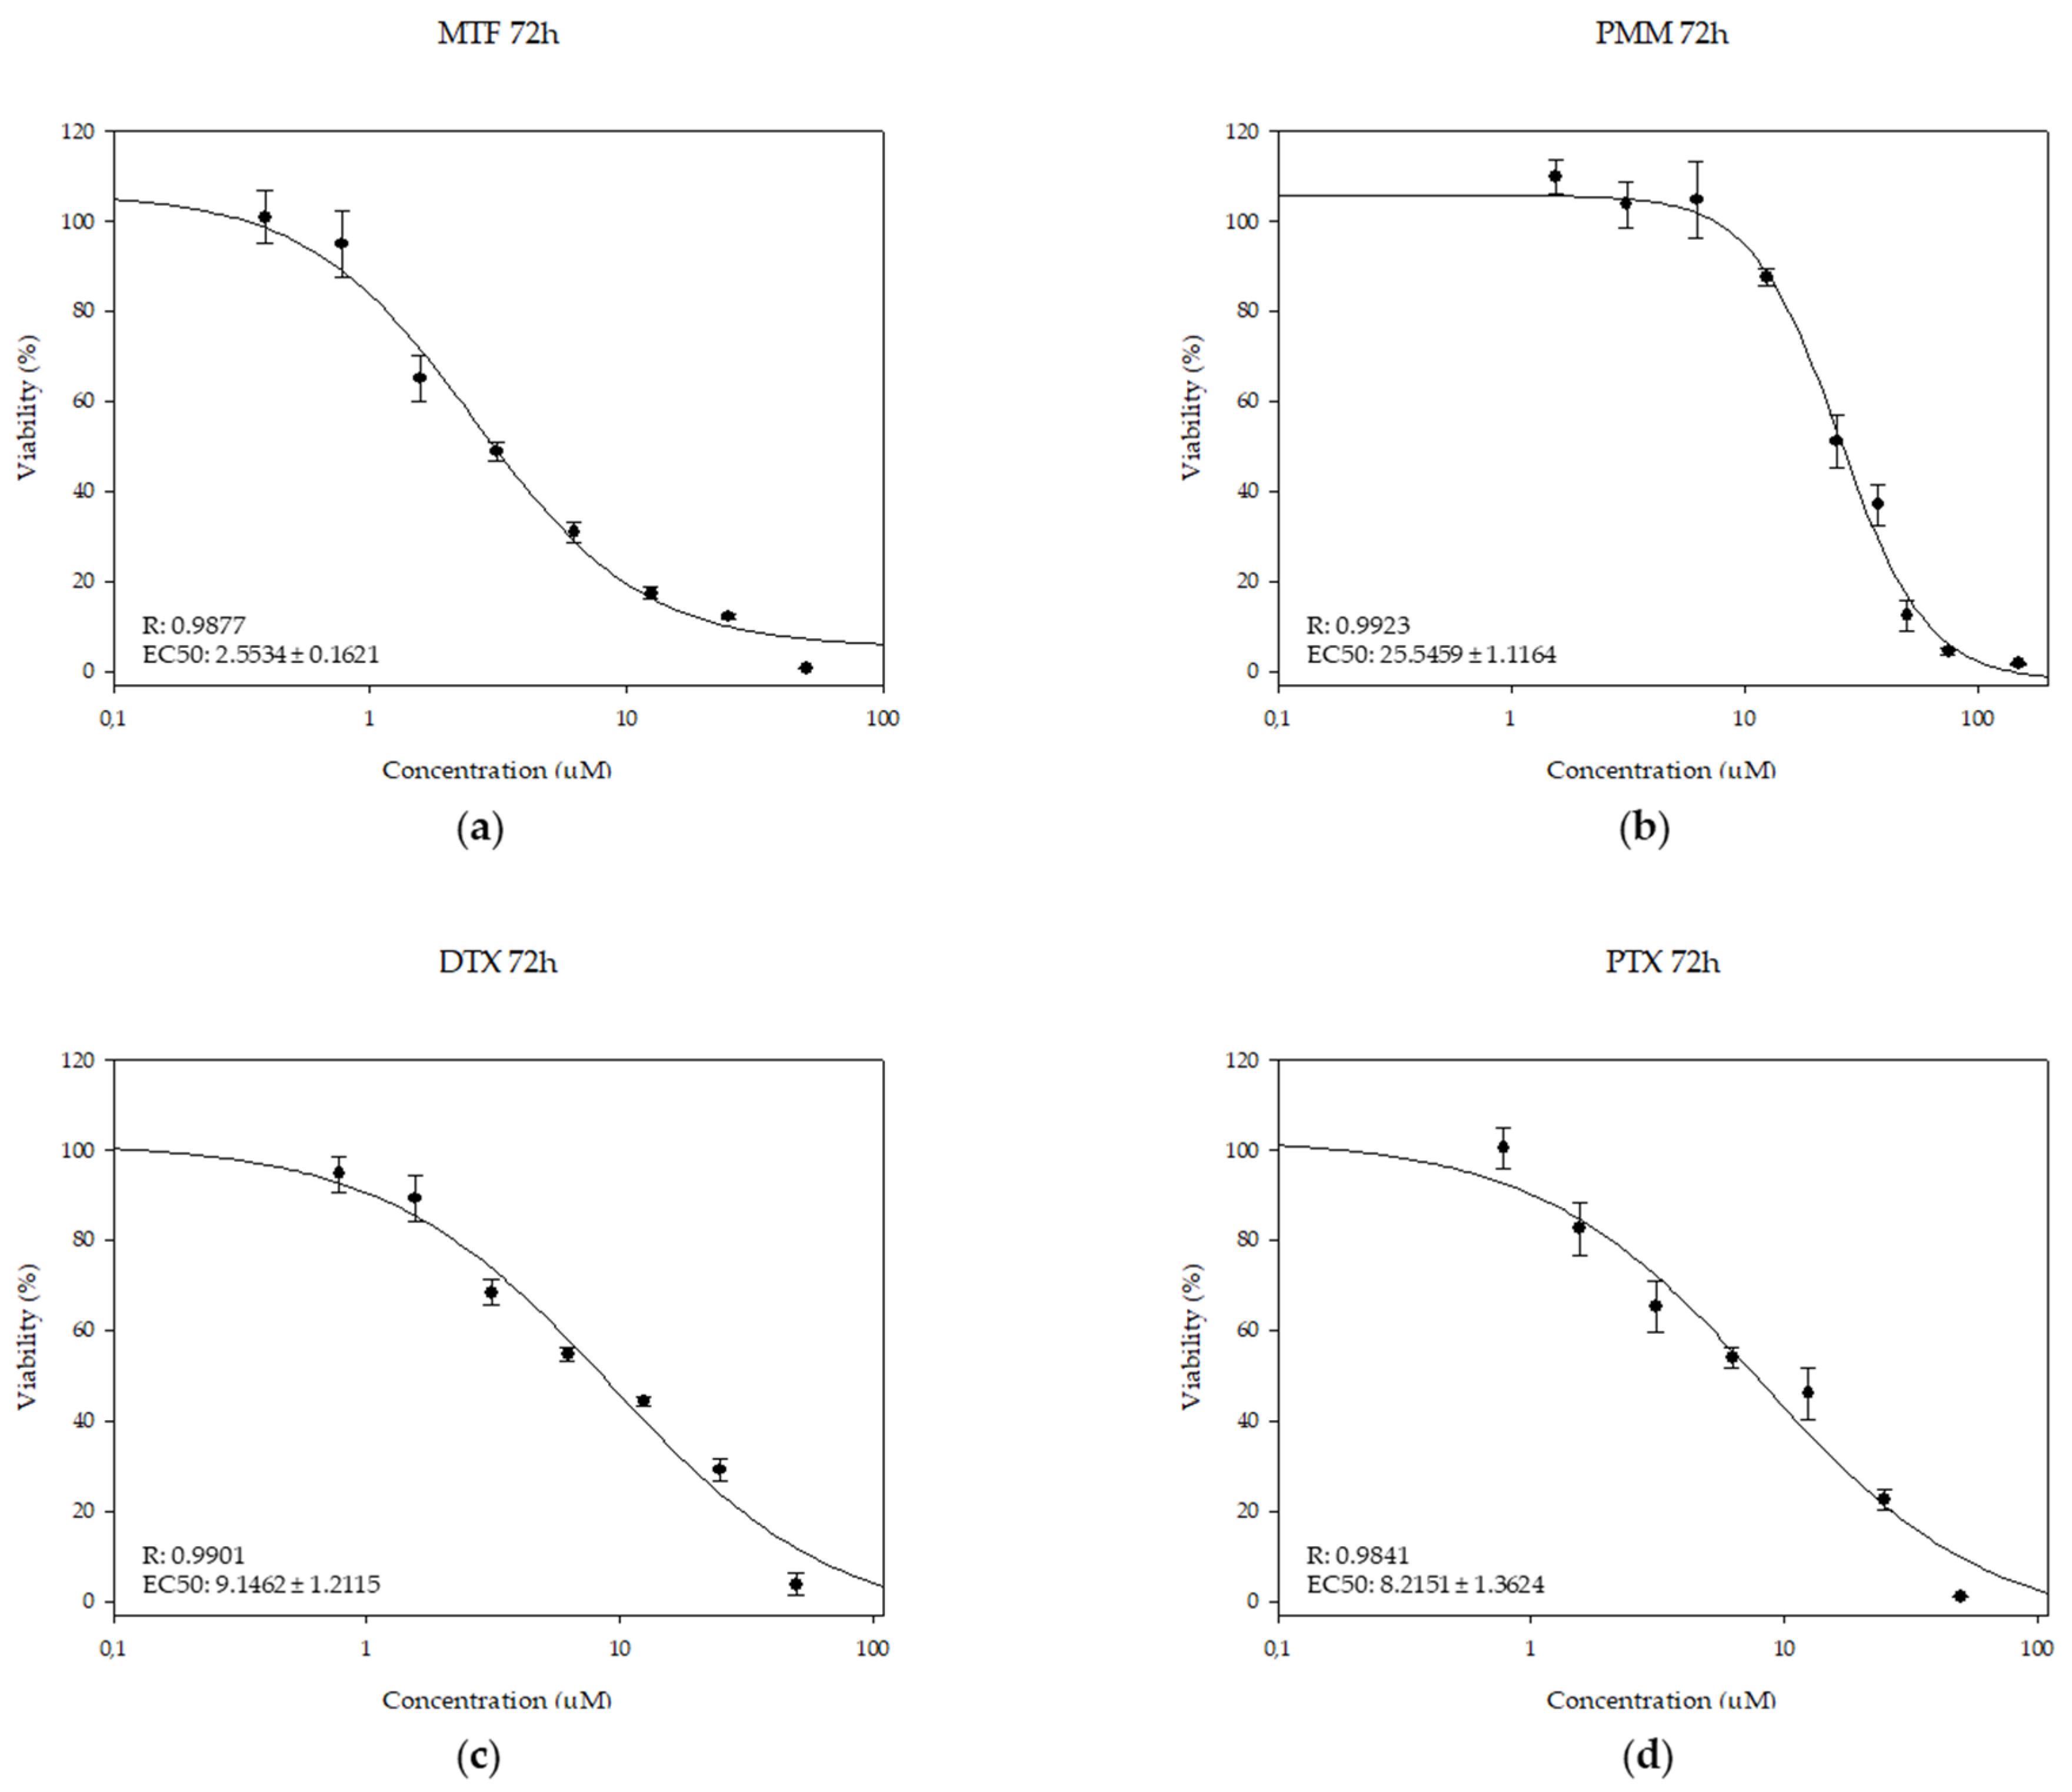
Figure 5.
Interaction effects of MTF/taxane (1:2) combinations with DTX (a) and with PTX (b) on iRFP-L. infantum intramacrophagic amastigotes, expressed as CI versus fa, calculated using CalcuSyn software. Data were obtained with the mean of three different experiments with three technical replicates each.
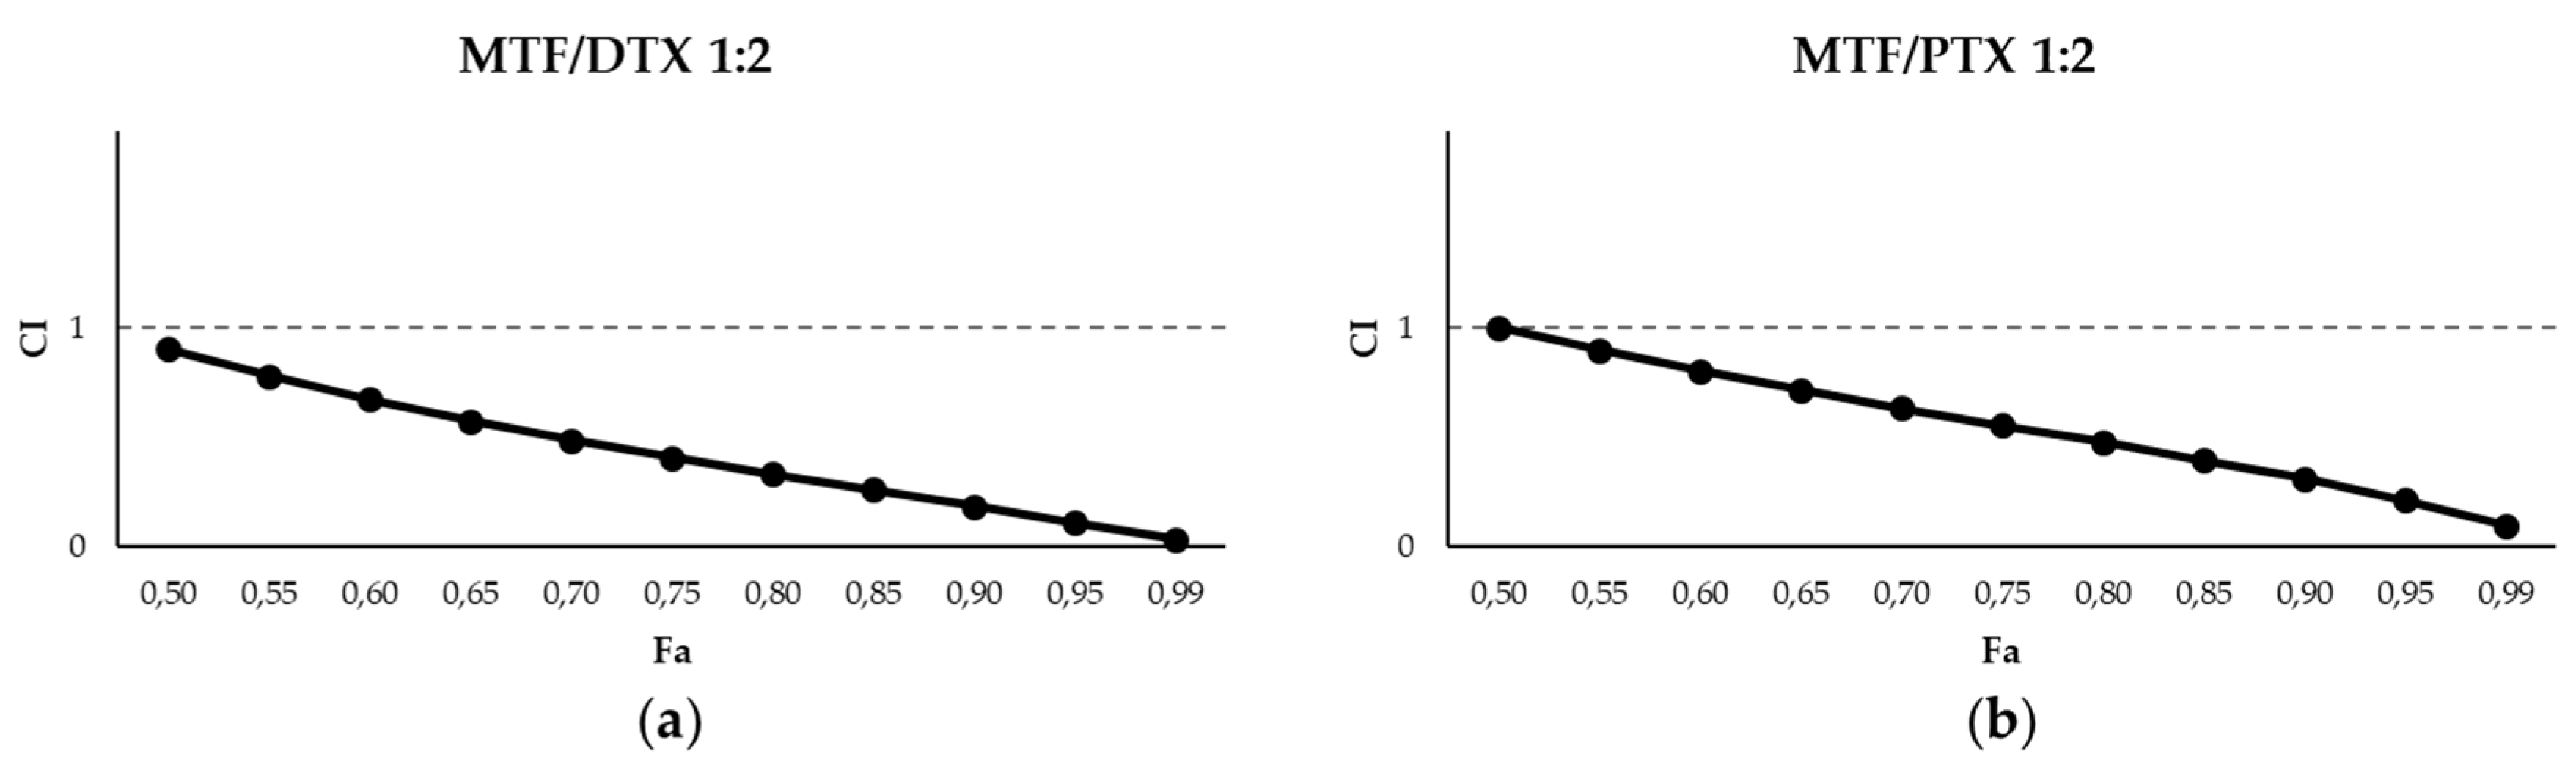
Figure 6.
Interaction effects of PMM/taxane (1:1) combinations with DTX (a) and with PTX (b) on iRFP-L. infantum intramacrophagic amastigotes, expressed as CI versus fa, calculated using CalcuSyn software. Data are presented as the mean ± SD of three different experiments with three technical replicates each.
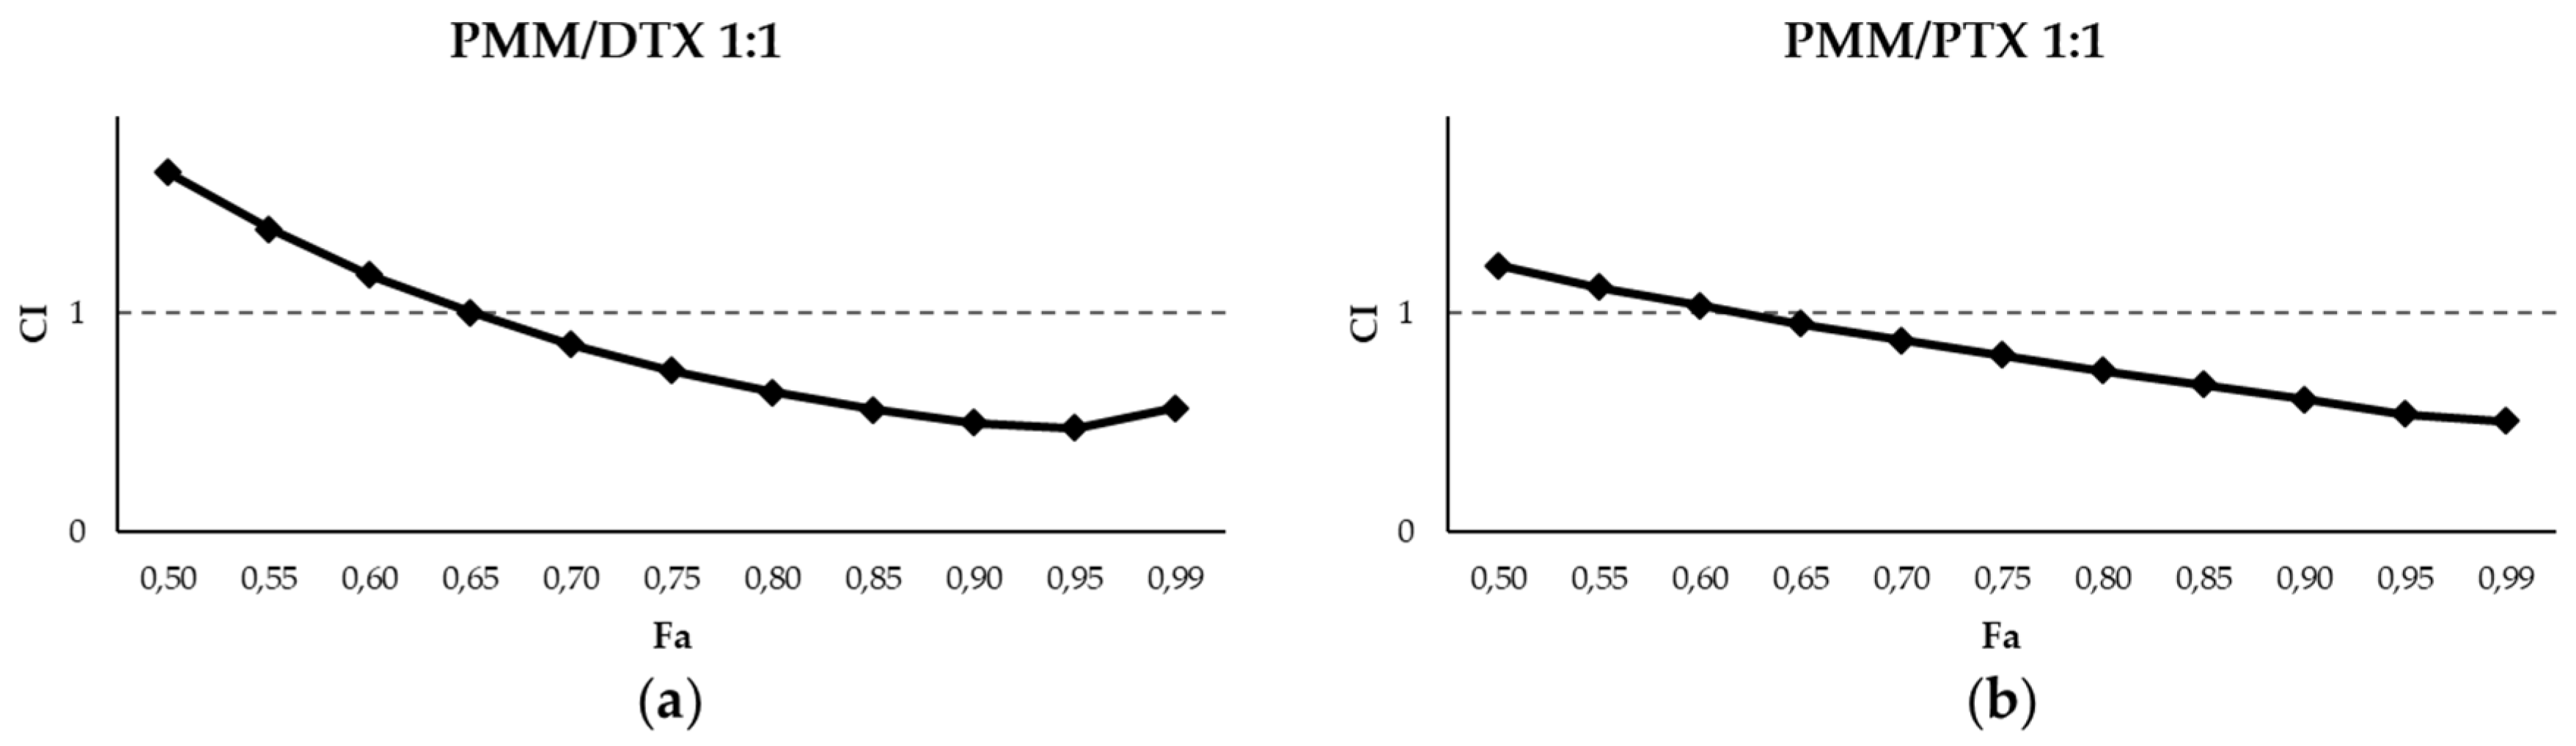
Figure 7.
(a) Cell viability of primary splenic cultures from uninfected BALB/c mice exposed to MTF, PMM, DTX, PTX and their combinations at the concentrations selected for cytokine evaluation. Cell viability was assessed using the Alamar Blue assay, considering the absorbance of the negative control wells (0.1% DMSO) as 100% of viability. Data are presented as the mean of three different experiments with three technical replicates each. (b) Intramacrophagic amastigote viabilitty exposed to MTF, PMM, DTX, PTX and their combinations at the concentrations selected for cytokine evaluation. Data are presented as the mean of three different experiments with three technical replicates each.
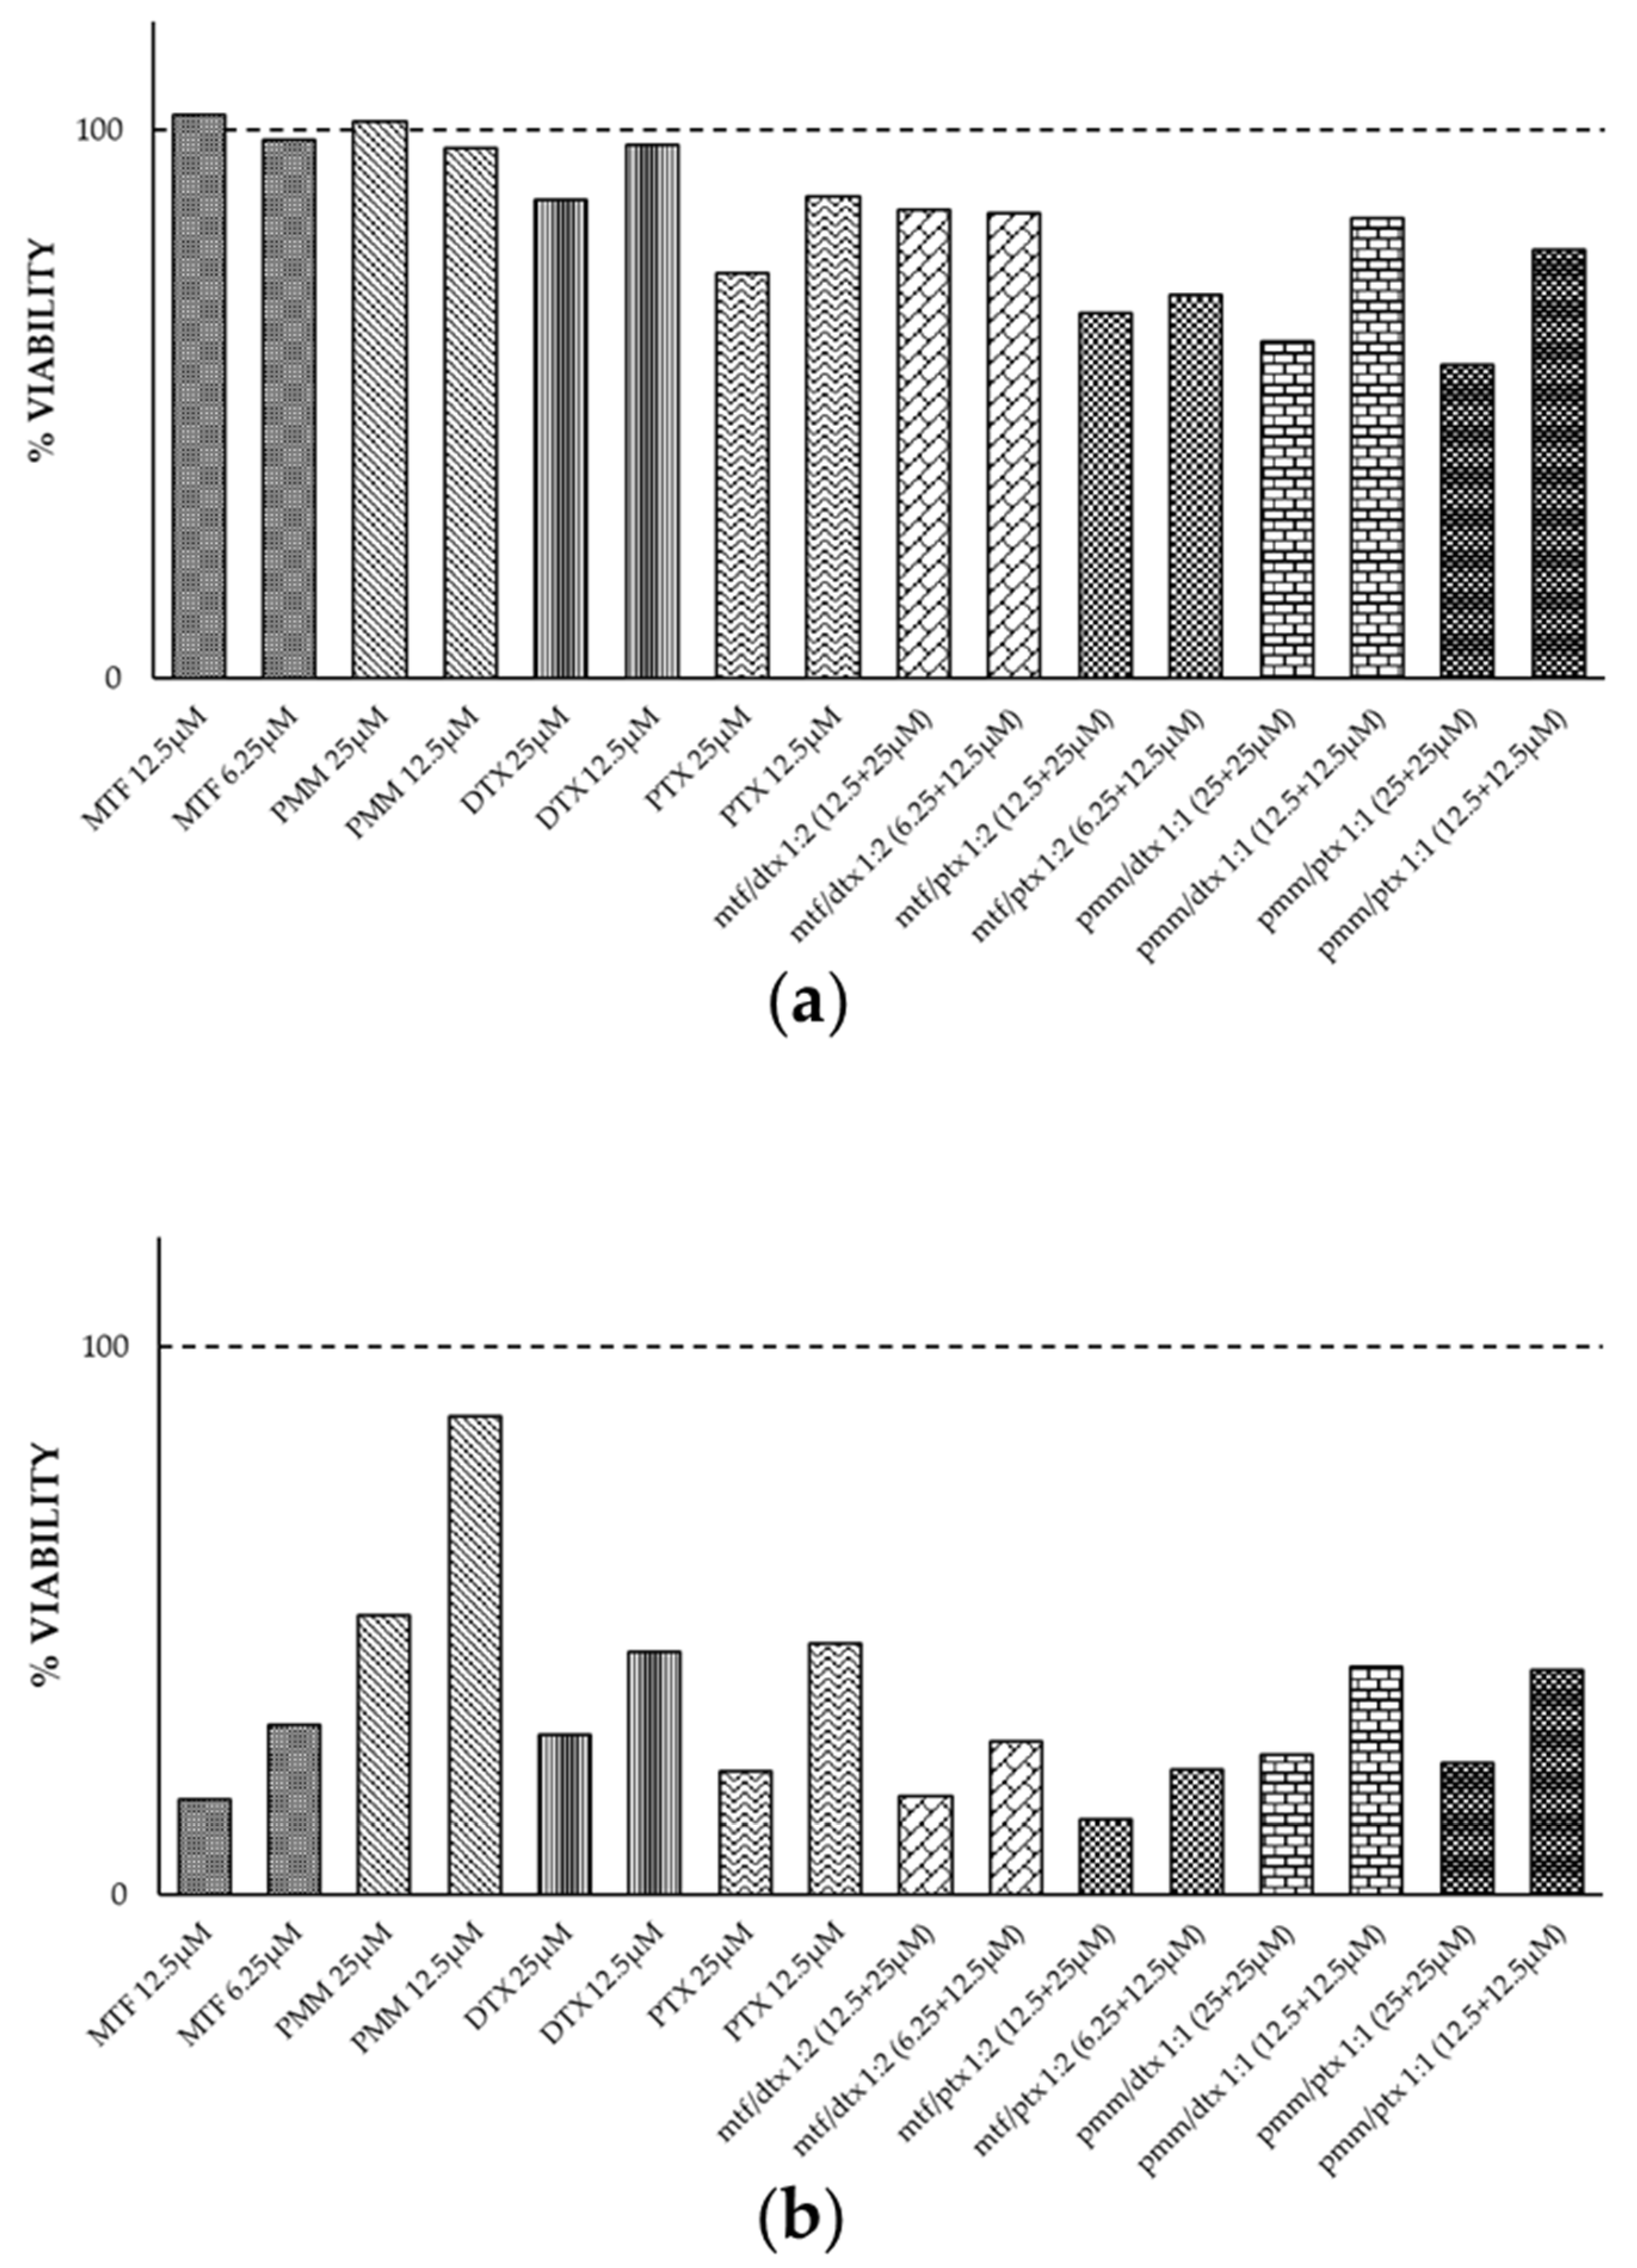
Figure 8.
Cytokine values obtained from infected splenocyte cultures, exposed to MTF, PTX and MTF/PTX (1:2) combination, compared with the control (splenocytes isolated from infected mice and treated with 0.1% DMSO). Statistical analysis was performed using the Student's t-test. The level of significance is indicated by asterisks (*≤ 0,05; **≤ 0,01; ***≤ 0,001).
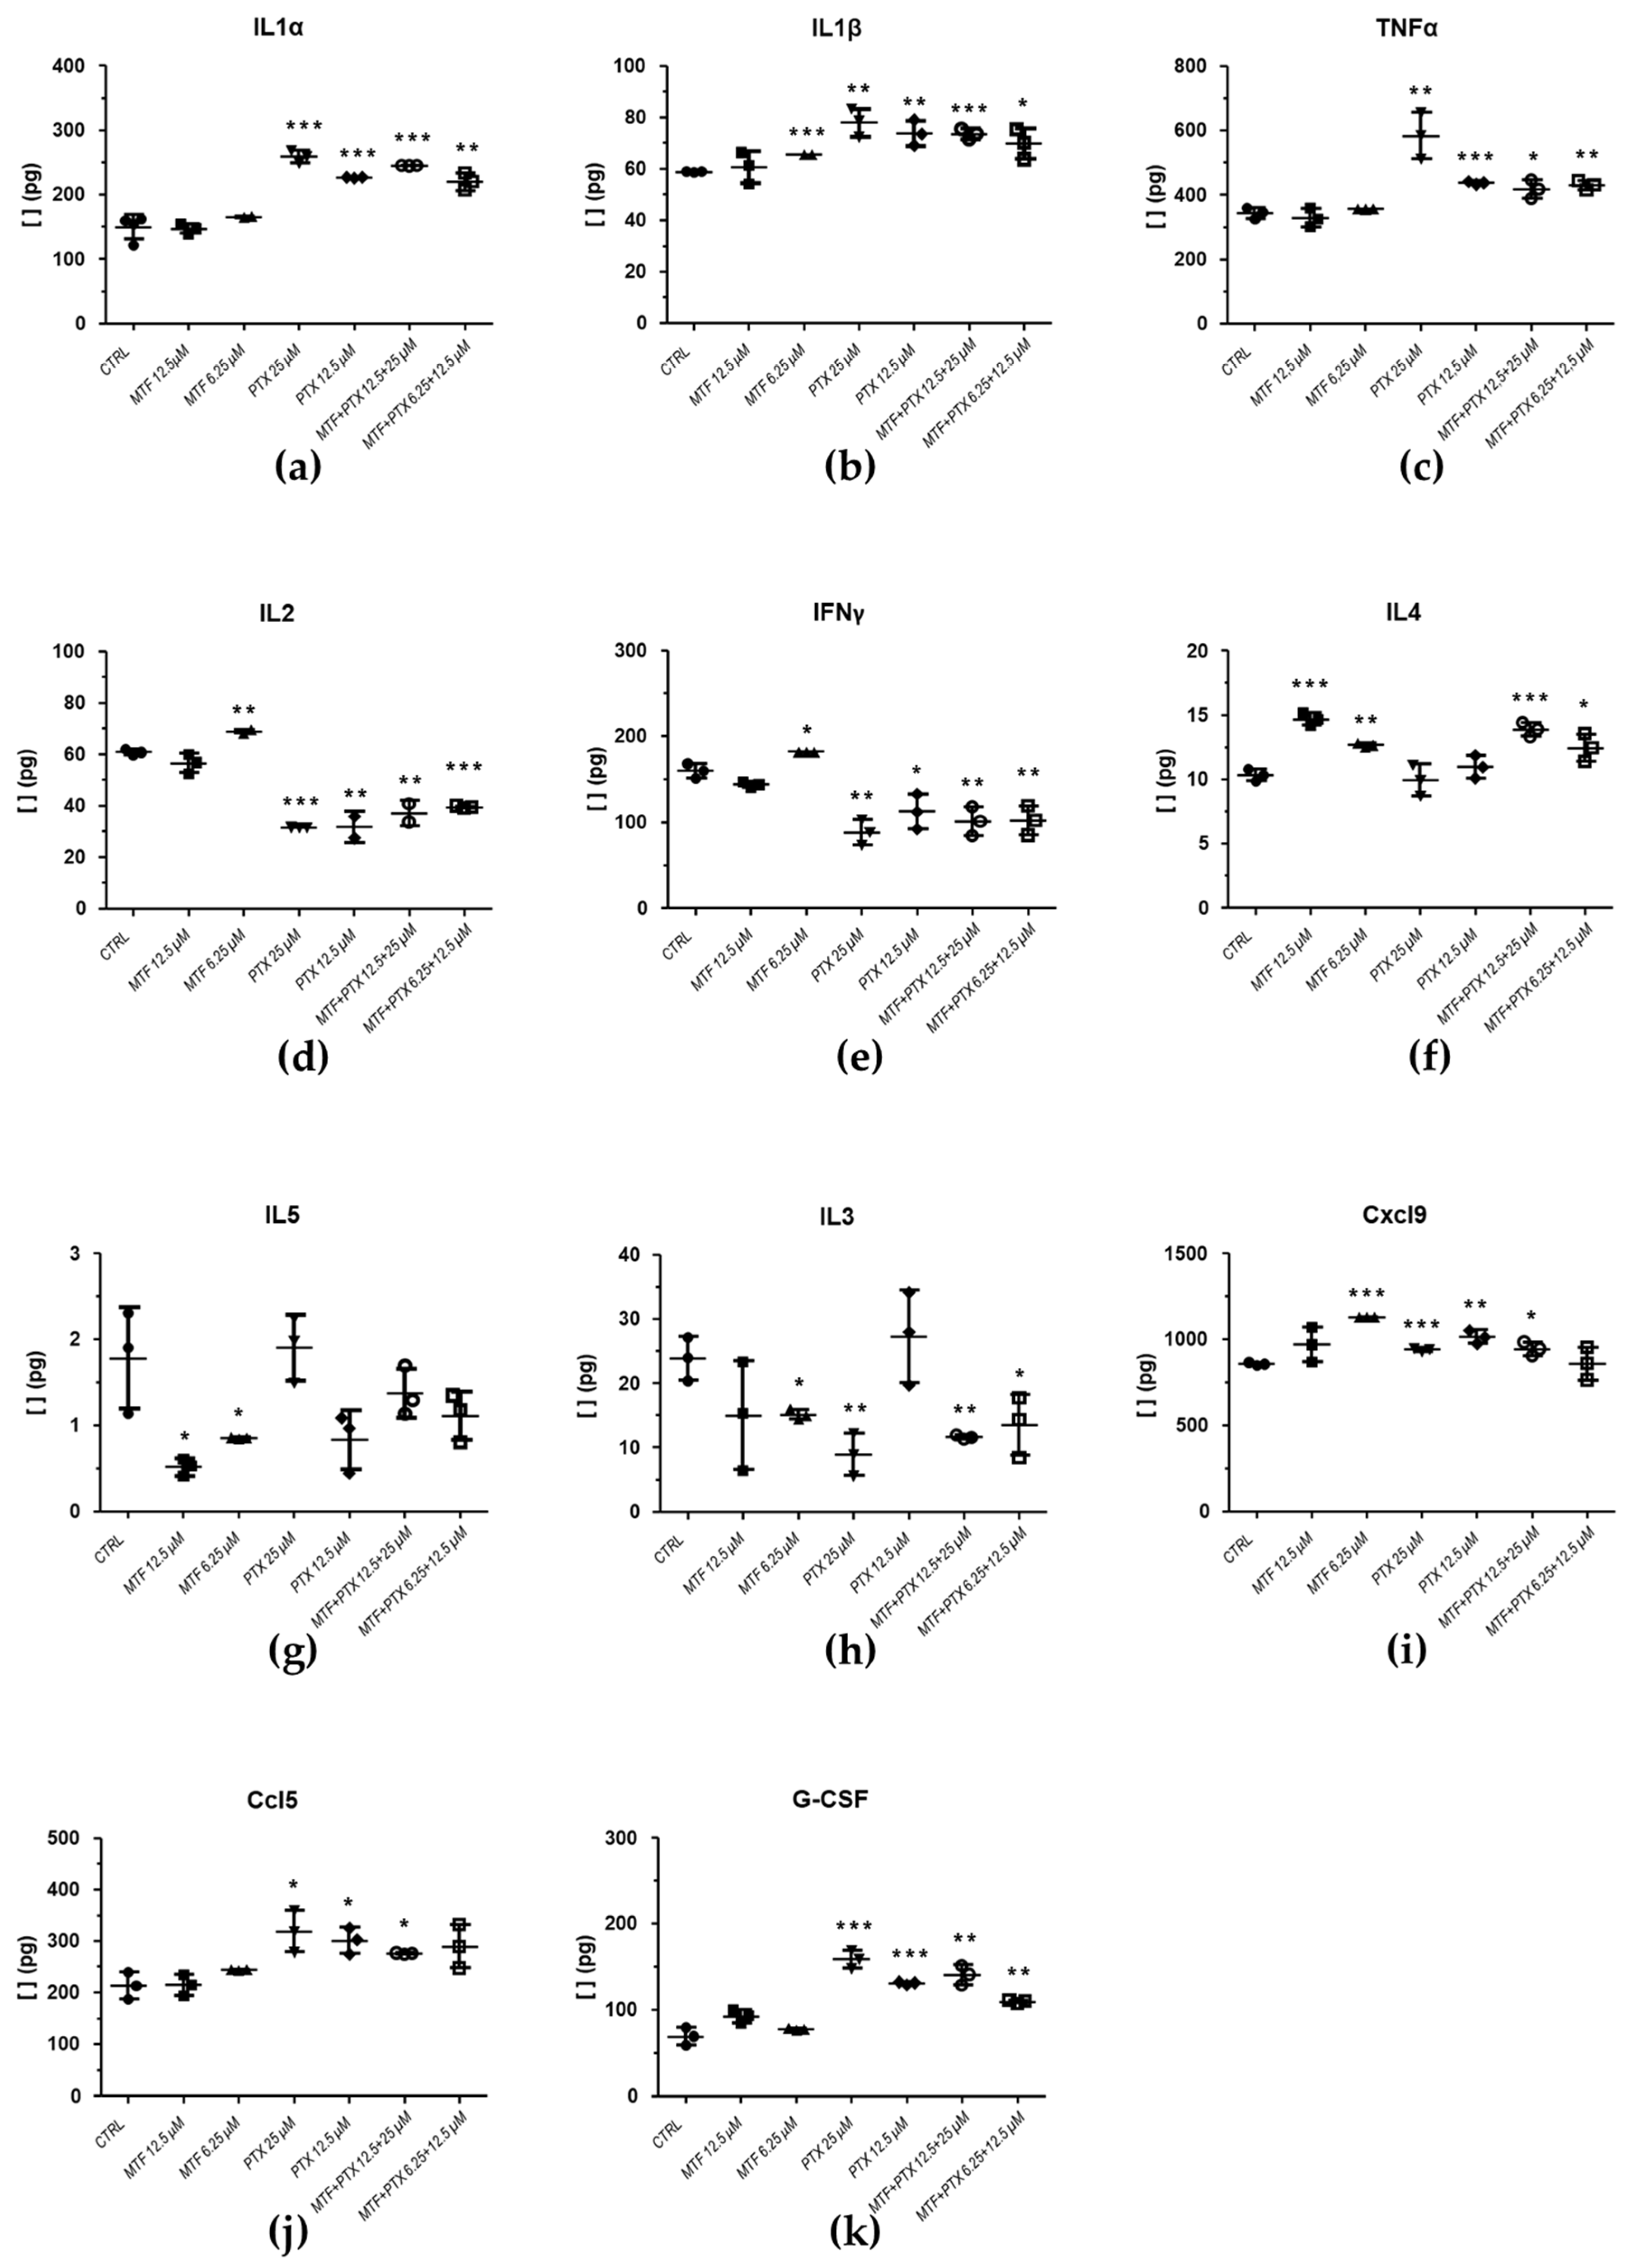
Figure 9.
Cytokine values obtained from infected splenocyte cultures, exposed to MTF, PTX and the MTF/DTX (1:2) combination, compared with the control (splenocytes isolated from infected mice and treated with 0.1% DMSO). Statistical analysis was performed using the Student's t-test. The level of significance is indicated by asterisks (*≤ 0,05; **≤ 0,01; ***≤ 0,001).
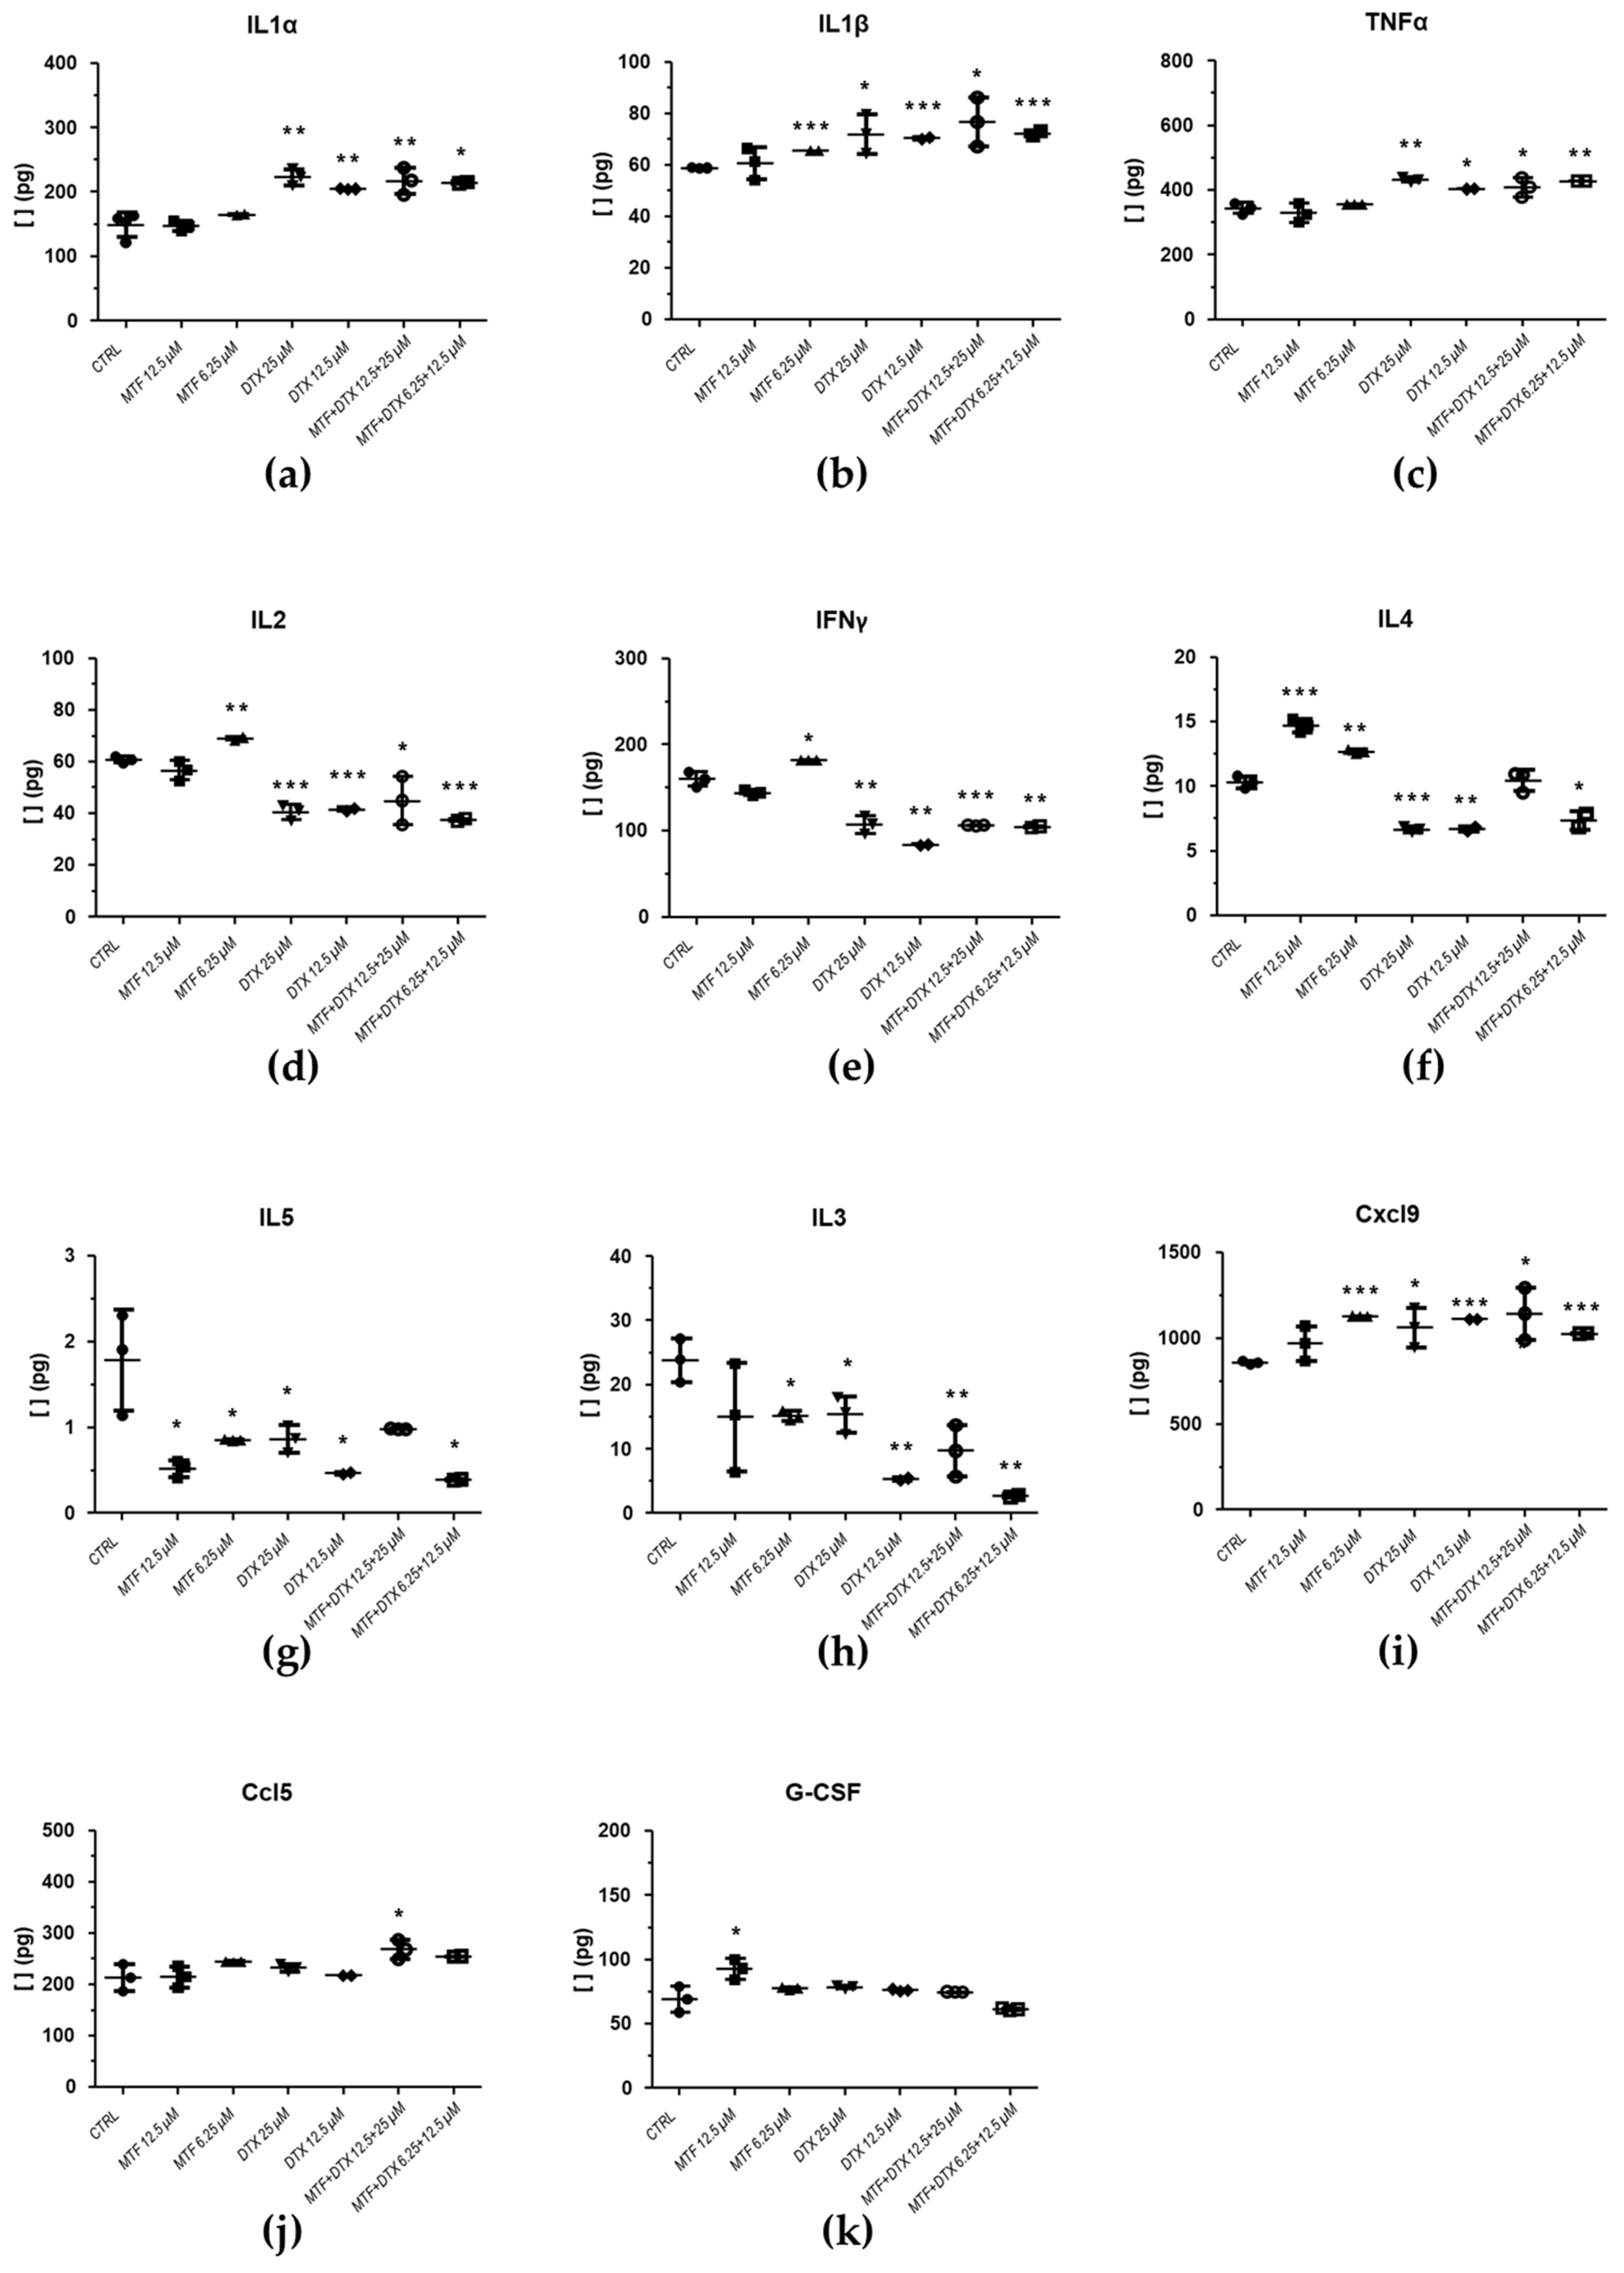
Figure 10.
Cytokine values obtained from infected splenocyte cultures, exposed to PMM, PTX and the PMM/PTX (1:1) combination, compared with the control (splenocytes isolated from infected mice and treated with 0.1% DMSO). Statistical analysis was performed using the Student's t-test. The level of significance is indicated by asterisks (*≤ 0,05; **≤ 0,01; ***≤ 0,001).
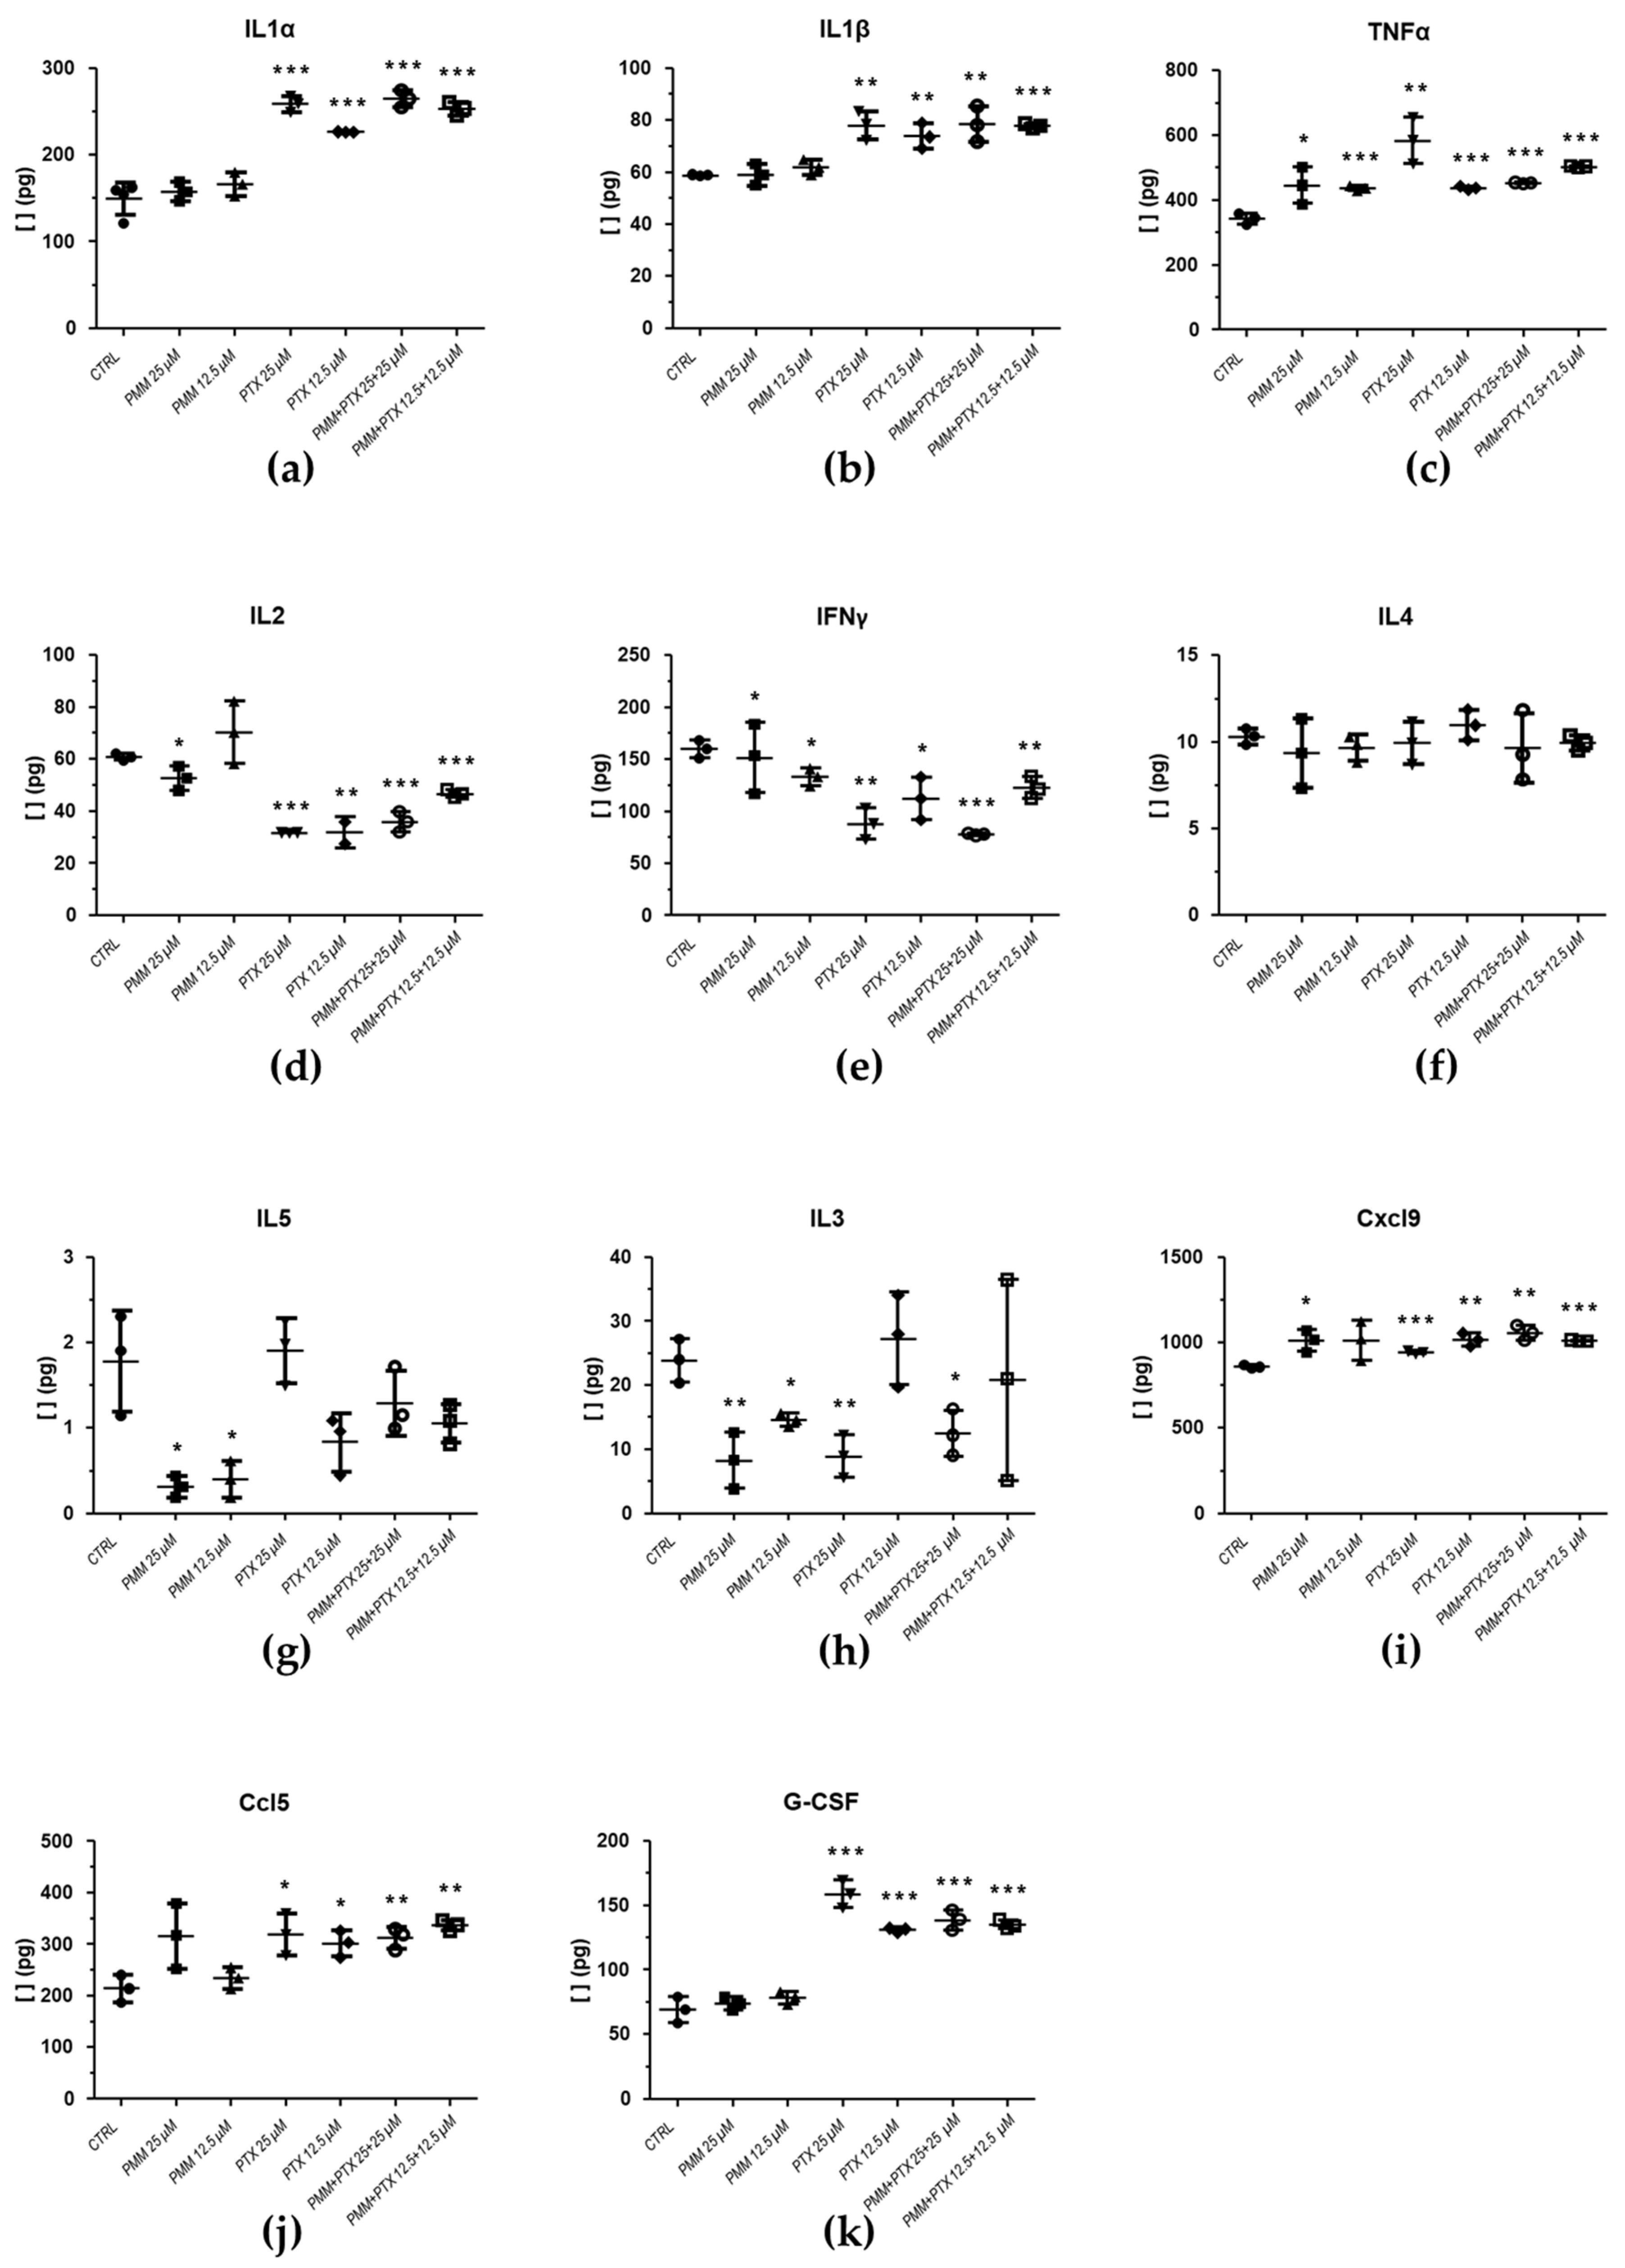
Figure 11.
Cytokine values obtained from infected splenocyte cultures, exposed to PMM, DTX and the PMM/DTX (1:1) combination, compared with the control (splenocytes isolated from infected mice and treated with 0.1% DMSO). Statistical analysis was performed using the Student's t-test. The level of significance is indicated by asterisks (*≤ 0,05; **≤ 0,01; ***≤ 0,001).
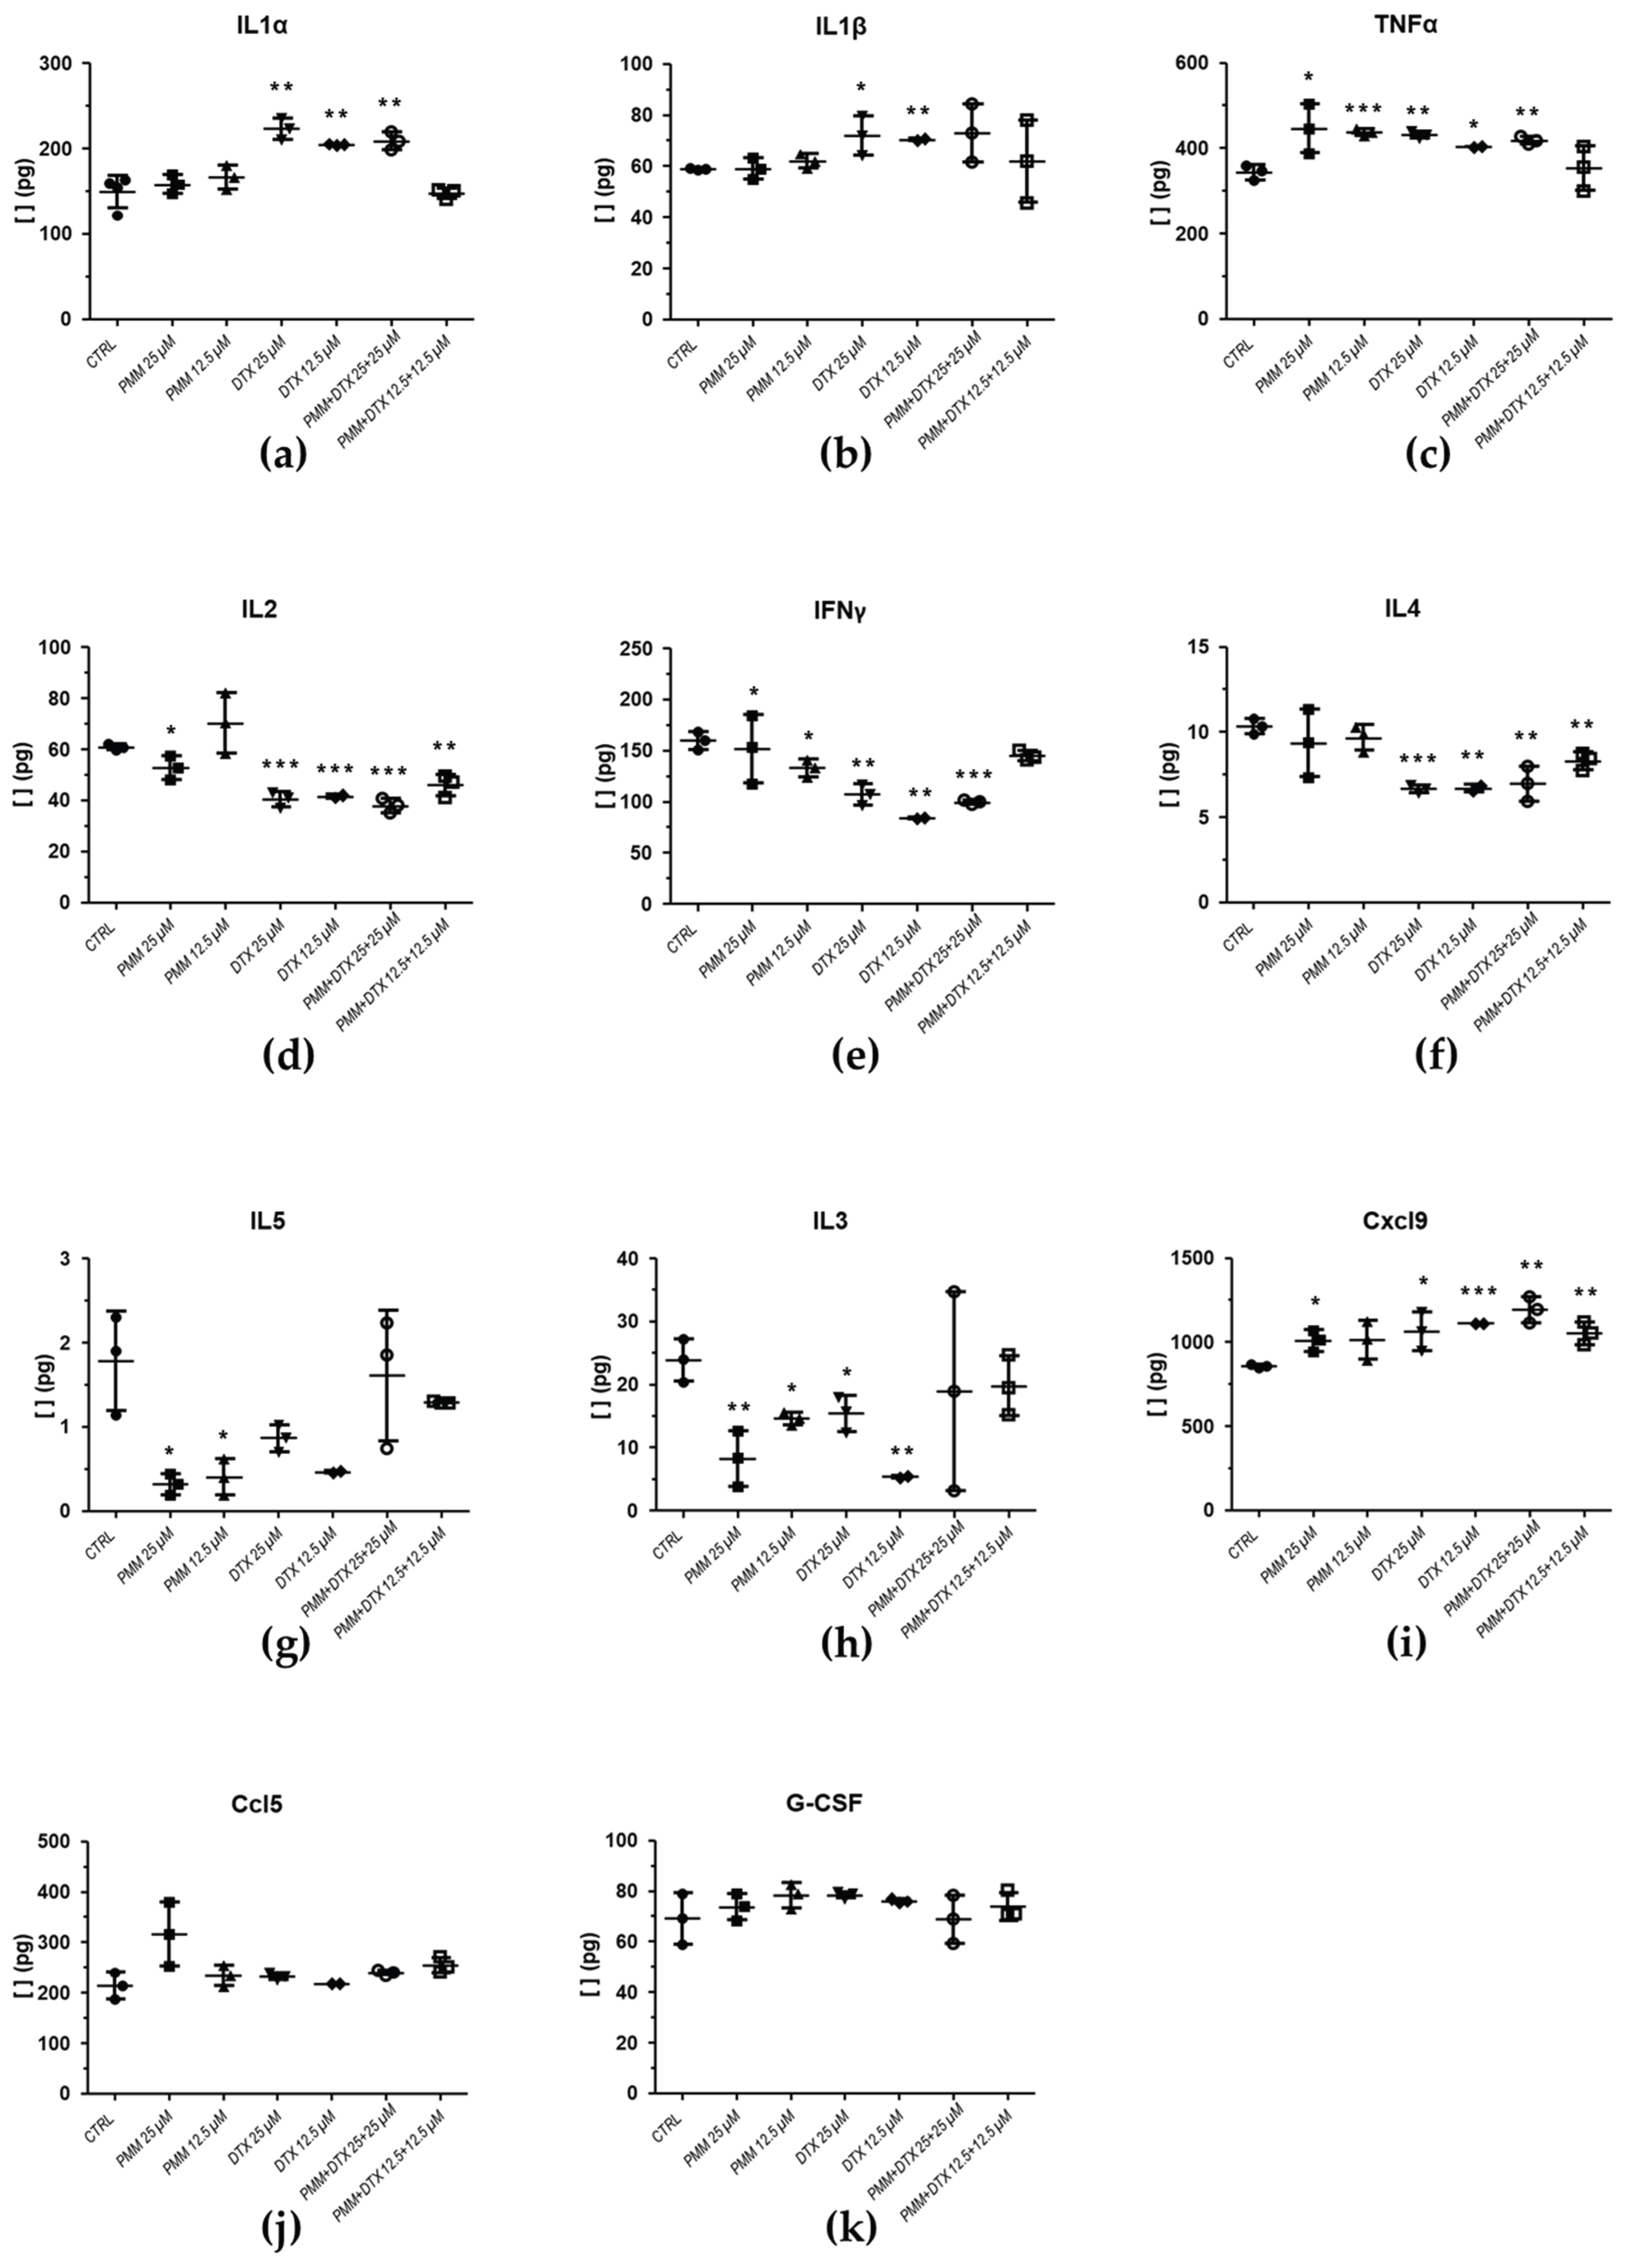

Table 1.
Predictive DRI for MTF/taxane combinations tested in axenic amastigotes, calculated using the CalcuSyn software (r: correlation coefficient; DRI: dose reduction index).
Table 1.
Predictive DRI for MTF/taxane combinations tested in axenic amastigotes, calculated using the CalcuSyn software (r: correlation coefficient; DRI: dose reduction index).
| DRI Values at following effect levels | |||||||||
|---|---|---|---|---|---|---|---|---|---|
| 25% | 50% | 75% | 95% | ||||||
| Drug | r | MTF | Taxane | MTF | Taxane | MTF | Taxane | MTF | Taxane |
| MTF+DTX 1:1 | 0.84 | 1.74 | 3.48 | 1.16 | 4.44 | 0.77 | 5.66 | 0.39 | 8.50 |
| MTF+DTX 1:2 | 0.98 | 3.54 | 3.55 | 2.54 | 4.87 | 1.82 | 6.67 | 1.04 | 11.33 |
| MTF+DTX 2:1 | 0.74 | 0.91 | 3.64 | 0.75 | 5.73 | 0.61 | 9.02 | 0.44 | 19.35 |
| MTF+PTX 1:1 | 0.91 | 2.29 | 7.04 | 2.04 | 10.20 | 1.82 | 14.79 | 1.50 | 27.59 |
| MTF+PTX 1:2 | 0.92 | 4.14 | 11.10 | 3.22 | 12.33 | 2.50 | 13.69 | 1.64 | 16.33 |
| MTF+PTX 2:1 | 0.92 | 3.82 | 23.47 | 1.92 | 19.16 | 0.96 | 15.64 | 0.30 | 11.12 |
Table 2.
Predictive DRI for MTF/taxane and PMM/taxane combinations tested in amastigotes obtained from splenic explants of infected BALB/c mice, calculated using CalcuSyn software (r: correlation coefficient; DRI: dose reduction index).
Table 2.
Predictive DRI for MTF/taxane and PMM/taxane combinations tested in amastigotes obtained from splenic explants of infected BALB/c mice, calculated using CalcuSyn software (r: correlation coefficient; DRI: dose reduction index).
| DRI Values at following effect levels | |||||||||
|---|---|---|---|---|---|---|---|---|---|
| 25% | 50% | 75% | 95% | ||||||
| Drug | r | MTF | Taxane | MTF | Taxane | MTF | Taxane | MTF | Taxane |
| MTF/DTX 1:2 | 0.999 | 0.58 | 1.24 | 1.46 | 4.54 | 3.04 | 12.67 | 10.41 | 71.17 |
| MTF/PTX 1:2 | 0.97 | 0.53 | 3.34 | 1.23 | 5.19 | 2.38 | 7.35 | 7.23 | 13.20 |
| PMM/DTX 1:1 | 0.99 | 5.30 | 0.16 | 4.13 | 0.71 | 3.38 | 2.27 | 2.42 | 15.87 |
| PMM/PTX 1:1 | 0.96 | 5.01 | 0.55 | 4.32 | 1.01 | 3.73 | 1.85 | 2.91 | 5.10 |
Disclaimer/Publisher’s Note: The statements, opinions and data contained in all publications are solely those of the individual author(s) and contributor(s) and not of MDPI and/or the editor(s). MDPI and/or the editor(s) disclaim responsibility for any injury to people or property resulting from any ideas, methods, instructions or products referred to in the content. |
© 2026 by the authors. Licensee MDPI, Basel, Switzerland. This article is an open access article distributed under the terms and conditions of the Creative Commons Attribution (CC BY) license (http://creativecommons.org/licenses/by/4.0/).
Copyright: This open access article is published under a Creative Commons CC BY 4.0 license, which permit the free download, distribution, and reuse, provided that the author and preprint are cited in any reuse.


