Preprint
Article

This version is not peer-reviewed.

Sustainable Management of the Common Bean Fly by Integrating Farmers’ Preferences for Improved Varieties

Submitted:

26 February 2026

Posted:

28 February 2026

You are already at the latest version

Abstract

The common bean (Phaseolus vulgaris L.) is a vital commodity crop globally. The bean fly (Ophiomyia spp.) is among the major insect pests constraining crop production in sub-Sharan Africa, including Zimbabwe. New cultivars with resistance to bean fly have yet to be developed, with winning traits preferred by farmers and end-users. A survey of 241 farmers was conducted to assess production constraints, farmers’ variety preferences, bean fly awareness and current management practices. Data were analysed using the Rank-Based Quotient analysis. A multiple linear regression model was used to determine farmers’ awareness of the pest. Survey results showed that insect pests, including bean fly, topped the list among production constraints, followed by diseases, drought, and input costs. Level of education, years in bean production, and access to extension service significantly (P < 0.05) influenced farmers’ awareness of the bean fly. Principal component analysis identified grain yield (with a loading score of 0.89), disease resistance (0.73), insect pest resistance (0.64), and early maturity (0.41) as the key traits that influence bean variety choice The results of this study are vital to refine the common bean target product profiles for Zimbabwe and guide the breeding programs’ efforts in developing demand-driven varieties with farmers’ preferred traits.

Keywords: 
;  ;  

1. Introduction

Common bean (Phaseolus vulgaris L.) is a key commodity crop globally [1]. In Africa, it is the major crop contributing to food security, human nutrition, cash income, and sustainable farming practices [2]. Globally, it is cultivated on approximately 33.1 million hectares of agricultural land [3]. It is rich in protein (16-33%), vitamins (e.g., thiamine, riboflavin, niacin, vitamin B6, and folic acid), dietary fibre (14-19%), minerals (e.g., calcium, iron, copper, zinc, phosphorus, potassium and magnesium) and free unsaturated fatty acids [4]. It also plays a significant role in cropping systems because of its ability to fix atmospheric nitrogen through a symbiotic relationship with rhizobia bacteria living in its root nodules [5].
In Zimbabwe, the common bean is among the most significant food legumes, along with cowpea [Vigna unguiculata (L.) Walp] and bambara groundnut [Vigna subterranea (L.) Verdc] [6]. Based on the 2016 baseline report on improving bean production and consumption in Zimbabwe, findings suggested an increased severity of bean production constraints and limited awareness of improved technologies, including new varieties. Since then, the national program and its partners’ interventions have placed increasing emphasis on the common bean to build the country’s value chain, focusing on demand-driven breeding and scaling initiatives [2]. This effort led to the cultivation of various market classes (e.g., sugar, red mottled, and navy bean) of common bean, as well as landraces. This highlights that researchers can provide appropriate and sustainable recommendations when farmers’ priorities, needs, and capacities are valued and better understood [7].
Despite numerous initiatives, the full production potential of common beans is yet to be achieved, particularly in resource-constrained regions of sub-Saharan Africa (SSA), including Zimbabwe. There is a significant variation in average yields among countries. Bean yield in SSA is very low, averaging around 600kg/ha compared to about 2000kg/ha in the United States, 1700kg/ha in China, and 1100kg/ha in Brazil [8]. Notable yield increments have been noted in Ethiopia (1600kg/ha), Uganda (1200kg/ha), and Tanzania (1100kg/ha) as a result of concerted efforts in demand-led breeding and seed systems. In Zimbabwe, approximately 30,000 hectares are cultivated with common beans annually, yielding an average of 500 kg per hectare, totalling about 15,000 tonnes [3]. These low yields may be attributed to disease susceptibility, drought, heat stress, and pest damage caused by bean fly (Ophiomyia phaseoli spp), aphids (Aphis fabae), and storage pests (Acanthoscelides obtectus) [9]. Hence, determining the principal current constraints affec ing bean production is crucial for designing new common bean cultivars that enhance yields, increase farmers’ income, and ensure food security [10]. In addition, the insights gained can serve as a foundation for future common bean breeding aiming at developing varieties resistant to abiotic and biotic stresses encountered by farmers.
Insect pests, particularly bean fly, significantly reduce yields, prompting the need for resistant varieties, but adoption by farmers’ remains limited due to the lack of cultivars that combine resistance and other desirable traits [11]. Currently, no bean fly-resistant varieties are reported in Zimbabwe. While bean fly has been reported in Zimbabwe [12], farmers’ knowledge of the pest and its management strategies remains poorly understood. The bean fly is among the major insect pests that constrain crop production, leading to yield losses of up to 100%. The bean fly is considered economically important even at low densities due to its feeding behaviour, life stage, and the young stems of the plants it attacks [13]. For instance, internal feeding by bean fly larvae, which bore into and destroy stem tissue, results in wilting and plant death. Breeding efforts have identified resistance sources and potential resistance genes on chromosome Pv01 [14,15], vital for marker-assisted breeding approaches to enhance resistance. However, successful deployment and adoption of resistant varieties into farming systems requires involving farmers in defining the breeding goals and subsequent selections to ensure the new cultivars meet their needs and preferences.
Participatory appraisal of needs and requirements allows the researcher to gain a clear understanding of the actual issues, as problems are identified and communicated directly by the farmers. For instance, Mongi et al. [16] reported that angular leaf spot caused by Pseudocercospora griseola is a major production constraint in common bean production in Tanzania, through participatory rural appraisal (PRA). Furthermore, PRA results expedite the breeding process by enabling breeders to focus on the most desired traits [17], and breeders can use the identified traits as selection criteria in their breeding programs [18]. PRA studies can also identify production-limiting factors such as a scarcity of seeds and the production status of a crop, which may be low due to farmers’ limited exploration and understanding of new technologies [19,20]. Findings from PRA studies necessitate the development of strategies to raise awareness, facilitate access, and mobilise farmers to adopt new technologies to improve their livelihoods. The Department of Research and Specialist Services (DR&SS) in Zimbabwe is focused on developing a resistance breeding strategy to sustainably manage the bean fly and boost overall productivity. However, there is currently insufficient and recent data to justify the effort to target this trait in the breeding program. This study, therefore, aimed to appraise the t present status of common bean production, its constraints, cropping systems, bean fly awareness, and farmers’ preferences in Zimbabwe to guide future common bean variety development and release.

2. Materials and Methods

2.1. Description of the Study Areas

This study was conducted in 2024 across six purposively selected districts from three rural provinces (Manicaland, Masvingo, and Midlands) of Zimbabwe (Table 1). Zimbabwe consists of five major agro-ecological zones. Manicaland is a part of natural regions 1 and 2, which receive higher annual rainfall (700-1000mm annually), with relatively low temperatures, and are suitable for maize, bean, tobacco, and horticultural crops production. Masvingo is in agro-ecological zones 4 and 5, characterised by lower annual rainfall (maximum 600mm annually) distribution, high temperatures, and poor soils, while Midlands is located in agro-ecological region 4, which receives annual rainfall of 450-650mm, subject to frequent seasonal droughts and severe dry spells during the rainy season.

2.2. Sampling Procedures

A multi-stage sampling technique was employed to ensure a representative sample of common bean-growing households in the study areas. Initially, three provinces were selected, which are known for their higher common bean production in Zimbabwe. In the second stage, six districts were selected: Nyanga, Mutasa, and Chimanimani districts from Manicaland province, Shurugwi district in Midlands province, and Chiredzi district in Masvingo province. In collaboration with the extension officers, 241 farmers were selected: Nyanga (48), Mutasa (34), Chimanimani (67), Chiredzi (46), Gweru (17), and Shurugwi (29).

2.3. Data Collection and Analysis

Data were collected from the 241 common bean-growing farmers (85 male and 156 female) using a semi-structured questionnaire. Data collected through structured interviews included socio-demographic description (age, experience in common bean production, farm sizes, gender, and education level), common bean production constraints, farmers’ trait preferences of common bean cultivars, common bean cropping systems, awareness of bean fly and their control. Farmers were interviewed about awareness and the presence of bean fly in their region, their symptoms, the methods they employed to manage the pest, and the other field insect pests they deemed detrimental to bean production. Focus group discussions and transect walks were conducted to validate the data collected through interviews.
Descriptive summary statistics were calculated and computed using the Statistical Package for Social Sciences (SPSS, IBM version 22). In addition, chi-square and t-tests were performed using the cross-tabulation procedure of SPSS (SPSS, IBM version 20). The constraints were predefined, and farmers evaluated the severity of each one as very important (1), important (2), average (3), and less important (4) based on their perceptions, designated by ranking as first, second, third, or fourth, respectively. The Rank-Based Quotient (RBQ) of constraints [21] was calculated using the following formula.
RBQ = ∑fi (n+1-i) x100)/ (N*n)
where
fi = frequency of farmers for the ith rank
n = number of ranks
i = concerned ranks (1 to 4)
N=Number of farmers (241)
Furthermore, the traits were ranked after conducting a principal component (PC) analysis based on eigenvalues greater than or equal to 1. The ordinal multiple regression [22] was further applied to test the effects of key determinants on farmers’ awareness and control methods for bean fly. The best-fit model was further tested for goodness of fit based on the comparison of the null model and the full model. The regression model was used with the formula:
Y = 𝛽0+ 𝛽1Xi + 𝛽2X2 + 𝛽3X3+𝛽4X4 +𝜀
where:
Y = the farmer’s awareness of the bean fly
β0 = Constant
β1...... βn = coefficients of the explanatory variables
ε = the error term
Explanatory variables: Xi = access to extension services; X2 = years in bean production; X3 = level of education; and X4 = gender

3. Results

3.1. Socio-Economic Characteristics of the Survey Households

The socio-economic and demographic characteristics of the interviewed farmers are summarised in Table 2. The majority (66%) of respondent farmers were females between 35 and 66 years old. A greater percentage (99.2%) of the respondents received formal education, with the highest number having completed secondary education (47.3%) and tertiary education (42.74%). Farm sizes varied significantly (P<0.001) among the respondent farmers across the three provinces. Approximately 79% of farmers had farm sizes of >5 ha in Manicaland, while in Masvingo, a greater percentage of respondents had an average farm size of 2-4 ha.

3.2. Comparison of the Area Under Common Bean Production and Cropping Practices Among the Three Provinces

The area allocated to common bean cultivation varied significantly (P<0.05) among households across the studied provinces (Table 3). Unlike in Masvingo, the majority of farmers in Midlands (89%) and Manicaland (83%) allocated small plots of < 0.5 ha to common bean production. The most reported cropping system or farming practice was sole cropping of wheat (55%), followed by cereals and common bean rotation (41%), while intercropping of beans and maize was only practised by a few farmers (3%) (Table 3).

3.3. Constraints to Common Bean Production

Results from the Rank-Based Quotient (RBQ) analyses showed the severity of the production constraint (Table 4). A lower RBQ value indicates a less severe constraint. Table 4 presents that the top production constraints are insect pests (e.g., bean fly, aphids), with RBQ values of 93.5, 97.8, and 94.3 in Manicaland, Masvingo, and Midlands, respectively. This is followed by foliar bean diseases (e.g., angular leaf spot, rust, and common bacterial blight) with RBQ values 87, 90, and 93.8 in Manicaland, Masvingo, and Midlands, in that order. In addition, the RBQ analysis showed that the effect of drought differed significantly (P<0.05) among the three provinces, with the highest RBQs of 70.7 and 75.5 in Manicaland and Masvingo, respectively, compared with 63.9 in the Midlands. The lack of improved bean varieties with RBQ values of 46.2, 29.9, and 33, and the lack of varieties with farmer-preferred traits with RBQ of 38.6, 38, and 35.2 were ranked lower at Manicaland, Masvingo, and Midlands, respectively. These values indicate that the present varieties lack abiotic and biotic (e.g., insect pests and diseases) stress tolerance (Table 4).
Bean farmers incur crop losses mainly due to the bean fly and other insect pests such as cutworms, Cape Mountain Rifle (CMR) beetles, and aphids. These pests affect the crop at different crop growth stages. Respondent farmers during a focus group discussion indicated that the most important pests, in order of importance, were the bean fly, which results in poor crop stand at the seedling stage; aphids, which are more severe during dry spells; and CMR beetles, which are destructive at the flowering stage. Mites and cutworms were reported by farmers as less prevalent pests.

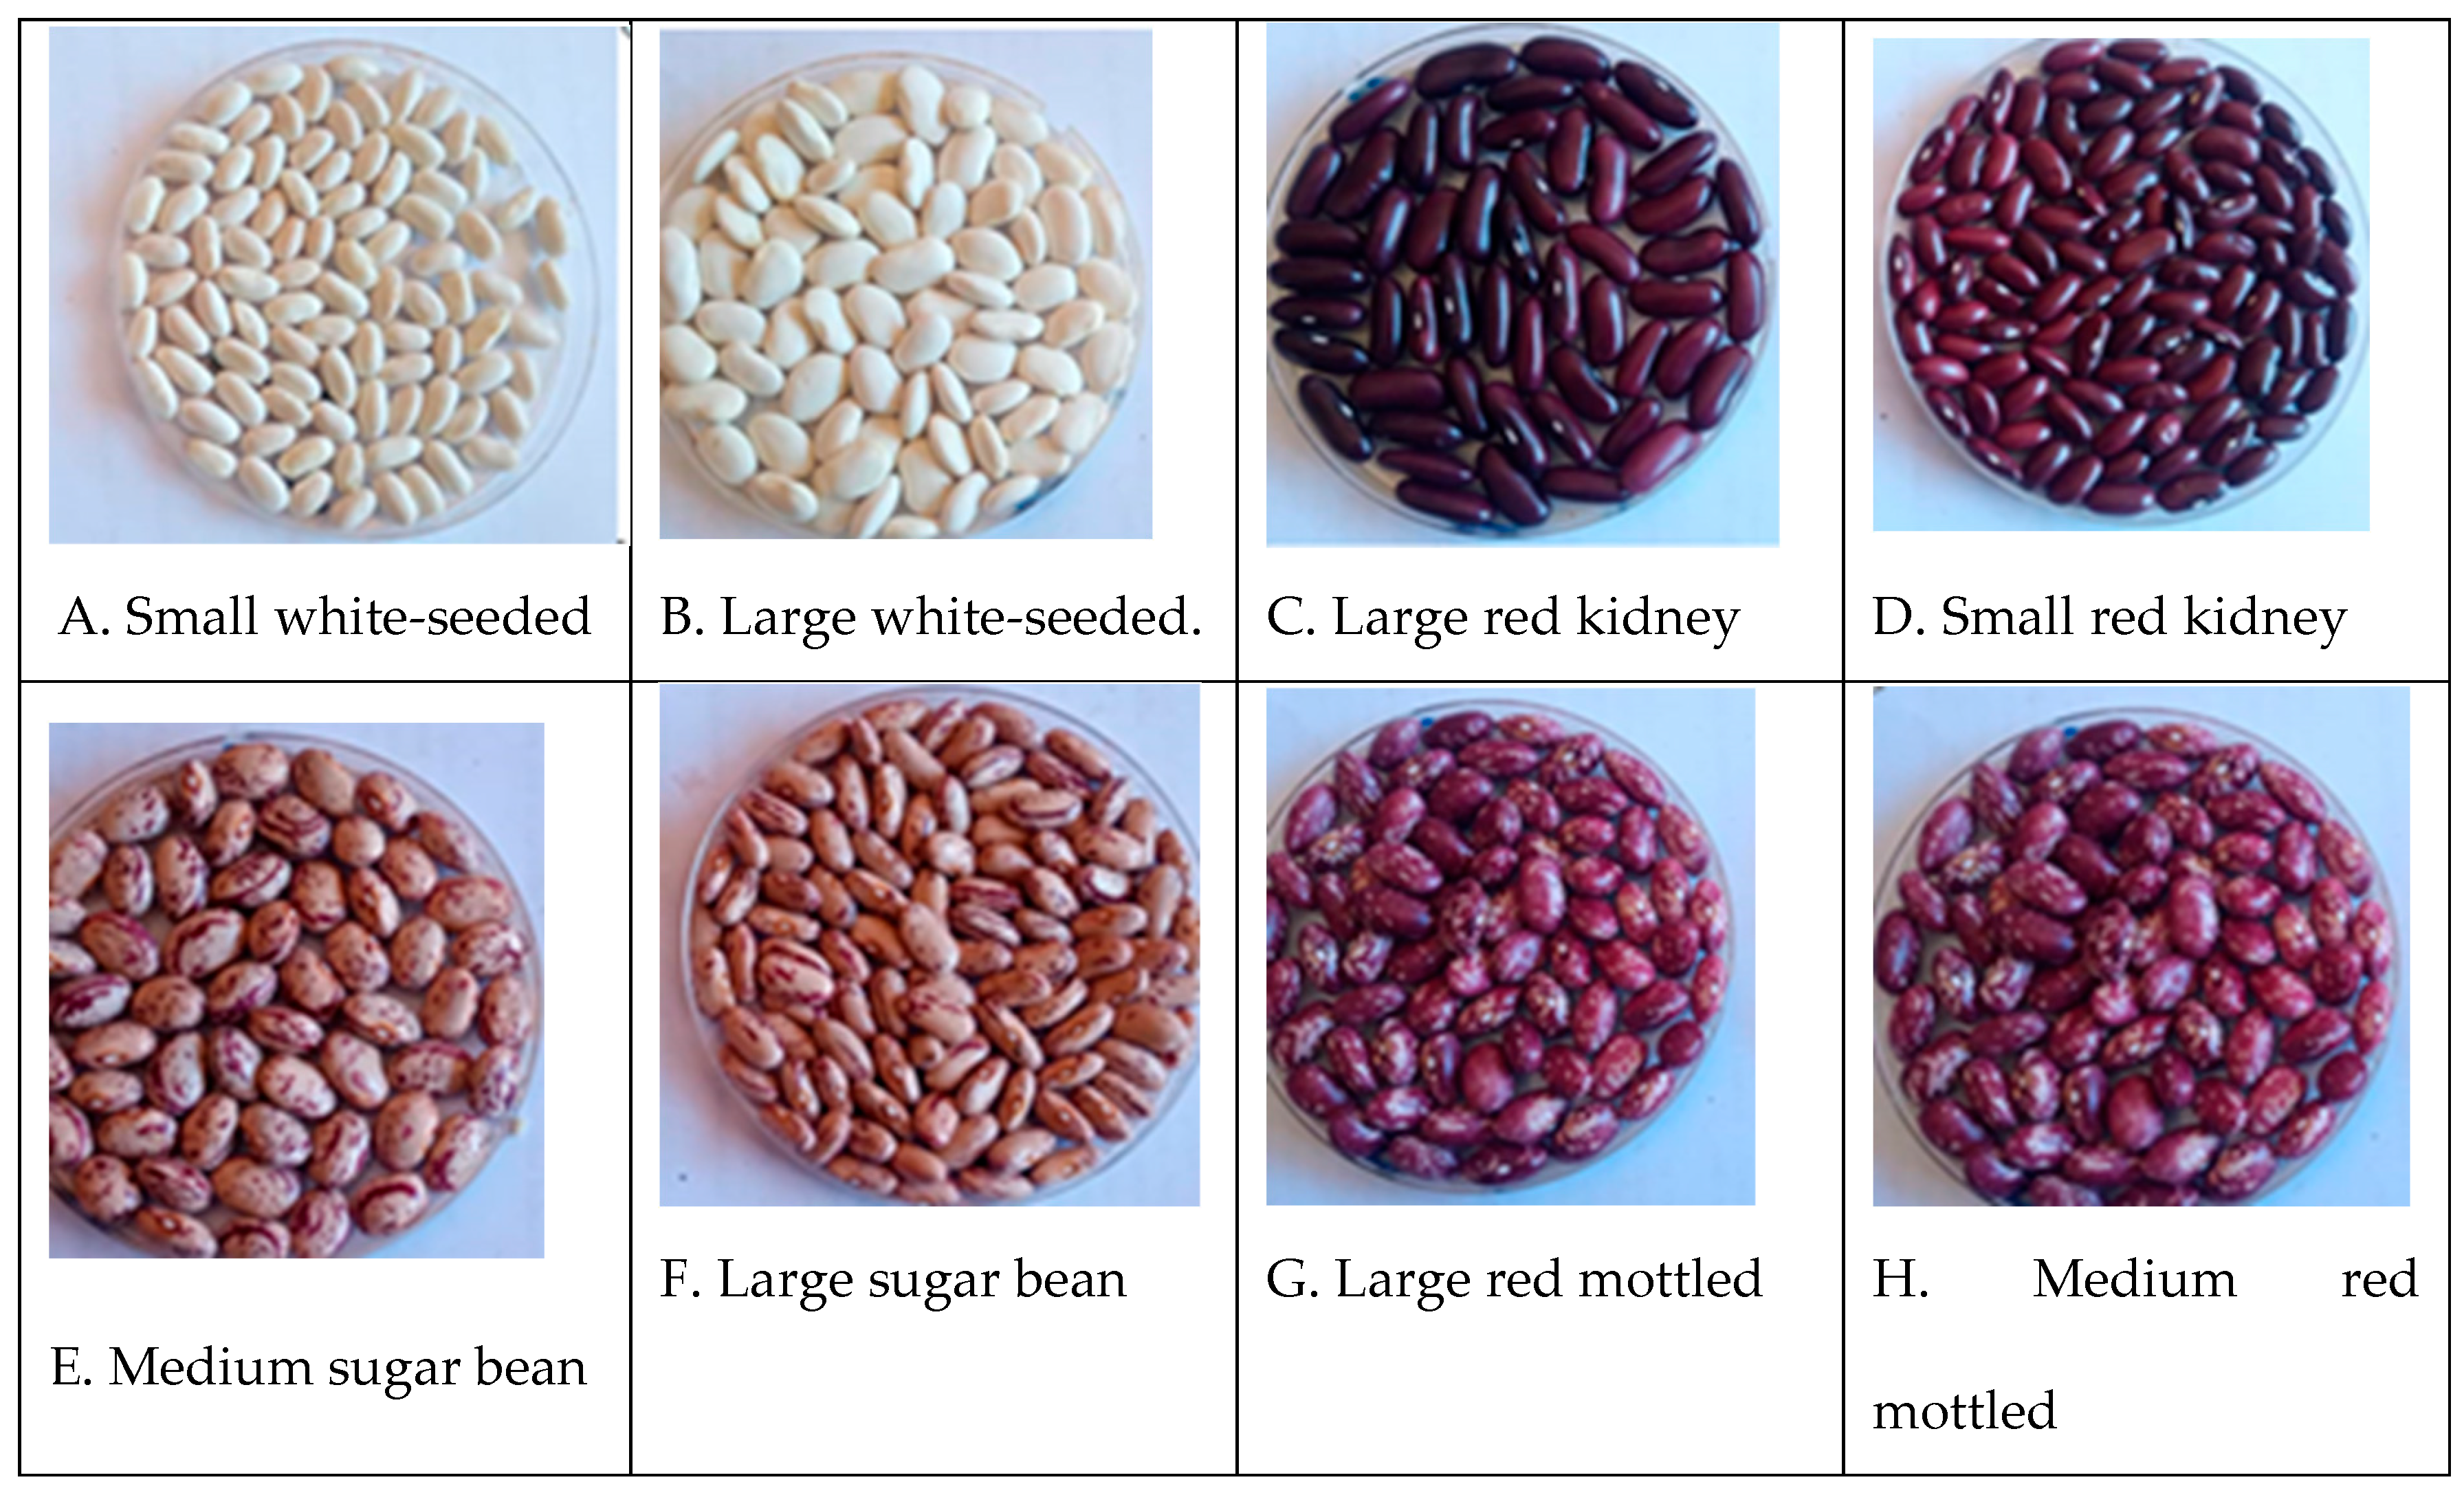
3.4. Farmer Preferred Traits

The first five principal components (PCs) with eigenvalues >0.78 explained 75% of the variation in trait preference among the respondent farmers (Table 5). The PC1 identified high grain yield (with a loading score of 0.89), disease resistance (0.73), insect pest resistance (0.64), and early maturity (0.41) as the most important traits influencing varietal choice. Seed colour (0.51) and seed size (0.68) had the highest contributions on PC2. Regarding seed size, most farmers preferred large, red mottled seeds (Figure 1 G), followed by red speckled seeds (Figure 1 F). High grain yield, tolerance to drought, resistance to diseases and insect pests such as aphids, bean fly, CMR beetles, cutworms (Table 5), and early maturity were the primary traits, while seed colour and seed size were traits of market importance (Figure 1A, G and H).

3.5. Farmers’ Awareness and Damage from Bean Fly

Farmer awareness of bean fly did not show a statistically significant difference among the respondents (ꭕ2 = 1.250; p =0.535) across the three provinces. This indicates that farmer awareness of the bean fly was consistently high across provinces and did not vary significantly by location. Among the three surveyed provinces, it was noted that in Manicaland Province, all interviewed farmers were aware of the pest, while only a small percentage (3%) of farmers in Masvingo and Midlands were not aware of the pest.
Table 6. Number of respondent farmers who were (not) aware of the bean fly pest in the three provinces in Zimbabwe.

Provinces
Awareness of the bean fly
Aware Not aware
No. of farmers No. of farmers Total
Manicaland 46 0 46
Masvingo 45 1 46
Midlands 145 4 149
Total 236 5 241
Chi-square test df=2 ꭕ2= 1.250 p-value=0.535
Df = degrees of freedom, ꭕ2 = chi-square value.

3.5. Factors That Influence Farmers’ Awareness of the Bean Fly

To determine the factors influencing farmers’ awareness of the bean fly, a multiple linear regression model was calculated. In the model, farmers’ awareness of the bean fly and its associated damage was modelled, along with gender, experience in bean production, access to extension services, farmers’ involvement in bean seed production programs, and level of education. The regression model summary (Table 7) showed that 67% of the model was explained by the selected parameters, while 33% of the variance was unexplained and independent of the parameters.

3.6. Regression Analysis of Farmers’ Awareness of Bean Fly and Its Damage in Three Selected Provinces in Zimbabwe

The results of a multiple regression analysis on factors affecting farmers’ awareness of the bean fly and its associated damage in Zimbabwe are summarised in Table 8. The extent and value of the selected variables were ascertained using the variance increase factors (VIFs) and tolerance indices (Table 8). If VIF values are >10, there are multiple relations between variables [23]. In the present findings, the VIF values for all variables are < 10, suggesting that there are no multiple relations between the variables. In addition, if tolerance values are > 0.10, there are no multiple relations between the selected variables. The tolerance values computed in this study are > 0.10, suggesting that there are no multiple relations among the variables. In addition, it was computed that none of the correlation coefficients exceeded 0.80, suggesting that there are no multiple relations among the variables. Overall, the present analysis detected a lack of multiple relations between the assessed variables on the awareness of the bean fly and its damage.
The absolute value of the Beta (β), summarised in Table 8, indicates the order of importance of the selected independent variables. The variable with the highest β value is relatively more important than the others. The findings show that access to extension services and years of experience in bean production made the highest contributions, followed by the level of education (Table 8). Gender was non-significant and had the smallest contribution to the model, with a coefficient of determination of 0.50. In summary, the multiple regression analysis revealed that education, experience in bean production, and access to extension significantly (p<0.05) influenced farmers’ awareness of the bean fly (Table 8).

3.7. Control Methods of the Bean Fly in the Study Areas

There are significant differences (P<0.05) in the bean fly control methods used by the respondent farmers across the study areas (Table 9). Predominantly, the respondent farmers reported use of crop protection chemicals (28%) and cultural practices (33%) such as ridging, fertiliser application, and crop rotation, to control bean fly in the three provinces in Zimbabwe. About 2% of respondents were unaware of any control method, and 2% were unaware of the pest and its damage.

3.8. Availability of Bean Fly-Tolerant Varieties in the Study Areas

The availability of bean fly-tolerant varieties was assessed by interviewing sampled farmers to determine which bean varieties they cultivated were tolerant of the pest. The findings revealed that no bean fly-resistant varieties were reported by the respondents or in their marketplaces.
In the study areas, farmers grow different seed colour types (Figure 1), including medium- and large-red mottled, sugar beans, and small white seeds. Small white bean or the navy bean types are produced for canning purposes, while other bean types are used for both home consumption and sale, either to traders or local boarding schools. However, none of their varieties are resistant to bean fly.

4. Discussion

The Socio-Economic Status in the Study Areas

The present study was undertaken to generate baseline information for establishing a bean fly control strategy that integrates demand-driven varieties with farmer- and market-preferred traits. Male and female farmers were involved in bean production in the study areas, unlike the notion that bean is primarily a women’s crop in Zimbabwe [9]. Men are gradually becoming more involved in its cultivation owing to the market significance and cash revenues. The study reveals high literacy rates in Zimbabwe’s bean-farming communities, highlighting the ability of smallholder farmers to easily understand and adopt technical knowledge and new technologies. In the study, there was active engagement of school leavers who have pursued higher education in bean production across the surveyed provinces. Unlike in Masvingo Province, the majority of respondents in Midlands Province (89%) and Manicaland Province (83%) allocated small plots (< 0.5 ha) to common bean production, suggesting the ideal land size that farmers can manage to produce grain for household consumption and the market.

4.1. Common Bean Production and Cropping Systems

From 1990 to 2020, world dry bean production and area harvested increased by about 60% and 36%, respectively [3], demonstrating that the production increases have not been due to increased area under cultivation but to improvements in dry bean breeding and agronomic practices [24]. With the demand for common beans in sub-Saharan Africa increasing due to population growth, growing urbanisation, and export opportunities of trading 40% of produce in domestic and regional markets [25], it seems possible that, from a breeding perspective, the wide genetic diversity offers an opportunity to incorporate many novel traits within a variety development program. With bean fly increasingly becoming the most important field pest of beans in Africa [26], including Zimbabwe, the consumption of common beans in Zimbabwe and the gap in crop production and productivity require the development of varieties with improved resistance to insect pests, such as bean fly. Owing to its value as a major crop for food security and market, in 2016, it was noted that common beans were primarily cultivated as a sole crop, typically on around 0.36 hectares per household. Mutari et al. [9] indicated that sole cropping was the most common farming practice, with farmers managing small plots of land for navy bean production. In the present study areas common beans are often utilized in rotation and sole cropping systems, with limited cases of intercropping. However, better farming practices that suit farmers’ needs must be mainstreamed, and this study was designed to gain a better understanding of key issues, as the problems are identified and communicated directly by the farmers. Understanding farmers’ needs and requirements in new bean varieties is essential for developing varieties and effective pest control management strategies tailored to their needs, thereby increasing the likelihood of adoption [27,28]. Hence, this study used a participatory approach. Information gathered during the focus group discussion with farmers indicated that extension agents strongly discourage intercropping, especially among bean seed producers. Therefore, farmers opted to control bean fly through cultural practices, as intercropping is impractical. Crop rotation is highly recommended because it disrupts the life cycle of the bean fly, which has four stages: egg, larva, pupa, and adult. An effective control strategy for bean fly and other important insect pests should leverage an integrated approach (e.g., using resistant varieties and cultural practices such as early planting, crop rotation, and earthing up) that is readily adopted in farming systems.

4.2. The Major Bean Production Constraints in the Study Area

The identification of crop productivity constraints is crucial for designing integrated control strategies guided by resistance-breeding programs aimed at improving productivity [29]. The key biotic constraints being faced by farmers in the study areas were insect pests (aphids, bean fly, CMR blister beetles, and cutworms) and diseases (bacterial blight, angular leaf spot, rust, and anthracnose). Related results were reported for groundnuts, where constraints to production were ranked as drought, yield, insect pests, and diseases [30]. Biotic constraints are significant limitations to crop production and productivity in common beans. Therefore, developing climate-smart varieties and strengthening integrated insect and disease management strategies are essential to enhance resilience and ensure sustainable production [31].
Earlier reports revealed a lack of awareness regarding improved varieties, underscoring the need for better information dissemination [12]. Breeding efforts have produced varieties with some of the traits preferred by farmers. However, the effect of drought on common bean was significantly (P<0.05) different between the study areas, with more farmers in the Midlands (64%) perceiving drought as the most important production constraint. In a recent study assessing production constraints in navy bean production, drought stress was also reported as a major constraint among bean farmers [9]. Therefore, common bean breeding programs should integrate drought tolerance, insect pest and disease resistance during variety development to enhance production and productivity.

4.3. Farmer-Preferred Traits

Studying farmers’ varietal preferences is crucial for enhancing the utilisation of new varieties and informing plant breeding programs [32]. Thus, this research employed a participatory approach to foster discussions between common bean farmers and researchers, aiming to gain insight into the traits farmers prefer. The study revealed that the respondent farmers prioritise production attributes (including grain yield, drought tolerance, and resistance to insect pests and diseases) over marketing attributes (such as seed size and colour). This is due to the unreliable nature of rainfall in the country, which could influence farmers to consider adaptation to constraints prevailing in the cropping environment and productivity as their best criterion. This concurs with other studies that found that, for rice cultivation in Ghana, both men and women significantly valued production traits [33] over consumption traits. However, in India, market traits like seed size (small) and colour (red) were most preferred due to high market demand. Hence, releasing bean varieties with preferred traits is vital. Previous bean fly-resistant varieties in Kenya have seen low adoption due to a lack of desirable traits [34]. Therefore, prioritising the development of bean fly-resistant cultivars with farmers’ preferred traits is crucial for demand-led bean breeding programs.

4.4. Awareness and Control of Bean Fly Highlighted by the Respondent Farmers

The results of this study show that the majority of farmers (97.9%) were aware of the bean fly. These results further support the implementation of integrated pest management using chemical sprays (28%) and cultural practices (33%), including fertiliser application, crop rotation, and earthing up. Similar findings were reported in Malawi, where farmers identified chemical insecticides as the most effective and efficient control method [15], followed by cultural practices such as intercropping, early planting, and varietal mixtures. However, continued pesticide use has several challenges, including pesticide resistance, non-selective damage to other valuable insects, and environmental pollution [35,36]. Improved varieties are grown by farmers, but the current study revealed that no bean fly-resistant varieties are available on the market (Table 9), with similar conclusions drawn in Malawi [15]. Therefore, the study reveals an urgent need to enhance efforts to develop bean varieties resistant to bean fly damage and incorporate traits preferred by farmers to boost common bean production in East and Southern Africa (ESA).

4.5. Factors Influencing Farmers’ Awareness of Bean Fly Damage

The results of multiple linear regression revealed a stronger positive effect for the number of years in bean production, suggesting that greater experience in bean production is associated with better results. Additionally, access to extension services has a positive, significant effect, suggesting that increased extension support will lead to a corresponding rise in bean fly awareness. The level of education shows a very weak positive relationship with the level of bean fly awareness. This suggests that higher education may slightly increase awareness of the bean fly. Overall, the model indicates that experience in bean production and access to extension services are key positive predictors, as evidenced by their highest β values. Gender and level of education, however, do not demonstrate significant influence in this analysis. These findings suggest that practical efforts to increase extension access and leverage production experience could improve farmers’ awareness of the bean fly. A similar study in Malawi found that important factors influencing awareness of bean fly included education, prior experience with bean fly, and the farmer’s geographical location [15].

5. Conclusions

This study underscores that while the majority of respondent farmers across the three provinces in Zimbabwe were aware of the bean fly and used various control strategies, adoption of resistant varieties remains low. The farmer preferred traits, which include grain yield, pest and disease resistance, and early maturity, should guide breeding efforts. Hence, integrating bean fly resistance with desirable traits will be critical for developing improved cultivars that are both effective and acceptable to farmers, supporting sustainable and resilient common bean production

Author Contributions

This work was done in collaboration with all authors. Conceptualization, S.T and H.S, Formal analysis, ST, Investigation, ST, Supervision, HS, WN, CMM, Validation, HS, Writing-original draft, ST, Writing –review & editing, H.S, WN, CMM, SA. All the authors read and approved the final manuscript.

Funding

This work was supported by the Pan-African Bean Research Alliance (PABRA) Academy.

Institutional Review Board Statement

Not applicable.

Data Availability Statement

Not applicable.

Acknowledgments

The Pan Africa Bean Research Alliance (PABRA) Academy and the Department of Research and Specialist Services/Zimbabwe are thanked for providing financial and research support to the first author. All the farmers and the extension agents are sincerely acknowledged for their support in making this study possible.

Conflicts of Interest

The authors declare no conflicts of interest.

References

  1. Ambachew, D., Mekbib, F., Asfaw, A., Beebe, S. E., & Blair, M. W. (2015). Trait associations in common bean genotypes grown under drought stress and field infestation by BSM bean fly. Crop Journal, 3(2015), 305–316. [CrossRef]
  2. Nchanji, E. B., Chisorochengwe, N., Tsekenedza, S., Gutsa, F., Musyoka, J. N., & Lutomia, C. K. (2024). Breaking ground: transformative partnerships for inclusive bean breeding in Zimbabwe. Frontiers in Sustainable Food Systems, 8(2024), 1–13. [CrossRef]
  3. FAO. (2022). Food and Agriculture Organisation of the United Nations, Rome, 2022.
  4. Moreno CR, López OP, & Gonzalez E. (2014). Critical Reviews in Food Science and Nutrition Hard - to - cook phenomenon in common beans — A review. Food and Science Nutrition, 35(2014), 263–298. [CrossRef]
  5. Chaibva, E., Musundire, L., Chivasa, W., & Lagat, A. (2024). Adaptation, Path Coefficient, and Correlation Study of Yield and Associated Traits in Common Bean (Phaseolus vulgaris L.) Genotypes. Journal of Agricultural Science, 16(2024), 1–16. [CrossRef]
  6. Maereka EK, M. B., Kunaka F, Nchanji EB, Tsekenedza S, & Muthoni-andriatsitohaina R. (2024). NUA 45, a dry bean cultivar, builds a subtle brand in Zimbabwe against all odds. Frontiers in Sustainable Food Systems, 10(2024), 1–12. [CrossRef]
  7. Sheikh, F. A., Sofi, P. A., Khan, M. N., Sofi, N. R., Wani, S. H., & Bhat, M. A. (2017). Participatory rural appraisal and farmers’ perception about common bean varieties in temperate Kashmir. Journal of Applied and Natural Science, 9(2017), 1256–1263. [CrossRef]
  8. Losa, A., Vorster, J., Cominelli, E., Sparvoli, F., Paolo, D., Sala, T., Ferrari, M., Carbonaro, M., Marconi, S., Camilli, E., Reboul, E., Waswa, B., Ekesa, B., Aragão, F., & Kunert, K. (2022). Drought and heat affect common bean minerals and human diet—What we know and where to go. Food and Energy Security, 11(2022), 1–29. [CrossRef]
  9. Mutari, B., Sibiya, J., Nchanji, E. B., Simango, K., & Gasura, E. (2021). Farmers ’ perceptions of navy bean (Phaseolus vulgaris L.) production constraints, preferred traits and farming systems and their implications on bean breeding : a case study from South East Lowveld region of Zimbabwe. Journal of Ethnobiology and Ethnomedicine, 3(2021), 1–19.
  10. Luque, R. De, & José, J. (2014). Major constraints and trends for common bean production and commercialization; establishing priorities for future research. [CrossRef]
  11. Kiptoo, G. J., Kinyua, M. G., Kiplagat, O. K., Agron, I. J., & Agri, R. (2019). Evaluation of phenolic content of common bean (Phaseolus vulgaris L.) in association to bean fly (Ophiomyia spp.). International Journal of Agronomy and Agriculture Research, 14(2019), 9–13. http://www.innspub.net.
  12. Katungi, E., Mutua, M., Mutari, B., Makotore, W., Kalemera, S., Maereka, E., Birachi, R. Z. E., & Chirwa, R. (2017). Improving bean production and consumption in Zimbabwe baseline report. Improving Bean Production and Consumption in Zimbabwe Baseline Report, 2017, 49-pp. https://cgspace.cgiar.org/handle/10568/82724.
  13. Edwards, O., & Singh, K. B. (2006). Resistance to insect pests : What do legumes have to offer ? Euphytica, 147(2006), 273–285. [CrossRef]
  14. Ojwang, P. P. O., Eldridge, T., Corredor-Moreno, P., & Njung’e, V. (2021). Structure of genetic diversity and genome-wide association studies of bean fly (Ophiomyia spencerella) resistance in common bean. Euphytica, 217(2021), 1–21. [CrossRef]
  15. Nkhata, W., Shimelis, H., Melis, R., Chirwa, R., Mzengeza, T., Mathew, I., & Shayanowako, A. (2021). Selection for bean fly (Ophiomyia spp) resistance and agronomic performance in selected common bean (Phaseolus vulgaris L.) accessions. Crop Protection, 140(2021), 1–8. [CrossRef]
  16. Mongi, R., Tongoona, P., Shimelis, H., & Sibiya, J. (2016). Appraisal of common bean farming systems under angular leaf spot disease prone environments of the Southern Highlands of Tanzania. Indian Journal of Agricultural Research, 50(2016), 428–433. [CrossRef]
  17. Ouedraogo, A. P., Danquah, A., Tignegre, J.-B., Batieno, B. J., Bama, H., Ilboudo, D., Ouedraogo, J. T., Ayertey, J. N., & Ofori, K. (2020). Participatory Rural Appraisal on Cowpea Production Constraints and Farmers’ Management Practices in Burkina Faso. Modern Applied Science, 14(2020), 1–18. [CrossRef]
  18. Daudi, H., Shimelis, H., Laing, M., Okori, P., Mponda, O., Daudi, H., Shimelis, H., Laing, M., Okori, P., & Mponda, O. (2018). Groundnut production constraints, farming systems, and farmer-preferred traits in Tanzania. Journal of Crop Improvement, 7528(2018), 812–828. [CrossRef]
  19. Nyang, J. O., Mohamed, J. H., Mango, N., Makate, C., & Wangeci, A. N. (2021). Heliyon Smallholder farmers ’ perception of climate change and adoption of climate smart agriculture practices in Masaba South Sub-county, Kisii, Kenya. Heliyon, 7(2020), 1–18. [CrossRef]
  20. Mangole, G., Ithuteng, M., & Al, E. (2022). Challenges and Opportunities in Common Bean Production and Marketing in Botswana. African Journal of Food, Agriculture, Nutrition and Development, 22(2022), 1–18.
  21. Sabarathnam, V.E. (1988). Manual on Field Experience Training for ARS Scientists, National Academy and Agricultural Research Management, Hyderabad.
  22. McCullagh, P., & Nelder, J.A. (1989). Generalized Linear ModelsInference. In Regression Analysis with Application G.B. Wetherill (Vol. 42, Issue 1989).
  23. Uyanik, G. K., & Guler, N. (2013). A study on multiple linear regression analysis. Procedia-Social and Behavioral Sciences, 106(2013), 234–240. [CrossRef]
  24. Uebersax, M. A., Cichy, K. A., Gomez, F. E., Porch, T. G., Heitholt, J., Osorno, J. M., Kamfwa, K., Snapp, S. S., & Bales, S. (2023). Dry beans (Phaseolus vulgaris L.) as a vital component of sustainable agriculture and food security—A review. Legume Science, 5(1), 1–13. [CrossRef]
  25. Larochelle C, Alwang J, Norton GW, Katungi E, & Labarta RA. (2015). Impacts of improved bean varieties on poverty and food security in Uganda and Rwanda. In Crop improvement, adoption, and impact of improved varieties in food crops in sub-Saharan Africa (pp. 314–337). [CrossRef]
  26. Ochilo, W. N., & Nyamasyo, G. H. (2011). Pest status of bean stem maggot (Ophiomyia spp.) and black bean aphid (Aphis fabae) in Taita District, Kenya. Tropical and Subtropical Agroecosystems, 13(2011), 91–97.
  27. Chitere, P. O., & Omolo, B. A. (1993). Farmers’ indigenous knowledge of crop pests and their damage in Western Kenya. International Journal of Pest Management, 39(1993), 126–132. [CrossRef]
  28. Tanzubil, P. B., & Yakubu, E. A. (1997). Insect pests of millet in northern Ghana. 1. Farmers’ perceptions and damage potential. International Journal of Pest Management, 43(1997), 133–136. [CrossRef]
  29. Kraaijvanger, R., Almekinders, C. J. M., & Veldkamp, A. (2016). Identifying crop productivity constraints and opportunities using focus group discussions: A case study with farmers from Tigray. NJAS - Wageningen Journal of Life Sciences, 78(2016), 1–13. [CrossRef]
  30. Banla, E. M., Dzidzienyo, D. K., Beatrice, I. E., Offei, S. K., Tongoona, P., & Desmae, H. (2018). Groundnut production constraints and farmers’ trait preferences: A pre-breeding study in Togo. Journal of Ethnobiology and Ethnomedicine, 14(2018), 14–75. [CrossRef]
  31. Mangole, G., Ithuteng, M., & Al, E. (2022). Challenges and Opportunities in Common bean Production and Marketing in Botswana. African Journal of Food, Agriculture, Nutrition and Development, 22(2022), 1–18.
  32. Ndeko, A. B., Chuma, G. B., Mondo, J. M., Kazamwali, L. M., Civava, R., Bisimwa, E. B., & Mushagalusa, G. N. (2025). Farmers’ preferred traits, production constraints, and adoption factors of improved maize varieties under South-Kivu rainfed agro-ecologies, eastern D.R. Congo: implications for maize breeding. International Journal of Agricultural Sustainability, 23(2025), 1–26. [CrossRef]
  33. Frimpong, B. N., Asante, B. O., Asante, M. D., Ayeh, S. J., Sakyiamah, B., Nchanji, E., Mujawamariya, G., Zenna, N., & Tufan, H. (2023). Identification of Gendered Trait Preferences among Rice Producers Using the G+ Breeding Tools: Implications for Rice Improvement in Ghana. Sustainability, 15(2023), 1–24. [CrossRef]
  34. Kiptoo, G. J., Kinyua, M., Kiplagat, O., Wanjala, F. M. E., & Kiptoo, J. J. (2016). Evaluation of Common Bean (Phaseolus vulgaris L.) Varieties for Resistance to Bean Stem Maggot (Ophiomyia spp.) in Kenya. American Journal of Experimental Agriculture, 12(2016), 1–7. [CrossRef]
  35. Nderitu JH, Kayumbo HY, & Mueke JM. (1991). Evaluation of bean cultivars for resistance to beanflies in single plantings at different seasons. International Journal of Tropical Insect Science, 12, 463–471. [CrossRef]
  36. Oesterlund AH, Thomsen JF, Sekimpi DK, Maziina J, Racheal A, & Jørs E. (2014). Pesticide knowledge, practice and attitude and how it affects the health of small-scale farmers in Uganda: A cross-sectional study. African Health Sciences, 14(2014), 420–433. [CrossRef]
Figure 1. Photos showing the seed attributes (seed colour, size, and shape) of the common bean varieties grown in Zimbabwe. Note: the names of the varieties are A= Protea, B=Jasmine, C=Gloxinia, D=Landrace, E=Sweet William, F= Gloria, G=Cherry, and H= NUA45.
Preprints 200428 g001
Table 1. Geographical description of the study sites with sampled farmers.
Sampled farmers
Province District Latitude Longitude Altitude (masl) Male Female Total
Manicaland Nyanga 170482’2’’S 32058’17’’E 812 20 28 48
Mutasa 18035’57’’S 32043’52’’E 888 11 23 34
Chimanimani 19051’29’’S 32024’14’’E 513 23 44 67
Masvingo Chiredzi 20057’7’’S 3208’29’’E 397 20 26 46
Midlands Gweru 19048’33’’S 29078’33’’E 1419 3 14 17
Shurugwi 19037’27’’S 30062’11’’E 1179 8 21 29
masl = meter above sea level.
Table 2. Socio-Demographic Parameters of Respondent Farmers in the Study Areas (%; n =241).
Variable Midlands Masvingo Manicaland %Mean χ² Df P-value
Gender
Male 23.91 43.48 36.24 34.54 4.018 2 0.134
Female 76.09 56.52 63.76 65.46
Age of farmers (year)
<35 15.22 17.39 13.42 15.34 2.819 8 0.940
36-45 15.22 19.57 17.45 16.9
46-55 21.74 21.74 16.11 19.25
56-65 10.87 10.87 16.11 14.43
>66 36.95 32.61 39.6 30.45
Level of education
None 0 2.17 2.68 1.62 5.713 6 0.450
Primary (Grade 1-7) 10.89 4.35 10.01 13.18
Secondary (Form 1-6) 52.17 39.13 48.32 46.54
Tertiary 36.96 54.35 40.93 44.08
Farm size (ha)
>5 63.04 2.17 79.19 48.13 103.0 6 <.0.001
2-5 30.43 97.82 18.12 48.79
0.6 -2 4.35 0.00 2.68 2.34
<0.5 2.17 0.00 0.00 0.72
Df = degrees of freedom; χ² = Chi-square value.
Table 3. Common Bean production and cropping systems in three provinces in Zimbabwe in 2024.
Variables Midlands Masvingo Manicaland % Mean ꭕ2 d.f P –value
Cultivation area (ha)
2-4 4.7 80.4 6.5 30.5 142.1 4 <0.001
0.6-2 6.0 10.9 10.9 9.3
< 0.5 89.2 8.7 82.6 60.1
Cropping system
Sole cropping of beans 52 60 52 54.6
Crop rotation of cereals with beans 44 37 41 40.6 1.228 4 0.814
Intercropping of beans with maize 4 2 4 3.3
Df = degrees of freedom, χ² = Chi-square value.
Table 4. The major constraints to common bean production, as ranked by respondent farmers in three provinces of Zimbabwe (N=241).
Constraints Manicaland (N=46) Masvingo (N=46) Midlands (N=149)
1 2 3 4 RBQ R 1 2 3 4 RBQ R 1 2 3 4 RBQ R P-value
Insect pests 38 5 2 1 93.5 1 43 2 1 0 97.8 1 128 12 5 4 94.3 1 0.79
Diseases 33 7 1 5 87 2 37 5 0 4 90.8 2 123 19 3 4 93.8 2 0.29
Drought 16 9 17 5 70.7 3 18 16 7 5 75.5 3 43 32 39 35 63.9 4 0.05
High cost of production inputs 13 11 13 9 65.2 4 15 14 5 12 61.4 4 45 39 38 27 67.1 3 0.48
Lack of extension service 6 6 10 24 46.7 5 3 6 6 31 39.7 6 15 30 32 72 48.0 5 0.38
Lack of improved varieties 0 2 5 39 46.2 6 1 2 2 41 29.9 9 3 12 15 119 33.0 9 0.68
Heat 4 10 7 25 46.2 6 3 7 8 31 43.5 5 19 17 24 89 44.3 6 0.48
Poor soil fertility 6 3 11 26 44.0 8 4 1 9 32 37.5 8 10 21 24 94 41.1 7 0.16
Lack of varieties with preferred traits 0 7 7 32 38.6 9 1 9 3 33 38.0 7 3 18 16 112 35.2 8 0.65
Note: A score of R=1 denotes very important and 4 less important production constraints, p-values = probability/significant values according to the Kruskal-Wallis Test procedure. R = the Rank of the constraint, RBQ = Rank Based Quotient
Table 5. Principal components revealing the association of farmer-preferred traits in common bean production in three provinces in Zimbabwe.
Variables PC1 PC2 PC3 PC4 PC5
Eigen values 1.69 1.49 0.88 0.84 0.78
Explained variance (%) 22.4 19.7 11.6 11.1 10.2
Cumulative variance (%) 22.4 42.1 53.8 64.9 75.2
Grain yield 0.89 0.16 0.1 0.03 0.23
Disease resistance 0.73 0.29 0.16 0.20 0.31
Insect pest-resistance 0.64 0.32 0.07 0.07 0.24
Early maturity 0.41 0.13 0.11 0.11 0.16
Seed colour -0.24 0.51 0.08 0.02 0.1
Seed size -0.26 0.68 0.29 0.17 -0.02
PC = Principal component .
Table 7. A regression model summary comparing farmers’ awareness of the bean fly and its associated damage, influenced by gender, experience in bean production, access to extension services, involvement in bean seed production programs, and level of education.
Degree of correlation (r) R-squared (coefficient of determination) Adjusted R-Square Std. Error of the Estimate Durbin-Watson statistics
0.810 0.667 0.652 0.28380 2.125 (P = 0.00)
Table 8. Determinants of farmers’ awareness of bean fly in three selected provinces in Zimbabwe were deciphered through multiple regression analysis and associated parameters.

Parameters
Coefficients Standardized Coefficients
t-test

p-value
95.0% confidence interval for β Correlations Collinearity statistics
Std. Error Beta (β) t-value Lower boundary Upper boundary Zero-order Partial Paired-r Tolerance VIF
Constant 2.404 0.214 11.209 0.000 1.979 2,828
Years in bean production 0.097 0.013 0.453 7.509 0.000 0.072 0.123 0.615 0.575 0.412 0.828 1.208
Access to extension service 0.215 0.081 0.153 2.651 0.009 0.054 0.376 0.277 0.241 0.145 0.902 1.108
Education 0.011 0.034 0.017 0.312 0.056 0.079 0.057 0.023 0.029 0.017 0.961 1.041
Gender -0.538 0.066 -0.504 -8.097 0.651 -.670 0.407 0.677 0-.604 0-.444 0.776 1.288
VIF=variance increase factor.
Table 9. The bean fly management methods practised by respondent farmers in the three selected provinces in Zimbabwe.
Control method Midlands Masvingo Manicaland % Mean 2 d.f. P-value
Crop protection chemicals 23.90 21.70 39.6 28.37
Cultural practices 34.80 35.10 29.50 33.13
Use of tolerant varieties 0.00 0.00 0.00 0.00 36.50 10 <0.001
Integrated 6.50 13.00 23.50 14.33
No control 32.60 28.00 5.40 2.20
Not aware of the pest 2.20 2.20 2.00 2.10
df = degrees of freedom; χ² =Chi-square value.
Disclaimer/Publisher’s Note: The statements, opinions and data contained in all publications are solely those of the individual author(s) and contributor(s) and not of MDPI and/or the editor(s). MDPI and/or the editor(s) disclaim responsibility for any injury to people or property resulting from any ideas, methods, instructions or products referred to in the content.
Copyright: This open access article is published under a Creative Commons CC BY 4.0 license, which permit the free download, distribution, and reuse, provided that the author and preprint are cited in any reuse.
Prerpints.org logo

Preprints.org is a free preprint server supported by MDPI in Basel, Switzerland.

Subscribe

Disclaimer

Terms of Use

Privacy Policy

Privacy Settings

© 2026 MDPI (Basel, Switzerland) unless otherwise stated