Submitted:
22 February 2026
Posted:
27 February 2026
You are already at the latest version
Abstract
Autumn irrigation is a key agricultural practice during the non-growing season in the Hetao Irrigation District, and its spatial distribution and dynamic monitoring are essen-tial for refined water resource management and for salinity control. Taking the Yichang Irrigation District in Hetao as the study area, this study integrated multi-source optical remote sensing data from GF-1/GF-6, HJ-2A/B, Landsat 8/9, and Sentinel-2, acquired dur-ing the autumn irrigation period (October–November 2024). The spectral characteristics of croplands in the non-growing season were analyzed, and a soil moisture index was con-structed to retrieve the extent of autumn irrigation and reveal its spatiotemporal evolution at both the district and irrigation unit scales. The results indicate that cropland spectral responses in the non-growing season can be classified into three types: non-irrigated fields, post-irrigation fields with a surface-water layer, and post-irrigation fields after sur-face-water infiltration. The visible–red-edge–near-infrared (450–890 nm) and shortwave infrared (1565–2290 nm) regions are highly sensitive to soil moisture variations. Among the tested indices, the soil moisture index based on the near-infrared–shortwave infrared band combination exhibited the most consistent performance and highest accuracy in identifying irrigated areas. Newly irrigated areas characterized the irrigation rate, whereas the cumulative irrigated area reflected the actual coverage. Together, these indi-cators delineate the four phases of autumn irrigation: initiation, acceleration, stabilization, and termination. The coefficient of determination (R²) between the remotely sensed cumu-lative irrigated area and statistical records was 0.95. The final cumulative au-tumn-irrigated area was 1040.76 km², compared with 831.4 km² reported in the statistical data, satisfying the accuracy requirement for large-scale irrigation monitoring. At the irri-gation-unit scale, the linear fit for the newly irrigated area yielded R² = 0.75, effectively capturing incremental changes across different phases. The spatiotemporal evolution ex-hibited clear regularity. Temporally, the entire district follows a four-phase pattern, and the similarity between unit- and district-scale processes increases with the ca-nal-controlled area. Spatially, early stage irrigation was concentrated along the Fengji, Shahe, Yihe, and Tongji main canals, forming an east–west gradient with greater intensity in the east. As irrigation progresses, irrigated areas expand along the hierarchy of the main, primary, branch, and lateral canals, gradually forming contiguous patches and ul-timately an integrated district-wide pattern. Irrigation remains relatively sparse along the northern margin and in the southwest, whereas large canal units, such as Fengji, Zaohuo, Tongji, and Yihe, dominate the spatial evolution. This multi-source remote sensing ap-proach provides a scientific basis for optimizing autumn irrigation water allocation, im-proving irrigation scheduling, and enhancing water-use efficiency in the Hetao Irrigation District.
Keywords:
autumn irrigation
; multi-source optical remote sensing
; irrigated area
; spectral characteristics
; Hetao Irrigation District
1. Introduction
Irrigation is a fundamental guarantee of agricultural production in arid and semi-arid regions [1,2,3]. It not only directly affects crop yield and quality but also plays a crucial role in optimizing regional water allocation and in supporting sustainable development. Autumn irrigation is a distinctive regime in the Hetao Irrigation District. It performs multiple functions, including leaching soil salts, improving soil structure through freeze–thaw processes, and conserving moisture for spring sowing. Its spatial pattern and dynamic evolution are closely associated with irrigation water use efficiency, salinity control, and agricultural production. Therefore, accurate and timely monitoring of the spatiotemporal dynamics of autumn-irrigated areas, together with an analysis of the process differences among irrigation units, can provide scientific support for water scheduling, irrigation system optimization, and refined management in large irrigation districts [4].1−34
Traditional monitoring of irrigated areas mainly relies on field surveys and statistical data. These approaches are time-consuming and labor-intensive, lack timeliness, and provide limited spatial accuracy, making them inadequate for dynamic management in large irrigation districts [5,6,7,8]. Remote sensing, characterized by wide spatial coverage, short revisit cycles, and diverse data sources [9,10,11], has become an important tool for monitoring irrigated areas [12,13]. Extensive studies based on multi-source remote sensing data have developed multiple technical approaches, including optical remote sensing [14], microwave remote sensing [15,16], and multi-source data fusion methods [17,18,19]. In the optical domain, Qian et al. [20] combined MODIS and Sentinel-2 data to construct a multi-band water index (MBWI) for retrieving autumn irrigation progress, taking advantage of the sensitivity of medium-to-high-resolution optical data to surface moisture content. Du et al. [21] used Landsat-8 to develop the temperature vegetation drought index (TVDI) and the modified perpendicular drought index (MPDI) for irrigated area identification in the Jiefangzha district, demonstrating the potential of vegetation and drought indices for irrigation monitoring. Longo-Minnolo [22] and Acharya [23] proposed stand-alone methods based on the optical trapezoid model (OPTRAM), providing physical support for irrigation detection. In the microwave domain, Yang et al. [24] used Sentinel-1 radar backscatter time-series variations to develop a differencing and local-threshold method for extracting actual irrigated areas, overcoming the limitations of cloud and rainfall interference in optical remote sensing [25]. Bazzi [26,27] and Gao [28] employed Sentinel-1 time series data to detect field-scale irrigation events and map irrigated areas, confirming the stability of microwave remote sensing in complex weather conditions.5−89−11121314151617−19202122232425262728
Threshold-based methods are widely used spectral-feature-based approaches for extracting irrigated areas [29]. Suitable bands are selected to construct indices or models that enhance the target information, and thresholds are then applied to segment images and identify irrigated areas [30]. These methods include single-band and multiband approaches. Single-band methods contain limited information and have gradually been replaced by multi-band approaches that integrate spectral characteristics from multiple bands for classification purposes. Because the wavelength ranges vary across satellites, different identification indices must be constructed according to the band configuration of each sensor when extracting irrigated areas [31].293031
With the development of artificial intelligence, machine learning [32], and deep learning algorithms [33] have provided effective tools for the high-accuracy identification of irrigation extent. Yu et al. constructed NDVI, SAVI, and OSAVI from Sentinel-2 data and extracted irrigated areas using random forest, CART decision trees, and support vector machines, significantly improving classification accuracy over complex surfaces. Magidi et al. [34] achieved efficient large-scale irrigated-area mapping on the Google Earth Engine platform using a random forest classifier, providing an operational framework for regional monitoring. Zhang et al. [35] mapped irrigated cropland across China using a synergistic training-sample generation strategy combined with machine learning classifiers, demonstrating the applicability of this approach at the national scale [36]. However, during the non-growing season, croplands are characterized by low vegetation cover and complex surface conditions. Conventional remote sensing methods often suffer from spectral confusion between irrigated and non-irrigated areas, as well as trade-offs between spatial and temporal resolution, resulting in insufficient accuracy for autumn-irrigation extraction and limited capability to characterize temporal evolution and spatial heterogeneity. In addition, a single data source is constrained by its inherent characteristics [37], such as the susceptibility of optical data to weather conditions and the relatively coarse spatial resolution of microwave data. A single algorithm may also fail to adapt to spectral differences among multi-source datasets. Moreover, studies on multi-source optical data fusion for monitoring the specific autumn irrigation regime in the Hetao Irrigation District remain limited.323334353637
The Yichang Irrigation District is the largest irrigation district in this region. Although its irrigation and drainage system is well developed, it contains numerous irrigation units, and the initiation time, irrigation intensity, and irrigation progress vary substantially among the main and branch canals, further increasing monitoring complexity. Existing studies have largely focused on a single data source or algorithm, lacking in-depth exploitation of spectral characteristics from multi-source optical data and failing to fully utilize the band advantages of different satellites for high-accuracy and high-timeliness monitoring of autumn irrigation. Against this background, this study takes the Yichang Irrigation District as the study area and focuses on the autumn irrigation period (October–November 2024). Using multi-source optical remote sensing data from GF-1/GF-6, HJ-2A/B, Landsat 8/9, and Sentinel-2, a technical framework of “spectral analysis –index construction–threshold segmentation–temporal overlay” was developed to identify and dynamically monitor the extent of autumn irrigation. Based on this, the results were further refined to the main and branch canal unit scales to characterize the phase features and spatial distribution patterns of the irrigation process. Irrigation water-diversion data were then incorporated to analyze the relationship between the irrigated area and water use, providing scientific support for refined scheduling and efficient water utilization in irrigation districts.
2. Materials and Methods
2.1. Study Area
The study area was the Yichang Irrigation District, located within the Hetao Irrigation District in Inner Mongolia (107°45′E–108°45′E, 40°50′N–41°20′N). It covers 3449.28 km2 and is the largest irrigation district in the Hetao region (Figure 1). The area has a mid-temperate continental climate. Precipitation is concentrated in summer, whereas annual evaporation reaches 2000–2200 mm, far exceeding annual precipitation. The terrain is dominated by an alluvial plain with gentle relief and elevations ranging from 942 to 1081 m. Irrigation primarily relies on the diversion of water from the Yellow River. The irrigation and drainage infrastructure is well developed. The district includes 10 state-managed canals (6 main canals and 4 branch canals) with a total length of 469.09 km, and 5 state-managed drainage channels with a total length of 161.5 km. A total of 1539 hydraulic structures were distributed throughout the system. As a core area of the Hetao Irrigation District, Yichang has a backbone-engineering matching rate exceeding 90% and a complete irrigation–drainage network. The long-term average Yellow River diversion is 1.278 billion m3, the average ecological replenishment is 0.201 billion m3, and the average drainage is 0.036 billion m3. This drainage exports approximately 103,300 tons of salt annually, making substantial contributions to agricultural and pastoral production and ecological development in the region.
2.1.1. Irrigation Units
From upstream to downstream, the main and branch canals in the Yichang Irrigation District are the Nansanzhi Branch Canal, Fengji Main Canal, Shiba Branch Main Canal, Fuxing Main Canal, Zaohuo Main Canal, Guangze Branch Main Canal, Shahe Main Canal, Yihe Main Canal, Sudulong Branch Main Canal, and the Tongji Main Canal. The district implements a combined management system involving professional and collective management. Before each irrigation season, the crop planting structure is surveyed and summarized via Zhikou canals, and water-use plans for spring–summer irrigation, autumn irrigation, and autumn flooding irrigation are formulated (Table 1) to support rational water allocation planning. Water distribution follows a combined strategy of “upstream–downstream, left bank–right bank, high canal–low canal, and rotational irrigation” to ensure orderly irrigation and continuously improve water-use efficiency. In this study, the control range of each main canal (or branch main canal) was defined as an irrigation unit (Figure 2).
2.1.2. Water Diversion and Irrigated Area
In 2023 and 2024, the Yellow River diversion volumes in the Yichang Irrigation District were 1.068 billion m3 and 1.20 billion m3, respectively. Spring–summer irrigation accounted for 47.5% and 54.57% of the diversion (Figure 3), autumn irrigation accounted for 19.84% and 13.28%, and autumn flooding irrigation accounted for 32.66% and 32.16%, respectively. The cropland area was 2.943 million mu. In 2023 and 2024, the cumulative irrigated areas were 5.8264 million mu and 4.8808 million mu, respectively. Spring–summer irrigation accounted for 41.93% and 49.76% of the irrigated area, autumn irrigation accounted for 36.50% and 24.69%, and autumn flooding irrigation accounted for 21.58% and 25.55% (Figure 4). Spring–summer irrigation and autumn irrigation have longer durations (approximately 60 days), whereas autumn flood irrigation is shorter (approximately 35 days). Autumn flooding irrigation has the largest irrigation quota because it serves both moisture conservation and salt leaching. Accordingly, the principle of “autumn irrigation instead of spring irrigation, and spring irrigation instead of autumn irrigation” is strictly implemented [30,38].3038
2.1.3. Meteorological Data
Temperature and precipitation data from local meteorological stations were collected for the autumn irrigation period (October 16 to November 25, 2024). These data were analyzed together with water diversion and newly irrigated areas (Figure 5).
2.1.4. Statistical Data of Autumn Irrigation Progress
2.2. Acquisition and Preprocessing of Remote Sensing Data
The GF-1, GF-6, and HJ-2A/B datasets used in this study were Level-2 products (geometrically corrected). Following system-level geometric correction, these Level-2 products were preliminarily georeferenced and could be used without additional preprocessing after downloading. However, data production requests must be submitted to the official distribution platform for on-demand generation and download. GF-1 and GF-6 are equipped with WFV sensors with a spatial resolution of 16 m, and HJ-2A/B is equipped with 16 m visible CCD sensors. GF-1, GF-6, and HJ-2A/B data were obtained from the China Center for Resources Satellite Data and Application. The Google Earth Engine (GEE) platform [34,39] was used to access, download, and preprocess Landsat 8/9 and Sentinel-2 data. Landsat 8/9 imagery was obtained from the GEE dataset LANDSAT/LC08/C02/T1_L2, which provides surface reflectance (SR) and land surface temperature (LST) data. These Level-2 data are standardized through radiometric calibration, atmospheric correction, and terrain correction and can be directly used for quantitative remote sensing analysis. Sentinel-2 imagery data were obtained from the GEE dataset COPERNICUS/S2_SR_HARMONIZED, which provides the latest Level-2A product. This dataset underwent atmospheric correction (bottom-of-atmosphere reflectance), orthorectification, and geometric refinement; therefore, the reflectance values represent surface conditions and can be directly used for quantitative analysis [40,41].
Within the LANDSAT/LC08/C02/T1_L2 Landsat 8/9 dataset, the panchromatic band has a resolution of 15 m. The Landsat 8/9 multispectral bands were pan-sharpened using the NNDiffuse Pan Sharpening algorithm to enhance the spatial resolution from 30 m to 15 m by fusing multispectral and panchromatic data. Mosaic generation and projection were then performed in ENVI 5.6. Non-cropland areas were masked to reduce their influence on irrigated-area extraction.

Table 2.
Multi-source optical satellite bands and spatial resolution used in this study.
| Satellite | Sensor | Wavelength (nm) | Center Wavelength (nm) | Spatial Resolution |
|---|---|---|---|---|
| GF1 | B1 Blue | 450-520 | 485 | 16m |
| B2 Green | 520-590 | 555 | ||
| B3 Red | 630-690 | 660 | ||
| B4 Near-infrared | 770-890 | 830 | ||
| GF6 | B1 Blue | 450-520 | 485 | 16m |
| B2 Green | 520-590 | 555 | ||
| B3 Red | 630-690 | 660 | ||
| B4 Near-infrared | 770-890 | 830 | ||
| B5 Red Edge I | 690-730 | 710 | ||
| B6 Red Edge II | 730-770 | 750 | ||
| B7 | 400-450 | 425 | ||
| B8 | 590-630 | 610 | ||
| HJ-2A/2B | B1 Blue | 450-520 | 485 | 16m |
| B2 Green | 520-590 | 555 | ||
| B3 Red | 630-690 | 660 | ||
| B4Red Edge | 690-730 | 710 | ||
| B5Near-infrared | 770-890 | 830 | ||
| Landsat8/9 OLI | B2 Blue | 450-510 | 480 | 30m |
| B3 Green | 530-590 | 560 | ||
| B4 Red | 640-670 | 655 | ||
| B5 Near-infrared | 850-880 | 865 | ||
| B6 Shortwave IR I | 1570-1650 | 1610 | ||
| B7 Shortwave IR II | 2110-2290 | 2200 | ||
| B8 Panchromatic | 500-680 | 590 | 15m | |
| Sentinel-2A/2B | B1 Blue | 458-523 | 490 | 10m |
| B2 Green | 543-578 | 560 | 10m | |
| B3 Red | 650-680 | 665 | 10m | |
| B5 Red Edge I | 698-713 | 705 | 20m | |
| B6 Red Edge II | 733-748 | 740 | 20m | |
| B7 Red Edge III | 773-793 | 783 | 20m | |
| B8 Near-infrared | 785-900 | 842 | 10m | |
| B8A Near-infrared | 855-875 | 865 | 20m | |
| B11 Shortwave IR I | 1565-1655 | 1610 | 20m | |
| B12 Shortwave IR II | 2100-2280 | 2190 | 20m |
After preprocessing, remote sensing images for the autumn irrigation period (October–November 2024) in the Yichang Irrigation District were obtained, comprising 15 scenes (Table 3).
2.3. Methods
This study integrates 15 optical remote sensing scenes acquired during October–November 2024 from the GF-1/GF-6, HJ-2A/B, Landsat 8/9, and Sentinel-2satellites. Using a cropland mask, the imagery was processed in ENVI 5.6 to extract croplands in the Yichang Irrigation District. The spectral characteristics of non-irrigated and irrigated croplands during autumn irrigation were derived, and moisture-sensitive bands were selected to construct a soil moisture index for retrieving the extent of autumn irrigation. The newly and cumulatively irrigated areas were then calculated. Spatiotemporal dynamic monitoring was performed at both district and irrigation unit scales. Accuracy was evaluated using statistical irrigation progress records, enabling a dynamic assessment of the irrigated area and the related water-use trends. The technical workflow is shown in Figure 6.
Extraction of Spectral Characteristics for Non-Irrigated and Irrigated Soils
A combination of near-infrared, red, and green bands provides information on surface moisture conditions and can improve classification performance. To ensure representativeness and an adequate sample size for the three categories, (i) non-irrigated cropland, (ii) post-irrigation fields with a surface water layer, and (iii) post-irrigation fields after surface water infiltration, spectral curves and index features were analyzed, and additional visually interpreted points were added. Sample polygons were manually delineated on remote-sensing images using the Region of Interest (ROI) tool. ENVI 5.6 was then used to extract the spectral curves for croplands during the autumn irrigation period [42]. Reflectance values across wavelengths for sample pixels were exported as text files, and spectral curves for each sample were plotted in Excel or Origin to identify variation patterns and key features under different irrigation conditions. After quality screening, the final sample sizes were 147 (non-irrigated), 152 (surface water layer), and 150 (surface water infiltrated).42
3. Results
3.1. Spectral Characteristics of Irrigated Soils
The cropland spectral curves during autumn irrigation in the Yichang Irrigation District (Figure 7) showed marked differences between non-irrigated and irrigated fields in both peak values and rising/declining trends. These patterns are jointly controlled by the presence of a surface water layer and variations in soil moisture content [43]. Under irrigated conditions, fields with a surface-water layer and fields after surface water infiltration exhibited distinct spectral peaks and trend characteristics. These differences in spectral shapes provide critical evidence for identifying autumn-irrigated areas. GF-1, GF-6, HJ-2A/B, Landsat 8/9, and Sentinel-2A/2B include visible to near-infrared bands (450–890 nm), whereas Landsat 8/9 and Sentinel-2A/2B provide shortwave infrared bands (1565–2290 nm). The key identification patterns are summarized below.
3.1.1. Visible–Near-Infrared Spectral Characteristics
The 450–890 nm range includes the visible, red edge, and near-infrared bands. Considering the band compatibility across satellites, three types of identification indices were defined:
(1) Red-band–near-infrared band combination
The reflectance in the red band (630–690 nm) was weakly affected by moisture, whereas the reflectance in the near-infrared band (770–890 nm) was negatively correlated with water content. The band trend patterns differed among categories: infiltrated-water fields generally showed an overall decline, surface water layer fields showed a slight increase, and non-irrigated fields showed a marked increase. These contrasting trends support discrimination among field conditions.
(2) Red-edge–near-infrared band combination
Moisture had a limited effect on reflectance in the red-edge band (690–730 nm). Irrigated fields exhibited a continuous decreasing trend from the red edge (690–730 nm) to the near-infrared (770–890 nm), whereas non-irrigated fields showed a continuous increasing trend.
(3) Red-edge band combination
The moisture sensitivity increased with the wavelength. The 698–713 nm interval represented a peak band for the post-irrigation fields with a surface-water layer. A pronounced decline in the surface-water layer state, a weak trend for the infiltrated-water state, and an increasing trend for non-irrigated fields were identified as key discriminants.
3.1.2. Spectral Characteristics of Visible–Near-Infrared–Shortwave Infrared Band Combinations
The 1565–2290 nm range is highly sensitive to soil moisture. Non-irrigated fields formed a reflectance peak at 1565–1650 nm, whereas irrigated fields exhibited substantially lower reflectance owing to strong water absorption [44]. The main identification indices were as follows:44
(1) Red-band–shortwave infrared band combination
From the red band (640–670 nm) to the shortwave infrared bands (1565–2290 nm), fields with a surface water layer showed a continuous decrease, infiltrated-water fields showed a decreasing trend, and non-irrigated fields showed a continuous increase. These contrasting trends provide a basis for identification.
(2) Red-edge–shortwave infrared band combination
As moisture has a limited influence on red-edge reflectance (698–713 nm), fields with a surface water layer displayed a decreasing trend. For some infiltrated-water fields, the red-edge reflectance was slightly lower than the SWIR reflectance, in contrast to the increasing trend observed for non-irrigated fields. This difference was used as an identification criterion.
(3) Near-infrared–shortwave infrared band combination
3.2. Identification of Irrigated Cropland Based on Spectral Characteristics
Based on the spectral curve patterns for non-irrigated fields, post-irrigation fields with a surface water layer, and post-irrigation fields after surface water infiltration, the latter two conditions were jointly classified as irrigated croplands and distinguished from non-irrigated croplands. Accordingly, different soil moisture indices were constructed for each sensor (Table 4). The extraction results indicated that the near-infrared–shortwave infrared band combination exhibited the strongest regularity and the best identification performance.
3.3. Comparison Between Remote Sensing Monitoring Results and Statistical Irrigation Progress
The water diversion by the irrigation unit in 2024, based on the statistical irrigation progress records, is shown in Figure 8. The newly irrigated area derived from statistical records is presented in Figure 9 (a), and the remotely sensed newly irrigated area by unit is shown in Figure 9 (b).
As shown in Figure 9, the statistical records and remote sensing results estimates of the newly irrigated area were highly consistent from October 25 to November 5. On November 10, the remotely sensed newly irrigated area was 220.01 km2, compared with 155.24 km2 from statistics (difference: 64.77 km2). On November 20, the remotely sensed newly irrigated area was 190.78 km2, compared with 110.27 km2 from statistics (difference:80.51 km2). Overall, the remotely sensed newly irrigated area for each unit was slightly larger than the corresponding statistical record. Linear regression was performed using daily remotely sensed newly and cumulatively irrigated areas for each unit as samples and pairing them with statistical values on the same dates (Figure 10).
For the nine irrigation units, seven dates produced 63 samples of newly irrigated areas and 63 samples of cumulative irrigated areas. These samples were combined with statistical irrigation progress data to evaluate the consistency between remote sensing retrieval and the reported statistics. The linear fit for the newly irrigated area yielded R2 = 0.75, indicating good agreement and a strong ability to capture incremental changes across the phases during autumn irrigation. The residual differences likely reflect inconsistencies between statistical aggregation by administrative units and remote sensing extraction based on actual field parcels; nevertheless, the overall deviation remained acceptable. The linear fit for the cumulative irrigated area yielded R2 = 0.95, demonstrating highly consistent temporal trends and indicating that the proposed method accurately captured the overall evolution of the cumulative autumn-irrigated area in the Yichang Irrigation District. The final cumulative irrigated area reached 1040.76 km2, exceeding the statistical value of 831.40 km2 and meeting the accuracy requirements for large-scale monitoring.
3.4. Dynamic Monitoring of Spatiotemporal Evolution in the Yichang Irrigation District
The extent of irrigation derived from 15 images acquired during the autumn irrigation period (October 22 to November 29) is shown in Figure 11, from which the total autumn-irrigated area in the Yichang Irrigation District was obtained. The temporal interval between consecutive images ranged from 1 to 7 days. In the map, light blue denotes the cumulative irrigated area and dark blue denotes the newly irrigated area. The cumulative irrigated area was calculated by spatially overlaying the irrigated area identified on the current date with that from previous dates, whereas the newly irrigated area was derived by differencing the cumulative irrigated areas between the current and previous dates.
3.4.1. Temporal Evolution of Irrigation Progress
Because the temporal intervals among the images were uneven, a 5-day interval was adopted to unify the temporal scale for the time-series analysis. The time series was reconstructed from October 25 to November 25, yielding nine monitoring epochs. October 22 and November 29 corresponded to the first and last remote sensing images available for autumn irrigation in this study. Table 5 lists the remotely sensed newly and cumulatively irrigated areas.
As shown in Figure 12, the autumn irrigation process in the Yichang Irrigation District was divided into four stages. The initiation stage began on October 22, when autumn irrigation began, and the irrigated area was 20.97 km2. By October 25, the newly irrigated area over three days was 56.42 km2, indicating a relatively slow increase. The acceleration stage began on October 31, when the newly irrigated area increased rapidly to 143.15 km2 over 5 days; it further rose to 153.22 km2 by November 5 and to 220.01 km2 by November 10, showing an overall increasing trend. From November 10 to 20, the process entered a stabilization stage: the newly irrigated area decreased slightly on November 15 and declined to 190.78 km2 on November 20, but the magnitude of the decrease was limited. From November 20 to 29, the process entered the termination stage. The newly irrigated area decreased markedly after November 20, dropping to 50.11 km2 by November 25 and further to 10.52 km2 by November 29, exhibiting a clear downward trend. The diversion gates were closed on November 20, which ended the water diversion.
Remote sensing monitoring and statistical irrigation progress were highly consistent during the initiation and early acceleration stages. On November 10, the remotely sensed newly irrigated area was 220.01 km2, whereas the statistical value was 155.24 km2 (difference: 64.77 km2). On November 20, the remotely sensed newly irrigated area was 190.78 km2, whereas the statistical value was 110.27 km2 (difference: 80.51 km2). Before November 15, the remotely sensed cumulative irrigated area nearly overlapped with the statistical curve, and after November 15, the remote sensing estimates became slightly larger than the statistical records.
3.4.2. Spatial Evolution of Irrigation Progress
As shown in Figure 11, during the early stage, the irrigated areas in the Yichang Irrigation District were mainly distributed around the western side of the Fengji Main Canal (e.g., Jianshe Branch Ditch and Jianhong Branch Canal) and the southern side of the Fengji Main Canal (e.g., Shenghe Main Canal and Hongwei Branch Ditch). Along the eastern side of the Shahe Main Canal, irrigation was concentrated in the Hongfeng Branch Ditch, Gaohong Branch Ditch, Zhangdaguan Branch Ditch, Lengtou Branch Ditch, Dongshawuo Branch Ditch, Yonghe Branch Ditch, Guangsheng West Branch Ditch, Houbuhong Branch Ditch, and Xiyu Branch Canal. Along the eastern side of the Yihe Main Canal, irrigation was concentrated around the Lihaisheng Branch Ditch, Right-2 Branch Canal, Yigui Branch Ditch, Xianfeng Branch Canal, Rongfeng Branch Ditch, Erfent Canal, Xinyong Branch Ditch and Naliu Branch Ditch. Along its southern side, irrigation was concentrated around the Right-8 Branch Canal, Huxiansheng Branch Ditch, Right-9 Branch Canal, Tiansuide Branch Ditch, Bian Branch Canal, Er Branch Canal, San Branch Canal, Si Branch Canal, and Wuhan Branch Canal. Along the southern side of the Tongji Main Canal, irrigation occurred around the Xianjin Branch Ditch, Xianjin Branch Canal, Hongguang Branch Ditch, and Taigong Branch Ditches. Overall, early stage irrigation exhibited an east-more/west-less pattern in this region. As the process progressed to the late stage, the irrigated areas expanded continuously along the Fengji, Shahe, Yihe, and Tongji main canals. Irrigation also expanded within the Shiba Branch Main Canal and Zaohuo Main Canal units. By the end of the period, the irrigated patches expanded and were connected across the units, whereas the northern margin and southwestern areas remained sparsely irrigated.
3.5. Dynamic Monitoring of Spatiotemporal Evolution for Irrigation Units
From upstream to downstream, the main and branch canals in the Yichang Irrigation District are the Nansanzhi Branch Canal, Fengji Main Canal, Shiba Branch Main Canal, Fuxing Main Canal, Zaohuo Main Canal, Guangze Branch Main Canal, Shahe Main Canal, Yihe Main Canal, Sudulong Branch Main Canal, and Tongji Main Canal. The district adopts a combined professional and collective management system. Using a 5-day interval for irrigation progress monitoring, the newly irrigated area was analyzed in a time series. The newly irrigated areas derived from the nine temporal images between October 22 and November 29 are shown in Figure 11.
3.5.1. Temporal Evolution of Irrigation Progress
Remote sensing estimates of newly and cumulatively irrigated areas for each irrigation unit were compared with the statistical records of newly and cumulatively irrigated areas (Figure 13).
As shown in Figure 13, the initiation stage was consistent across the Fengji Main Canal, Shiba Branch Main Canal, Zaohuo Main Canal, Shahe Main Canal, and Tongji Main Canal units, spanning October 22 to 31. The 3-day newly irrigated areas on October 25 were 3.05, 0.64, 1.57, 10.19, and 11.68 km2, indicating relatively slow growth. During the acceleration stage, the canal systems exhibited only slight variations. Fengji and Zaohuo entered and sustained acceleration later than Shahe and Tongji. By October 31, irrigation had accelerated, with 5-day newly irrigated areas of 20.57, 8.80, 12.30, 27.62, and 30.11 km2, respectively. By November 10, the newly irrigated areas increased to 44.30, 27.93, 31.61, 28.60, and 39.47 km2. At this point, the acceleration stage ended for Shiba, Shahe, and Tongji, whereas Fengji and Zaohuo remained in acceleration until November 15, when the 5-day newly irrigated areas reached 49.72 and 33.00 km2, respectively. From 15 to 20 November, Fengji and Zaohuo entered stabilization, with Fengji at 49.76 km2 and Zaohuo decreasing to 22.85 km2; changes were small. From 10 to 20 November, Shiba, Shahe, and Tongji also entered stabilization, with slight decreases by 15 November and values of 18.97, 20.82, and 28.96 km2 by 20 November, respectively, again showing only minor declines. From November 20 to 29, all units entered the termination stage, and the newly irrigated areas decreased sharply after November 20. By November 25, the 5-day newly irrigated areas dropped to 7.11, 3.76, 8.31, 5.99, and 3.81 km2, and by November 29, they further declined to 2.05, 1.41, 0.74, 0.90, and 0.86 km2, respectively. The diversion gates were closed on November 20, which ended the water diversion.
For the Fengji Main Canal, the remotely sensed newly irrigated area on November 5 was 24.27 km2, whereas the statistical value was 46.67 km2 (difference: 22.40 km2). On November 20, the remotely sensed newly irrigated area was 49.76 km2, whereas the statistical value was 28.93 km2. From October 31 to November 15, the remotely sensed cumulative irrigated area was slightly higher than the statistical record. For the Shiba Branch Main Canal, the remotely sensed newly irrigated area on November 10 was 27.93 km2, whereas the statistical value was 16.00 km2 (difference: 11.93 km2). Before November 5, the remotely sensed cumulative irrigated area nearly overlapped with the statistical curve; after November 5, the remote sensing estimate became slightly higher. For the Zaohuo Main Canal, the remotely sensed newly irrigated area on November 10 was 31.61 km2, whereas the statistical value was 12.53 km2 (difference: 19.08 km2). On November 20, the remotely sensed newly irrigated area was 22.85 km2, whereas the statistical value was 10.00 km2 (difference: 12.85 km2). Before November 5, the cumulative areas nearly overlapped, and after November 5, the remote sensing estimates became slightly higher. For the Shahe Main Canal, the remotely sensed newly irrigated area on November 15 was 27.59 km2, whereas the statistical value was 37.33 km2 (difference: 9.74 km2). For the Tongji Main Canal, the remotely sensed newly irrigated area on 10 November was 39.47 km2, whereas the statistical value was 25.33 km2 (difference: 14.14 km2). Overall, the remotely sensed cumulative irrigated area was slightly larger than the statistical record.
Nansanzhi Branch Canal. The initiation stage began on October 22, when the croplands within the unit began autumn irrigation. The 3-day newly irrigated area on October 25 was 1.52 km2, indicating relatively slow growth. The acceleration stage began on November 5, when the 5-day newly irrigated area reached 7.86 km2, increasing to 8.25 km2 byNovember 10r. From November 10 to 20, the process entered the stabilization stage, and the newly irrigated area gradually decreased. From November 20 to 29, the unit entered the termination stage, and the newly irrigated area declined sharply. On November 5, the remotely sensed newly irrigated area was 7.86 km2, whereas the statistical value was 4.33 km2 (difference: 3.53 km2). On November 10, the remotely sensed value was 8.25 km2, whereas the statistical value was 5.67 km2 (difference: 2.58 km2). After October 31, the remotely sensed cumulative irrigated area was slightly higher than the statistical record.
Fuxing Straight-Intake Canal. The initiation stage began on October 22 and lasted relatively long; the newly irrigated area on October 31 was 0.67 km2. The 5-day newly irrigated areas on November 5 and November 10 were 0.63 km2 and 0.47 km2, respectively, indicating slow growth. The acceleration stage began on November 15, when the 5-day newly irrigated area increased to 2.23 km2. From November 15 to 20, the unit entered the stabilization stage, and the newly irrigated area decreased to 1.86 km2. From November 20 to 29, the unit entered the termination stage, and the newly irrigated area decreased sharply.
Guangze Branch Main Canal. The initiation stage began on October 22, and the 3-day newly irrigated area on October 25 was 0.61 km2, indicating slow growth. The acceleration stage began on October 31 when the 5-day newly irrigated area reached 3.19 km2, increasing to 3.63 km2 by November 5. From November 5 to 10, the unit entered the stabilization stage, and the newly irrigated area decreased to 2.44 km2, with a small decline. From November 10 to 20, the newly irrigated area continued to decrease. From November 20 to 29, the unit entered the termination stage, with a clear decline. On November 10, the remotely sensed newly irrigated area was 2.44 km2, whereas the statistical value was 0.33 km2 (difference: 2.11 km2). On November 15, the remotely sensed newly irrigated area was 0.68 km2, whereas the statistical value was 2.00 km2 (difference: 1.32 km2). Overall, the remotely sensed cumulative irrigated area was slightly larger than the statistical record.
Yihe Main Canal. The initiation stage began on October 22, when croplands within the unit started autumn irrigation; the newly irrigated area was 13.51 km2, indicating relatively slow growth. The acceleration stage began after October 25, and the newly irrigated area increased rapidly. By November 20, the remotely sensed newly irrigated area reached 42.88 km2. After November 20, the unit entered the termination stage, and the newly irrigated area declined sharply toward the end of November. On November 20, the remotely sensed newly irrigated area was 42.88 km2, whereas the statistical value was 17.53 km2 (difference: 25.35 km2). After November 5, the remotely sensed cumulative irrigated area was slightly higher than the statistical record.
Table 6 shows the differences between the individual irrigation units and the Yichang Irrigation District autumn irrigation progress. The Shiba Branch Main Canal, Shahe Main Canal, and Tongji Main Canal followed the same four-stage pattern as the Yichang Irrigation District. The acceleration stage of the Fengji Main Canal and Zaohuo Main Canal lasted longer than the district-wide process. Yihe Main Canal entered the acceleration stage earlier and exhibited a larger increment during acceleration. The Nansanzhi Branch Canal, Fuxing Straight-Intake Canal, and Guangze Branch Main Canal have relatively small canal-controlled areas; therefore, their newly irrigated areas were smaller, and their stage transitions were more compact. Overall, the progress rhythm was positively related to the canal-controlled area: larger units showed higher similarity to the district-wide process, whereas smaller units exhibited faster and more condensed changes.
3.5.2. Spatial Evolution of Irrigation Progress
As shown in Figure 14, early stage irrigation in the Fengji Main Canal unit was mainly distributed along the western (e.g., Jianshe Branch Ditch and Jianhong Branch Canal) and southern (e.g., Shenghe Main Canal and Hongwei Branch Ditch) sides. As the process progressed, the irrigated areas expanded along the canal network and gradually connected to the contiguous patches. In the late stage, irrigated areas were widely distributed across the unit, with notable expansion on both sides of the main canal and downstream lateral canals.
As shown in Figure 15, early stage irrigated areas in the Shiba Branch Main Canal unit were primarily distributed along the northern side, concentrated around the Shengli Branch Ditch, Er Branch Canal, Shidagu Branch Canal, and Hongqu Branch Canal, and along the southern side around the Xianfeng Branch Ditch and Shiwu Branch Ditch. Irrigation was also observed around the Xingui Branch Ditch. In the late stage, the irrigated areas expanded northward from the Shengli Branch Ditch to the Yinhai Branch Ditch, and irrigation along the Hongqu Branch Canal continued to extend toward the Shidagu Branch Canal. On the southern side, expansion occurred from the Xianfeng Branch Ditch to the Gongnong Branch and from the Shiwu Branch Ditch to the Xingui Branch Ditch, forming contiguous irrigated patches.
As shown in Figure 16, early-stage irrigation in the Nansanzhi Branch Canal unit was mainly distributed around the Jingyanglin Branch Ditch and along the southern side. As irrigation progressed, the irrigated areas gradually expanded and remained concentrated in the western and eastern parts of the unit and along the southern side of the Jingyanglin Branch Ditch, with additional small patches appearing in the east.
As shown in Figure 17, early-stage irrigation in the Fuxing Straight-Intake Canal unit was mainly distributed north of the Liupai Main Branch Ditch. In the late stage, the irrigated areas continued to expand northward from the Liupai Main Branch Ditch, forming contiguous patches and ultimately concentrating around the Liupai Main Branch Ditch area.
As shown in Figure 18, early stage irrigation in the Zaohuo Main Canal unit was mainly distributed on the eastern side (e.g., Yize Branch Ditch, Tuanjie Branch Canal, Yimin Branch Ditch, Yazitu Branch Canal, Magui Branch Ditch, Jiuzhi Ditch, and Zhaosha Main Ditch) and concentrated on the western side around the Chunlian Branch Canal, Nao’e Branch Ditch, Balisheng Branch Canal, Naiyong Branch Ditch, and Xibian Branch Canal. As irrigation progressed, the irrigated areas on the eastern side continued to expand from the Tuanjie Branch Canal toward the Caogui Branch Canal and became concentrated around the Tuanjie Branch Canal, Gui Branch Canal, Yimin Branch Ditch, Yazitu Branch Canal, Magui Branch Ditch, Jiuzhi Ditch, and Xishao Branch Ditch. On the western side, irrigation remained concentrated around the Chunlian Branch Canal, Nao’e Branch Ditch, Balisheng Branch Canal, Naiyong Branch Ditch, and Xibian Branch Canal.
As shown in Figure 19, early stage irrigation in the Guangze Branch Main Canal unit was mainly distributed along the southern side around the Zuoyi Branch Ditch, with a relatively small irrigated area. In the late stage, the irrigated areas along the southern side of the Zuoyi Branch Ditch continued to expand and formed contiguous patches.
As shown in Figure 20, early-stage irrigation in the Shahe Main Canal unit was mainly distributed on the eastern side around the Hongfeng Branch Ditch, Gaohong Branch Ditch, Zhangdaguan Branch Ditch, Lengtou Branch Ditch, Dongshawuo Branch Ditch, Yonghe Branch Ditch, Guangsheng West Branch Ditch, Houbuhong Branch Ditch, and Xiyu Branch Canal. On the western side, irrigation was concentrated around the Nanmao’an Branch Ditch, Ashan Branch Canal, and Zhaosha Main Canal, and on the northern side around the Hongqi Branch Ditch. Toward the late stage, irrigation remained concentrated on the eastern side around Hongfeng Branch Ditch, Gaohong Branch Ditch, Zhangdaguan Branch Ditch, Gongyi Branch Canal, Lengtou Branch Ditch, Dongshawuo Branch Ditch, Yonghe Branch Ditch, Guangsheng West Branch Canal and Ditch, and Houbuhong Branch Ditch. Irrigation also persisted on the western side around the Nanmao’an Branch Ditch, Ashan Branch Canal, and Zhaosha Main Canal, and on the northern side around the Hongqi Branch Ditch and Muyanghai Branch Canal.
As shown in Figure 21, early stage irrigation in the Yihe Main Canal unit was mainly distributed on the eastern side around the Lihaisheng Branch Ditch, Right-2 Branch Canal, Yigui Branch Ditch, Xianfeng Branch Canal, Rongfeng Branch Ditch, Erfent Canal, Xinyong Branch Ditch and Naliu Branch Ditch. Irrigation was also observed on the western side around the Wuqizhi Branch Ditch; on the southern side around the Right-8 Branch Canal, Huxiansheng Branch Ditch, Right-9 Branch Canal, Tiansuide Branch Ditch, Bian Branch Canal, Er Branch Canal, San Branch Canal, Si Branch Canal, and Wuhan Branch Canal; and on the northern side around the Yinsuiqiao Branch Ditch and Tuanjie Branch Canal. In the late stage, irrigated areas were concentrated on the eastern side around Lihaisheng Branch Ditch, Right-2 Branch Canal, Yigui Branch Ditch, Sanman Branch Canal and Ditch, Xianfeng Branch Canal, Rongfeng Branch Ditch, Erfent Canal, Xinyong Branch Ditch, and Naliu Branch Ditch. Irrigation also remained concentrated on the western side around Wuqizhi Branch Ditch, on the southern side around Right-8 Branch Canal, Huxiansheng Branch Ditch, Right-9 Branch Canal, Tiansuide Branch Ditch, Bian Branch Canal, Er Branch Canal, San Branch Canal, Si Branch Canal, and Wuhan Branch Canal, and on the northern side around Yinsuiqiao Branch Ditch and Tuanjie Branch Canal.
As shown in Figure 22, early stage irrigation in the Tongji Main Canal unit was mainly distributed on the southern side around the Xianjin Branch Ditch, Xianjin Branch Canal, Hongguang Branch Ditch, and Taigong Branch Ditch, and on the northern side around the Yangban Branch Canal, Left-4 Branch Canal, Guoqi Branch Ditch, Tongbei Branch Ditch, and Wulian Branch Canal. In the late stage, irrigated areas were concentrated on the southern side around the Siluxing Branch Canal, Caijia Branch Canal, Sanjianzi Branch Ditch, Yangban Branch Canal, Manquan Branch Ditch, Xianjin Branch Ditch, Xianjin Branch Canal, Hongguang Branch Ditch, and Taigong Branch Ditch, and on the northern side around the Yangban Branch Canal, Left-4 Branch Canal, Xiangyang Branch Ditch, Guoqi Branch Ditch, Tongbei Branch Ditch, Left-7 Branch Canal, and Wulian Branch Canal.
Although irrigation units differed in terms of initiation time, expansion rhythm, and patch connectivity, their spatial expansion directions were controlled by the main canal framework and advanced linearly in bands. The coordinated expansion across units produced a district-wide pattern in which irrigated areas evolved from sparse canal-adjacent distributions to areal patches through stepwise diffusion along the hierarchy of “main trunk canal–main canal–branch main canal–lateral canal”, and were subsequently connected to neighboring units. Large units, such as Fengji, Zaohuo, Tongji, and Yihe, played a dominant role in the overall spatial evolution.
4. Discussion
4.1. Spectral Characteristics of Irrigated Versus Non-Irrigated Soils
During the non-growing season, croplands typically exhibit low vegetation cover, and soil moisture is the dominant factor controlling spectral responses [44]. This study identified clear differences between irrigated and non-irrigated soils in the visible–red-edge–near-infrared (450–890 nm) and shortwave infrared (1565–2290 nm) regions. Within the 450–890 nm range, non-irrigated soils generally exhibited an increasing trend from the red edge to the near-infrared region, whereas irrigated soils showed a decreasing trend, particularly under conditions of surface water presence. The red-edge band around 698–713 nm was particularly informative for distinguishing surface ponding after the irrigation. In the SWIR range (1565–2290 nm), which is highly sensitive to soil moisture, irrigated soils exhibited lower reflectance because of strong water absorption, whereas non-irrigated soils showed higher reflectance and often formed a peak at approximately 1565–1650 nm. Collectively, these spectral differences support the construction of soil moisture indices based on NIR–SWIR and related band combinations to improve robustness across sensors.
4.2. Differences Between Remote Sensing Monitoring and Statistical Irrigation Progress
Temporal trajectories derived from remote sensing monitoring and statistical irrigation progress records showed certain discrepancies, and these differences cannot be solely attributed to interpretation errors. From a remote sensing perspective, limited spatial resolution can produce mixed pixels containing multiple land cover components (e.g., irrigated and non-irrigated fields). When only part of a pixel is irrigated or becomes moist, the pixel-level spectral response changes and may be classified as irrigated. In addition, rainfall-induced surface wetting may be misclassified as irrigation, leading to remotely sensed irrigated areas that exceed the statistical records. In this study, temporal interpolation was used to fill the gaps between image acquisition dates; however, the interpolated values may deviate from actual irrigation conditions. Collectively, these factors can increase the remotely sensed estimates of newly and cumulatively irrigated areas. In contrast, statistical records typically rely on manual field checks and farmer reports. Small, scattered irrigated plots or remote fields may be missed because of limited verification frequency and inspection difficulty. For parcels spanning villages or canal management units, boundary ambiguities can result in omission (counted by neither unit) or partial inclusion, leading to under-reporting. Moreover, irrigation data are aggregated through multiple administrative levels, where duplication or incomplete de-duplication may occur; consequently, the final totals may be biased low.
5. Conclusions
The spectral characteristics of non-irrigated and irrigated croplands during the non-growing season were systematically identified. Irrigated croplands were further subdivided into fields with a surface water layer and fields with surface water infiltration, resulting in three distinct spectral response types. This refined classification demonstrates that the visible–red-edge–near-infrared (450–890 nm) and shortwave infrared (1565–2290 nm) regions are highly sensitive to soil moisture variations. Soil moisture indices constructed from the red, red-edge, near-infrared, and shortwave infrared bands were used to extract irrigated land extent, among which the near-infrared–SWIR combination exhibited the strongest regularity and the best identification performance. The cumulative irrigated area was obtained by spatially overlaying newly irrigated areas. During autumn irrigation, the newly irrigated areas effectively reflected the rate of change and phase transitions, whereas the cumulative irrigated area represented the actual coverage. For the Yichang Irrigation District, the linear fit between the remotely sensed cumulative irrigated area and statistical records yielded an R2 value of 0.95. The final cumulative autumn-irrigated area reached 1040.76 km2, compared with 831.4 km2 from the statistical data, thus meeting the accuracy requirement for large-scale monitoring. In terms of temporal evolution, autumn irrigation in the Yichang Irrigation District followed four stages: initiation, acceleration, stabilization, and termination. Irrigation units show differences in timing relative to the district-scale process, and process similarity is positively correlated with the canal-controlled area, with larger units closely tracking the district-wide rhythm and smaller units exhibiting more compact dynamics. Spatially, early-stage irrigation was concentrated along the Fengji, Shahe, Yihe, and Tongji main canals, forming an east-more/west-less pattern. As irrigation advances, irrigated areas expand hierarchically from trunk canals to main, branch, and lateral canals, gradually connecting into contiguous patches and ultimately forming an integrated district-wide pattern, whereas the northern margin and southwest remain relatively sparse.
Author Contributions
Conceptualization, S.L.; methodology, S.L.; validation, S.L., F.M., X.W., and Y.B.; formal analysis, S.L., Y.B., F.M., X.W.,; investigation, S.L.; data curation, S.L.; writing—original draft preparation, S.L.; writing—review and editing, S.L.; visualization, S.L.; F.M., X.W.,; supervision, Y.B.; project administration, Y.B.; funding acquisition, Y.B. All authors have read and agreed to the published version of the manuscript.
Funding
This research was funded by Fundamental Research Funds for the Universities Directly under the Inner Mongolia Autonomous Region (BR220103), Natural Science Foundation of the Inner Mongolia Autonomous Region (2023LHMS05014), Science and Technology Program of the Inner Mongolia Autonomous Region (2025YFHH0097), and Major Science and Technology Special Project of the Inner Mongolia Autonomous Region (2021ZD0003).
Data Availability Statement
The data are contained within the manuscript.
Conflicts of Interest
The authors declare no conflicts of interest.
References
- Ozdogan, M.; Yang, Y.; Allez, G.; Cervantes, C. Remote Sensing of Irrigated Agriculture: Opportunities and Challenges. Remote Sensing 2010, 2, 2274–2304. [Google Scholar] [CrossRef]
- Cao, Z.; Zhu, T.; Cai, X. Hydro-agro-economic optimization for irrigated farming in an arid region: The Hetao Irrigation District, Inner Mongolia. Agricultural Water Management 2023, 277. [Google Scholar] [CrossRef]
- Devkota, K.P.; Devkota, M.; Rezaei, M.; Oosterbaan, R. Managing salinity for sustainable agricultural production in salt-affected soils of irrigated drylands. Agricultural Systems 2022, 198. [Google Scholar] [CrossRef]
- Ji, L.; Senay, G.B.; Friedrichs, M.; Schauer, M.; Boiko, O. Characterization of water use and water balance for the croplands of Kansas using satellite, climate, and irrigation data. Agricultural Water Management 2021, 256. [Google Scholar] [CrossRef]
- Ambika, A.K.; Wardlow, B.; Mishra, V. Remotely sensed high resolution irrigated area mapping in India for 2000 to 2015. Sci Data 2016, 3, 160118. [Google Scholar] [CrossRef]
- Ozdogan, M.; Gutman, G. A new methodology to map irrigated areas using multi-temporal MODIS and ancillary data: An application example in the continental US. Remote Sensing of Environment 2008, 112, 3520–3537. [Google Scholar] [CrossRef]
- Wriedt, G.; van der Velde, M.; Aloe, A.; Bouraoui, F. A European irrigation map for spatially distributed agricultural modelling. Agricultural Water Management 2009, 96, 771–789. [Google Scholar] [CrossRef]
- Zhang, C.; Dong, J.; Ge, Q. Mapping 20 years of irrigated croplands in China using MODIS and statistics and existing irrigation products. Sci Data 2022, 9, 407. [Google Scholar] [CrossRef]
- Zajac, Z.; Gomez, O.; Gelati, E.; van der Velde, M.; Bassu, S.; Ceglar, A.; Chukaliev, O.; Panarello, L.; Koeble, R.; van den Berg, M.; et al. Estimation of spatial distribution of irrigated crop areas in Europe for large-scale modelling applications. Agricultural Water Management 2022, 266. [Google Scholar] [CrossRef]
- Zhang, L.; Zhang, K.; Zhu, X.; Chen, H.; Wang, W. Integrating remote sensing, irrigation suitability and statistical data for irrigated cropland mapping over mainland China. Journal of Hydrology 2022, 613. [Google Scholar] [CrossRef]
- Xie, F.; Fan, H. Deriving drought indices from MODIS vegetation indices (NDVI/EVI) and Land Surface Temperature (LST): Is data reconstruction necessary? International Journal of Applied Earth Observation and Geoinformation 2021, 101. [Google Scholar] [CrossRef]
- Foster, T.; Mieno, T.; Brozović, N. Satellite-Based Monitoring of Irrigation Water Use: Assessing Measurement Errors and Their Implications for Agricultural Water Management Policy. Water Resources Research 2020, 56. [Google Scholar] [CrossRef]
- Fu, D.; Jin, X.; Jin, Y.; Mao, X. Extraction of grassland irrigation information in arid regions based on multi-source remote sensing data. Agricultural Water Management 2024, 302. [Google Scholar] [CrossRef]
- Patil, P.P.; Jagtap, M.P.; Khatri, N.; Madan, H.; Vadduri, A.A.; Patodia, T. Exploration and advancement of NDDI leveraging NDVI and NDWI in Indian semi-arid regions: A remote sensing-based study. Case Studies in Chemical and Environmental Engineering 2024, 9. [Google Scholar] [CrossRef]
- Zappa, L.; Schlaffer, S.; Brocca, L.; Vreugdenhil, M.; Nendel, C.; Dorigo, W. How accurately can we retrieve irrigation timing and water amounts from (satellite) soil moisture? International Journal of Applied Earth Observation and Geoinformation 2022, 113. [Google Scholar] [CrossRef]
- Colliander, A.; Jackson, T.J.; Bindlish, R.; Chan, S.; Das, N.; Kim, S.B.; Cosh, M.H.; Dunbar, R.S.; Dang, L.; Pashaian, L.; et al. Validation of SMAP surface soil moisture products with core validation sites. Remote Sensing of Environment 2017, 191, 215–231. [Google Scholar] [CrossRef]
- Ghassemi, B.; Immitzer, M.; Atzberger, C.; Vuolo, F. Evaluation of Accuracy Enhancement in European-Wide Crop Type Mapping by Combining Optical and Microwave Time Series. Land 2022, 11. [Google Scholar] [CrossRef]
- Garcia, A.D.B.; Islam, M.D.S.; Prudente, V.H.R.; Sanches, I.D.A.; Cheng, I. Irrigated rice-field mapping in Brazil using phenological stage information and optical and microwave remote sensing. Applied Computing and Geosciences 2025, 25. [Google Scholar] [CrossRef]
- Htitiou, A.; Boudhar, A.; Lebrini, Y.; Hadria, R.; Lionboui, H.; Elmansouri, L.; Tychon, B.; Benabdelouahab, T. The Performance of Random Forest Classification Based on Phenological Metrics Derived from Sentinel-2 and Landsat 8 to Map Crop Cover in an Irrigated Semi-arid Region. Remote Sensing in Earth Systems Sciences 2019, 2, 208–224. [Google Scholar] [CrossRef]
- Qian, X.; Qi, H.; Shang, S.; Wan, H.; Wang, R. Multi-year mapping of flood autumn irrigation extent and timing in harvested croplands of arid irrigation district. GIScience & Remote Sensing 2022, 59, 1598–1623. [Google Scholar] [CrossRef]
- Du, E.; Chen, F.; Jia, H.; Wang, L.; Yang, A. Irrigation area monitoring in Jiefangzha irrigation district based on Landsat 8 satellite data. Remote Sensing Technology and Application 2022, 37, 620–628. [Google Scholar]
- Longo-Minnolo, G.; Consoli, S.; Vanella, D.; Ramírez-Cuesta, J.M.; Greimeister-Pfeil, I.; Neuwirth, M.; Vuolo, F. A stand-alone remote sensing approach based on the use of the optical trapezoid model for detecting the irrigated areas. Agricultural Water Management 2022, 274. [Google Scholar] [CrossRef]
- Acharya, U.; Daigh, A.L.M.; Oduor, P.G. Soil Moisture Mapping with Moisture-Related Indices, OPTRAM, and an Integrated Random Forest-OPTRAM Algorithm from Landsat 8 Images. Remote Sensing 2022, 14. [Google Scholar] [CrossRef]
- Bingyang, G.; Yanning, Y.; Youtao, S.; Shanshan, Y. Identification and frequency estimation of winter wheat irrigation events using Sentinel-1 SAR data. Transactions of the Chinese Society of Agricultural Engineering 2025, 41, 116–125. [Google Scholar]
- Crow, W.T.; Anderson, M.C.; Volk, J.M.; Colliander, A. Value of microwave soil moisture and thermal-infrared evapotranspiration retrievals for the mapping of irrigation coverage. International Journal of Applied Earth Observation and Geoinformation 2025, 143. [Google Scholar] [CrossRef]
- Bazzi, H.; Baghdadi, N.; Fayad, I.; Charron, F.; Zribi, M.; Belhouchette, H. Irrigation Events Detection over Intensively Irrigated Grassland Plots Using Sentinel-1 Data. Remote Sensing 2020, 12. [Google Scholar] [CrossRef]
- Bazzi, H.; Baghdadi, N.; Ienco, D.; El Hajj, M.; Zribi, M.; Belhouchette, H.; Escorihuela, M.J.; Demarez, V. Mapping Irrigated Areas Using Sentinel-1 Time Series in Catalonia, Spain. Remote Sensing 2019, 11. [Google Scholar] [CrossRef]
- Gao, Q.; Zribi, M.; Escorihuela, M.J.; Baghdadi, N.; Segui, P.Q. Irrigation Mapping Using Sentinel-1 Time Series at Field Scale. Remote Sensing 2018, 10. [Google Scholar] [CrossRef]
- Sharma, A.K.; Hubert-Moy, L.; Buvaneshwari, S.; Sekhar, M.; Ruiz, L.; Moger, H.; Bandyopadhyay, S.; Corgne, S. Identifying Seasonal Groundwater-Irrigated Cropland Using Multi-Source NDVI Time-Series Images. Remote Sensing 2021, 13. [Google Scholar] [CrossRef]
- Li, H.; Miao, Q.; Shi, H.; Li, X.; Zhang, S.; Zhang, F.; Bu, H.; Wang, P.; Yang, L.; Wang, Y.; et al. Remote sensing monitoring of irrigated area in the non-growth season and of water consumption analysis in a large-scale irrigation district. Agricultural Water Management 2024, 303. [Google Scholar] [CrossRef]
- Chance, E.; Cobourn, K.; Thomas, V.; Dawson, B.; Flores, A. Identifying Irrigated Areas in the Snake River Plain, Idaho: Evaluating Performance across Composting Algorithms, Spectral Indices, and Sensors. Remote Sensing 2017, 9. [Google Scholar] [CrossRef]
- López-Pérez, E.; Sanchis-Ibor, C.; Jiménez-Bello, M.Á.; Pulido-Velazquez, M. Mapping of irrigated vineyard areas through the use of machine learning techniques and remote sensing. Agricultural Water Management 2024, 302. [Google Scholar] [CrossRef]
- Shengwei, Z.; Yongting, H.; Lu, L.; Lin, Y.; Meng, L.; Kedi, F.; Qian, Z. Extraction of Irrigation Water Body in Jiefangzha Irrigation Area of Hetao Irrigation District Based on MWatNet Model. Nongye Jixie Xuebao/Transactions of the Chinese Society of Agricultural Machinery 2024, 55. [Google Scholar]
- Magidi, J.; Nhamo, L.; Mpandeli, S.; Mabhaudhi, T. Application of the Random Forest Classifier to Map Irrigated Areas Using Google Earth Engine. Remote Sens (Basel) 2021, 13, 876. [Google Scholar] [CrossRef] [PubMed]
- Zhang, C.; Dong, J.; Xie, Y.; Zhang, X.; Ge, Q. Mapping irrigated croplands in China using a synergetic training sample generating method, machine learning classifier, and Google Earth Engine. International Journal of Applied Earth Observation and Geoinformation 2022, 112. [Google Scholar] [CrossRef]
- Youtao, S.; Yanning, Y.; Bingyang, G.; Yun, B.; Xifang, W.; Shanshan, Y. Integration of remote sensing and machine learning for identifying irrigated farmland in Shandong Province of China using optimized training samples. Transactions of the Chinese Society of Agricultural Engineering 2025, 41, 154–164. [Google Scholar]
- Ihuoma, S.O.; Madramootoo, C.A.; Kalacska, M. Integration of satellite imagery and in situ soil moisture data for estimating irrigation water requirements. International Journal of Applied Earth Observation and Geoinformation 2021, 102. [Google Scholar] [CrossRef]
- Qian, X.; Qi, H.; Shang, S.; Wan, H.; Rahman, K.U.; Wang, R. Deep Learning-based Near-real-time Monitoring of Autumn Irrigation Extent at Sub-pixel Scale in a Large Irrigation District. Agricultural Water Management 2023, 284. [Google Scholar] [CrossRef]
- Zurqani, H.A.; Allen, J.S.; Post, C.J.; Pellett, C.A.; Walker, T.C. Mapping and quantifying agricultural irrigation in heterogeneous landscapes using Google Earth Engine. Remote Sensing Applications: Society and Environment 2021, 23. [Google Scholar] [CrossRef]
- Balenzano, A.; Satalino, G.; Lovergine, F.P.; D’Addabbo, A.; Palmisano, D.; Grassi, R.; Ozalp, O.; Mattia, F.; Nafría García, D.; Paredes Gómez, V. Sentinel-1 and Sentinel-2 Data to Detect Irrigation Events: Riaza Irrigation District (Spain) Case Study. Water 2022, 14. [Google Scholar] [CrossRef]
- Pageot, Y.; Baup, F.; Inglada, J.; Baghdadi, N.; Demarez, V. Detection of Irrigated and Rainfed Crops in Temperate Areas Using Sentinel-1 and Sentinel-2 Time Series. Remote Sensing 2020, 12. [Google Scholar] [CrossRef]
- Mahmood, M.R.; Abrahem, B.I.; Jumaah, H.J.; Alalwan, H.A.; Mohammed, M.M. Drought monitoring of large lakes in Iraq using remote sensing images and normalized difference water index (NDWI). Results in Engineering 2025, 25. [Google Scholar] [CrossRef]
- Brocca, L.; Tarpanelli, A.; Filippucci, P.; Dorigo, W.; Zaussinger, F.; Gruber, A.; Fernández-Prieto, D. How much water is used for irrigation? A new approach exploiting coarse resolution satellite soil moisture products. International Journal of Applied Earth Observation and Geoinformation 2018, 73, 752–766. [Google Scholar] [CrossRef]
- Du, Y.; Zhang, Y.; Ling, F.; Wang, Q.; Li, W.; Li, X. Water Bodies’ Mapping from Sentinel-2 Imagery with Modified Normalized Difference Water Index at 10-m Spatial Resolution Produced by Sharpening the SWIR Band. Remote Sensing 2016, 8. [Google Scholar] [CrossRef]
- Sadeghi, M.; Jones, S.B.; Philpot, W.D. A linear physically-based model for remote sensing of soil moisture using short wave infrared bands. Remote Sensing of Environment 2015, 164, 66–76. [Google Scholar] [CrossRef]
- Wenjia, L.; Ruiyan, W.; Jiahao, X.; Ruhao, W.; Xiaoteng, L. Detecting farmland irrigation in arid areas of Northwest China using remote sensing. Transactions of the Chinese Society of Agricultural Engineering 2024, 40, 120–128. [Google Scholar]
Figure 1.
Overview of the study area.
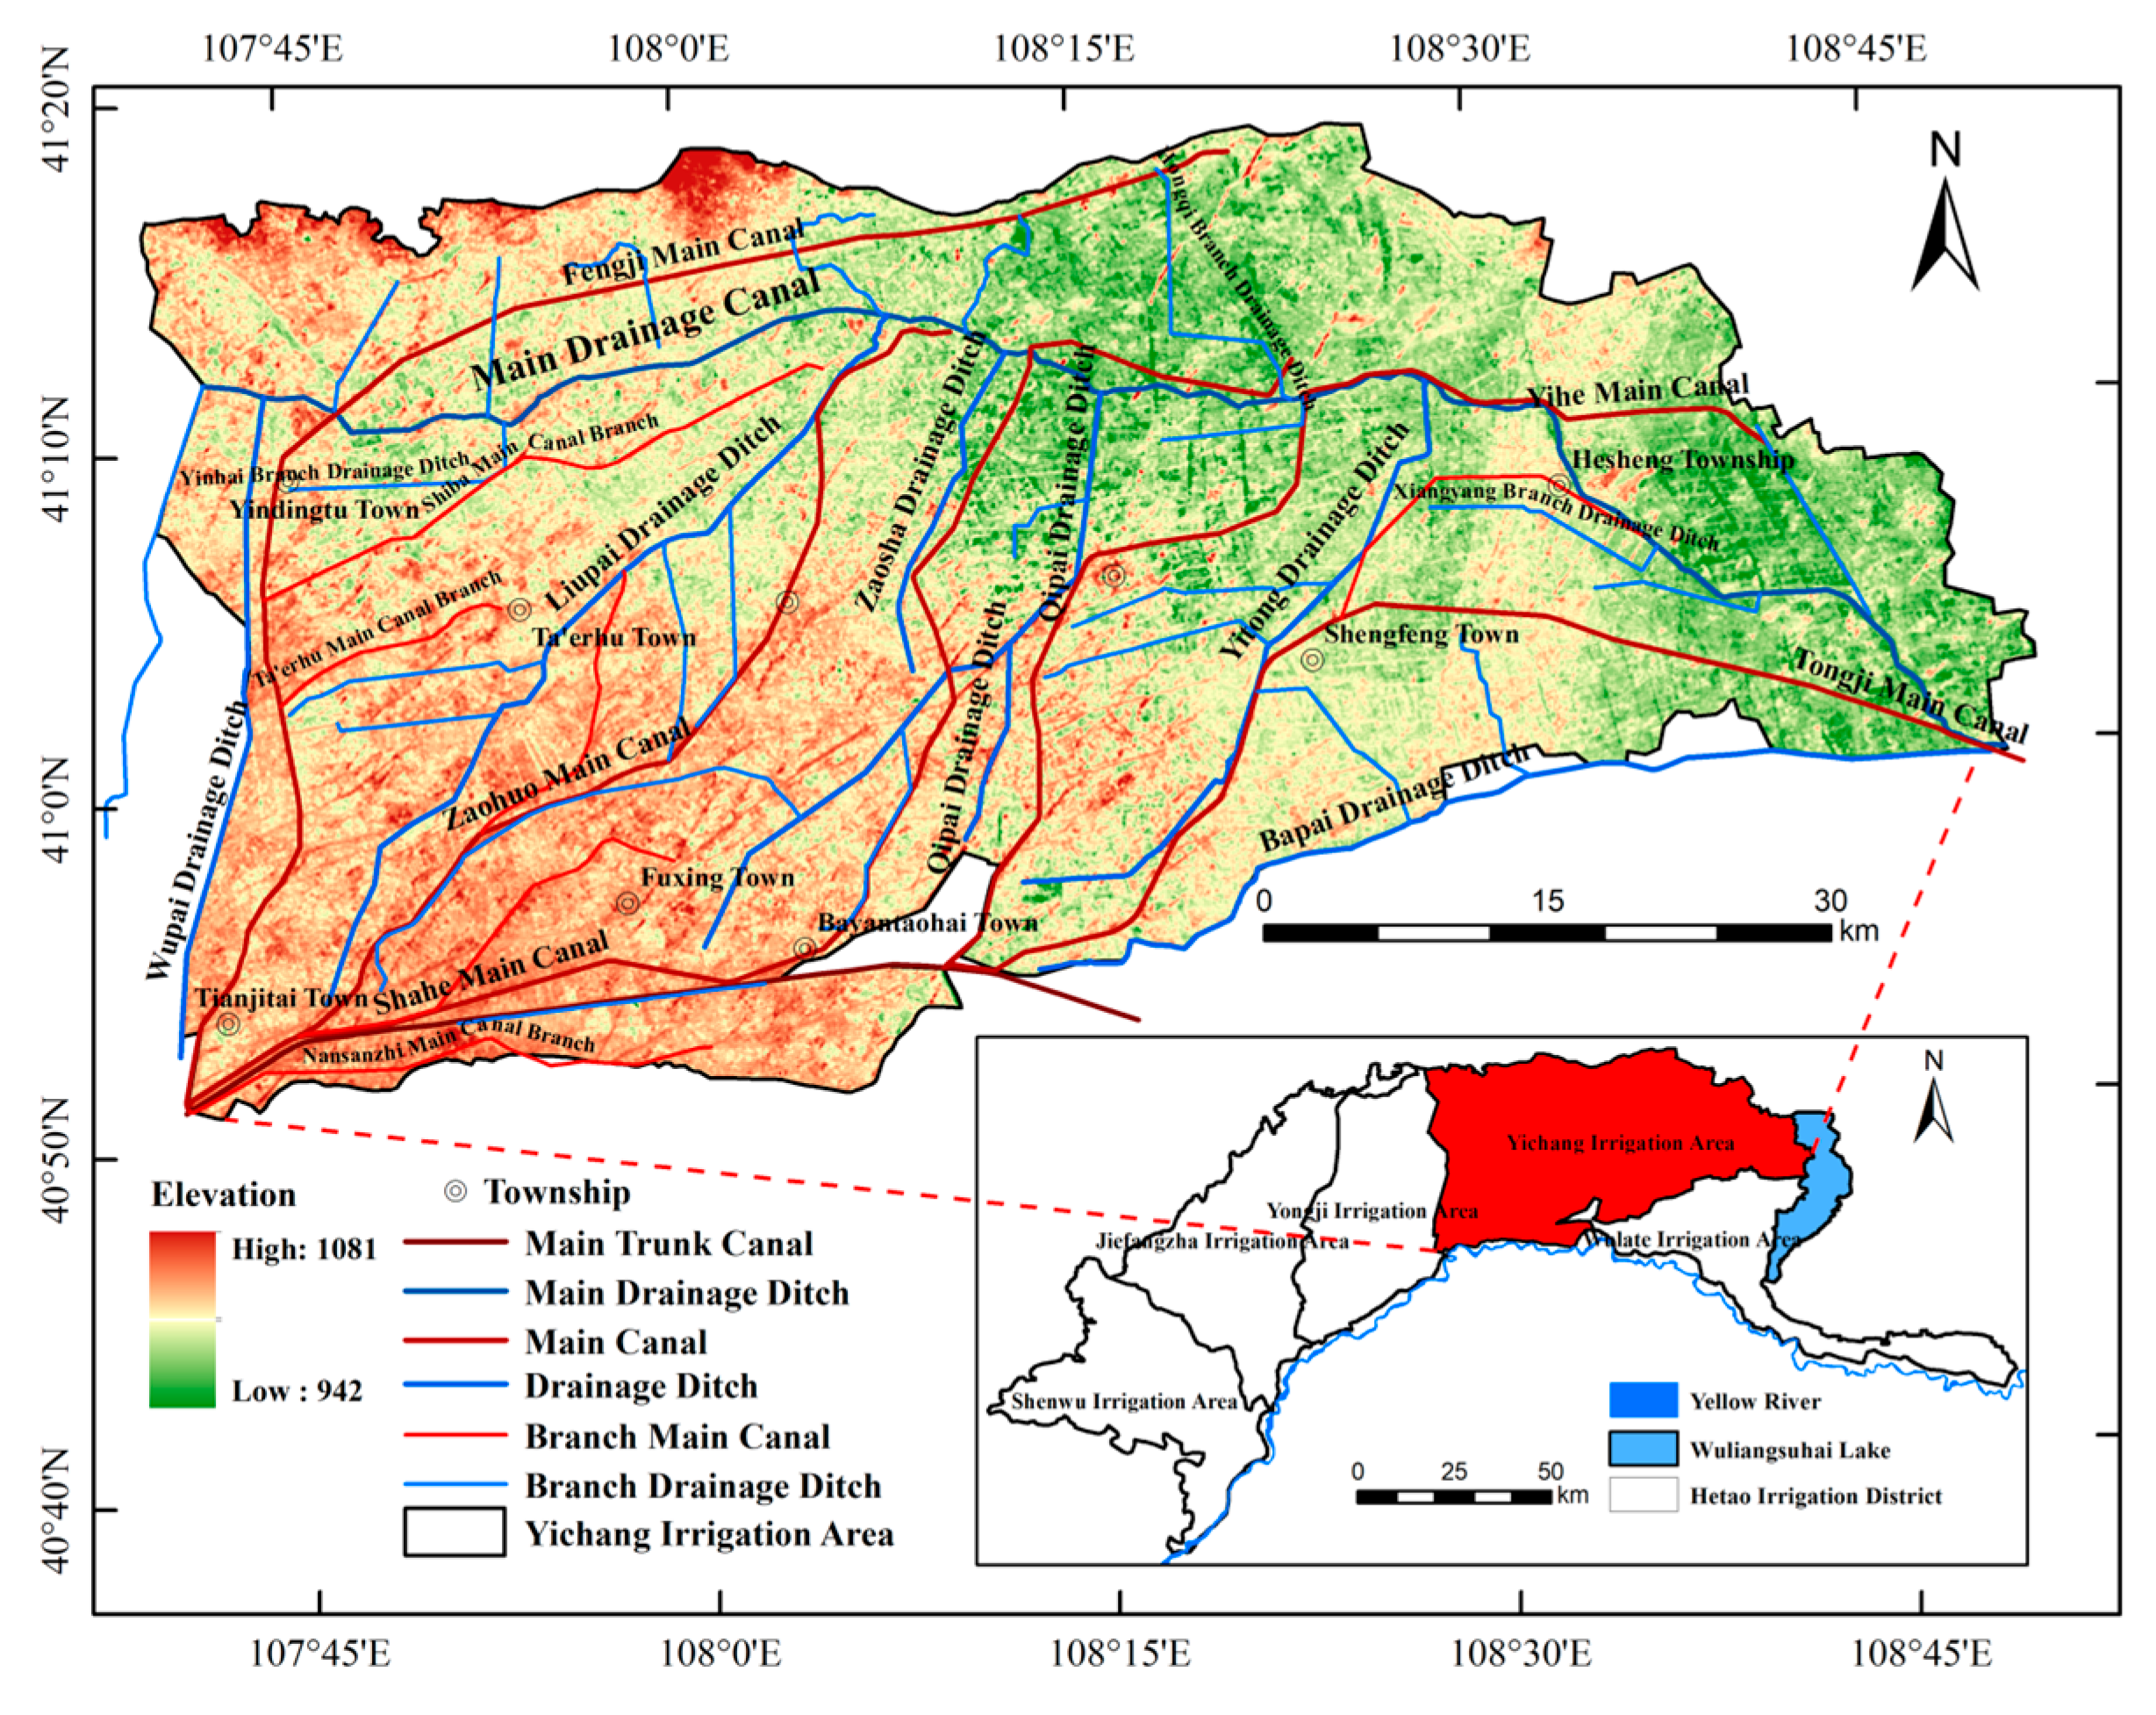
Figure 2.
Distribution of control areas for main canals (and branch main canals).
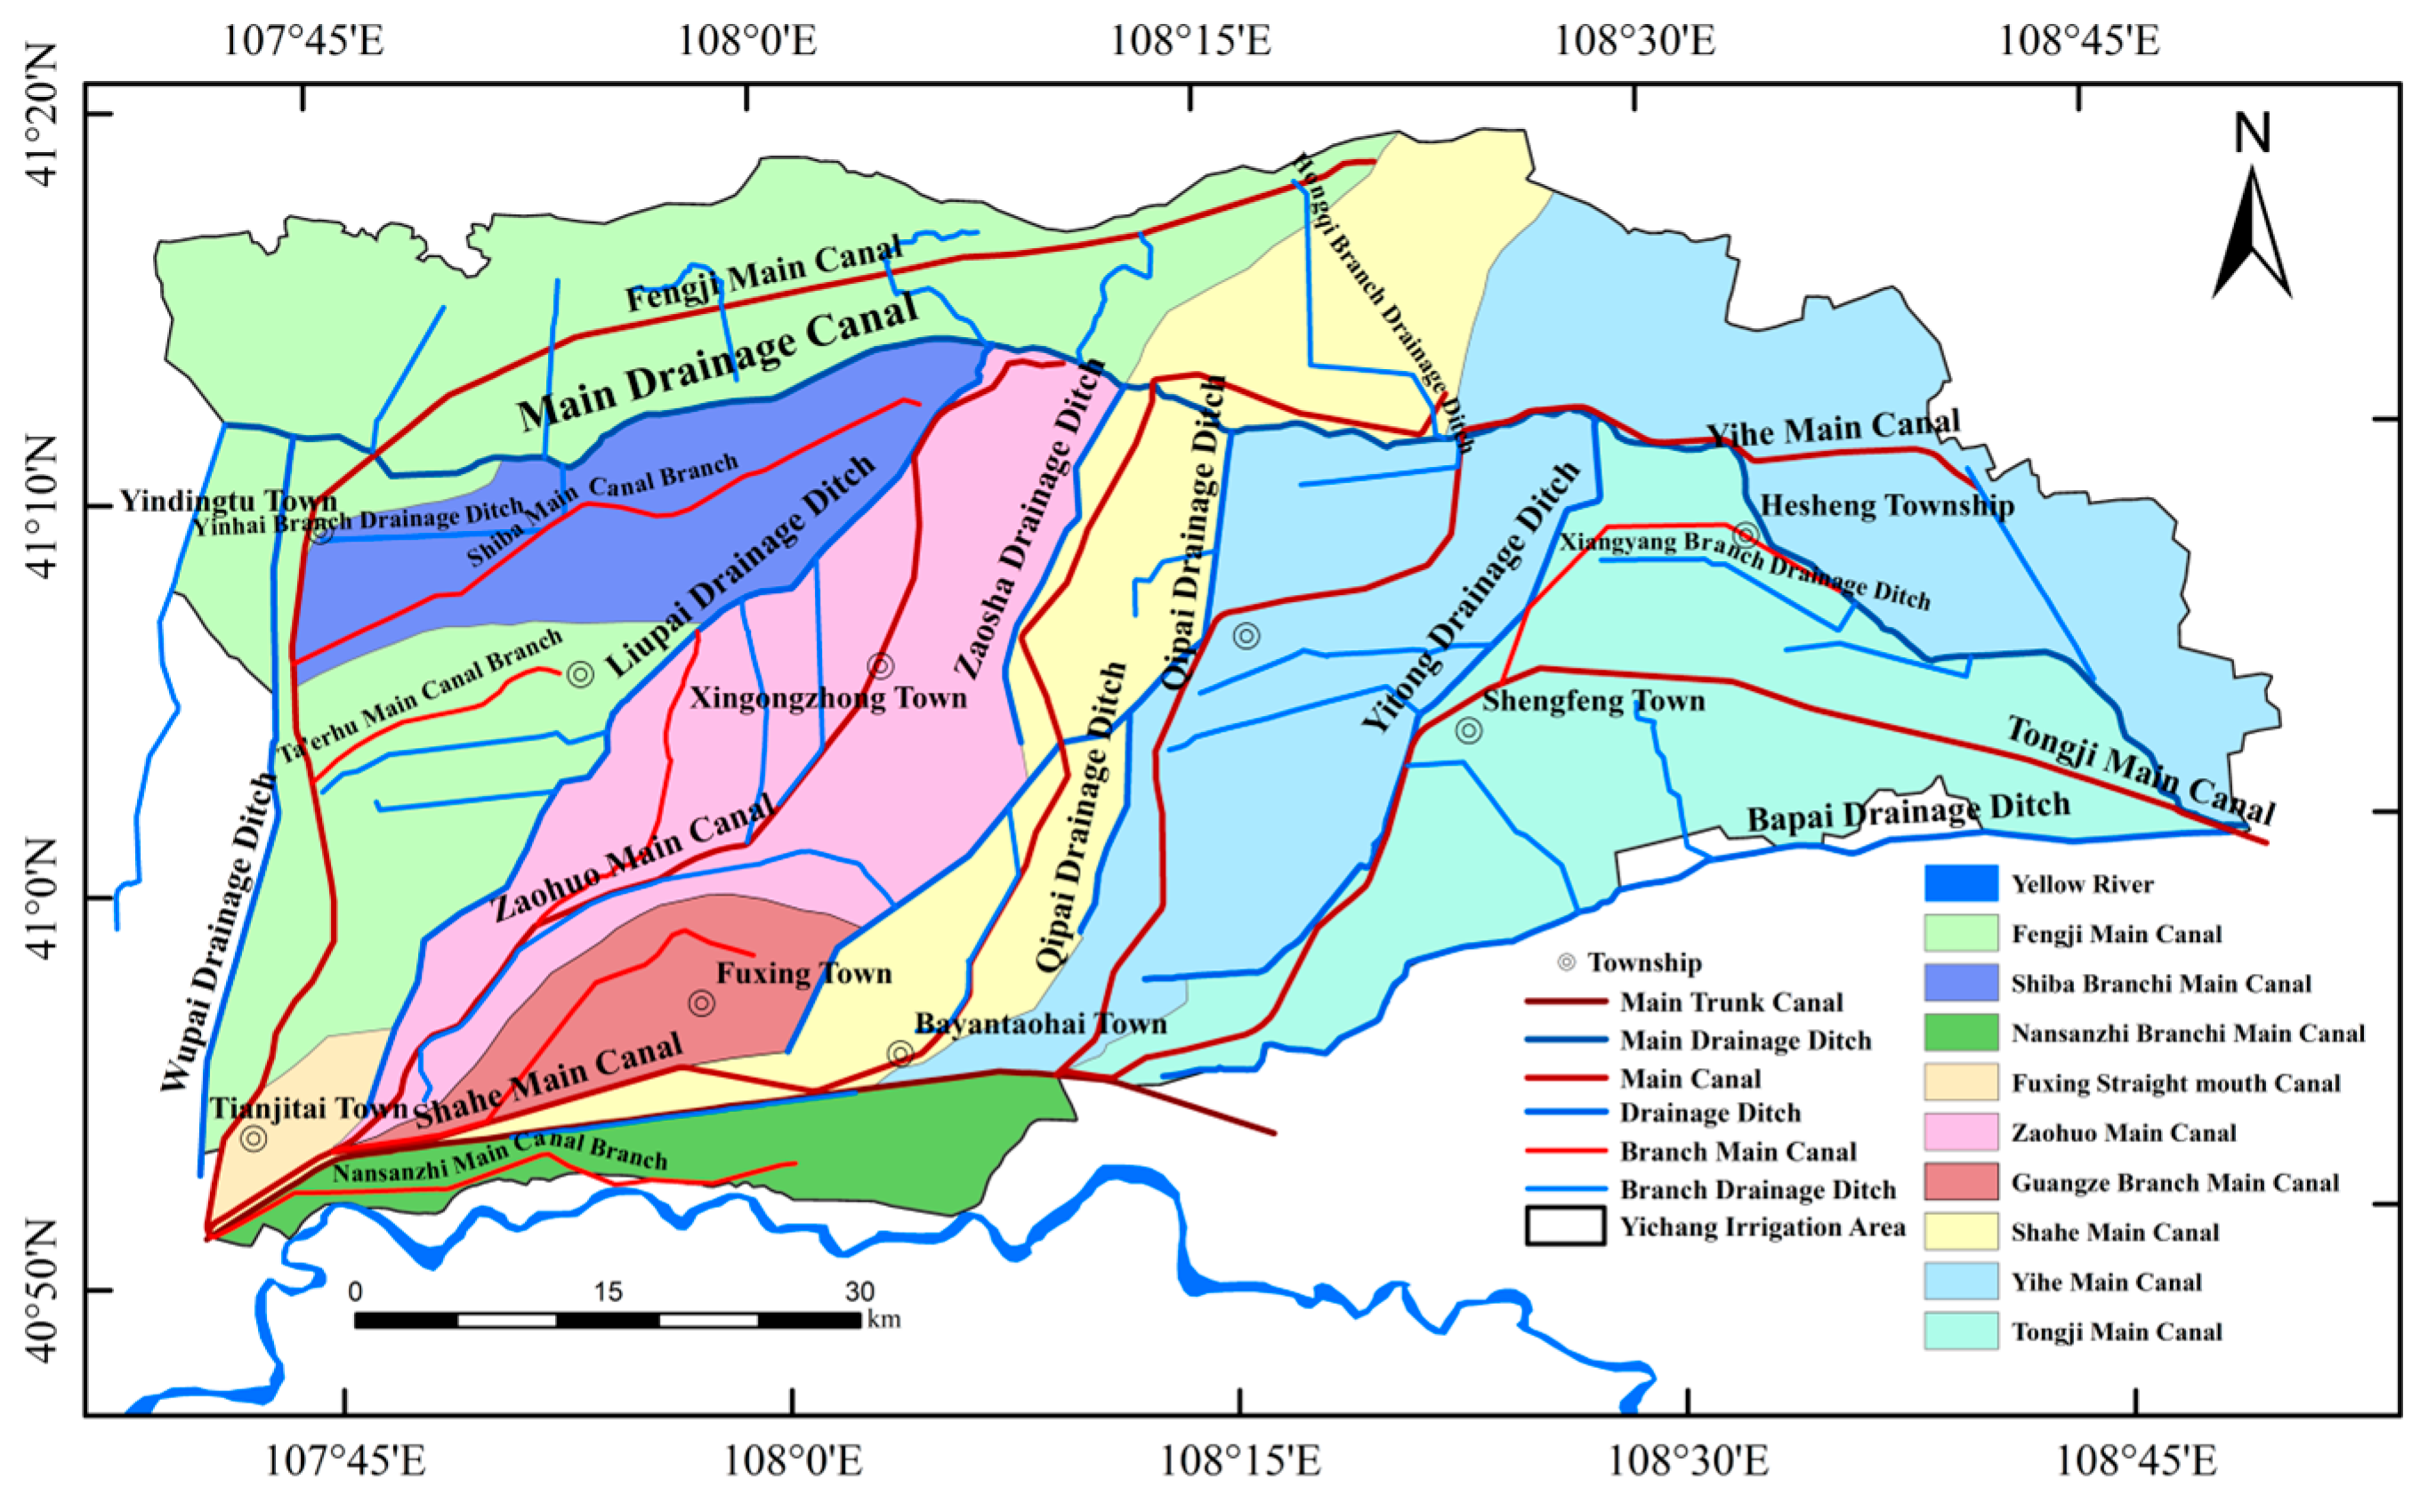
Figure 3.
Water diversion during the non-growing and growing seasons.
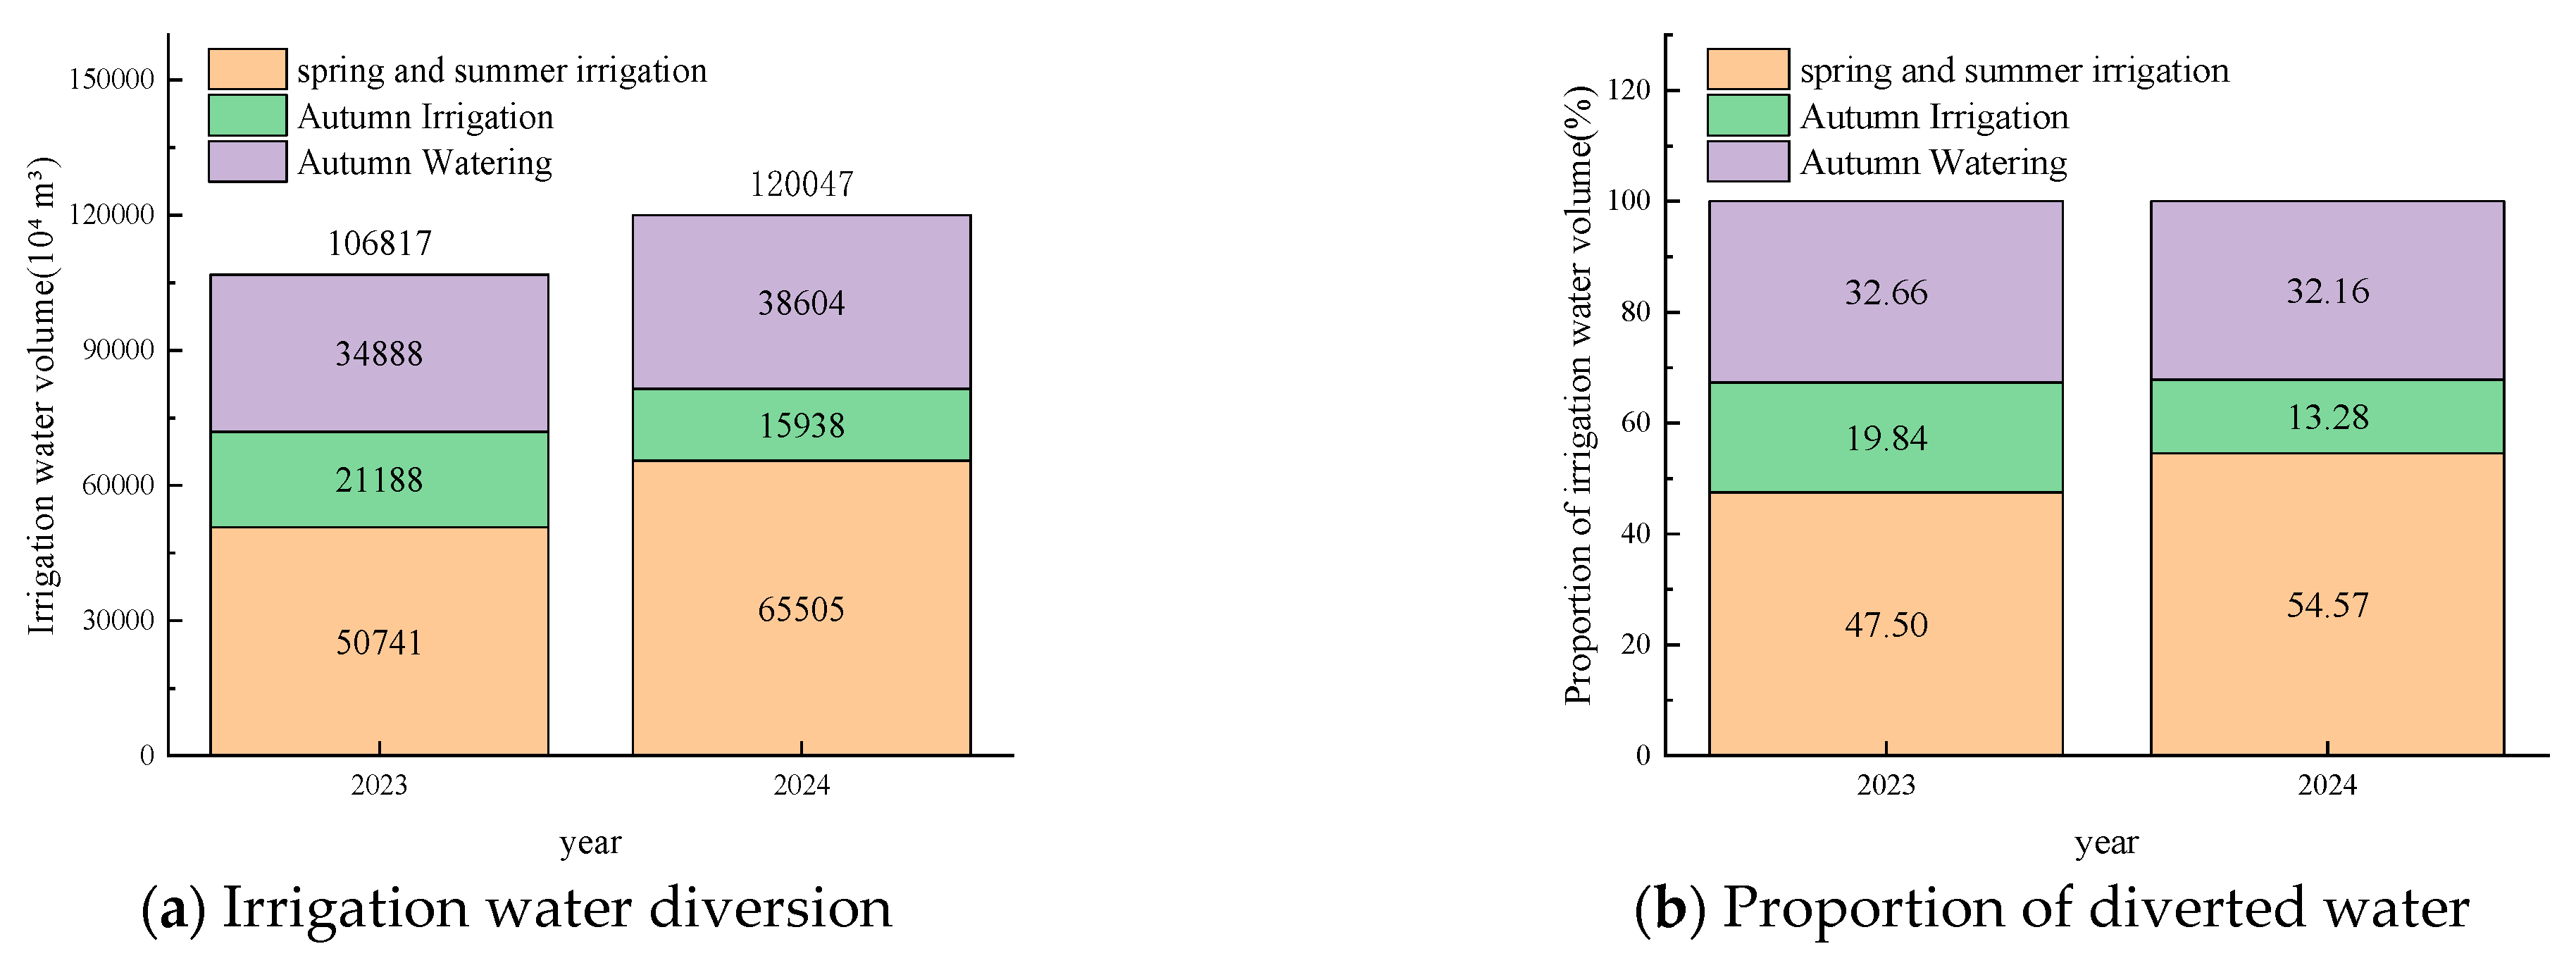
Figure 4.
Irrigated area during the non-growing and growing seasons.
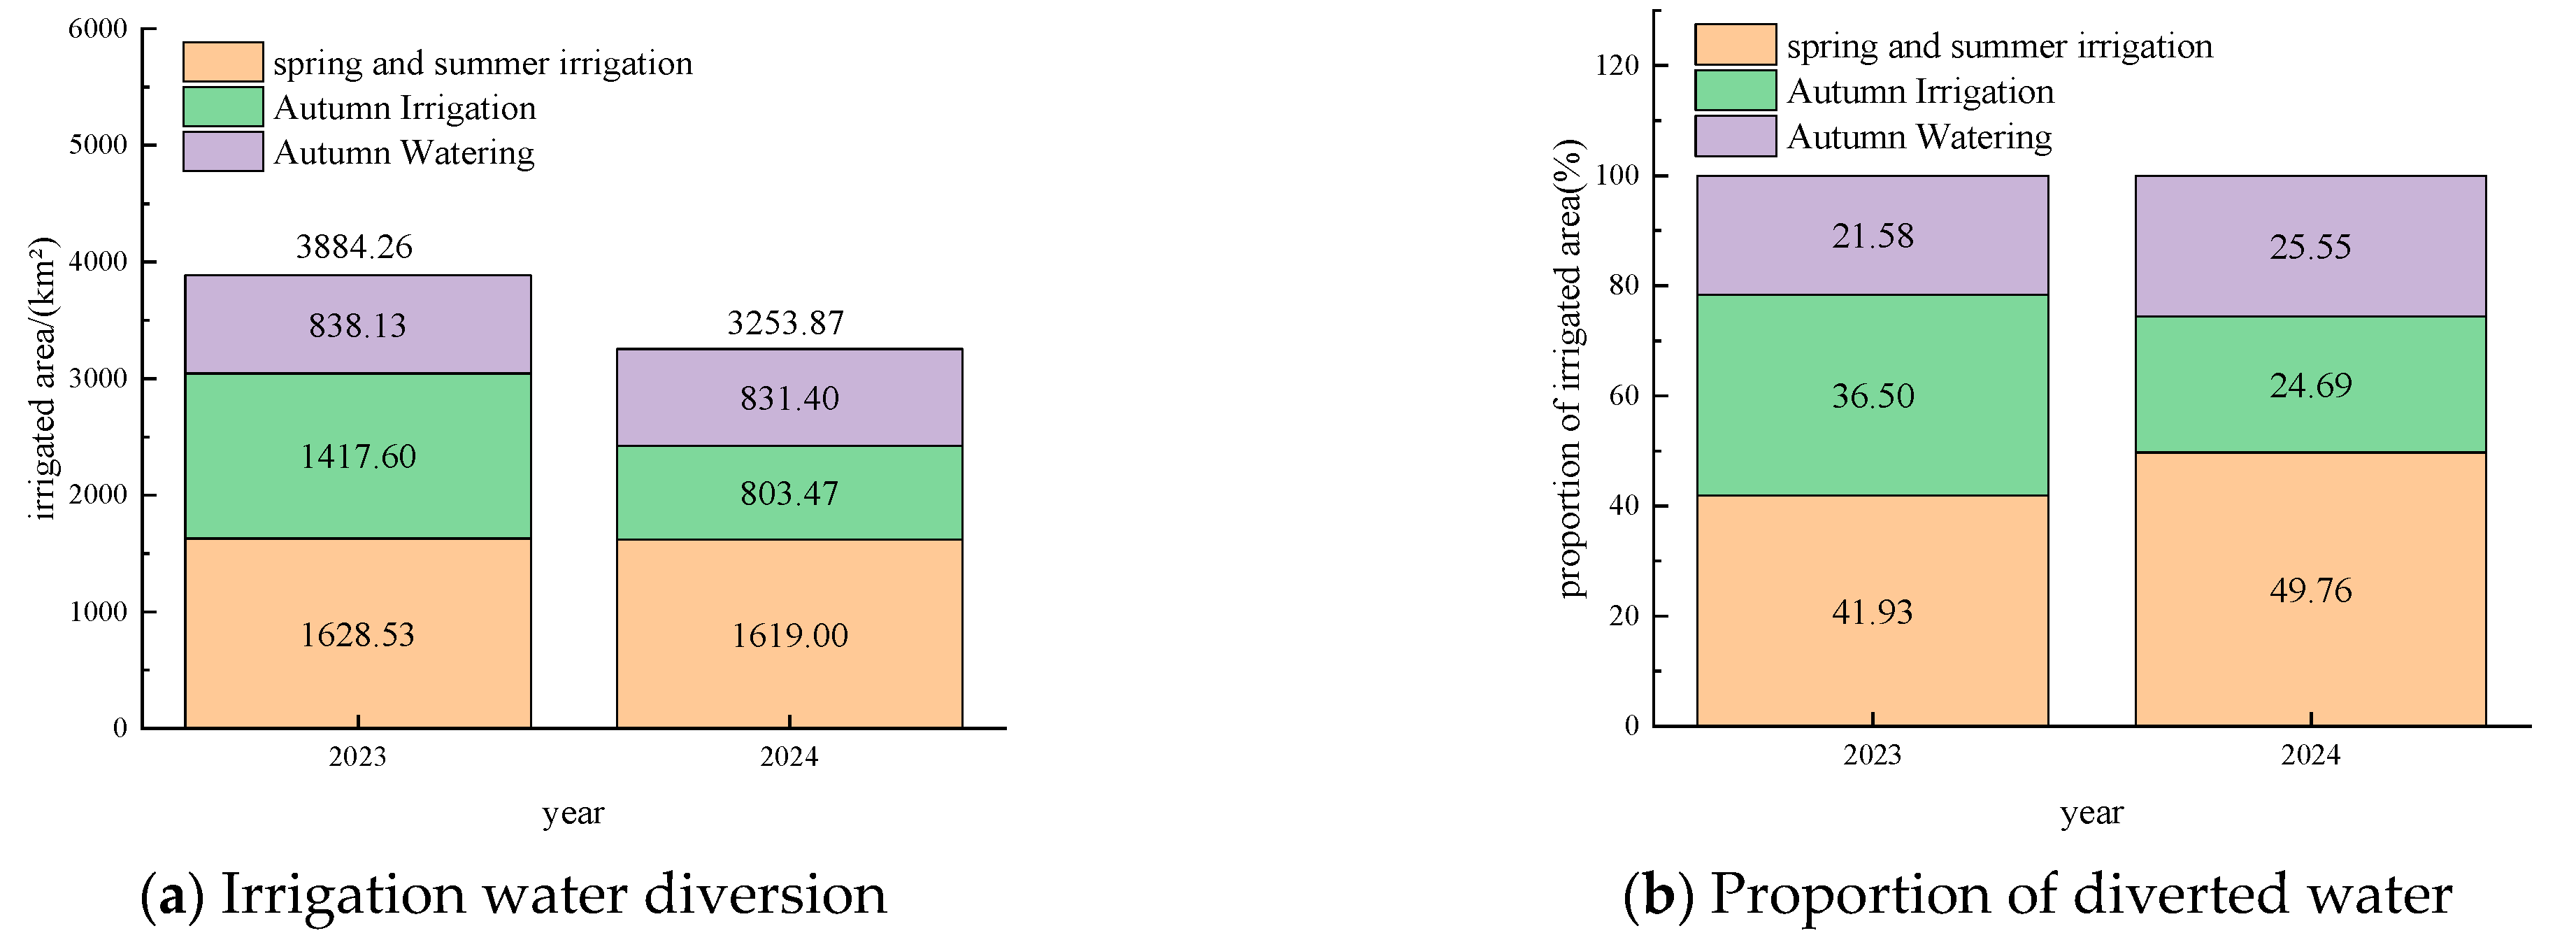
Figure 5.
Meteorological data in 2024.
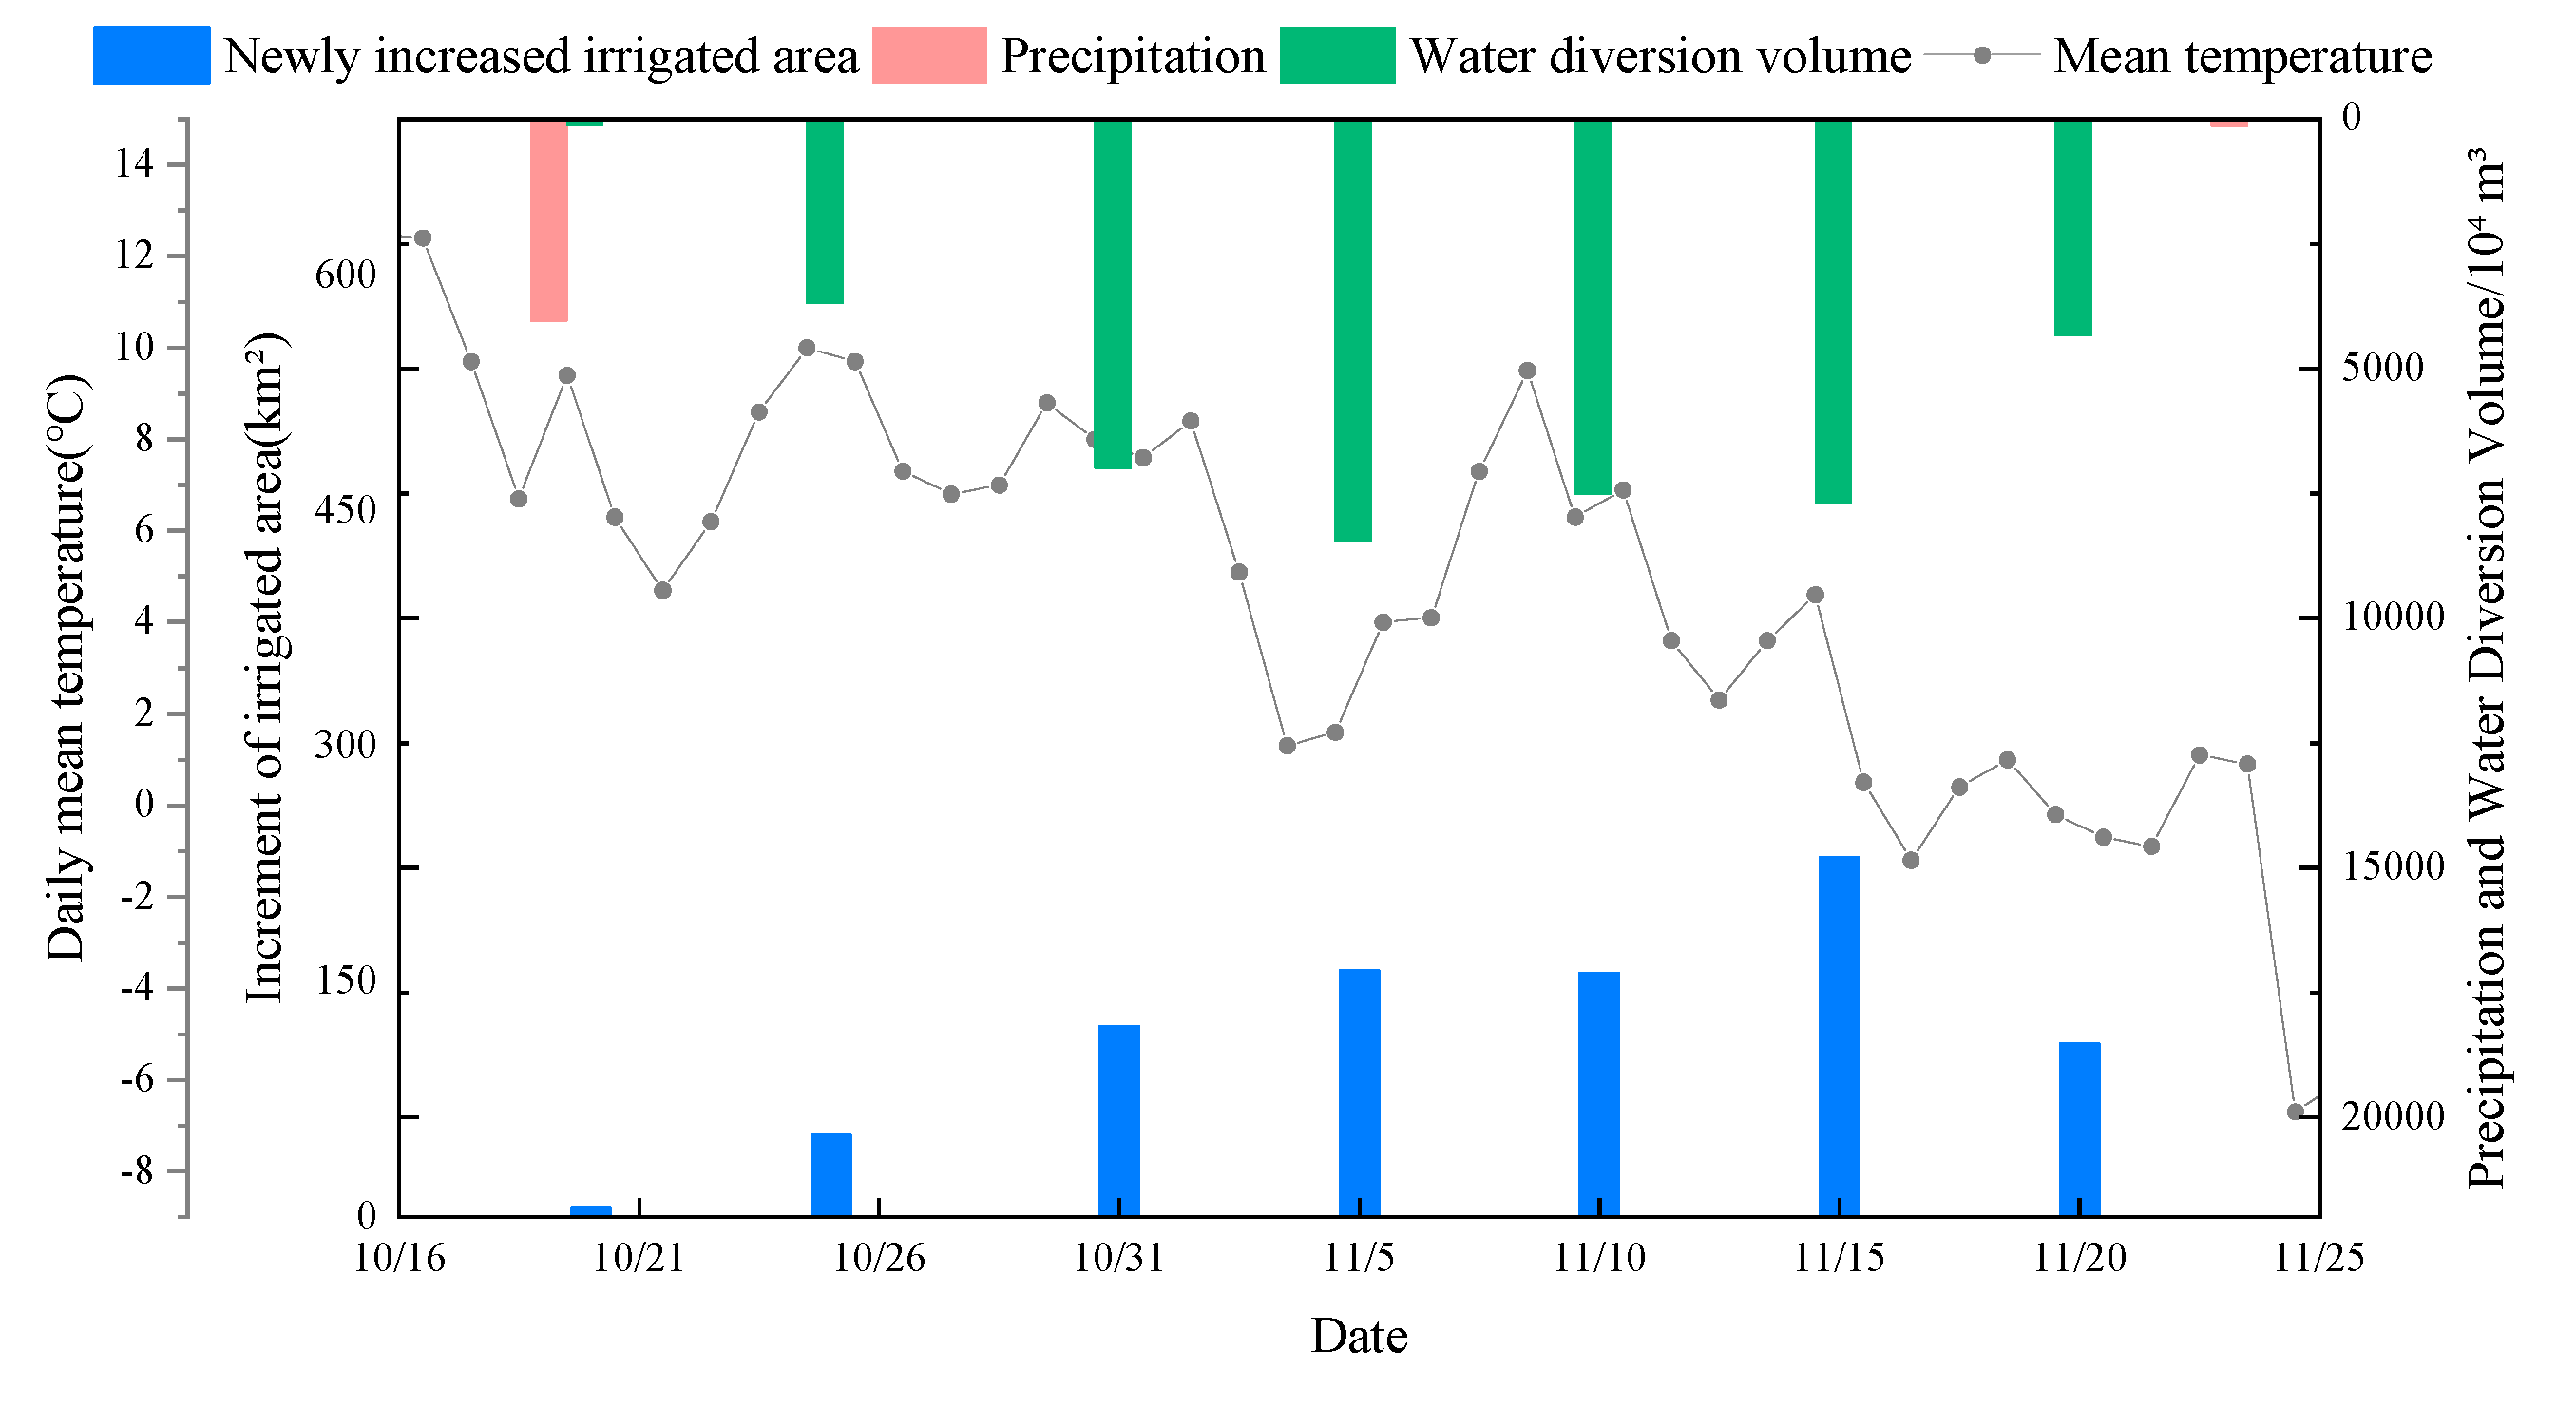
Figure 6.
Technical workflow.
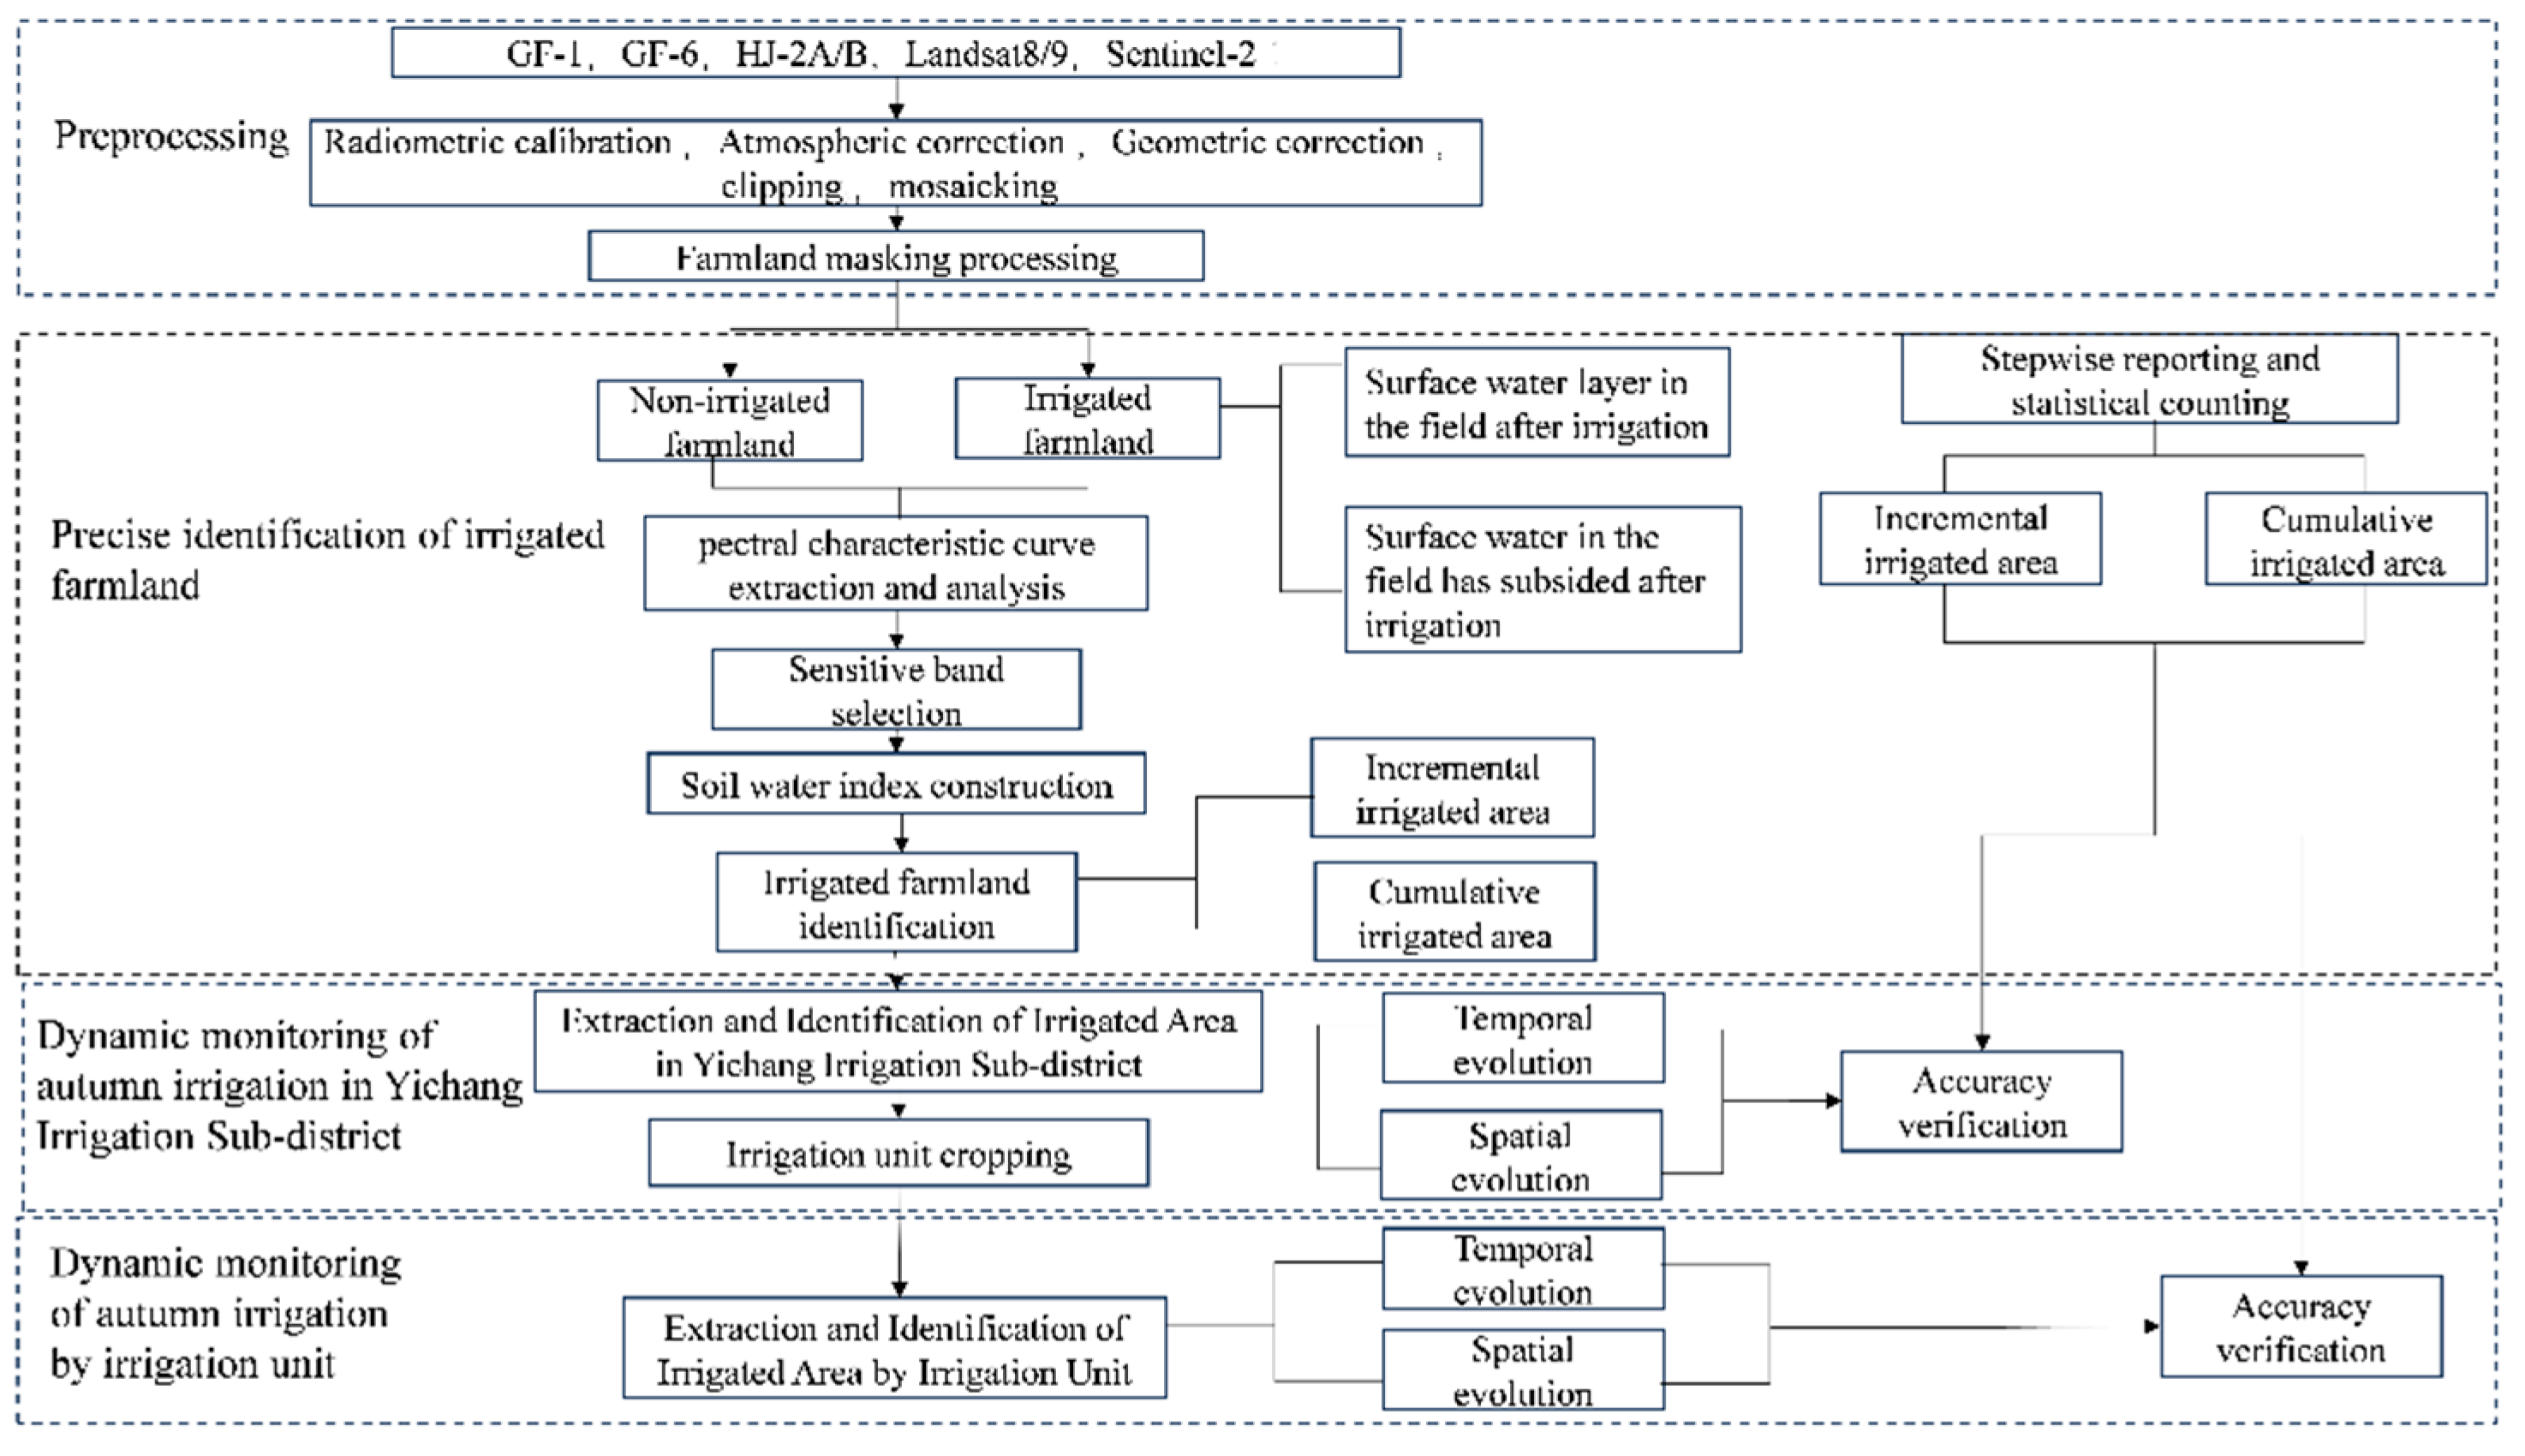
Figure 7.
Multi-source remote sensing spectral curves.
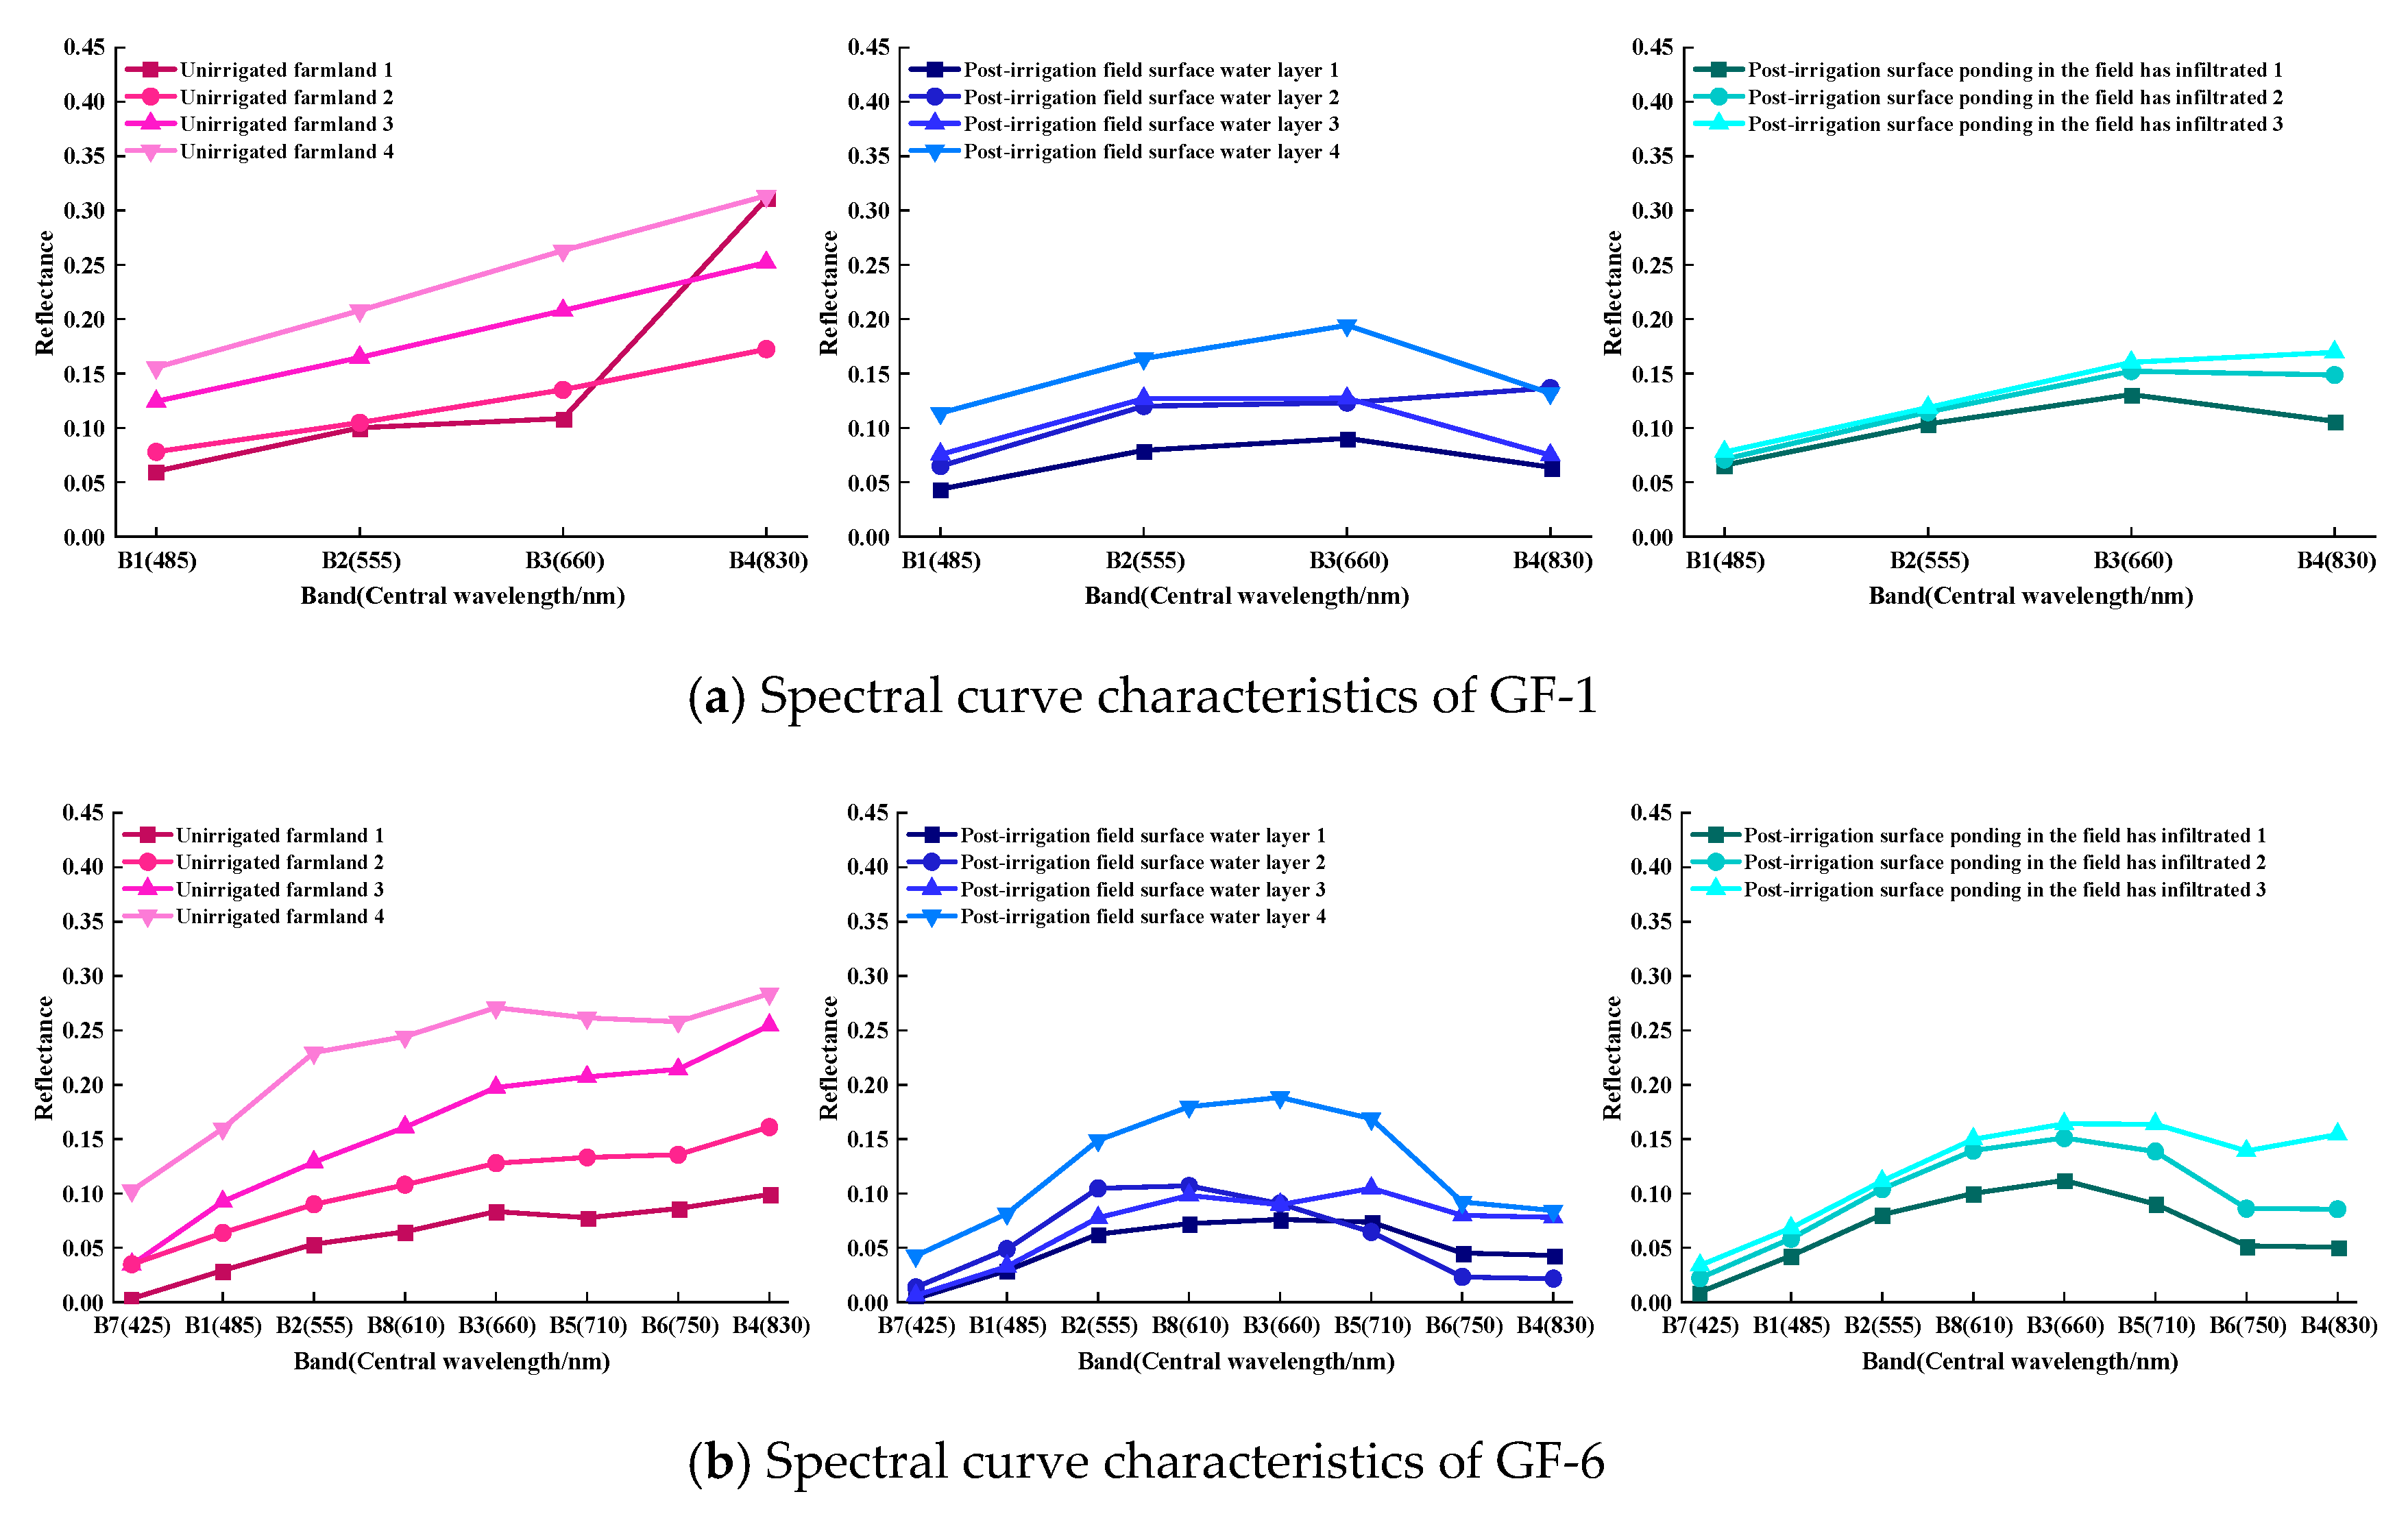
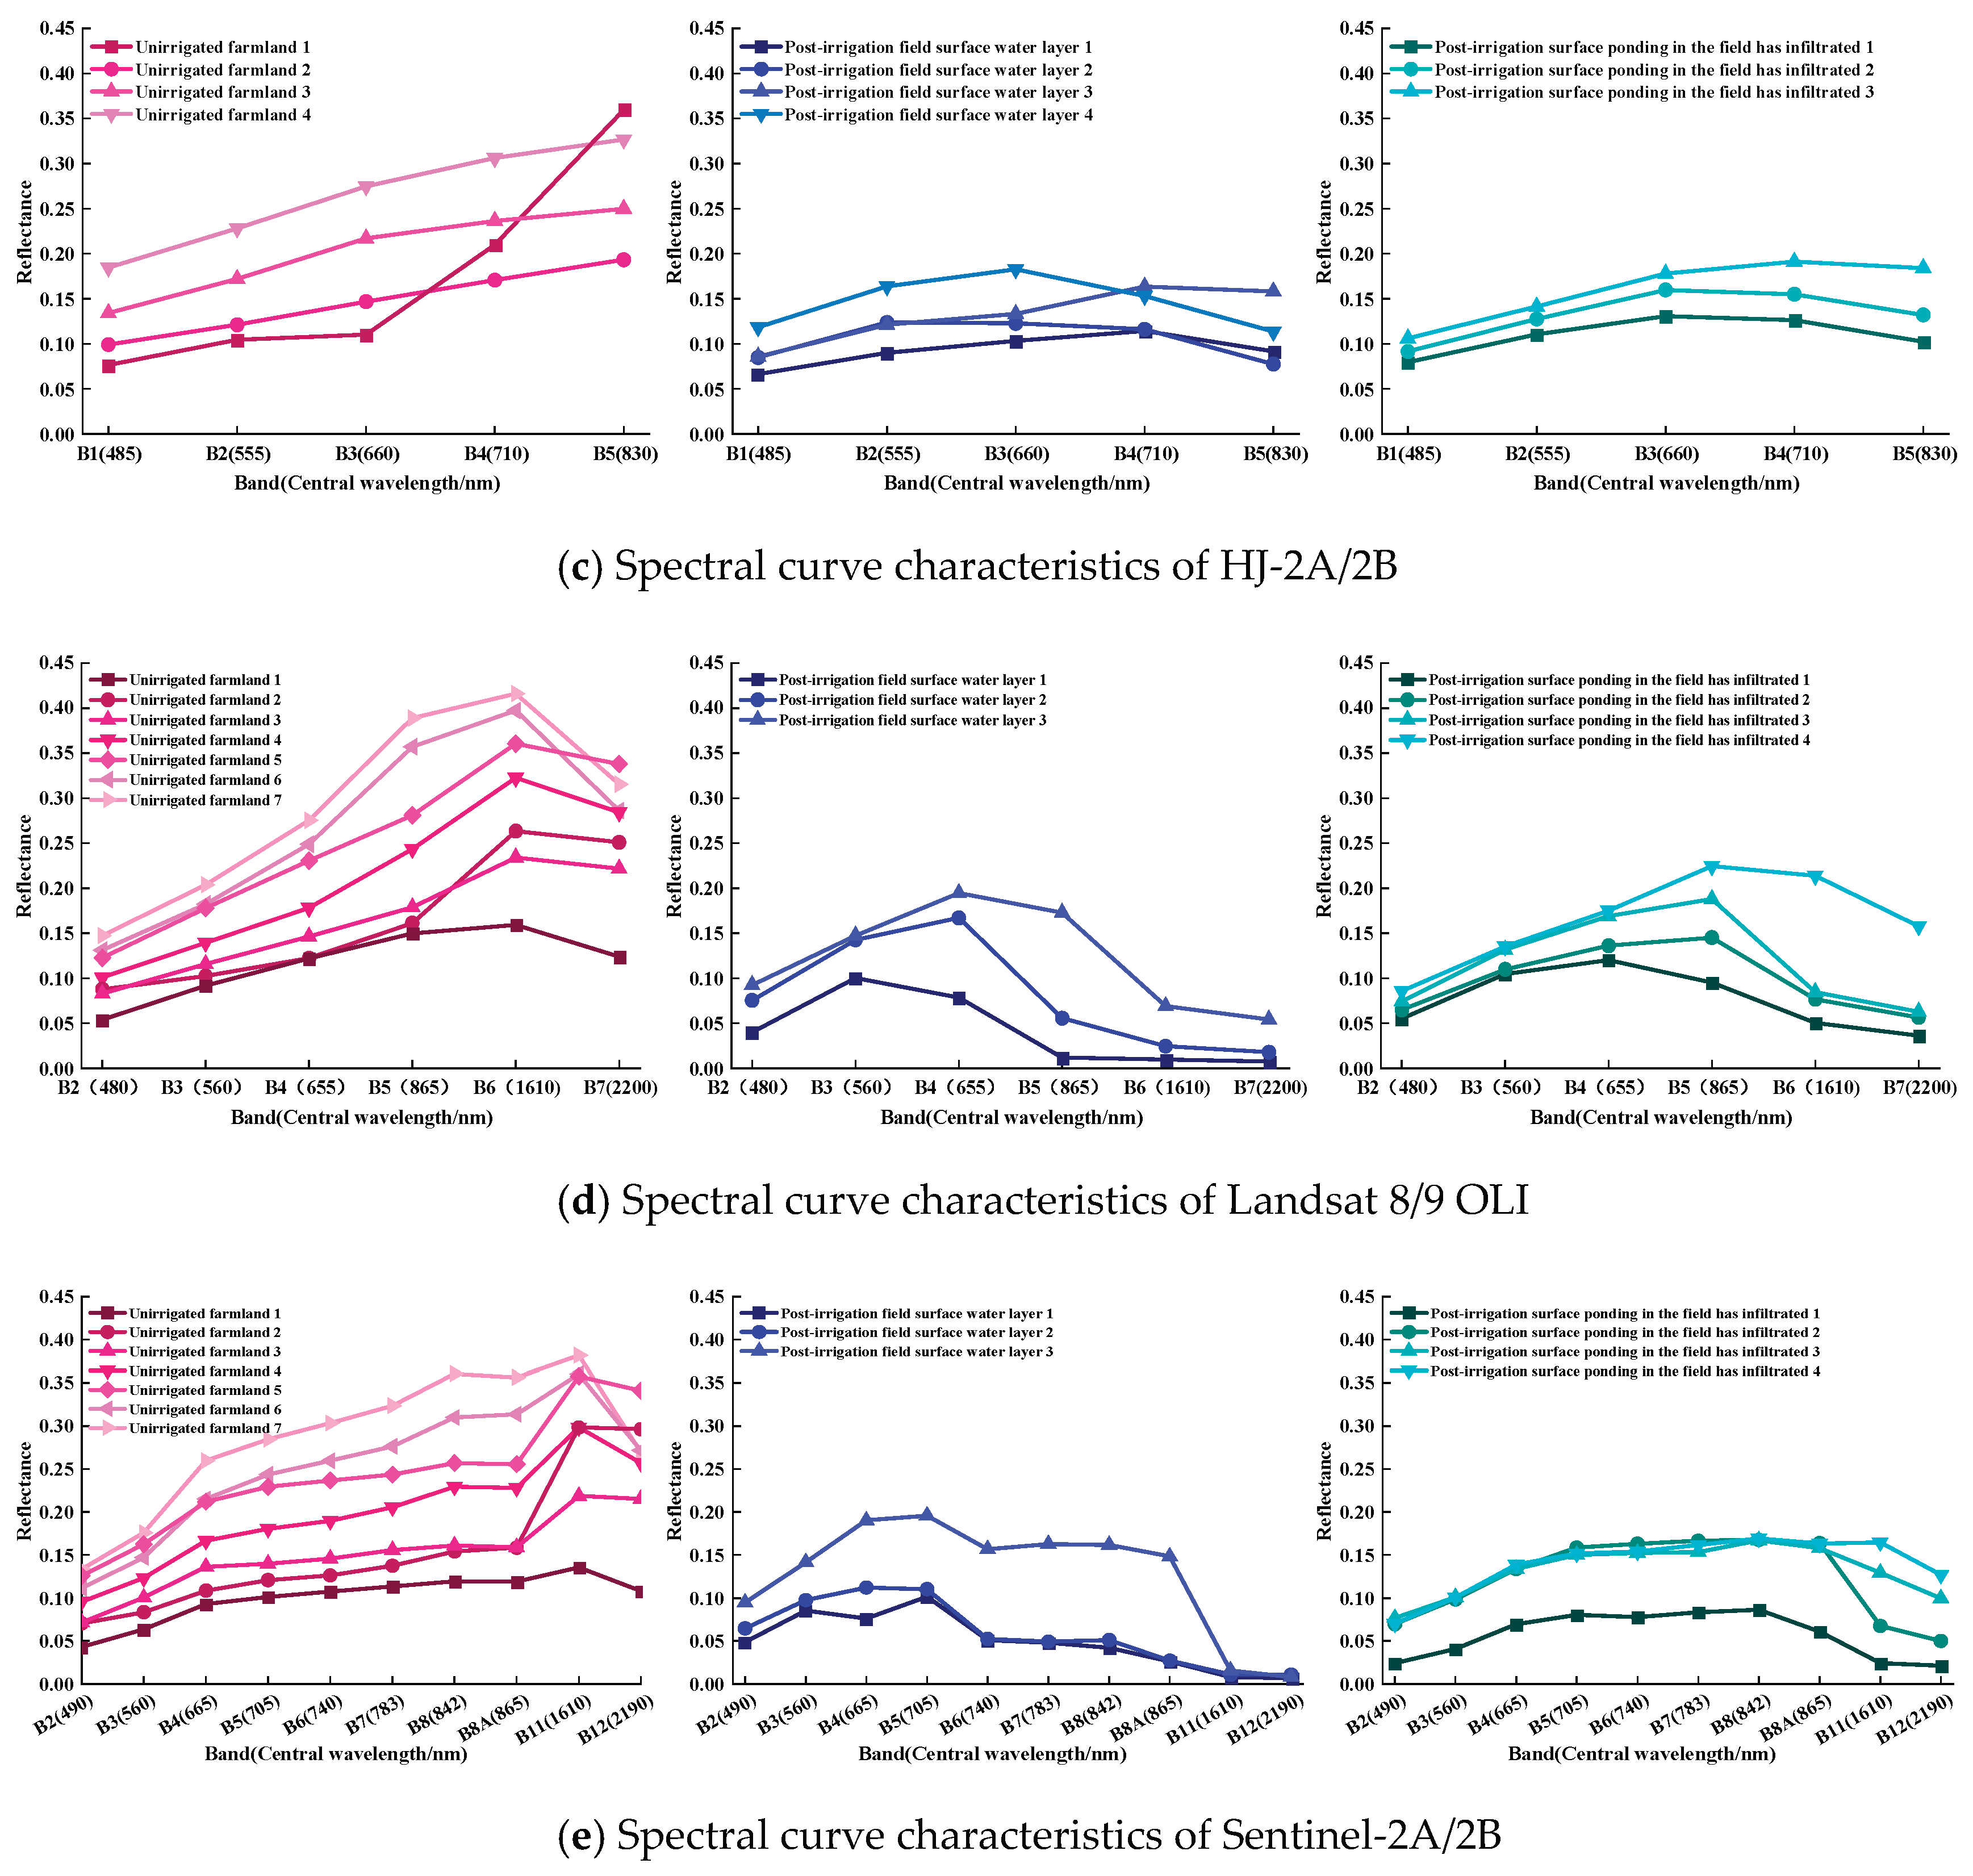
Figure 8.
Water diversion data by irrigation unit.
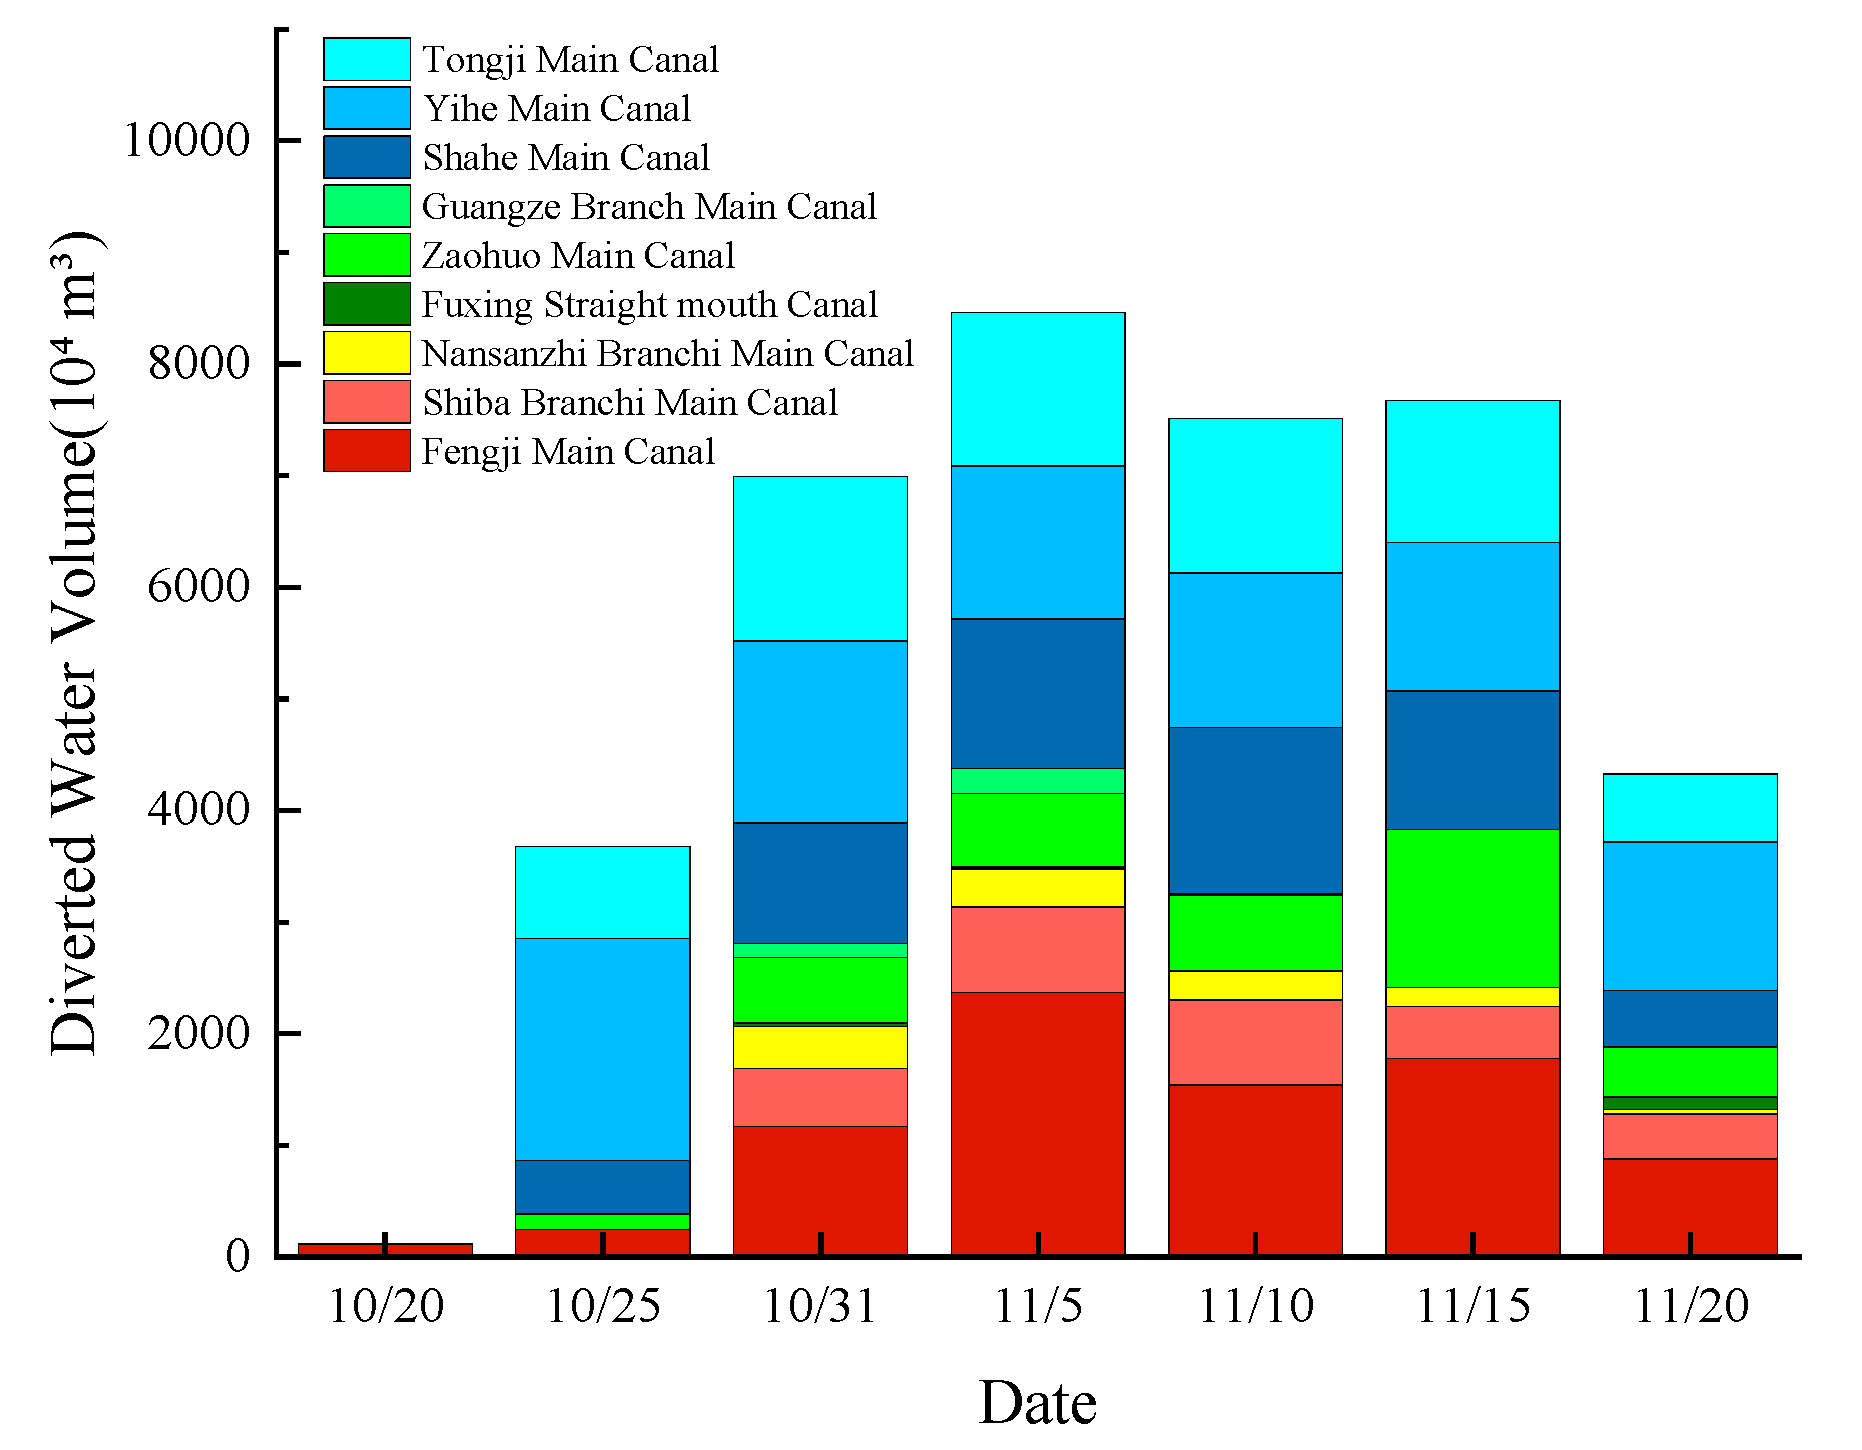
Figure 9.
Newly irrigated area by irrigation unit.
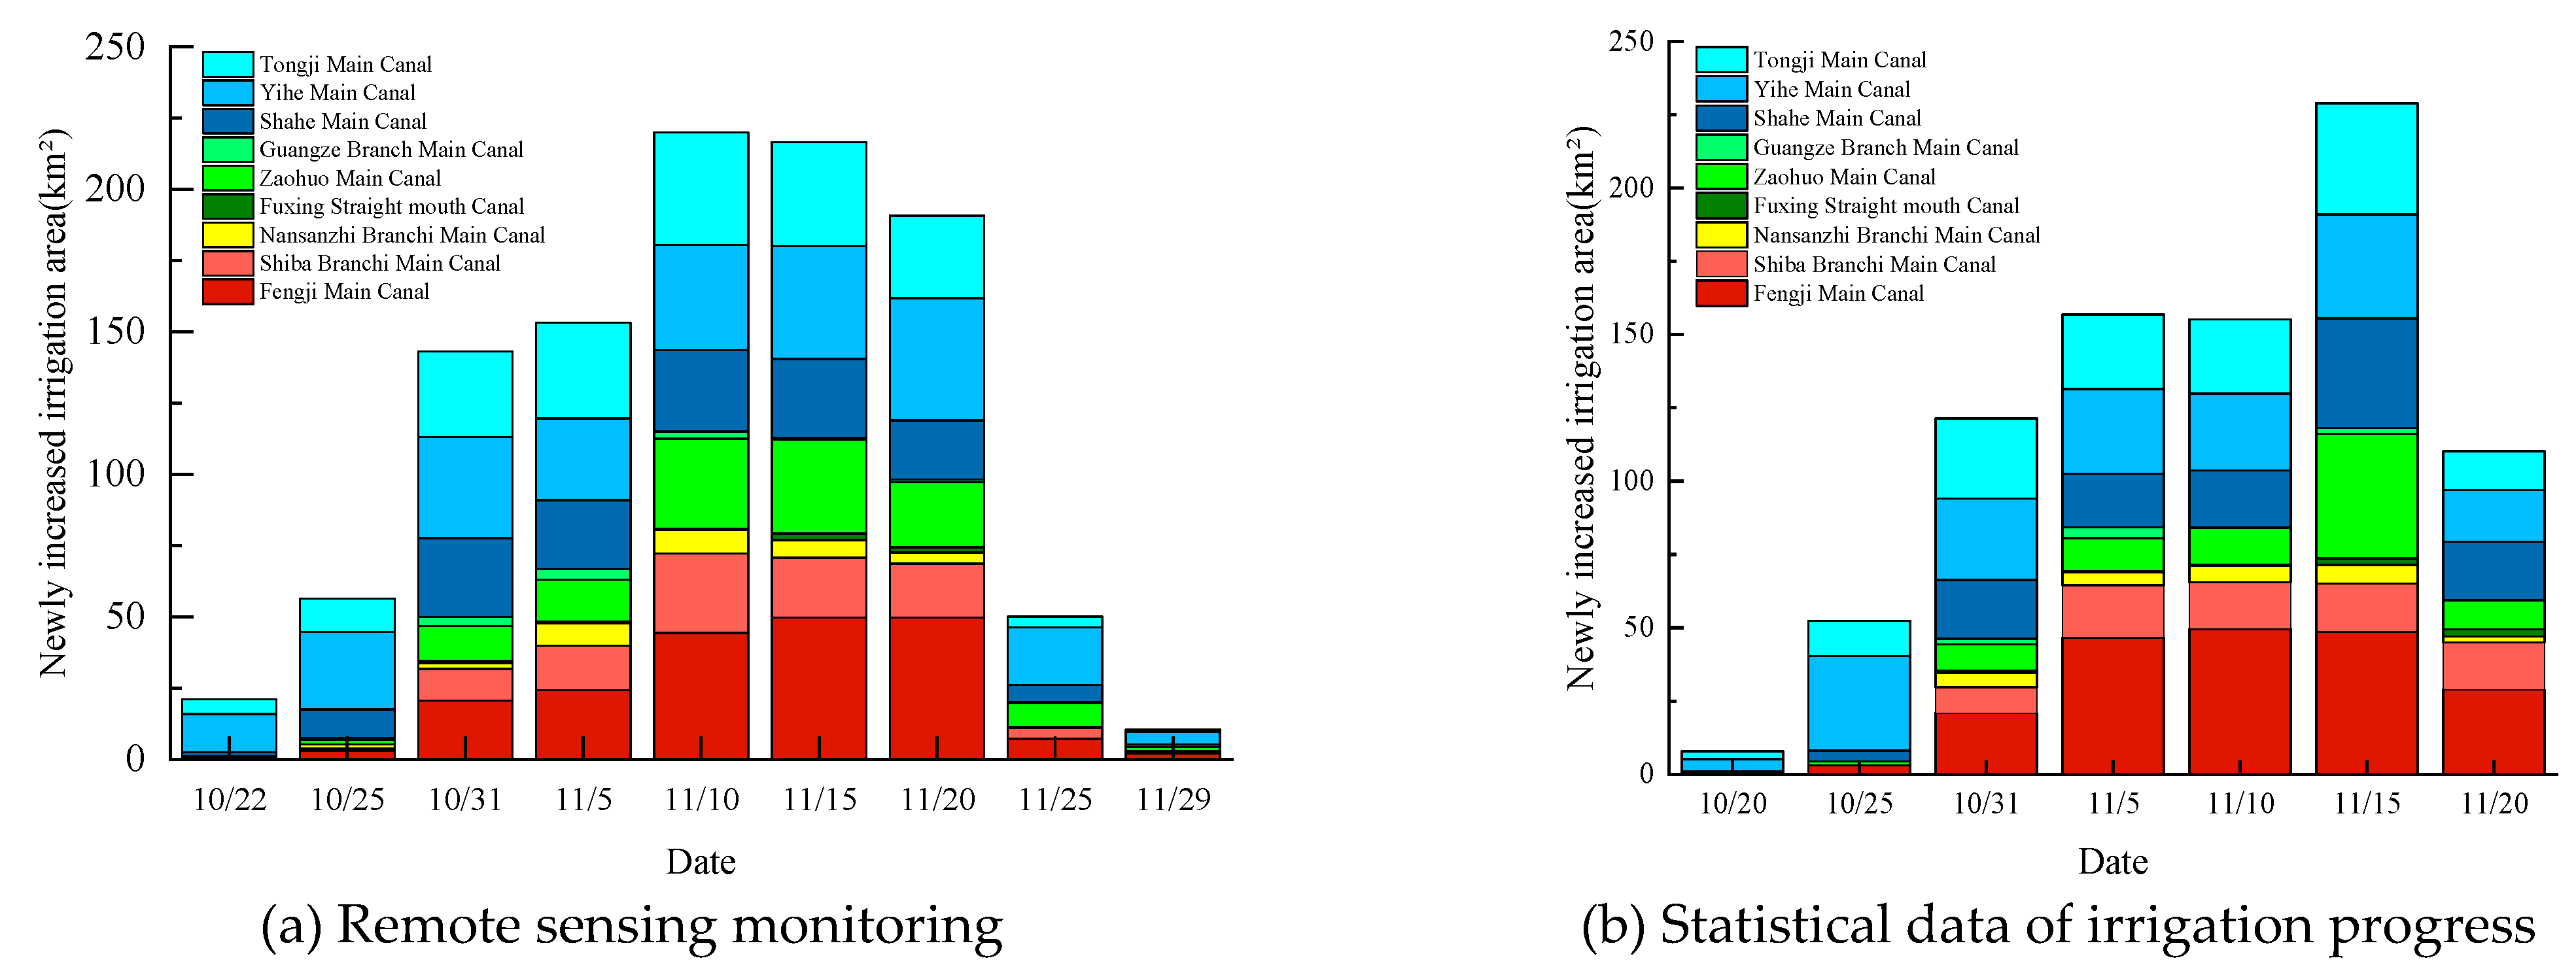
Figure 10.
Results of the fitting analysis between remote sensing data and statistical data.
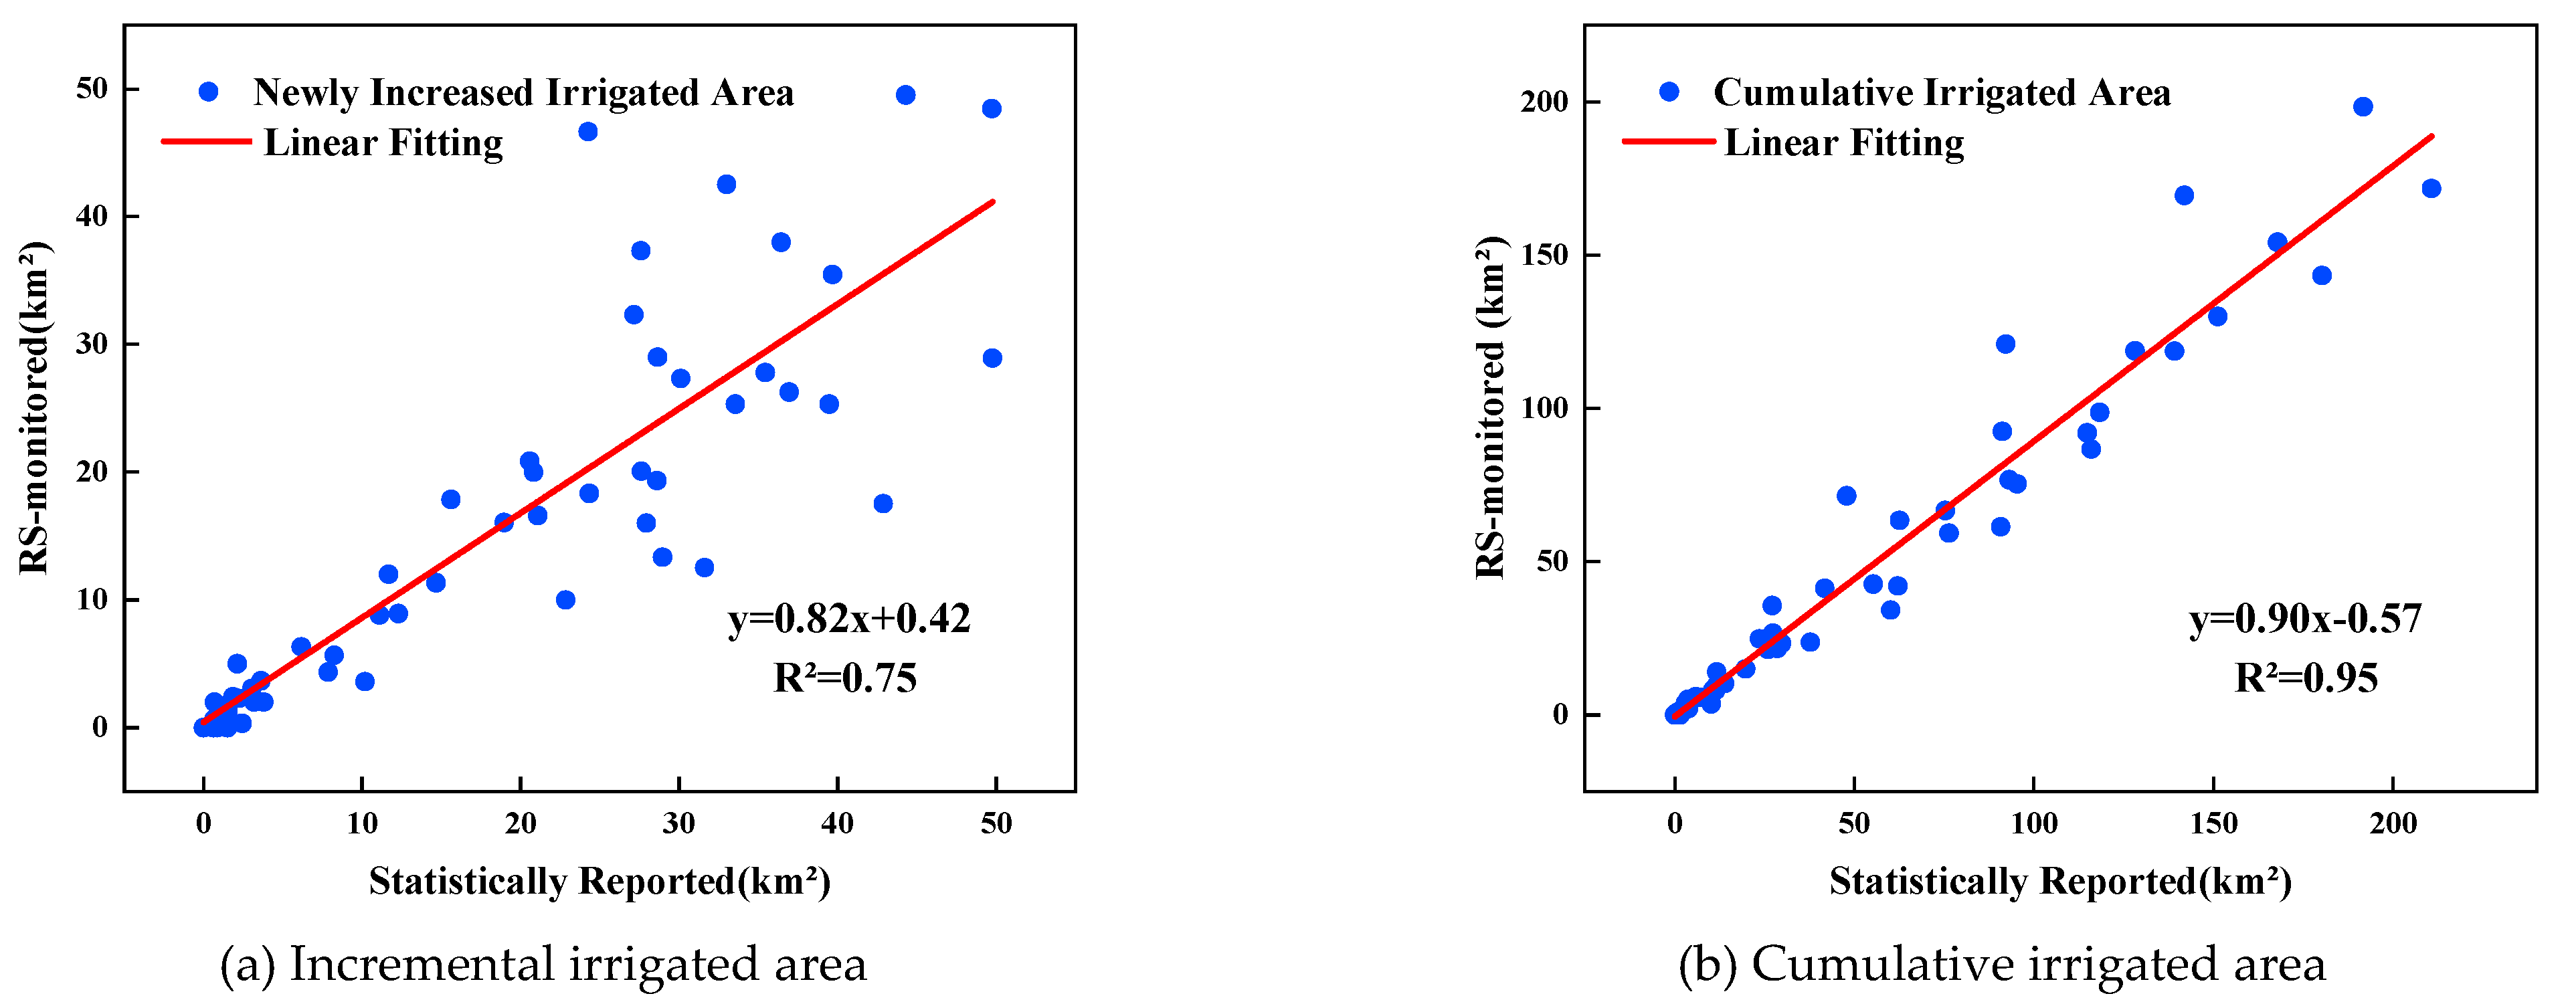
Figure 11.
Identification of autumn irrigation extent in the Yichang Irrigation District.
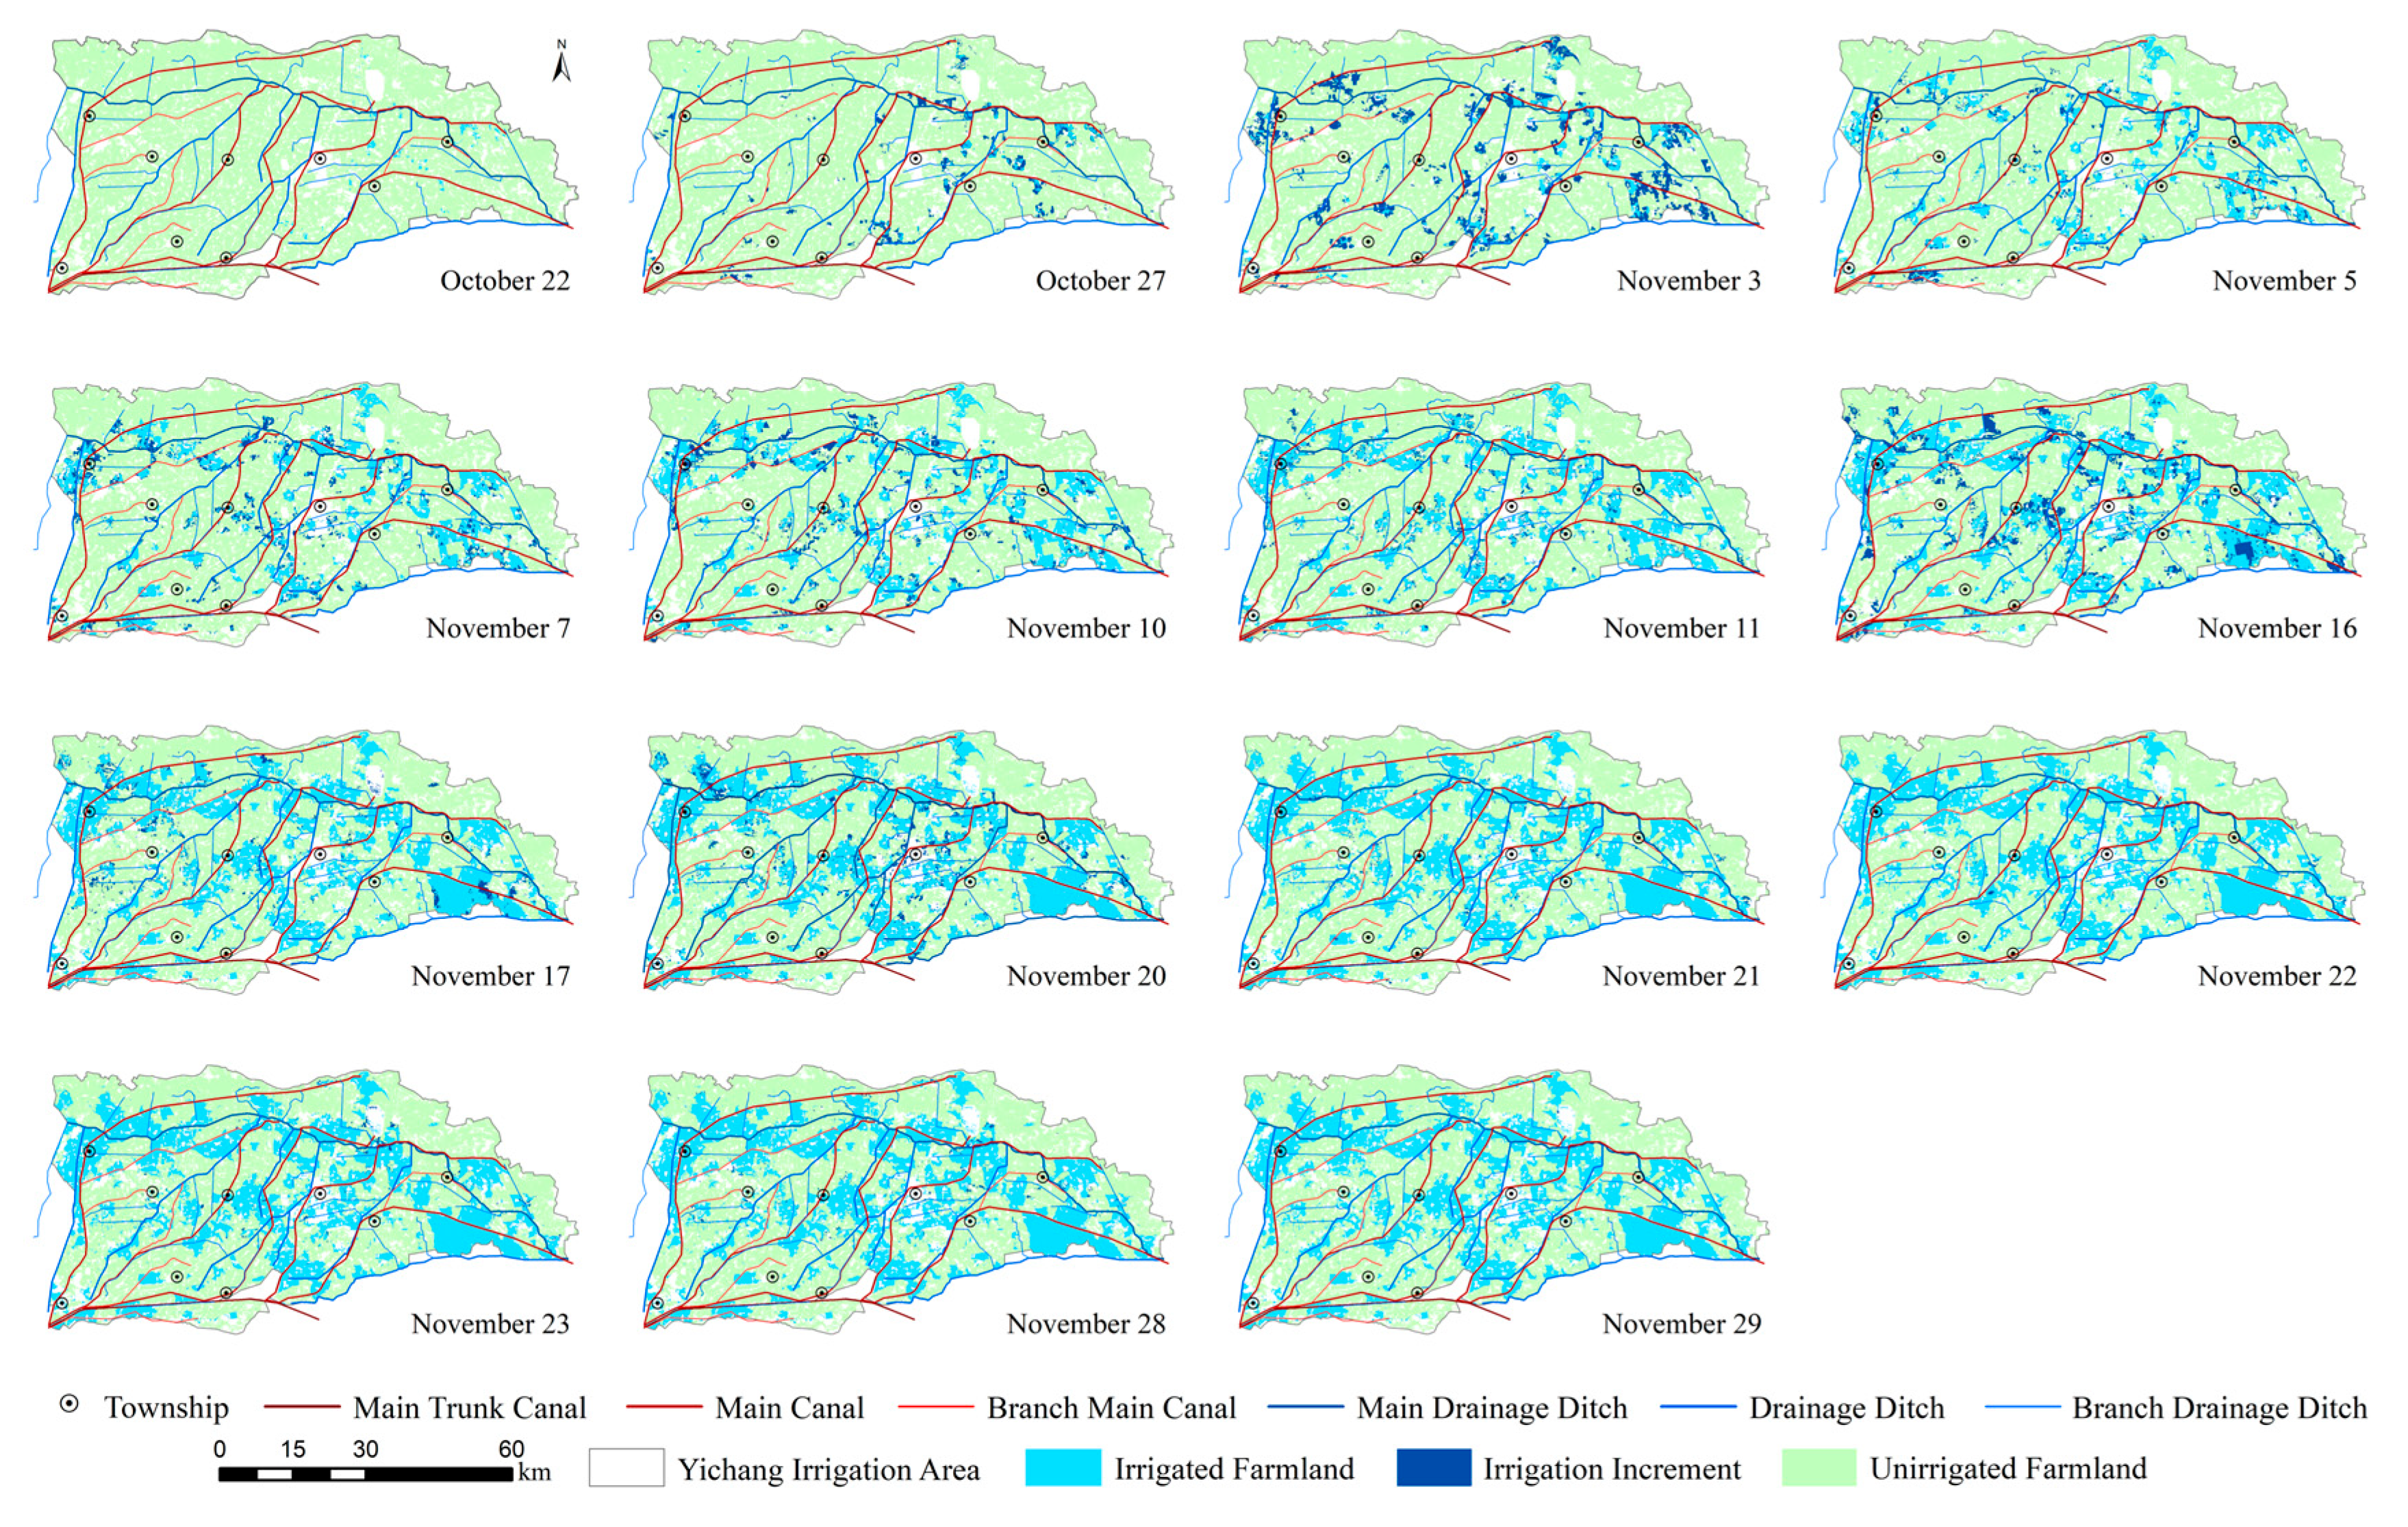
Figure 12.
Comparison between remotely sensed irrigated area and statistical irrigation progress for the Yichang Irrigation District.
Figure 12.
Comparison between remotely sensed irrigated area and statistical irrigation progress for the Yichang Irrigation District.
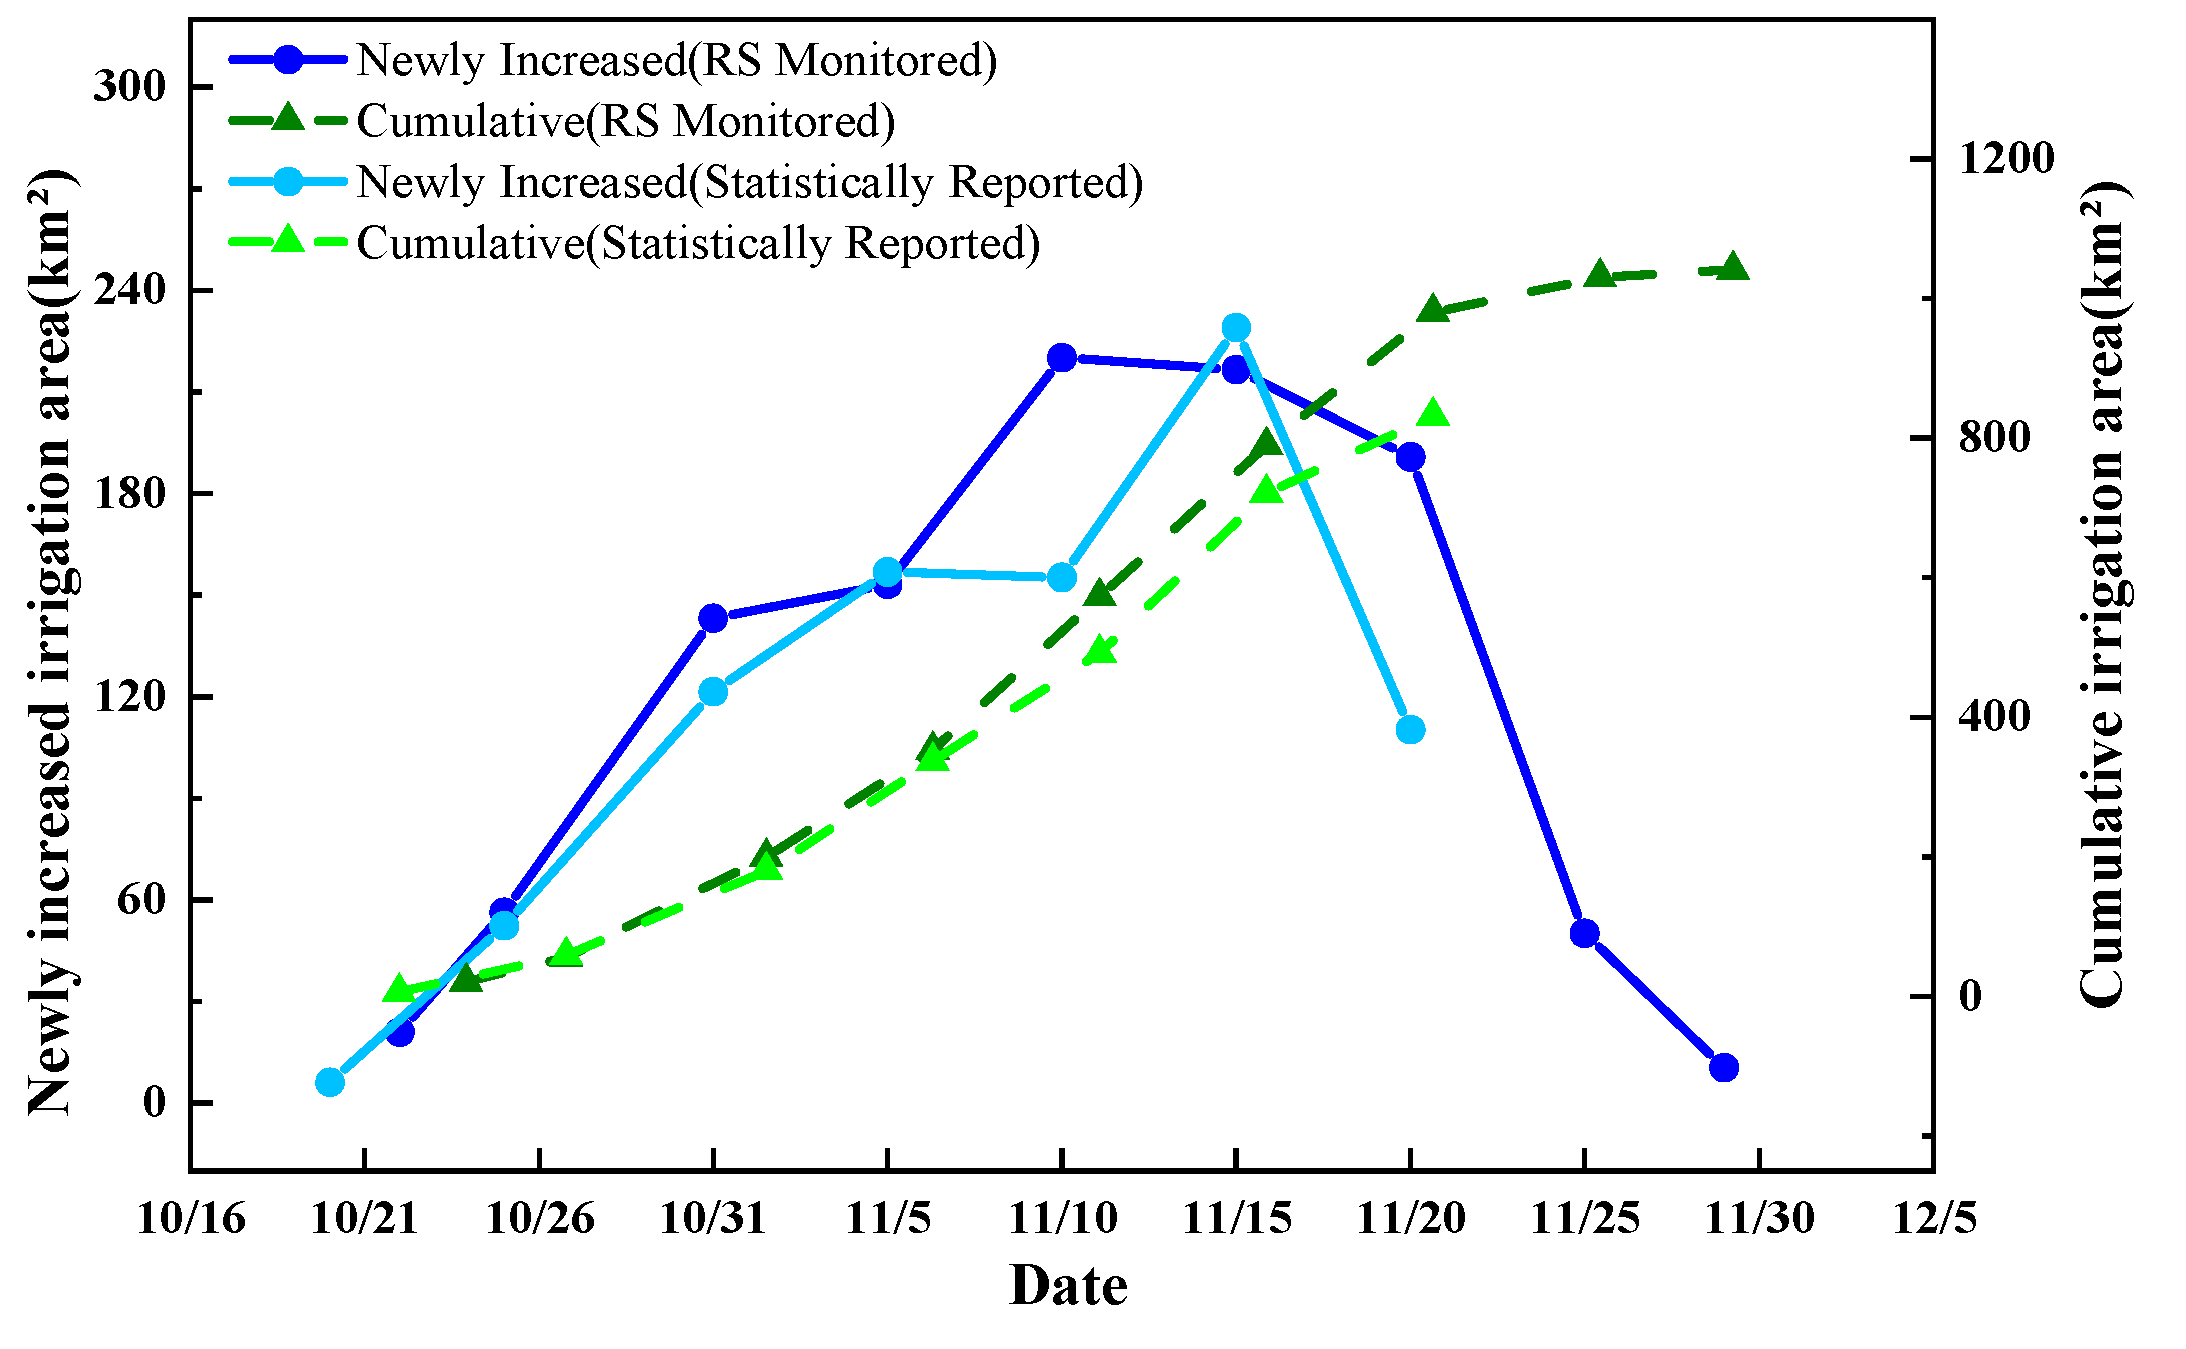
Figure 13.
Autumn irrigation progress by irrigation unit from remote sensing and statistical data.
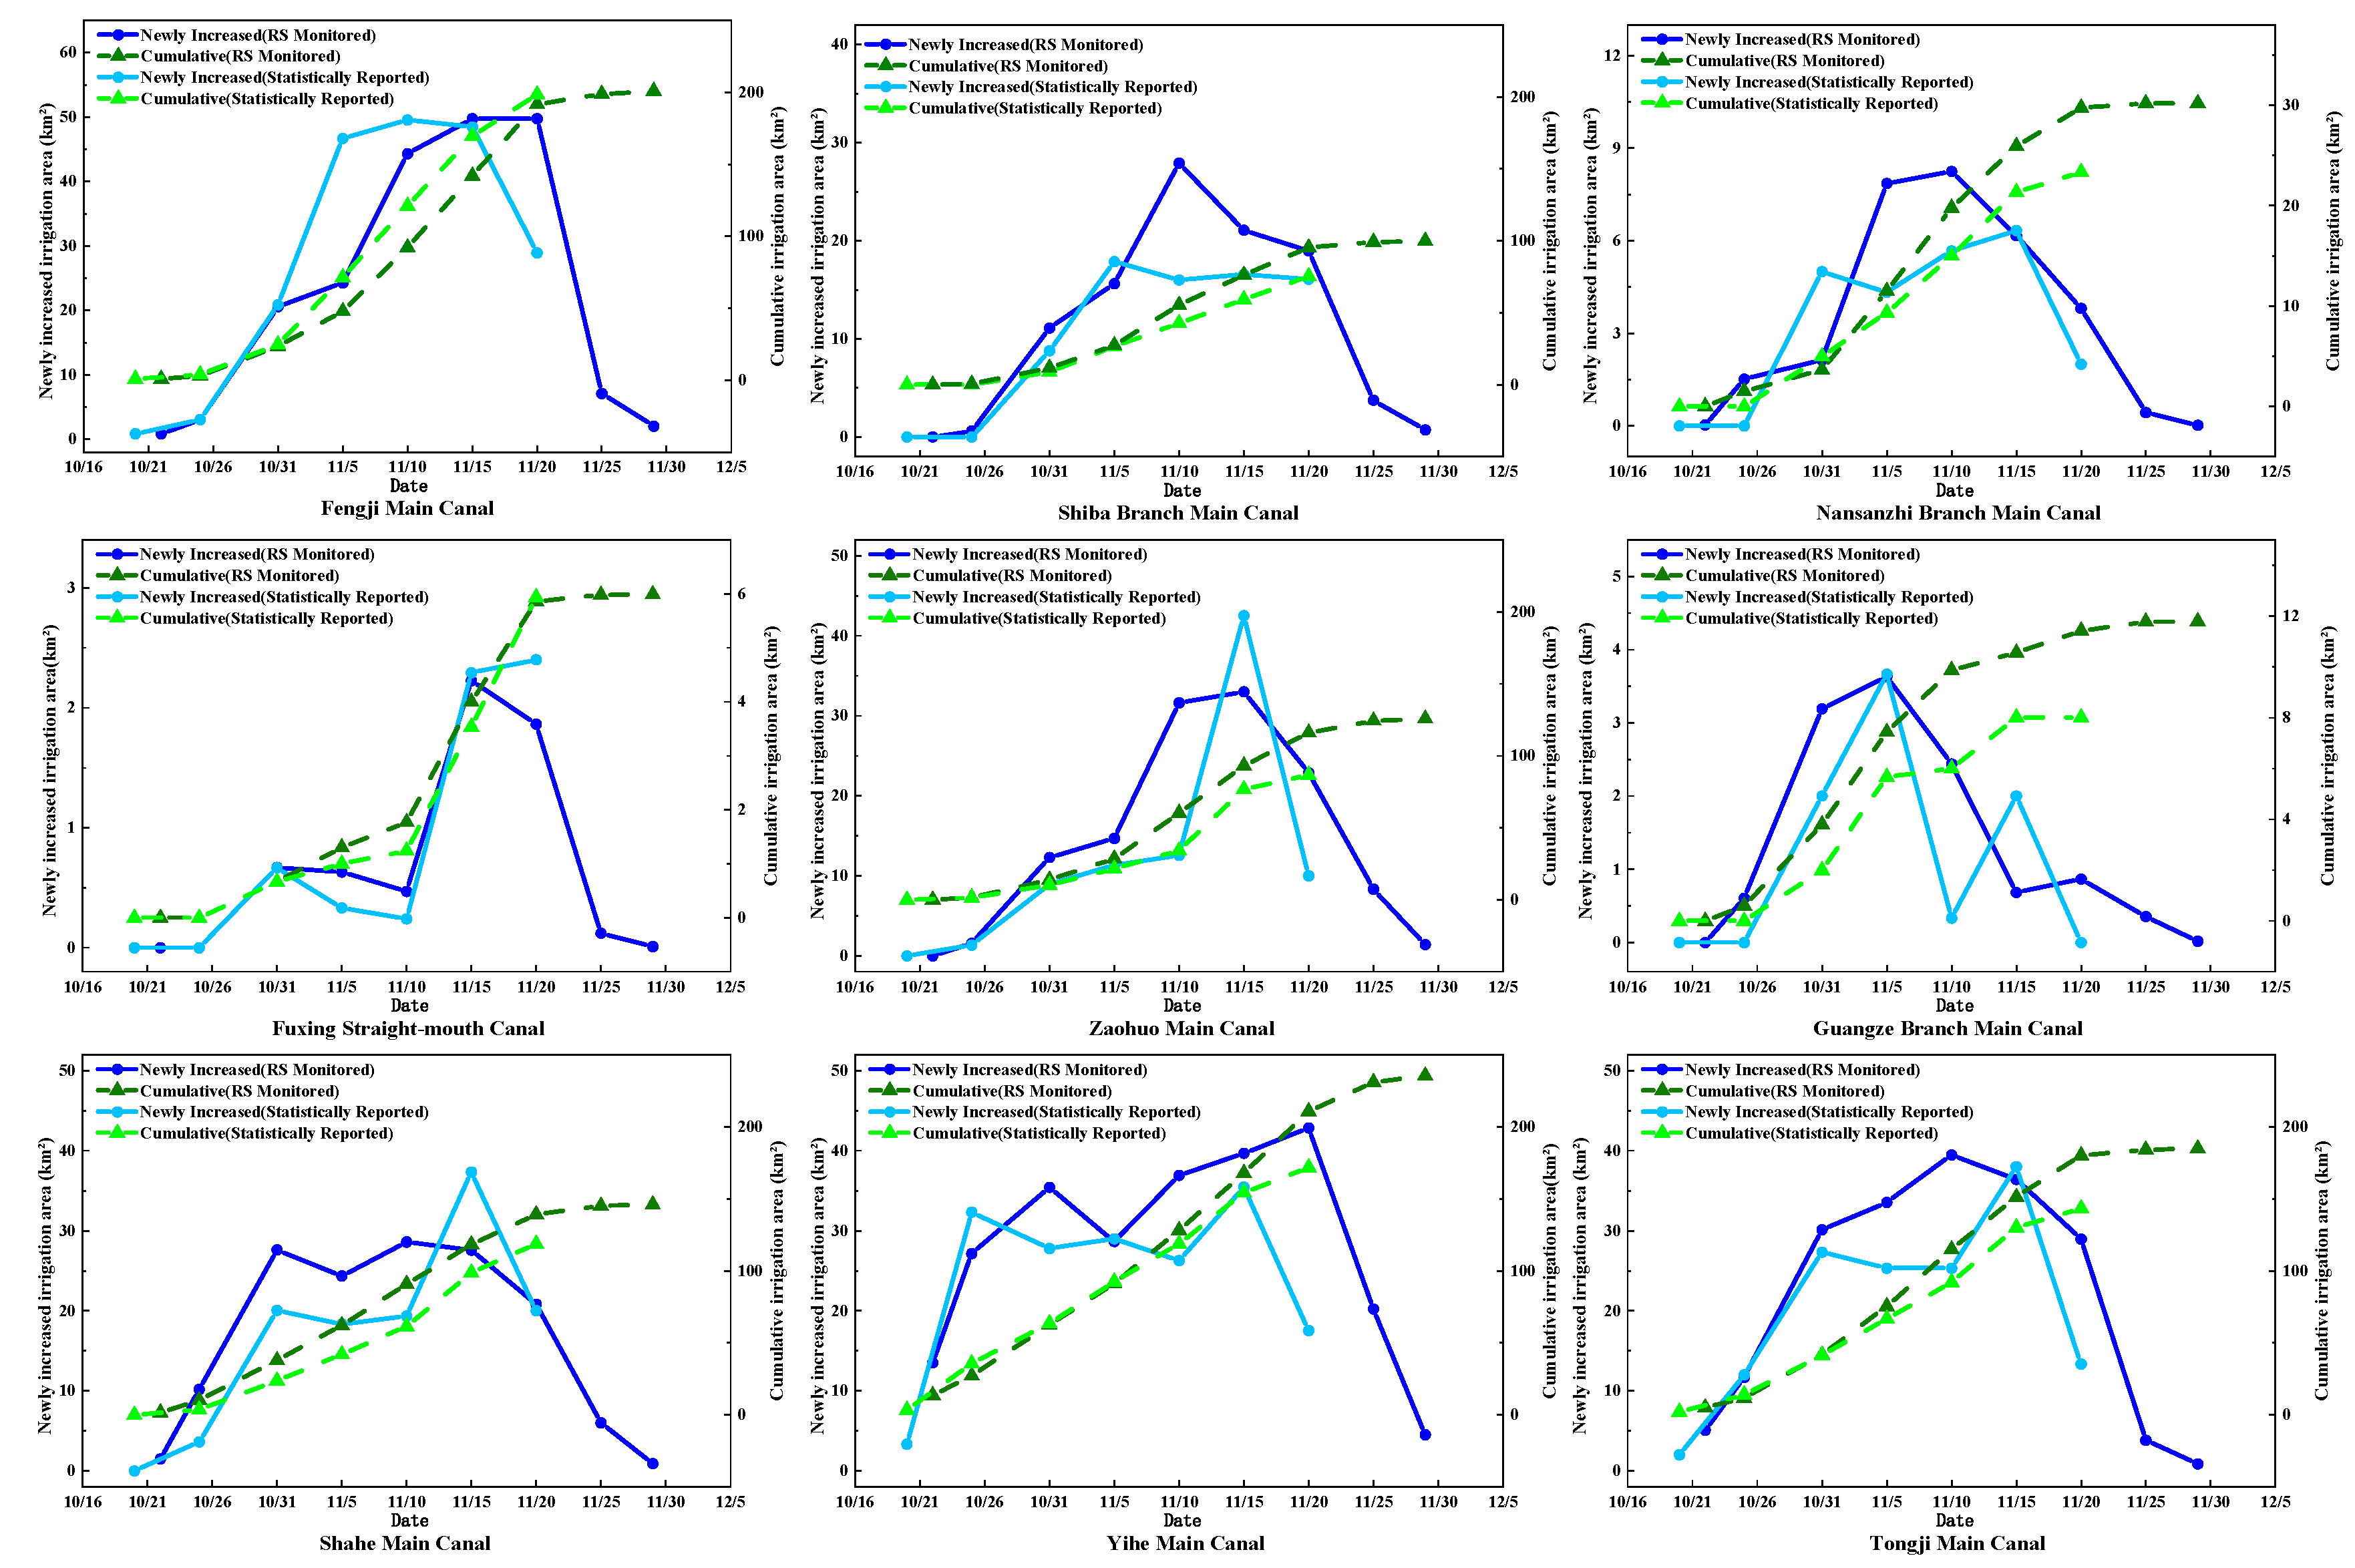
Figure 14.
Autumn irrigation progress of the Fengji Main Canal.
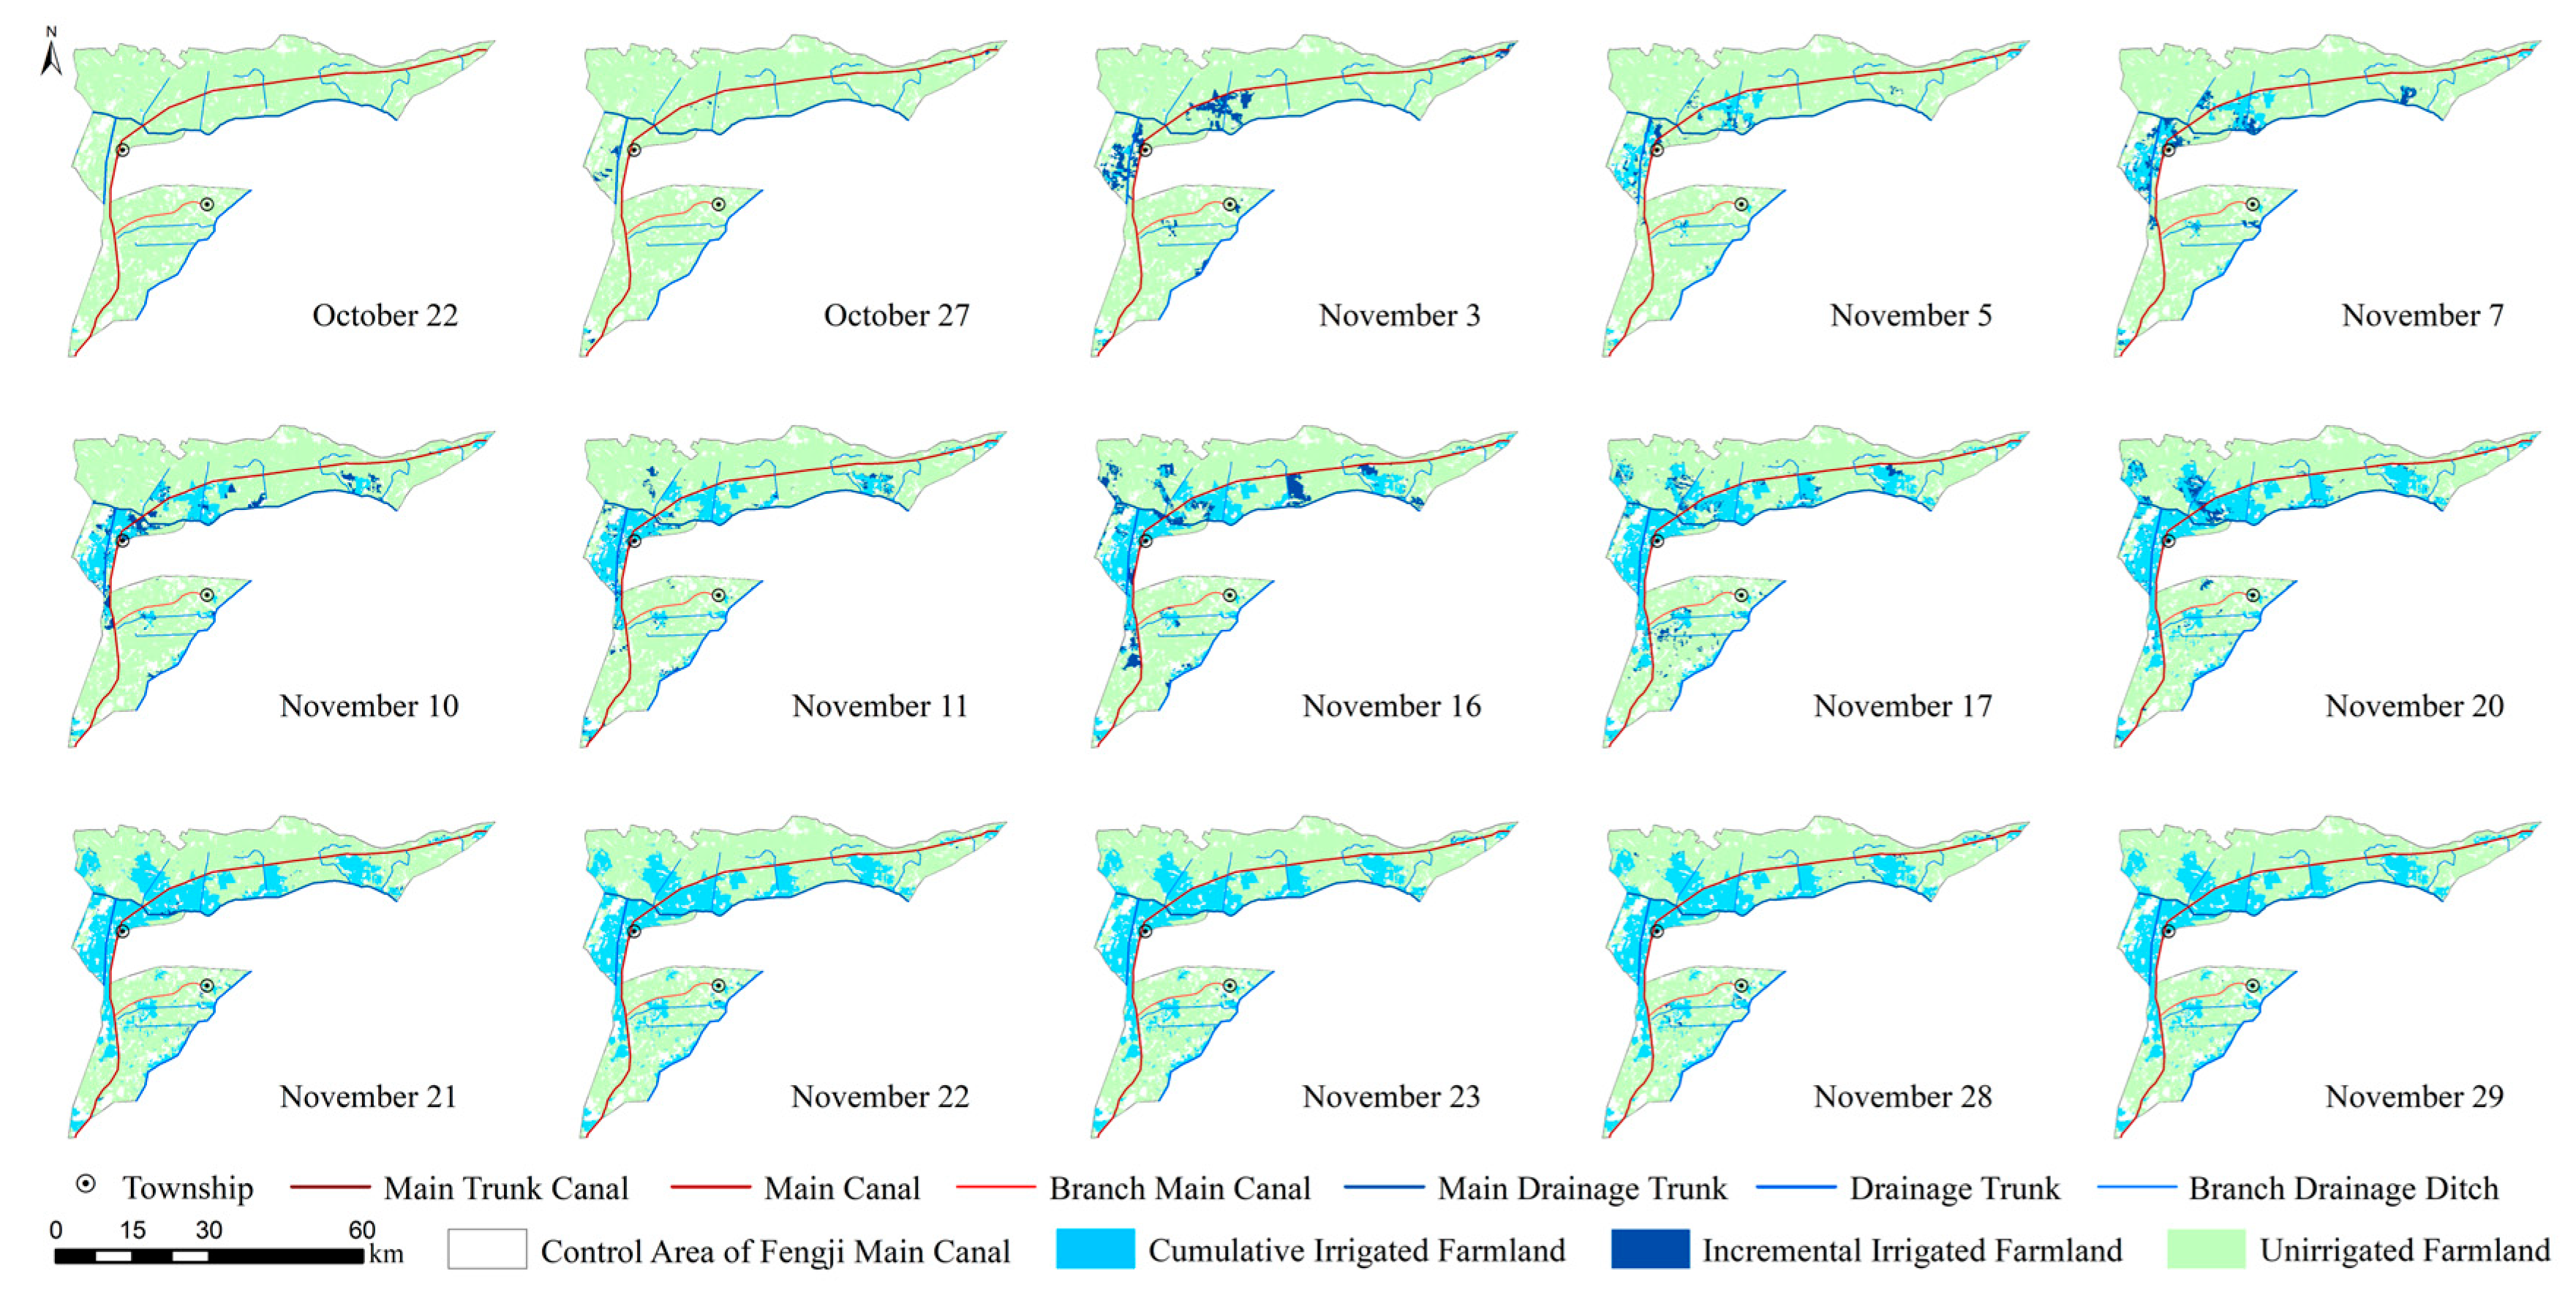
Figure 15.
Autumn irrigation progress of the Shiba Branch Main Canal.
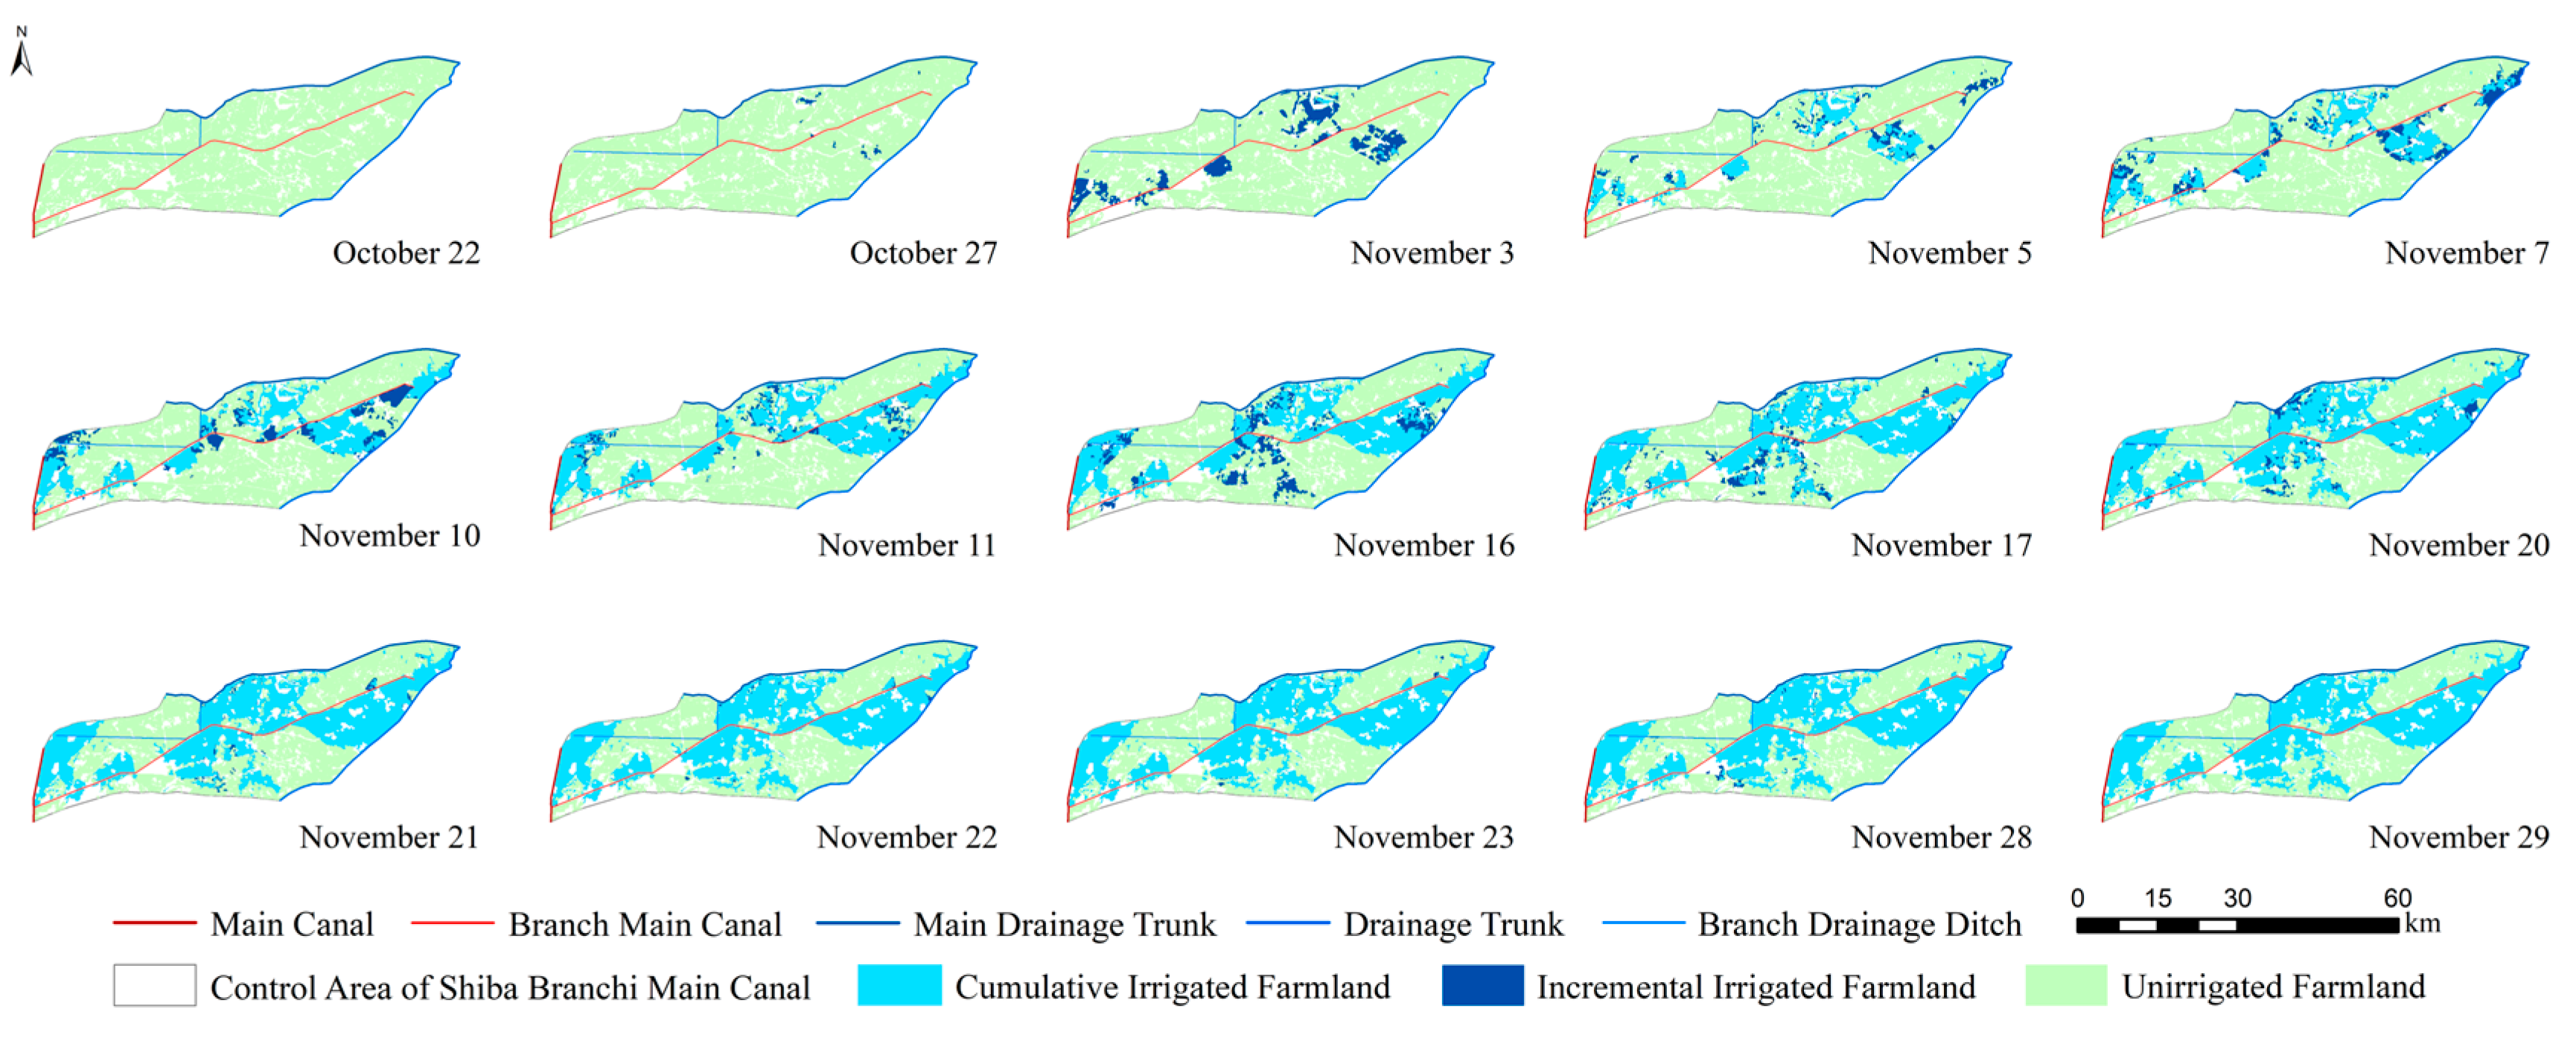
Figure 16.
Autumn irrigation progress of the Nansanzhi Branch Canal.
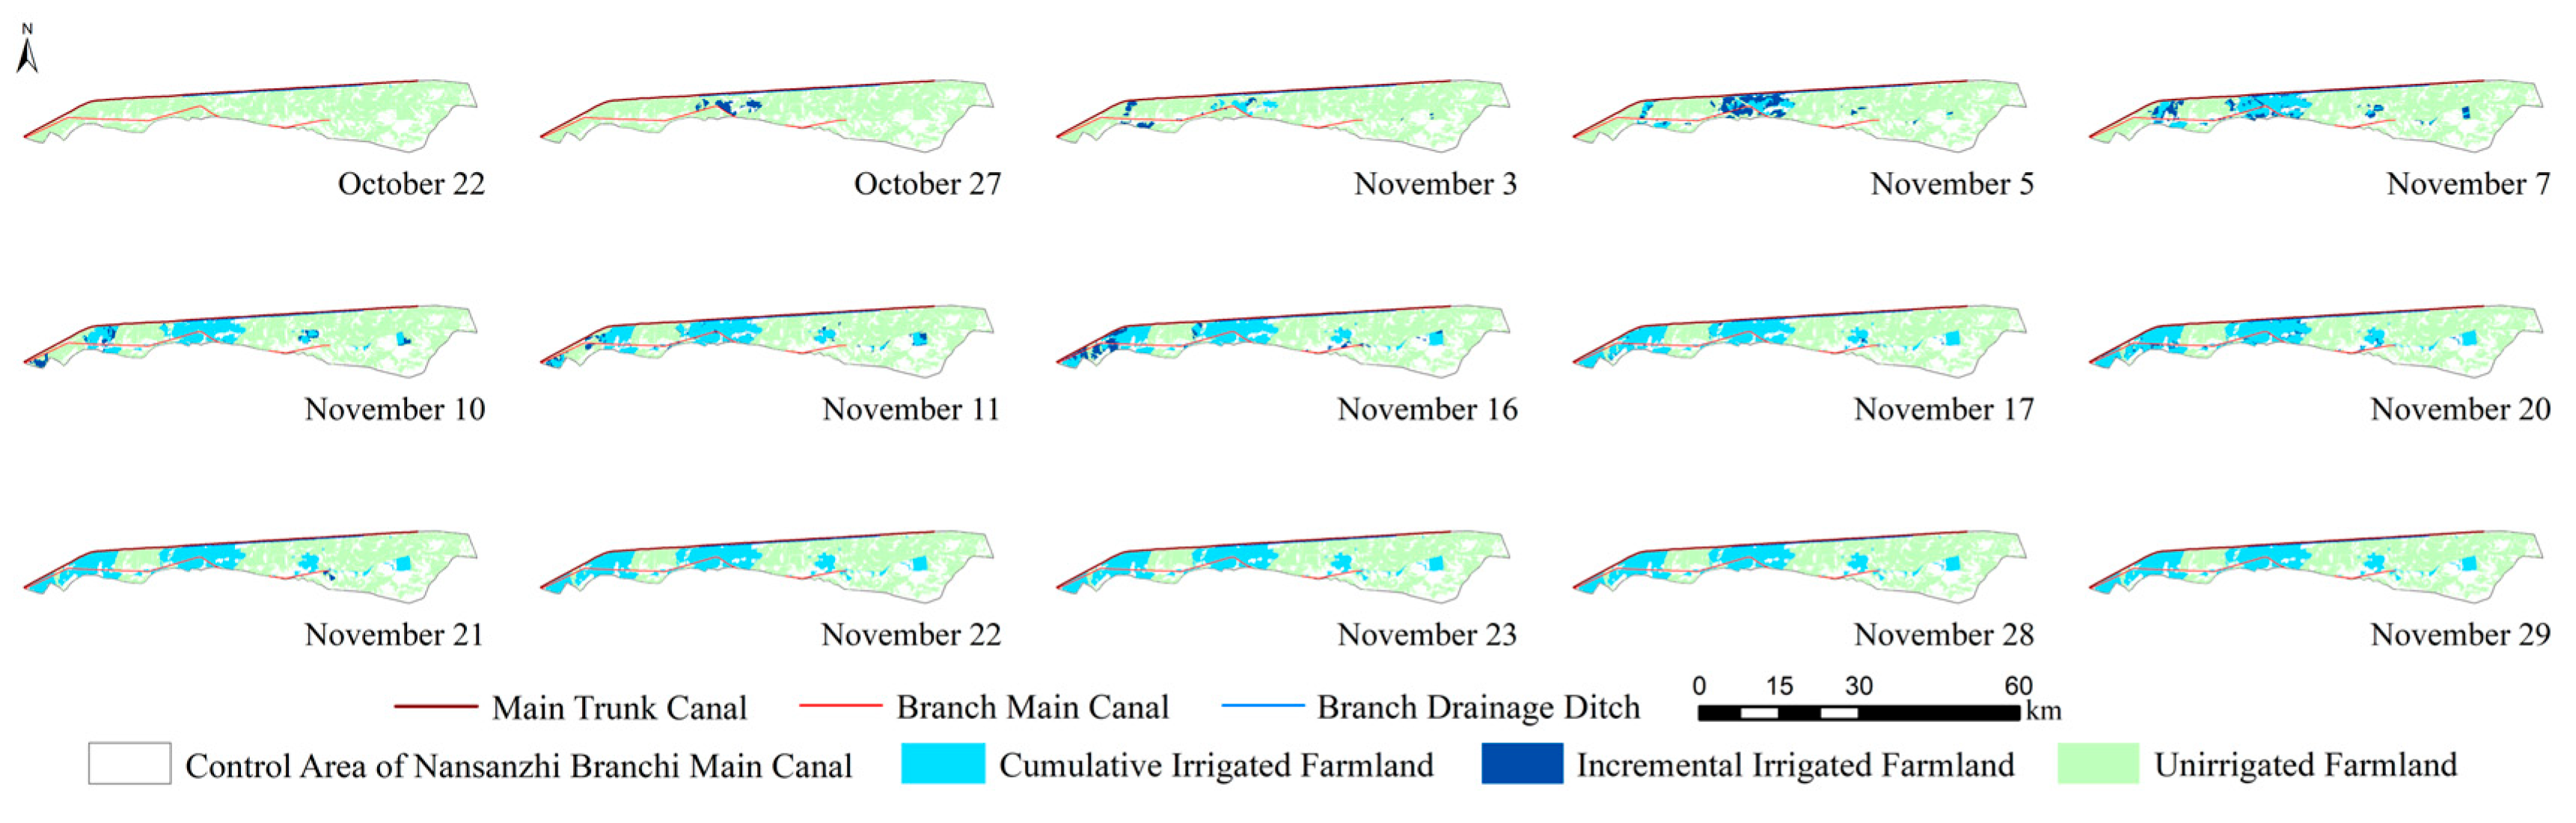
Figure 17.
Autumn irrigation progress of the Fuxing Straight-Intake Canal.
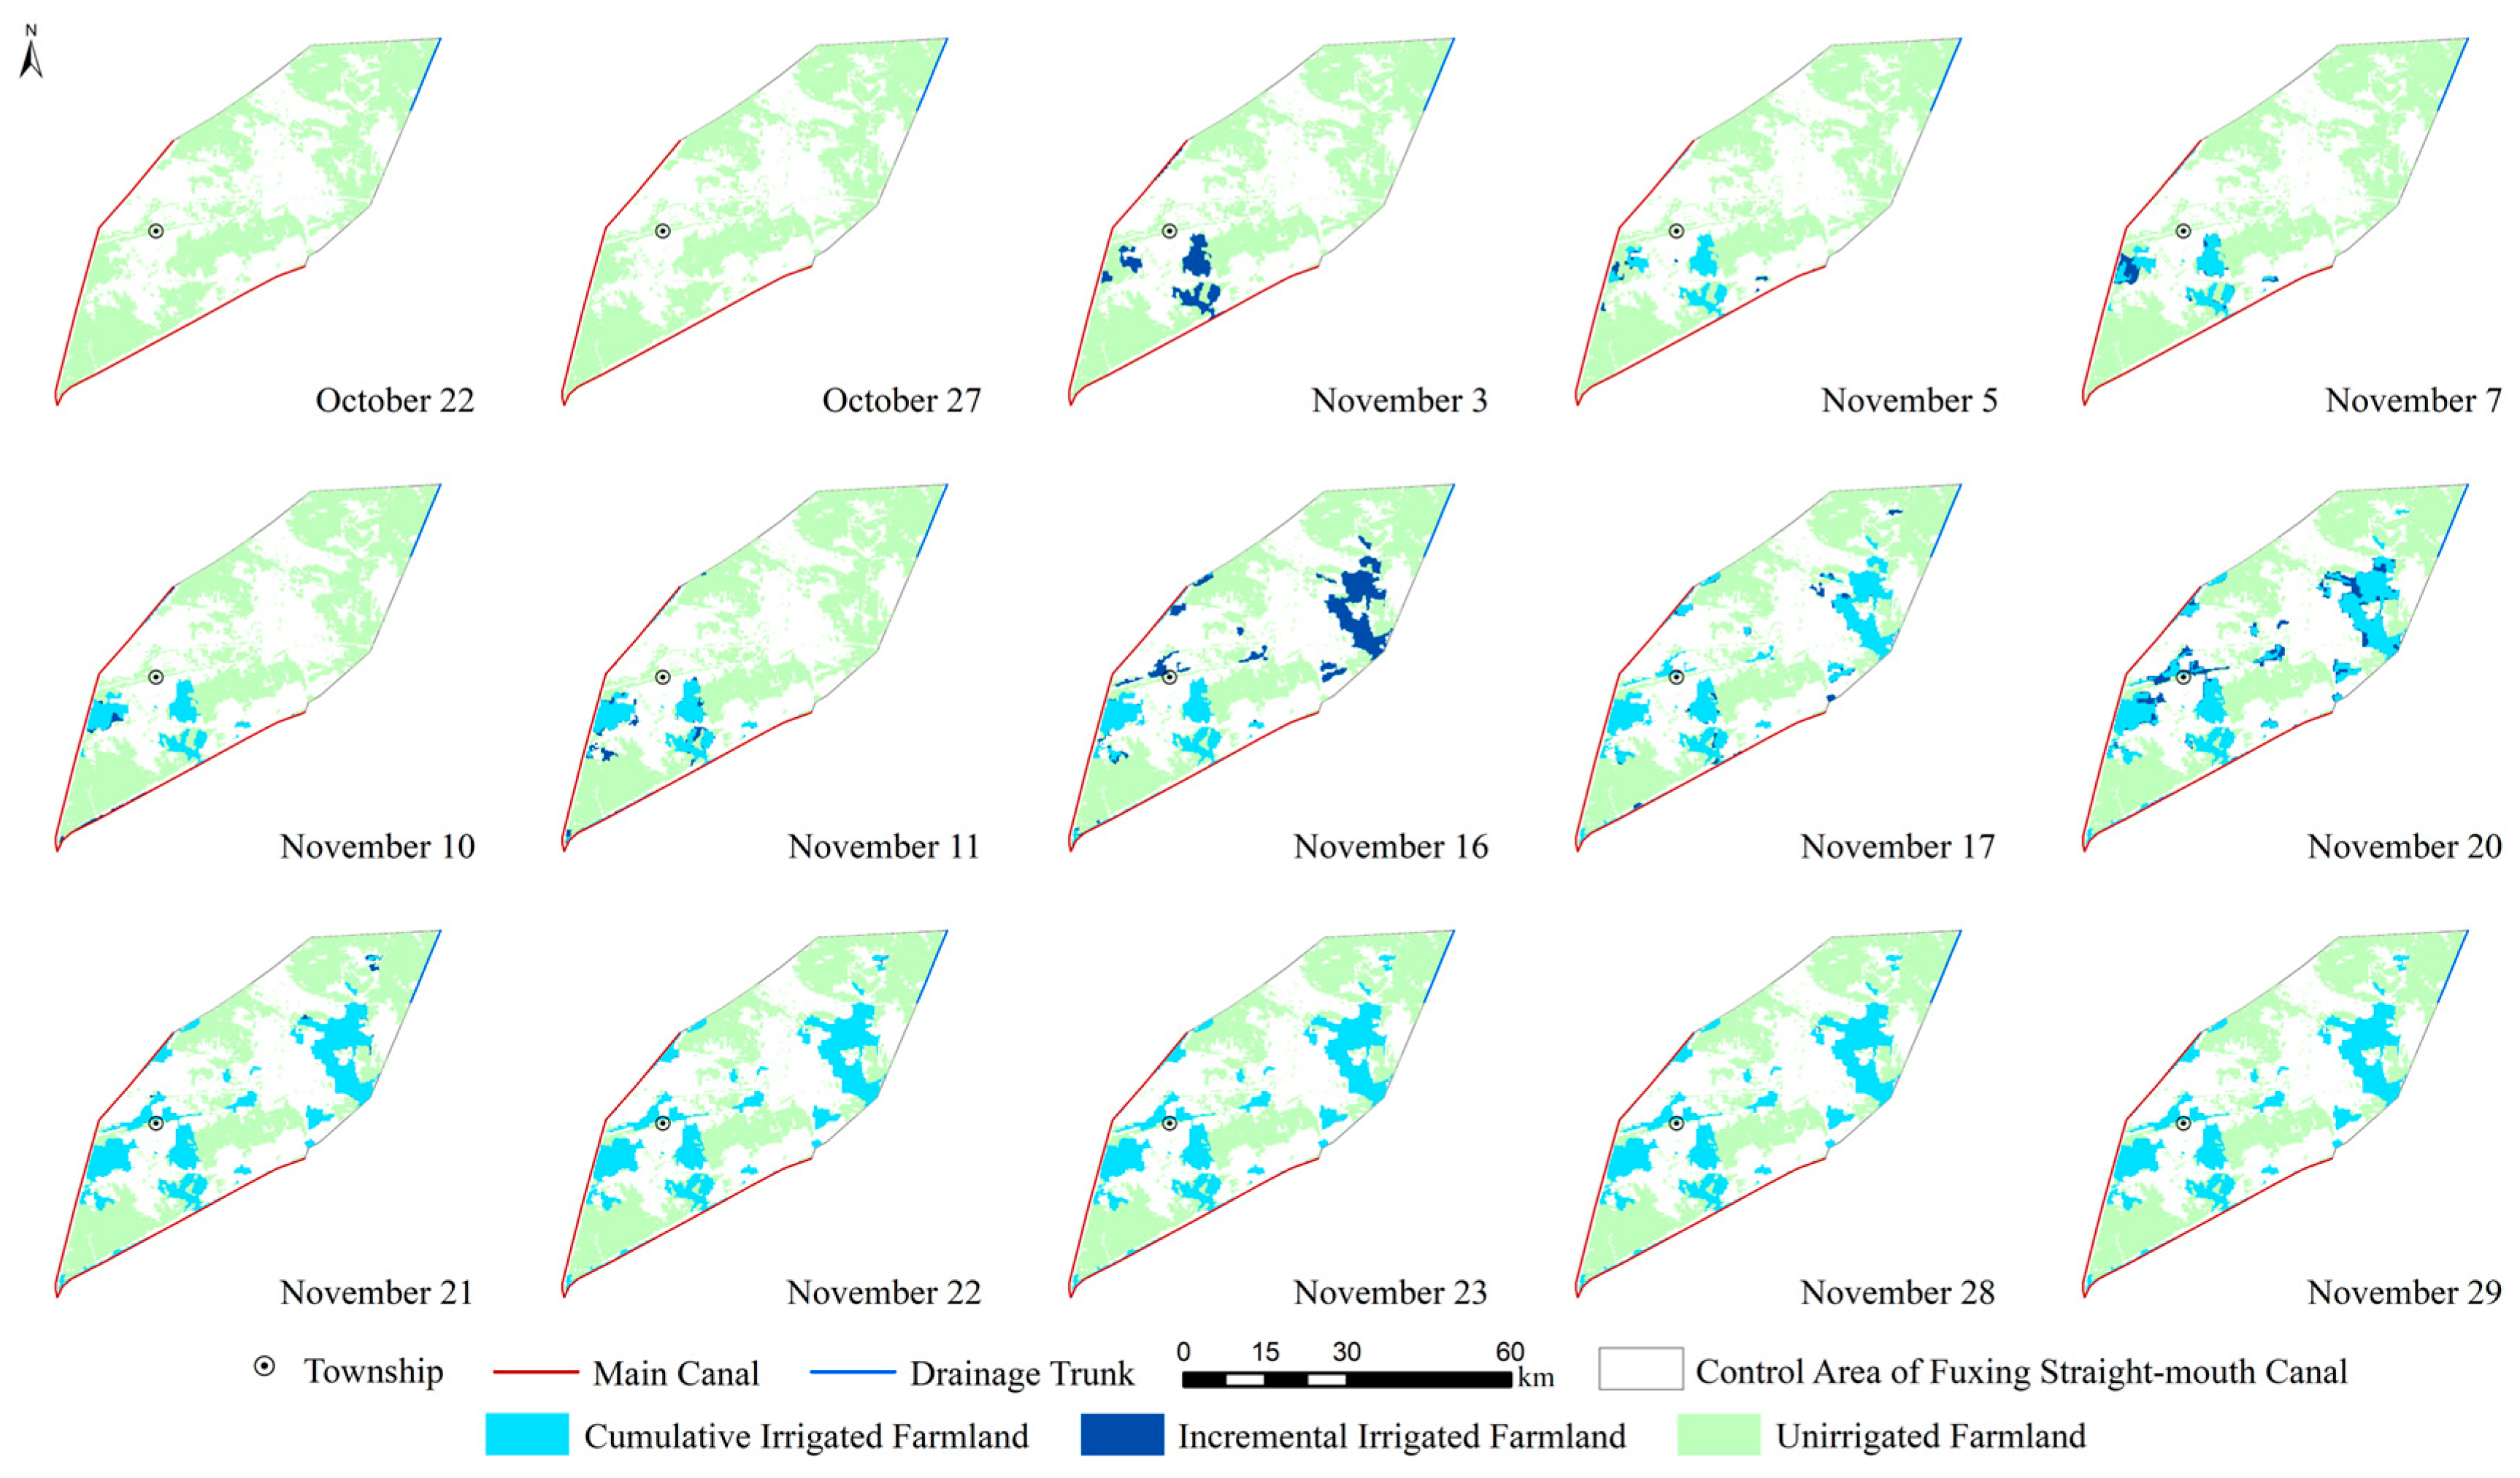
Figure 18.
Autumn irrigation progress of the Zaohuo Main Canal.
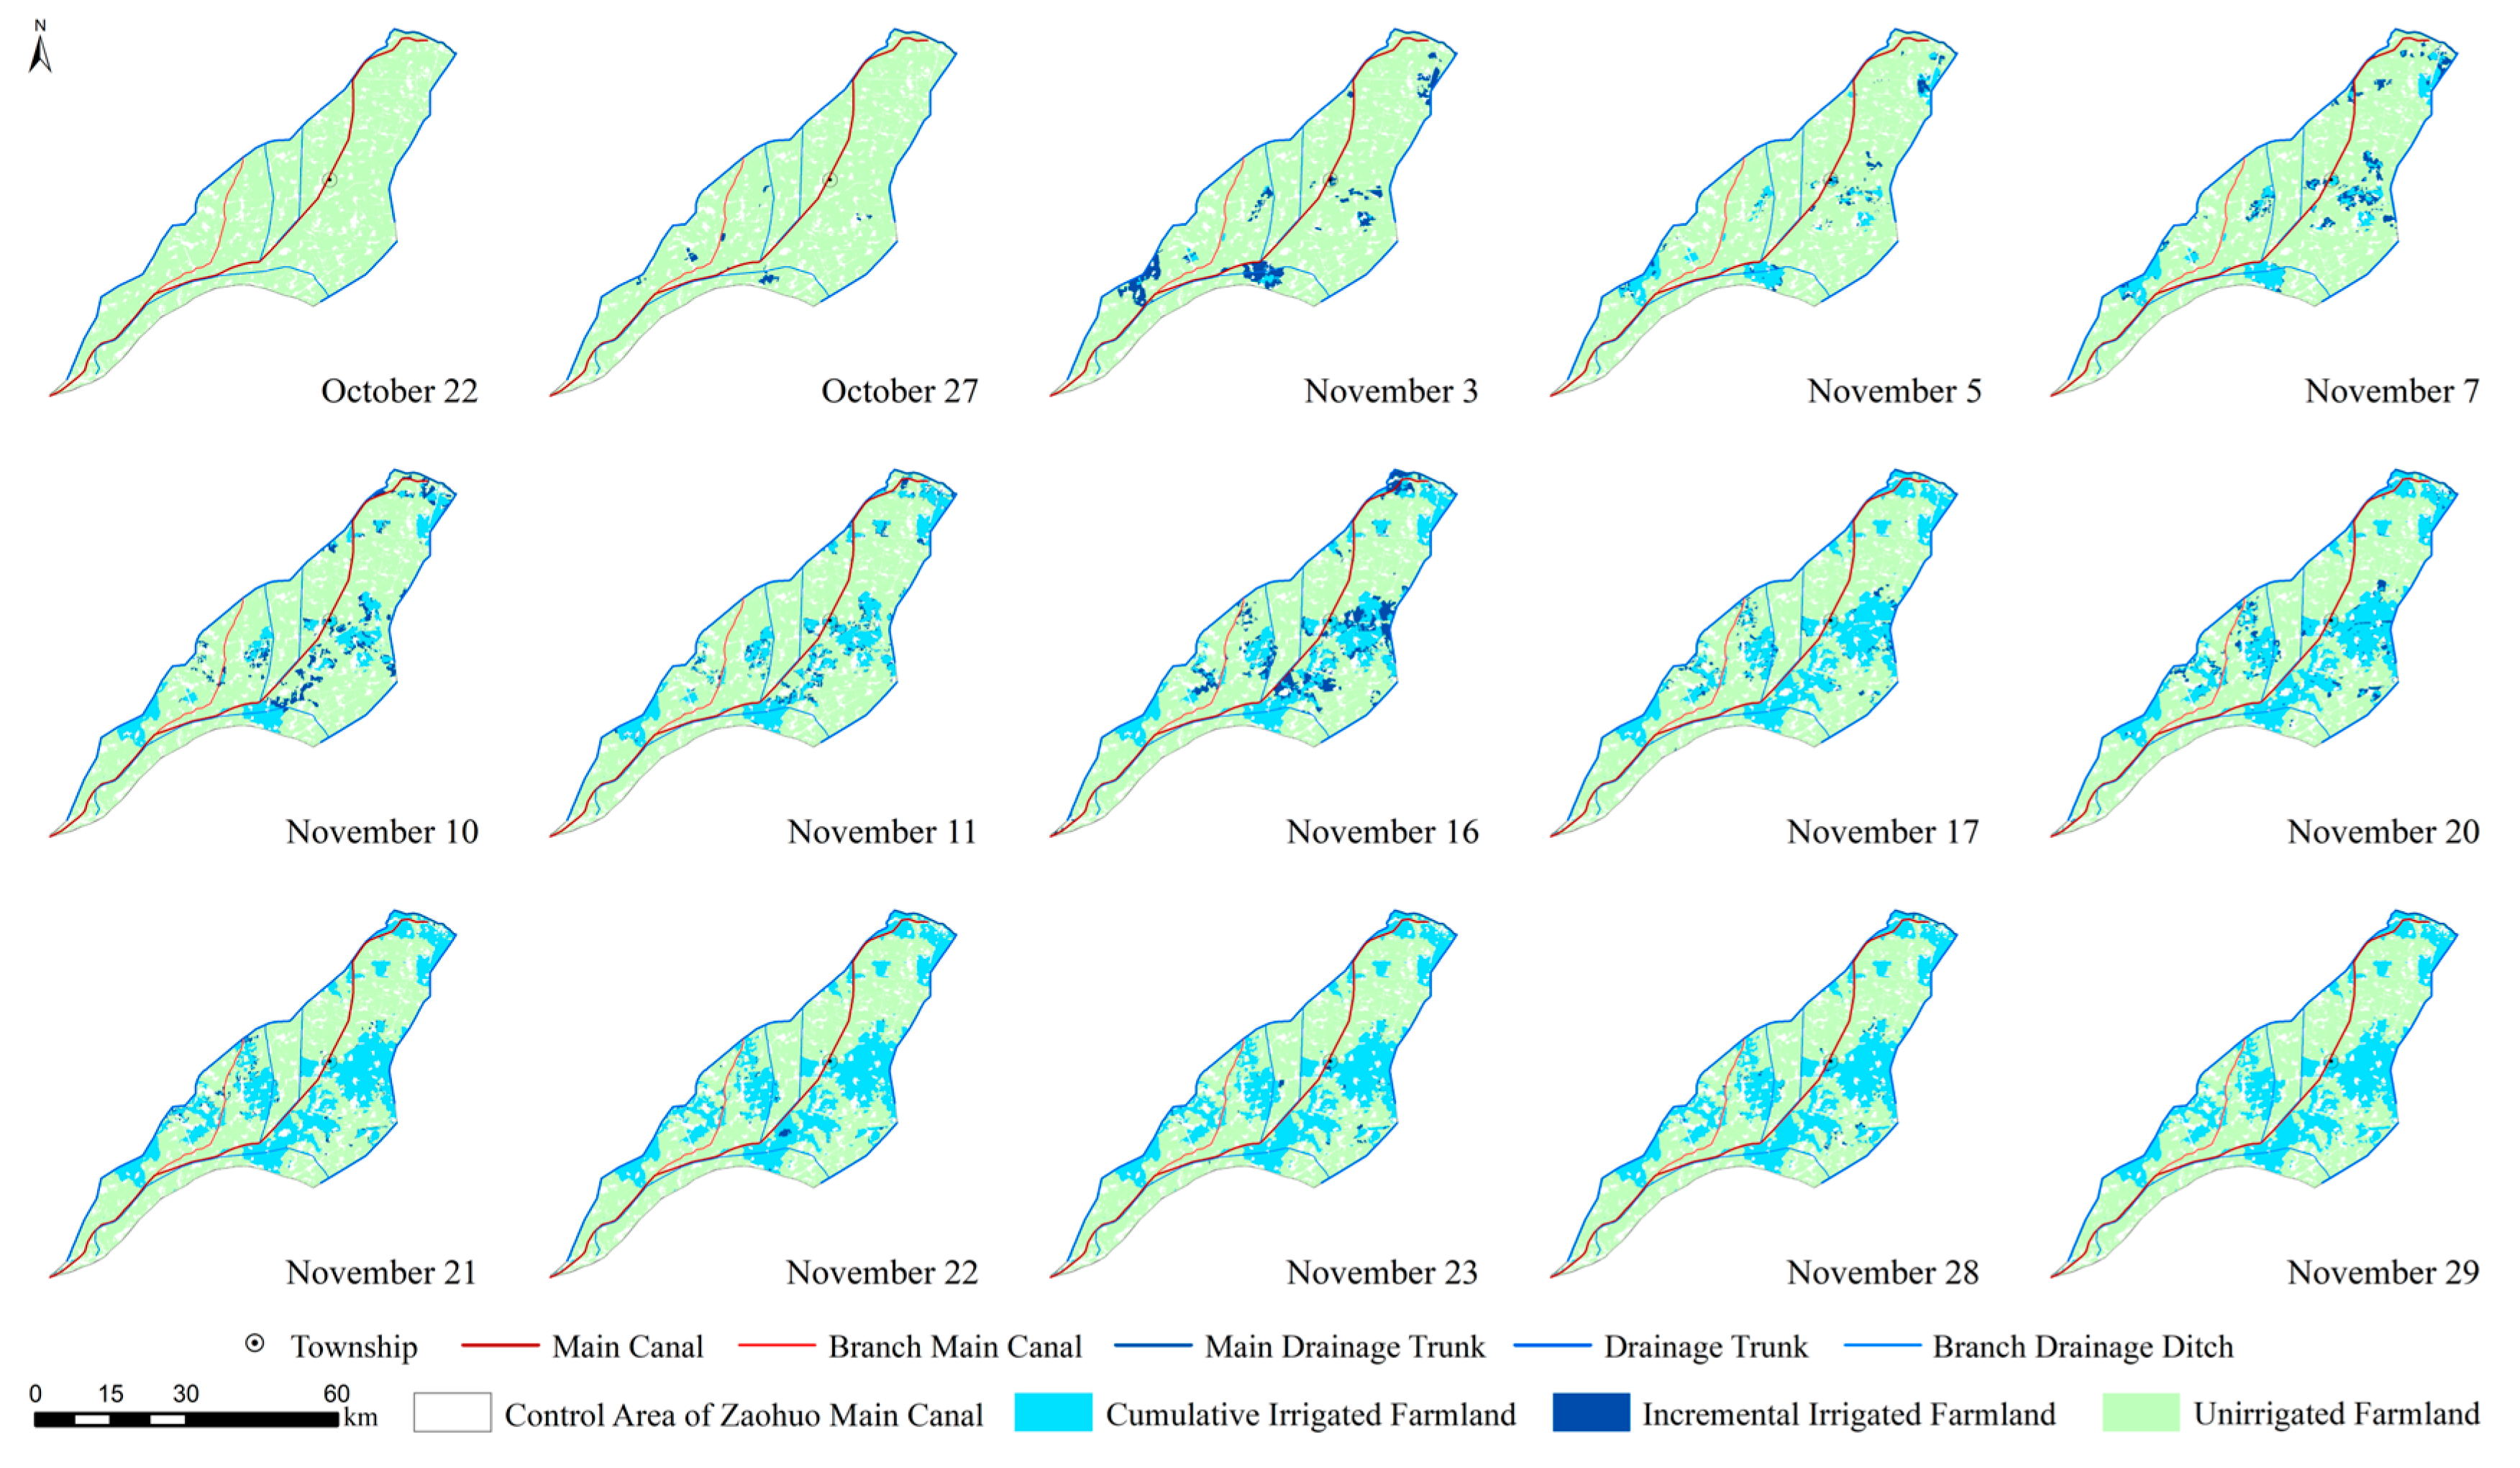
Figure 19.
Autumn irrigation progress of the Guangze Branch Main Canal.
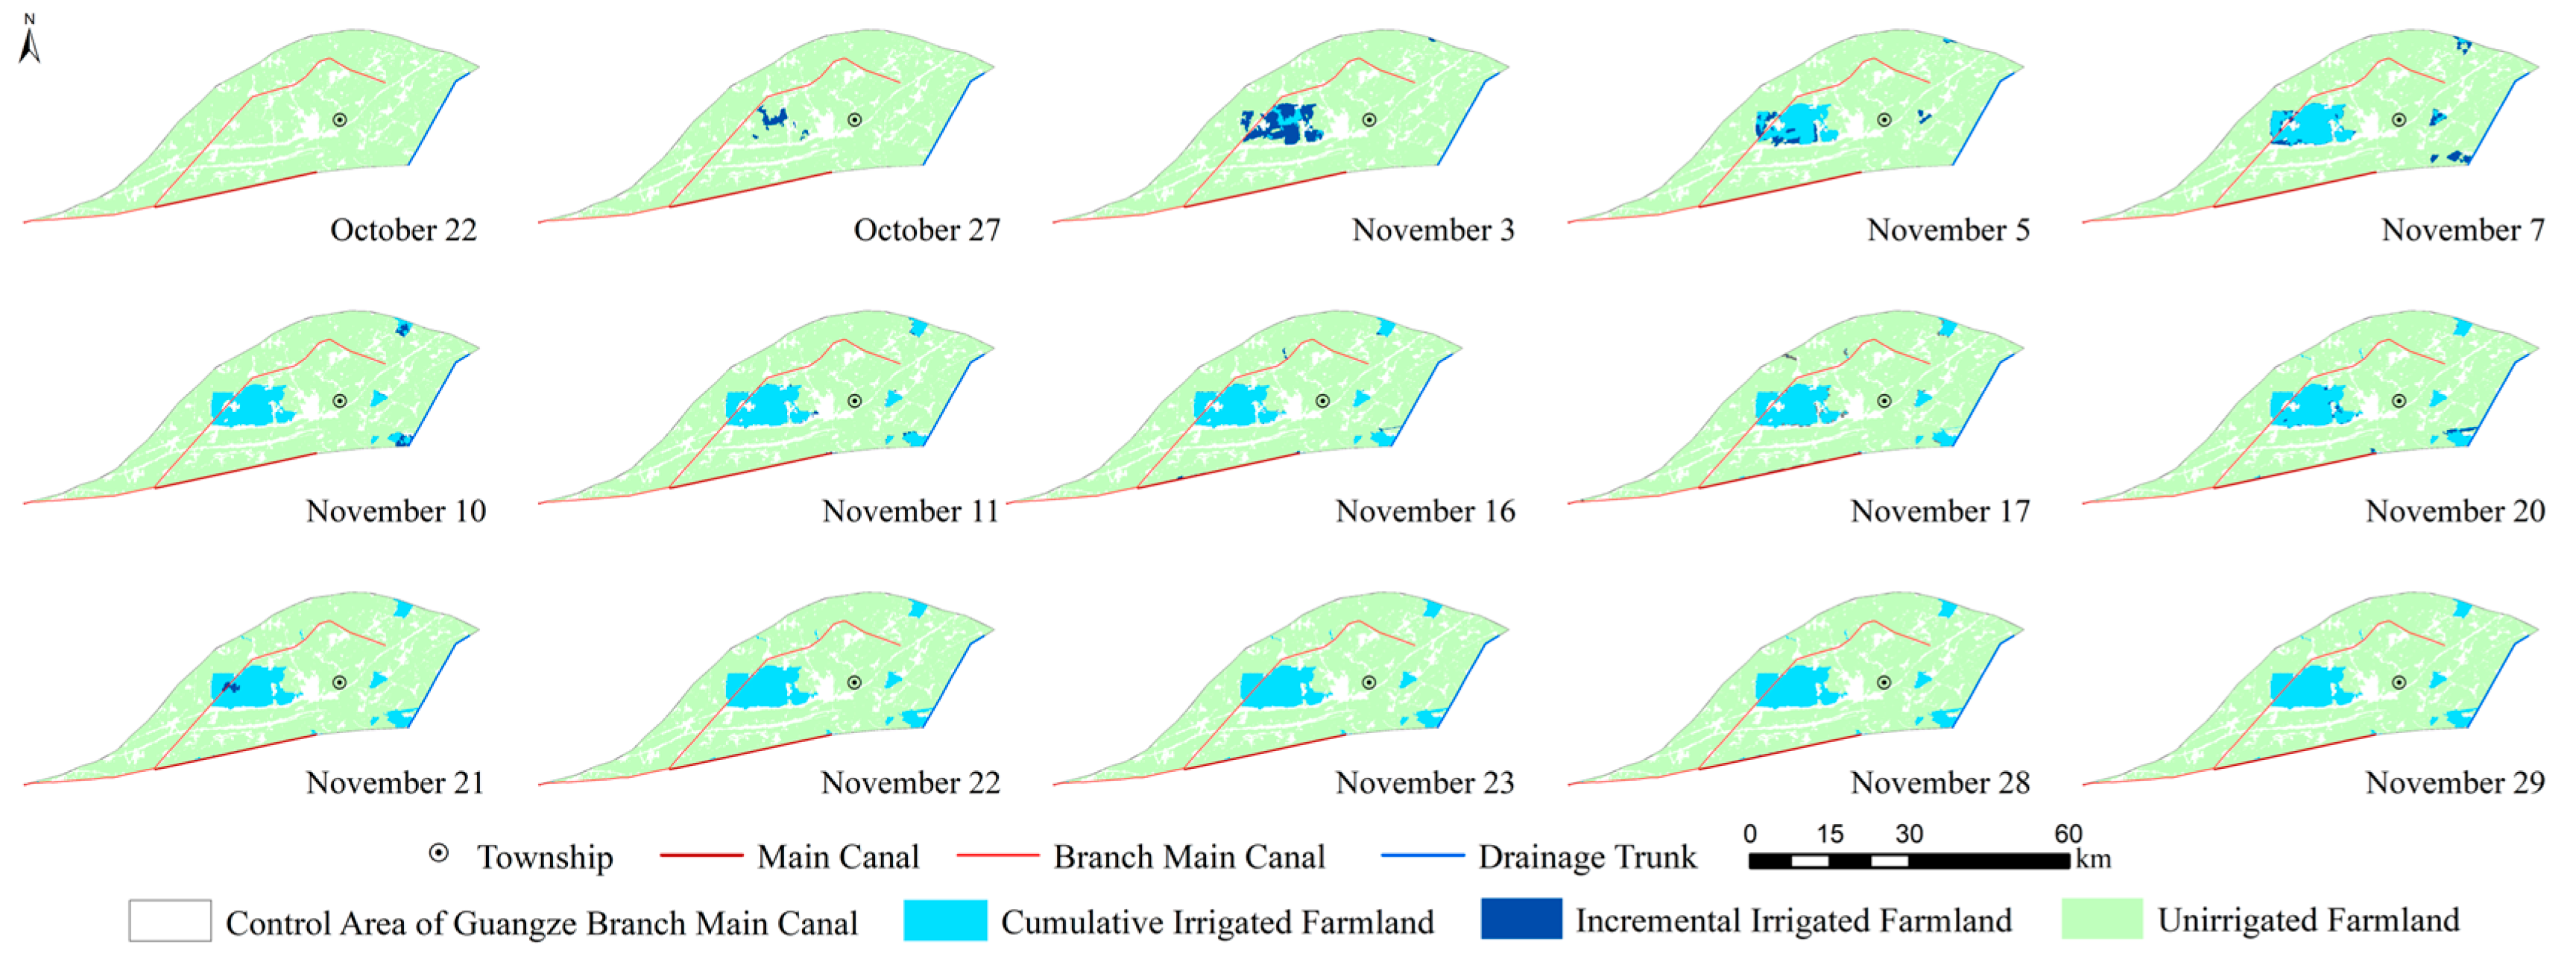
Figure 20.
Autumn irrigation progress of the Shahe Main Canal.
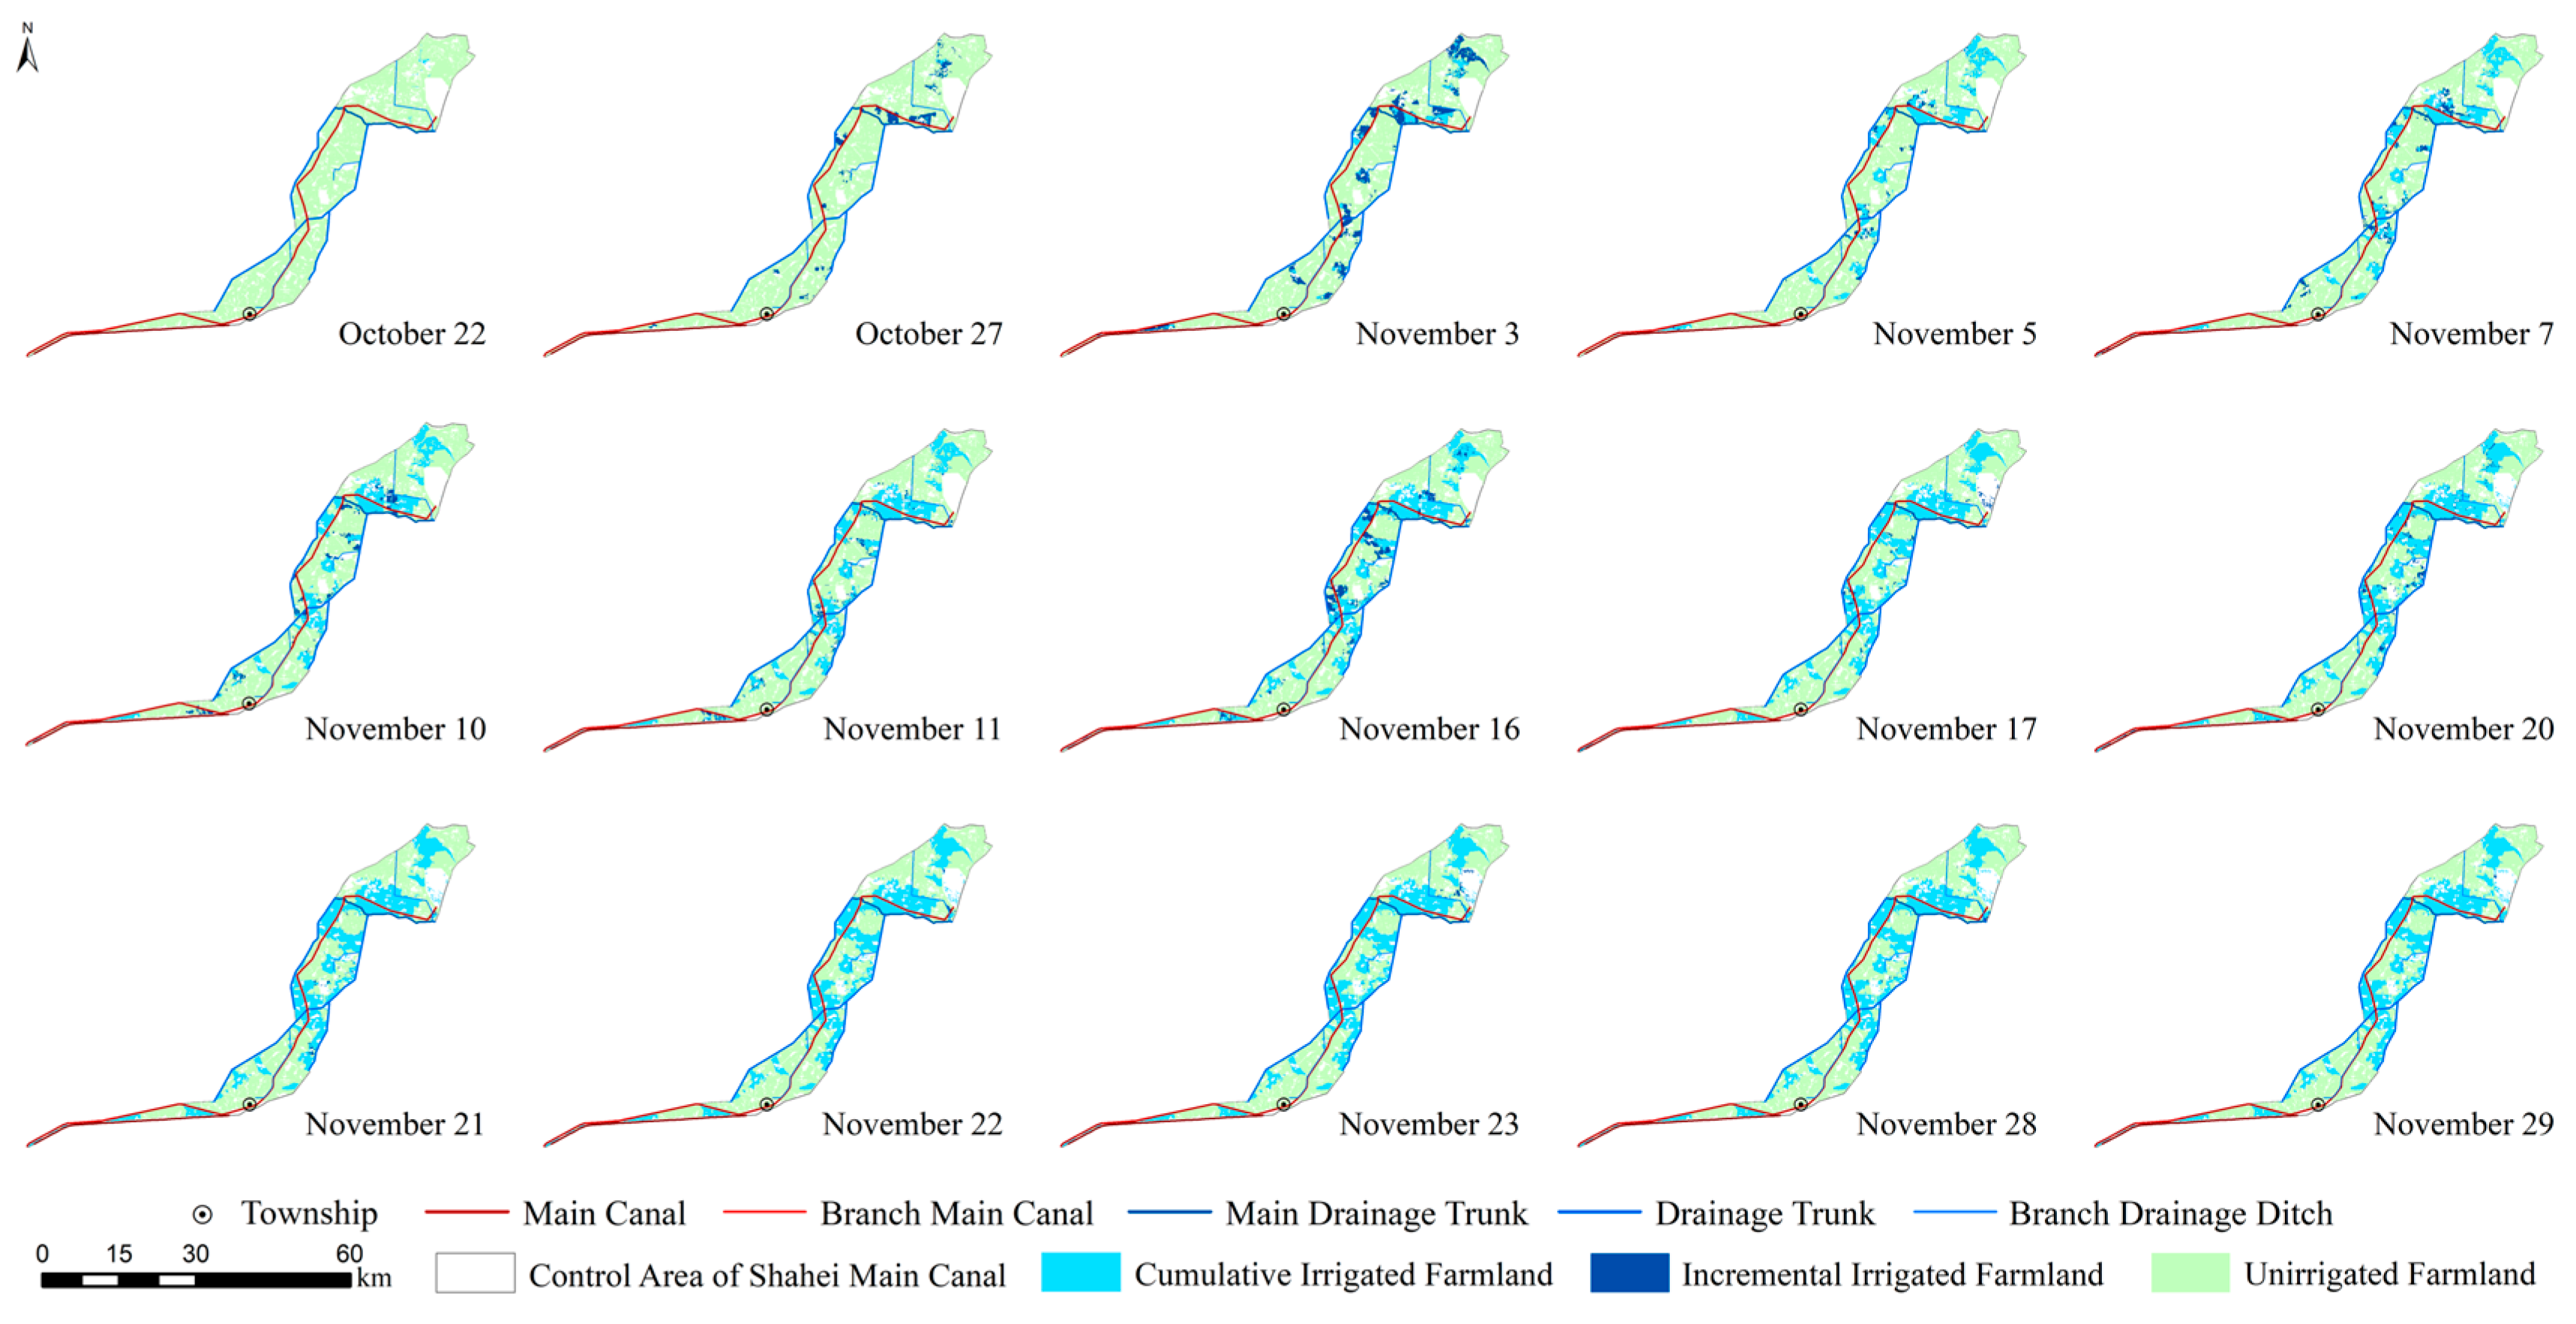
Figure 21.
Autumn irrigation progress of the Yihe Main Canal.
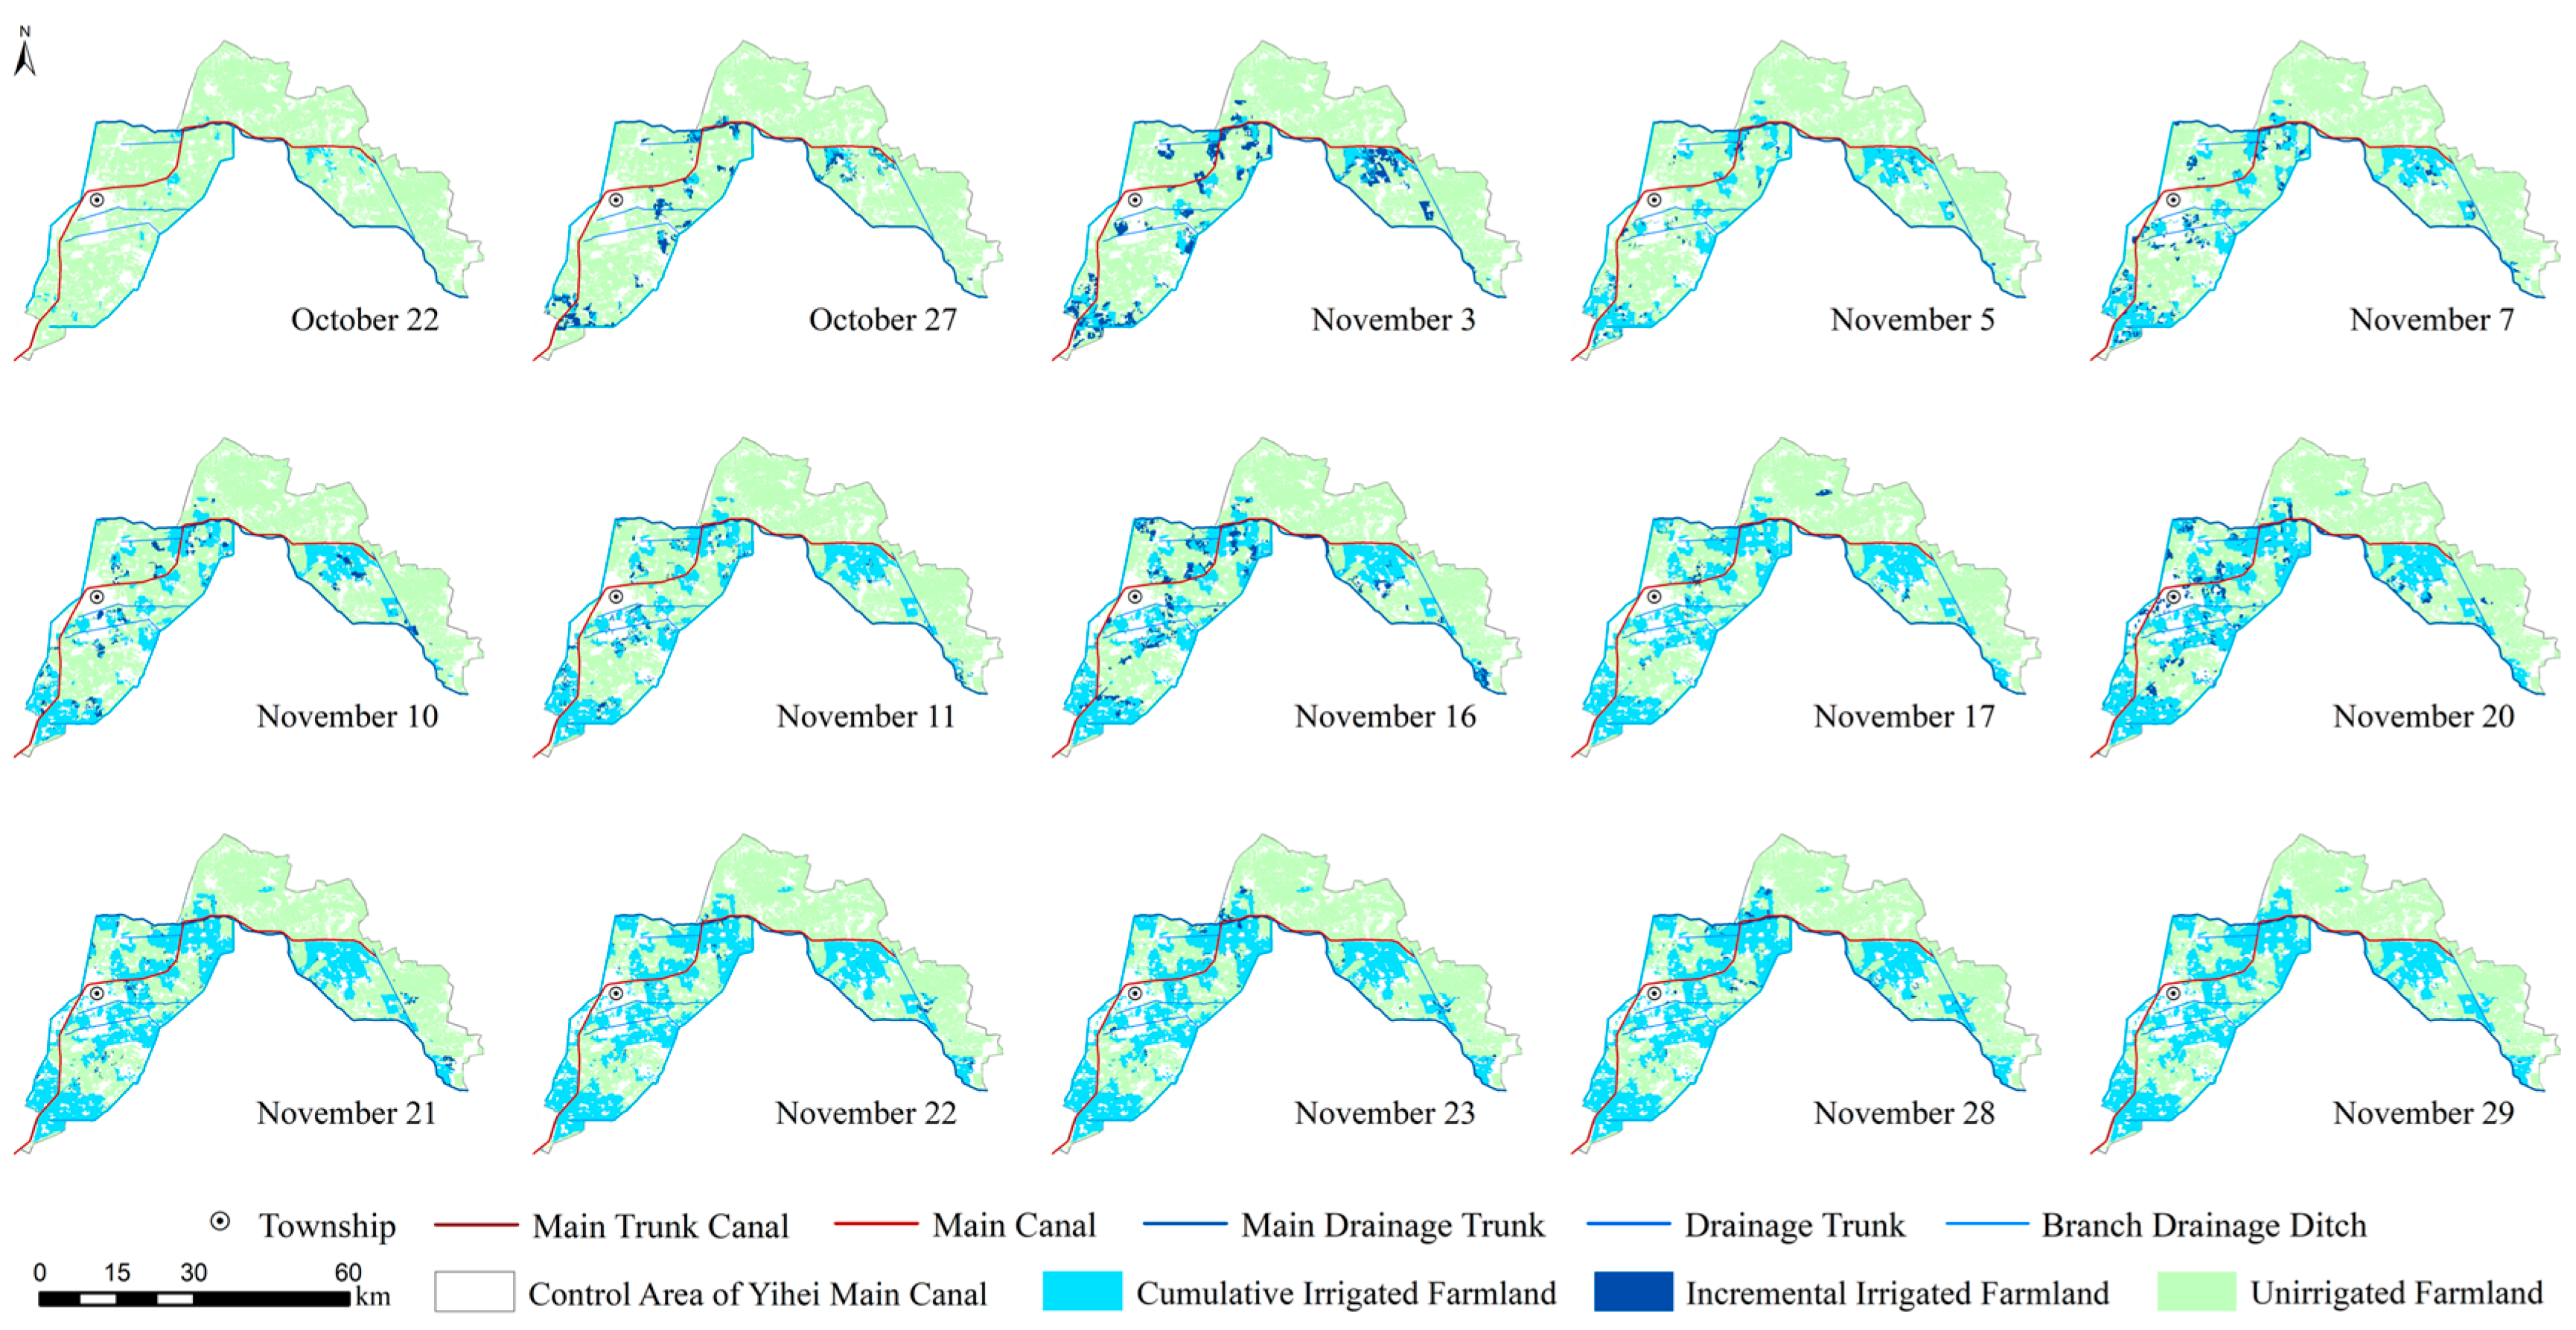
Figure 22.
Autumn irrigation progress of the Tongji Main Canal.
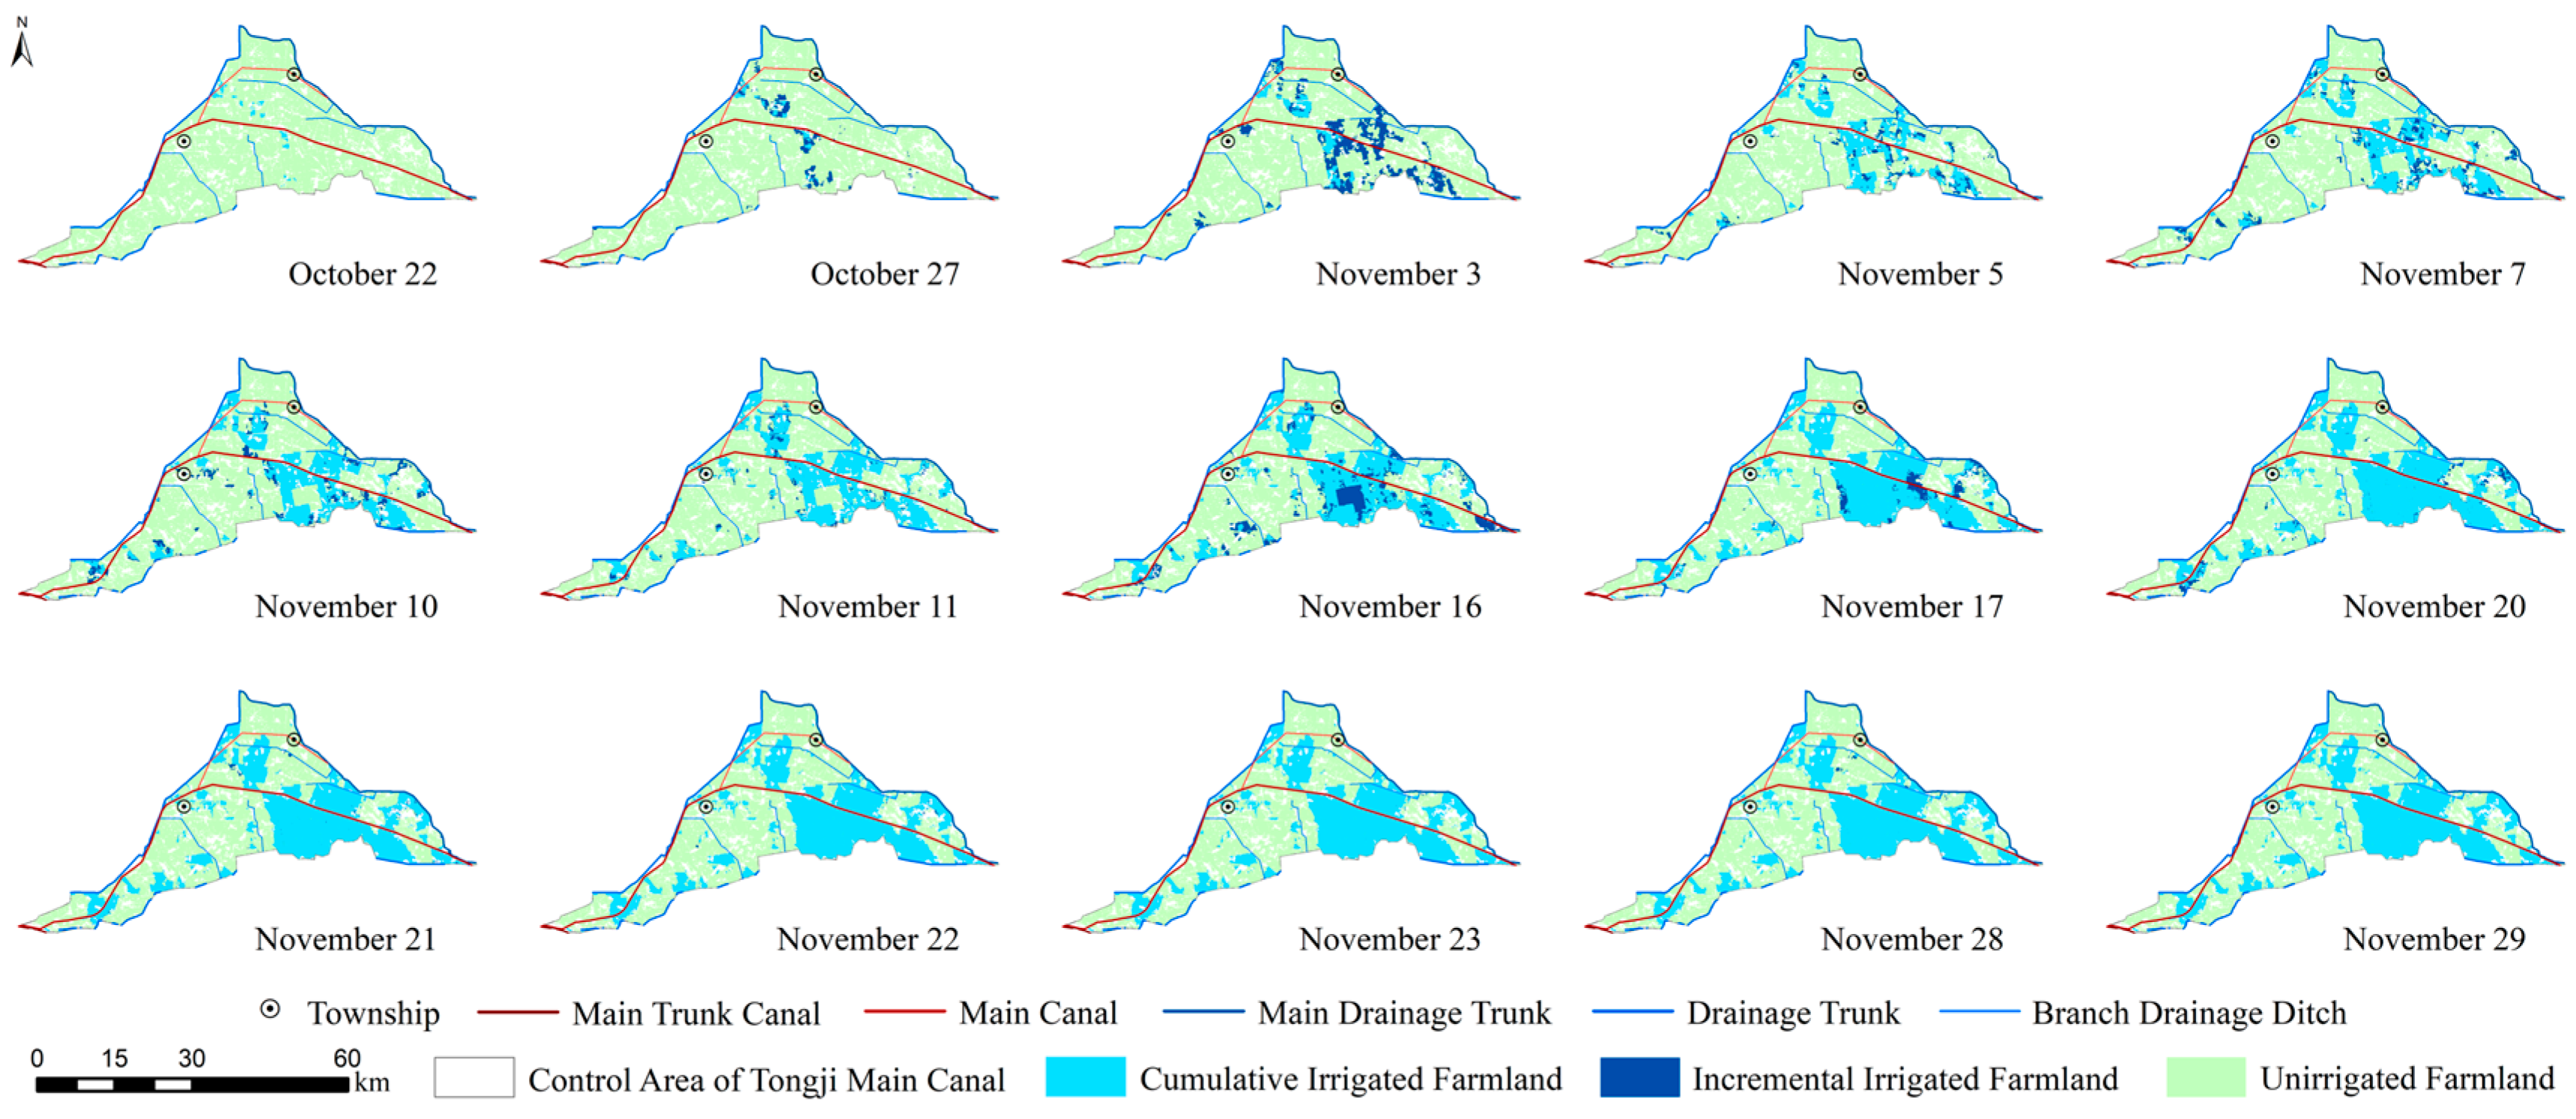
Table 1.
2024 autumn irrigation water allocation for main canals and branch main canals.
| Serial No. | Channel | Autumn Irrigation Area (km2) | Area Proportion (%) | Area Proportion (%) | Proportion of Water Volume (%) |
|---|---|---|---|---|---|
| 1 | Nansanzhi Branchi Main Cana | 3.50 | 2.89 | 0.119 | 3.16 |
| 2 | Fengji Main Canal | 29.76 | 24.55 | 0.809 | 21.54 |
| 3 | Shiba Branchi Main Canal | 11.30 | 9.32 | 0.291 | 7.75 |
| 4 | Fuxing Main Canal | 0.89 | 0.73 | 0.017 | 0.46 |
| 5 | Guangze Branch Main Canal | 1.20 | 0.99 | 0.036 | 0.95 |
| 6 | Zaohuo Main Cana | 13.00 | 10.73 | 0.393 | 10.45 |
| 7 | Shahe Main Canal | 17.80 | 14.69 | 0.614 | 16.33 |
| 8 | Yihe Main Canal | 24.16 | 19.93 | 0.835 | 22.22 |
| 9 | Sudulong Branchi Main | 1.60 | 1.32 | 0.069 | 1.85 |
| 10 | Tongji Main Cana | 21.50 | 17.74 | 0.694 | 18.46 |
| Total | 121.21 | 121.21 | 3.758 | 100.00 | |
Table 3.
Overpass dates of images during autumn irrigation in 2024.
| Serial No. | Date | Image Type | Spatial Resolution |
|---|---|---|---|
| 1 | Oct 22 | Sentinel-2 | 10m |
| 2 | Oct 27 | Sentinel-2 | 10m |
| 3 | Nov 03 | GF-1 | 16m |
| 4 | Nov 05 | GF-6 | 16m |
| 5 | Nov 07 | GF-1 | 16m |
| 6 | Nov 10 | GF-6 | 16m |
| 7 | Nov 11 | Sentinel-2 | 10m |
| 8 | Nov 16 | Sentinel-2 | 10m |
| 9 | Nov 17 | HJ-2B | 16m |
| 10 | Nov 20 | Landsat8/9 | 15m |
| 11 | Nov 21 | Sentinel-2 | 10m |
| 12 | Nov 22 | GF-6 | 16m |
| 13 | Nov 23 | GF-1 | 16m |
| 14 | Nov 28 | Landsat8/9 | 15m |
| 15 | Nov 29 | HJ-2B | 16m |
Table 4.
Soil moisture indices corresponding to multi-source optical remote sensing data.
| Image type | Soil water index | Red/NIR band soil water index | Irrigated farmland identification index range |
|---|---|---|---|
| GF1 | (B3-B4)/(B3+B4) | (BRed-BNIR)/(BRed+BNIR) | >0 |
| GF6 | (B3-B4)/(B3+B4) (B5-B4)/(B5+B4) |
(BRed-BNIR)/(BRed+BNIR) (BRed EdgeI-BRed EdgeII)/(BRed EdgeI+BRed EdgeII) |
>0 |
| HJ-2A/2B | (B3-B5)/(B3+B5) (B4-B5)/(B4+B5) |
(BRed-B NIR)/(BRed+B NIR) (BRed Edge-BNIR)/(BRed Edge+BNIR) |
>0 |
| Landsat8/9 OLI | (B4-B5)/(B4+B5) (B4-B6)/(B4+B6) (B5-B6)/(B5+B6) |
(BRed-BNIR)/(BRed+BNIR) (BRed-BRed EdgeI)/(BRed+BRed EdgeI) (BNIR-BSWIRI)/(BNIR+BSWIRI) |
>0 |
| Sentinel-2A/2B | (B5-B6)/(B5+B6) (B5-B11)/(B5+B11) (B8A-B11)/(B8A+B11) |
(BRed EdgeI-BRed Edge II)/(BRed EdgeI+BRed Edge II) (BRed EdgeI-BSWIRI)/(BRed EdgeI+BSWIRI) (BNIR II-BSWIRI)/(BNIR II+BSWIRI) |
>0 |
Table 5.
Remote sensing–based irrigation progress.
| 22 Oct | 25 Oct | 31 Oct | 5 Nov | 10 Nov | 15 Nov | 20 Nov | 25 Nov | 29 Nov | |
|---|---|---|---|---|---|---|---|---|---|
| Incremental irrigated area (km2) | 20.97 | 56.40 | 143.15 | 153.22 | 220.01 | 216.58 | 190.78 | 50.11 | 10.52 |
| Cumulative irrigated area (km2) | 20.97 | 56.40 | 199.55 | 352.76 | 572.77 | 789.35 | 980.12 | 1030.24 | 1040.76 |
Table 6.
Remote sensing–based autumn irrigation progress by irrigation unit.
| Name | Initiation | Acceleration | Stabilization | Termination |
|---|---|---|---|---|
| Yichang Irrigation Sub-district | 10/22-10/31 | 10/31-11/10 | 11/10-11/20 | 11/20-11/29 |
| Fengji Main Canal | 10/22-10/31 | 10/31-11/15 | 11/15-11/20 | 11/20-11/29 |
| Shiba Branchi Main Canal | 10/22-10/31 | 10/31-11/10 | 11/10-11/20 | 11/20-11/29 |
| Nansanzhi Branchi Main Canal | 10/22-11/5 | 11/5-11/10 | 11/10-11/20 | 11/20-11/29 |
| Fuxing Straight mouth Canal | 10/22-11/15 | 11/15 | 11/15-11/20 | 11/20-11/29 |
| Zaohuo Main Canal | 10/22-10/31 | 10/31-11/15 | 11/15-11/20 | 11/20-11/29 |
| Guangze Branch Main Canal | 10/22-10/31 | 10/31-11/5 | 11/5-11/10 | 11/10-11/29 |
| Shahe Main Canal | 10/22-10/31 | 10/31-11/10 | 11/10-11/20 | 11/20-11/29 |
| Yihe Main Canal | 10/22-10/25 | 10/25-11/20 | 11/20-11/25 | 11/25-11/29 |
| Tongji Main Canal | 10/22-10/31 | 10/31-11/10 | 11/10-11/20 | 11/20-11/29 |
Disclaimer/Publisher’s Note: The statements, opinions and data contained in all publications are solely those of the individual author(s) and contributor(s) and not of MDPI and/or the editor(s). MDPI and/or the editor(s) disclaim responsibility for any injury to people or property resulting from any ideas, methods, instructions or products referred to in the content. |
© 2026 by the authors. Licensee MDPI, Basel, Switzerland. This article is an open access article distributed under the terms and conditions of the Creative Commons Attribution (CC BY) license (http://creativecommons.org/licenses/by/4.0/).
Copyright: This open access article is published under a Creative Commons CC BY 4.0 license, which permit the free download, distribution, and reuse, provided that the author and preprint are cited in any reuse.


