Submitted:
25 February 2026
Posted:
26 February 2026
You are already at the latest version
Abstract
Maintaining forest ecosystems is critical for climate regulation, biodiversity conservation, and the socio-economic stability of agrarian societies such as Ethiopia. This study presents a spatiotemporal analysis of deforestation and its biophysical feedbacks across Ethiopia from 2001 to 2022. The methodology integrates the Hansen Global Forest Change dataset, Global Forest Watch carbon flux data, and MODIS/CHIRPS environmental products within the Google Earth Engine platform, validated by a 1,000-point accuracy assessment. Over the 22-year study period, the nation recorded a total reduction of 718,351 hectares of forest cover, peaking in 2014. The Oromia, Southern Nations, Nationalities, and Peoples' (SNNP), and Benishangul-Gumuz regions experienced the greatest extent of forest loss. In these regions, deforestation correlated positively with rapid population growth and the expansion of key agricultural commodities, specifically wheat, maize, and coffee. Topographic analysis indicates an upward altitudinal shift in deforestation, reaching a peak mean altitude of 1,924 meters and expanding onto steeper slopes. These land-cover changes coincide with spatially heterogeneous environmental shifts; in the southeastern highlands, deforestation corresponded with land surface warming, whereas in the western humid lowlands, clearing coincided with substantial increases in evapotranspiration without immediate thermal anomalies. Additionally, forest-related activities contributed approximately 222.38 million Mg of CO2 emissions, with the Oromia region identified as the primary contributor. These findings indicate that evidence-based conservation strategies, alternative energy adoption, and sustainable land management are necessary to mitigate further forest loss and ensure long-term ecological resilience.
Keywords:
deforestation
; Ethiopia
; environmental impact
; agricultural expansion
; conservation strategies
; land surface temperature
; commodity crops
1. Introduction
Between 2000 and 2018, agricultural expansion accounted for approximately 90% of global forest cover changes, establishing food production as the primary driver of terrestrial biomass depletion [1]. Over the past 8,000 years, the world has lost approximately 2.2 billion hectares of forest, which reduced global forest cover from approximately 47% to 30% of the Earth’s land area by 2015 [2]. Tropical forests have experienced the highest proportion of this loss, accounting for 58% of total deforestation, followed by boreal (27%) and temperate forests (8%) [2].
Although deforestation rates slowed globally from 7.3 million hectares per year (1990–2000) to 3.3 million hectares per year (2010–2015), the localized biophysical and climatic consequences of canopy removal remain critical threats to agrarian sustainability [3]. The drivers of global deforestation are complex and interacting; however, economic growth, population expansion, and evolving consumer preferences have rapidly increased the demand for agricultural land. With global food demand projected to rise by 50% by 2050, an estimated 70 million hectares of land may require conversion for cultivation, placing unprecedented pressure on remaining intact ecosystems [1,4].
Factors such as foreign direct investments and urban population growth accelerate deforestation trends, suggesting that targeted interventions in food systems could effectively mitigate forest loss [2]. In developing countries, particularly those lacking significant oil and natural gas reserves, agriculture is frequently the primary source of wealth, leading to rapid land-use changes and forest conversion. Beyond direct drivers such as logging and land conversion, indirect factors including weak governance, land tenure insecurity, and inadequate forest policies exacerbate deforestation [2,5].
Africa faces particularly severe deforestation challenges due to its diverse ecosystems and high levels of biodiversity. African forests, which support approximately 80% of global terrestrial species, are increasingly threatened by human activities such as logging, agricultural expansion, and urbanization [6]. In Africa, commercial agriculture is the leading driver of deforestation, followed by subsistence agriculture. However, models for deforestation in Africa suggest that factors beyond the food system also play a structural role, with political and socio-economic factors contributing significantly to forest loss [7,8].
East Africa is particularly critical for deforestation studies due to its unique ecological characteristics and rapid environmental changes. Tropical montane forests in East Africa, which provide vital ecological and socio-economic benefits, are facing increasing pressure from deforestation. Estimates of deforestation rates in East Africa vary, with annual rates ranging from 0.4% to 3% [9]. Agriculture, encompassing both smallholder and commercial scales, is the primary driver of forest loss in the region, followed by the demand for fuelwood, which places substantial pressure on forest resources [10].
In Ethiopia, deforestation is a growing concern due to the country’s exceptional ecological diversity and complex socio-economic dynamics. Ethiopia is endowed with fertile land, a favorable climate, and significant biodiversity; however, these resources are often underutilized or mismanaged [11]. Ethiopian forests, ranging from lowland dry forests to highland montane systems, provide essential ecological services such as water regulation and biodiversity support. Nonetheless, the expansion of agricultural land is the primary driver of deforestation across many regions. Studies in districts such as Adami Tulu Jido Kombolcha have identified agricultural land expansion as the major cause of deforestation, driven by both smallholder farming and large-scale agriculture. Charcoal production, poverty, unemployment, and weak enforcement of forest laws have also been identified as significant drivers [12].
The conversion of forests to agricultural land, combined with population pressure, rapid urbanization, and climate change, has led to severe environmental degradation, threatening the country’s natural resources and sustainability [13]. The environmental consequences of deforestation in Ethiopia are far-reaching and include biodiversity loss, soil erosion, and the disruption of local hydrological systems. Forests provide critical hydrological services by regulating water cycles and stabilizing local climates. When forests are lost, these functions are impaired, leading to negative environmental impacts such as increased flooding, droughts, and soil degradation [14]. In Ethiopia, deforestation also contributes to the depletion of vital resources such as fuelwood and building materials, exacerbating socio-economic challenges for local communities. The loss of forest cover accelerates soil erosion, further degrading agricultural land and reducing crop yields [11,12].
The effects of deforestation in Ethiopia are closely linked to broader regional patterns, as similar challenges are faced by neighboring countries in East Africa, which complicates efforts for regional conservation and sustainability. Despite extensive research on global deforestation patterns, significant gaps remain in understanding deforestation processes at the regional level, especially in data-scarce regions such as Ethiopia. Existing global deforestation datasets are often too broad and lack the spatial and thematic resolution required for local-scale decision-making by policymakers [15]. This study aims to address these gaps by providing a detailed, high-resolution analysis of deforestation patterns and environmental impacts in Ethiopia from 2001 to 2022. By utilizing satellite data from Google Earth Engine and the Hansen Global Forest Change dataset, this research examines spatial deforestation patterns, identifies deforestation hotspots, and assesses the environmental consequences of forest loss. The research also explores the relationship between deforestation and key biophysical factors such as altitude and slope, providing necessary insights for local and regional forest management policies. This study informs targeted conservation strategies, sustainable land management practices, and policies addressing the root causes of deforestation, thereby supporting efforts to mitigate environmental degradation and enhance forest conservation in the region.
2. Materials and Methods
2.1. Study Area
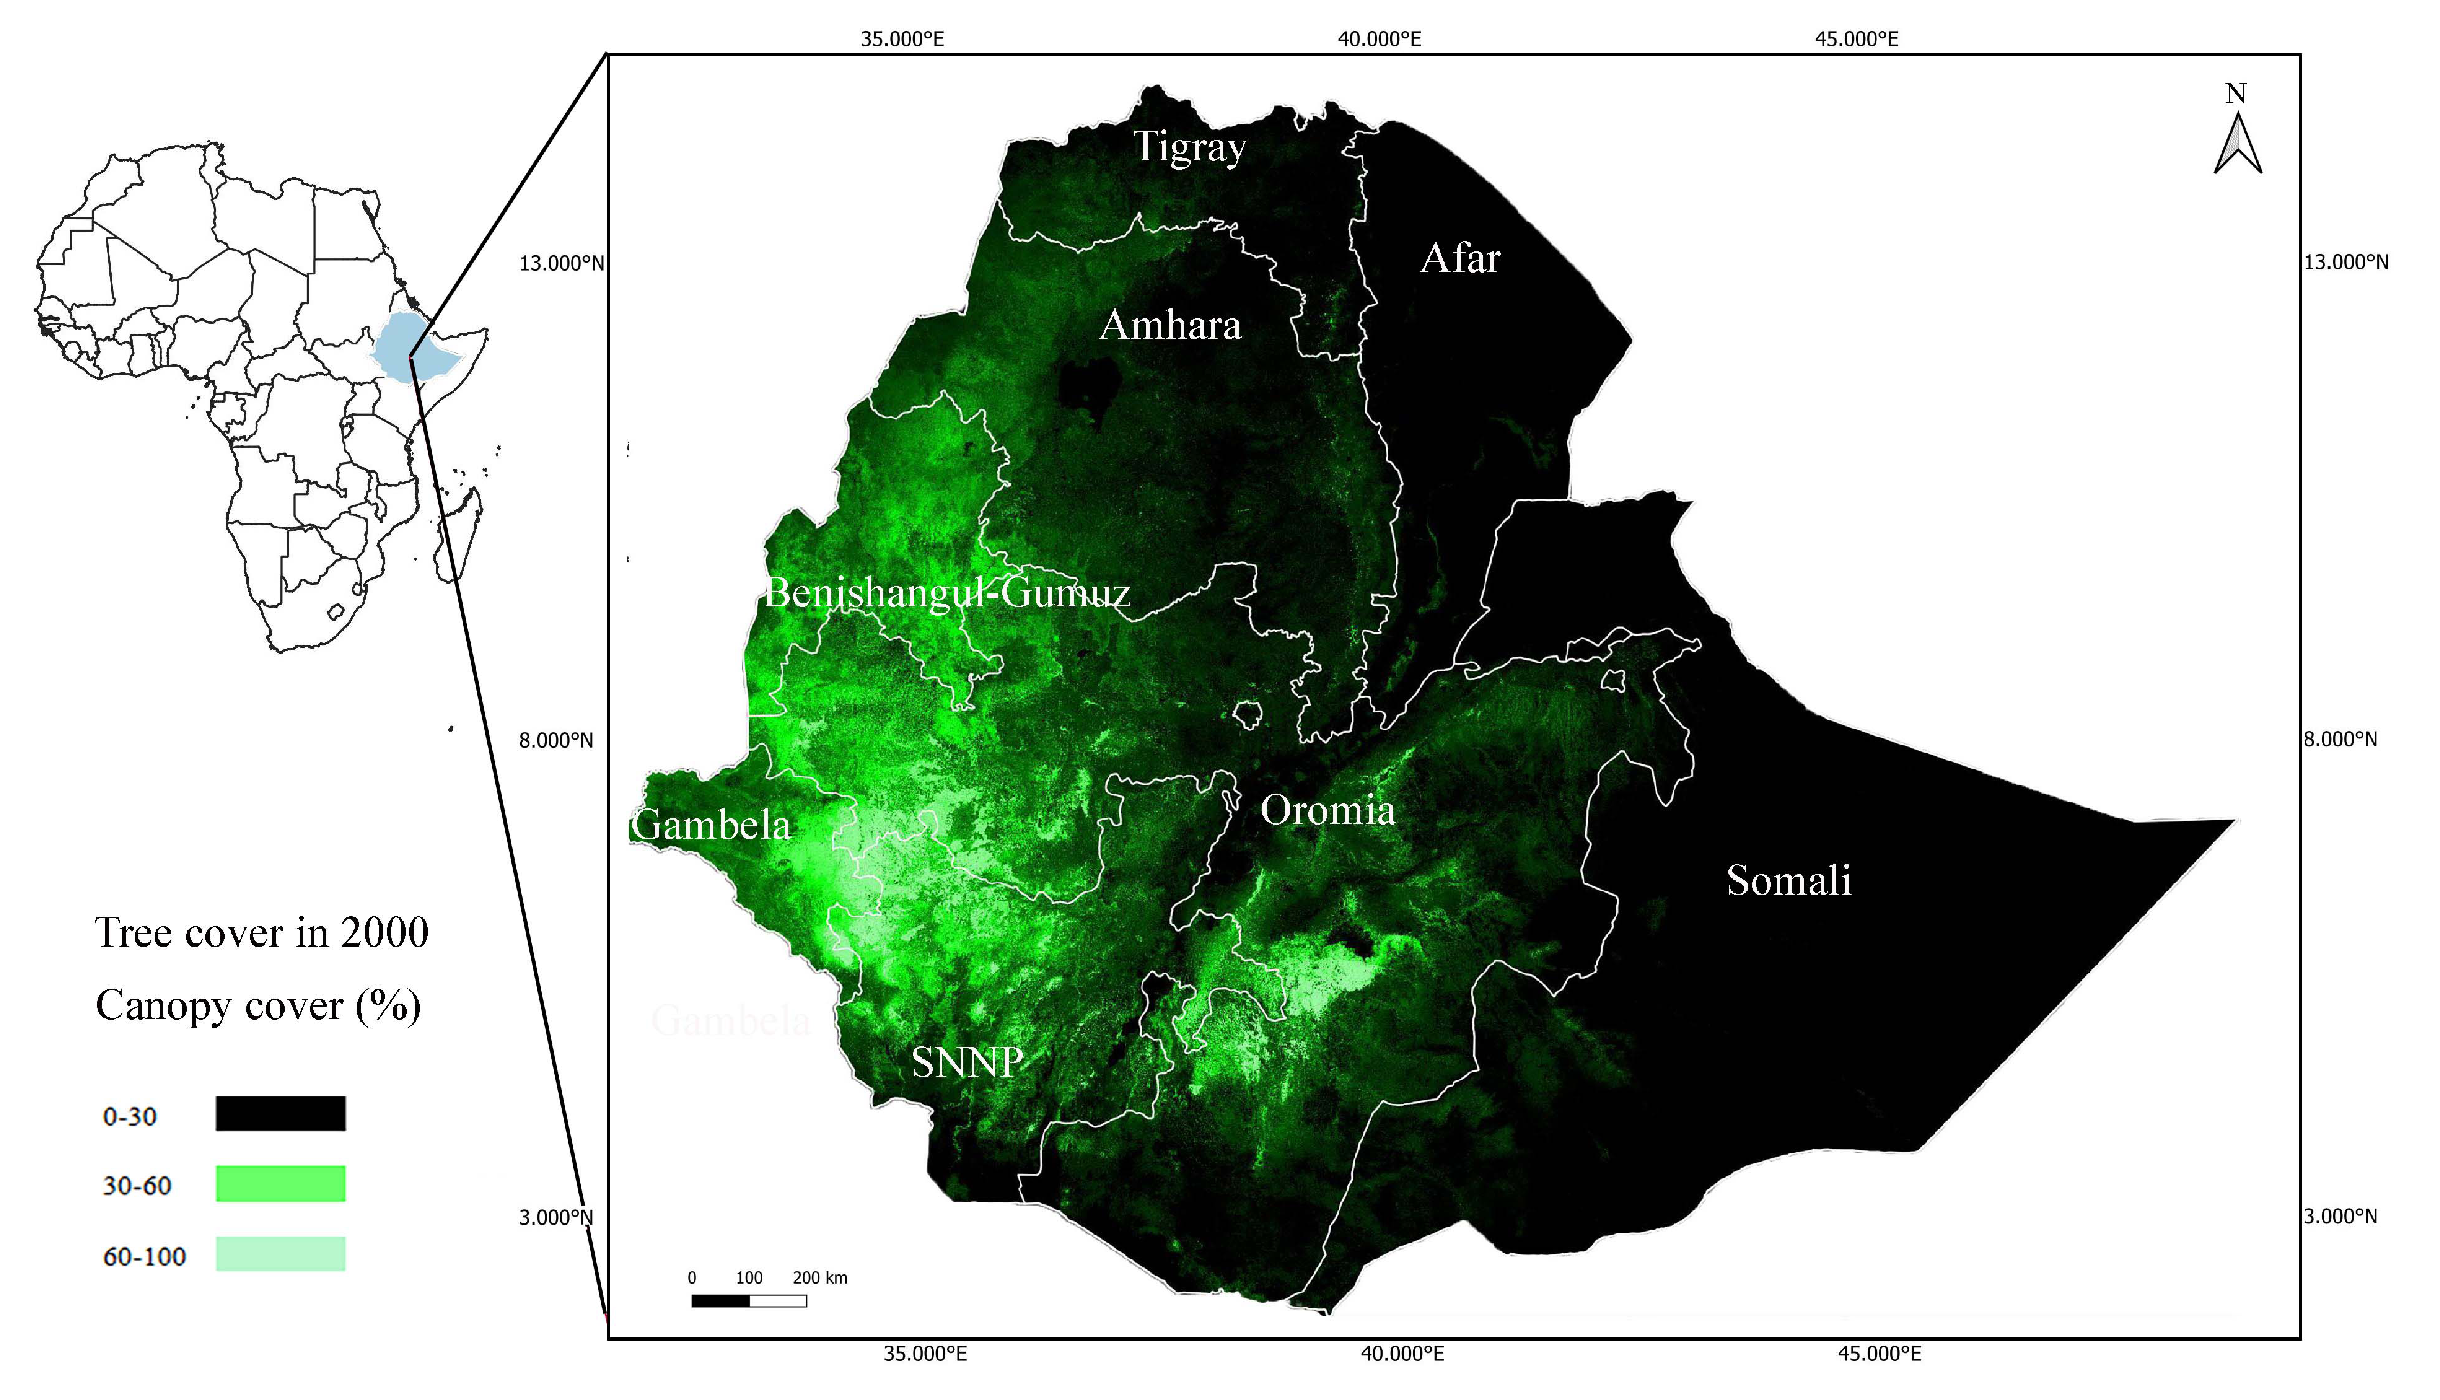
Ethiopia, located in the northeastern part of Africa, is a country characterized by diverse landscapes, rich biodiversity, and unique environmental features. Spanning approximately 3° to 15° N latitude and 33° to 48° E longitude, Ethiopia shares borders with Sudan, South Sudan, Kenya, Somalia, Eritrea, and Djibouti. The country’s varied geography includes highlands, plateaus, and lowland areas. The Ethiopian Highlands, forming the largest continuous mountain range in Africa, cover a significant portion of the country’s land area. This mountainous region is known for its peaks, deep valleys, and extensive network of rivers and streams.
The diverse topography of Ethiopia contributes to its varied climate patterns. The country experiences a range of climatic conditions, from tropical climates in lowland areas to cooler temperatures at higher altitudes. The climate is influenced by factors such as altitude, proximity to the equator, and the presence of different weather systems. The Ethiopian highlands exhibit a temperate climate with cooler temperatures and higher precipitation compared to the lowland regions. Ethiopia is also recognized for its significant ecological importance, housing numerous unique and endemic plant and animal species. It boasts a remarkable level of biodiversity, including diverse ecosystems such as montane forests, savannas, wetlands, and deserts. These ecosystems support a wide array of wildlife, including rare and endangered species such as the Ethiopian wolf, Gelada baboon, and various bird species.
Figure 1.
Ethiopia’s tree cover area in the year 2000.
2.2. Data Processing and Analysis
This study utilized the Google Earth Engine (GEE) cloud-based platform for planetary-scale geospatial analysis to process and analyze all datasets [16]. GEE’s extensive data catalog and parallel processing capabilities enabled an efficient examination of forest cover dynamics and associated environmental shifts across Ethiopia for the period 2001–2022 [17]. A suite of remote sensing and administrative datasets was integrated for the analysis (Table 1). All raster datasets were clipped to Ethiopia’s national boundary using the FAO Global Administrative Unit Layers (GAUL) dataset prior to analysis. A methodological workflow was implemented to integrate these diverse datasets (Figure 2).
Forest loss was derived from the Hansen Global Forest Change dataset [18], a product generated from cloud-free Landsat observations. Forest-related CO2 emissions were quantified using the Global Forest Watch (GFW) Greenhouse Gas Emissions dataset, which provides gross carbon emissions resulting from stand-replacing forest disturbances. This dataset employs a carbon flux model [20] to estimate the transfer of carbon from forest biomass to the atmosphere during deforestation events. For environmental variables, standard MODIS (MOD11A1) and CHIRPS products were utilized. To mitigate the impact of atmospheric interference, particularly in highland regions, low-quality observations were filtered using the provider’s inherent Quality Assessment (QA) bands during the generation of annual composites.
The analytical workflow utilized a combination of spatial, temporal, and statistical approaches [16]. First, annual forest loss was calculated using the Hansen dataset, where "forest" was defined as any pixel with 30% tree canopy cover in the year 2000 [23]. The lossyear band was used to generate annual binary masks, isolating all pixels that experienced deforestation in a given year. An essential step in the analysis involved overlaying this loss data with the FAO administrative boundaries to conduct district-level analyses [18]. This process was essential for identifying the districts experiencing the greatest extent of forest loss, thereby facilitating targeted assessments of environmental impacts in those specific hotspot areas.
To investigate environmental shifts, the annual forest loss masks were used to extract corresponding data from the environmental and topographic datasets. Annual mean composites were calculated from the daily (LST, CHIRPS) and 8-day (ET) source imagery [24], while a slope layer was derived from the SRTM Digital Elevation Model. This process yielded a time-series of the mean elevation, slope, LST, precipitation, and ET for the specific pixels that were deforested in each year.
Finally, to quantify the relationships between deforestation and the observed environmental shifts, Pearson’s correlation coefficients (r) were calculated [16]. This statistical analysis determined the strength and direction of the linear relationship between the time-series of annual forest loss and the corresponding time-series of each environmental variable. This multi-faceted approach provided robust evidence of the interconnectedness of forest loss with carbon emissions, hydrological shifts, and thermal dynamics [25]. National-level socio-economic and agricultural data were integrated into the workflow. Annual time-series for population growth and the harvested areas of major commodities (wheat, maize, and coffee) were obtained from the World Bank [22] and FAOSTAT [19]. Pearson’s correlation coefficients (r) were then calculated to quantify the relationships between annual forest loss and national socio-economic drivers as well as localized environmental shifts.
2.3. Accuracy Assessment
To validate the suitability of the primary deforestation dataset and correct for temporal lag in satellite detection, an accuracy assessment was conducted utilizing the updated Hansen dataset version (v1.12) alongside a strict valid-forest mask [18]. A stratified random sampling methodology was employed to select 1,000 reference points (500 mapped as forest loss, 500 mapped as stable forest). Each point was visually interpreted by an analyst using a multi-temporal sequence of high-resolution satellite imagery available in Google Earth Pro. This included baseline imagery from Landsat (1999) to confirm pre-disturbance forest cover and recent post-disturbance imagery to confirm the transition to a non-forested state [27].
The validation yielded an overall accuracy of 78.7% and a Kappa coefficient of 0.57 (Table 2). The user’s accuracy for the forest loss category was 84.4%, confirming the high reliability of the identified deforestation hotspots. The producer’s accuracy of 75.8% reflects the typical challenges of capturing fine-scale smallholder agricultural expansion in complex, mountainous terrain, as well as minor temporal lag effects [28].
3. Results
3.1. Temporal and Topographic Trends of Deforestation
The analysis of forest cover in Ethiopia from 2001 to 2022 documented a total reduction of 718,351.19 hectares. The annual extent of loss exhibited considerable temporal fluctuation; the highest recorded loss occurred in 2014, corresponding to a reduction of 56,702 hectares in a single year (Figure 3).
Topographic characteristics of these deforested areas demonstrated a progressive shift into higher and steeper terrain over time (Figure 4). The average elevation of areas experiencing deforestation rose from approximately 1,625 meters in 2001 to a peak of 1,924 meters in 2020. This shift translates to an altitudinal encroachment rate of approximately 15 meters per year. Concurrently, the average slope of deforested lands exhibited a parallel upward trend, increasing steadily from 2009 and culminating in a peak average slope of approximately 12 degrees in 2020.
3.2. Regional Deforestation Patterns and Carbon Emissions
Distinct spatial variations in deforestation were observed across Ethiopia’s regional states, with the southwestern blocks bearing the majority of the forest loss (Figure 5A). The Oromia region recorded the highest cumulative forest cover loss, totaling 353,006.80 hectares (49.1% of the national total), with a peak loss year in 2012. The Southern Nations, Nationalities, and Peoples’ (SNNP) region ranked second, with a cumulative loss of 188,311.90 hectares (26.2% of the national total). The Benishangul-Gumuz region ranked third with a cumulative loss of 77,716.28 hectares, followed by the Amhara region (50,931.61 hectares), which experienced a severe clearing spike in 2014. Deforestation in the northern and eastern lowlands (Tigray, Somali, Afar) was comparatively lower.
The total forest-related CO2 emissions for the study period amounted to approximately 222.38 million Mg. A temporal decoupling was observed between the areal extent of deforestation and carbon emissions: while the national areal extent of forest loss peaked in 2014, the estimated carbon emissions peaked earlier in 2012 at approximately 19.74 million Mg (Figure 5B). Regionally, Oromia was the primary absolute contributor, with emissions peaking in 2012 at 10.49 million Mg, mirroring a simultaneous emissions peak in the SNNP region.
3.3. Identification of National Socio-Economic Correlates
Pearson correlation analysis identified significant statistical relationships between socio-economic factors and annual forest cover loss (Table 3). Wheat harvested area () and maize harvested area () exhibited the strongest positive correlations with national forest depletion. The variance in wheat harvested area mathematically accounts for approximately 52% () of the variance in national deforestation rates.
Ethiopia’s national population increased by 86.05% during the study period, demonstrating a robust correlation () with forest loss. An observed 201.10% increase in coffee harvested area was also significantly correlated with forest clearing (). A moderate, positive correlation was found between national population growth and the upward topographic shift of deforestation into higher elevations ().
3.4. Localized Environmental Associations
To assess localized environmental shifts, data was extracted for four high-deforestation zones representing two distinct geographic and climatic regimes: the southeastern highlands (Bale and Guji) and the western/southwestern humid midlands (Bench Maji and Metekel) (Figure 6).
In the southeastern highland zones, cumulative forest loss exhibited a significant positive correlation with daytime Land Surface Temperatures (LST). Guji displayed a strong thermal correlation (), and Bale demonstrated a moderate positive correlation (). Evapotranspiration (ET) in Guji showed no statistical relationship with forest loss (), while precipitation exhibited a weak positive correlation ().
In the western and southwestern humid lowland zones, Bench Maji maintained a relatively stable thermal profile relative to forest loss (), while Metekel indicated a moderate inverse correlation with LST (). In these zones, cumulative forest loss was positively correlated with ET in both Metekel () and Bench Maji (). The increased ET in Metekel was moderately correlated with increased localized precipitation events ().
4. Discussion
4.1. Drivers of Temporal and Spatial Trends and the Carbon Paradox
Ethiopia’s deforestation trajectory indicates that demographic growth and agricultural demand jointly influence forest loss. The strong positive correlation between national forest loss and wheat harvested area () identifies cereal expansion as a primary macro-level correlate of forest conversion [19,29]. This relationship is structurally tied to Ethiopia’s 86.05% population expansion during the study period, which created unprecedented pressures on land systems to deliver staple food commodities [22].
The temporal decoupling of forest areal loss (peaking in 2014) from carbon emissions (peaking in 2012) presents a critical biophysical paradox. This pattern suggests that forests cleared after 2012 contained lower biomass. The 2012 emissions peak, driven predominantly by the Oromia and SNNP regions, aligns with the systematic clearing of dense, old-growth, high-biomass montane forests, which release disproportionately high volumes of stored carbon upon conversion [20]. By 2014, although the absolute acreage of cleared land reached its maximum—heavily influenced by an expansion spike in the Amhara region—the relative carbon footprint was lower. This indicates that the deforestation frontier had shifted toward lower-biomass dry woodlands and highly fragmented secondary forests.
4.2. Topographic Marginalization and Land Scarcity
The demonstrable altitudinal shift in deforestation documented in this analysis supports the land scarcity hypothesis. The aggregate upward progression of deforestation—averaging an altitudinal shift of approximately 15 meters per year—accompanied by encroachment onto steeper slopes (exceeding 12° by 2020), indicates an exhaustion of accessible agricultural frontiers. While this shift occurs in opportunistic pulses rather than a uniform spatial march, Overall, deforestation increasingly occurs in higher elevation areas.
This topographic transition carries immediate implications for environmental sustainability. High-altitude environments are characterized by steep slopes and fragile soils; their conversion renders them highly susceptible to erosion and accelerates watershed degradation [34]. The spatial bias identified during the accuracy assessment—where omission errors (missed deforestation) occurred at significantly lower elevations (mean 1,376 m) than correctly identified loss (mean 1,566 m)—suggests that global satellite algorithms struggle to detect smallholder disturbances in highly fragmented, lower-elevation dry forest ecotones. Consequently, early-stage frontier degradation in the lower midlands may be systematically underreported by global datasets.
4.3. Localized Environmental Feedbacks: A Biophysical Divergence
By isolating the environmental data across distinct climatic zones, this study reveals that the biophysical consequences associated with deforestation in Ethiopia are highly dependent on baseline climatology. In the southeastern highland zones (Guji and Bale), the removal of the protective montane canopy was strongly associated with localized thermal anomalies. While background global climate change undeniably contributes to baseline warming, the distinct spatial correlation between cumulative pixel-level canopy loss and localized LST increases ( in Guji) isolates the microclimatic forcing of deforestation. In these cooler environments, the sudden loss of shade and alteration in surface albedo leads to an immediate increase in sensible heat flux, a phenomenon well-documented in broader tropical and subtropical biophysical studies [46,47].
In contrast, the western humid lowland zones (Bench Maji and Metekel) exhibited an entirely different feedback loop. Despite extensive canopy removal, LST remained stable or slightly cooled ( in Metekel), while evapotranspiration () and local precipitation () increased. This divergence suggests that the specific post-deforestation land use dictates the microclimatic response. In the western midlands, the conversion of humid forests to dense, irrigated commercial agriculture or rapid secondary understory growth appears to sustain localized moisture recycling loops [14]. The rapid transpiration from new agricultural canopies effectively buffers the thermal spikes that would otherwise occur. Therefore, climate mitigation models cannot treat Ethiopian deforestation uniformly; interventions must be tailored to the specific hydrological and thermal responses of the local ecosystem.
4.4. Commodity Chains and Regional Vulnerability
Agricultural expansion in Ethiopia exhibits regional specialization reflecting market dynamics. Maize expansion () functions as a widespread agent of initial frontier conversion driven by domestic food security needs [33]. In contrast, the dramatic 201.1% increase in coffee harvested area () coincides with deforestation specifically in the southwestern Oromia and SNNP biodiversity hotspots [30]. While maize expansion is a survival imperative, coffee expansion is driven by export-oriented revenue generation, demonstrating that both subsistence needs and commercialization independently generate powerful incentives for forest clearing [37].
4.5. Strategic Conflicts: The CRGE Framework and Food Security
Ethiopia’s Climate Resilient Green Economy (CRGE) strategy explicitly commits to reducing emissions from deforestation [39]. However, the sustained forest loss documented well into the CRGE implementation period highlights a structural policy-reality gap. This gap is fundamentally driven by endemic food insecurity [41]. The CRGE’s emphasis on agricultural intensification requires capital and technology that remain inaccessible to most Ethiopian smallholders [8]. Under conditions of capital scarcity, land abundance functions as a substitute for technological intensity; farmers expand horizontally across remaining forest areas because clearing land remains economically viable compared to purchasing agricultural inputs [44]. Until policies adequately address the underlying rural livelihood crisis and provide accessible intensification technologies, forest protection mandates will continually conflict with the immediate survival logic of agrarian communities [45].
4.6. Methodological Limitations
While this study provides a robust macro-level assessment, certain remote sensing uncertainties must be acknowledged. Correlating national socio-economic data with spatial deforestation introduces a risk of ecological fallacy, indicating broad alignment rather than localized causation [48]. Additionally, there is an inherent spatial scale mismatch when analyzing high-resolution (30-meter) forest loss against coarser environmental products (1-km LST, -km precipitation), meaning sub-pixel microclimatic anomalies may be diluted, a challenge compounded by persistent cloud contamination in optical MODIS data [49].the Hansen dataset relies on a structural canopy threshold that struggles to differentiate primary forests from Ethiopia’s dense shade-grown coffee agroforestry. Because the algorithm is calibrated primarily for stand-replacing disturbances, gradual degradation from local fuelwood collection remains largely undetected, suggesting the documented areal loss serves as a conservative baseline. Finally, applying global carbon flux models to heterogeneous East African woodlands necessitates interpreting emission values as relative temporal trends rather than exact inventories [20,50].
5. Conclusions
This study analyzes spatial and temporal patterns of forest loss in Ethiopia from 2001 to 2022, revealing a total documented loss of 718,351 hectares. The integration of geospatial analysis with national-level socio-economic data demonstrates that deforestation is not an isolated environmental event but is fundamentally associated with a relationship between demographic pressure and agricultural expansion. The findings identify population growth and the horizontal expansion of staple crops as the primary national correlates of forest clearing. The 201.10% increase in coffee harvested area highlights the significant role of export-oriented commodities in coinciding with land-use conversion in Ethiopia’s southwestern hotspots.
A central finding of this research is the topographic marginalization of forest loss (Figure 4). As lowland agricultural frontiers were exhausted, deforestation shifted toward higher altitudes and steeper slopes. This shift poses a severe threat to Ethiopia’s highland water towers and drastically increases the risk of soil erosion and land degradation. Localized consequences of this loss are biophysically dependent; southeastern highland zones (e.g., Guji, Bale) exhibited significant land surface warming, whereas western humid lowland zones (e.g., Metekel) experienced heavily altered evapotranspiration cycles without immediate thermal spikes (Figure 6). These environmental shifts confirm that the removal of forest cover destabilizes regional microclimates and reduces ecological resilience in geographically specific ways. The persistence of forest loss despite the implementation of the Climate Resilient Green Economy (CRGE) strategy underscores a structural policy-implementation gap driven by the food security needs of a growing population. For policy interventions to be successful, Ethiopia must aggressively transition from horizontal land expansion to sustainable agricultural intensification. Future conservation strategies should prioritize protecting high-altitude forest fragments and providing smallholder farmers with the resources necessary to increase yields on existing farmland. This approach is essential to balance Ethiopia’s economic development goals with the urgent need for forest conservation and climate mitigation.
Supplementary Materials
The following supporting information can be downloaded at the website of this paper posted on Preprints.org.
Author Contributions
Saad Muse: Methodology, Data curation, Formal analysis, Visualization, Writing original draft. Weifeng Wang: Conceptualization, Supervision, review and editing.
Funding
The authors received no financial support for the research, authorship, and/or publication of this article.
Data Availability Statement
The datasets generated and analyzed during the current study are available from the corresponding author upon reasonable request. Supplementary data supporting the accuracy assessment is provided.
Acknowledgments
AI tools (Gemini) were used only for language polishing and editing. The content, analysis, interpretation, and final approval were performed entirely by human authors.
Conflicts of Interest
The authors declare no conflicts of interest.
References
- Sylvester, J.M.; Gutiérrez-Zapata, M.C.; Maimbo, M.; et al. Analysis of food system drivers of deforestation highlights foreign direct investments and urbanization as threats to tropical forests. Sci. Rep. 2024, 14, 15179. [Google Scholar] [CrossRef]
- Runyan, C.W.; Stehm, J. Deforestation: Drivers, Implications, and Policy Responses. Oxf. Res. Encycl. Environ. Sci. 2020. [Google Scholar]
- Kim, D.H.; Sexton, J.O.; Townshend, J.R. Accelerated deforestation in the humid tropics from the 1990s to the 2000s. Geophys. Res. Lett. 2015, 42, 3495–3501. [Google Scholar] [CrossRef]
- Hansen, M.C.; Potapov, P.V.; Moore, R.; Hancher, M.; Turubanova, S.A.; Tyukavina, A.; et al. High-resolution global maps of 21st-century forest cover change. Science 2013, 342, 850–853. [Google Scholar] [CrossRef]
- Barbier, E.B. Explaining agricultural land expansion and deforestation in developing countries. Am. J. Agric. Econ. 2004, 86, 1347–1353. [Google Scholar] [CrossRef]
- Shobande, O.A.; Ogbeifun, L. Emergence of Forest Environmental Kuznets Curve in Africa: Some New Evidences. J. Dev. Areas 2024, 58, 131–147. [Google Scholar] [CrossRef]
- Hosonuma, N.; Herold, M.; De Sy, V.; De Fries, R.S.; Brockhaus, M.; Verchot, L.; Angelsen, A.; Romijn, E. An assessment of deforestation and forest degradation drivers in developing countries. Environ. Res. Lett. 2012, 7, 044009. [Google Scholar] [CrossRef]
- Simane, B.; Kapwata, T.; Naidoo, N.; et al. Ensuring Africa’s Food Security by 2050: The Role of Population Growth, Climate-Resilient Strategies, and Putative Pathways to Resilience. Foods 2025, 14, 262. [Google Scholar] [CrossRef]
- Ojoatre, S.; Zhang, C.; Yesuf, G.; Rufino, M.C. Mapping deforestation and recovery of tropical montane forests of East Africa. Front. Environ. Sci. 2023, 11, 1084764. [Google Scholar] [CrossRef]
- Bamwesigye, D.; Kučera, P.; et al. Redd+: An analysis of initiatives in east africa amidst increasing deforestation. Eur. J. Sustain. Dev. 2020, 9, 224–237. [Google Scholar] [CrossRef]
- Wassie, S.B. Natural resource degradation tendencies in Ethiopia: a review. Environ. Syst. Res. 2020, 9, 1–29. [Google Scholar] [CrossRef]
- Ababu, T.; Eyasu, A.; Abebe, M.; et al. Analysis of Land Use Change from Forest to Agriculture and its Determinants: the Case of East Shewa, Oromia, Ethiopia. Indones. J. Soc. Environ. Issues 2024, 5, 75–87. [Google Scholar] [CrossRef]
- Desta, H.; Fetene, A. Land-use and land-cover change in Lake Ziway watershed of the Ethiopian Central Rift Valley Region and its environmental impacts. Land Use Policy 2020, 96, 104682. [Google Scholar] [CrossRef]
- Rosenstock, T.S.; Dawson, I.K.; Aynekulu, E.; et al. A Planetary Health Perspective on Agroforestry in Sub-Saharan Africa. One Earth 2019, 1, 330–344. [Google Scholar] [CrossRef]
- Sims, M.J.; Stanimirova, R.; Raichuk, A.; et al. Global drivers of forest loss at 1 km resolution. Environ. Res. Lett. 2025, 20, 044006. [Google Scholar] [CrossRef]
- Amani, M.; Ghorbanian, A.; Ahmadi, S.A.; Kakroodi, A.A.; et al. Google Earth Engine Cloud Computing Platform for Remote Sensing Big Data Applications: A Comprehensive Review. IEEE J. Sel. Top. Appl. Earth Obs. Remote Sens. 2020, 13, 5326–5350. [Google Scholar] [CrossRef]
- Velastegui-Montoya, A.; Montalván-Burbano, N.; Carrión-Mero, P.; et al. Google Earth Engine: A Global Analysis and Future Trends. Remote Sens. 2023, 15, 3675. [Google Scholar] [CrossRef]
- Potapov, P.; Hansen, M.C.; Pickens, A.; et al. The Global 2000-2020 Land Cover and Land Use Change Dataset Derived From the Landsat Archive: First Results. Front. Remote Sens. 2022, 3, 856903. [Google Scholar] [CrossRef]
- FAO. FAOSTAT Database; Food and Agriculture Organization of the United Nations: Rome, Italy, 2024; Available online: https://www.fao.org/faostat/en/.
- Harris, N.L.; Gibbs, D.A.; Baccini, A.; et al. Global maps of twenty-first century forest carbon fluxes. Nat. Clim. Chang. 2021, 11, 234–240. [Google Scholar] [CrossRef]
- Simane, B.; Zaitchik, B.F.; Foltz, R. Agroecosystem specific climate vulnerability analysis. Mitig. Adapt. Strateg. Glob. Chang. 2016, 21, 39–65. [Google Scholar] [CrossRef]
- World Bank. World Development Indicators: Population growth; World Bank: Washington, DC, USA, 2024; Available online: https://data.worldbank.org/indicator/SP.POP.GROW.
- Rakuasa, H.; Khromykh, V.V.; Rifai, A. Spatio-Temporal Analysis of Forest Cover Change in Halmahera and Obi Islands, Indonesia using Hansen Global Forest Change Data on Google Earth Engine. J. Sci. Insights 2025, 2, 281–291. [Google Scholar] [CrossRef]
- Phan, T.N.; Kuch, V.; Lehnert, L.W. Land cover classification using Google Earth Engine and random forest classifier. Remote Sens. 2020, 12, 2411. [Google Scholar] [CrossRef]
- Vitale, A.; Lamonaca, F. Advancing Built-Up Area Monitoring Through Multi-Temporal Satellite Data Fusion and Machine Learning-Based Geospatial Analysis. Remote Sens. 2025, 17, 1830. [Google Scholar] [CrossRef]
- Hemati, M.; Hasanlou, M.; Mahdianpari, M.; Mohammadimanesh, F. A systematic review of landsat data for change detection applications: 50 years of monitoring the earth. Remote Sens. 2021, 13, 2869. [Google Scholar] [CrossRef]
- Young, N.E.; Anderson, R.S.; Chignell, S.M.; Vorster, A.G.; Lawrence, R.; Evangelista, P.H. A survival guide to Landsat preprocessing. Ecology 2017, 98, 920–932. [Google Scholar] [CrossRef] [PubMed]
- Galiatsatos, N.; Donoghue, D.N.M.; Watt, P.; et al. An assessment of global forest change datasets for national forest monitoring and reporting. Remote Sens. 2020, 12, 1790. [Google Scholar] [CrossRef]
- Mulatu, K.; Hundera, K.; Senbeta, F. Analysis of Forest Cover Change in the Southwest Ethiopia: Key Drivers, Impacts, and Conservation Implications. Int. J. For. Res. 2025, 5523008. [Google Scholar] [CrossRef]
- Mekuria, T.A. Forest Ecosystems and Climate Change in Ethiopia. Afr. J. Clim. Chang. Resour. Sustain. 2025, 4, 1–10. [Google Scholar] [CrossRef]
- Shibabaw, M.; Wondimneh, S. Synthesis of Deforestation and Forest-Based Climate Change Mitigation Strategies in Ethiopia. East Afr. J. For. Agrofor. 2025, 8, 447–465. [Google Scholar] [CrossRef]
- Getahun, S.G. Forest Cover Change in Ethiopia: Extent, Driving Factors, Environmental Implication and Management Strategies. J. Res. Dev. Manag. 2020, 67, 1–15. [Google Scholar]
- Getahun, S.; Berhan, G.; et al. Exploring drivers of land use/land cover transformations in Goang watershed Ethiopia. Heliyon 2024, 10, e101043. [Google Scholar]
- Yesuph, A.Y.; Dagnew, A.B. Land use/cover spatiotemporal dynamics, driving forces and implications at the Beshillo catchment of the Blue Nile Basin, North Eastern Highlands of Ethiopia. Environ. Syst. Res. 2019, 8, 1–15. [Google Scholar] [CrossRef]
- Nahar, N.; Mohiuddin, M.; et al. Influential Factors of Landslide Occurrence in the South-Eastern Part of Bangladesh. IDRiM J. 2025. [Google Scholar] [CrossRef]
- Molla, T.B.; et al. Estimating soil erosion risk and evaluating erosion control measures for soil conservation planning at Koga watershed. Solid Earth 2017, 8, 13–20. [Google Scholar] [CrossRef]
- Ameneshewa, W.; Kebede, Y.; et al. Trends of land use land cover dynamics of Sheka biosphere reserve, A case of Shato core area, Southwest Ethiopia. PLoS ONE 2023, 18, e0287830. [Google Scholar]
- Worku, G.; Hunde, Z.D.; et al. Challenges of Smallholder Farming in Ethiopia and Opportunities by Adopting Climate-Smart Agriculture. Agriculture 2021, 11, 192. [Google Scholar] [CrossRef]
- Teshome, F.; Dadi, K. The Role of Climate Services in Supporting Climate Change Adaptation in Ethiopia. Land 2025, 14, 2251. [Google Scholar] [CrossRef]
- Dawid, I.; et al. The status, challenges, and prospects of agricultural production and productivity in Ethiopia: A review. Int. J. Res. Agron. 2021, 4, 1–15. [Google Scholar] [CrossRef]
- Telila, H.F.; et al. Quantifying food insecurity in Ethiopia: Prevalence, drivers, and policy implications. Cogent Soc. Sci. 2024, 10, 2318862. [Google Scholar] [CrossRef]
- Kobe, F.T. Understanding Climate Change in Ethiopia: Impacts and Solutions. Int. J. Big Data Min. Glob. Warm. 2024, 23300014. [Google Scholar] [CrossRef]
- Du, R.; Cai, H.; et al. Enhancing governance performance in Sub-Saharan Africa can bolster climate mitigation and food security. Ecosyst. Heal. Sustain. 2024, 0241. [Google Scholar] [CrossRef]
- Bewket, W.; Radeny, M. Agricultural Adaptation and Institutional Responses to Climate Change Vulnerability in Ethiopia; CGIAR: Montpellier, France, 2015. [Google Scholar]
- Owusu-Danquah, E.; Danquah, F. Sustainable Intensification and Climate-Smart Yam Production for Improved Food Security in West Africa: A Review. Front. Agron. 2022, 4, 858114. [Google Scholar] [CrossRef]
- Alkama, R.; Cescatti, A. Biophysical climate impacts of recent changes in global forest cover. Science 2016, 351, 600–604. [Google Scholar] [CrossRef] [PubMed]
- Lawrence, D.; Vandecar, K. Effects of tropical deforestation on climate and agriculture. Nat. Clim. Chang. 2015, 5, 27–36. [Google Scholar] [CrossRef]
- Robinson, W.S. Ecological correlations and the behavior of individuals. Am. Sociol. Rev. 1950, 15, 351–357. [Google Scholar] [CrossRef]
- Wan, Z. New refinements and validation of the collection-6 MODIS land-surface temperature/emissivity product. Remote Sens. Environ. 2014, 140, 36–45. [Google Scholar] [CrossRef]
- Mitchard, E.T.A. The tropical forest carbon cycle and climate change. Nature 2018, 559, 527–534. [Google Scholar] [CrossRef]
Figure 2.
Methodological workflow implemented within the Google Earth Engine environment, illustrating the integration of forest loss data with environmental, topographic, and socio-economic variables.
Figure 2.
Methodological workflow implemented within the Google Earth Engine environment, illustrating the integration of forest loss data with environmental, topographic, and socio-economic variables.
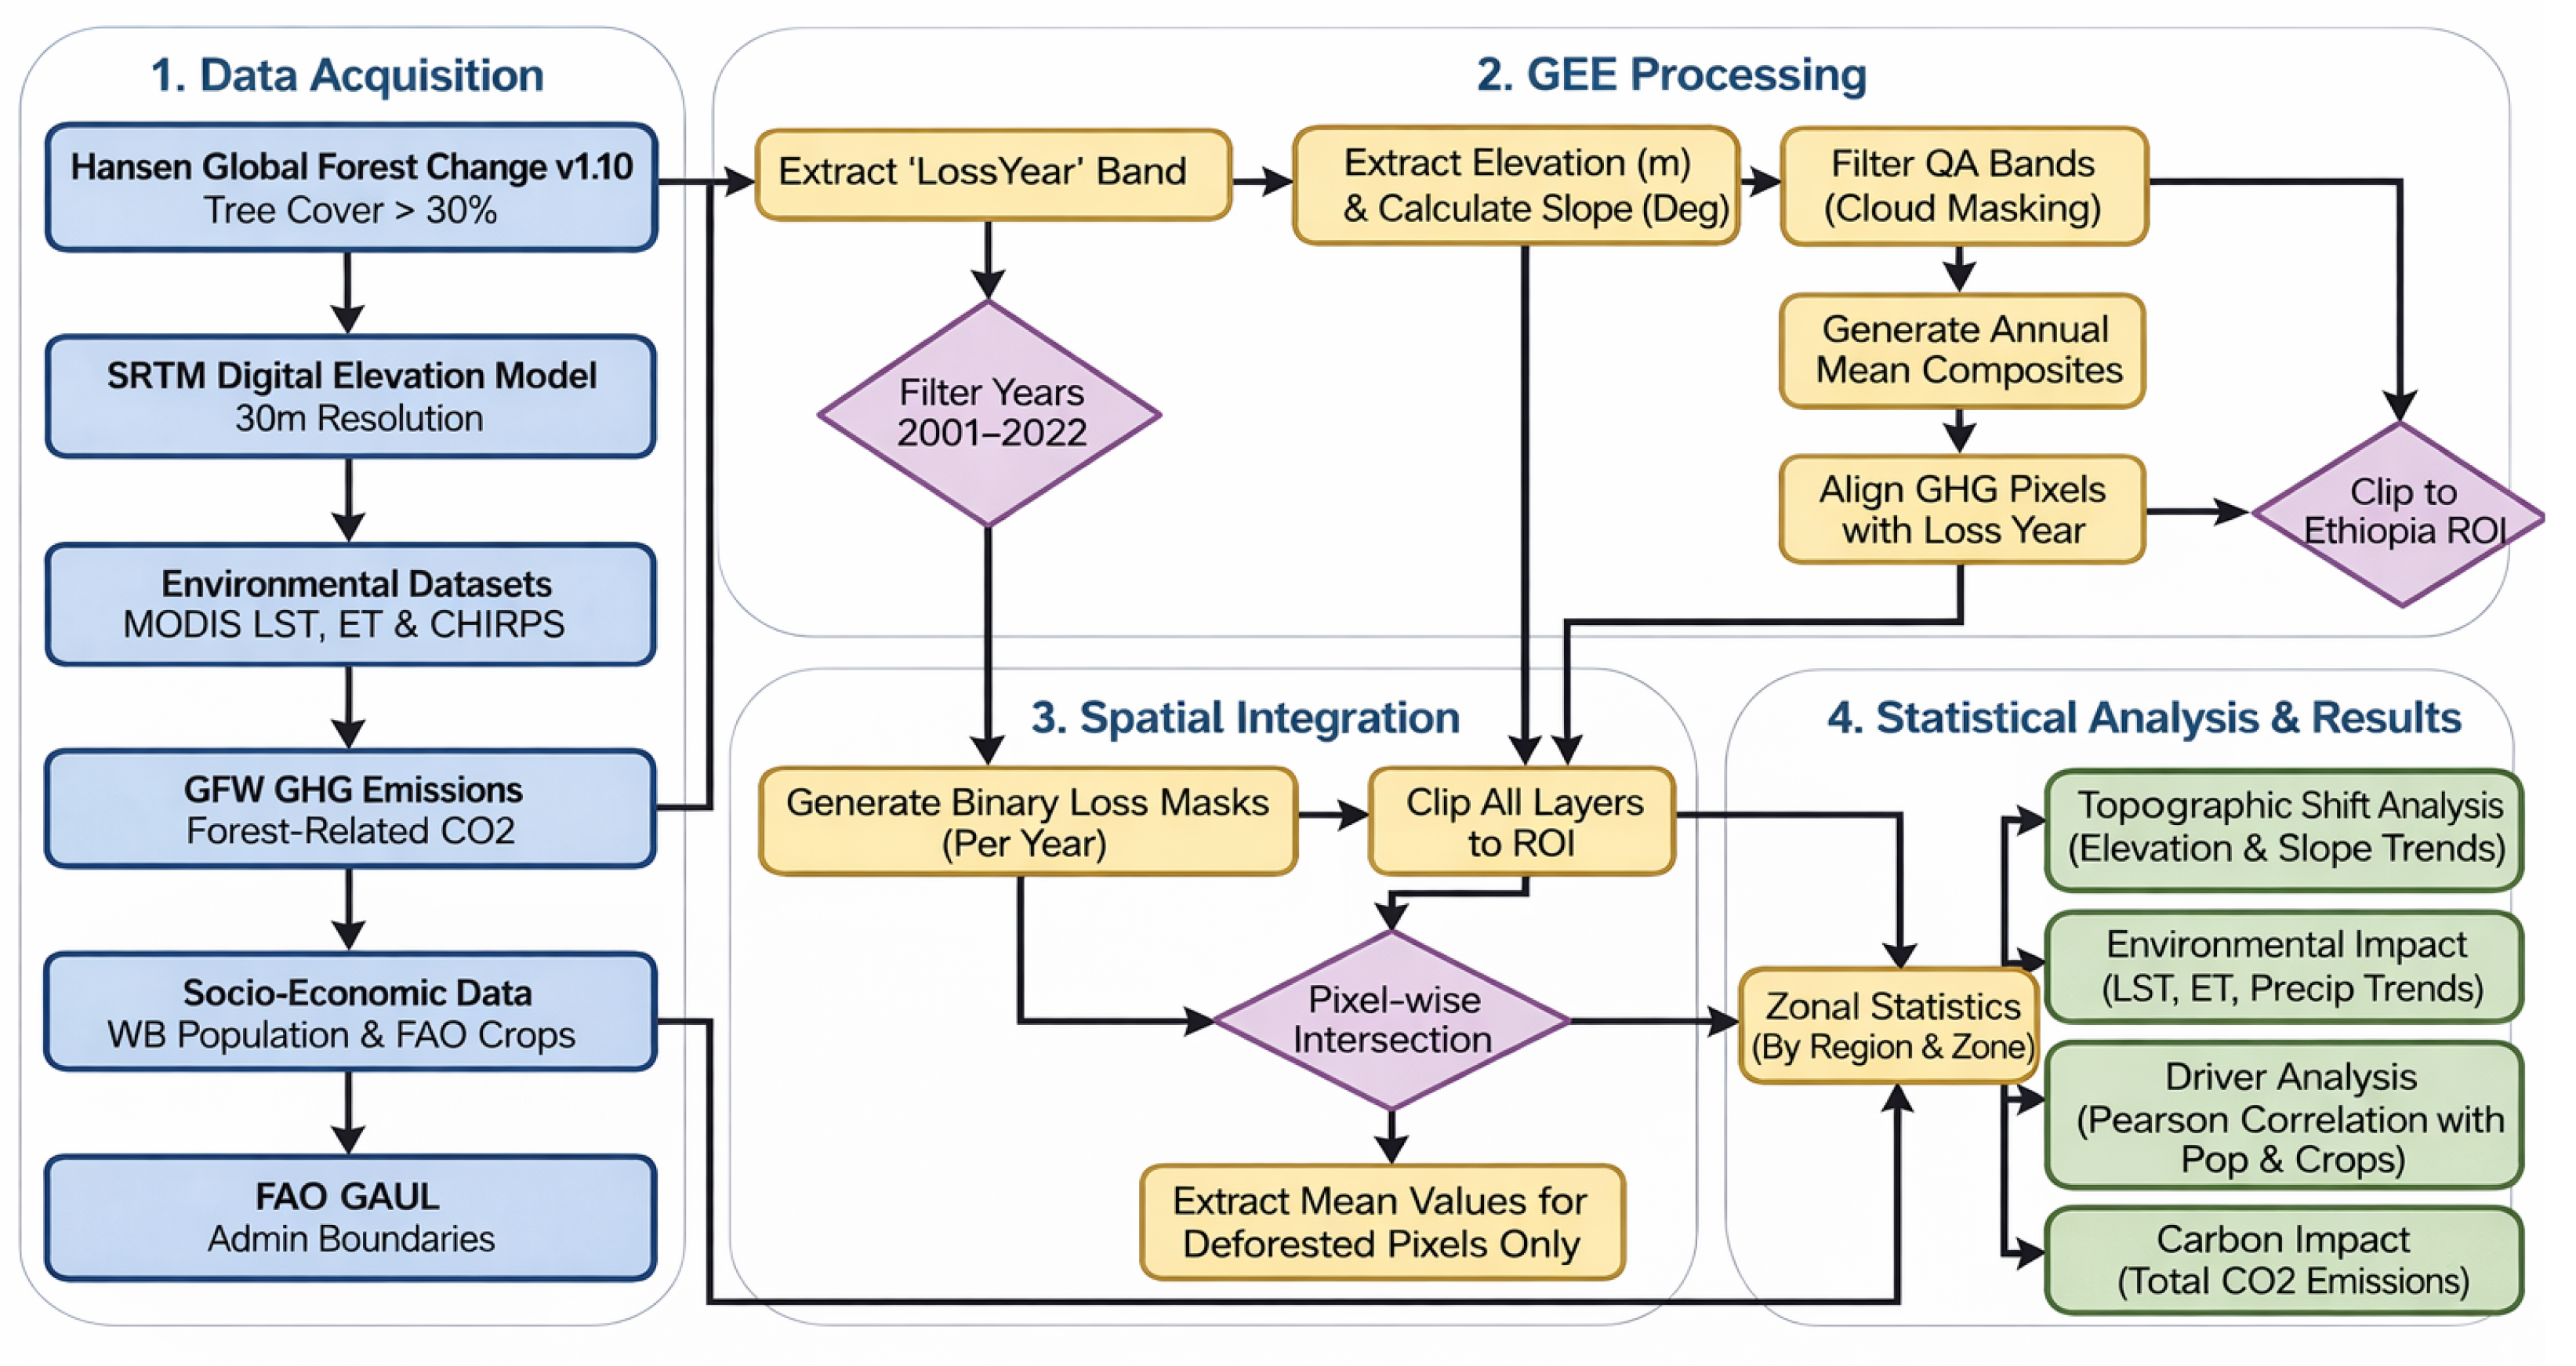
Figure 3.
Time Series Analysis of Cumulative (Line) and Annual (Bar) Forest Loss (Hectares) from 2001 to 2022 in Ethiopia.
Figure 3.
Time Series Analysis of Cumulative (Line) and Annual (Bar) Forest Loss (Hectares) from 2001 to 2022 in Ethiopia.
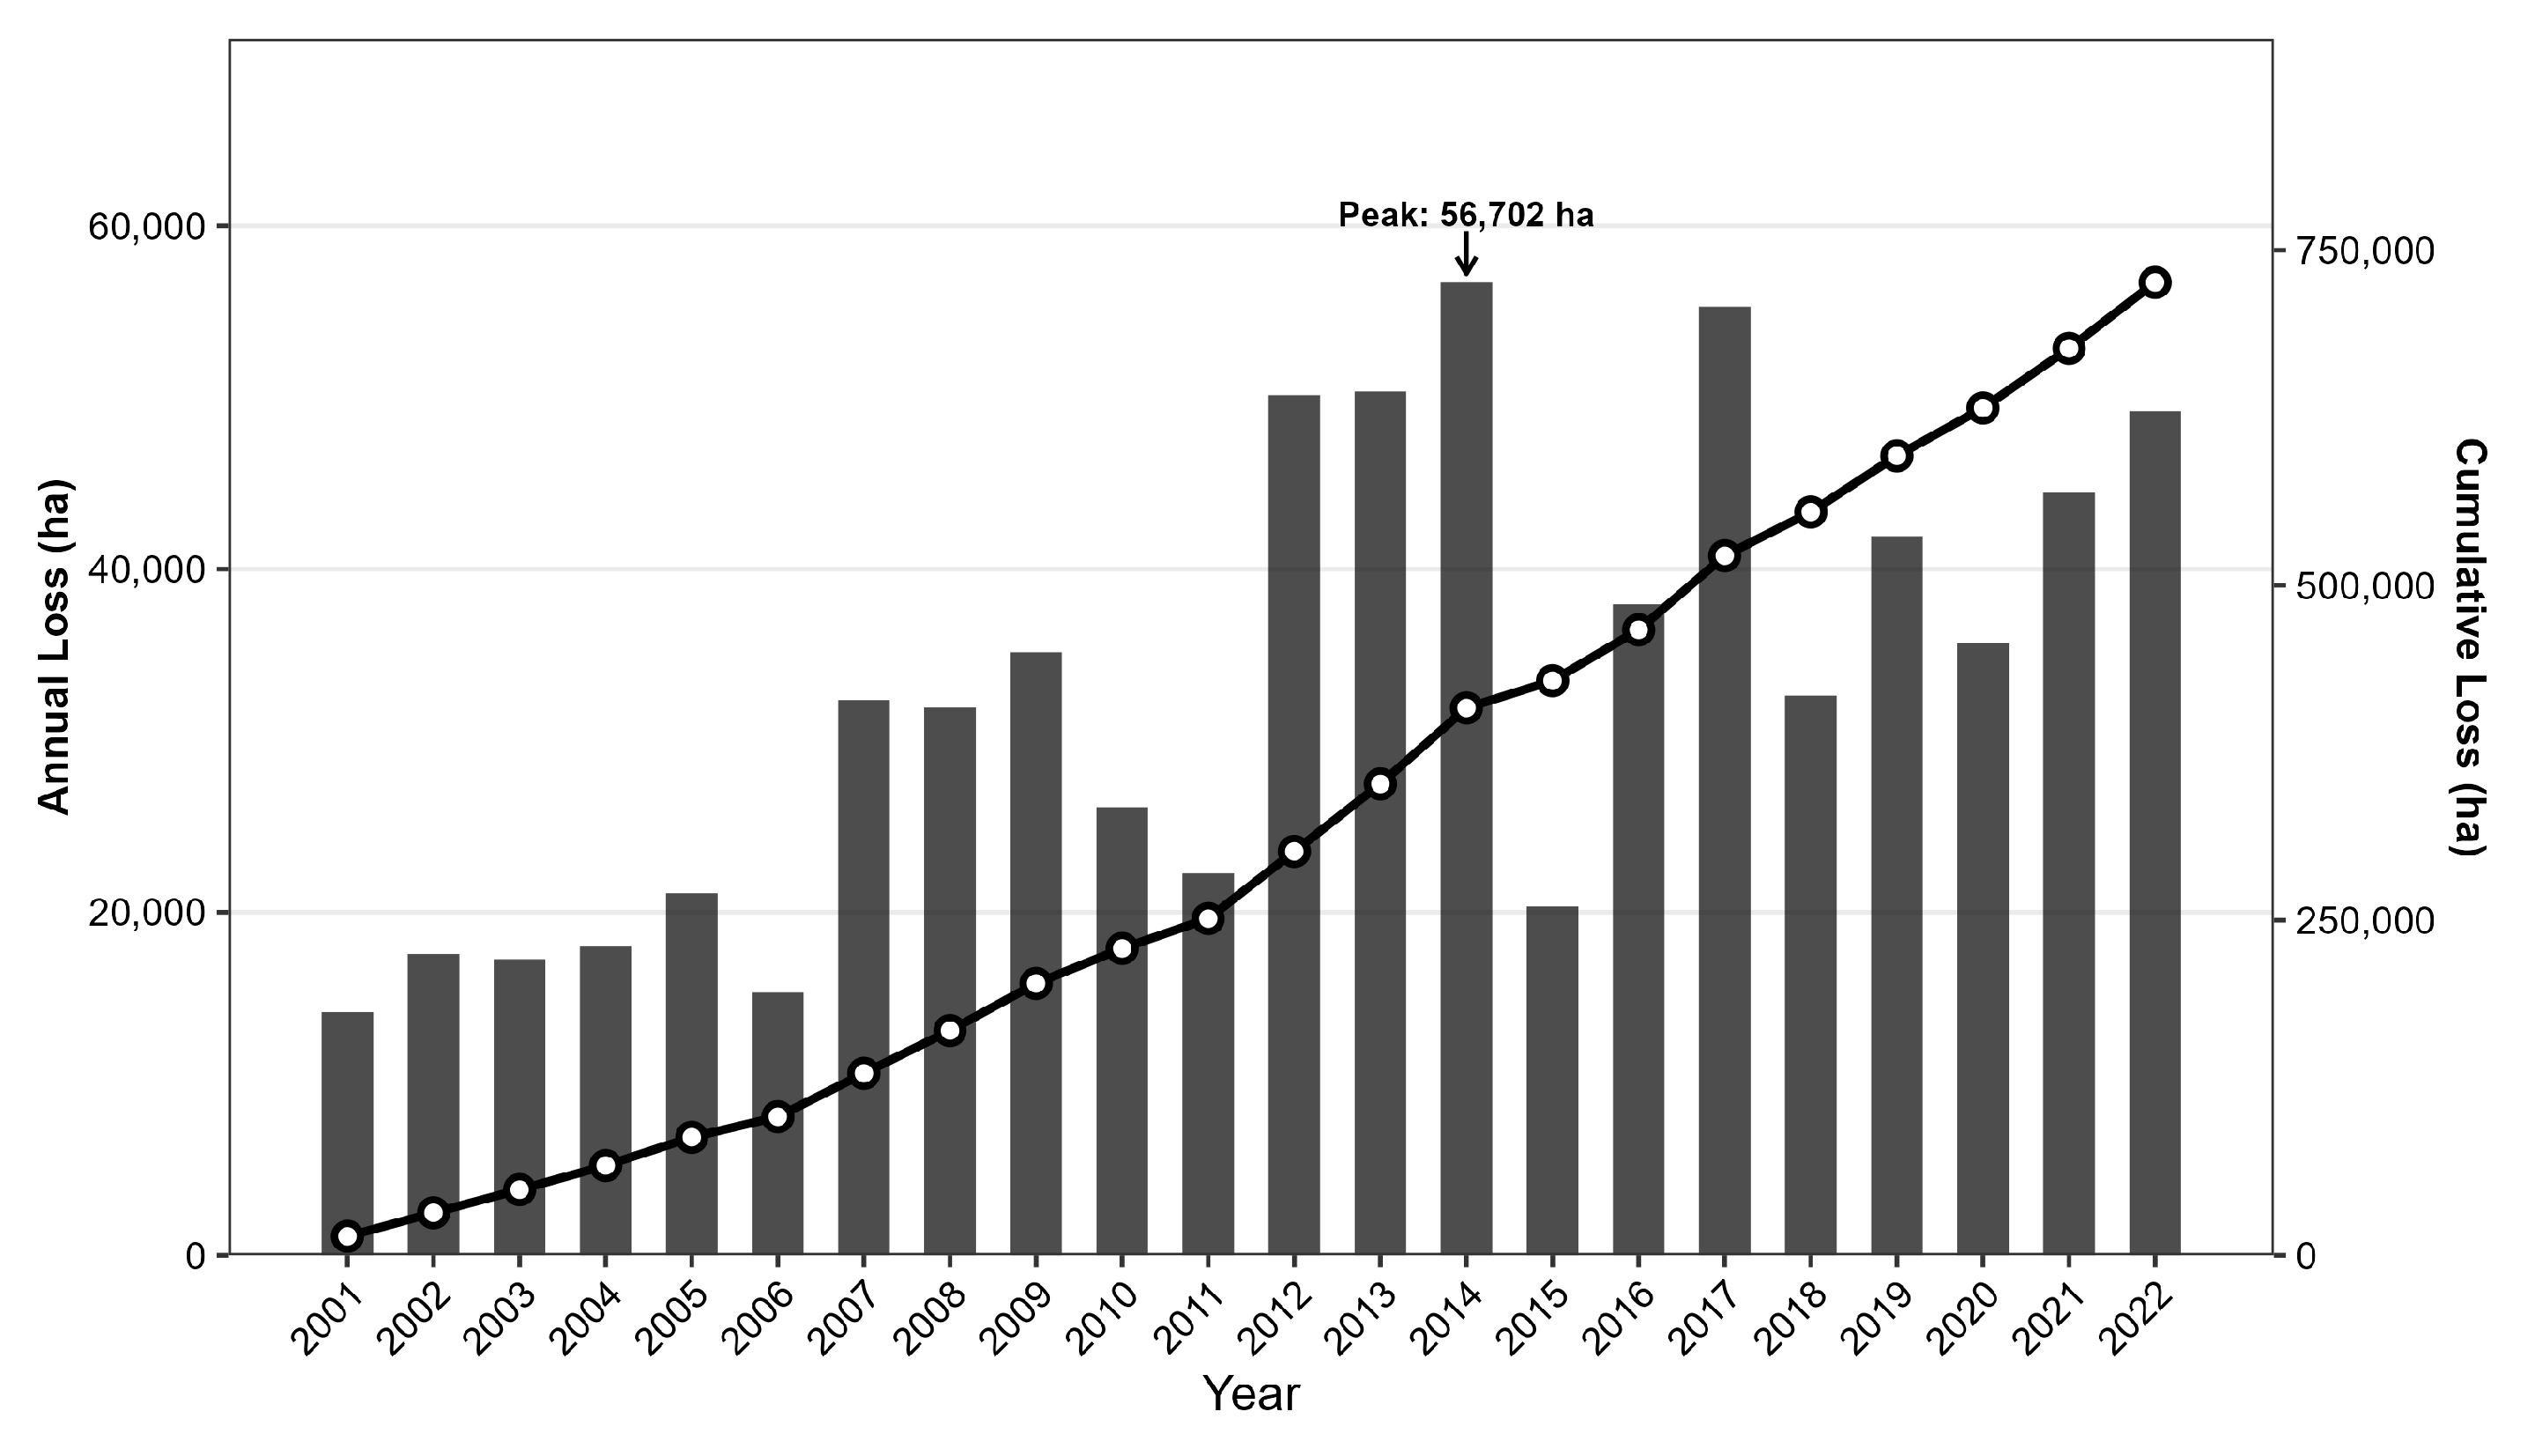
Figure 4.
Temporal trends in the average elevation (meters) and slope (degrees) of areas experiencing forest cover loss in Ethiopia from 2001 to 2022.
Figure 4.
Temporal trends in the average elevation (meters) and slope (degrees) of areas experiencing forest cover loss in Ethiopia from 2001 to 2022.
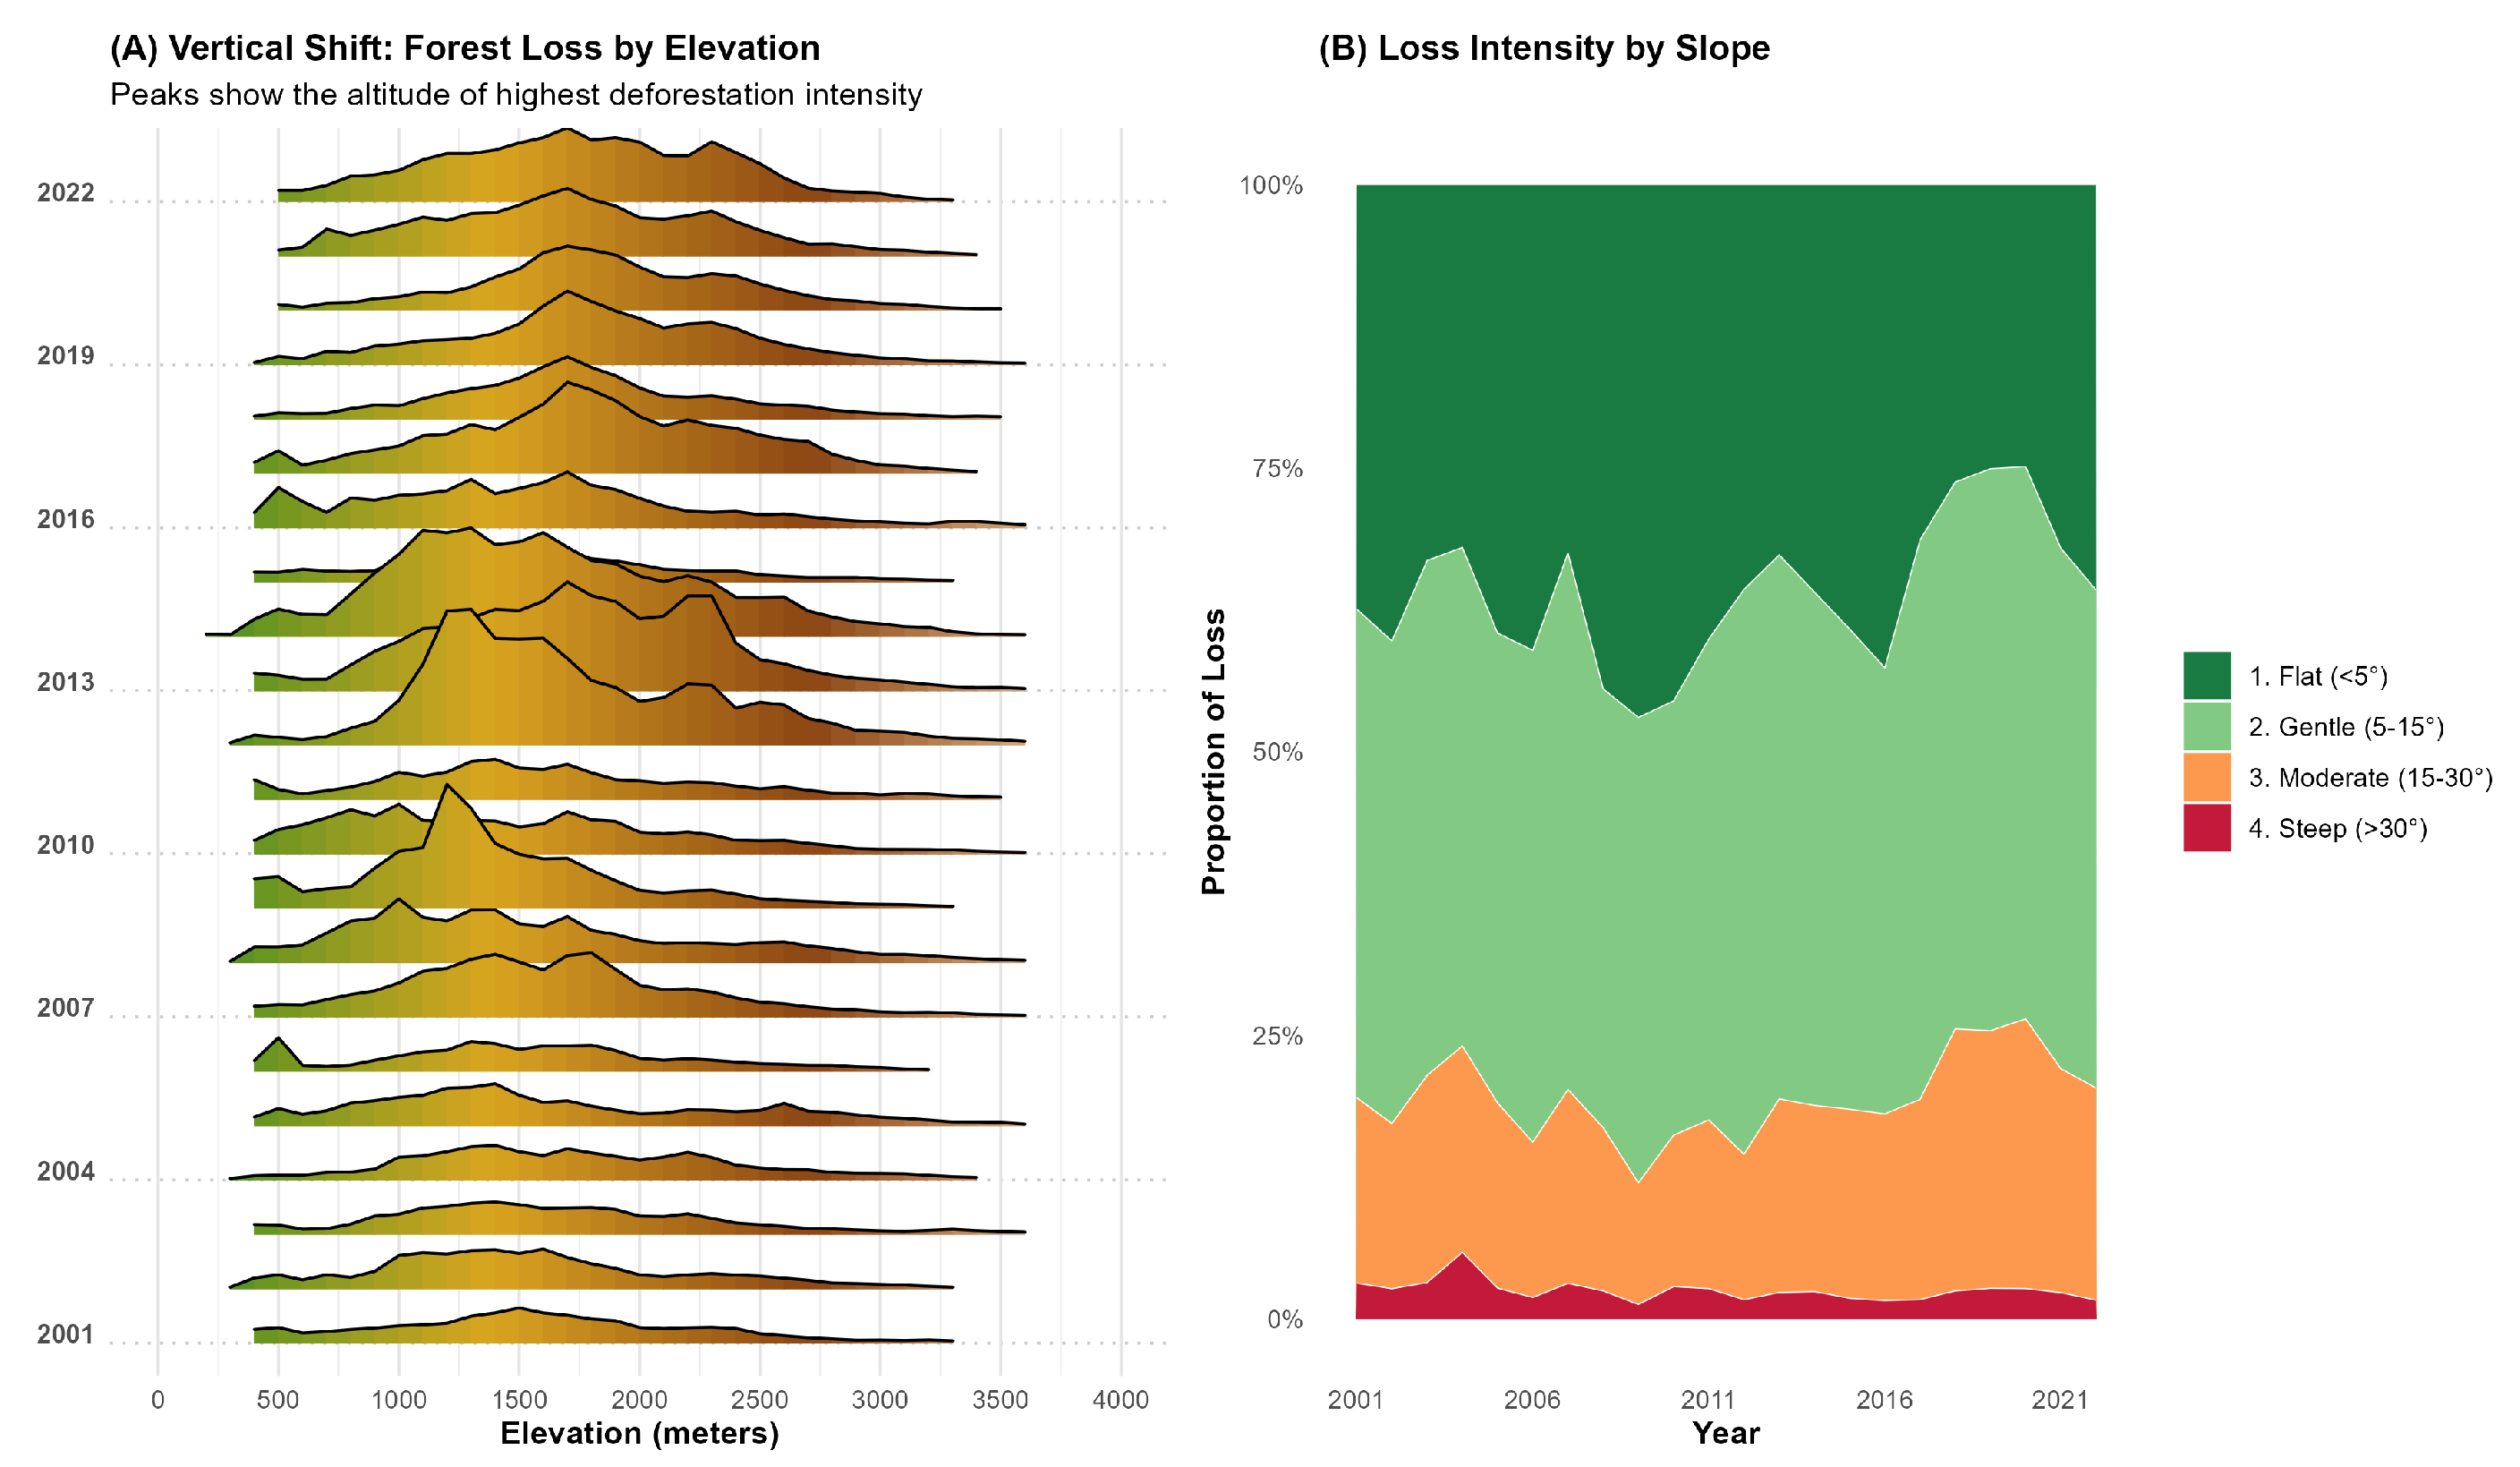
Figure 5.
Regional analysis of deforestation and carbon emissions in Ethiopia (2001–2022): (A) Total Forest Loss in Regional States (ha); (B) Forest related CO2 emissions in different regions (Mg).
Figure 5.
Regional analysis of deforestation and carbon emissions in Ethiopia (2001–2022): (A) Total Forest Loss in Regional States (ha); (B) Forest related CO2 emissions in different regions (Mg).
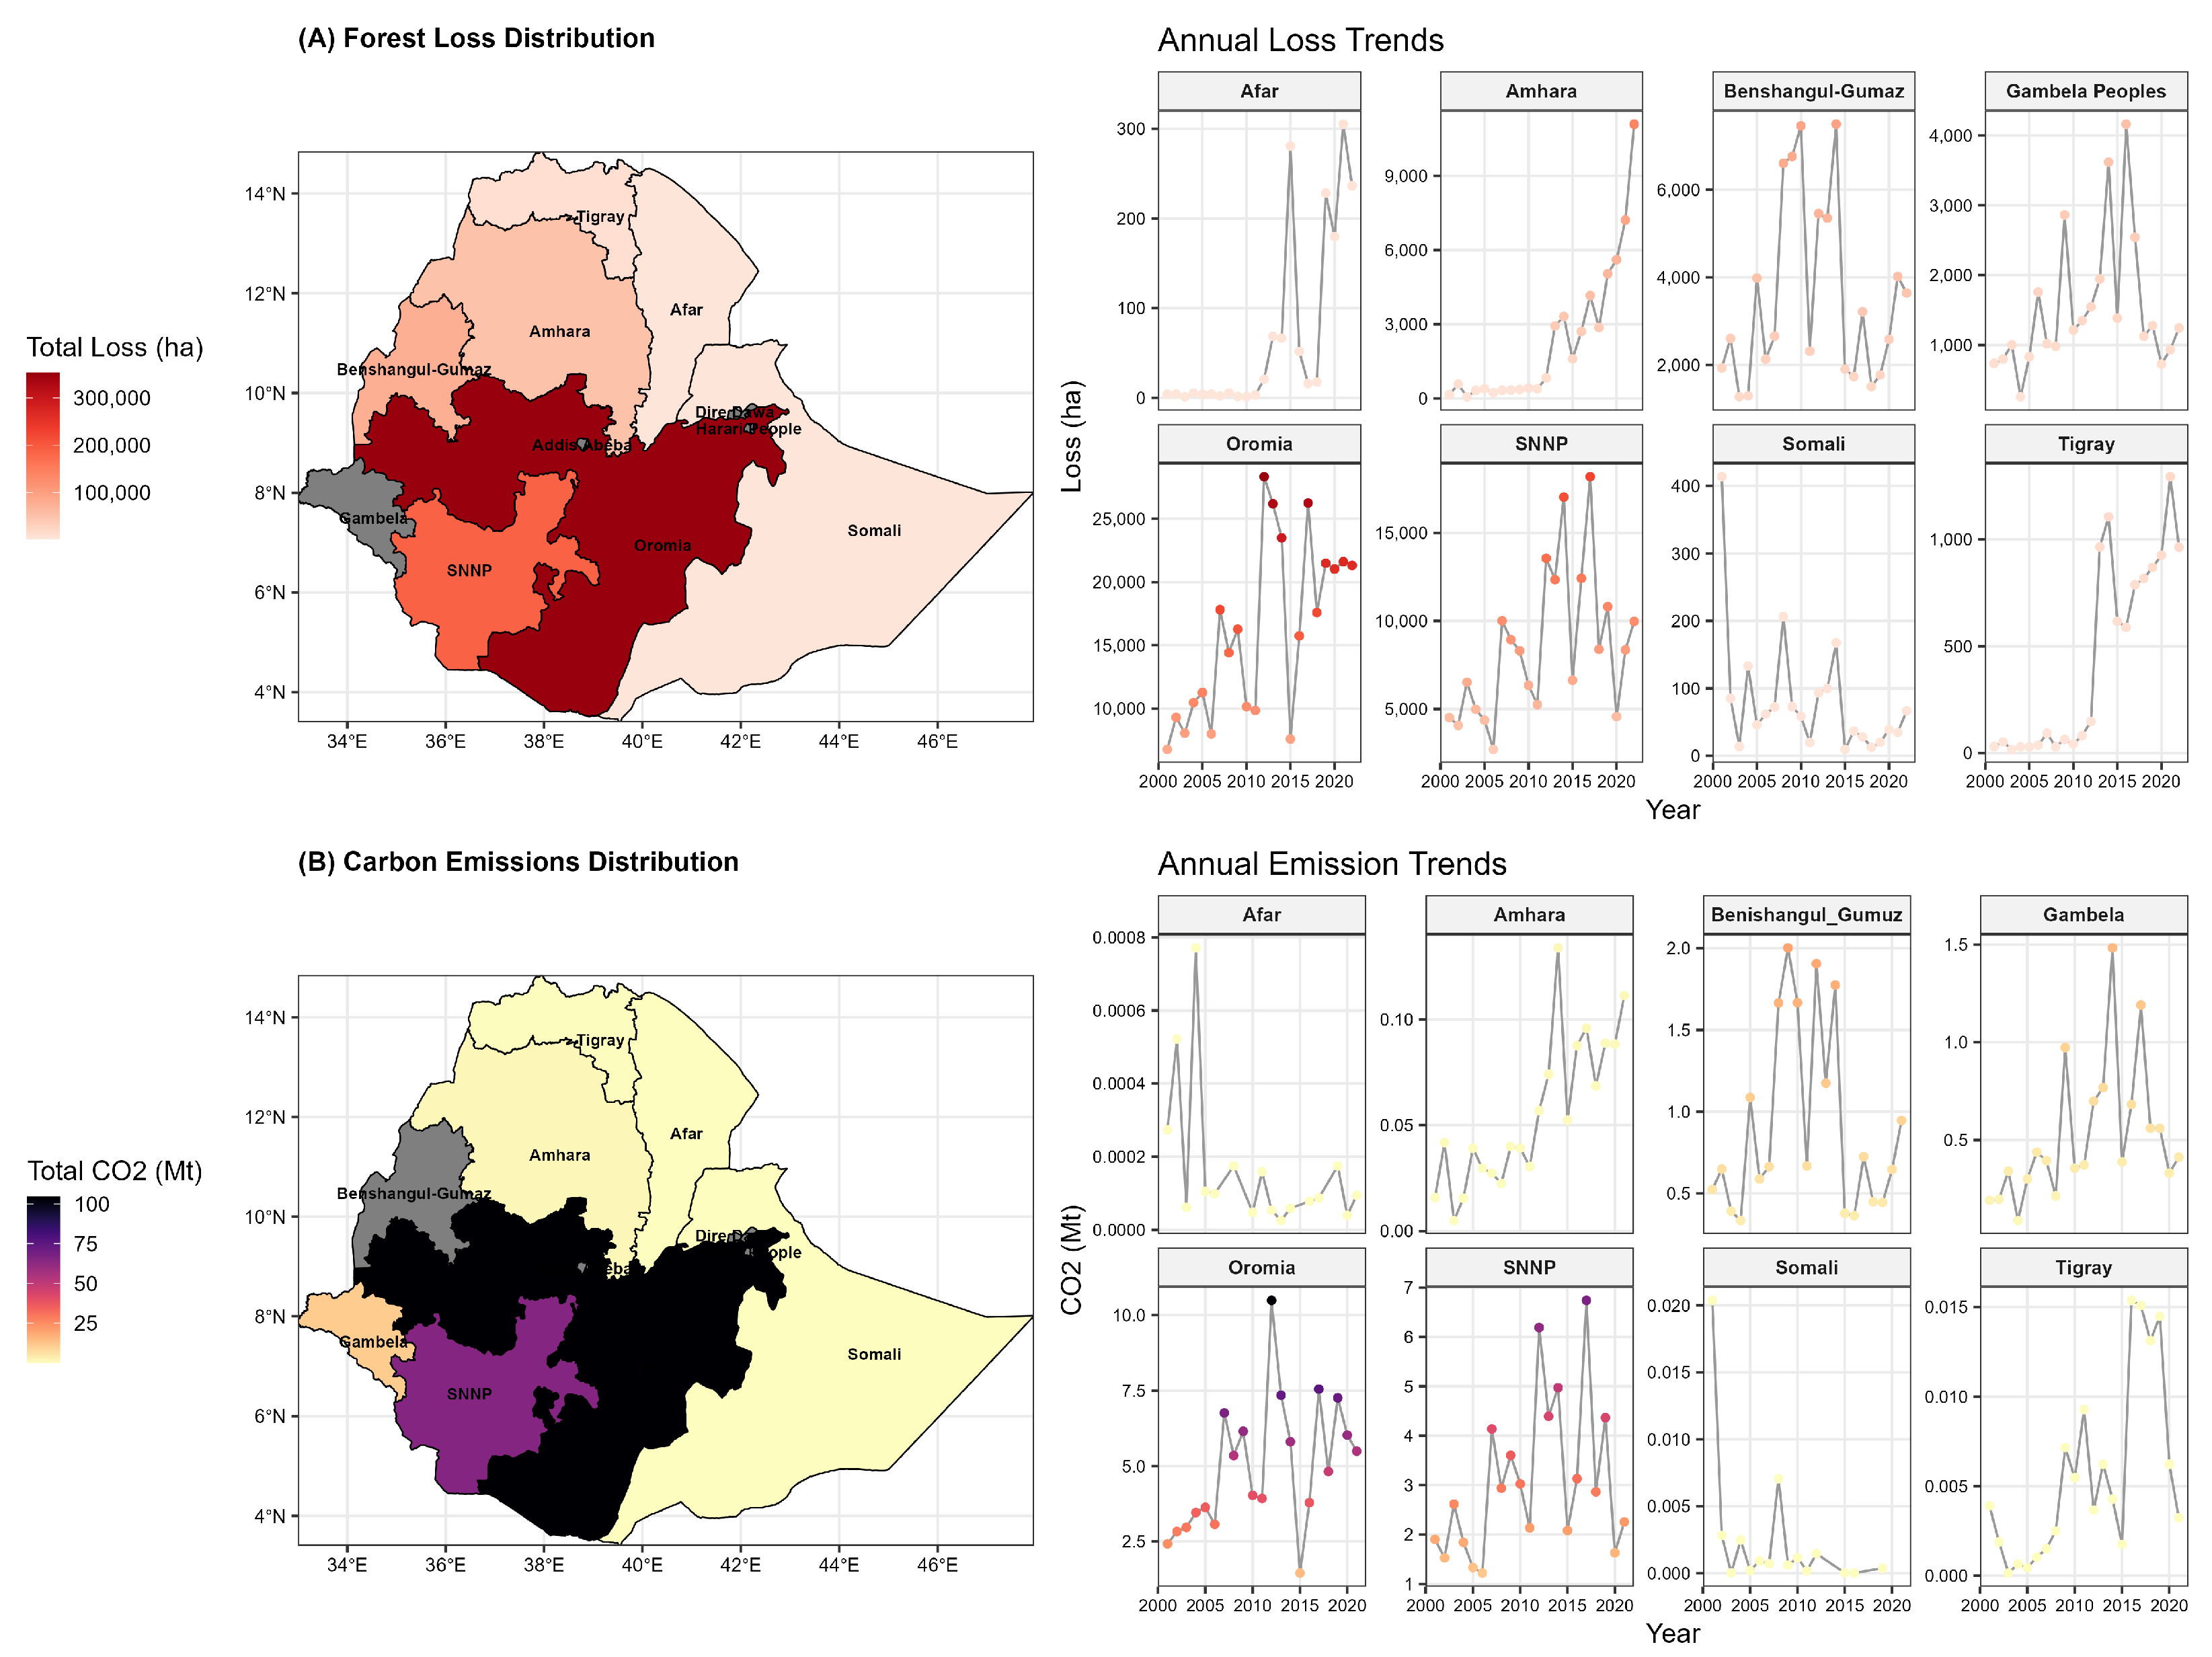
Figure 6.
Spatio-temporal analysis of environmental shifts associated with high-deforestation hotspots: (A) Location of the four study zones; (B) Corresponding temporal trends (2001–2022) for annual mean Land Surface Temperature (LST, °C), Evapotranspiration (ET, mm), and Precipitation (mm).
Figure 6.
Spatio-temporal analysis of environmental shifts associated with high-deforestation hotspots: (A) Location of the four study zones; (B) Corresponding temporal trends (2001–2022) for annual mean Land Surface Temperature (LST, °C), Evapotranspiration (ET, mm), and Precipitation (mm).
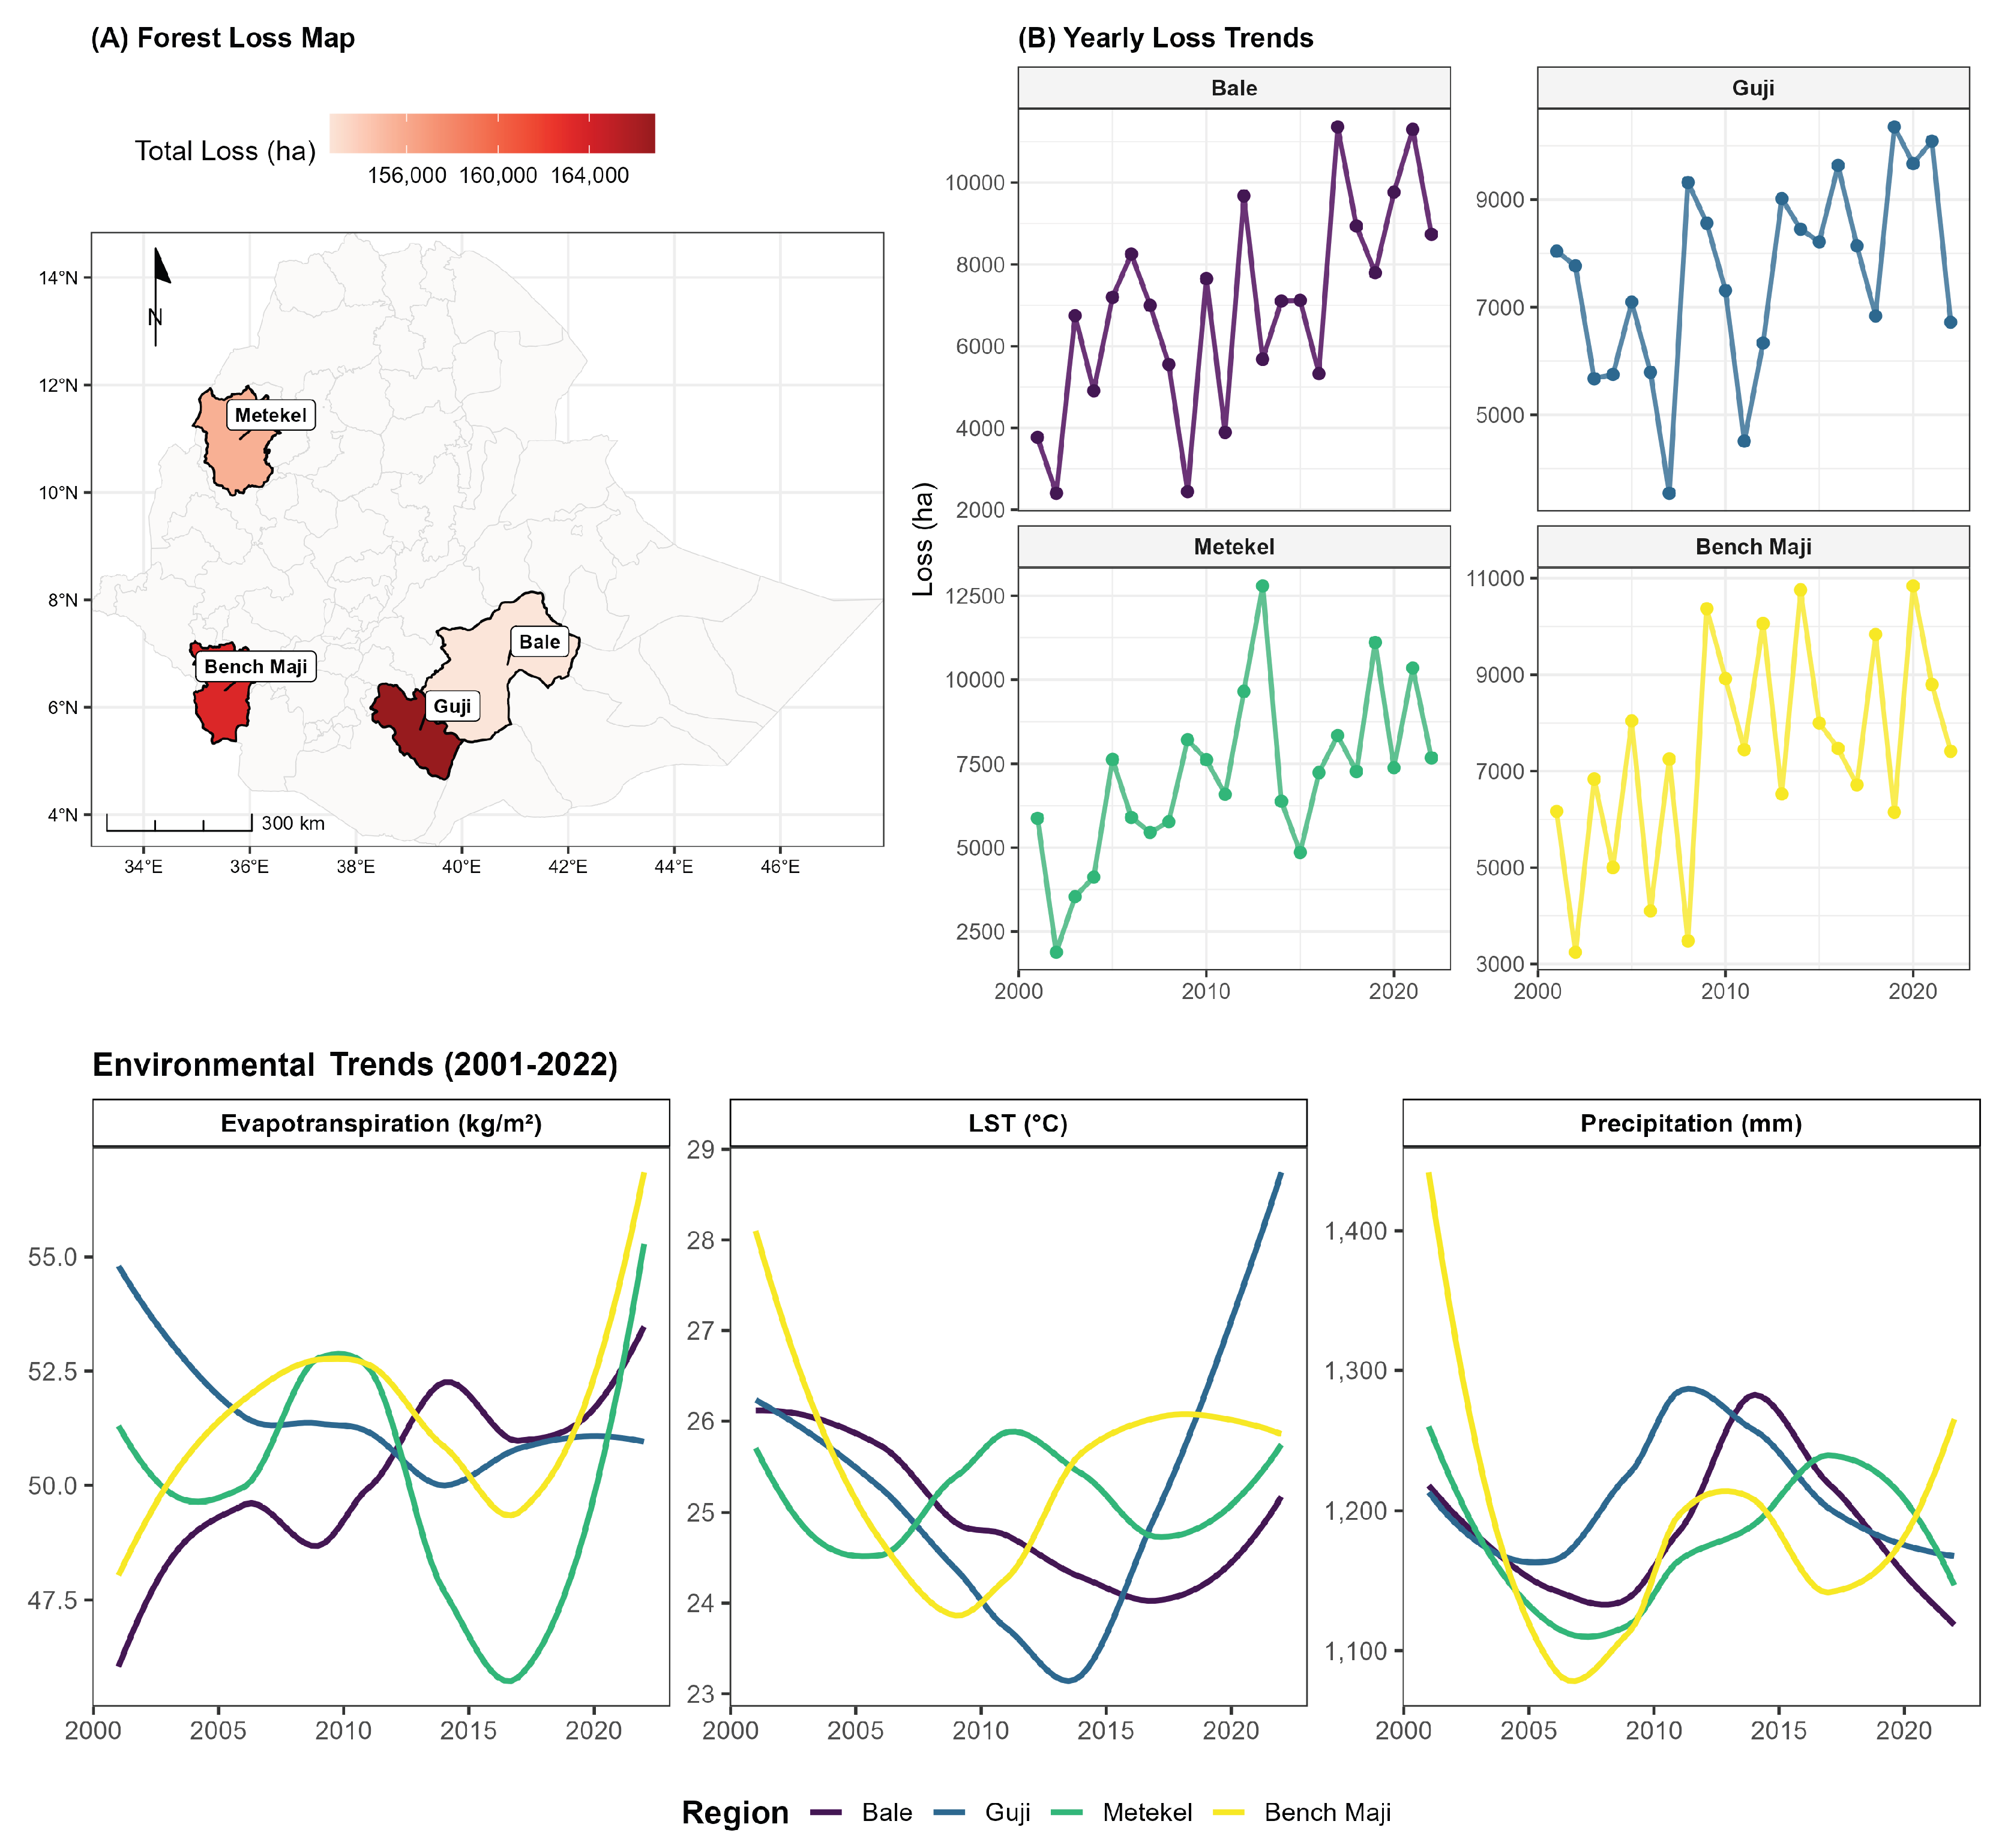

Table 1.
Datasets used in the analysis of Ethiopian deforestation and its environmental impacts.
| Dataset Name | Key Variable(s) | Resolution | Source / Provider |
|---|---|---|---|
| Hansen Global Forest Change | lossyear, treecover2000 | 30-meter | Hansen/UMD/NASA [18] |
| FAO GAUL Admin Boundaries | ADM1_NAME, ADM2_NAME | Vector | FAO / GEE [19] |
| GFW GHG Emissions | Gross CO2e emissions | 30-meter | GFW / Harris et al. [20] |
| MODIS/061/MOD11A1 | LST_Day_1km | 1-km | NASA LP DAAC [17] |
| CHIRPS Daily | precipitation | 5.5-km | UCSB / CHC [21] |
| MODIS/061/MOD16A2 | ET (Evapotranspiration) | 500-meter | NASA LP DAAC [17] |
| SRTM Digital Elevation Data v4 | Elevation and Slope | 30-meter | CGIAR-CSI / NASA [16] |
| World Bank Indicators | Population Growth | National | World Bank [22] |
Table 2.
Confusion Matrix for the accuracy assessment of forest loss classification (Hansen v1.12).
| Reference Data (Manual) | ||||
|---|---|---|---|---|
| Classified Data (Map) | Forest Loss | Stable Forest | Total | User’s Accuracy (%) |
| Forest Loss | 422 (TP) | 78 (FP) | 500 | 84.4% |
| Stable Forest | 135 (FN) | 365 (TN) | 500 | 73.0% |
| Total | 557 | 443 | 1000 | |
| Producer’s Accuracy (%) | 75.8% | 82.4% | Overall: 78.7% | |
Table 3.
Pearson correlation coefficients (r) and significance levels (p-values) between key socio-economic variables and annual deforestation in Ethiopia.
Table 3.
Pearson correlation coefficients (r) and significance levels (p-values) between key socio-economic variables and annual deforestation in Ethiopia.
| Socio-Economic Variable | Correlation Coefficient (r) | Significance (p-value) |
|---|---|---|
| Wheat Harvested Area | 0.72 | 0.001 |
| National Population Growth | 0.70 | 0.001 |
| Maize Harvested Area | 0.67 | 0.001 |
| Coffee Harvested Area | 0.66 | 0.01 |
| Population Growth vs. Topographic Shift | 0.54 | 0.01 |
Disclaimer/Publisher’s Note: The statements, opinions and data contained in all publications are solely those of the individual author(s) and contributor(s) and not of MDPI and/or the editor(s). MDPI and/or the editor(s) disclaim responsibility for any injury to people or property resulting from any ideas, methods, instructions or products referred to in the content. |
© 2026 by the authors. Licensee MDPI, Basel, Switzerland. This article is an open access article distributed under the terms and conditions of the Creative Commons Attribution (CC BY) license (http://creativecommons.org/licenses/by/4.0/).
Copyright: This open access article is published under a Creative Commons CC BY 4.0 license, which permit the free download, distribution, and reuse, provided that the author and preprint are cited in any reuse.


