Submitted:
25 February 2026
Posted:
27 February 2026
You are already at the latest version
Abstract
Deep-sea sediments harbor unique fungal communities adapted to extreme conditions, offering an untapped resource for novel bioactive compounds. However, systematic studies of their potential for agricultural biocontrol remain limited. This study assessed the diversity of culturable fungi from deep-sea sediments and screened their antago-nistic activity against important phytopathogens. Using a multi-method approach (dilution plating and plate stamping), we isolated 159 fungal isolates from sediments at four sites. Internal transcribed spacer (ITS)-based phylogenetic analysis identified Ascomycota as the dominant phylum, along with 35 genera dominated by Cladosporium, Penicillium, and Aspergillus. ITS sequence similarities of 34 strains to known species were < 95%, suggesting potentially novel taxa. Of 23 representative isolates tested, 82.6% inhibited at least one of the following pathogens: Colletotrichum gloeosporioides, Ganoderma pseudoferreum, or Phellinus noxius. Nine selected strains in-hibited pathogen growth through both sterile culture filtrates and volatile organic compounds (VOCs), with effects varying by the strain-pathogen combination. Notably, VOCs from certain strains stimulated the growth of specific pathogens, demonstrating complex fungal chemical interactions. These results highlight the diversity and bio-control potential of culturable deep-sea fungi and support their evaluation as envi-ronmentally friendly agricultural biocontrol agents.
Keywords:
deep-sea fungi
; fungal diversity
; biological control
; antagonistic activity
; phylogenetic analysis
1. Introduction
The deep-sea, an environment characterized by extreme hydrostatic pressure, low temperature, perpetual darkness, and chronic nutrient limitation, is one of the most distinctive and least explored ecosystems on Earth [1]. Deep-sea microorganisms have evolved unique physiological and metabolic adaptations to survive under these conditions. Fungi are an important component of deep-sea eukaryotic microbial communities, and they have attracted increasing attention due to their remarkable potential for secondary metabolite production. Adaptation to high pressure and oligotrophic conditions has driven the diversification of fungal biosynthetic pathways, positioning deep-sea fungi as a promising and largely underexplored source of structurally diverse and biologically active natural products [2,3,4].
Studies employing both culture-dependent [5] and culture-independent approaches [6,7] have revealed diverse fungal communities in deep-sea sediments across multiple oceanic regions, including the Mariana Trench [8,9], the Indian Ocean basins [6,10], and the South China Sea [5,11,12]. Notably, studies in the South China Sea have found abundant culturable fungal populations. Due to the paucity of comparable investigations across different deep-sea regions, the extent to which these findings can be generalized beyond the South China Sea remains unclear. Genera such as Aspergillus, Penicillium, and Talaromyces have been frequently isolated and shown to exhibit strong abilities for secondary metabolite production and broad adaptability. These taxa have been shown to produce novel metabolites with antimicrobial, antitumor, and other biological activities [13,14,15,16,17,18]. These findings suggest that deep-sea fungi are an important component of marine microbial ecosystems, extending beyond the South China Sea, and they represent a valuable reservoir of bioactive compounds with potential applications outside the marine environment.
Unlike deep-sea bacteria and archaea, the diversity and ecological functions—particularly the biocontrol potential—of culturable deep-sea fungi have not been systematically explored, even for frequently isolated genera. In particular, there is a lack of studies that integrate deep-sea fungal resource exploration with functional screening relevant to practical challenges, such as the control of phytopathogens including Colletotrichum gloeosporioides [19], Ganoderma pseudoferreum [20], and Phellinus noxius [21], which threaten crop production and ecosystem stability. Given the limitations and environmental concerns associated with intensive pesticide use [22,23], there is growing interest in identifying alternative biological control strategies.
Endophytic fungi from terrestrial plants have been widely studied as biocontrol agents [24,25]. However, extreme environments such as the deep sea, with its distinct selective pressures (high hydrostatic pressure, low temperature, and intense competition for limited nutrients) may promote the evolution of fungi producing antimicrobial metabolites with unique chemical structures and modes of action [26,27]. Deep-sea fungi produce a diverse set of bioactive metabolites [13,14,15,16,17,18]; however, research has predominantly focused on their pharmaceutical potential. To the best of our knowledge, the antagonistic activity of deep-sea fungi—particularly through diffusible metabolites and volatile organic compounds (VOCs)—against agriculturally important phytopathogens has been largely unexplored.
To evaluate the application potential of culturable deep-sea fungi, we employed a multi-method cultivation strategy to systematically isolate and phylogenetically characterize fungal strains from deep-sea sediments. In contrast to previous work primarily oriented toward drug discovery, the present study adopted a screening approach targeting fungi antagonistic to major phytopathogens. Metabolically active taxa, particularly Aspergillus and Penicillium, were further assessed for in vitro antagonistic activity against C. gloeosporioides, G. pseudoferreum, and P. noxius. Moreover, both culture filtrates and VOCs were evaluated to comprehensively assess antifungal potential. This study presents an integrated framework for investigating the diversity of deep-sea fungi and evaluating their biocontrol potential.
2. Materials and Methods
2.1. Sample Collection and Processing
Four deep-sea sediment samples were collected from different locations at depths ranging from 2,595 to 6,000 m (Figure 1 and Supplementary Table S1). To generate the sampling map, base vector maps were obtained from the Aliyun Map Service in GeoJSON format. The vector data were converted to shapefile (shp) format and imported into ArcMap v10.8 (Esri, Redlands, CA, USA) for visualization. Sampling locations, geographic coordinates, and a scale bar were annotated and finalized in ArcMap. The sediment samples, serially designated DS01 through DS04, were collected using a sterile push corer, immediately sealed in sterile bags after retrieval, and stored at 4°C during transport. All samples were kindly provided by the Institute of Deep-Sea Science and Engineering, Chinese Academy of Sciences.
2.2. Isolation of Cultivable Fungi
Sediment samples were aseptically air-dried in a laminar flow cabinet and gently homogenized using a sterile mortar and pestle. To maximize fungal recovery, our isolation strategy combined dilution plating (with and without pretreatment) and plate stamping onto glucose-peptone-yeast extract (GPY) [28], malt extract agar [29], Fungus No. II medium [30], and Martin’s agar [31], i.e., 12 distinct isolation protocols (T01-T12, detailed in Supplementary Table S2). All media were supplemented with a filter-sterilized antibiotic cocktail (chloramphenicol, streptomycin, and ampicillin, each at 100 µg/mL) to inhibit bacterial growth.
2.2.1. Dilution Plate Technique
Each sample was diluted to disperse fungal propagules using a standard method consisting of suspending 2 g of sediment in 18 mL of sterile artificial seawater and shaking at 180 rpm for 3 h at room temperature [32,33]; and a pretreatment method, consisting of suspending the sediment in 18 mL of sterile artificial seawater containing 10% (v/v) ethylenediaminetetraacetic acid (EDTA) prior to shaking [34]. After shaking, samples were serially diluted up to 10⁻² in sterile artificial seawater. Aliquots (0.2 mL) from the dilution tubes of both dilution methods were spread onto the surfaces of the four types of agar media in three independent replicates. Plates were incubated at 28°C and monitored for 1–3 weeks.
2.2.2. Plate Stamping Technique
The plate stamping protocol was adopted from Jensen et al. [35]. Briefly, 1 g of sediment was air-dried in a biosafety cabinet for 1 h, and any aggregates were gently dispersed. A sterile foam plug (2 cm diameter) was pressed firmly onto the sediment and then stamped methodically in a clockwise pattern onto the surface of Fungus No. II and GPY agar plates to create a dilution gradient. This operation was performed in three independent replicates for each medium. Plates were incubated at 28°C for up to 3 weeks.
2.3. Purification, Morphological Grouping, and Preservation
Emerging fungal colonies from all plates were examined daily and grouped based on colony texture, color of aerial and substrate mycelia, production of soluble pigments, and growth rate [36]. Representative colonies from each distinct morphotype were carefully picked and repeatedly subcultured on fresh Potato Dextrose Agar (PDA; Hope Bio-Technology, Qingdao, China) plates until pure cultures were obtained. All purified strains were assigned unique labels (e.g., DSF001) and preserved on PDA slants at 4°C for short-term use and as 20% (v/v) glycerol stock suspensions stored at −80°C for long-term maintenance.
2.4. Molecular Identification and Phylogenetic Analysis
Molecular identification and phylogenetic analysis were performed following established methodologies [37]. Genomic DNA was extracted from mycelia using a commercial Fungal Genomic DNA Extraction Kit. The internal transcribed spacer (ITS) region was amplified using universal primers ITS1 and ITS4 and then purified and sequenced bidirectionally. Sequences were assembled and manually corrected. Preliminary taxonomic assignments of the ITS sequences were based on searches in the NCBI GenBank database using the BLASTn algorithm (summarized in Supplementary Table S3). Phylogenetic relationships among a subset of representative isolates were determined by first aligning the ITS sequences with reference sequences from closely related type species using ClustalW. A phylogenetic tree was constructed using the Neighbor-Joining method in MEGA v7.0, with bootstrap analysis based on 1000 replicates.
2.5. In Vitro Antagonism Assay: Dual Culture
Based on the results of phylogenetic analysis and the recognized biocontrol potential of genera such as Penicillium [14,16] and Aspergillus [15,18], we selected 23 representative fungal isolates for primary antagonism screening. The assay targeted five phytopathogens: three strains of Colletotrichum gloeosporioides (CH008 from Stylosanthes, 171-1 from mango, and RC178 from rubber tree), Ganoderma pseudoferreum (GP030), and Phellinus noxius (Pn006), kindly provided by the Chinese Academy of Tropical Agricultural Sciences.
The dual-culture assay was performed as described by Al-Rashdi et al. [38] with modifications. Briefly, a 5-mm mycelial plug of a pathogen was placed at the center of a PDA plate. All plates were supplemented with streptomycin sulfate at a final concentration of 100 mg/L. Then, a plug of a deep-sea fungal isolate was inoculated at four points equidistant (2.5 cm) from the center. Control plates contained only the pathogen. Plates were incubated at 28°C until the mycelial growth of the pathogen in the control plate either reached the plate edge or stopped advancing for three consecutive days. The percentage of mycelial growth inhibition (MGI) was calculated as: MGI (%) = [(Rc - Rt) / Rc] × 100, where Rc is the radial growth in the control and Rt is the radial growth in the treatment [24]. Each test was performed in three independent replicates.
2.6. Antifungal Activity of Culture Filtrates
Nine of the isolates exhibiting notable antagonism were selected for the culture filtrate antagonism assay. Each isolate was cultured in 50 mL of potato dextrose broth in a 250-mL flask at 28°C with shaking at 180 rpm for 7 days [39]. The culture broth was centrifuged, and the supernatant was filter-sterilized through a 0.22 µm membrane. This filtrate was mixed with PDA medium at a 4:1 (v/v) ratio. PDA mixed with sterile water served as the negative control. All media were supplemented with streptomycin sulfate at a final concentration of 100 mg/L. A 5-mm mycelial plug of the target pathogen was placed at the center of each prepared plate, which were then incubated at 28°C until the mycelial growth of the pathogen in the control plate either reached the plate edge or stopped advancing for three consecutive days. The percentage MGI was calculated as described in Section 2.5, with three independent replicates per treatment.
2.7. Antifungal Activity of Fungal Volatile Organic Compounds
The antifungal activities of VOCs produced by the nine selected isolates were evaluated using a dual-compartment Petri dish (90 mm diameter) method adapted from previous studies [40]. This setup physically separates two types of agar media while sharing a common headspace, enabling interaction solely through gaseous metabolites. For each test, two PDA plates supplemented with streptomycin sulfate (100 mg/L) were prepared. One plate was centrally inoculated with a 5-mm mycelial plug of the target phytopathogen. The companion plate was either centrally inoculated with a plug of a deep-sea fungal antagonist or left uninoculated to serve as the control. Immediately after inoculation, the two plates were joined base-to-base, and the junction was tightly sealed with three layers of Parafilm® [41] to prevent air exchange. All paired assemblies were incubated at 28°C until the mycelial growth of the pathogen in the control setup (paired with an uninoculated plate) either reached the plate edge or stopped advancing for three consecutive days. The radial growth of the pathogen was then measured, and the MGI was calculated using the formula described in Section 2.5. Each antagonist-pathogen combination was tested with three independent replicates.
2.8. Data and Statistical Analysis
All statistical analyses were performed using specialized software and online platforms. Bar plots and heatmaps were generated using ImageGP 2 (https://www.bic.ac.cn/ImageGP/) [42]. Culturable fungi diversity was measured by calculating alpha-diversity indices (including observed taxa, Shannon, Simpson, Pielou’s evenness, and Chao1) and beta-diversity based on the Bray-Curtis distance matrix using PAST software (version 4.17) [43]. Principal coordinate analysis (PCoA) for beta-diversity visualization was performed using the online tools of the Majorbio Cloud Platform (https://www.majorbio.com) [44].
Statistical analyses for the in vitro antagonism assays (dual culture, culture filtrate, and VOC) were conducted using IBM SPSS Statistics v26.0 [45]. MGI data are presented as the mean ± standard deviation of three biological replicates. Differences in MGI among different deep-sea fungal isolates against a specific pathogen or for one isolate against different pathogens were analyzed using one-way ANOVA. P-values <0.05 were considered statistically significant. Tukey’s honestly significant difference post hoc test was applied for multiple comparisons.
3. Results
3.1. Phylogenetic and Diversity Analysis of Culturable Fungal Strains
A total of 159 culturable fungal strains were isolated from four deep-sea sediment samples (Supplementary Table S3) using 12 distinct isolation protocols (Supplementary Table S2). Taxonomic status was determined by sequencing the ITS region, which identified 128, 30, and 1 strains as Ascomycota, Basidiomycota, and Mucoromycota, respectively. The ITS sequences of 125 strains were highly similar (95%–100%) to known species belonging to 34 genera. However, similarity matches of 34 strains (listed in Supplementary Table S3) were <95%, a threshold commonly used to identify species, indicating their potential as novel taxonomic units.
We selected 76 representative isolates for phylogenetic analysis based on combined ITS sequence and phenotypic data, generating the neighbor-joining tree shown in Figure 2. The 76 isolates belonged to the following 35 genera: Alfaria, Aspergillus, Botryosporium, Cladosporium, Coprinellus, Curvularia, Diaporthe, Epicoccum, Exobasidiomycetidae, Fusarium, Gliomastix, Hortaea, Hypoxylon, Leptospora, Letendraea, Meyerozyma, Montagnula, Neodevriesia, Neodidymella, Neogyrothrix, Neovaginatispora, Nigrograna, Nigrospora, Nodulisporium, Odontoefibula, Penicillium, Perenniporia, Peroneutypa, Phlebiopsis, Pseudocercospora, Pyrenochaetopsis, Setophaeosphaeria, Talaromyces, Torula, and Ustilaginoidea. These were distributed across 17 orders: Agaricales, Amplistromatales, Chaetothyriales, Cladosporiales, Diaporthales, Eurotiales, Helicobasidiales, Hymenochaetales, Hypocreales, Mycosphaerellales, Mucorales, Pleosporales, Polyporales, Russulales, Serinales, Xylariales, and Phomatosporales. Additionally, two, one, and one strains belonged to the class Dothideomycetes (order uncertain), class Exobasidiomycetes (order uncertain), and x Ascomycota (class and order uncertain), respectively. The dominant genera were Cladosporium (41 strains, 25.79%), followed by Penicillium (19 strains, 11.95%), and Aspergillus (15 strains, 9.43%) (Table 1).
The distribution of the 159 isolates across the four sampling sites is shown in Figure 3A and 3B. Site DS04 yielded the highest number and diversity of isolates (48 strains, 15 genera, 30.19%), followed by DS02 (41 strains, 11 genera, 25.79%), DS03 (36 strains, 15 genera, 22.64%), and DS01 (34 strains, 11 genera, 21.38%). Heatmap analysis (Supplementary Figure S1A) showed Cladosporium as the dominant (20.83%–31.71% of isolates) genus across all sites, followed by Penicillium (5.56%–17.65%). Aspergillus was isolated from all sites except DS01 and was particularly abundant at DS02, constituting 24.39% of its community. We identified 20 rare genera (defined as comprising <1% of total abundance), which were mostly detected at DS03 (7 genera), and least detected at DS02 (2 genera). Sites DS02 and DS04 had the fewest and highest proportion of potentially novel taxa, respectively.
Fungal recovery varied significantly with the isolation protocol, as shown in Figure 3C and 3D. Among the 12 treatment combinations, T12 yielded the highest number and diversity of isolates, accounting for 35.85% of the total (57 strains, 13 genera), followed by protocol T11 (42 strains, 14 genera, 26.42%). Specifically, the "stamping method" combined with either GPY or Fungi No. II medium was the most effective strategy, collectively accounting for 99 strains (62.26% of the total). The 10⁻¹ dilution (T1-T4) yielded 32 strains (20.13%, 14 genera), whereas the 10⁻² dilution (T5-T8) yielded 15 strains (9.43%, 12 genera), consistent with the dilution effect. The 10⁻¹ dilution on MEA (T2) yielded the highest number of isolates (10 strains, 6 genera); however, the differences among the different media were not significant. In contrast, at the 10⁻² dilution, Fungus No. II medium (T7) and Martin’s agar (T8) grew significantly more isolates (6 strains each) than GPY (T5) or MEA (T6). Pretreatment with EDTA (T9 and T10) yielded slightly more isolates, but this improvement was not statistically significant (P > 0.05) (Supplementary Figure S1B).
3.2. Alpha and Beta Diversity of Fungal Communities
Comparison of alpha and beta diversity indices of fungal communities across different sites and isolation methods revealed significant differences in alpha diversity among the four sampling sites (Table 2). The values of Shannon and Simpson indices indicate the highest species richness and diversity (H’ = 3.589, 1–D = 0.9699) at site DS04, followed by DS03 (H’ = 3.066, 1–D = 0.9302). The evenness index values for DS01, DS03, and DS04 are high (>0.97), with a value of 1.131 for DS04, indicating a relatively balanced abundance distribution, whereas the evenness at DS02 was lower (0.8143). Values of all indices consistently suggest lower community diversity at DS02. Notably, the Chao1 richness estimator was substantially higher than the observed species count for all sites. Results of PCoA based on Bray-Curtis dissimilarity reveal clear differences in community composition (beta diversity) among sites (Supplementary Figure S2A). The first two PCoA axes explain 71.45% of the total variation. The plot shows four distinct, nonoverlapping clusters corresponding to each site. Sites DS01 and DS03 show a similar clustering pattern, while DS02 and DS04 form distinct clusters separated from the others.
Alpha diversity also varied with the different isolation methods (Table 3). The observed number of genera ranged from 1 (T06) to 30 (T12), with the latter yielding the highest diversity (Taxa = 30, H’ = 3.242, 1–D = 0.9292, Evenness = 0.8526, Chao1 = 71.26). Methods using 10⁻² diluted soil suspensions yielded the lowest diversity. The evenness index values are close to or slightly above 1 for most dilution-based methods (T01-T10), reflecting an extremely even distribution of recovered taxa, likely a consequence of the limited number of isolates per method. In contrast, we observed lower evenness in T11 and T12 (0.7411 and 0.8526, respectively), suggesting the dominance of a few taxa. Notably, we found higher Chao1 values than the observed count for all methods, most dramatically for T11 (229.1 Chao1 vs. 24 observed), indicating that even the most effective isolation strategy captured only a fraction of the presumed fungal diversity. Results of PCoA of beta diversity reveal that the isolation method was the primary factor shaping the recoverable fungal community composition (Supplementary Figure S2B). The first two axes explained 55.22% of the variation, with the plot showing two distinct clusters: T01-T10, i.e., samples that underwent dilution-based methods forming a relatively tight cluster, whereas those from stamping methods (T11 and T12) were clearly separated and distant from the former. This result indicates that the stamping and dilution methods accessed distinct subsets of the fungal community.
3.3. In Vitro Antagonism Assessed by Dual-Culture Assay
The 23 representative fungal isolates screened for antagonism against phytopathogenes were selected based on a dereplication analysis of ITS sequences to capture phylogenetic diversity. We focused on Penicillium and Aspergillus because they are well-documented as prolific producers of a broad spectrum of antimicrobial metabolites [2,15,16]. Nineteen of these isolates (82.6%) exhibited antagonistic activity against at least one of the five phytopathogens tested, confirming our hypothesis that deep-sea fungi are a reservoir of potential biocontrol agents with a broad spectrum of antifungal activity (Table 4, Figure 4).
The antagonistic activity of isolates varied considerably according to the pathogen. The three strains of C. gloeosporioides were inhibited at rates that ranged from 50.2 ± 5.43% to 70.59 ± 0% for CH008; from 34.51 ± 0.68% to 81.96 ± 3.4% for 171-1; and from 3.75 ± 4.33% to 79.17 ± 9.02% for RC178. The basidiomycete pathogens were inhibited at rates that ranged from 0.39 ± 0.68% to 78.82 ± 2.04% against P. noxius Pn006, and from 3.93 ± 0% to a maximum inhibition of 92.72 ± 0% against G. pseudoferreum GP030.
We identified a subset of highly effective antagonists: Isolates DSF005, DSF007, DSF044, DSF059, DSF073, and DSF109 consistently performed well against multiple pathogens. For instance, DSF073 showed the highest inhibition(81.96% ± 3.4%) against C. gloeosporioides 171-1, whereas DSF044 exhibited the strongest overall activity (92.72% ± 0%) against G. pseudoferreum GP030. DSF005 demonstrated potent broad-spectrum activity, achieving high inhibition rates against P. noxius Pn006 (78.82% ± 2.04%) and several C. gloeosporioides strains (Figure 5A). These isolates form a robust subset of promising candidates for subsequent, mode-of-action-focused assays.
3.4. Antifungal Activity of Fungal Culture Filtrates
To determine the contribution of diffusible metabolites in the inhibition of phytopathogens, we evaluated the antifungal activities of sterile culture filtrates from nine fungal strains (DSF005, DSF007, DSF012, DSF044, DSF059, DSF073, DSF078, DSF109, and DSF149). These strains were selected based on the antagonistic spectrum observed in the dual-culture assay and their taxonomic classification. The results (Table 5, Figure 5B) reveal pronounced heterogeneity in inhibition mediated by diffusible metabolites.
C. gloeosporioides CH008 was most strongly inhibited by the culture filtrates of DSF005 and DSF044 at inhibition rates of 36.95 ± 1.39% and 30.92±1.39%, respectively. Several isolates, including DSF149, DSF007, and DSF012, showed moderate inhibition (22.49 ± 2.51%-24.9±3.03%), whereas DSF059, DSF078, and DSF109 displayed weak inhibition (<18%). Notably, the culture filtrate of DSF073 did not inhibit the mycelial growth of CH008.
P. noxius Pn006 was strongly inhibited by the culture filtrates of multiple isolates. Strong inhibition (>70%) was observed for DSF044 (74.12% ± 4.08%), DSF149 (70.59% ± 1.18%), and DSF109 (70.20% ± 11.18%), and DSF012 (63.53% ± 4.24%). Other isolates exhibited weak or no inhibitory effects against this pathogen.
C. gloeosporioides 171-1 was most strongly inhibited by DSF005 (40.83% ± 22.09%), with DSF012 and DSF073 showing moderate activity (~25%). C. gloeosporioides RC178 was inhibited by DSF109 at a rate of 18.43% ± 4.75%, followed by DSF012 and DSF149.
Among the tested isolates, DSF012 displayed the highest inhibitory activity against G. pseudoferreum GP030 (46.77% ± 4.27%), whereas DSF073 and DSF149 showed moderate inhibition. The remaining isolates exhibited little to no inhibitory effect and in some cases appeared to promote mycelial growth.
Overall, these results demonstrate that antifungal activity mediated by culture filtrates was highly pathogen-dependent and did not necessarily correlate with antagonistic performance observed in the dual-culture assay. These findings suggest that antifungal activity of the isolates is not fully explained by diffusible metabolite production.
3.5. Antifungal Activity of Fungal Volatile Organic Compounds
The antifungal activity of VOCs produced by the nine selected deep-sea fungal isolates varied according to both isolate and pathogen (Table 6, Figure 5C). Overall, VOC-mediated effects differed substantially from those observed in both dual-culture and culture filtrate assays, indicating a distinct and independent mode of antagonism.
C. gloeosporioides CH008 was most strongly inhibited by VOCs from DSF007, DSF044, and DSF073 at rates of 44.18 ± 1.39%, 44.18 ± 1.39%, and 44.98 ± 0.70%, respectively. Isolates DSF005, DSF059, DSF078, and DSF109 exhibited notable inhibition rates ranging from 30.12 ± 9.39% to 39.76 ± 4.78%. VOCs from DSF012 and DSF149 were weakly inhibitory at rates of 6.02 ± 2.41% and 20.48 ± 3.61%, respectively.
P. noxius Pn006 was modestly inhibited by VOCs of DSF109 at a rate of 24.31 ± 4.45%, followed by DSF059 at a rate of 18.04 ± 4.13%. VOCs of isolates DSF005, DSF012, DSF073, and DSF078 were weakly inhibitory at rates ranging from 6.67 ± 1.36% to 13.73 ± 3.40%, whereas VOCs of DSF007, DSF044, and DSF149 failed to inhibit phytopathogens under the tested conditions.
A distinct inhibition pattern was observed for C. gloeosporioides 171-1: VOCs from DSF059 and DSF078 suppressed mycelial growth at the highest rates of 33.74 ± 8.99% and 32.52 ± 7.62%, respectively. Moderate inhibition was observed for DSF109 at a rate of 24.39 ± 16.91%, whereas DSF012, DSF044, and DSF149 exhibited intermediate inhibition rates ranging from 16.67 ± 14.75% to 19.51 ± 7.32%. The remaining isolates displayed limited inhibition.
Notably, VOCs exerted both inhibitory and stimulatory effects, depending on the pathogen. For example, C. gloeosporioides RC178 was inhibited by VOCs from DSF149 at a rate of 24.51 ± 5.94%, whereas VOCs from DSF005, DSF007, DSF044, and DSF073 significantly promoted mycelial growth by approximately 25%. Similarly, the growth of G. pseudoferreum GP030 was weakly promoted by VOCs from DSF078 and DSF109. Conversely, VOCs from DSF044 strongly inhibited G. pseudoferreum GP030, achieving a maximum inhibition of 45.00 ± 14.74%.
Collectively, these results demonstrate that fungal VOCs can both inhibit and stimulate growth of phytopathogens, underscoring the ecological complexity of VOC-driven fungal antagonism. Therefore, it is necessary to evaluate multiple antagonistic mechanisms when screening deep-sea fungi for biocontrol applications.
4. Discussion
We systematically assessed culturable fungal diversity from deep-sea sediments and evaluated their potential as agricultural biocontrol agents. Using a multifaceted isolation strategy, we isolated 159 fungal strains representing 35 genera. Our approach was highly effective at accessing a broad spectrum of culturable taxa by combining different dilution and stamping methods. ITS sequence analysis identified 34 isolates with similarities below 95%, indicating novel species. Importantly, this potential novelty was observed across sampling sites from different deep-sea regions, rather than being restricted to a single geographic area. These findings are consistent with the growing consensus that deep-sea ecosystems are underexplored biodiversity hotspots with significant potential for biotechnological and agricultural bioprospecting [3,46]. Ascomycota was the dominant phylum of culturable fungi, with Cladosporium, Penicillium, and Aspergillus as the most prevalent genera. This taxonomic profile aligns with reports from diverse marine environments and reflects the well-documented metabolic versatility and secondary metabolite–producing capacity of these taxa [47,48].
The results of in vitro antagonism assays provide compelling preliminary evidence supporting the biocontrol potential of deep-sea-derived fungi. Among the 23 representative isolates screened, 82.6% inhibited at least one of the tested phytopathogens (C. gloeosporioides, G. pseudoferreum, and P. noxius), which are responsible for economically important plant diseases worldwide. Isolates DSF005, DSF007, DSF044, DSF059, DSF073, and DSF109 consistently exhibited strong and broad-spectrum antagonistic activity in dual-culture assays. Notably, DSF044 inhibited the mycelial growth of G. pseudoferreum GP030 at an exceptionally high level (92.72% ± 0.00%), whereas DSF073 suppressed C. gloeosporioides 171-1 by 81.96 ± 3.40%. DSF005 strongly inhibited P. noxius Pn006 at a rate of 78.82 ± 2.04%. These inhibition levels are comparable to, and in some cases exceed, those reported for well-characterized terrestrial biocontrol fungi [49], suggesting that deep-sea fungi may have evolved potent antifungal strategies in response to long-term exposure to extreme conditions of high hydrostatic pressure, low temperature, and chronic nutrient limitation.
Analyses of culture filtrates and VOCs revealed that deep-sea fungi employ multiple and distinct antagonistic mechanisms. In several cases, the culture filtrates were more inhibitory against phytopathogens than direct fungal exposure, as exemplified by the DSF044 filtrate, which suppressed P. noxius Pn006 by 74.12%, highlighting the important role of diffusible secondary metabolites. In addition, VOCs produced by certain isolates inhibited only specific pathogens independently; for instance, VOCs from DSF044 inhibited G. pseudoferreum GP030 by 45%. Because of the volatile nature of these compounds, no direct physical contact is required, indicating biotechnological applications such as disease suppression in enclosed environments as environmentally benign alternatives to chemical fumigants [50]. Notably, we also observed that VOCs from some deep-sea fungi promoted the growth of specific pathogens, such as C. gloeosporioides RC178. This bidirectional effect underscores the complexity of VOC-mediated fungal interactions and suggests the involvement of nuanced chemical ecological mechanisms. These findings emphasize the need for a nuanced approach (i.e., considering both inhibitory and stimulatory effects) when evaluating fungal VOCs for biocontrol applications [51].
We acknowledge several limitations of the present study. First, our culture-dependent approach likely underestimates the true diversity of deep-sea fungal communities, given the prevalence of unculturable taxa in extreme environments. Future studies should incorporate culture-independent techniques, such as metagenomics and metatranscriptomics, to provide a more comprehensive understanding of community structure and functional potential [11]. Second, all antagonism assays were conducted in vitro, which cannot fully replicate the complexity of natural or agricultural ecosystems, where microbial interactions, host plant responses, and environmental variables interact dynamically [52]. Consequently, applying our results to field conditions should be undertaken with caution. This limitation should be addressed by performing greenhouse and field trials to assess biocontrol efficacy, environmental persistence, and ecological safety. Finally, the development and optimization of deep-sea fungi–based biocontrol strategies will require efforts to characterize both the chemical nature of the active metabolites and their molecular mechanisms of action.
5. Conclusion
This study employed a targeted screening approach to isolate and characterize culturable fungi from deep-sea sediments and evaluate their antagonistic activity against phytopathogens. The resulting diverse collection of isolates includes several strains with low ITS sequence similarity to known species, underscoring the view that the deep-sea environment is a reservoir of previously undescribed fungal diversity. The fungal community was dominated by genera such as Penicillium and Aspergillus, and included strains that are exhibited both specific and broad-spectrum inhibition against phytopathogens. Antagonistic activity was mediated by a combination of direct mycelial interaction, diffusible metabolites, and VOCs, highlighting multiple means of pathogen suppression. Notably, we also observed opposing (i.e., inhibitory and stimulatory) VOC-mediated effects, reflecting the complex chemical ecology of fungal interactions, which underscores the necessity of comprehensive screening in biocontrol agent selection. Results of our in vitro assays suggest that deep-sea fungi may be a promising source of novel biocontrol strategies. Our findings provide a foundation for future studies focusing on metabolite identification, mode-of-action analyses, and validation under controlled and field conditions.
Supplementary Materials
The following supporting information can be downloaded at: Preprints.org. Supplementary Table S1. Sampling details of deep-sea sediments, including site coordinates, depth, and sample type. Supplementary Table S2. Comparison of different pretreatment and culture methods for the isolation of culturable fungi from deep-sea sediments. Supplementary Table S3. Identification and BLAST results of fungal isolates from deep-sea sediments. Figure S1. Heatmap of genus-level distribution across sampling sites (A) and isolation methods (B). Figure S2. Beta diversity analysis of culturable fungal communities, (A) by sampling site (B) by isolation method.
Author Contributions
Conceptualization, K.Y.; methodology, K.Y., H.F. and X.X.; software, X.X., J.G. and J.J.L.; validation, X.X. and H.F.; formal analysis, X.X. and H.F.; investigation, X.X., H.F., Z.L., T.L., J.G., J.P.L. and H.W.; resources, H.F. and K.Y.; data curation, X.X., H.F., Z.L., T.L., J.G., J.P.L. and H.W.; writing—original draft preparation, X.X. and H.F.; writing—review and editing, J.J.L., Z.L., T.L., J.G., J.P.L., H.W. and K.Y.; visualization, X.X., H.F. and J.J.L.; supervision, K.Y.; project administration, X.X. and K.Y.; funding acquisition, X.X., H.F. and K.Y. All authors have read and agreed to the published version of the manuscript.
Funding
This research was funded by the Scientific Research Foundation of Hainan Tropical Ocean University (Grant No. RHDRC202338), the Natural Science Fund Projects of Hainan Province (Grant No. 321RC748) and Hainan Provincial Science and Technology Talent Innovation Project (Grant No. KJRC2023B18).
Institutional Review Board Statement
Not applicable.
Informed Consent Statement
Not applicable.
Data Availability Statement
The data generated in this study have been deposited in the GenBank database. The high-quality raw genome sequence data are available in the NCBI database under accession numbers PQ302328-PQ302480, PX857774-PX857779.
Acknowledgments
The deep-sea sediment samples used in this study were kindly provided by Prof. Yong Wang from the Institute of Deep-sea Science and Engineering, Chinese Academy of Sciences. We also thank Wenxin Yuan from Hainan Tropical Ocean University for assistance with figure preparation.
Conflicts of Interest
The authors declare no conflicts of interest.
Abbreviations
The following abbreviations are used in this manuscript:
| GPY | Glucose-peptone-yeast |
| ITS | Internal transcribed spacer |
| MGI | Mycelial growth inhibition |
| PCoA | Principal coordinate analysis |
| PDA | Potato Dextrose Agar |
| VOC | Volatile organic compounds |
References
- Morita, R.Y. Starvation-survival of heterotrophs in the marine environment. Adv. Microb. Ecol. 1982, 6, 171–198. [Google Scholar] [CrossRef]
- Zhou, Y.; Gao, X.; Shi, C.; Li, M.; Jia, W.; Shao, Z.; Yan, P. Diversity and antiaflatoxigenic activities of culturable filamentous fungi from deep-sea sediments of the South Atlantic Ocean. Mycobiology 2021, 49, 151–160. [Google Scholar] [CrossRef]
- Feng, L.; Song, Q.; Jiang, Q.; Li, Z. The horizontal and vertical distribution of deep-sea sediments fungal community in the South China Sea. Front. Mar. Sci. 2021, 8, 592784. [Google Scholar] [CrossRef]
- Poli, A.; Finore, I.; Romano, I.; Gioiello, A.; Lama, L.; Nicolaus, B. Microbial diversity in extreme marine habitats and their biomolecules. Microorganisms 2017, 5, 25. [Google Scholar] [CrossRef]
- Zhang, X.-Y.; Zhang, Y.; Xu, X.-Y.; Qi, S.-H. Diverse deep-sea fungi from the south china sea and their antimicrobial activity. Curr. Microbiol. 2013, 67, 525–530. [Google Scholar] [CrossRef]
- Singh, P.; Raghukumar, C.; Verma, P.; Shouche, Y. Fungal community analysis in the deep-sea sediments of the central indian basin by culture-independent approach. Microb. Ecol. 2011, 61, 507–517. [Google Scholar] [CrossRef] [PubMed]
- Xu, W.; Luo, Z.-H.; Guo, S.; Pang, K.-L. Fungal community analysis in the deep-sea sediments of the pacific ocean assessed by comparison of ITS, 18S and 28S ribosomal DNA regions. Deep Sea Res. I: Oceanogr. Res. Pap. 2016, 109, 51–60. [Google Scholar] [CrossRef]
- Nagano, Y.; Nagahama, T.; Hatada, Y.; Nunoura, T.; Takami, H.; Miyazaki, J.; Takai, K.; Horikoshi, K. Fungal diversity in deep-sea sediments – the presence of novel fungal groups. Fungal Ecol. 2010, 3, 316–325. [Google Scholar] [CrossRef]
- Takami, H.; Inoue, A.; Fuji, F.; Horikoshi, K. Microbial flora in the deepest sea mud of the Mariana Trench. FEMS Microbiol. Lett. 1997, 152, 279–285. [Google Scholar] [CrossRef]
- Damare, S.; Raghukumar, C.; Raghukumar, S. Fungi in deep-sea sediments of the central Indian basin. Deep Sea Res. I: Oceanogr. Res. Pap. 2006, 53, 14–27. [Google Scholar] [CrossRef]
- Lai, X.; Cao, L.; Tan, H.; Fang, S.; Huang, Y.; Zhou, S. Fungal communities from methane hydrate-bearing deep-sea marine sediments in South China Sea. ISME J. 2007, 1, 756–762. [Google Scholar] [CrossRef]
- Qu, J.; Liu, K.H.; Ding, X.W.; Deng, B.W.; Chen, W.Q.; Guo, Q.L.; Tian, X.P.; Zhang, S.; Li, W.J. Fungal diversity and enzyme activities in marine sediments in the South China Sea. Acta Microbiol. Sin. 2014, 54, 552–562. [Google Scholar]
- Yang, S.-Q.; Song, Q.; Li, X.-M.; Li, X.; Li, H.-L.; Meng, L.-H.; Wang, B.-G. Antimicrobial polyketides and sesquiterpene lactones from the deep-sea cold-seep-derived fungus Talaromyces minioluteus CS-113 triggered by the histone deacetylase inhibitor SAHA. Org. Biomol. Chem. 2023, 21, 2575–2585. [Google Scholar] [CrossRef]
- Wang, W.; Liao, Y.; Zhang, B.; Gao, M.; Ke, W.; Li, F.; Shao, Z. Citrinin monomer and dimer derivatives with antibacterial and cytotoxic activities isolated from the deep sea-derived fungus Penicillium citrinum NLG-S01-P1. Mar. Drugs 2019, 17, 46. [Google Scholar] [CrossRef] [PubMed]
- Huang, Z.-H.; Liang, X.; Gu, Q.; Ma, X.; Qi, S.-H. Punicesterones A–G, polyhydroxylated mycoecdysteroids from the deep-sea-derived fungus Aspergillus Puniceus SCSIO Z021. Phytochemistry 2023, 205, 113511. [Google Scholar] [CrossRef]
- Liu, Y.-P.; Fang, S.-T.; Shi, Z.-Z.; Wang, B.-G.; Li, X.-N.; Ji, N.-Y. Phenylhydrazone and quinazoline derivatives from the cold-seep-derived fungus Penicillium oxalicum. Mar. Drugs. 2021, 19, 9. [Google Scholar] [CrossRef]
- Ding, X.M.; Ye, W.X.; Tan, B. Talachalasins A-C, Undescribed cytochalasans from the deep-sea-derived fungus Talaromyces muroii Sp. SCSIO 40439. Chin. J. Chem 2023, 41, 915–923. [Google Scholar] [CrossRef]
- Magot, F.; Van Soen, G.; Buedenbender, L.; Li, F.; Soltwedel, T.; Grauso, L.; Mangoni, A.; Blümel, M.; Tasdemir, D. Bioactivity and metabolome mining of deep-sea sediment-derived microorganisms reveal new hybrid PKS-NRPS macrolactone from Aspergillus versicolor PS108-62. Mar. Drugs. 2023, 21, 95. [Google Scholar] [CrossRef] [PubMed]
- Zhang, B.; Huang, L.; Xie, Q.; Luo, H.; Wang, Q.; An, B. Characterisation of polyamines and their biosynthetic pathways contributing to postharvest anthracnose resistance in mango (Mangifera indica L.). Plant. Biotechnol. J. 2026, 0–1. [Google Scholar] [CrossRef]
- Lu, J.; Qin, C.; Huo, S.; Wang, H.; Norvienyeku, J.; Miao, W.; Liu, W. Characterization of Ganoderma pseudoferreum mitogenome revealed a remarkable evolution in genome size and composition of protein-coding genes. Front. Plant Sci. 2025, 16, 1532782. [Google Scholar] [CrossRef] [PubMed]
- Meng, X.; Luo, Y.; Zhao, X.; Fu, Y.; Zou, L.; Cai, H.; Zhou, Y.; Tu, M. Isolation, identification, and biocontrol mechanisms of endophytic Burkholderia arboris DHR18 from rubber tree against red root rot disease. Microorganisms 2024, 12, 1793. [Google Scholar] [CrossRef]
- Komárek, M.; Čadková, E.; Chrastný, V.; Bordas, F.; Bollinger, J.-C. Contamination of vineyard soils with fungicides: a review of environmental and toxicological aspects. Environ. Int. 2010, 36, 138–151. [Google Scholar] [CrossRef]
- Piotrowska-Seget, Z.; Engel, R.; Nowak, E.; Kozdrój, J. Successive soil treatment with captan or oxytetracycline affects non-target microorganisms. World J. Microbiol. Biotechnol. 2008, 24, 2843–2848. [Google Scholar] [CrossRef]
- Kim, M.; Nguyen, M.H.; Lee, S.; Han, W.; Kim, M.; Jeon, H.; Lee, J.; Seo, S.; Kim, N.; Shin, K. Diversity of endophytic fungi isolated from Prunus yedoensis and their antifungal activity against wood decay fungi. Microorganisms 2025, 13, 617. [Google Scholar] [CrossRef] [PubMed]
- Nifakos, K.; Tsalgatidou, P.C.; Tsafouros, A.; Angeli, C.; Kartsonas, E.; Delis, C.; Charalampopoulos, I.; Venieraki, A.; Katinakis, P. Colletotrichum Scovillei and prospective biocontrol agents isolated from asymptomatic olive trees. Microorganisms 2025, 13, 2838. [Google Scholar] [CrossRef]
- Li, X.-D.; Li, X.; Li, X.-M.; Xu, G.-M.; Liu, Y.; Wang, B.-G. 20-nor-isopimarane epimers produced by Aspergillus wentii SD-310, a fungal strain obtained from deep sea sediment. Mar. Drugs 2018, 16, 440. [Google Scholar] [CrossRef] [PubMed]
- Yang, Z.; Kaliaperumal, K.; Zhang, J.; Liang, Y.; Guo, C.; Zhang, J.; Yang, B.; Liu, Y. Antifungal fatty acid derivatives against Penicillium italicum from the deep-sea fungus Aspergillus terreus SCSIO 41202. Nat. Prod. Res. 2021, 35, 4394–4401. [Google Scholar] [CrossRef]
- Huang, L.; Lan, W.-J.; Li, H.-J. Two new hirsutane-type sesquiterpenoids chondrosterins N and O from the marine fungus Chondrostereum sp. Nat. Prod. Res. 2018, 32, 1578–1582. [Google Scholar] [CrossRef] [PubMed]
- Szulc, J.; Ruman, T.; Gutarowska, B. Metabolome profiles of moulds on carton-gypsum board and malt extract agar medium obtained using an auNPET SALDI-TOF-MS method. Int. Biodeterior Biodegrad. 2017, 125, 13–23. [Google Scholar] [CrossRef]
- Yang, H.X. Secondary metabolites from endophytic fungi harbored in the medicinal plant mahonia fortunei using OSMAC strategy. Ph.D. Thesis, Qingdao University, Qingdao, China, 2020. [Google Scholar]
- Thayer, J.D.; Martin, J.E. A selective medium for the cultivation of N. gonorrhoeae and N. meningitidis. Public Health Reports (1896-1970) 1964, 79, 49. [Google Scholar] [CrossRef]
- Ruttanasutja, R.; Pathom-Aree, W. Selective isolation of cultivable actinomycetes from Thai coastal marine sediment. Chiang Mai J. Sci 2015, 42, 88–103. [Google Scholar]
- Pathom-Aree, W.; Duangmal, K.; Ward, A.C.; Bull, A.T.; Goodfellow, M. Biosystematics and comparative genomics of actinomycetes isolated from Norwegian Fjord sediments. Ph.D. Thesis, University of Newcastle, Newcastle, UK, 2006. [Google Scholar]
- Damare, S.; Raghukumar, C. Fungi and macroaggregation in deep-sea sediments. Microb. Ecol. 2008, 56, 168–177. [Google Scholar] [CrossRef]
- Jensen, P.R.; Mincer, T.J.; Williams, P.G.; Fenical, W. Marine actinomycete diversity and natural product discovery. Antonie Van Leeuwenhoek 2005, 87, 43–48. [Google Scholar] [CrossRef]
- Jin, L.; Yang, L.; Li, W.; Xu, D.; Yang, N.; Li, G.; Wan, P. Diversity and biocontrol potential of culturable endophytic fungi in cotton. Front. Microbiol. 2021, 12, 698930. [Google Scholar] [CrossRef] [PubMed]
- Raja, H.A.; Miller, A.N.; Pearce, C.J.; Oberlies, N.H. Fungal identification using molecular tools: a primer for the natural products research community. J. Nat. Prod. 2017, 80, 756–770. [Google Scholar] [CrossRef] [PubMed]
- Al-Rashdi, F.K.H.; Al-Sadi, A.M.; Al-Riyamy, B.Z.; Maharachchikumbura, S.S.N.; Al-Sabahi, J.N.; Velazhahan, R. Endophytic fungi from the medicinal plant aloe Dhufarensis lavranos exhibit antagonistic potential against phytopathogenic fungi. S. Afr. J. Bot. 2020, 147, 1078–1085. [Google Scholar] [CrossRef]
- Nguyen, M.H.; Park, I.-K.; Lee, J.K.; Lee, D.-H.; Shin, K. Antifungal activity of culture filtrate from endophytic fungus Nectria balsamea E282 and its fractions against Dryadomyces quercus-mongolicae. Forests 2024, 15, 332. [Google Scholar] [CrossRef]
- Chávez-Avilés, M.N.; García-Álvarez, M.; Ávila-Oviedo, J.L.; Hernández-Hernández, I.; Bautista-Ortega, P.I.; Macías-Rodríguez, L.I. Volatile organic compounds produced by Trichoderma asperellum with antifungal properties against Colletotrichum acutatum. Microorganisms. Available online. 2024, 12. [CrossRef]
- Barakat, F.M.; Abada, K.A.; Abou-Zeid, N.M.; El-Gammal, Y.H.E. Effect of volatile and non-volatile compounds of Trichoderma spp. On Botrytis fabae. Am. J. Life Sci 2014, 2, 11–18. [Google Scholar]
- Chen, T.; Liu, Y.; Chen, T.; Yang, M.; Fan, S.; Shi, M.; Wei, B.; Lv, H.; Cao, W.; Wang, C. Imagegp 2 for enhanced data visualization and reproducible analysis in biomedical research. iMeta 2024, 3, e239. [Google Scholar] [CrossRef]
- Hammer, Ø.; Harper, D.A.T.; Ryan, P.D. PAST: paleontological statistics software package for education and data analysis. Palaeontol. Electron 2001, 4, 9. [Google Scholar]
- Han, C.; Shi, C.; Liu, L.; Han, J.; Yang, Q.; Wang, Y.; Li, X.; Fu, W.; Gao, H.; Huang, H.; Zhang, X.; Yu, K. Majorbio Cloud 2024: update single-cell and multiomics workflows. iMeta 2024, 3, e217. [Google Scholar] [CrossRef]
- IBM Corp. IBM SPSS Statistics for Windows, Version 26.0; IBM Corp: NY, USA; Armonk, 2019. [Google Scholar]
- Wang, Y.-T.; Xue, Y.-R.; Liu, C.-H. A brief review of bioactive metabolites derived from deep-sea fungi. Mar. Drugs 2015, 13, 4594–4616. [Google Scholar] [CrossRef]
- Yurchenko, E.A. Bioactive compounds from marine sediment derived fungi. Mar. Drugs 2022, 20, 242. [Google Scholar] [CrossRef]
- Hyde, K.D.; Xu, J.; Rapior, S.; Jeewon, R.; Lumyong, S.; Niego, A.G.T.; Abeywickrama, P.D.; Aluthmuhandiram, J.V.S.; Brahamanage, R.S.; Brooks, S. The amazing potential of fungi: 50 ways we can exploit fungi industrially. Fungal Divers. 2019, 97, 1–136. [Google Scholar] [CrossRef]
- Thambugala, K.M.; Daranagama, D.A.; Phillips, A.J.L.; Kannangara, S.D.; Promputtha, I. Fungi Vs. fungi in biocontrol: an overview of fungal antagonists applied against fungal plant pathogens. Front. Cell. Infect. Microbiol. 2020, 10, 604923. [Google Scholar] [CrossRef] [PubMed]
- Gao, Y.; Ren, H.; He, S.; Duan, S.; Xing, S.; Li, X.; Huang, Q. Antifungal activity of the volatile organic compounds produced by Ceratocystis fimbriata Strains WSJK-1 and Mby. Front. Microbiol. 2022, 13, 1034939. [Google Scholar] [CrossRef] [PubMed]
- Palmieri, D.; Ianiri, G.; Del Grosso, C.; Barone, G.; De Curtis, F.; Castoria, R.; Lima, G. Advances and perspectives in the use of biocontrol agents against fungal plant diseases. Horticulturae 2022, 8, 577. [Google Scholar] [CrossRef]
- Yang, Y.; Chen, Y.; Cai, J.; Liu, X.; Huang, G. Antifungal activity of volatile compounds generated by endophytic fungi Sarocladium brachiariae HND5 against Fusarium oxysporum f. sp. cubense. PLoS. One. 2021, 16, e0260747. [Google Scholar] [CrossRef] [PubMed]
Figure 1.
Sampling locations and corresponding water depths of deep-sea sediment samples.
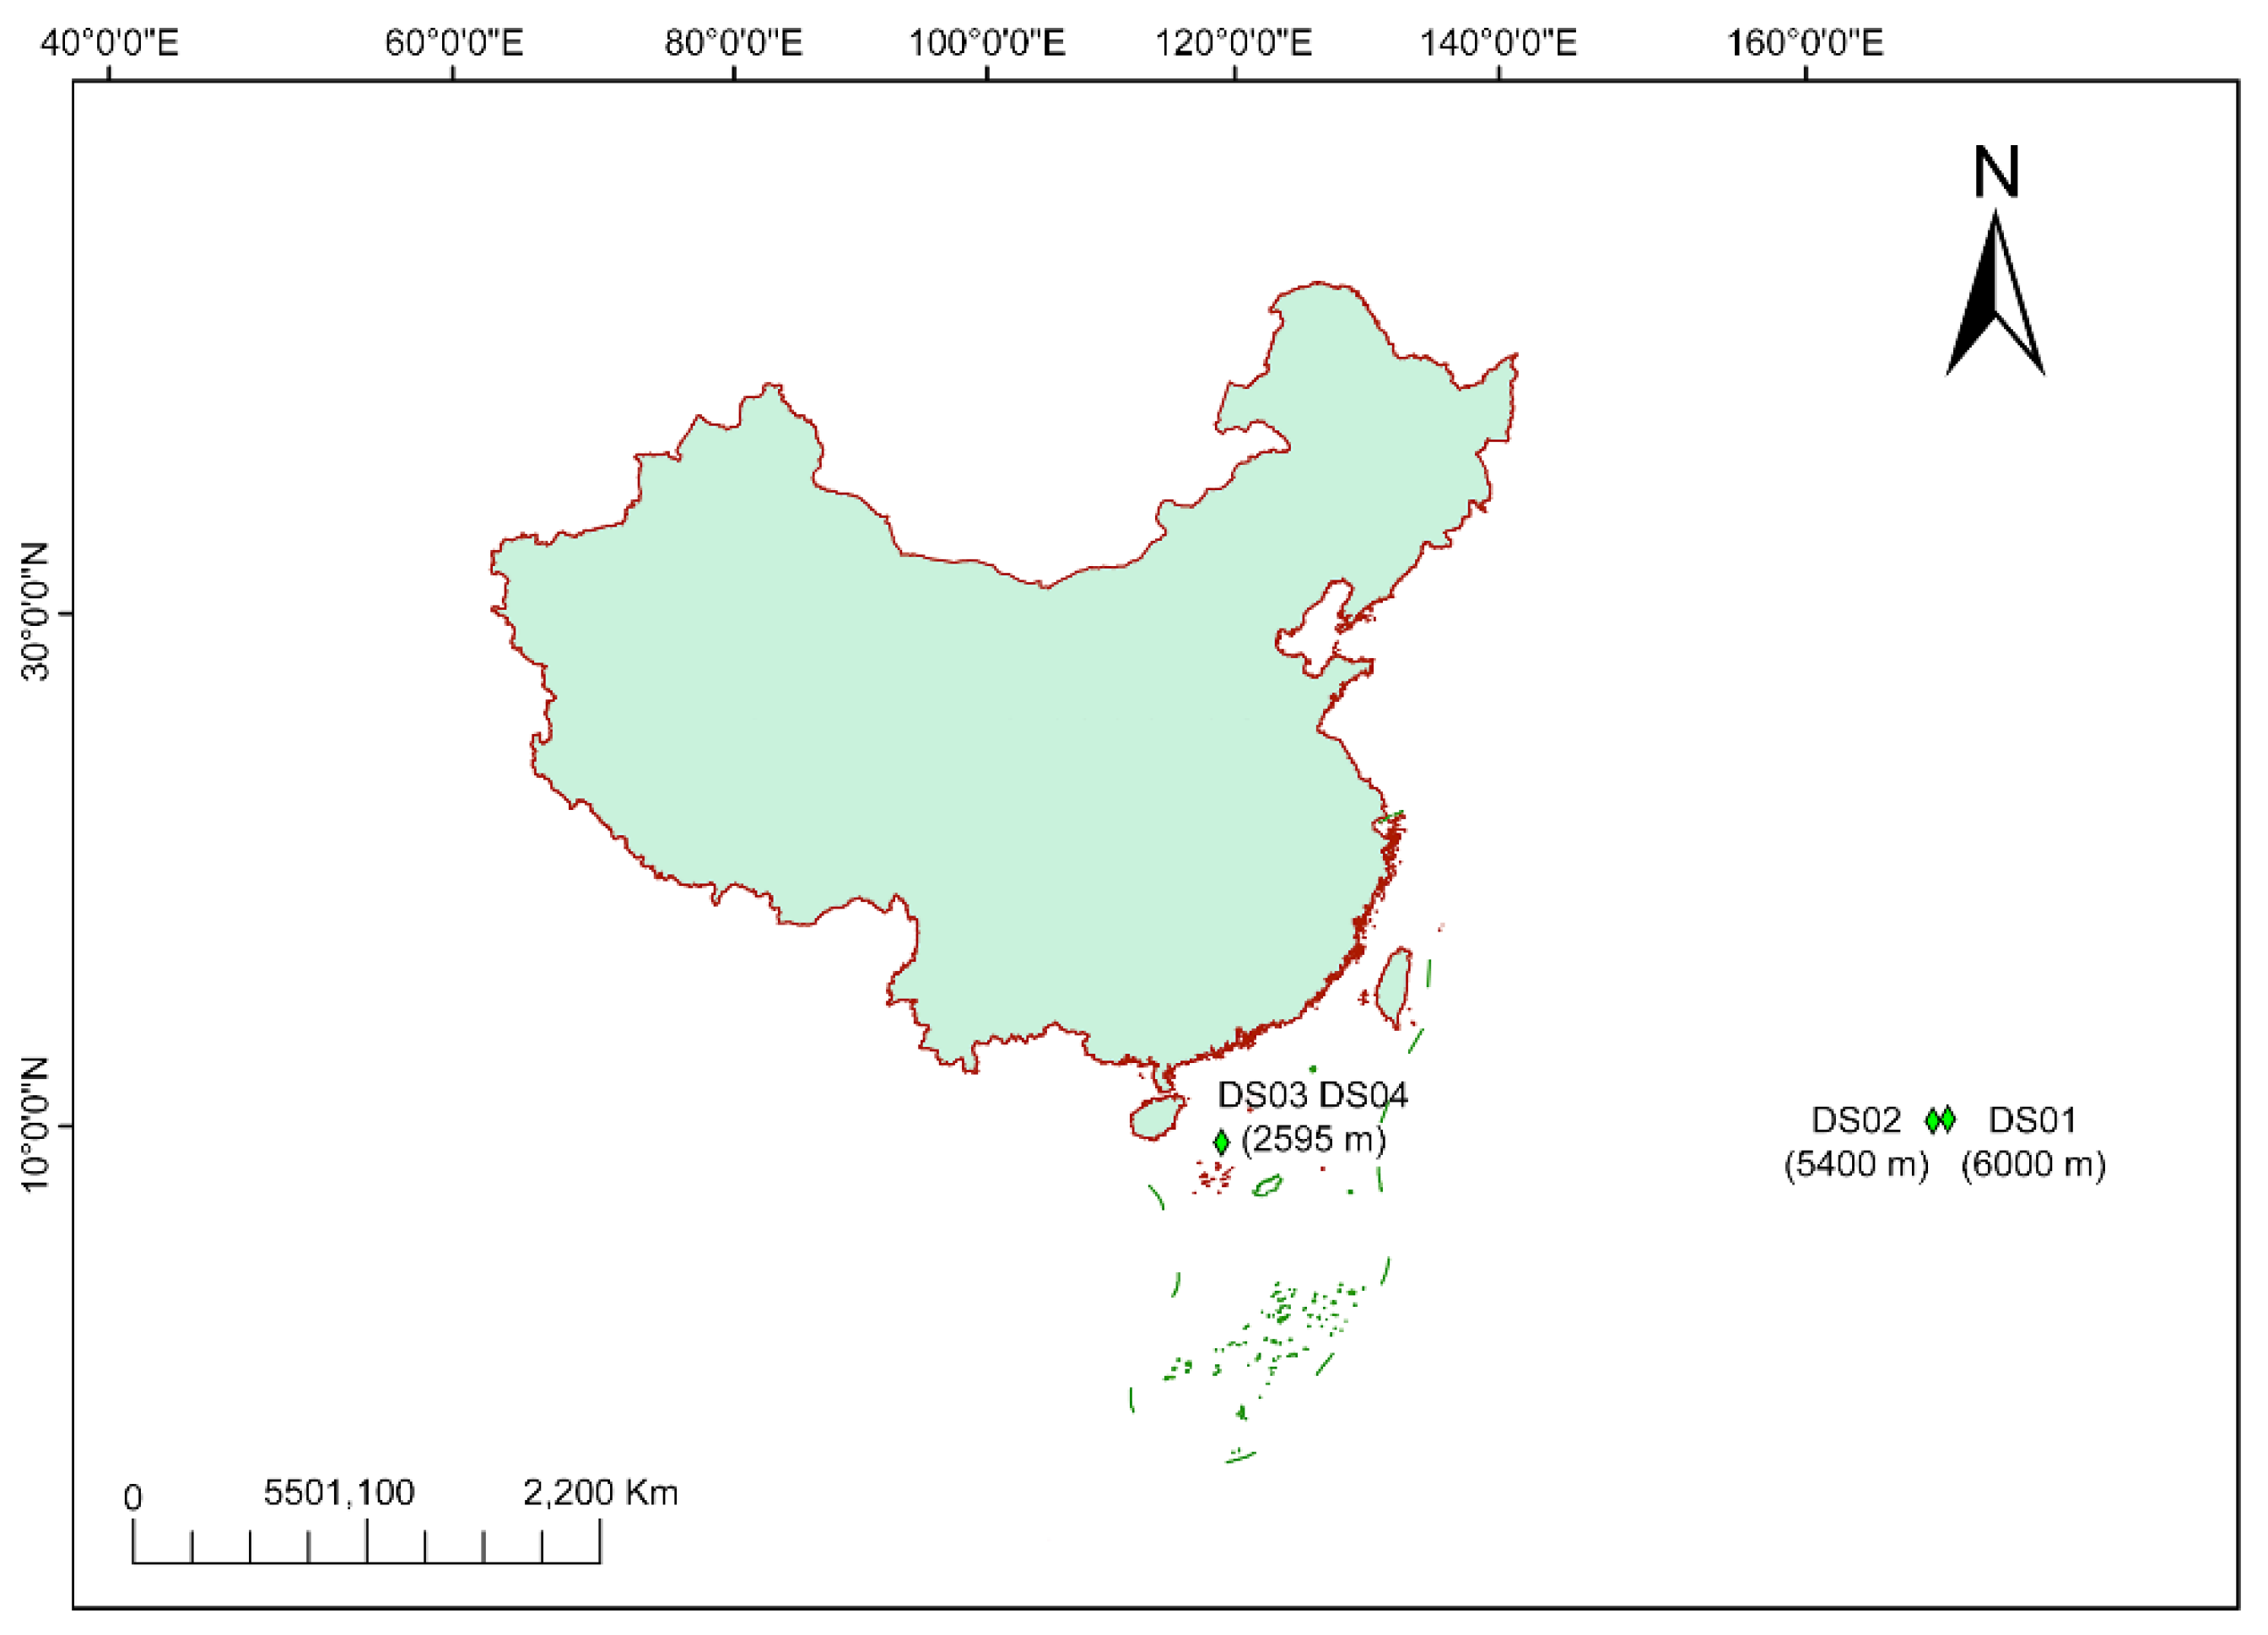
Figure 2.
Neighbor-joining phylogenetic tree based on ITS sequences of representative fungal isolates obtained from deep-sea sediments.
Figure 2.
Neighbor-joining phylogenetic tree based on ITS sequences of representative fungal isolates obtained from deep-sea sediments.
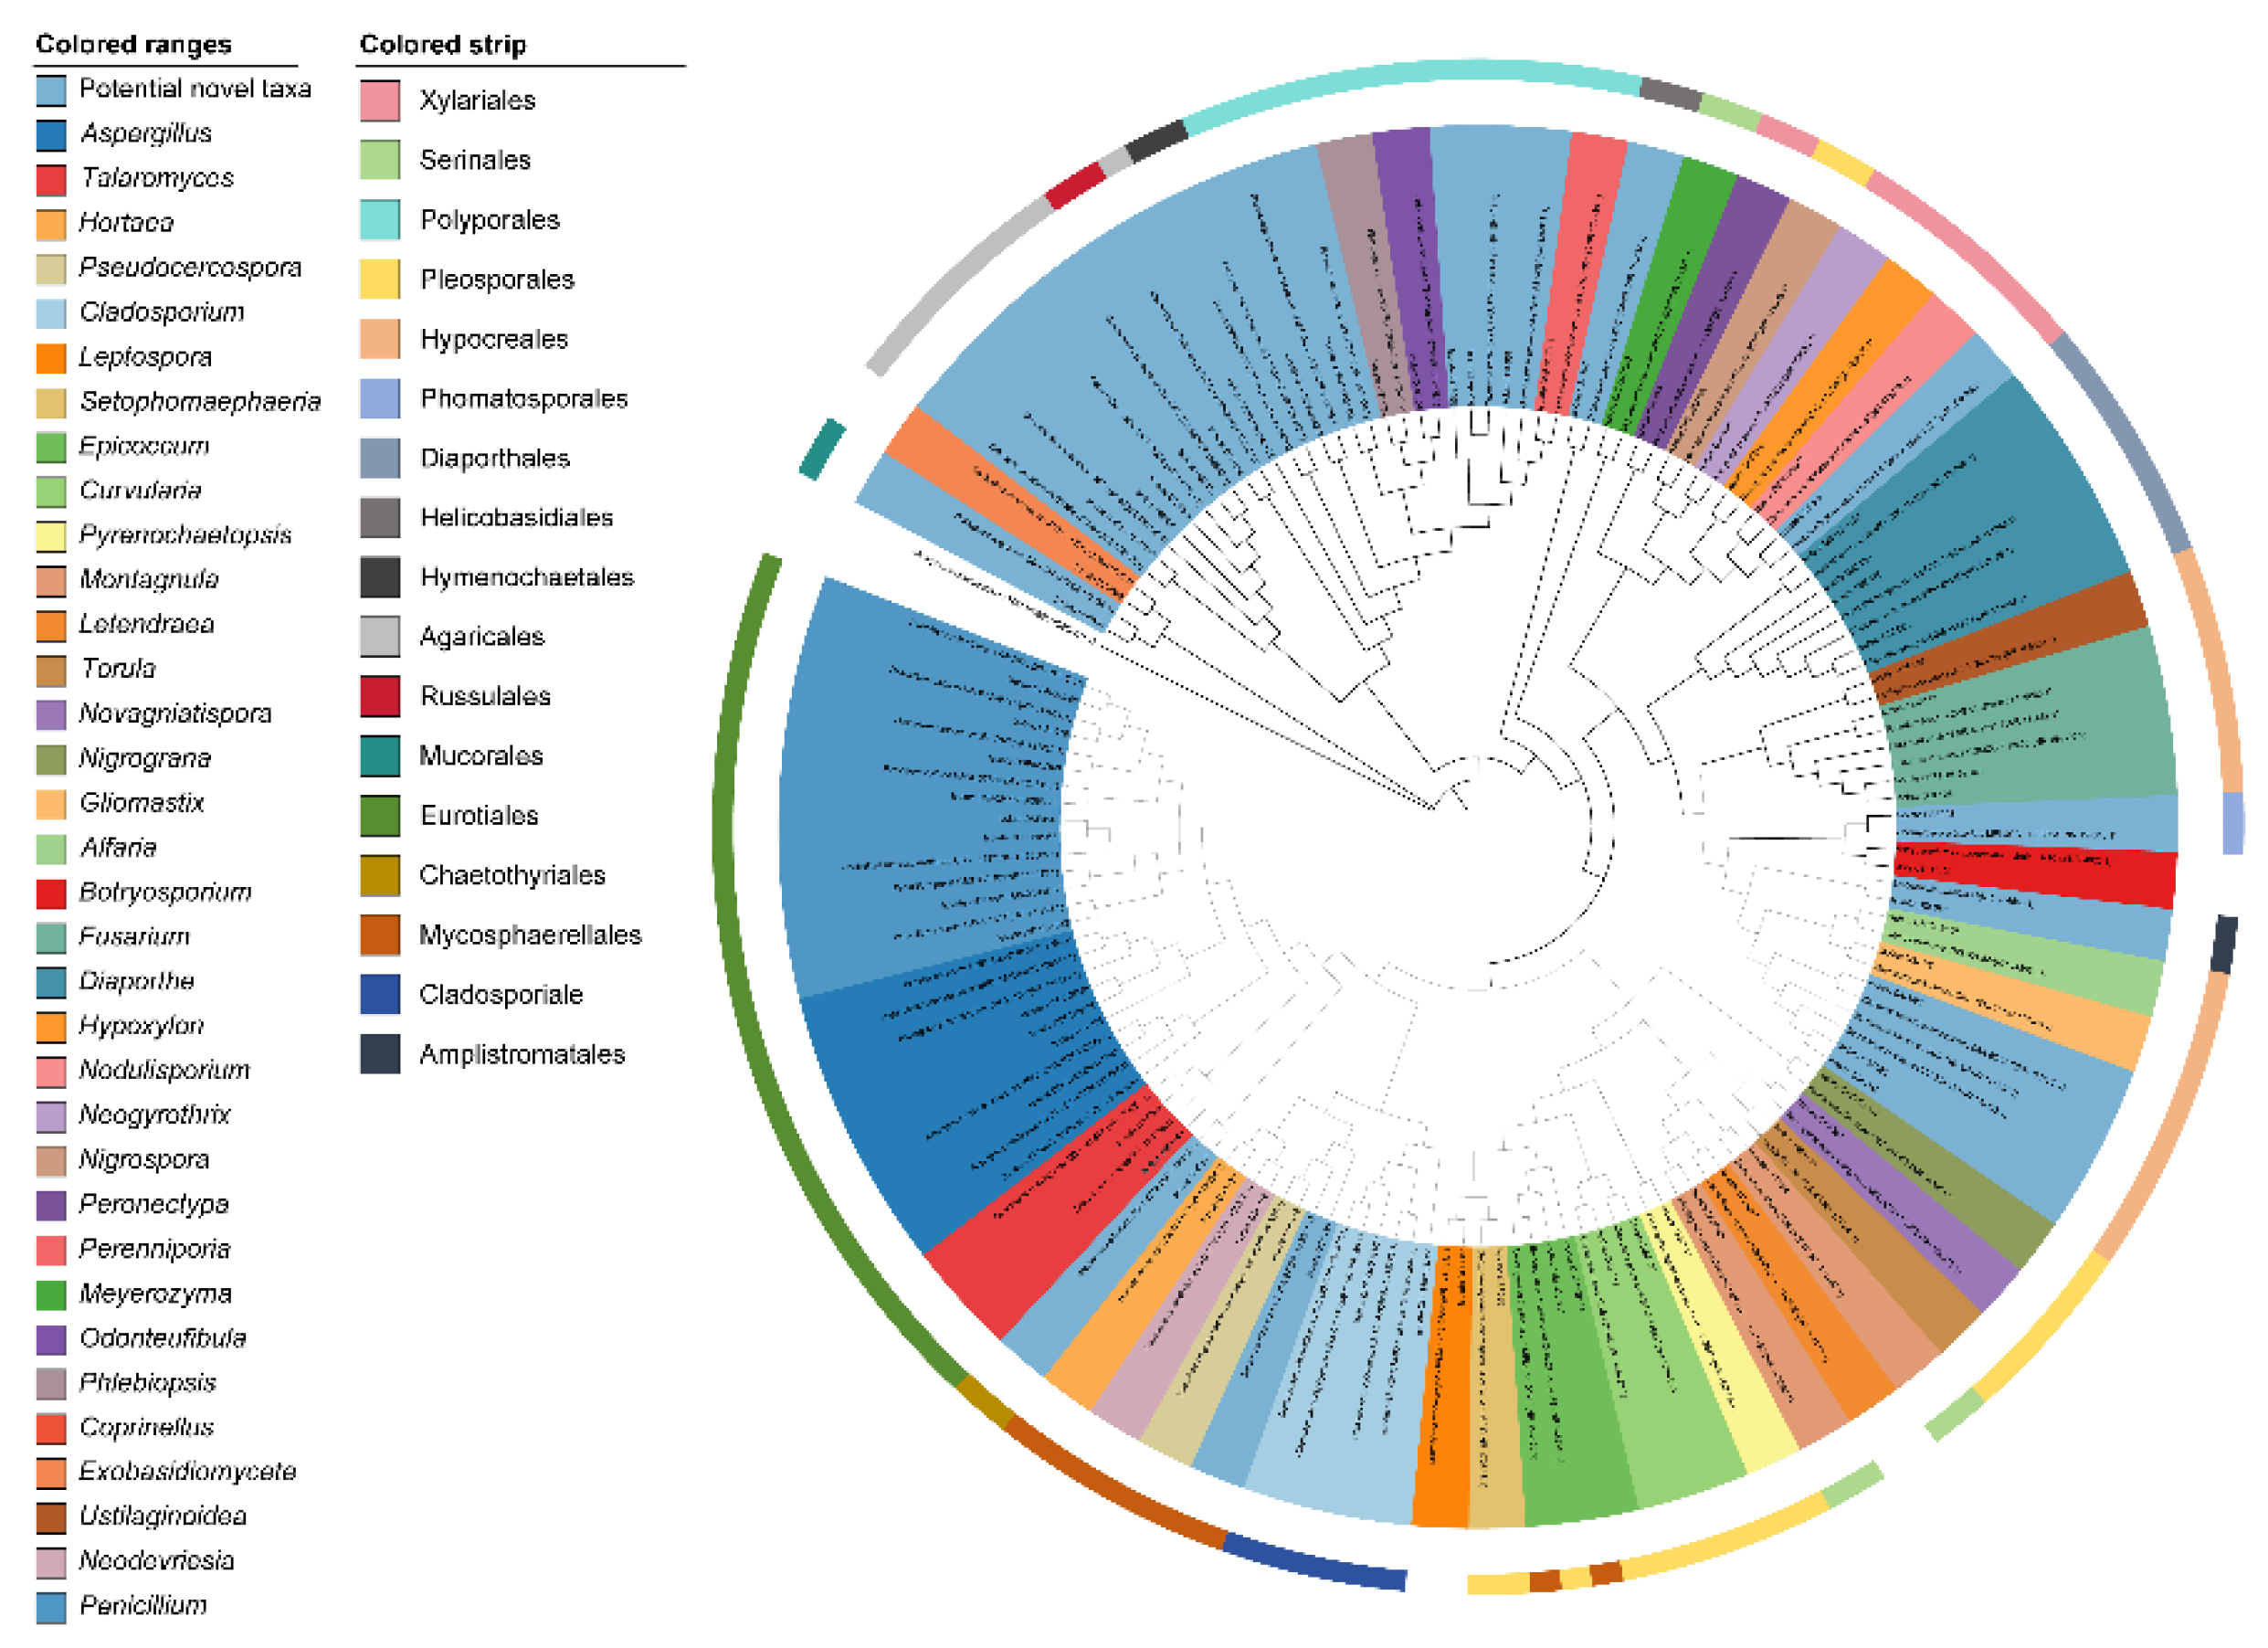
Figure 3.
Distribution of culturable fungi in four deep-sea sediment samples. (A, B) Bar charts showing taxonomic composition at the genus level; (C, D) bar charts showing genus-level taxonomic distributions using different isolation methods.
Figure 3.
Distribution of culturable fungi in four deep-sea sediment samples. (A, B) Bar charts showing taxonomic composition at the genus level; (C, D) bar charts showing genus-level taxonomic distributions using different isolation methods.
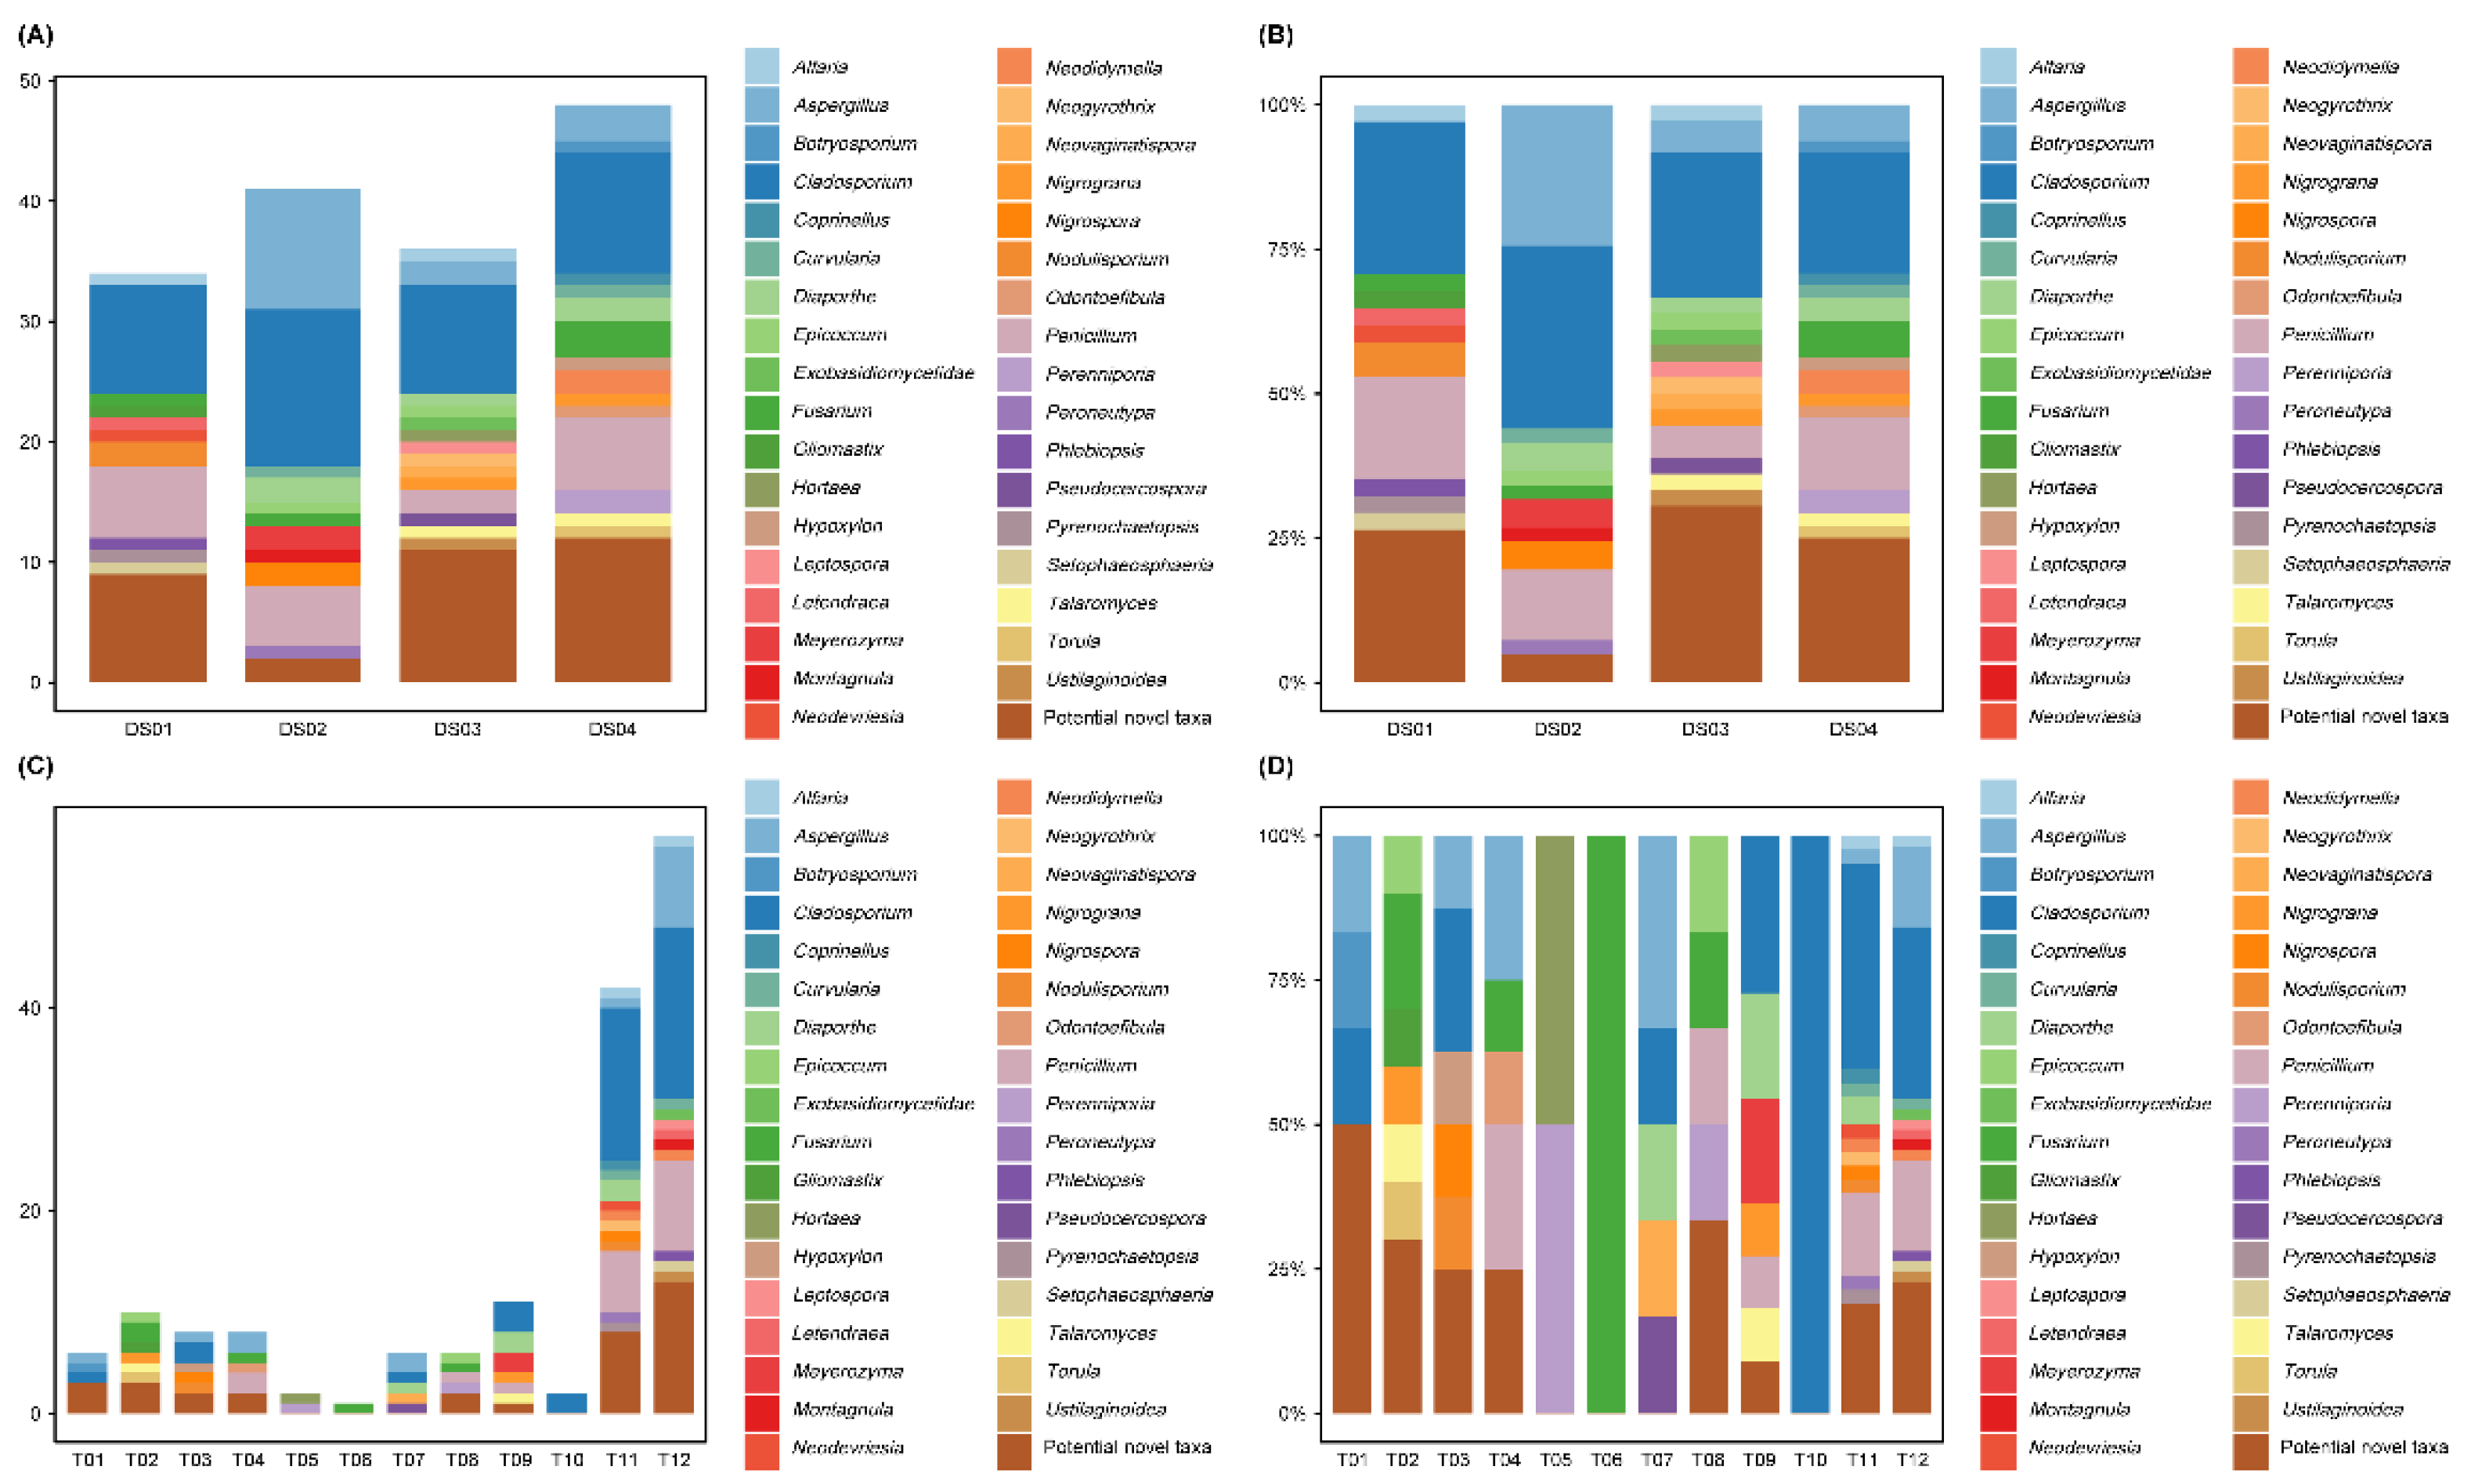
Figure 4.
Heatmap illustrating the antagonistic activity of 23 representative deep-sea fungal isolates against five phytopathogenic fungi, as determined by the dual-culture assay.
Figure 4.
Heatmap illustrating the antagonistic activity of 23 representative deep-sea fungal isolates against five phytopathogenic fungi, as determined by the dual-culture assay.
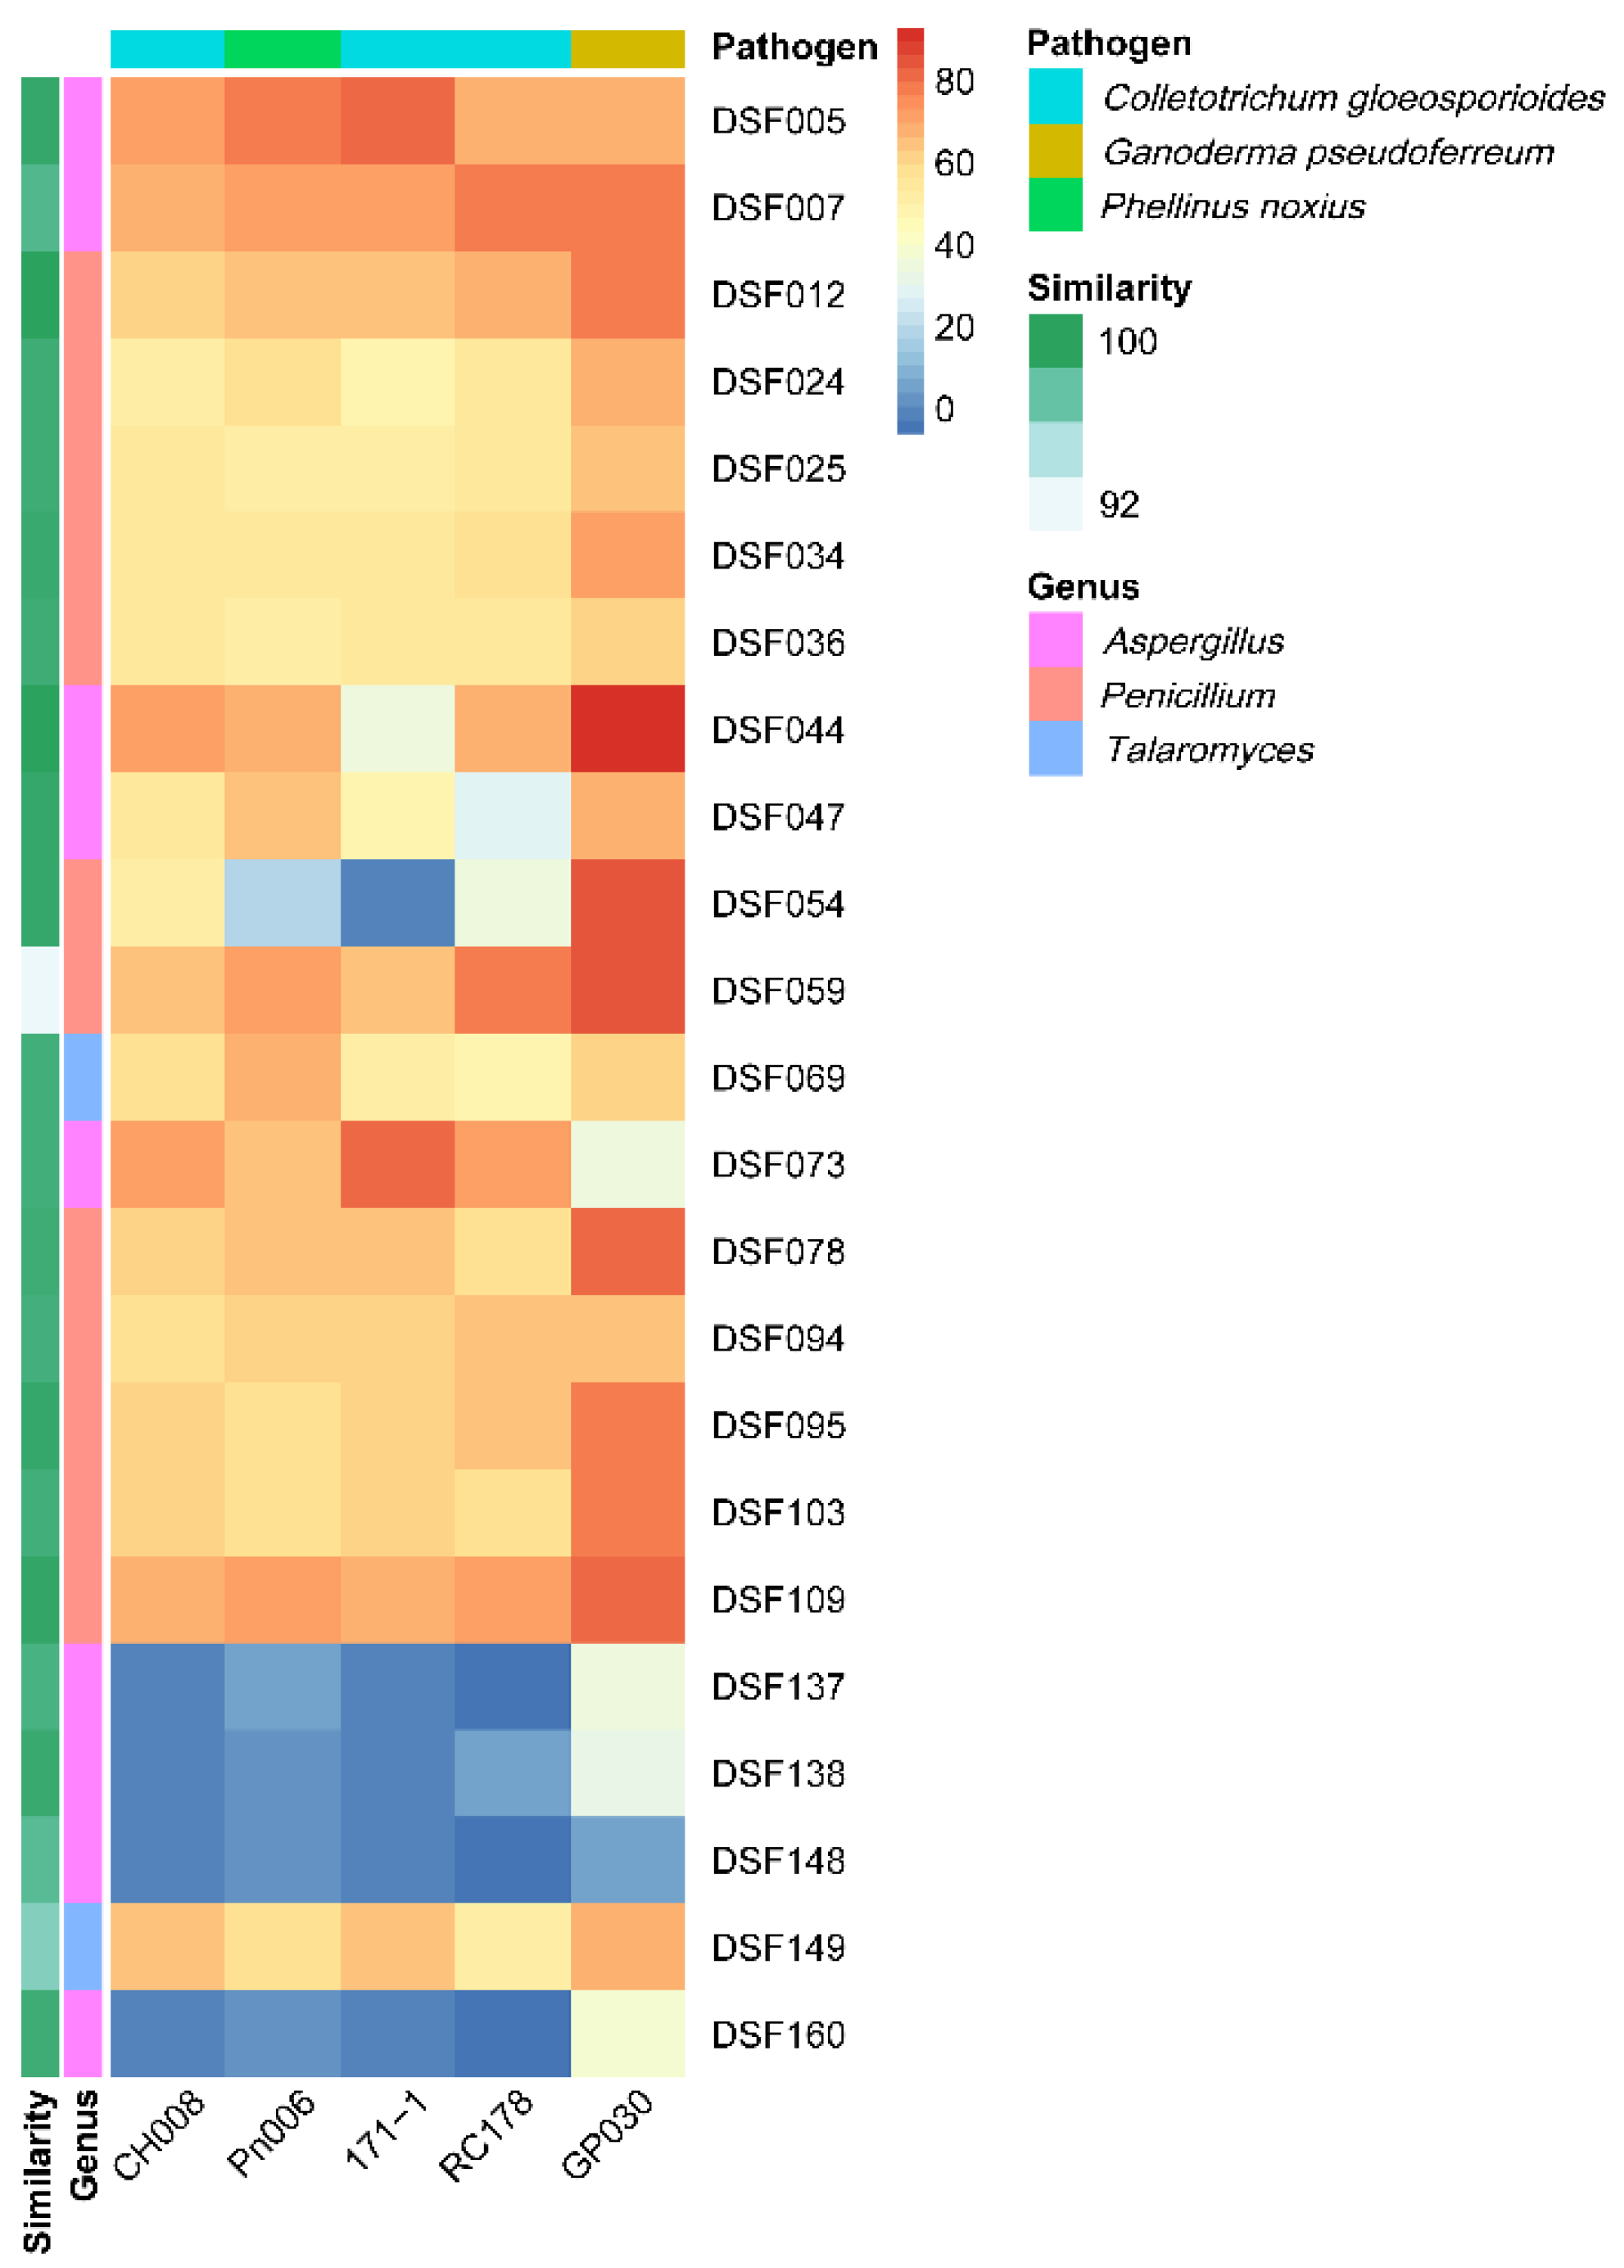
Figure 5.
Heatmap comparison of antifungal activity mediated by (A) dual-culture assays, (B) culture filtrates, and (C) volatile organic compounds (VOCs).
Figure 5.
Heatmap comparison of antifungal activity mediated by (A) dual-culture assays, (B) culture filtrates, and (C) volatile organic compounds (VOCs).
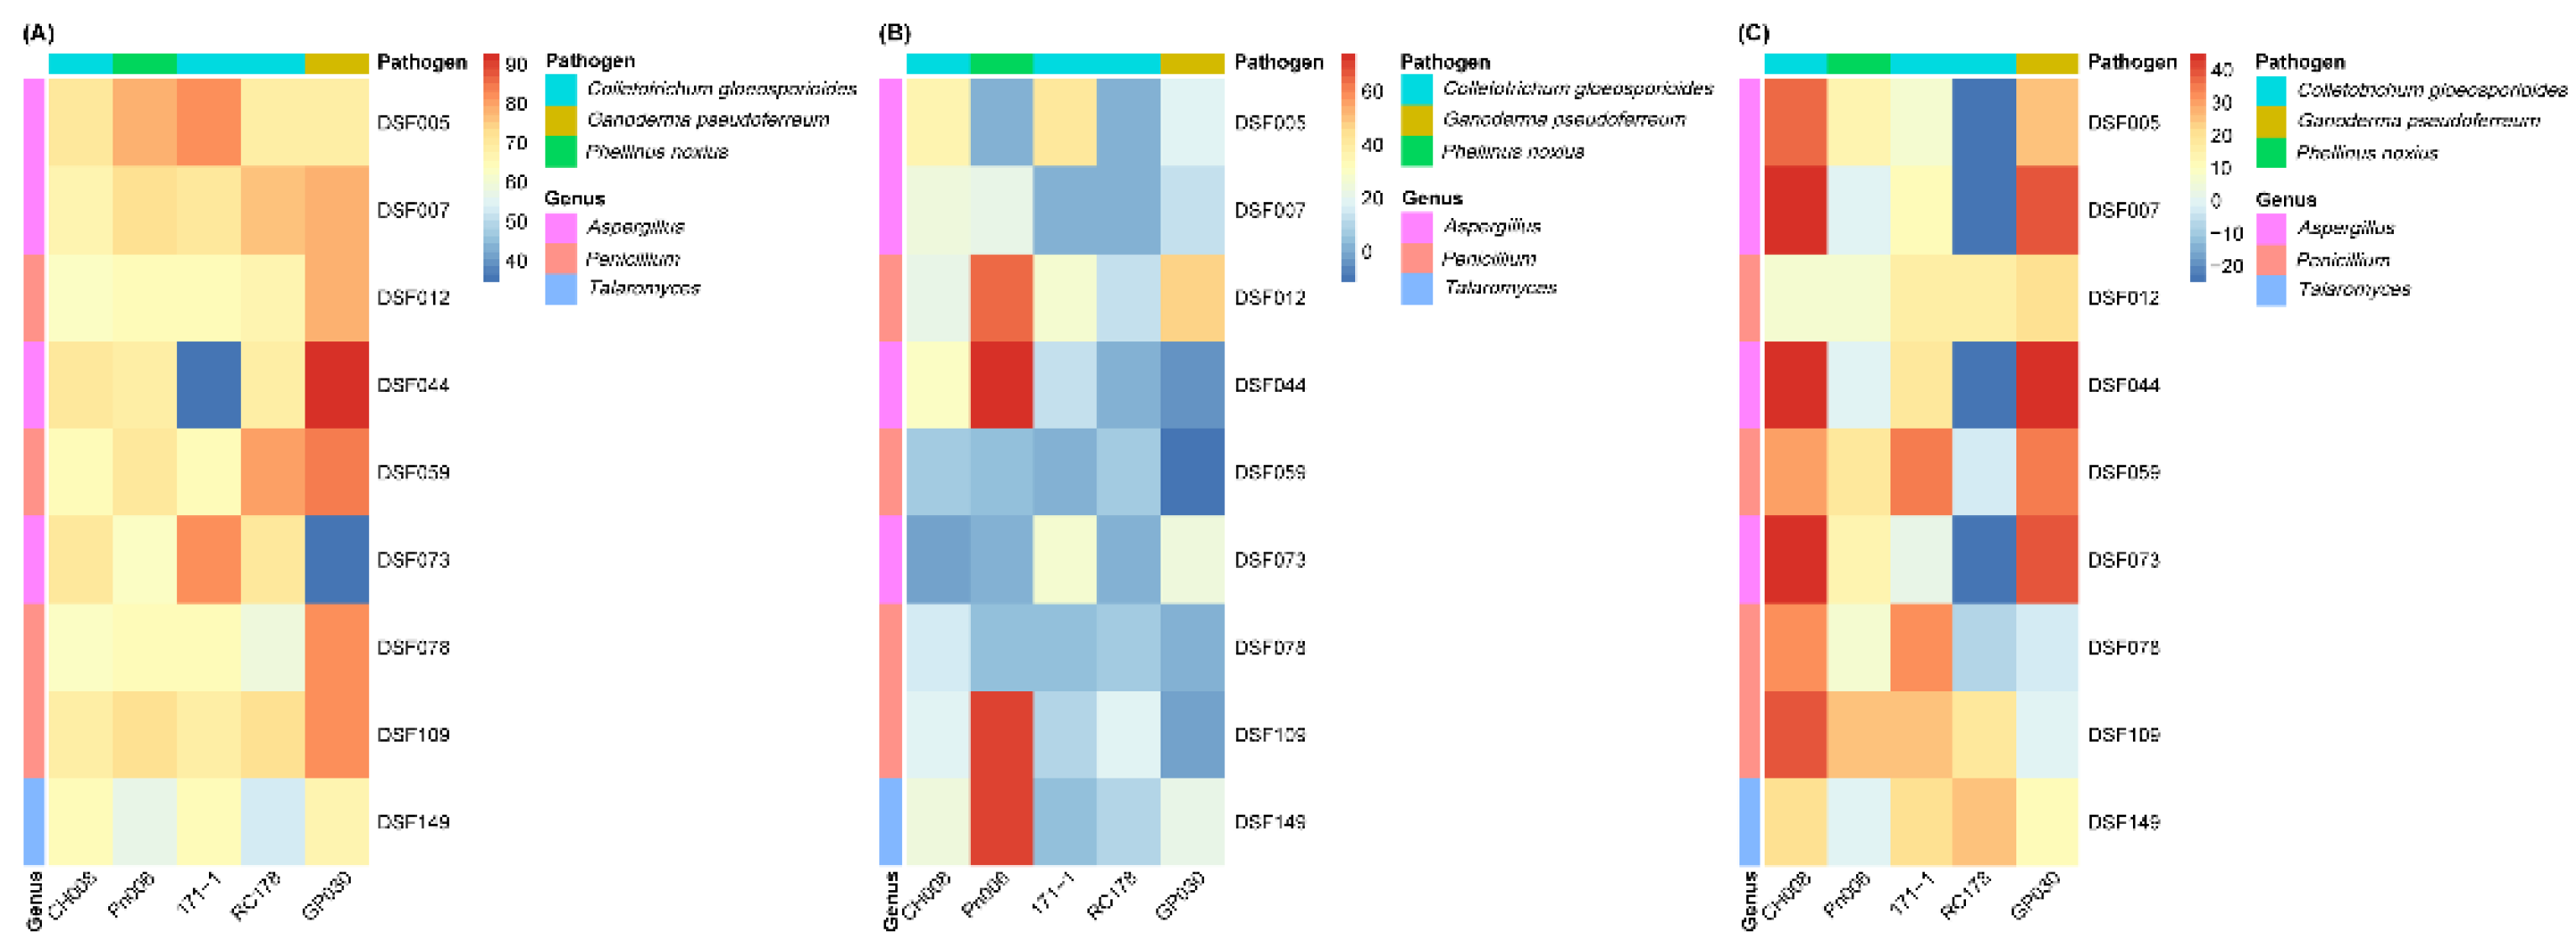

Table 1.
Taxonomic composition of culturable fungi isolated from deep-sea sediments.
| Phylum | Class | Order | Genus | Number of isolates | Relative abundance (%) |
|---|---|---|---|---|---|
| Ascomycota | Sordariomycetes | Hypocreales | Alfaria | 2 | 1.26 |
| Ascomycota | Eurotiomycetes | Eurotiales | Aspergillus | 15 | 9.43 |
| Ascomycota | Dothideomycetes | Botryosporiales | Botryosporium | 1 | 0.63 |
| Ascomycota | Dothideomycetes | Cladosporiales | Cladosporium | 41 | 25.79 |
| Basidiomycota | Agaricomycetes | Agaricales | Coprinellus | 1 | 0.63 |
| Ascomycota | Dothideomycetes | Pleosporales | Curvularia | 2 | 1.26 |
| Ascomycota | Sordariomycetes | Diaporthales | Diaporthe | 5 | 3.14 |
| Ascomycota | Dothideomycetes | Pleosporales | Epicoccum | 2 | 1.26 |
| Basidiomycota | Exobasidiomycetes | Exobasidiales | Exobasidiomycetidae | 1 | 0.63 |
| Ascomycota | Sordariomycetes | Hypocreales | Fusarium | 5 | 3.14 |
| Ascomycota | Sordariomycetes | Hypocreales | Gliomastix | 1 | 0.63 |
| Ascomycota | Dothideomycetes | Capnodiales | Hortaea | 1 | 0.63 |
| Ascomycota | Sordariomycetes | Xylariales | Hypoxylon | 1 | 0.63 |
| Ascomycota | Dothideomycetes | Pleosporales | Leptospora | 1 | 0.63 |
| Ascomycota | Dothideomycetes | Pleosporales | Letendraea | 1 | 0.63 |
| Ascomycota | Saccharomycetes | Saccharomycetales | Meyerozyma | 2 | 1.26 |
| Ascomycota | Dothideomycetes | Pleosporales | Montagnula | 1 | 0.63 |
| Ascomycota | Dothideomycetes | Capnodiales | Neodevriesia | 1 | 0.63 |
| Ascomycota | Dothideomycetes | Pleosporales | Neodidymella | 2 | 1.26 |
| Ascomycota | Sordariomycetes | Xylariales | Neogyrothrix | 1 | 0.63 |
| Ascomycota | Dothideomycetes | Pleosporales | Neovaginatispora | 1 | 0.63 |
| Ascomycota | Dothideomycetes | Pleosporales | Nigrograna | 2 | 1.26 |
| Ascomycota | Sordariomycetes | Hypocreales | Nigrospora | 2 | 1.26 |
| Ascomycota | Sordariomycetes | Xylariales | Nodulisporium | 2 | 1.26 |
| Basidiomycota | Agaricomycetes | Polyporales | Odontoefibula | 1 | 0.63 |
| Ascomycota | Eurotiomycetes | Eurotiales | Penicillium | 19 | 11.95 |
| Basidiomycota | Agaricomycetes | Polyporales | Perenniporia | 2 | 1.26 |
| Ascomycota | Sordariomycetes | Xylariales | Peroneutypa | 1 | 0.63 |
| Basidiomycota | Agaricomycetes | Polyporales | Phlebiopsis | 1 | 0.63 |
| Ascomycota | Dothideomycetes | Capnodiales | Pseudocercospora | 1 | 0.63 |
| Ascomycota | Dothideomycetes | Pleosporales | Pyrenochaetopsis | 1 | 0.63 |
| Ascomycota | Dothideomycetes | Pleosporales | Setophaeosphaeria | 1 | 0.63 |
| Ascomycota | Eurotiomycetes | Eurotiales | Talaromyces | 2 | 1.26 |
| Ascomycota | Dothideomycetes | Pleosporales | Torula | 1 | 0.63 |
| Ascomycota | Sordariomycetes | Ustilaginoideales | Ustilaginoidea | 1 | 0.63 |
| Potential novel taxa | 34 | 21.38 | |||
Table 2.
Alpha diversity indices of culturable fungal communities from four deep-sea sediment samples.
Table 2.
Alpha diversity indices of culturable fungal communities from four deep-sea sediment samples.
| Taxa | Shannon | Simpson | Evenness | Chao1 | |
|---|---|---|---|---|---|
| DS01 | 18 | 2.871 | 0.9323 | 0.9809 | 39.35 |
| DS02 | 19 | 2.739 | 0.8951 | 0.8143 | 31.88 |
| DS03 | 22 | 3.066 | 0.9302 | 0.975 | 66.07 |
| DS04 | 32 | 3.589 | 0.9699 | 1.131 | 86.05 |
Table 3.
Alpha diversity indices of culturable fungal communities obtained using different isolation methods.
Table 3.
Alpha diversity indices of culturable fungal communities obtained using different isolation methods.
| Taxa | Shannon | Simpson | Evenness | Chao1 | |
|---|---|---|---|---|---|
| T01 | 6 | 2.208 | 1 | 1.517 | 18.5 |
| T02 | 8 | 2.432 | 0.9722 | 1.423 | 17.33 |
| T03 | 8 | 2.517 | 1 | 1.549 | 32.5 |
| T04 | 7 | 2.281 | 0.9643 | 1.398 | 13.56 |
| T05 | 2 | 0.9431 | 1 | 1.284 | 2.5 |
| T06 | 1 | 0 | 0 | 1 | 1 |
| T07 | 5 | 1.894 | 0.9333 | 1.329 | 7.5 |
| T08 | 6 | 2.208 | 1 | 1.517 | 18.5 |
| T09 | 7 | 2.119 | 0.9091 | 1.189 | 8.818 |
| T10 | 2 | 0.9431 | 1 | 1.284 | 2.5 |
| T11 | 24 | 2.878 | 0.8738 | 0.7411 | 229.1 |
| T12 | 30 | 3.242 | 0.9292 | 0.8526 | 71.26 |
Table 4.
In vitro antagonistic activity of 23 representative deep-sea fungal isolates against five phytopathogens assessed by dual-culture assay.
Table 4.
In vitro antagonistic activity of 23 representative deep-sea fungal isolates against five phytopathogens assessed by dual-culture assay.
| Isolates | Maximum similarity strain | Maximum similarity (%) | Mycelial Growth Inhibition Rate (%) | ||||
|---|---|---|---|---|---|---|---|
| CH008 | Pn006 | 171-1 | RC178 | GP030 | |||
| DSF005 | A. brunneoviolaceus NRRL 4912 (NR_138279.1) | 99.44 | 69.8 ± 0.68a | 78.82 ± 2.04a | 81.57 ± 0.68a | 69.17 ± 0.72abc | 68.46 ± 1.68def |
| DSF007 | A. brunneoviolaceus NRRL 4912 (NR_138279.1) | 98.08 | 66.67 ± 1.36ab | 72.55 ± 1.36ab | 71.37 ± 1.36b | 76.25 ± 0a | 77.2 ± 0.84bcd |
| DSF012 | P. citrinum NRRL 1841 (NR_121224.1) | 100 | 62.35 ± 3.11bcd | 63.92 ± 0.68cde | 63.92 ± 0.68cd | 66.88 ± 1.65abcd | 77.44 ± 1.26bcd |
| DSF024 | P. coffeae NRRL 35363 (NR_121312.1) | 99.06 | 51.37 ± 0.68g | 59.61 ± 1.8efgh | 49.02 ± 0.68fg | 56.25 ± 2.72cde | 69.19 ± 5.16cdef |
| DSF025 | P. coffeae NRRL 35363 (NR_121312.1) | 99.06 | 53.33 ± 0.68fg | 52.75 ± 1.22h | 52.75 ± 0.9ef | 55.42 ± 1.91cde | 64.58 ± 2.22f |
| DSF034 | P. sclerotiorum FRR 2074 (NR_077157.1) | 99.27 | 54.51 ± 0.68efg | 56.08 ± 1.8gh | 54.9 ± 1.8e | 57.5 ± 4.51bcde | 70.4 ± 7.98cdef |
| DSF036 | P. coffeae NRRL 35363 (NR_121312.1) | 99.06 | 54.12 ± 1.56fg | 52.94 ± 2.35h | 54.51 ± 1.8e | 55.83 ± 2.6cde | 61.18 ± 0.84f |
| DSF044 | A. assiutensis AUMC 5748 (NR_151787.1) | 100 | 69.8 ± 0.68a | 69.02 ± 1.36bcd | 34.51 ± 0.68h | 69.17 ± 0.72abc | 92.72 ± 0a |
| DSF047 | A. brunneoviolaceus NRRL 4912 (NR_138279.1) | 99.44 | 54.12 ± 6.11fg | 63.92 ± 0.68cde | 46.67 ± 3.4g | 27.5 ± 19.49g | 69.43 ± 7.7cdef |
| DSF054 | P. macrosclerotiorum CBS 116871 (NR_156585.1) | 99.44 | 50.2 ± 5.43g | 19.61 ± 3.4i | 0 ± 0i | 35 ± 2.17fg | 83.5 ± 0.84ab |
| DSF059 | P. macrosclerotiorum CBS 116871 (NR_156585.1) | 91.57 | 65.49 ± 0.68abc | 70.2 ± 0.68bc | 65.1 ± 0.68cd | 79.17 ± 9.02a | 83.99 ± 3.17ab |
| DSF069 | T. beijingensis CBS 140617 (NR_172251) | 98.88 | 59.61 ± 0.68cdef | 69.41 ± 0bcd | 52.94 ± 0ef | 47.5 ± 1.25ef | 61.67 ± 0.84f |
| DSF073 | A. brunneoviolaceus NRRL 4912 (NR_138279.1) | 98.90 | 70.59 ± 0a | 63.53 ± 8.15cdef | 81.96 ± 3.4a | 70 ± 2.17abc | 34.98 ± 2.22g |
| DSF078 | P. mallochii DAOM 239917 (NR_111674.1) | 99.06 | 62.35 ± 1.18bcd | 64.71 ± 1.18cde | 63.92 ± 1.36cd | 59.58 ± 3.15bcde | 81.56 ± 0.84b |
| DSF094 | P. paxilli CBS 360.48 (NR_111483.1) | 98.81 | 58.63 ± 1.48def | 62.75 ± 1.36defg | 62.75 ± 1.8d | 64.38 ± 1.88abcd | 65.31 ± 1.52f |
| DSF095 | P. sclerotiorum FRR 2074 (NR_077157.1) | 99.44 | 60.78 ± 2.45bcde | 59.22 ± 1.8efgh | 61.96 ± 0.68d | 63.13 ± 4.88abcde | 79.14 ± 1.68bc |
| DSF103 | P. paxilli CBS 360.48 (NR_111483.1) | 98.87 | 61.96 ± 2.96bcd | 56.86 ± 1.8fgh | 62.75 ± 1.36d | 58.75 ± 5.96bcde | 76.71 ± 1.46bcde |
| DSF109 | P. oxalicum NRRL 787 (NR_121232.1) | 99.64 | 69.2 ± 0.68a | 71.76 ± 2.04b | 67.84 ± 0.68bc | 72.71 ± 3.44ab | 81.08 ± 1.46b |
| DSF137 | A. tennesseensis NRRL 13150 (NR_135447.1) | 98.49 | 0 ± 0 | 5.1 ± 0.68j | 0 ± 0i | −6.25 ± 0h | 34.98 ± 4.45g |
| DSF138 | A. tennesseensis NRRL 13150 (NR_135447.1) | 99.25 | 0 ± 0h | 0.78 ± 1.36j | 0 ± 0i | 3.75 ± 4.33h | 31.1 ± 4.68g |
| DSF148 | A. jensenii NRRL 58600 (NR_135444.1) | 97.77 | 0 ± 0h | 1.18 ± 0j | 0 ± 0i | −6.25 ± 0h | 3.93 ± 0h |
| DSF149 | T. Resinae (NR_190238.1) | 96.04 | 65.1 ± 1.36abcd | 56.86 ± 0.68fgh | 63.92 ± 0.68cd | 52.92 ± 1.44de | 67.01 ± 2.22ef |
| DSF160 | A. sydowii CBS 593.65 (NR_131259.1) | 99.01 | 0 ± 0h | 0.39 ± 0.68j | 0 ± 0i | −6.25 ± 0h | 37.41 ± 1.46g |
Note: Values in the table are expressed as mean ± standard deviation. Different lowercase letters following the values indicate significant differences at the 0.05 level.
Table 5.
Antifungal activity of sterile culture filtrates from nine selected deep-sea fungal isolates.
Table 5.
Antifungal activity of sterile culture filtrates from nine selected deep-sea fungal isolates.
| Isolates | Maximum similarity strain | Maximum similarity (%) | Mycelial Growth Inhibition Rate (%) | ||||
|---|---|---|---|---|---|---|---|
| CH008 | Pn006 | 171-1 | RC178 | GP030 | |||
| DSF005 | A. brunneoviolaceus NRRL 4912 (NR_138279.1) | 99.44 | 36.95 ± 1.39a | 0 ± 0c | 40.83 ± 22.09a | 0 ± 0c | 18.82 ± 4.06bc |
| DSF007 | A. brunneoviolaceus NRRL 4912 (NR_138279.1) | 98.08 | 23.29 ± 0.7bc | 21.96 ± 1.36b | 0 ± 1.25b | 0 ± 0c | 12.37 ± 2.46c |
| DSF012 | P. citrinum NRRL 1841 (NR_121224.1) | 100 | 22.49 ± 2.51bc | 63.53 ± 4.24a | 25.63 ± 4.38ab | 12.75 ± 4.17ab | 46.77 ± 4.27a |
| DSF044 | A. assiutensis AUMC 5748 (NR_151787.1) | 100 | 30.92 ± 1.39ab | 74.12 ± 4.08a | 11.67 ± 0.72ab | 0 ± 0c | −4.3 ± 0.93de |
| DSF059 | P. macrosclerotiorum CBS 116871 (NR_156585.1) | 91.57 | 6.43 ± 3.03d | 3.92 ± 4.13c | 2.08 ± 1.91b | 7.45 ± 1.36bc | −11.56 ± 5.25e |
| DSF073 | A. brunneoviolaceus NRRL 4912 (NR_138279.1) | 98.90 | −2.41 ± 0d | 0 ± 0c | 25.83 ± 20.97ab | 0 ± 0c | 24.73 ± 6.72b |
| DSF078 | P. mallochii DAOM 239917 (NR_111674.1) | 99.06 | 16.06 ± 8.13c | 3.92 ± 1.8c | 4.58 ± 1.91b | 7.84 ± 2.45b | 0 ± 0d |
| DSF109 | P. oxalicum NRRL 787 (NR_121232.1) | 99.64 | 17.67 ± 2.51c | 70.2 ± 11.18a | 10.42 ± 1.91b | 18.43 ± 4.75a | −0.81 ± 2.91de |
| DSF149 | T. Resinae (NR_190238.1) | 96.04 | 24.9 ± 3.03bc | 70.59 ± 1.18a | 3.75 ± 2.5b | 10.59 ± 4.08b | 22.04 ± 2.46bc |
Note: Values in the table are expressed as mean ± standard deviation. Different lowercase letters following the values indicate significant differences at the 0.05 level.
Table 6.
Antifungal activity mediated by volatile organic compounds (VOCs) produced by nine deep-sea fungal isolates.
Table 6.
Antifungal activity mediated by volatile organic compounds (VOCs) produced by nine deep-sea fungal isolates.
| Isolates | Maximum similarity strain | Maximum similarity (%) | Mycelial Growth Inhibition Rate (%) | ||||
|---|---|---|---|---|---|---|---|
| CH008 | Pn006 | 171-1 | RC178 | GP030 | |||
| DSF005 | A. brunneoviolaceus NRRL 4912 (NR_138279.1) | 99.44 | 36.14 ± 0ab | 13.33 ± 2.72bc | 6.91 ± 1.41b | −25 ± 0d | 25.42 ± 4.02bc |
| DSF007 | A. brunneoviolaceus NRRL 4912 (NR_138279.1) | 98.08 | 44.18 ± 1.39a | 0.39 ± 0.68d | 10.16 ± 0.7ab | −25 ± 0d | 40 ± 4.51ab |
| DSF012 | P. citrinum NRRL 1841 (NR_121224.1) | 100 | 6.02 ± 2.41c | 6.67 ± 7.09cd | 16.67 ± 14.75ab | 14.71 ± 19.91abc | 20.83 ± 5.64bc |
| DSF044 | A. assiutensis AUMC 5748 (NR_151787.1) | 100 | 44.18 ± 1.39a | 0 ± 0d | 19.11 ± 1.41ab | −25 ± 0d | 45 ± 14.74a |
| DSF059 | P. macrosclerotiorum CBS 116871 (NR_156585.1) | 91.57 | 30.12 ± 9.39ab | 18.04 ± 4.13ab | 33.74 ± 8.99a | −2.94 ± 7.35bcd | 34.79 ± 1.57ab |
| DSF073 | A. brunneoviolaceus NRRL 4912 (NR_138279.1) | 98.90 | 44.98 ± 0.7a | 13.73 ± 3.4bc | 2.44 ± 2.11b | −25 ± 0d | 40 ± 4.51ab |
| DSF078 | P. mallochii DAOM 239917 (NR_111674.1) | 99.06 | 32.53 ± 14.77ab | 6.67 ± 1.36cd | 32.52 ± 7.62a | −7.35 ± 4.41cd | −2.71 ± 0.95d |
| DSF109 | P. oxalicum NRRL 787 (NR_121232.1) | 99.64 | 39.76 ± 4.78a | 24.31 ± 4.45a | 24.39 ± 16.91ab | 17.89 ± 7.65ab | −0.63 ± 3.13d |
| DSF149 | T. Resinae (NR_190238.1) | 96.04 | 20.48 ± 3.61bc | 0 ± 0d | 19.51 ± 7.32ab | 24.51 ± 5.94a | 10.42 ± 9.38cd |
Note: Values in the table are expressed as mean ± standard deviation. Different lowercase letters following the values indicate significant differences at the 0.05 level.
Disclaimer/Publisher’s Note: The statements, opinions and data contained in all publications are solely those of the individual author(s) and contributor(s) and not of MDPI and/or the editor(s). MDPI and/or the editor(s) disclaim responsibility for any injury to people or property resulting from any ideas, methods, instructions or products referred to in the content. |
© 2026 by the authors. Licensee MDPI, Basel, Switzerland. This article is an open access article distributed under the terms and conditions of the Creative Commons Attribution (CC BY) license (http://creativecommons.org/licenses/by/4.0/).
Copyright: This open access article is published under a Creative Commons CC BY 4.0 license, which permit the free download, distribution, and reuse, provided that the author and preprint are cited in any reuse.


