Submitted:
24 February 2026
Posted:
27 February 2026
You are already at the latest version
Abstract
Psychological constructs such as anxiety, depression, fatalism, divine control, luck, helplessness, and internality are pressing subjects in the United States (US). Although several studies have explored how specific covariates influence these constructs, like depression and anxiety, less is known about how predictors interact to predict the different subscales of fatalism, namely, fatalism, luck, divine control, helplessness, and internality. This study addresses the gap by using Conditional Inference Trees (CIT) to explore how interactions among predictors influence these constructs.
Using a nationally representative survey of 2,000 respondents, CIT was employed to investigate how covariates, including Adverse Childhood Experiences (ACE), age, gender, race, education, and urbanicity, interact to predict each construct.
Our analyses revealed that for the scales of fatalism, education, age, and race were key predictors, but their effects varied across the subscales of fatalism- fatalism, divine control, luck, helplessness, and internality. For instance, higher levels of education and younger age were associated with higher levels of fatalism and internality. ACE interacted with race to provide different levels of helplessness and divine control.
In addition, by leveraging CIT, we were able to identify subtle interactions between covariates in predicting psychological constructs, primarily those related to the multi-fatalism scale.
Keywords:
psychological constructs
; depression
; anxiety
; fatalism
; conditional inference trees
1. Introduction
A psychological construct is a fundamental concept in psychology and health, widely used to understand human behavior. It serves as a framework for interpreting complex mental and emotional processes and can be defined as a label for a domain of interrelated behaviors (Encyclopedia Britannica, 2025). Examples of psychological constructs include depression, anxiety, and fatalism. In a recent study by Esparza et al. (2015), the fatalism construct has been divided into 5 different subscales consisting of fatalism, divine control, luck, internality, and helplessness. Studying psychological constructs not only provides a framework for understanding complex psychological phenomena but also plays a crucial role in enabling researchers to create interventions that aim to improve mental health and well-being. According to the (National Institute of Mental Health, 2023), in 2021, 14.5 million adults aged 18 or older had at least one major depressive episode in the U.S. Even though this is just for depression, it still goes on to show how psychological constructs are a topic that needs massive attention.
Understanding how various covariates contribute to psychological constructs requires attention to both their individual effects and their interactions. Traditional methods such as Classification and Regression Trees (CART), which was introduced by Breiman et al. (1984), are commonly used to model decision-based relationships. However, CART models are prone to overfitting and biased variable selection, particularly favoring covariates with many potential splits. Even though (Jensen & Cohen, 2000) introduced the use of the permutation approach in recursive partitioning to address the problems of CART, this method lacked a formally defined null hypothesis and a significance-based stopping criterion. To address these limitations, a statistical framework was developed by White et al. (1994). However, this method has some limitations, such as poor approximation to the chi-square when the sample size is small. This study employs Conditional Inference Trees (CIT), a statistical framework that was developed by Hothorn et al.(2006). CIT solves the problem of overfitting and selection bias and incorporates the concept of statistical significance in choosing a covariate to be part of the important variables based on permutations, offering a more robust framework for exploring how covariates interact in predicting psychological constructs.
The main aim of this research is to explore how covariates interact in predicting different levels of psychological constructs with a focus on the five scales of fatalism developed by (Esparza et al., 2015). Using Conditional Inference Trees, this study builds on recent work by (Robinson & Hearne, 2023) and (Schantz et al., 2024) in predicting depression and anxiety, while extending the findings to the subscales on fatalism.
In addition, by leveraging CIT, this study seeks to provide deeper insights into the interactions between covariates that may inform targeted interventions in mental health, education, and socioeconomic policy.
2. Materials and Methods
2.1. Research Design
The data were collected by YouGov PLC (2025), which interviewed 2508 respondents who were then matched down to a target sample of 2000. The respondents were matched to a sampling frame on gender, age, race, and education, which was constructed from the full 2019 American Community Survey (ACS). The dataset included the following independent variables: age, Adverse Childhood Experience (ACE), gender, race, education, race and urbanicity and the dependent variables: anxiety, depression, fatalism, divine control, luck, helplessness and internality. Continuous variables were summarized using the mean and standard deviation (SD) and frequencies and percentages for each level of categorical variables.
2.2. Statistical Analysis
All statistical analyses were performed using R software version 4.4.0 (R Core Team, 2024) with a significance level of = 0.05. The following packages were used: partykit (Hothorn et al., 2015), car (Fox & Weisberg, 2019), dplyr (Wickham et al., 2023) and grid (R Core Team, 2024) employing default parameters unless otherwise specified.
Conditional Inference Trees (CITs)
Conditional Inference Trees (CITs) are a type of recursive partitioning algorithm that integrates tree-structured regression models inside a well-defined framework of conditional inference procedures. Although there are other popular algorithms based on recursive partitioning, such as Classification and Regression Trees (CART), these suffer from two main issues: overfitting and selection bias towards covariates with numerous possible splits (Hothorn et al., 2006). CITs select significant covariates by comparing p-values against a pre-specified nominal or adjusted α level, such as the Bonferroni adjustment to control for multiple testing. Levshina (2021), suggested the use of permutation p-value. The conditional distribution of statistics that assess the relationship between the response variables and covariates underpins an impartial selection among variables measured on varying scales. CITs can be applied to all regression problems, including nominal, ordinal, and continuous response variables and different covariates, unlike CART, which can be applied to categorical (classification) or continuous (regression trees) response variables.
At each node, we tested whether there is an association between the response variable and each covariate in terms of partial hypothesis:
The procedure begins with a global null hypothesis defined as: , where is the number of covariates. If we fail to reject at a prespecified α, we stop the recursion. If the global null hypothesis is rejected, the association between Y and each of the covariates is evaluated using test statistics or corresponding p-values, which indicate deviations from the partial hypothesis .
The association between Y and each of the covariates is quantified using a linear test statistics of the form
where:
- represents case weights, which account for the current partitioning in the recursive tree-building process.
- is a nonrandom transformation of the covariate . It maps the covariate values to a numerical or categorical scale appropriate for testing (e.g. indicator functions for categorical variables).
- is the influence function of the response variable. This measures how each observation contributes to the association.
- puts the elements of the resulting matrix into a column vector
- is the dimension of the statistic where and denote the dimensions of the transformed covariate and response spaces, respectively.
The statistic assesses the linear relationship between each covariate and the outcome Y, adjusted for the weights of the current node. This adjusted association forms the basis of the permutation tests used to evaluate the significance of each potential split.
The process for implementing the recursive binary partitioning suggested by Hothorn et al. (2006) is as follows:
- For case weights test the global null hypothesis of independence between any of the covariates and the response. Stop if this hypothesis cannot be rejected. Otherwise select the covariate with strongest association to Y.
- Choose a set in order to split into two disjoint sets and . The case weights and determine the two subgroups with and for all denotes the indicator function.
- Recursively repeat Steps 1 and 2 with modified case weights and respectively.
3. Results
After excluding respondents from Alaska, Hawaii, and North Dakota, the final sample included 1953 participants. The sample was predominantly White (74.0%), with smaller representations of Black (12.2%), Hispanic/Latinx/Spanish (8.6%), and other racial groups (5.2%). Slightly more than half identified as female (50.8%). The average age was 49.8 (17.3) years. Majority of the participants had a high school diploma (36.6%),followed by bachelor’s degree (22.9%), associate degree (13.3%), master’s degree (9.9%), trade/technical/vocational training (9.7%), doctorate/professional degree (4.0%), and less than high school diploma (3.6%). Regarding community type, 37.1% lived in suburban areas, 31.0% in cities, 18.5% in rural areas, 13.1% in towns and 0.3% in other types of communities. Detailed distributions are provided in Table 1.
3.1. Conditional Inference Tree Results for Depression
The CIT algorithm identified the most significant variable in predicting depression to be Adverse Childhood Experience (ACE) (p<0.001). This suggests that individuals with higher levels of ACE are at a greater risk of experiencing higher levels of depression. Among those with lower ACE scores (ACE ≤ 1 age emerged as the second key factor, indicating that younger adults ≤ 28 years reported higher levels of depression compared to older individuals.
For individuals with higher ACE levels (ACE >1), age again was a significant moderating factor as those aged ≤ 44 years showed higher levels of depression, especially when ACE scores were greater than 8. This indicates that early life adversity interacts with age in shaping the risk of depression, with younger individuals with higher levels of adverse experiences showing the greatest risk. Figure 1 below shows the splits for the CIT algorithm in predicting depression.
3.2. Conditional Inference Tree Results for Anxiety
The results of the CIT for predicting anxiety are presented in Figure 2. The algorithm identified ACE (p < 0.001) as the most significant predictor, dividing individuals into two groups: those with ACE scores ≤ 1 and those with ACE scores > 1.
Among participants with ACE ≤ 1, age (p <0.001) emerged as the next significant covariate, which was split into individuals aged ≤ 28 and individuals aged > 28 years. Individuals aged ≤ 28 showed higher levels of anxiety. For those older than 28 years, age remained a significant variable (p < 0.001), dividing the group at 53 years. Individuals aged ≤ 53 years had moderately higher anxiety levels, while those older than 53 years were further split by ACE (p = 0.020) into ACE ≤ 0 (i.e., no ACEs) and ACE > 0. Individuals aged > 53 years with no ACEs had slightly lower levels of anxiety, whereas those with ACE > 0 were again divided by age (p=0.037) into those aged ≤ 71 and those aged > 71 years. Individuals aged ≤ 71 showed slightly higher levels of anxiety than those older than 71 years.
For individuals with more than one ACE i.e., ACE > 1, age emerged as the most significant predictor, and this was divided into individuals aged ≤ 58 and > 58 years. Among those aged ≤ 58 years, ACE (p < 0.001) emerged as the most significant, with a split of ACE > 7 and ACE ≤ 7. Individuals with ACE > 7 had higher levels of anxiety and those with ACE ≤ 7 was further split by age (p < 0.001) into individuals > 44 years and age ≤ 44 years. Individuals older than 44 years showed higher levels of anxiety. Among individuals older than 58 years, age (p= 0.001) continued to be significant, with a split at 61 years. Individuals aged ≤ 61 years exhibited higher levels of anxiety than those older than 61 years. Individuals older than 61 years were further divided by ACE (p = 0.007) into ACE ≤ 4 and ACE > 4, with those with ACE > 4 showing slightly higher levels of anxiety.
These results indicate that ACE was the dominant factor associated with anxiety, with age moderating this relationship. This suggests that individuals with higher ACE scores tend to report higher levels of anxiety, especially among younger and middle-aged adults.
3.3. Conditional Inference Tree Results for Fatalism
The CIT algorithm identified education (EDU) (p < 0.001) as the most significant predictor. Education was divided into two groups: individuals with less than a high school education, a high school diploma, or trade/technical training (lower education group), and individuals with an associate degree, bachelor’s degree, master’s degree, or doctorate (higher education group).
Among participants on the left branch, age (p= 0.002) emerged as the next significant predictor, splitting into individuals aged ≤ 60 years and > 60 years. Individuals aged > 60 years showed higher levels of fatalism. For those aged ≤ 60 years, gender (GEN) (p=0.035) was the next significant predictor, dividing individuals into men and nonbinary, and women and other gender identities. Individuals identifying as women or another gender showed slightly higher levels of fatalism than men and nonbinary individuals.
For individuals in the higher education group, age (p < 0.001) again emerged as the next significant predictor, with individuals aged ≤ 44 years and > 44 years as the splits. Among those aged ≤ 44 years, race (p=0.002) was the next significant variable. White individuals showed slightly higher levels of fatalism compared to individuals identifying as Black, Hispanic/Latinx, or other races.
Among individuals aged > 44 years, race (p < 0.001) was again significant. Individuals identifying as Black, Hispanic/Latinx, or another race reported higher levels of fatalism than White individuals. Within the White group, age (p= 0.027) was split into individuals aged ≤ 54 years and > 54 years, within individuals older than 54 years showing the highest fatalism levels. Individuals aged ≤ 54 years were further split by education (p = 0.016), where participants with a doctorate reported the lowest levels of fatalism.
This model showed that education was the primary determinant of fatalism, with age, race and gender moderating this relationship. Figure 3. below predicts Fatalism using the conditional inference algorithm.
3.4. Conditional Inference Tree Results for Divine Control
The algorithm had the most significant covariate as Education, EDU (p<0.001). Education had 2 splits, with the left side being individuals with education levels less than high school, those with an associate degree, those with a high school degree, and those with a trade or technical degree, while the right-side being individuals with bachelor’s degrees, those with doctoral degrees, and those with master’s degrees. Considering the right-hand side, the next significant covariate was Race (p<0.001), with a split between individuals in the black race, and Hispanic, and the other branch being individuals who are white and those in the other race. Individuals of the black and Hispanic race were also split based on Age (p=0.018), that is, at most 28 years and more than 28 years, with those more than 28 years old having slightly higher levels of Divine Control than those aged at most 28 years.
Individuals in the Other and White race were further split based on Gender (p<0.001), with individuals on the Men and Nonbinary branch having slightly lower levels of divine control than those who are in the Other and Women branch on the right branch.
For individuals on the right side of the branch after the split in education, that is bachelor’s, doctoral, and master’s degrees, there was another split based on Race (p=0.038). Individuals in the white race had lower levels of divine control than individuals in the black, Hispanic, and other races.
These results suggest that education is the primary determinant of divine control, with age, race and gender acting as the control of the levels of divine control.
Figure 4. below shows the results from using conditional inference trees in predicting divine
control.
3.5. Conditional Inference Tree Results for Luck
The CIT algorithm identified Age (p<0.001) as the most significant variable in predicting Luck. The root node was split into two: individuals aged at most 55 and those aged more than 55. On the side of individuals aged at most 55 years, it was further split based on ACE (p=0.005), ACE scores greater than 8 had higher levels of luck compared to ACE scores of at least 8, which was also split based on Education (p=0.006). Individuals in the left branch, those with less than a high school education, with an associate's degree, and those with a high school degree had higher levels of luck than those with a bachelor’s degree, a doctorate, a master’s degree, and a technical or trade certificate.
For the right side of the root node split, that is, individuals aged more than 55 years, this was further split based on Education, EDU (p=0.004). One side being individuals with less than a high school education, those with a high school education, and those with a trade or technical certification had higher levels of luck than those with an associate, bachelor’s, doctoral, and master’s degree. This left branch was further divided based on Urban status, URBAN (p=0.007). Based on this further split, individuals who live in the city, town, or other urban status had higher levels of luck than those who had their urban status as Rural or Suburb.
This model indicates that younger individuals with higher ACE scores and lower educational attainment tend to report higher levels of luck, while among older adults, lower education attainment and urbanicity are associated with higher perceived luck. These highlights the interplay of age, childhood experiences and community type in shaping perceptions of luck. Figure 5 below shows the cutoff from the CIT algorithm that was used in predicting luck.
3.6. Conditional Inference Tree Results for Helplessness
The results below show the cutoffs from the CIT algorithm in predicting Helplessness. The root node, which is also the most significant covariate, is Age (p<0.001). This was split into two branches, with individuals at most 52 years old on the left and those more than 52 years old on the right. For individuals aged at most 52, this was further split based on ACE (p<0.001), which emerged as the next most significant covariate. ACE was further divided into individuals with at most an ACE score of 1 and those with more than 1 ACE score. ACE ≤ 1 was split based on Race (p<0.001), with individuals of the White race recording higher levels of helplessness than those in the Black, Hispanic, and other races. For those with ACE > 1, this was further split based on ACE (p<0.001), with two branches: at most ACE score 7 and ACE greater than 7, with individuals having an ACE score > 7 having the highest level of helplessness.
For the right side of AGE (p<0.001), that is individuals aged more than 52 years, this was further split based on education EDU (p<0.001), left branch (individuals with less than high school diploma and those with a high school diploma) and right branch (individuals with an associate degree, bachelor’s degree, master’s degree, and trade or technical certificate). The left branch was further split based on age (p<0.001), with individuals at most 70 years having slightly higher helplessness levels than those more than 70 years, which was also split between ACE ≤ 3 and ACE > 3, and individuals with an ACE score greater than 3 had higher levels of helplessness.
The right side of the branch, based on associate degree, bachelor’s degree, master’s degree, and trade or technical certificate, was again split based on ACE (p=0.002), with ACE scores at most 6 on the left branch and ACE scores >6 on the right branch. Individuals with ACE scores of more than 6 had higher helplessness levels than those on the left branch. The left branch, based on ACE at most 6, was further divided into City, Rural, and Suburb on one branch and Other urbanicity and Town on another branch, with individuals on the Other urbanicity and Town urban status having higher levels of helplessness.
Figure 6 below shows the cutoff for predicting helplessness.
3.7. Conditional Inference Tree Results for Internality
The most significant predictor from the algorithm was Age (p<0.001), which was split into individuals aged at most 48 years and individuals aged more than 48 years. Individuals older than 48 years had lower levels of internality than individuals 48 years and younger. Individuals aged 48 or less was further split based on education, EDU (p=0.008) into those two branches: those with less than a high school diploma, those with a doctorate, those with a high school diploma, those with a technical or trade certificate and the other branch being individuals with an Associate degree, those with a bachelor's degree and those with a master's degree. Individuals with an associate degree, bachelor’s degree, and master’s degree had lower levels of internality than those at the other branch.
These results show that younger age and lower educational attainment are associated with higher internality, while older individuals tend to have lower internality. Figure 7 below shows the CIT algorithm in predicting internality.
4. Discussion
This study aimed to use conditional inference trees to predict psychological constructs and examine how the possible interaction of covariates contributes to achieving that.
The results from the conditional inference trees highlight the complex interplay of covariates in predicting levels of psychological constructs. In the case of depression, adverse childhood experiences (ACEs) and age emerged as the most significant predictors. Individuals with higher ACE scores reported more severe depression symptoms, with the highest levels observed among adults over the age of 44 who experienced multiple childhood adversities (ACE > 1), and especially those exceeding a threshold of ACE > 8. In contrast, the lowest depression scores were found among individuals with minimal childhood adversity (ACE ≤ 1), particularly those in the oldest age group (age > 77), suggesting that as one gets older in life and has lower or no ACE, the lower the depression levels.
In predicting anxiety, ACE and age played another significant role, with higher levels of anxiety observed in individuals with higher ACE scores (> 1) and younger age (≤ 58 years). Within this group, those with very high ACEs (> 7) exhibited higher levels of anxiety. However, individuals with minimal ACE scores (≤ 1) and older than 71 years experienced lower levels of anxiety. These findings suggest that younger individuals appear more vulnerable to the psychological impact of early adversity, whereas older adults with low ACE exposure may represent a more resilient group. This aligns with previous studies that higher ACE exposure is associated with higher risk for depression and anxiety across the life of an individual (Felitti et al., 1998; Hughes et al., 2017).
The interaction of education, age, gender, and race significantly predicted varying levels of fatalism. Higher levels of fatalism were observed among individuals under the age of 44 who identified as Black, Hispanic, or other races and held an associate’s, bachelor’s, master’s, or doctoral degree. This suggests that, in younger age groups and among Black, Hispanic, or other races, higher educational attainment may be associated with a stronger belief in fatalistic perspectives, such as “what is going to happen will happen.” In contrast, the lowest levels of fatalism were observed among White individuals aged between 45 and 54 with a doctoral degree, indicating that both racial identity and educational attainment may work together to reduce the idea of fatalism.
In predicting the levels of divine control, the interaction of education, race, gender, and age played an important role. Individuals who had attained less than a high school diploma, an associate degree, a high school degree, or a technical certificate and were of the black or Hispanic race and aged more than 28 years had higher levels of divine control. This suggests that individuals who are black or Hispanic and have attained lower levels of education and are aged more than 28 believe more in things happening in their lives as “part of God’s plan”. The interaction of age, adverse childhood experiences (ACEs), education, and urbanicity significantly predicted varying levels of belief in luck. The highest level of luck-related beliefs, with statements like “When I get what I want, it's usually because I'm lucky," was found among individuals aged 55 or younger who reported very high ACE scores (> 8). Additionally, individuals more than 55, with higher educational attainment (associate’s, bachelor’s, master’s, or doctoral degrees) and who resided in urban or other settings also showed higher levels of luck. These patterns suggest that both early adversity and factors like education and urbanicity may influence individuals' beliefs in luck.
In predicting helplessness, individuals aged 52 or younger with high ACE scores (> 7) reported the highest levels of helplessness, with statements such as “I feel that nothing I can do will change things.” This highlights the impact of early-life adversity on psychological perceptions, particularly among younger adults, suggesting that ACEs may have a lasting effect on beliefs that influence one’s success. Age and education interacted to predict different levels of internality. That is, belief in statements like “I feel that when good things happen, they happen as a result of my own efforts." Individuals aged at most 48 years and with higher levels of education had higher levels of internality which aligns with previous studies from Ross & Wu (1995) which highlighted that education enhances perceptions of personal efficacy and control.
These findings highlight the complex interaction between covariates in predicting psychological constructs like depression, anxiety, fatalism, divine control, luck, helplessness, and internality. By understanding how psychological outcomes are influenced, policymakers can develop more effective strategies to address persistent psychological issues across the U.S.
Limitations
The sample size was slightly reduced due to missing data from certain states, specifically North Dakota, Alaska, and Hawaii, which had to be excluded from the analysis. As a result, the total sample size decreased from 2,000 to 1,953. While the findings and recommendations provide meaningful insights, it is important to acknowledge that the study does not represent all U.S. regions. This geographic limitation should be considered when interpreting the results and their generalization.
5. Conclusions
This study highlights the importance of considering the interplay of covariates in predicting different levels of psychological constructs. We demonstrated how covariates such as ACE, age, race, gender, education, and urbanicity interact to influence constructs like depression, anxiety, fatalism, divine control, luck, helplessness, and internality. The results show that education and younger ages are associated with higher levels of both fatalism and internality. At the same time, ACEs, particularly when interacting with race, predicted greater helplessness and belief in divine control. These results underline the need for more nuanced, context-specific mental health interventions that take into account how social and demographic factors interact to influence psychological outcomes in the United States.
Author Contributions
Conceptualization, Samantha Robinson; methodology, Samantha Robinson; software, Frank Amo Agyei-Owusu and Samantha Robinson; validation, Samantha Robinson; formal analysis, Frank Amo Agyei–Owusu; data Curation, Frank Amo Agyei–Owusu and Samantha Robinson; writing - Original Draft Preparation, Frank Amo Agyei–Owusu, Samantha Robinson, Qingyang Zhang; writing - Review & Editing, Frank Amo Agyei–Owusu, Samantha Robinson, Qingyang Zhang; supervision, Frank Amo Agyei–Owusu, Samantha Robinson, Qingyang Zhang. All authors contributed to the manuscript.
Funding
The authors received no external funding for this research.
Data Availability Statement
The data used for this study are available from the corresponding author upon reasonable request.
Conflicts of Interest
The authors declare that they have no competing interest.
References
- Breiman, L., Friedman, J. H., Olshen, R. A., & Stone, C. J. (1984). Classification and Regression Trees. https://doi.org/https://books.google.com/books?id=JwQx-WOmSyQC.
- Encyclopedia Britannica. (2025, March 12). Cognitive Psychology. https://www.britannica.com/science/cognitive-psychology.
- Esparza, O. A.; Wiebe, J. S.; Quiñones, J. Simultaneous Development of a Multidimensional Fatalism Measure in English and Spanish. Current Psychology 2015, 34(4), 597–612. [Google Scholar] [CrossRef] [PubMed]
- Felitti, V. J.; Anda, R. F.; Nordenberg, D.; Williamson, D. F.; Spitz, A. M.; Edwards, V.; Koss, M. P.; Marks, J. S. Relationship of Childhood Abuse and Household Dysfunction to Many of the Leading Causes of Death in Adults. American Journal of Preventive Medicine 1998, 14(4), 245–258. [Google Scholar] [CrossRef] [PubMed]
- Fox, J.; Weisberg, S. An R Companion to Applied Regression (Third); Sage, 2019; Available online: https://www.john-fox.ca/Companion/.
- Hothorn, T.; Hornik, K.; Zeileis, A. Unbiased recursive partitioning: A conditional inference framework. Journal of Computational and Graphical Statistics 2006, 15(3), 651–674. [Google Scholar] [CrossRef]
- Hothorn, T.; Zeileis, A. partykit: A modular toolkit for recursive partytioning in R . Journal of Machine Learning Research 2015, 16, 3905–3909. Available online: https://jmlr.org/papers/v16/hothorn15a.html.
- Hughes, K.; Bellis, M. A.; Hardcastle, K. A.; Sethi, D.; Butchart, A.; Mikton, C.; Jones, L.; Dunne, M. P. The effect of multiple adverse childhood experiences on health: A systematic review and meta-analysis. The Lancet Public Health 2017, 2(8), e356–e366. [Google Scholar] [CrossRef] [PubMed]
- Jensen, D. D.; Cohen, P. R. Multiple Comparisons in Induction Algorithms; 2000. [Google Scholar] [CrossRef]
- Levshina, N. Conditional Inference Trees and Random Forests. In A Practical Handbook of Corpus Linguistics; Springer International Publishing, 2021; pp. 611–643. [Google Scholar] [CrossRef]
- National Institute of Mental Health. (2023, July). Major Depression. https://www.nimh.nih.gov/health/statistics/major-depression.
- R Core Team. (2024, April 24). R: A Language and Environment for Statistical Computing. https://www.r-project.org/.
- Robinson, S.; Hearne, B. Identifying Psychological Distress Patterns during the COVID-19 Pandemic using an Intersectional Lens. Qeios 2023, 5(7). [Google Scholar] [CrossRef]
- Ross, C. E.; Wu, C. The Links Between Education and Health. American Sociological Review 1995, 60(5), 719. [Google Scholar] [CrossRef]
- Schantz, B. L.; Toner, E. R.; Brown, M. L.; Kaiser, N.; Chen, A.; Adhikari, S.; Hoeppner, S. S.; Bui, E.; Simon, N. M.; Szuhany, K. L. Examining the relationship between emotion regulation, sleep quality, and anxiety disorder diagnosis. Journal of Mood & Anxiety Disorders 2024, 8, 100072. [Google Scholar] [CrossRef] [PubMed]
- White, A. P., Zhong Liu Wzliu, W., & Quinlan, J. Technical Note Bias in Information-Based Measures in Decision Tree Induction; 1994; Vol. 15. [CrossRef]
- Wickham, H.; François, R.; Henry, L.; Müller, K.; Vaughan, D. dplyr: A Grammar of Data Manipulation 2023. [CrossRef]
- YouGov, PLC. YouGov: Data analytics & market research services . 18 October 2025. Available online: https://yougov.com/.
Figure 1.
Conditional Inference Trees Showing Splits in Predicting Depression.
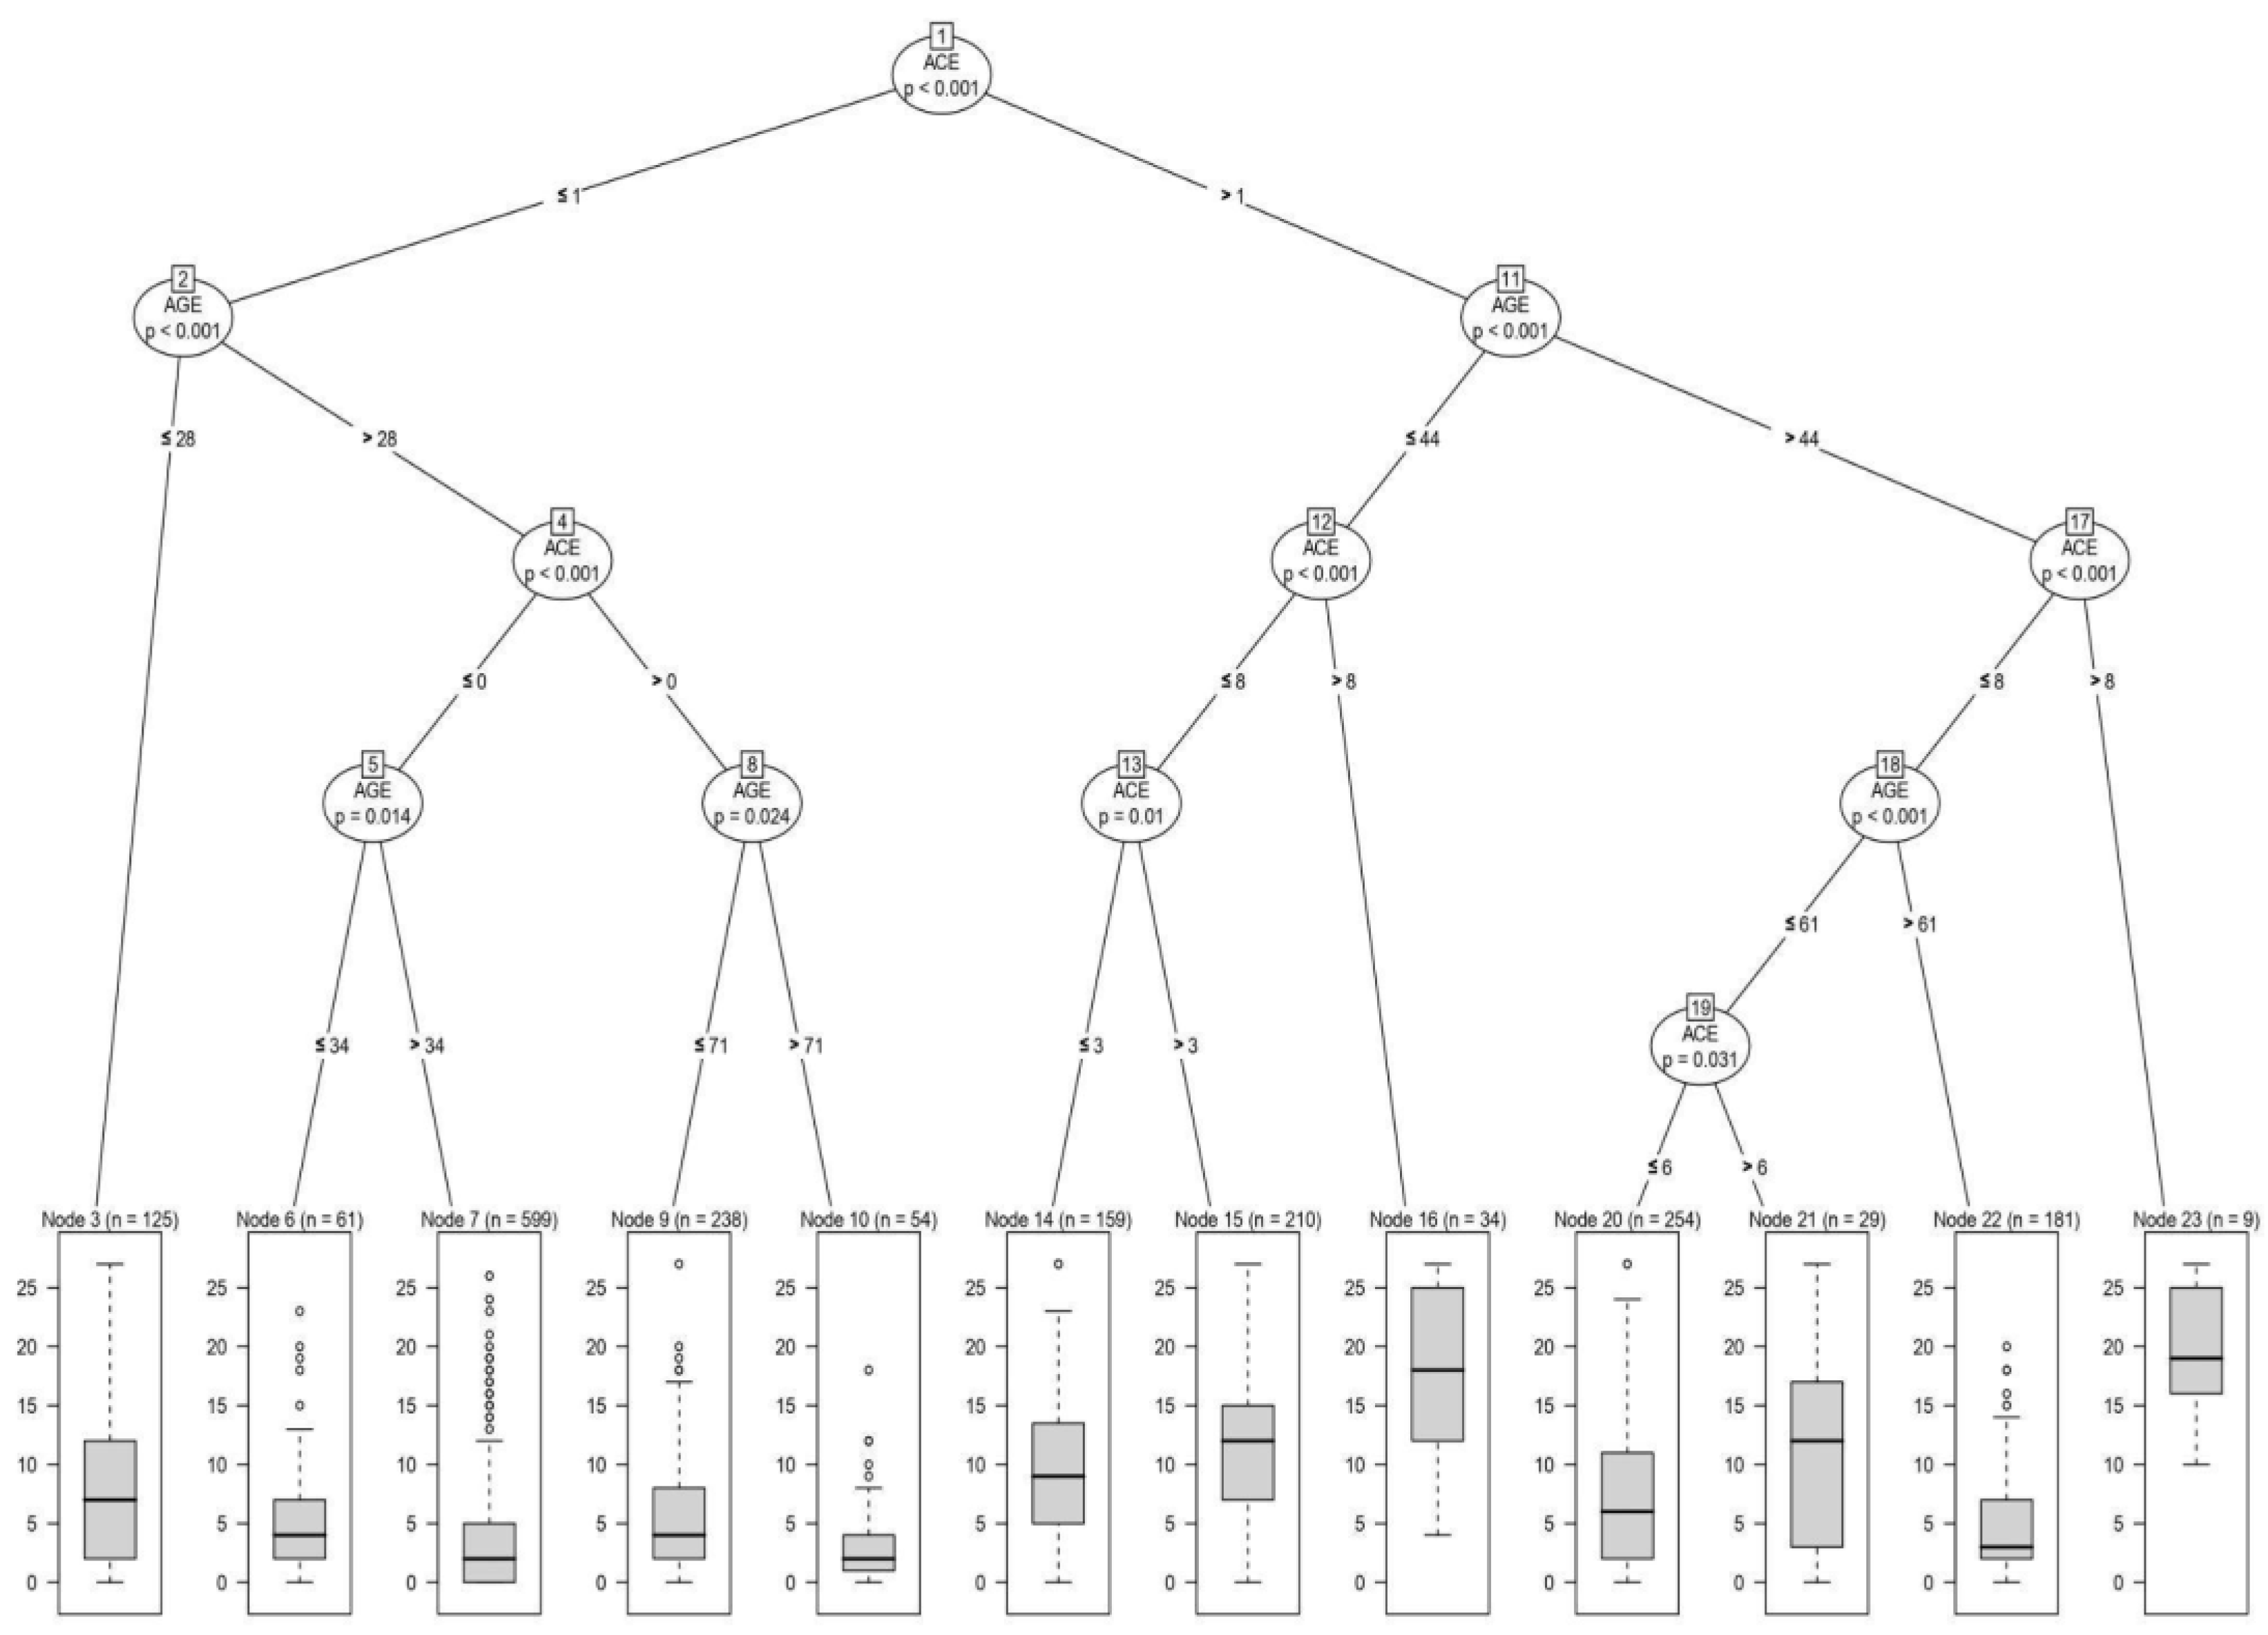
Figure 2.
Conditional Inference Trees Showing Splits in Predicting Anxiety.
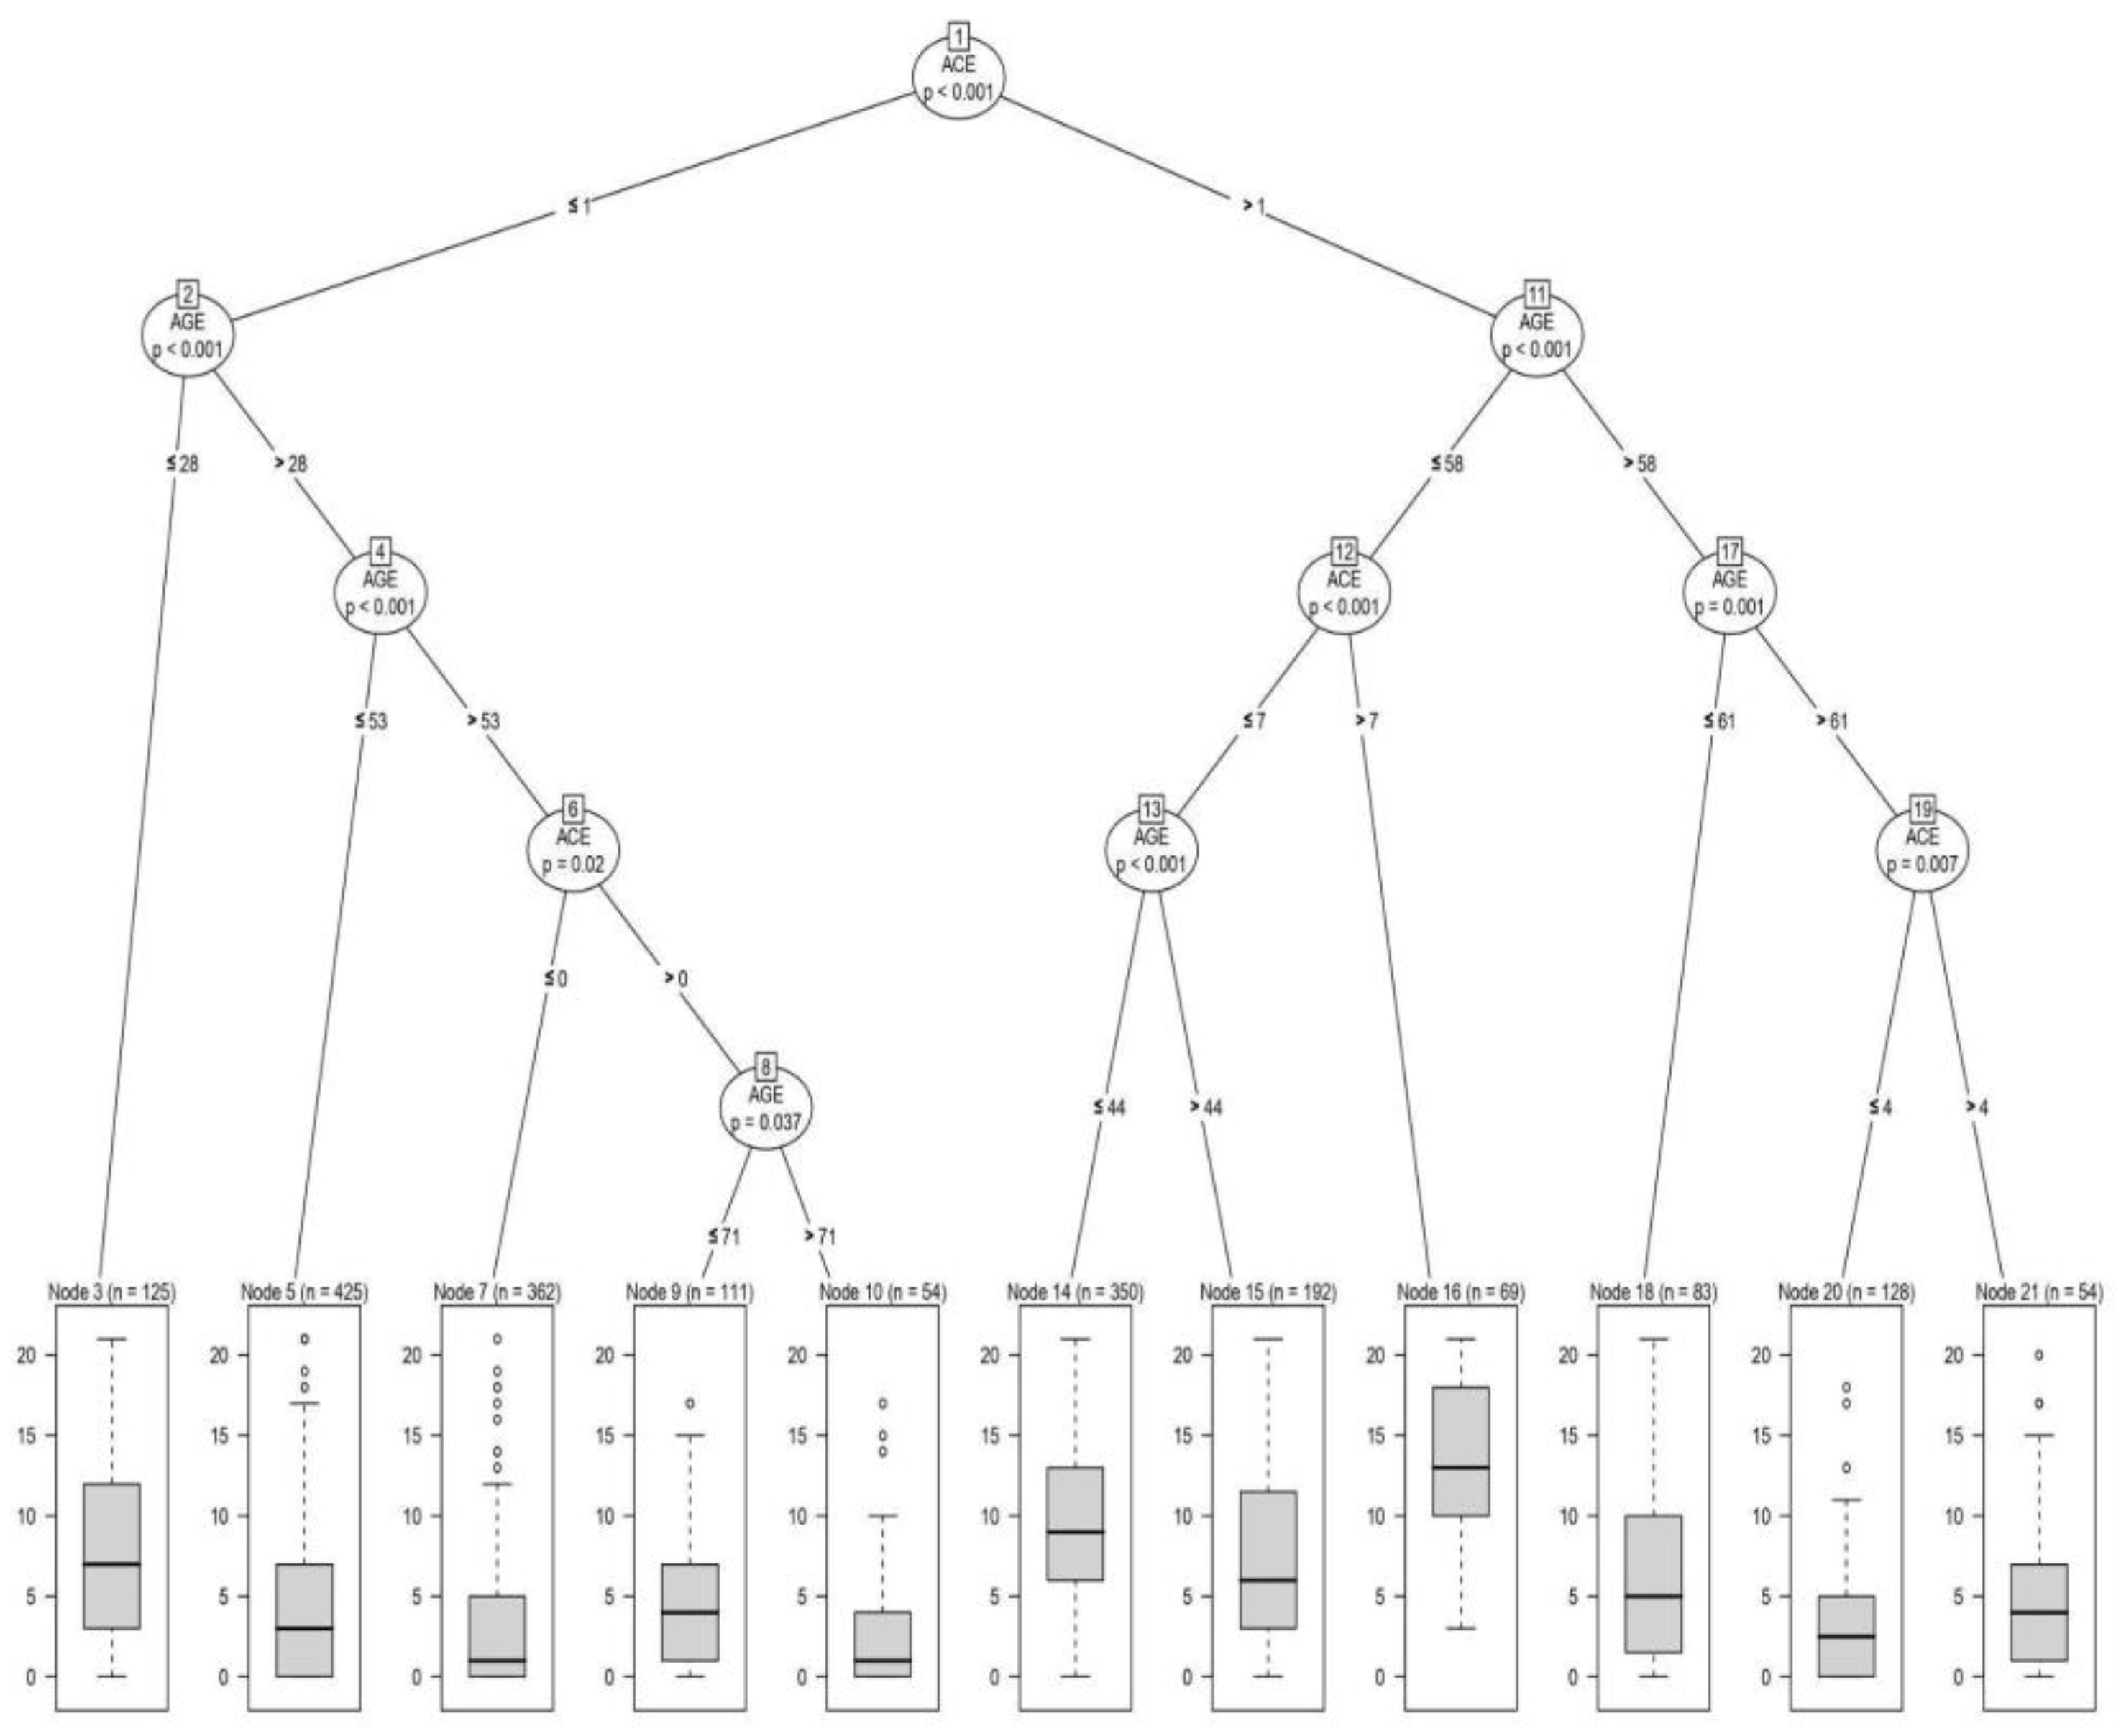
Figure 3.
Conditional Inference Trees Showing Splits in Predicting Fatalism.
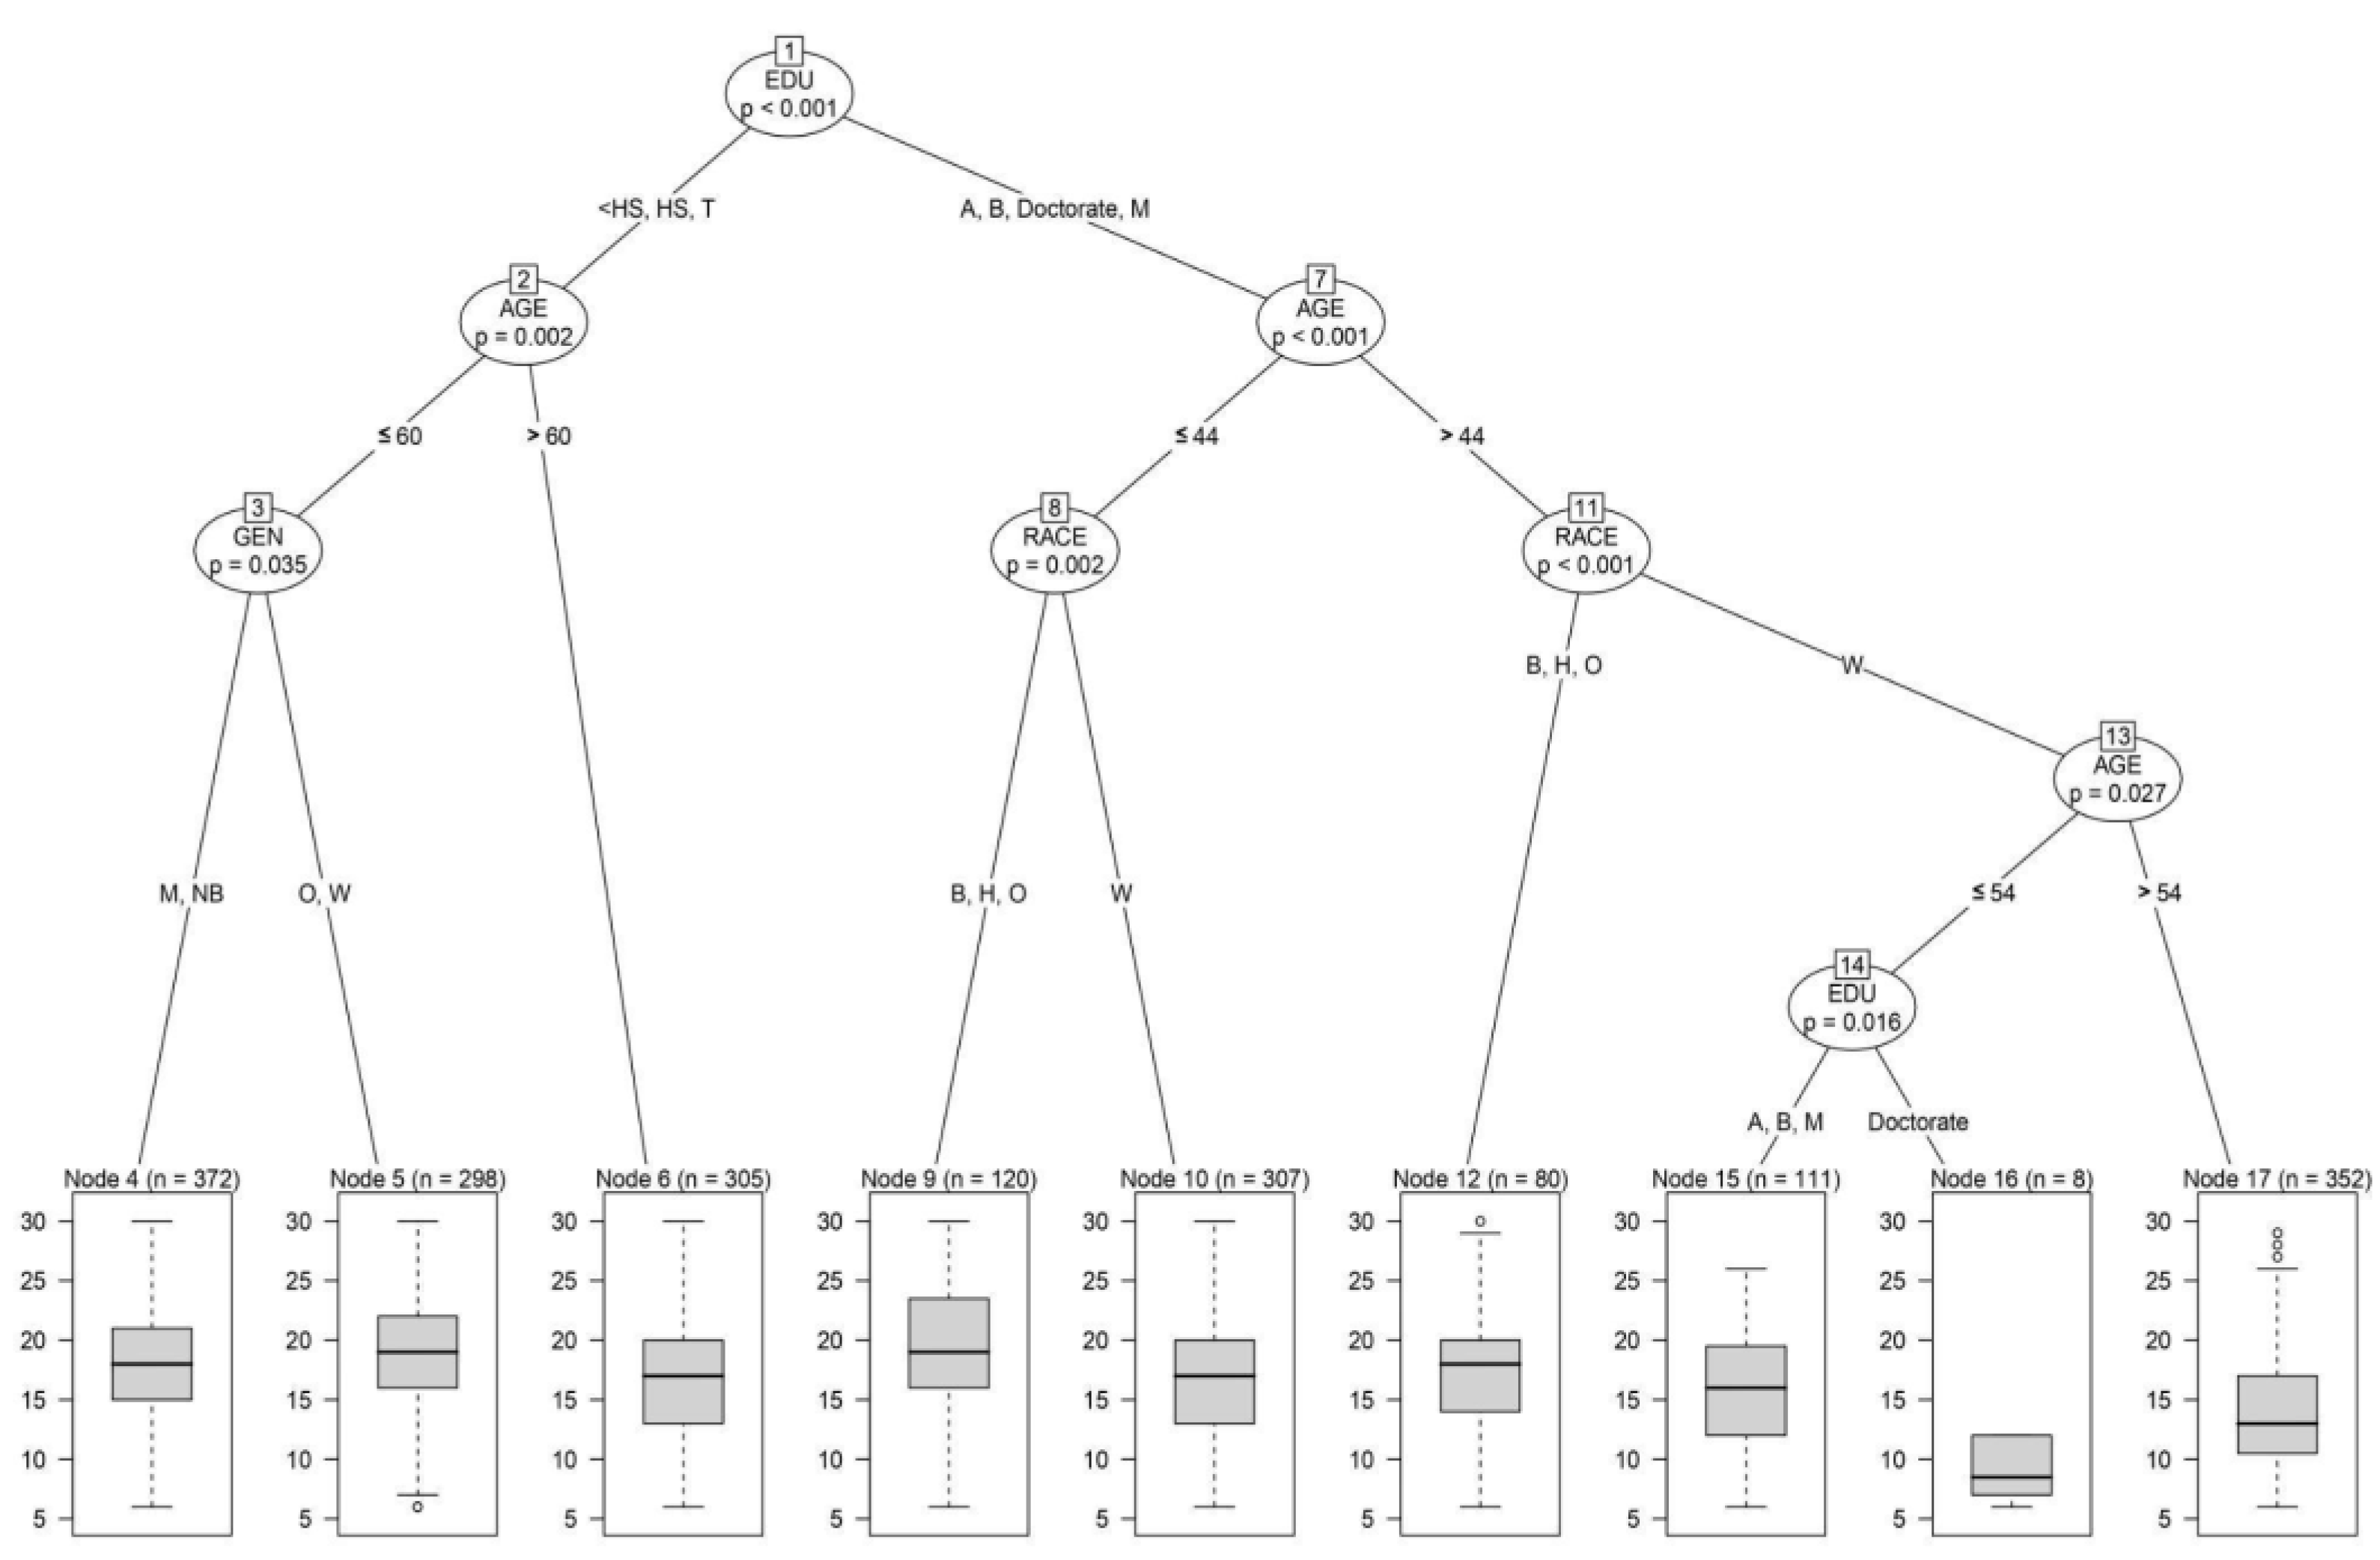
Figure 4.
Conditional Inference Trees Showing Splits in Predicting Divine Control.
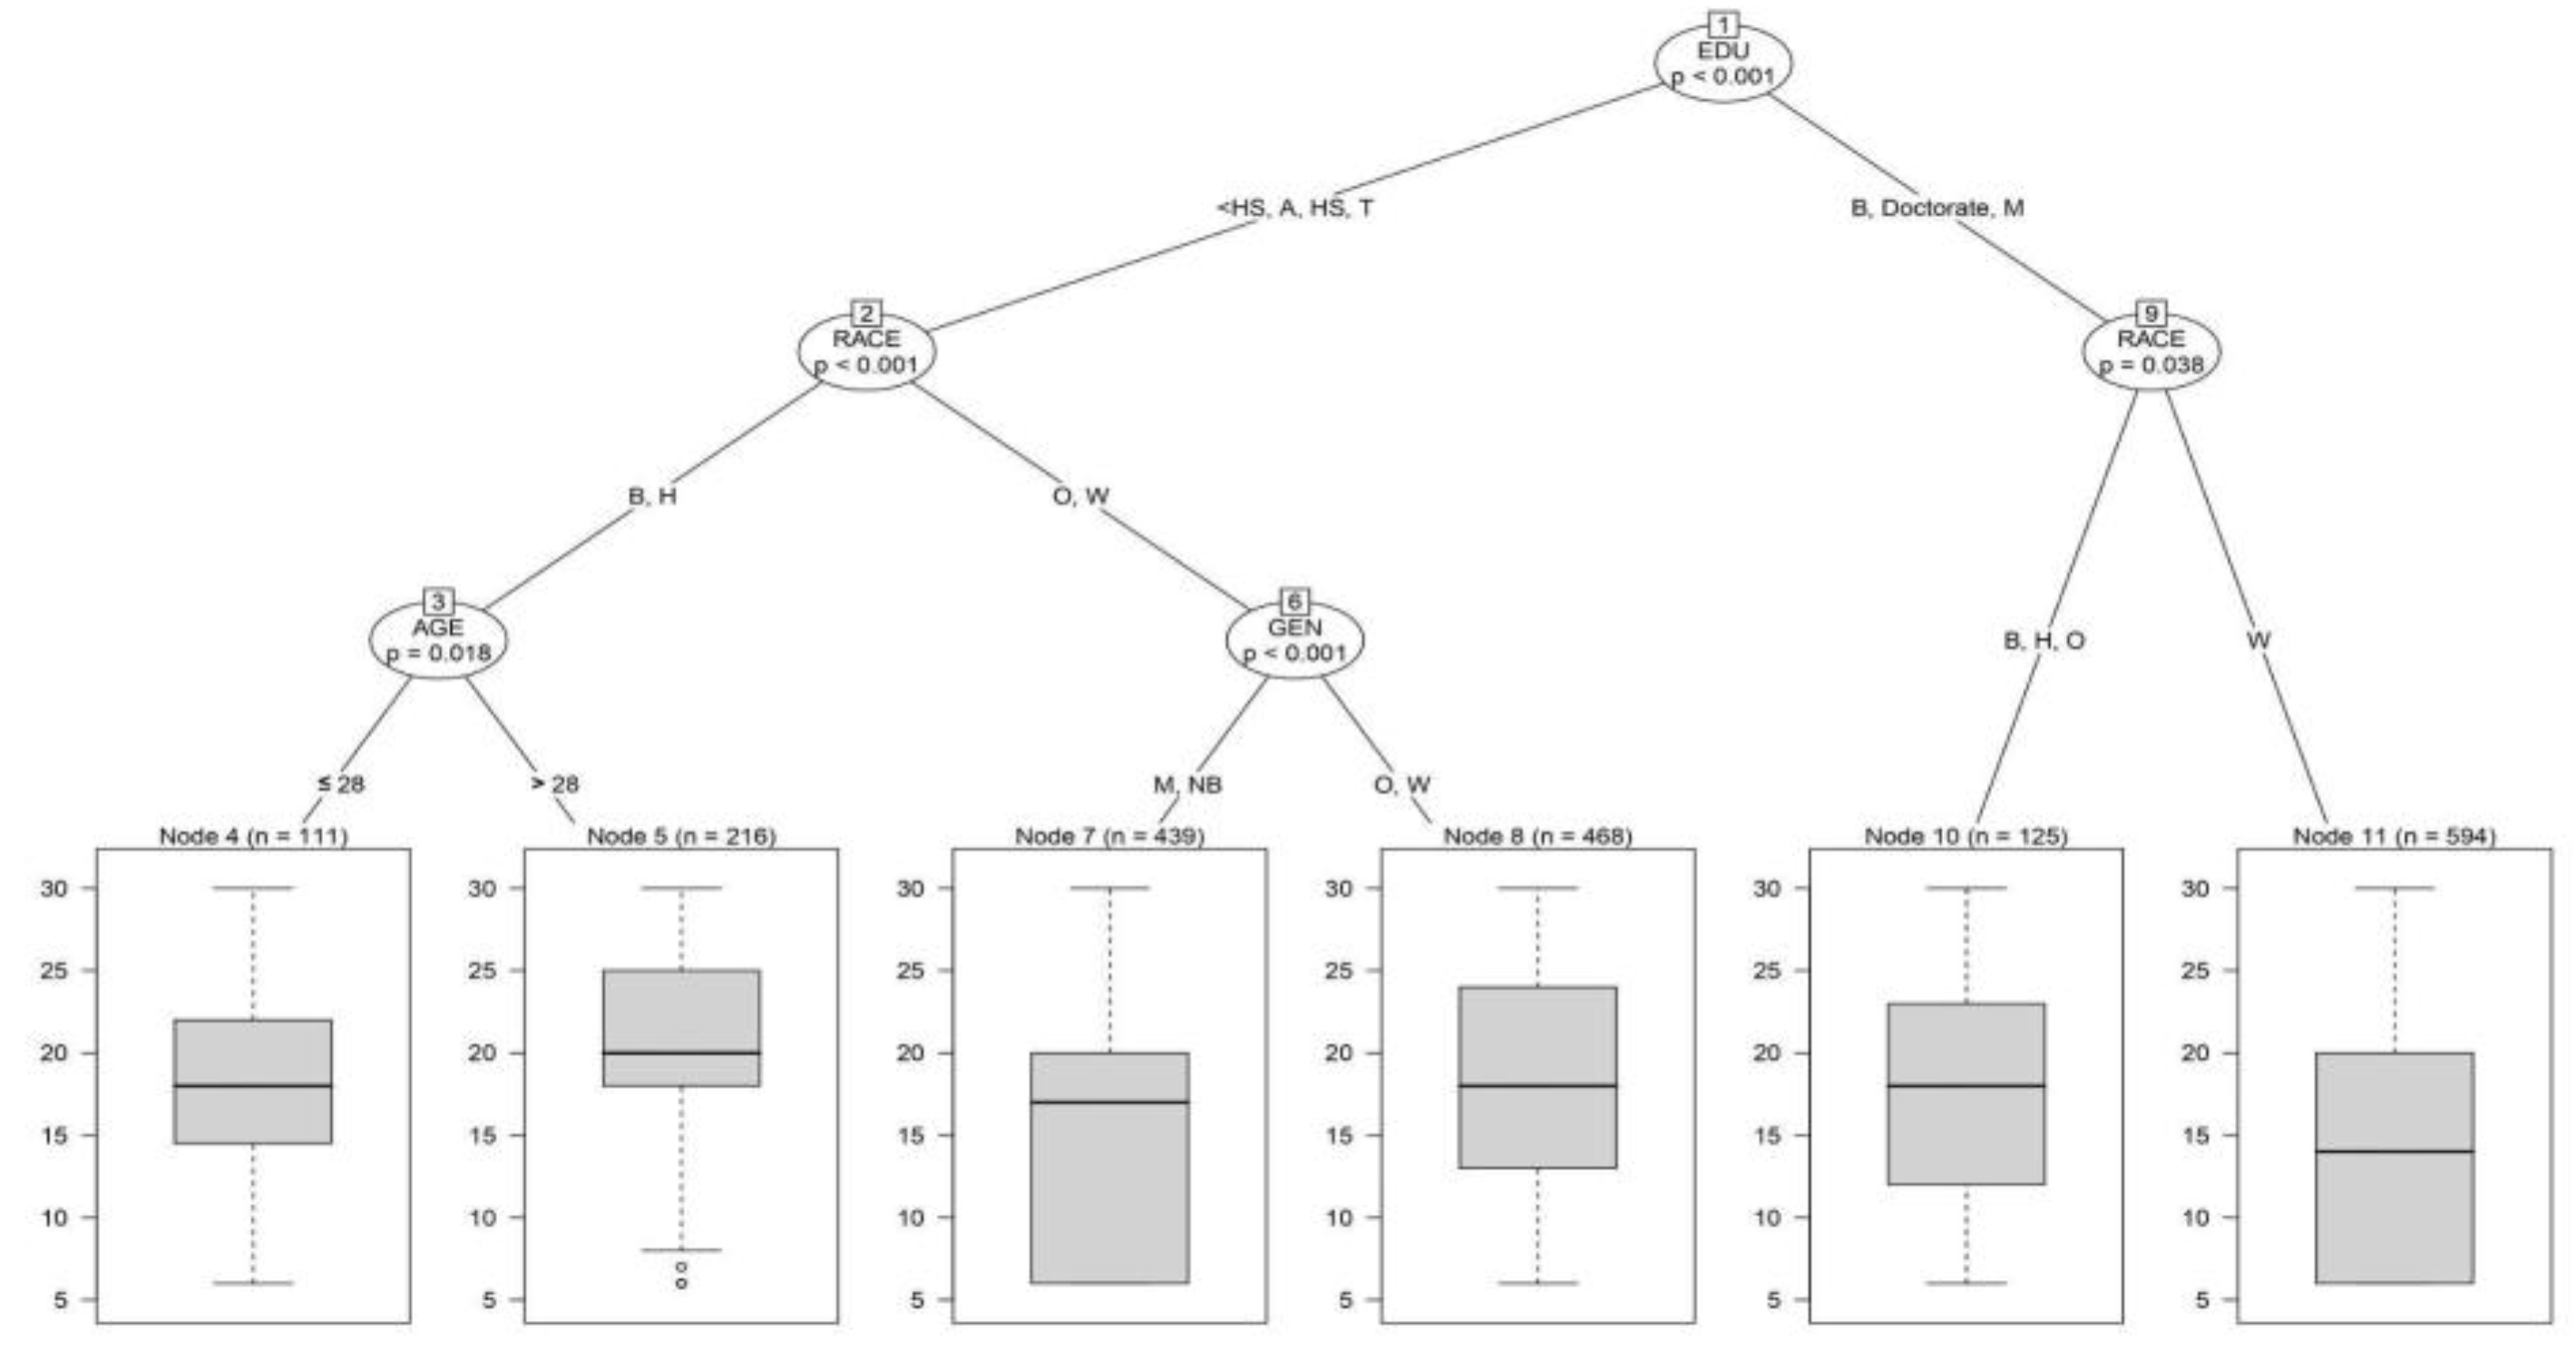
Figure 5.
Conditional Inference Trees Showing Splits in Predicting Luck.
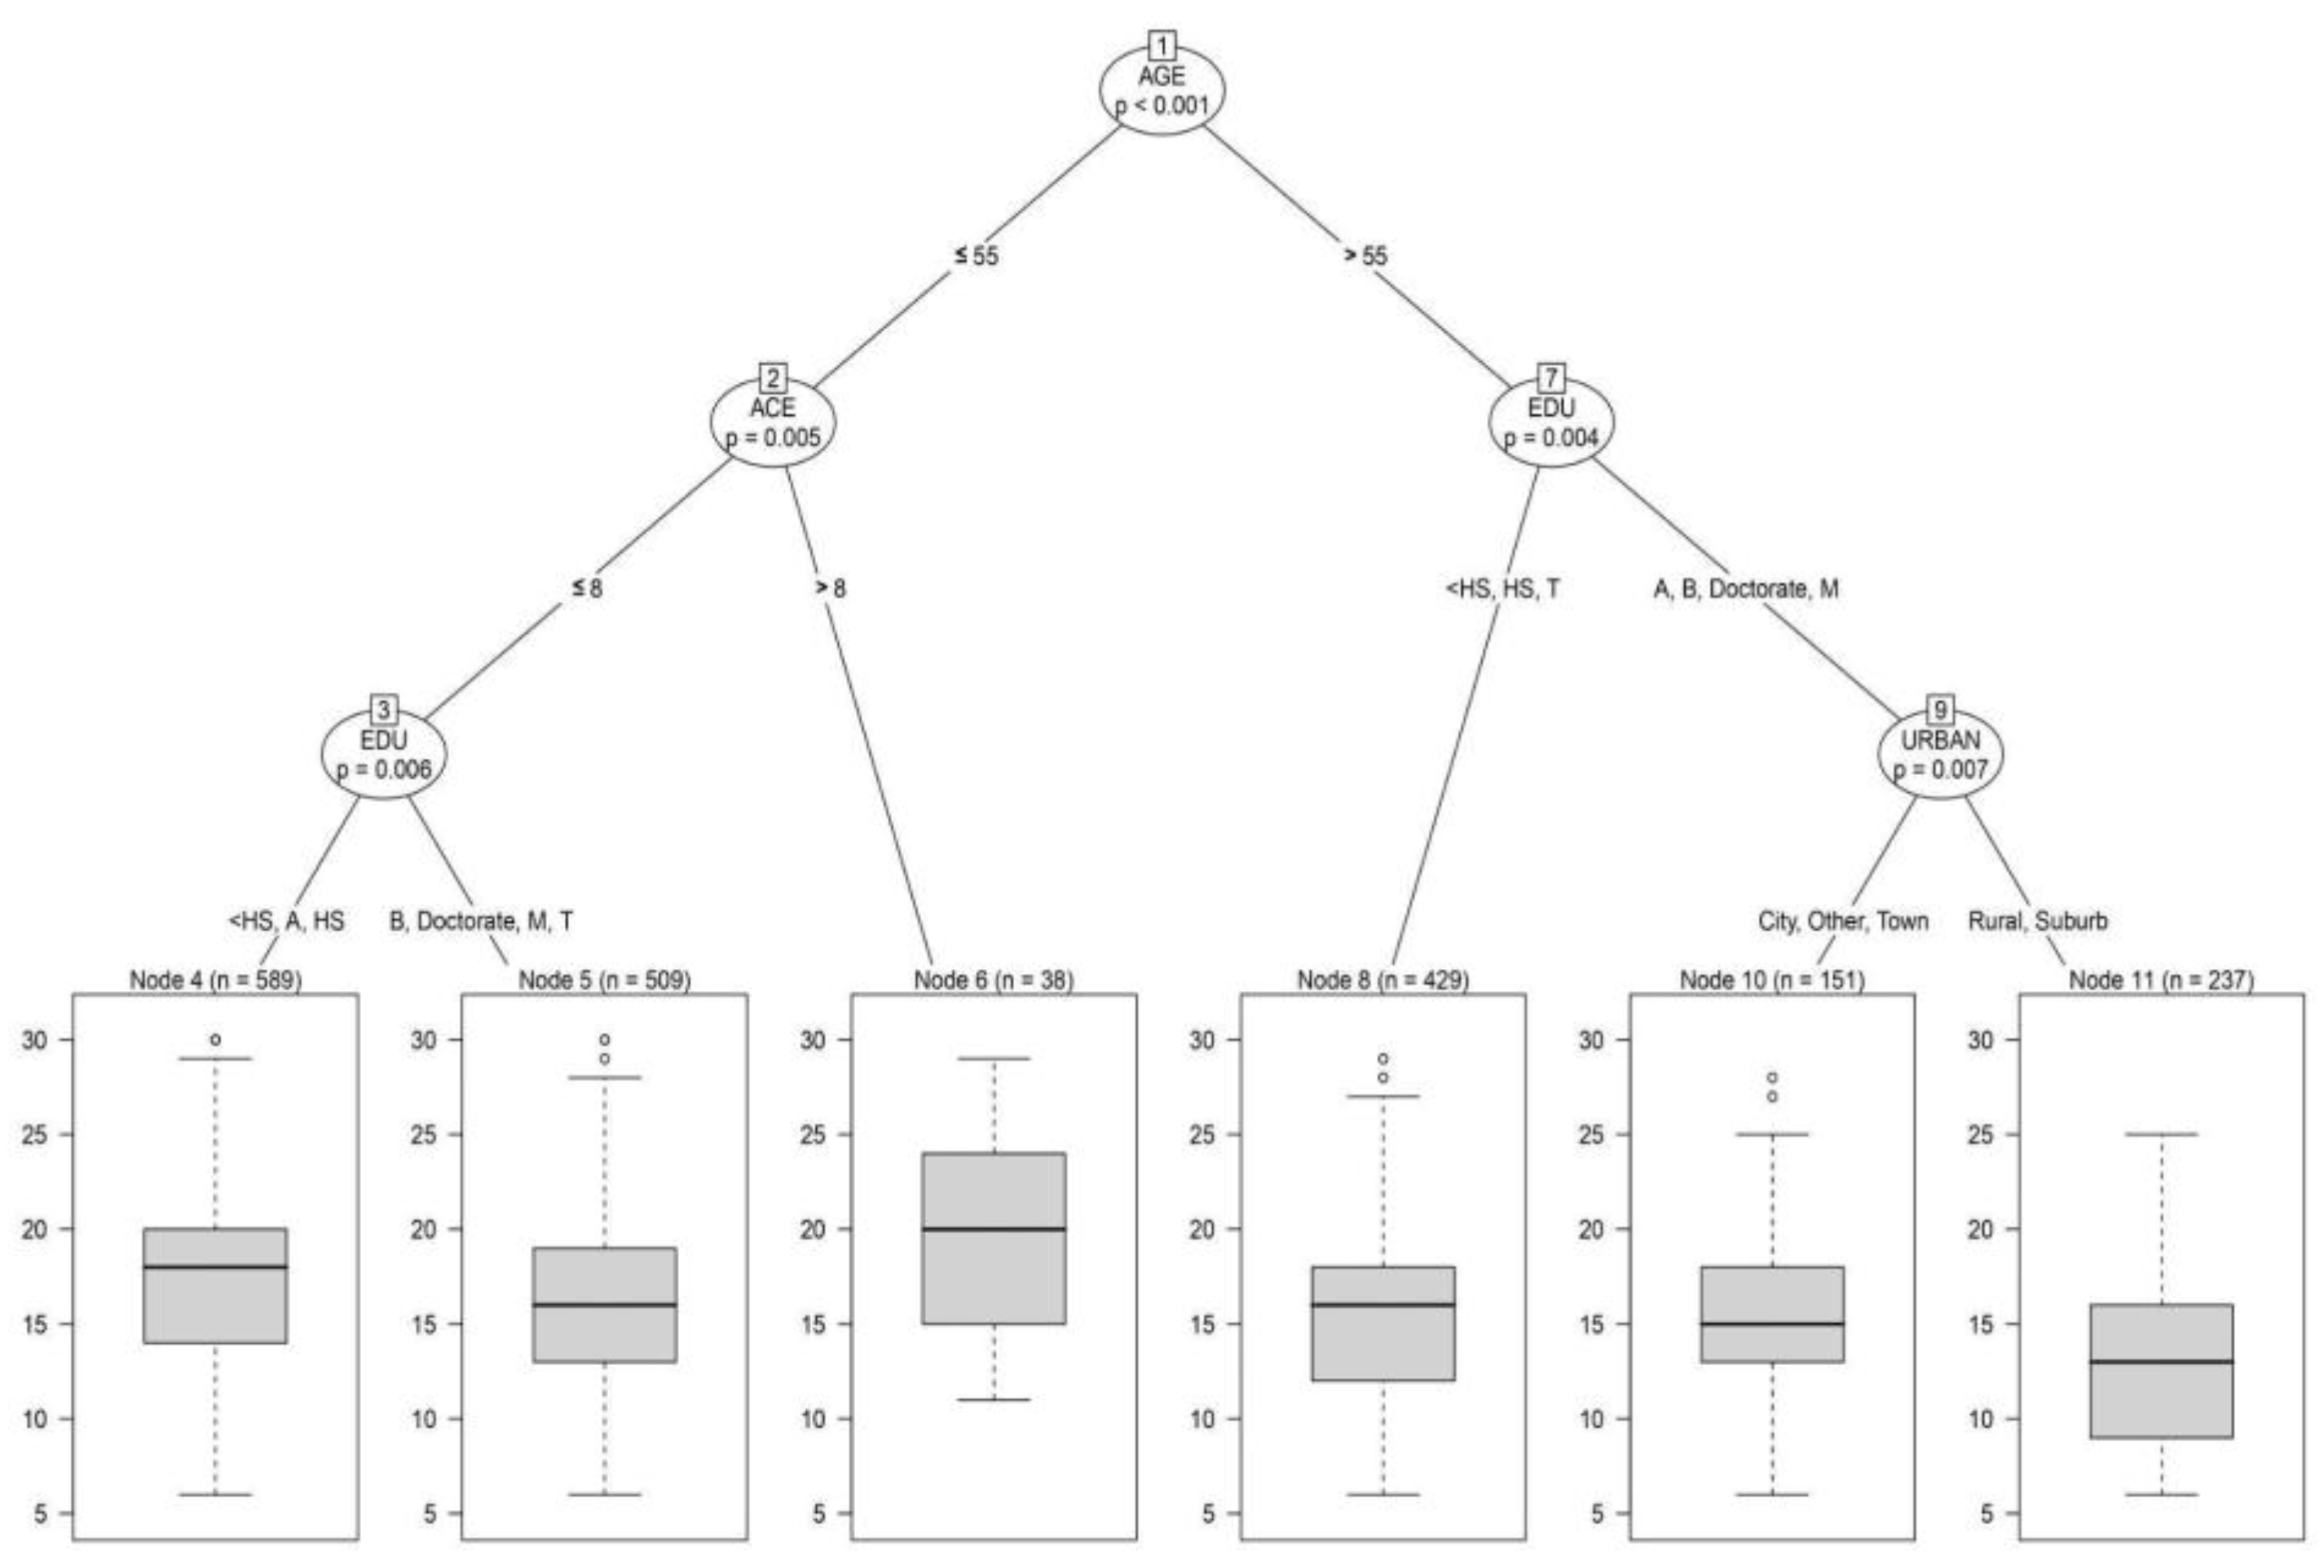
Figure 6.
Conditional Inference Trees Showing Splits in Predicting Helplessness.
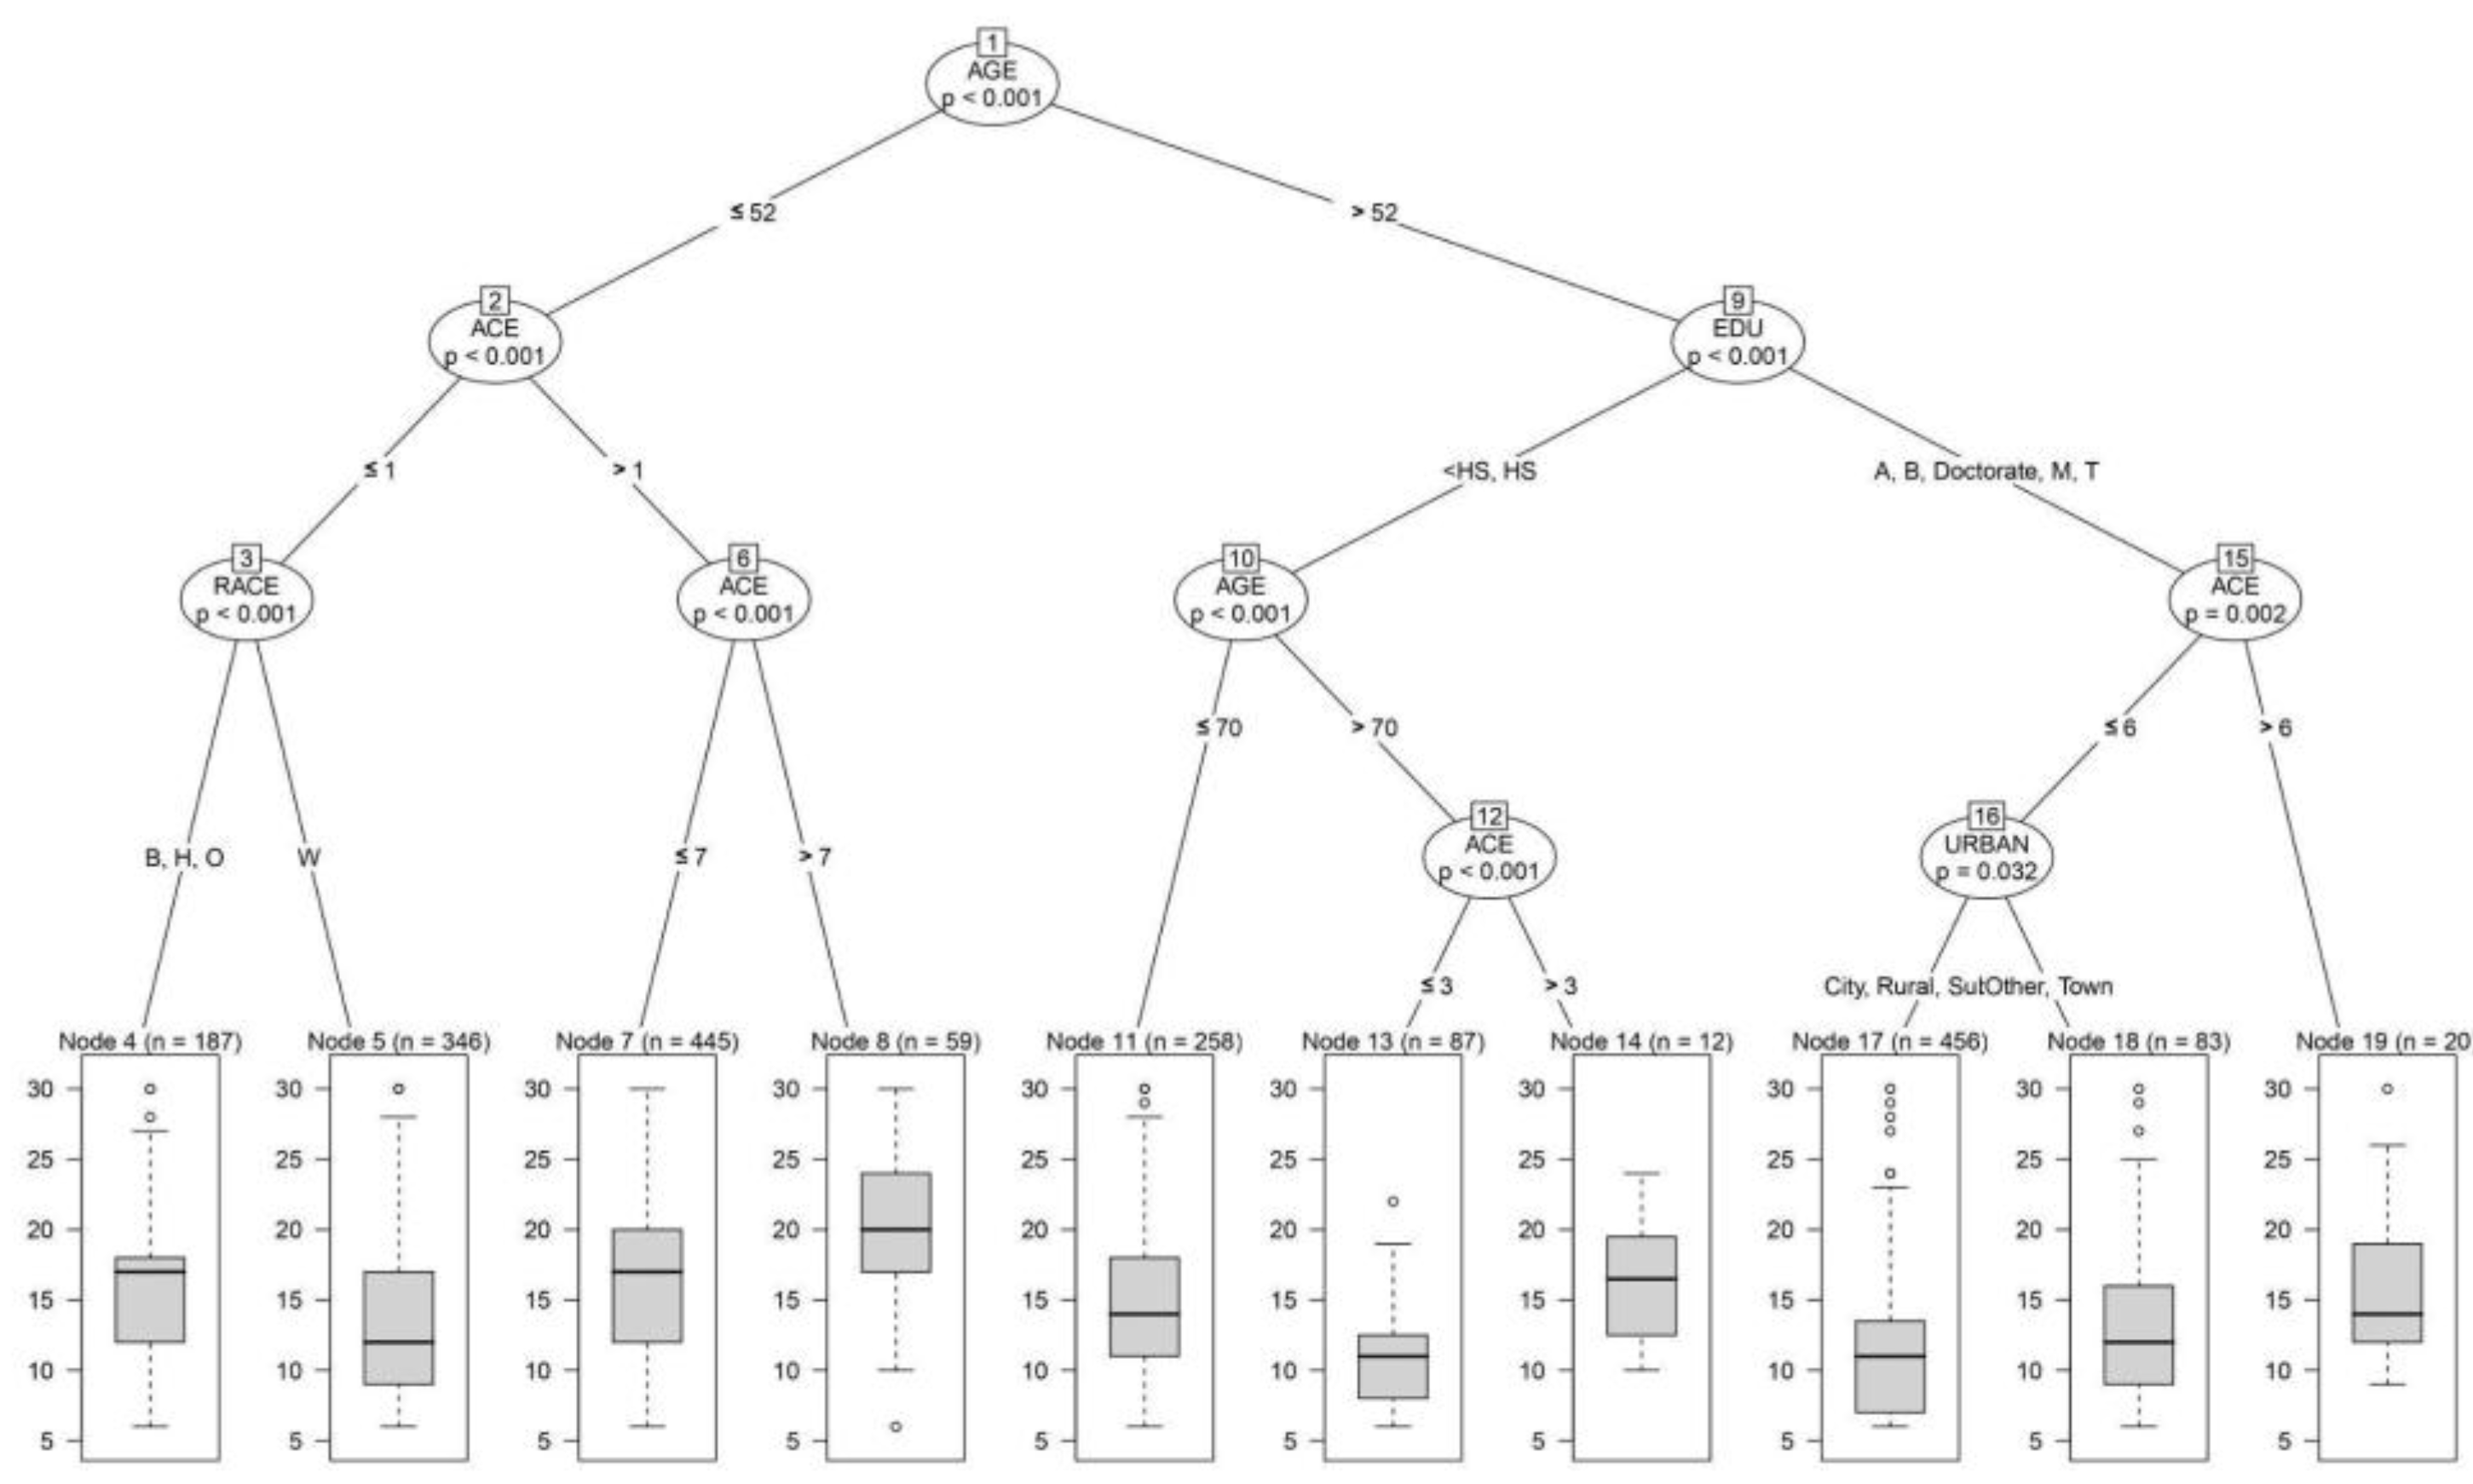
Figure 7.
Conditional Inference Trees Showing Splits in Predicting Internality.
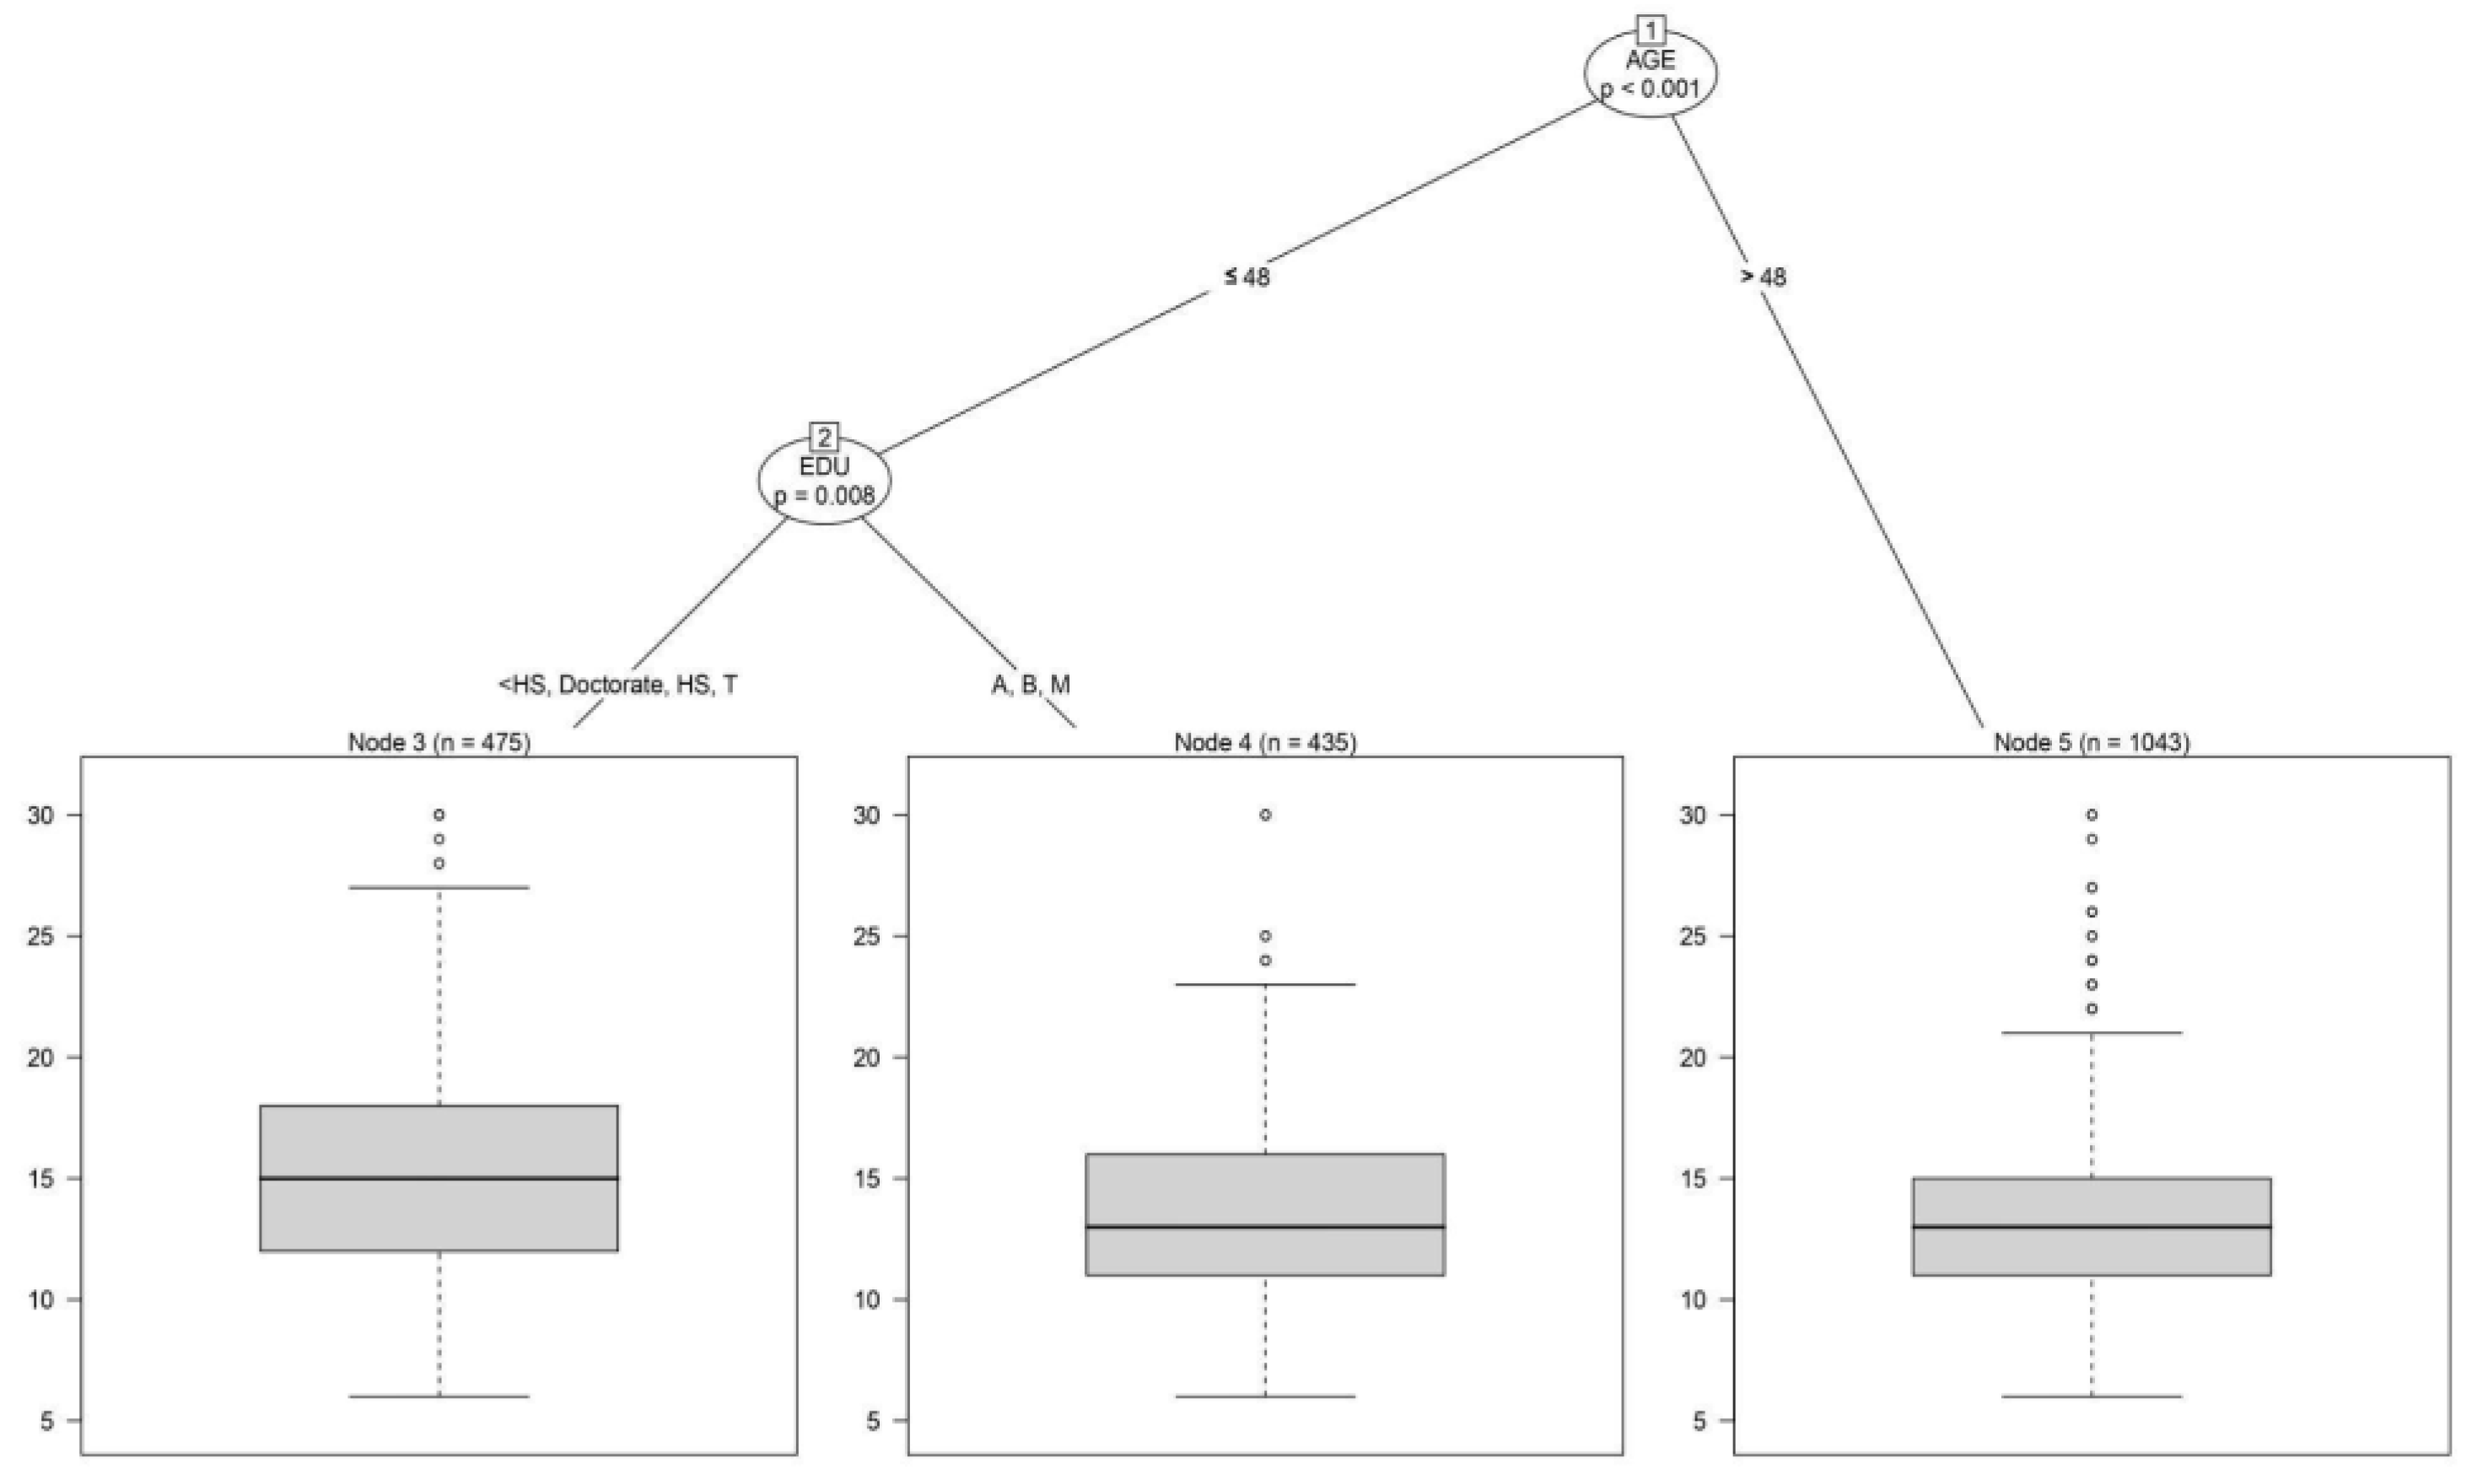

Table 1.
Demographic Information about the Participants of the Study.
| Variable1 | Level | N = 1953 |
|---|---|---|
| Adverse Childhood Experience | 2.05 (2.40) | |
| Age | 49.8 (17.3) | |
| Anxiety | 5.89 (5.51) | |
| Depression | 6.34 (6.11) | |
| MFS Subscales | ||
| Fatalism | 16.8 (5.43) | |
| Divine Control | 16.5 (7.67) | |
| Luck | 15.8 (5.10) | |
| Helplessness | 14.0 (5.77) | |
| Internality | 13.6 (4.52) | |
| Gender (%) | ||
| Man | 931 (47.7%) | |
| Non-Binary | 25 (1.3%) | |
| Other | 5 (0.3%) | |
| Woman | 992 (50.8%) | |
| Race (%) | ||
| Black | 238 (12.2%) | |
| Hispanic / Latinx / Spanish | 167 (8.6%) | |
| Other | 102 (5.2%) | |
| White | 1446 (74.0%) | |
| Education (%) | ||
| Less than High School Diploma | 70 (3.6%) | |
| Doctorate or Professional Degree | 78 (4.0%) | |
| Associate Degree | 259 (13.3%) | |
| Bachelor's Degree | 448 (22.9%) | |
| High School Diploma | 715 (36.6%) | |
| Master's Degree | 193 (9.9%) | |
| Trade / Technical / Vocational Diploma or Certificate | 190 (9.7%) | |
| Urban (%) | ||
| City | 605 (31.0%) | |
| Other | 6 (0.3%) | |
| Rural area | 362 (18.5%) | |
| Suburb | 724 (37.1%) | |
| Town | 256 (13.1%) |
1Quantitative variable summaries reported as mean(SD). All other values reported as N (%).
Disclaimer/Publisher’s Note: The statements, opinions and data contained in all publications are solely those of the individual author(s) and contributor(s) and not of MDPI and/or the editor(s). MDPI and/or the editor(s) disclaim responsibility for any injury to people or property resulting from any ideas, methods, instructions or products referred to in the content. |
© 2026 by the authors. Licensee MDPI, Basel, Switzerland. This article is an open access article distributed under the terms and conditions of the Creative Commons Attribution (CC BY) license (http://creativecommons.org/licenses/by/4.0/).
Copyright: This open access article is published under a Creative Commons CC BY 4.0 license, which permit the free download, distribution, and reuse, provided that the author and preprint are cited in any reuse.


