Preprint
Article

This version is not peer-reviewed.

Plasmonic Engineering of Black Phosphorus: Constructing Stable, Highly Sensitive Heterojunctions for Noninvasive Glucose Monitoring in Sweat

Submitted:

25 February 2026

Posted:

26 February 2026

You are already at the latest version

Abstract

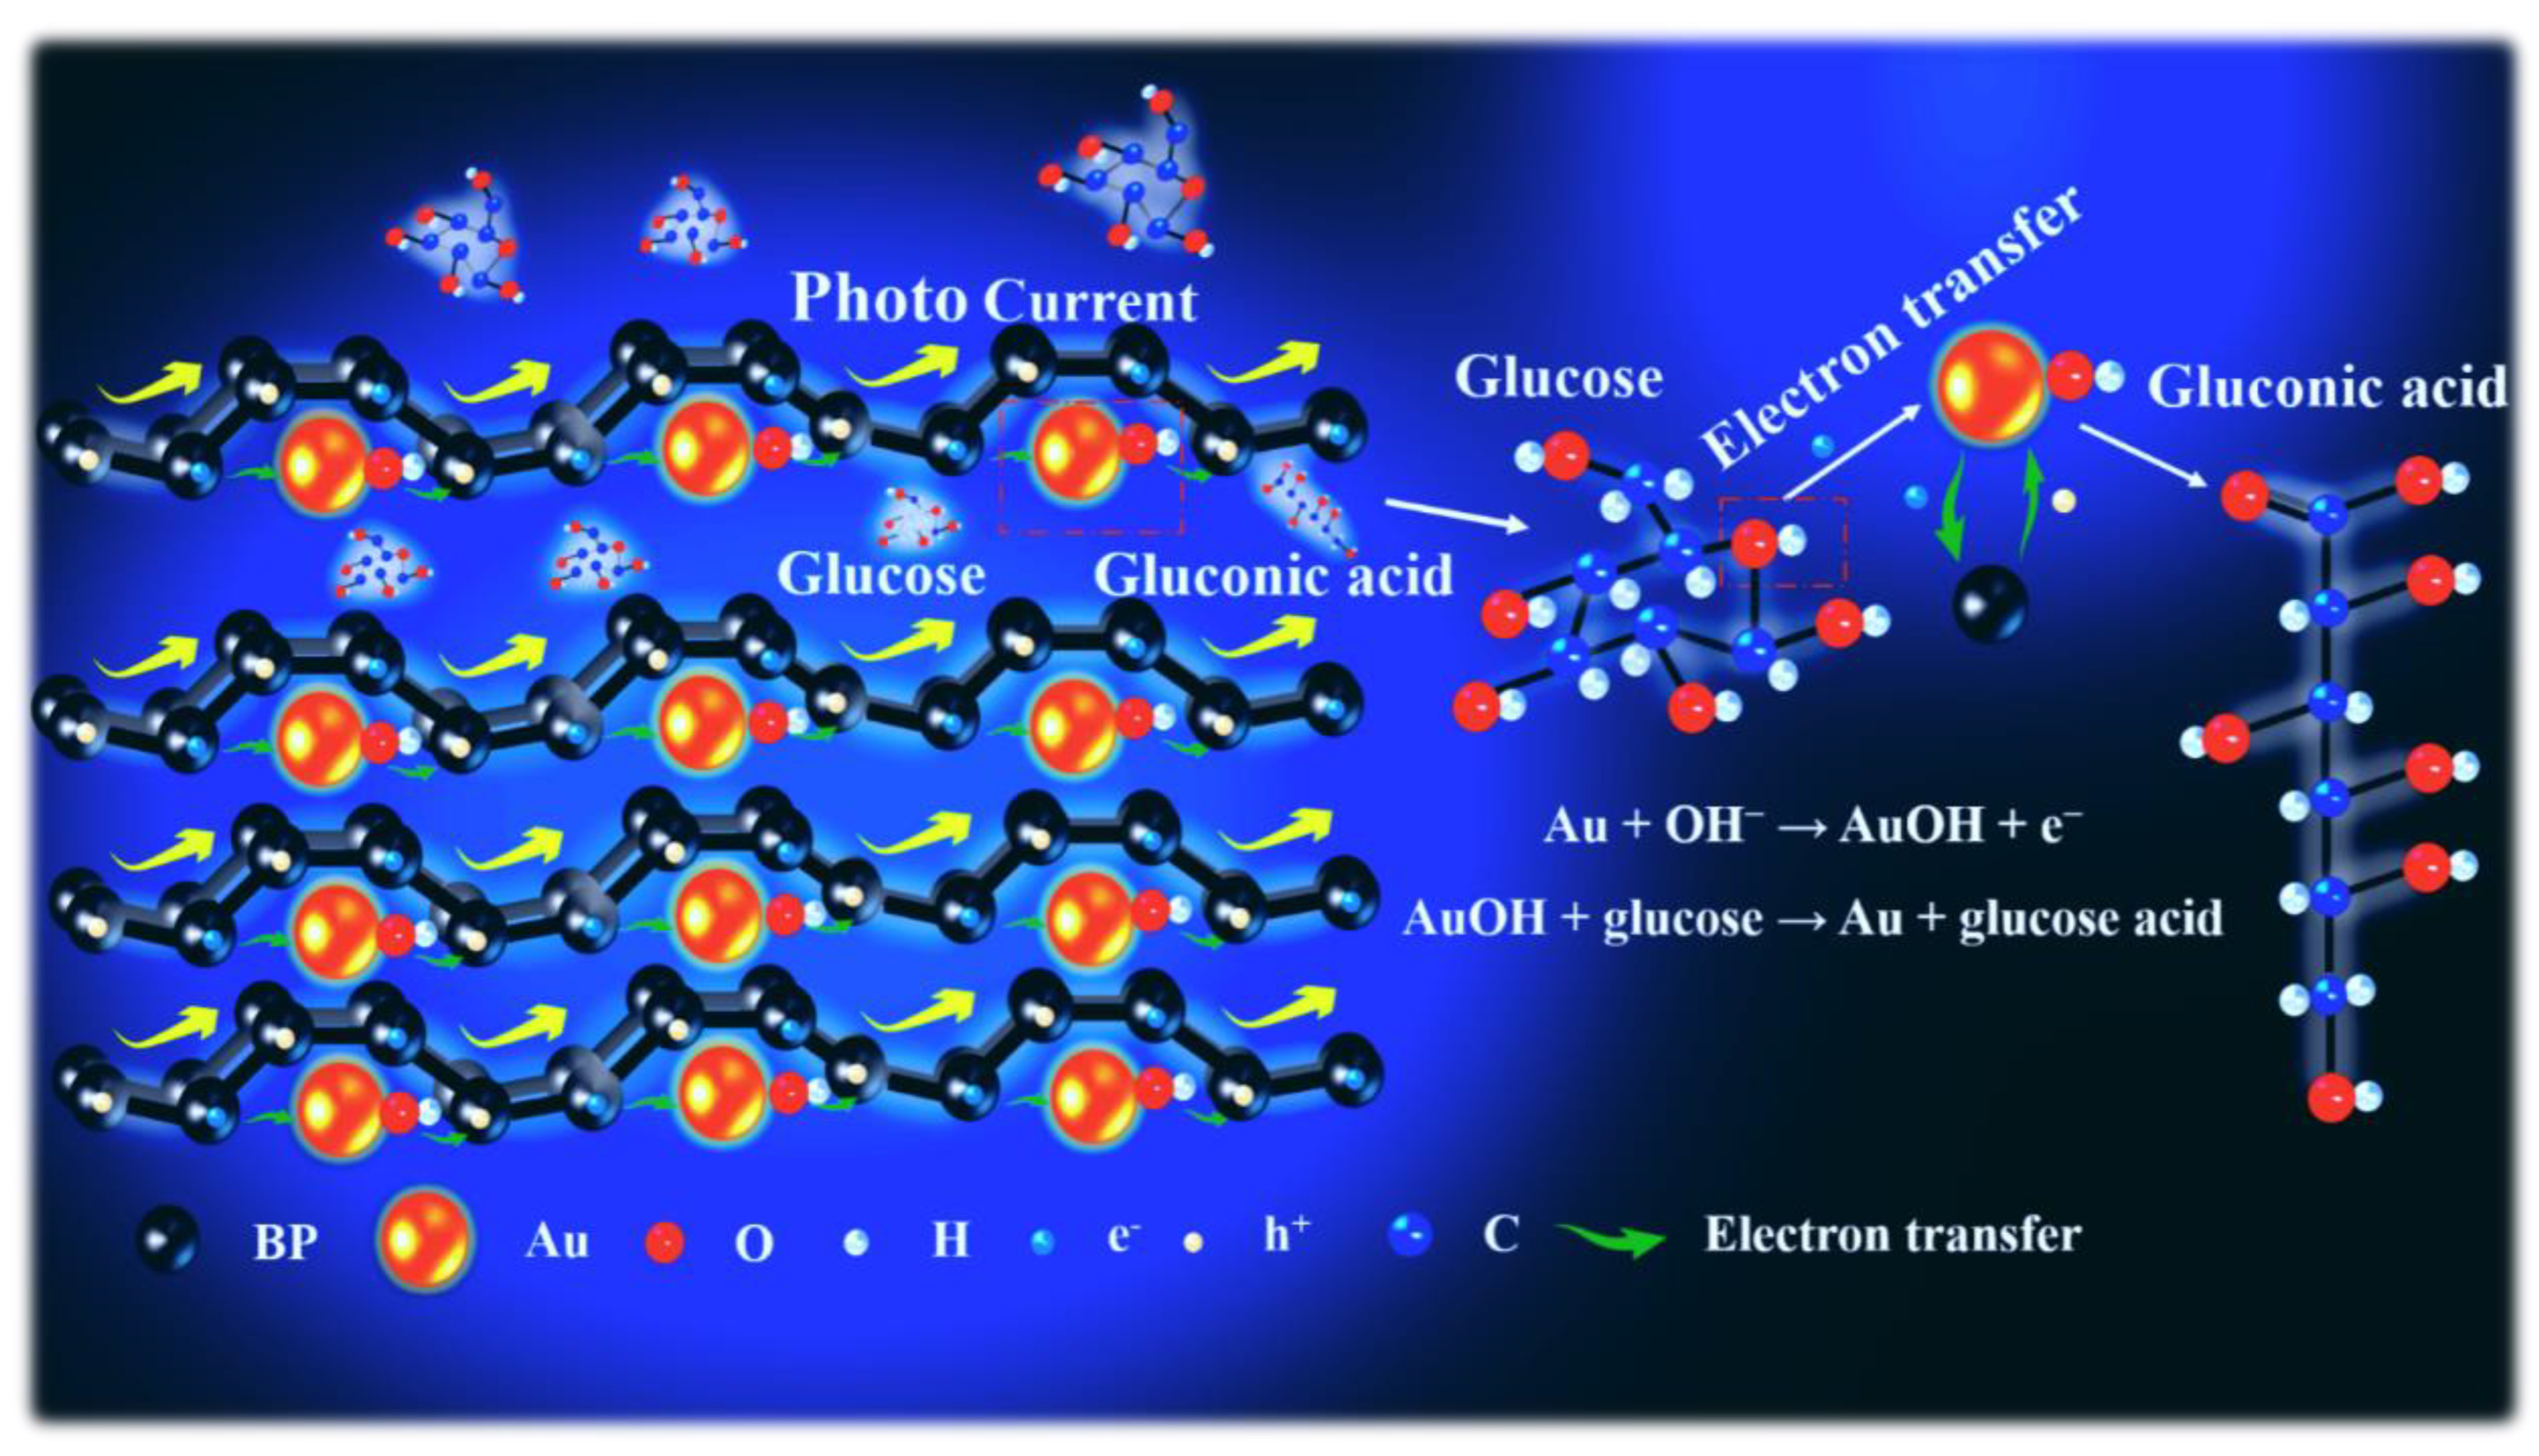
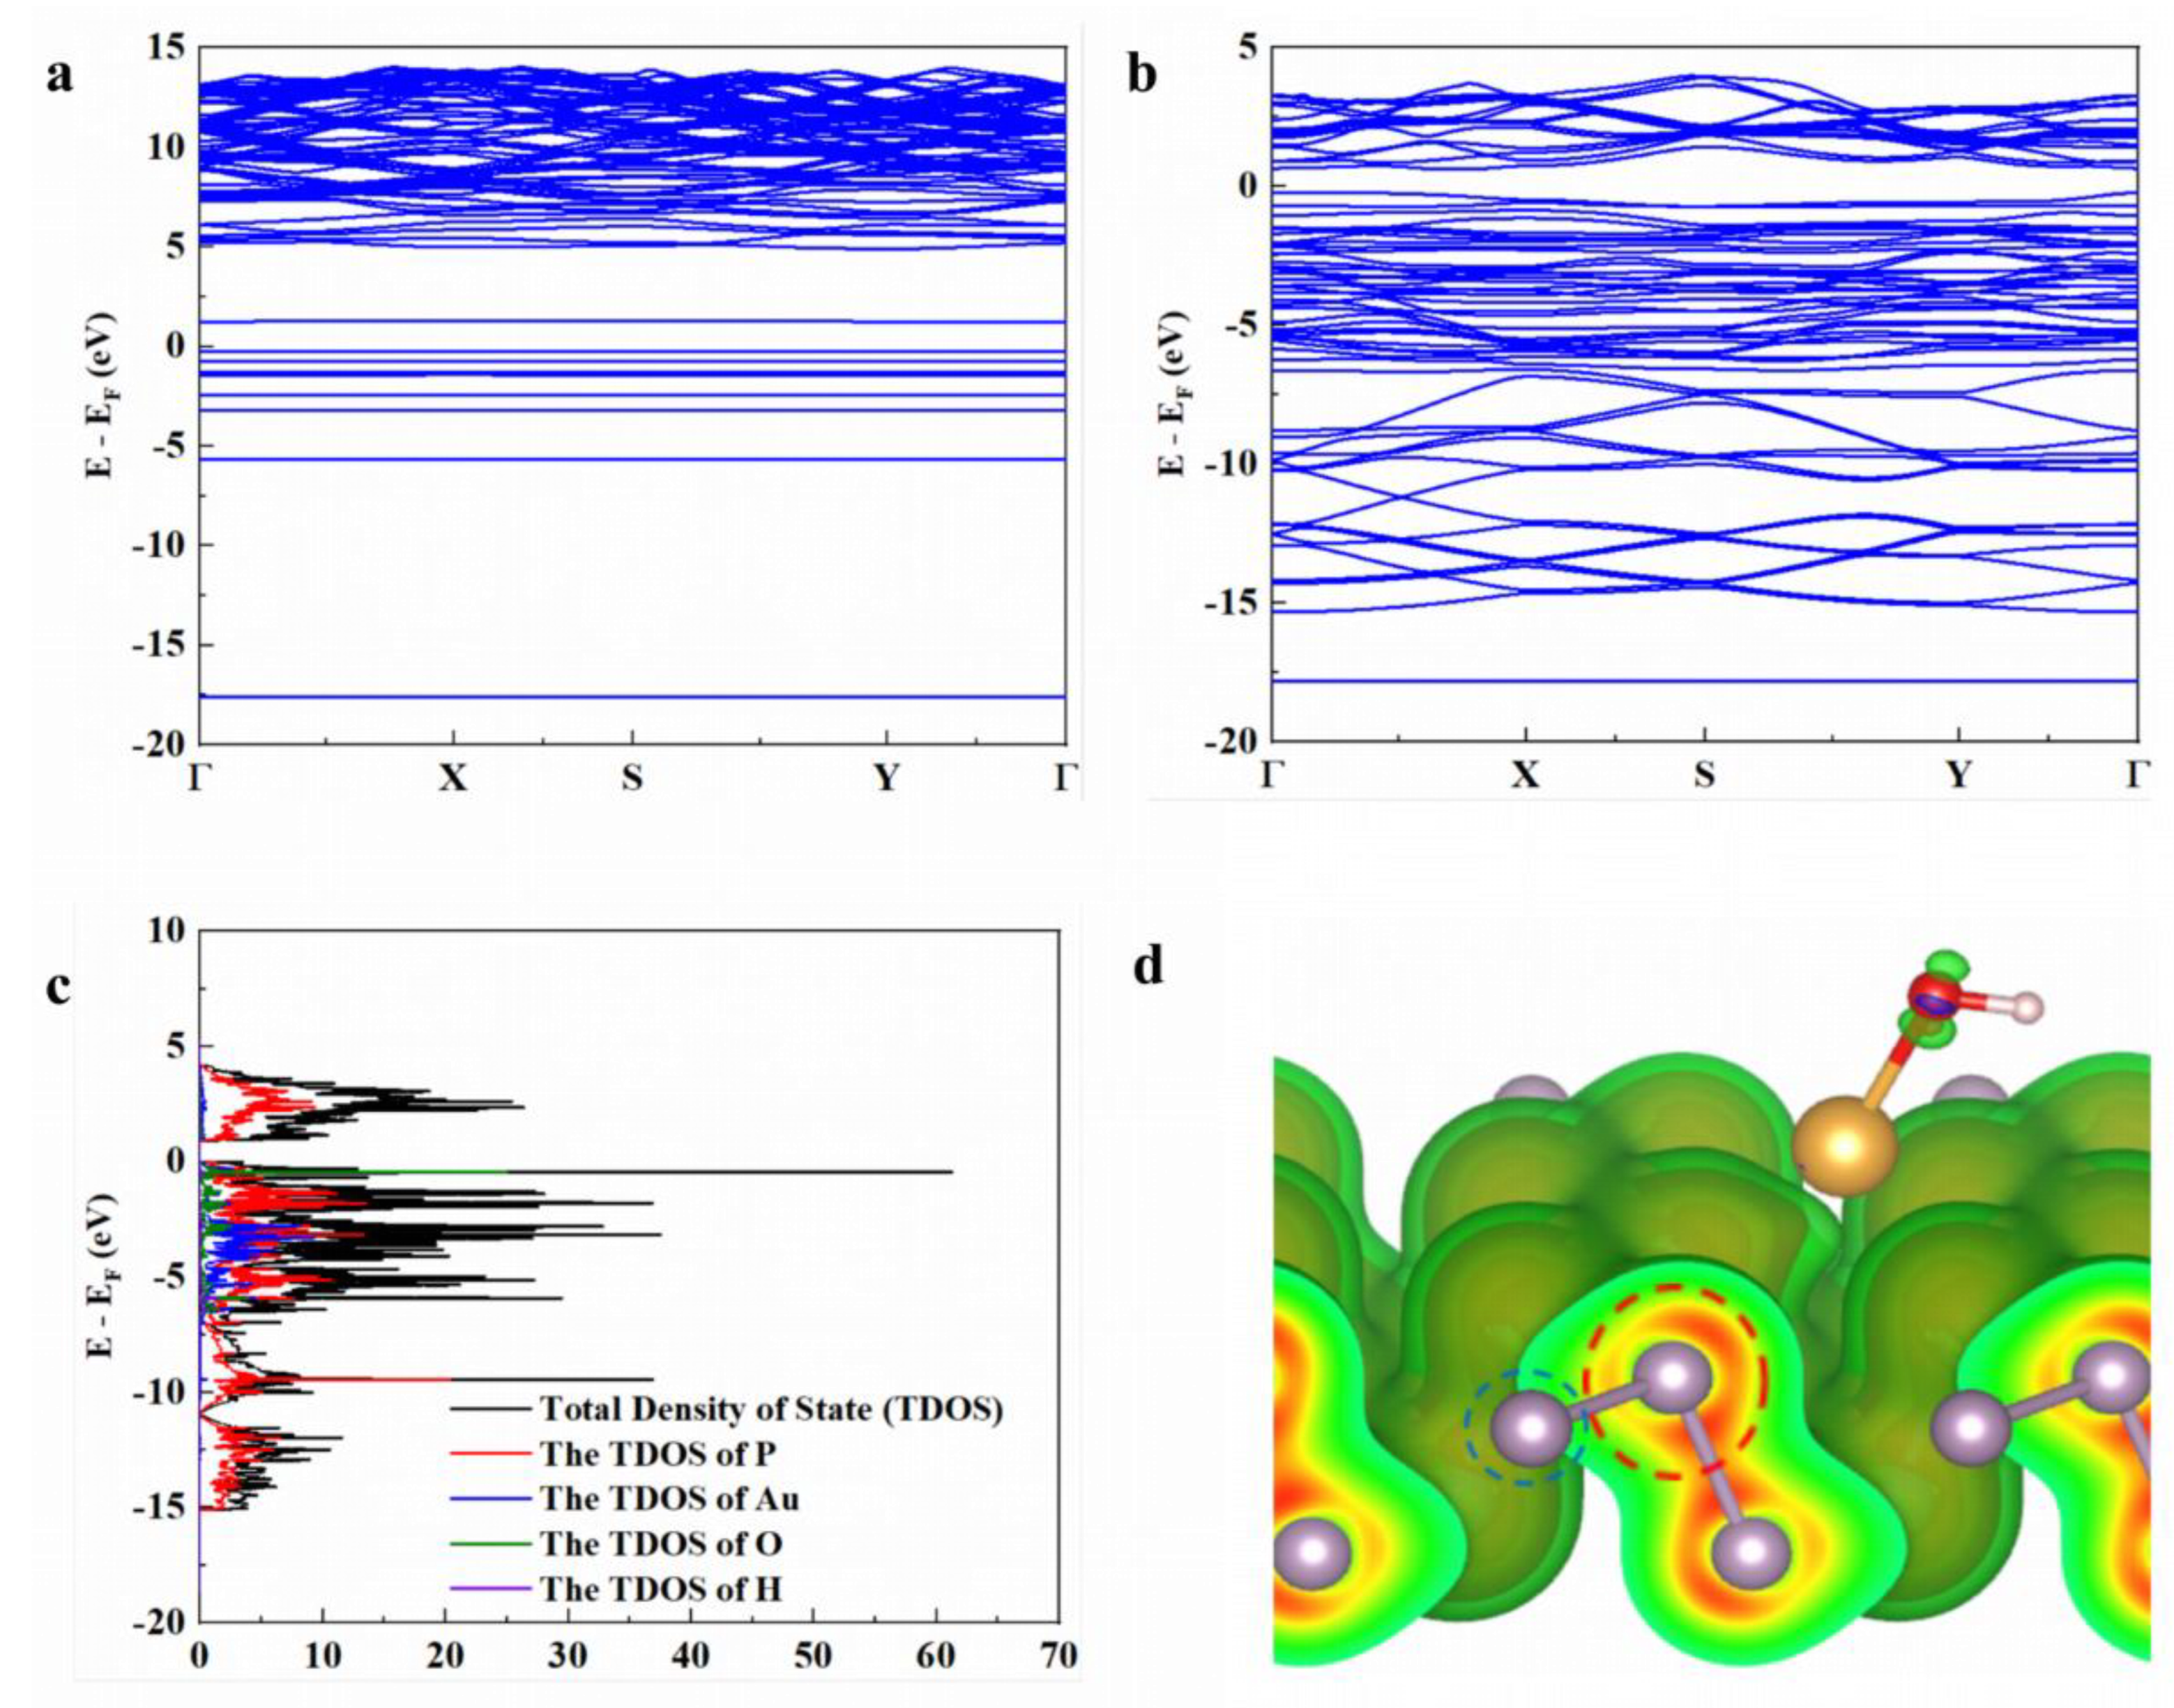
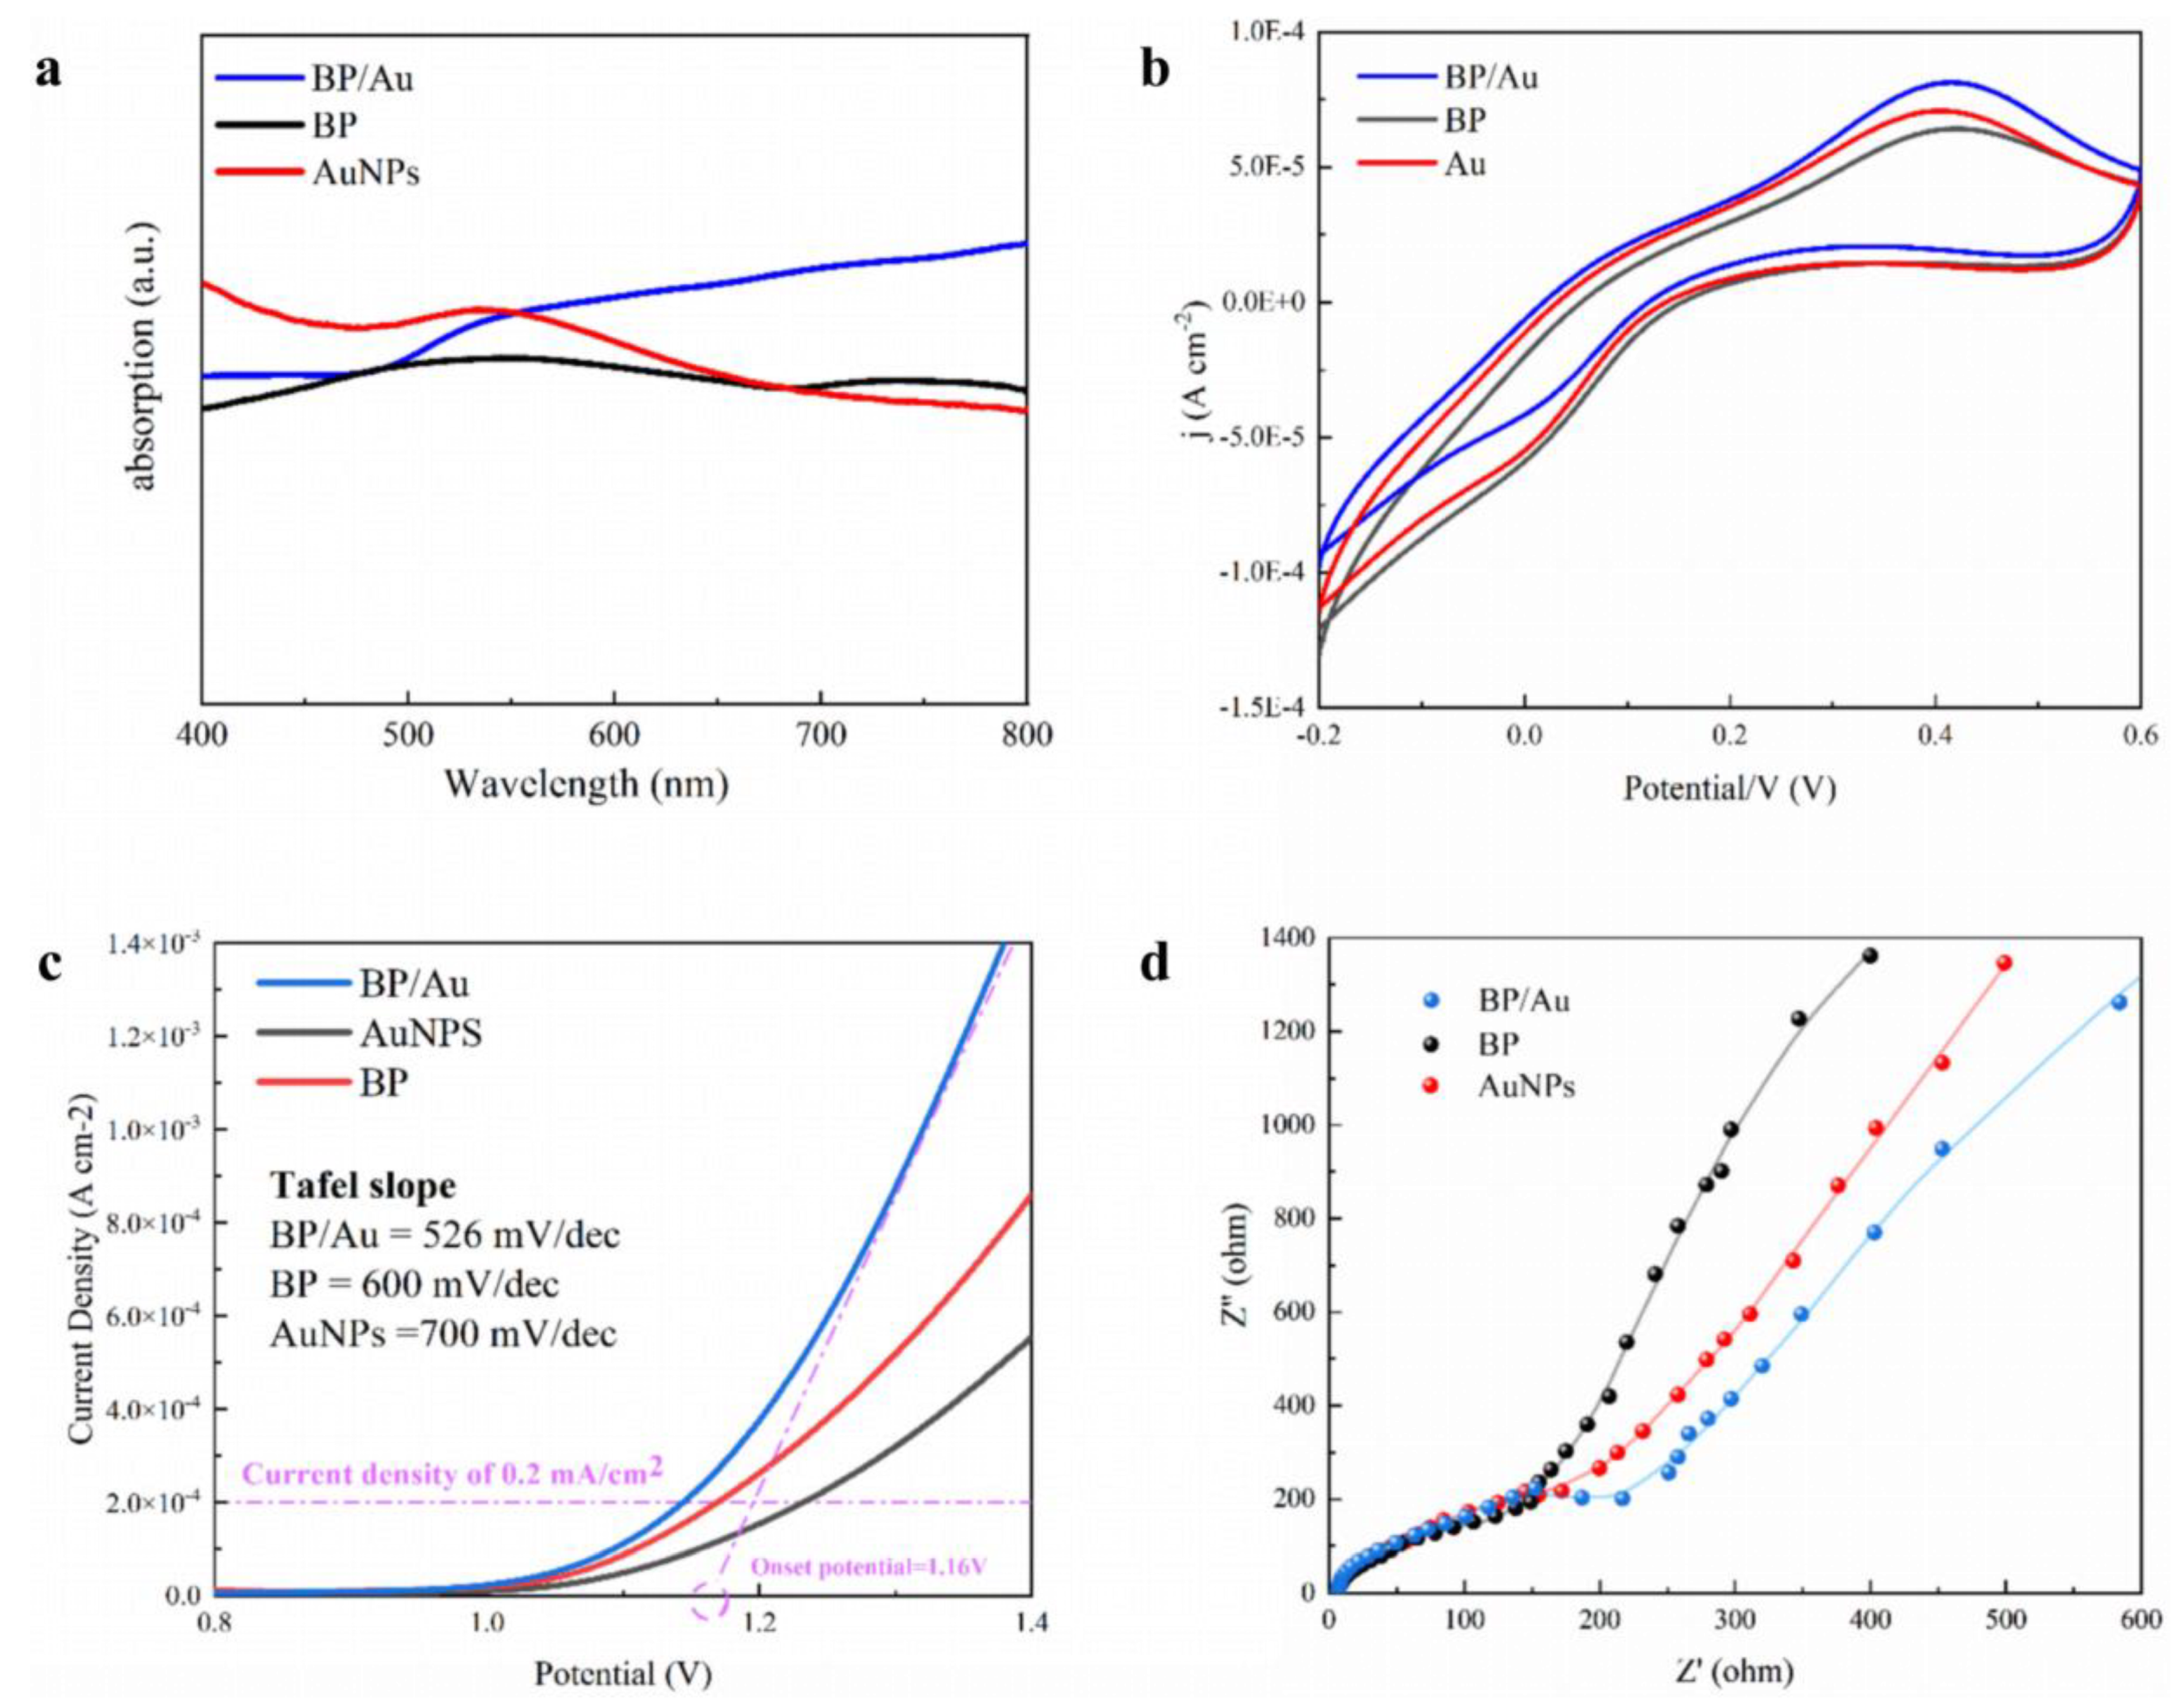
Although noninvasive glucose monitoring in sweat is a promising, pain-free method for diabetes management, it requires highly sensitive and stable sensors to overcome practical limitations. To overcome this challenge, a photoelectrochemical sensor based on a plasmon-enhanced black phosphorus (BP)/gold (Au) heterojunction was developed in this study. BP nanosheets possess a unique layered structure and intrinsic catalytic activity, but their instability and limited efficiency hinder direct use. Therefore, BP/Au was synthesized using the one-pot method. First-principles calculations revealed that single-layer BP behaved as a quasi-direct bandgap semiconductor. In comparison, the BP/Au heterojunction exhibited metallic characteristics, with anisotropic electron mobility reaching 1.62 cm2·V1·s1 along one direction. Charge density analysis confirmed directional charge transfer. Au donated electrons to adjacent P atoms, whereas P atoms forming shorter bonds lost charge. This process was associated with plasmon-assisted photoexcitation at the Au/BP interface, which modulated interfacial charge distribution and enhanced photoelectrochemical activity. By leveraging the Au component’s surface plasmon resonance, the heterojunction considerably augmented light absorption, accelerated interfacial electron transfer, and utilized the wrinkled BP layers to provide abundant active sites. This synergistic effect substantially lowered the oxidation activation energy of glucose. The resulting sensor achieved exceptional performance, with a sensitivity of 266.9 μA·μM1·cm2, a low detection limit, and a wide linear range well-suited for detecting glucose in sweat. The findings emphasized the potential of plasmon–semiconductor coupling for advancing noninvasive glucose monitoring and provided valuable design principles for sweat sensors based on metal–semiconductor heterojunctions.

Keywords: 
;  ;  ;  ;  

1. Introduction

Blood glucose is a key vital indicator, and significantly elevated levels increase the risk of hyperosmolar hyperglycemia, diabetic ketoacidosis, and various cardiovascular and cerebrovascular complications[1]. The global population with diabetes has surged from over 20 million in 2000 to 598 million in 2025 among individuals aged 20–79[2], with projections indicating an increase to 852 million by 2050[3]. Continuous, quantitative monitoring of blood glucose is crucial for optimizing patient management and treatment strategies.
Enzyme-based glucose biosensors have been extensively investigated for years, with several successfully commercialized. However, as a protein, β-glucosidase suffers from poor stability and low environmental adaptability, limiting its long-term performance.
In recent years, enzyme-free glucose biosensors have made considerable progress. Electrochemical sensors based on nanostructured materials are routinely used to detect diabetes, and biosensors utilizing noble metals such as Au and Ag for their plasmon resonance effect have also been developed[4,5,6]. Nonetheless, these enzyme-free systems face several limitations. While electrochemical sensors often have unstable nano-conducting media, Au nanoparticle (NP)-based sensors exhibit poor catalytic performance owing to surface poisoning, leading to low detection sensitivity[7,8].
Most commercial glucose sensors require blood samples, necessitating daily finger pricking. Consequently, noninvasive glucose monitoring has emerged as a research hotspot. Sweat glucose has been reported to accurately reflect blood glucose levels[9,10]. However, current glucose biosensors are sensitive to pH fluctuations and trace element variations in sweat, compromising test reliability[11].
Combining the photocatalytic effect of plasmonic metals with surface plasmon resonance (SPR) is a novel detection method with high sensitivity and minimal environmental interference[12,13]. Black phosphorus (BP) has attracted attention as a monoelemental 2D photocatalytic material, but its practical application is impeded by low catalytic activity[14,15]. Loading AuNPs onto BP has been observed to reduce Tafel slopes and overpotentials, substantially augmenting carrier mobility and interfacial electron transfer rates. The uniform distribution of AuNPs improves the catalyst’s ability to adsorb hydroxide ions from the electrolyte, lowering activation energy. Owing to the synergistic catalytic effect of BP and Au, BP/Au displays superior performance compared with single components[16]. Therefore, constructing a highly sensitive, enzyme-free, noninvasive glucose biosensor using the unique photoelectrocatalytic and synergistic properties of BP/Au, combined with the SPR effect of plasmonic metals, is a feasible strategy[17].
In this study, BP/Au NPs were selected as both a conductive medium and a photocatalytic material to fabricate a highly sensitive photoelectrochemical glucose sensor. A one-pot hot solution approach was used to synthesize a mixed-dimensional hybrid, where Au NPs were uniformly embedded within BP nanosheets. To enhance sunlight absorption and act as plasmonic exciters, AuNPs were uniformly deposited on the surface of BP. Under SPR excitation, Au NPs facilitated interfacial charge redistribution and surface oxidation processes, promoting the formation of AuOH oxide, which facilitated glucose oxidation. Concurrently, hot electrons excited from AuNPs escaped from the surface, generating a distinct photocurrent response. The synergistic integration of catalytic activity from Au and BP, combined with the plasmonic effect, considerably enhanced the catalytic efficiency[18]. Ultimately, a photoelectrochemical sensor based on metal–semiconductor heterojunctions was successfully constructed for highly sensitive glucose detection.

2. Experimental

2.1. Materials

Sodium hydroxide (NaOH), ascorbic acid (AA), chloroauric acid trihydrate, nafion® R-1100 resin, glucose, sodium citrate tribasic hydrate, urea, ethanol, hydrogen peroxide (H2O2) and L-tyrosine of analytical reagent grade were purchased from MACKLIN Co. Ltd. BP was provided by XFNANO Co. Ltd. Ultrapure water (≥18.25 MΩ/cm) was prepared to make up aqueous solution in the laboratory. Indium tin oxide (ITO) was supplied by South China Optoelectronics Co., Ltd.

2.2. Fabrication of the BP/Au Nanosheet Modified Electrode

BP nanosheets were prepared via liquid exfoliation[19,20]. Initially, bulk BP was added to a 20 mL beaker containing N-methyl-2-pyrrolidone (99.5%, anhydrous) and sonicated using an ultrasonicator probe at 100 W for 8 h in a low-temperature water bottle maintained at <20℃. The sonicated solution was centrifuged at 4,000 rpm for 15 min to remove unexfoliated BP, and the supernatant was filtered and washed twice with ethanol. The BP solution was resonicated for 4 h under the same temperature conditions, centrifuged at 6,000 rpm for 10 min, and washed/filtered with ethanol to obtain BP nanosheets.
The BP/Au hybrid was synthesized via a one-pot method. Chloroauric acid trihydrate was dissolved in purified water (5 mg/mL) and stored in the dark at 0℃[16,21]. BP nanosheets and the chloroauric acid solution (Au:BP = 20% mass ratio) were mixed in 20 mL of ultrapure water with 0.4 mL of 5 mM sodium citrate solution, followed by stirring in an oil bath at 100℃ for 30 min. After cooling to room temperature, the mixture was centrifuged to collect the BP/Au powder, which was washed twice with ultrapure water and dried under vacuum at 40℃ for 8 h.
The as-prepared BP/Au powder was dispersed in 1 mL of ethanol with 40 μL of Nafion® R-1100 resin and stirred at room temperature for 30 min[22]. The solution was drop-cast onto an ITO electrode, which was dried under vacuum at 100℃ for 8 h, followed by drying at 40℃ for 24 h (Figure 1b). The modified electrode was stored in the dark.

2.3. Physicochemical Characterization

The micromorphology and structure of as-prepared BP/Au were characterized using transmission electron microscopy. Energy-dispersive X-ray spectroscopy maps were obtained by operating at 200 kV on an EDAX solid-state X-ray detector using JEOL ARM-200F. The thickness of BP/Au was measured using an atomic force microscope (SEIKO, SPI3800N,300 HV). The electrochemical tests relied on a standard three-electrode system, an electrochemical workstation in which an ITO electrode coated with BP/Au was used as the working electrode, a platinum flake was used as the counter electrode, and a saturated calomel electrode was used as the reference electrode. NaOH solutions of different concentrations (1, 5, 10, 50, 100, 200, and 300 μM) were used as electrolytes during the test.
All measurements were conducted at ambient temperature. The photoelectrocatalysis for glucose was measured using a photoelectrochemical detection system, which contained an FX300 fiber optic light source, a Lightcube6.0 photoelectrochemical protective box, a P60-45 high air-tightness single-chamber three-electrode reactor, and an electrochemical workstation.

3. Results and Discussion

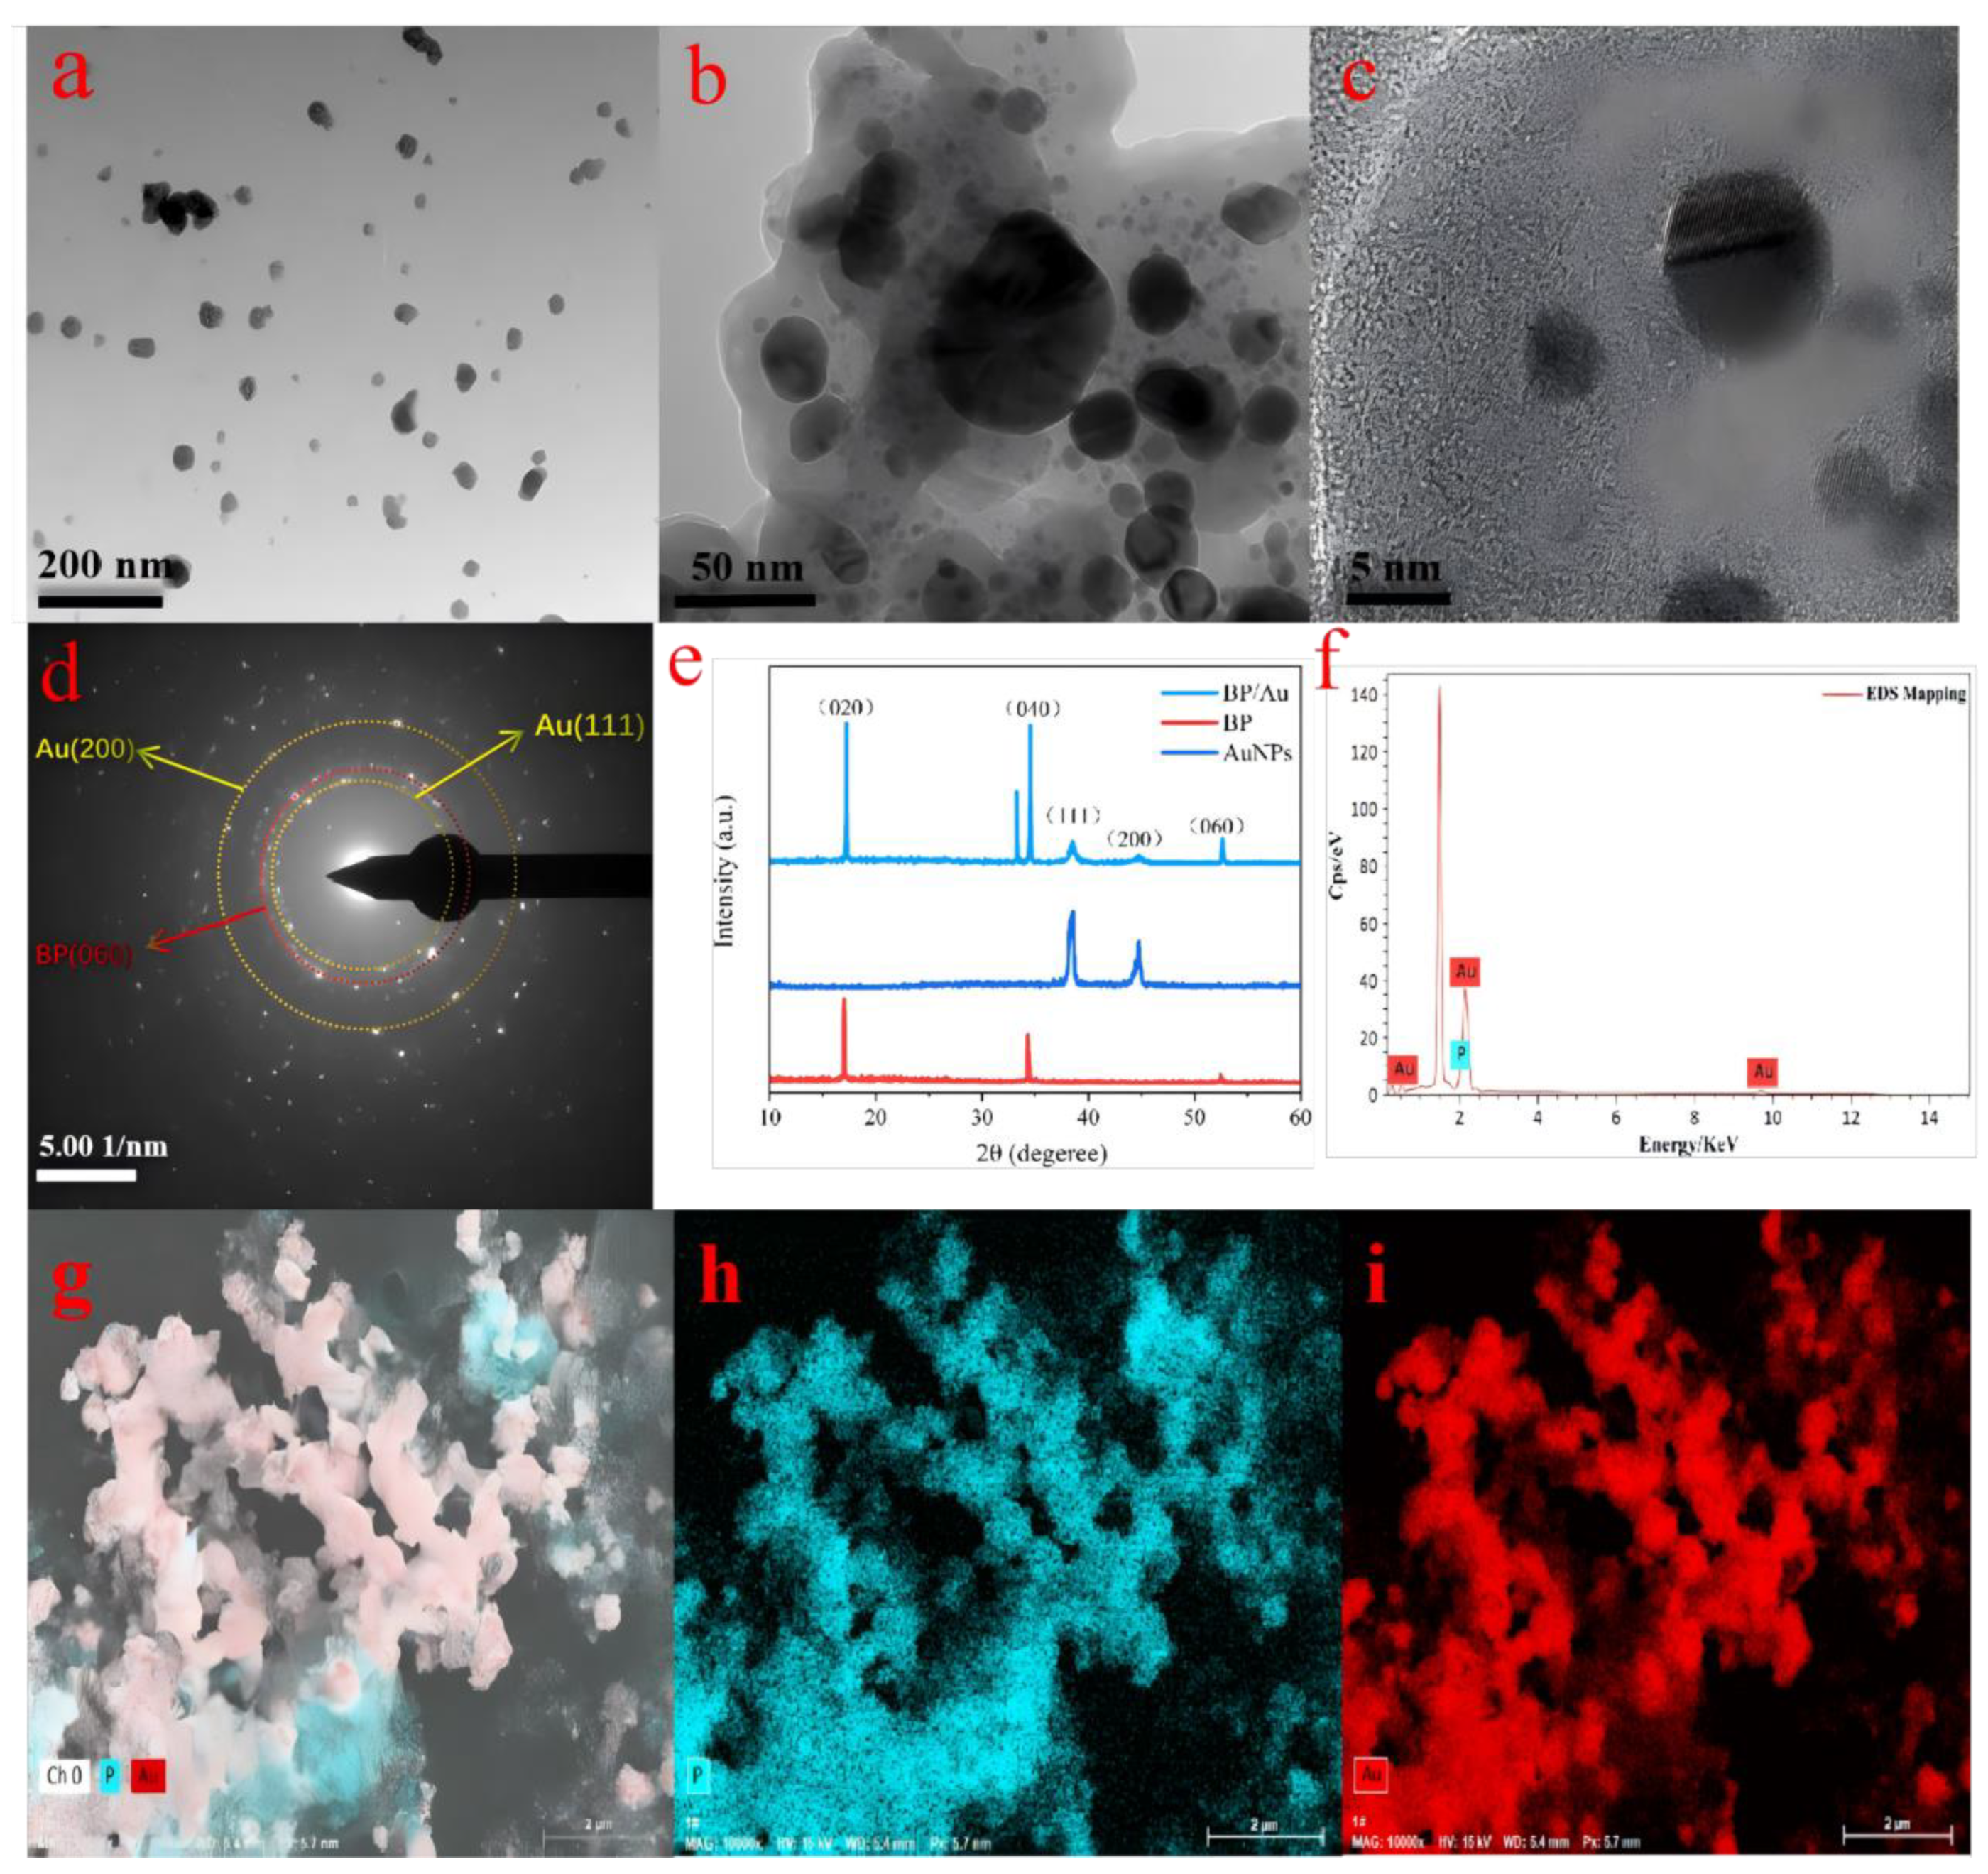
3.1. Morphological and Structural Characterization

Figure 1 depicts the glucose oxidation mechanism on the BP/Au electrode. Under visible light irradiation, AuNPs on BP/Au underwent SPR excitation, transitioning from the ground state to an excited state and inducing an unequal charge distribution on the electrode surface[23,24]. The BP/Au heterojunction structure facilitated efficient interfacial charge separation under illumination, thereby enhancing the photocurrent response under applied bias. Furthermore, Au was oxidized to AuOH under alkaline conditions, providing active sites for glucose oxidation. This process converted glucose to gluconic acid, amplifying the photocurrent[25].
To confirm the microstructure and composition of BP/Au, a series of characterizations was applied.
Figure 2a–c depicts that Au nanoparticles are randomly dispersed on BP nanosheets without significant aggregation, demonstrating a relative uniform distribution. The selected area electron diffraction (SAED) pattern shown in Figure 2d confirms the polycrystalline nature of BP/Au, indicating the presence of heterojunction formation. It depicts rings corresponding to crystal faces of Au nanoparticles (111, 200) and BP nanosheets (060), respectively. The X-ray diffraction (XRD) pattern displayed in Figure 2e further supports the successful fabrication of BP/Au. Specifically, the peak positions of BP nanosheets and AuNPs could coexist in the XRD curve of BP/Au, and the peaks corresponding to the crystal faces in BP/Au can be identified by the crystal ring positions in Figure 2d. In addition, the test results from the energy spectrum in Figure 2f could identify the presence of BP and Au elements in the fabricated BP/Au sample. SEM-EDS mapping of Au and P elements (Figure 2i) confirms that Au nanoparticles were adsorbed onto BP nanosheets, enabling effective synergistic catalysis via the surface plasmon resonance (SPR) effect of Au. This spatial arrangement facilitates charge transfer and enhances the photocatalytic response to glucose.

3.2. First-Principles Calculations

Structural and morphological characterizations (Figure 2) confirmed the uniform dispersion of Au-based species (AuOH) on BP nanosheets and the formation of intimate heterojunctions. Subsequently, first-principles calculations were performed to determine the intrinsic electronic structure and charge transfer mechanisms underlying the catalytic synergy between BP and AuOH. This theoretical investigation aimed to establish a structure–electronic property–catalytic activity relationship, aiding in the interpretation of the photoelectrochemical performance of the BP/AuOH heterojunction.

3.2.1. Computational Details

First-principles calculations were performed using the Vienna Ab initio Simulation Package (VASP, version 5.5.4) [26,27], whereas model generation and post-processing were implemented via VASPKIT 1.3.5[28]. The projector augmented-wave pseudopotentials were adopted to describe the electron-ion interactions, and a plane-wave cutoff energy of 400 eV was set to ensure the convergence of electronic states[27,29]. The exchange-correlation potential was treated within the generalized gradient approximation using the Perdew–Burke–Ernzerhof functional, complemented by the optB88 exchange functional to account for van der Waals (vdWs) interactions (optB88-vdWs method) [26].
For geometric optimization, the maximum number of self-consistent field iterations was set to 60, with a convergence criterion of 1.0 × 10⁻⁸ eV for the total energy. The Brillouin zone was sampled using the Monkhorst–Pack scheme with a 10 × 8 × 1 k-point grid to ensure accurate sampling of electronic states. Band structure, density of states (DOS), and charge density difference calculations were performed based on the optimized geometries.

3.2.2. Atomic Model Construction

To simulate the actual catalytic interface between BP and AuOH, a 2 × 2 × 1 supercell was constructed from the primitive cubic lattice of BP using VASPKIT 1.3.5. Vacuum layers were introduced above and below the BP plane to avoid interactions between adjacent supercells, ensuring the rationality of the 2D heterojunction model[30]. The BP/AuOH heterojunction model was created by adsorbing AuOH onto the BP surface, with P, Au, O, and H atoms represented by gray, golden, red, and white spheres (inset of Figure 3a). This model was utilized in all further electronic structure calculations to mimic the real catalytic environment.

3.2.3. Band Structure

The band structures of pristine AuOH and the BP/AuOH heterojunction are illustrated in Figure 3a and Figure 3b, respectively. Pristine AuOH exhibited a distinct band gap of 1.4927 eV, with nonoverlapping energy bands leading to poor electron mobility. In this case, electrons were localized around specific atoms, and it was challenging to excite them to the conduction band for participation in chemical reactions. In contrast, after adsorbing AuOH onto BP, new energy levels were introduced within the original band gap of AuOH, forming continuous electron transfer channels. The band gap of the BP/AuOH heterojunction at the Fermi level was reduced to 0.8441 eV, which considerably lowered the activation energy required for electron excitation from the highest occupied molecular orbital (HOMO) to the lowest unoccupied molecular orbital (LUMO). This band gap narrowing effect facilitated electron delocalization and transfer, laying the foundation for enhanced catalytic kinetics[31].

3.2.4. DOS

The total density of states and partial density of states (PDOS) of the BP/AuOH heterojunction were determined to elucidate the electronic orbital contributions and bonding characteristics (Figure 3c). The PDOS results revealed that the DOS peaks near the Fermi level were mainly contributed by O atoms, signifying that these atoms were the primary active sites for glucose oxidation. Moreover, electrons excited from the HOMO to the LUMO were predominantly derived from O-centered orbitals.
Furthermore, the PDOS peaks of P, Au, and O overlapped substantially near the Fermi level, which confirmed the formation of P-Au and Au-O chemical bonds at the heterojunction interface. These bonding interactions provided efficient channels for electron delocalization among P, Au, and O atoms, increasing the number of electrons available for redox reactions and augmenting the catalytic activity of the heterojunction.

3.2.5. Charge Density Difference

To quantitatively analyze the charge transfer behavior between BP and AuOH, the charge density difference (Δρ) of the BP/AuOH heterojunction was calculated. For this purpose, the charge density of pristine AuOH was subtracted from that of the heterojunction (Figure 3d)[32]. In the Δρ map, the red–yellow–green regions marked by a red dashed circle represent charge accumulation. In contrast, the gray regions, indicated by a blue dashed circle, denote charge depletion (P: purple, Au: golden, O: red, and H: white).
The introduction of BP induced a distinct reorientation of the charge density around O atoms, with considerable charge accumulation along the direction of the Au-O bond. This observation indicates that valence electrons of Au were transferred to O atoms via the Au-O bond under the modulation of BP, accompanied by the reconstruction of O-centered orbitals. Such charge redistribution not only stabilized the AuOH species on the BP surface but also optimized the electronic configuration of O atoms, augmenting their reactivity as active sites for glucose oxidation. Collectively, the first-principles calculations demonstrated that the integration of BP with AuOH modulated the electronic structure of the heterojunction by narrowing the band gap, forming chemical bonds (P-Au and Au-O) for electron delocalization, and promoting charge transfer from Au to O.
These theoretical findings signify that O atoms are the key active sites and establish the electronic origin of the enhanced catalytic activity of the BP/AuOH heterojunction. These observations provide a strong theoretical foundation for interpreting the subsequent investigations regarding the performance of the photoelectrochemical system.
The electrocatalytic and photoelectrocatalytic performances of the BP/Au-modified ITO electrode were examined in 0.1 M NaOH electrolyte under diverse conditions. The photoelectrochemical detection system described in the experimental section was used for this purpose. All measurements were acquired at ambient temperature with a scan rate of 50 mVs−1. Figure 4a depicts the UV–Vis absorption of BP/Au, AuNPs, and BP nanosheets, all of which exhibited light absorption peaks in the visible light band. The light absorption of BP/Au was higher than that of BP nanosheets in the visible light band, implying that the light absorption capacity of BP increased after hybridizing with AuNPs. The evolution of electrocatalytic oxygen from the as-prepared BP/Au heterojunction was evaluated using electrochemical measurements. Linear scanning voltammetry tests in 0.1 mol·L−1 KOH electrolyte (Figure 2a) revealed that the electrocatalytic activity of BP/Au was superior to that of pure BP nanosheets. Specifically, BP/Au demonstrated an onset potential of 1.36 V, which was considerably lower than that of pure BP nanosheets (1.45 V) and previously reported bulk BP (1.48 V).​
Tafel slope analysis (inset of Figure 4b), a key indicator of reaction kinetics[33], confirmed this advantage. BP/Au yielded a Tafel slope of 526 mV·dec−1, substantially lower than that of pure BP nanosheets (600 mV·dec−1) and AuNPs (700 mV·dec−1). At a current density of 10 mA·cm−2, BP/Au required an overpotential of 1.16 V. In contrast, pure BP nanosheets needed 1.61 V, emphasizing the improved performance of this mixed-dimensional heterojunction over most 2D materials and their heterostructures.
To gain profound insights into the enhanced activity, electrochemical impedance spectroscopy (EIS) was used (Figure 4c)[34]. The EIS spectra showed that BP/Au possessed a lower series resistance (reflected by the intercept on the real axis) and a reduced charge transfer resistance (indicated by the smaller semicircle radius) compared with pure BP nanosheets. These findings confirmed that the BP/Au heterojunction facilitated faster charge transfer and more efficient catalytic reaction kinetics, explaining its improved electrocatalytic performance. This enhancement was quantified, as illustrated in Figure 4d, which displays the increased photocurrent density (△j) of AuNPs, BP, and BP/Au photoanodes under light irradiation versus dark conditions. The BP/Au photoanode demonstrated the largest photocurrent enhancement, which can be attributed to the adequate amplification of the plasmonic photoresponse of Au (the plasmonic metal) by the BP nanosheets.
To determine the association between glucose concentration and amperometric responses, the BP/Au photoanode was used to detect glucose at varying concentrations (1, 5, 10, 50, 100, 200, and 300 μM) under light-on and light-off conditions. As depicted in Figure 4e, the BP/Au sensor successfully detected continuous subtle changes in glucose concentration from 1 to 10 μM under light irradiation. A photocurrent response hysteresis occurred in this low-concentration range, which could be explained by the slow mass transfer of glucose to the modified electrode/electrolyte interface. As the concentration of glucose increased from 50 to 300 μM, the photocurrent density displayed a steady and rapid upward trend under light irradiation compared with the dark condition, signifying that more photoactivated electrons escaped from the BP/Au surface to participate in glucose oxidation. Under light irradiation, alterations in photocurrent density were positively correlated with glucose concentration increments in the entire concentration range. This observation asserted the linear relationship between amperometric responses and stepwise glucose concentration changes. Nevertheless, the photocurrent density measured under dark conditions failed to accurately reflect subtle changes in the glucose concentration. Figure 4f demonstrates the degree of linear correlation between current density and glucose concentration under visible light switched on and off. The current density in the presence of light was linearly correlated with glucose content in the range of 1–300 μM, with a linearly dependent coefficient of 0.9910 (R2 = 0.9910). An ultrahigh sensitivity of 266.9 μA μmM−1 cm−2 and a low detection limit of 1 μM were attained in the linear response area[35]. Contrastingly, the low linear dependence coefficient (R2 = 0.6603) under dark conditions indicated a less reliable correlation.
As presented in Figure 5a, all cyclic voltammetry (CV) curves indicated that the addition of glucose led to an increase in the response anode current density under identical light conditions. This enhancement could be ascribed to the electrocatalytic oxidation of glucose to gluconic acid on the BP/Au-modified electrode surface. The corresponding oxidation process could be explained by the following reactions:
Au + OH → AuOH + e
AuOH + glucose → Au + glucose acid
When the light irradiation was on, the response anode current density was higher than that with light irritation off. This phenomenon resulted from SPR-induced coherent electron oscillations in AuNPs, which generated hot carriers. The excited hot holes and electrons were localized on the surface of BP/AuNPs owing to the plasmon-induced charge separation. AuNPs can be used as electron donors; they inject electrons into the surface of BP nanosheets, change the Fermi-level position of AuNPs, promote charge transfer between Au atoms and the BP layer, and improve carrier mobility and photoelectric catalytic activity. When applying the biased voltage, the localized electrons could be transferred to BP nanosheets to generate a higher photocurrent[16].
To comprehend the mass transfer process of glucose at the electrolyte/electrode interface of BP/Au, CV curves were plotted at different scan rates (Figure 5b), revealing that the diffusion rate of glucose molecules was a key determinant of the electrocatalytic process at the electrolyte/electrode interface. Figure 5c depicts the current density of the BP/Au electrode in a 0.5 V potential window with the successive addition of 1 mM glucose and 0.1 mM interferents (sucrose, glycine, ascorbic acid, urea, and valine). The results clearly showed that the BP/Au electrode exhibited favorable selectivity for glucose as the added interferents did not affect glucose detection considerably. To assess the stability of the BP/Au electrode, as illustrated in Figure 5d, the glucose sensor maintained a nearly constant photocurrent density (99.4% of the original) over a period of 15 days, followed by a slight decrease to 93.5% after 30 days.

4. Conclusions

In this work, a photoelectrochemical glucose sensor based on BP/Au was successfully fabricated to sensitively detect subtle changes in glucose concentration. Surprisingly, the photoresponses of AuNPs and BP nanosheets were enhanced by the addition of BP. This observation could be attributed to the increased carrier mobility and interface electron transfer rate of BP/Au owing to the formation of the heterojunction. Furthermore, the BP/Au-modified electrode performed favorably in terms of selectivity and exhibited an extremely low detection limit. This work could guide the construction of a sweat glucose sensor based on metal–semiconductor heterojunctions, paving the way for a novel noninvasive detection method.

Acknowledgments

This financial support is derived from Shenzhen Children’s Hospital. National Natural Science Fund of China (12274197, 12304487), Guangdong Scientific and Technological Project (2022B1515020093), Guangdong Scientific and Technological Project (2022A0505030024, 2022B1515120012,2025B0303000020), Science and Technology Innovation Commission of Shenzhen (JCYJ20220818102618040, GJHZ20220913143207014, JCYJ20241202130558075, JCYJ20230807093808017), Guangdong Provincial University Key Research Project (2023ZDZX2071) , and the project for Establishing Guangdong Engineering Research Center of Molecular POCT Smart Diagnosis for Infectious Diseases in Children.

References

  1. Ankit, B., et al., Sensitive electrochemical detection of glucose via a hybrid self-powered biosensing system. 2018. 20: p. 41-46.
  2. Research, A.J.D. and C. Practice, Over 250 million people worldwide unaware they have diabetes, according to new research from the International Diabetes Federation (IDF). 2025. 223(000).
  3. Global, regional, and national burden of diabetes from 1990 to 2021, with projections of prevalence to 2050: a systematic analysis for the Global Burden of Disease Study 2021. Lancet, 2023. 402(10397): p. 203-234.
  4. Witkowska Nery, E., et al., Electrochemical Glucose Sensing: Is There Still Room for Improvement? Anal Chem, 2016. 88(23): p. 11271-11282.
  5. Li, J., Z. Lou, and B.J.J.o.M.C.A. Li. Engineering plasmonic semiconductors for enhanced photocatalysis.
  6. Chen, L.-C., et al., Improving the reproducibility, accuracy, and stability of an electrochemical biosensor platform for point-of-care use. 2020. 155: p. 112111.
  7. Adeel, M., et al., Recent advances of electrochemical and optical enzyme-free glucose sensors operating at physiological conditions. Biosens Bioelectron, 2020. 165: p. 112331.
  8. Park, S., H. Boo, and T.D.J.A.c.a. Chung, Electrochemical non-enzymatic glucose sensors. 2006. 556(1): p. 46-57.
  9. van Enter, B.J. and E. von Hauff, Challenges and perspectives in continuous glucose monitoring. Chem Commun (Camb), 2018. 54(40): p. 5032-5045.
  10. Bariya, M., H.Y.Y. Nyein, and A.J.N.E. Javey, Wearable sweat sensors. 2018. 1(3): p. 160-171.
  11. Mohan, A.V., et al., Recent advances and perspectives in sweat based wearable electrochemical sensors. 2020. 131: p. 116024.
  12. Moyer, J., et al., Correlation between sweat glucose and blood glucose in subjects with diabetes. Diabetes Technol Ther, 2012. 14(5): p. 398-402.
  13. Saeloo, B., et al., Role of transition metal dichalcogenides as a catalyst support for decorating gold nanoparticles for enhanced hydrogen evolution reaction. 2024. 63(40): p. 18750-18762.
  14. Mu, X., J. Wang, and M.J.M.T. Sun, Two-Dimensional Black Phosphorus: Physical Properties and Applications. 2019.
  15. Peng, J., et al., Sensitive Detection of Carcinoembryonic Antigen Using Stability-Limited Few-Layer Black Phosphorus as an Electron Donor and a Reservoir. 2017. 13(15): p. 1-11.
  16. Black Phosphorus Nanosheets Modified with Au Nanoparticles as High Conductivity and High Activity Electrocatalyst for Oxygen Evolution Reaction %J Advanced Energy Materials. 2020. 10(44).
  17. He, C., et al., Noble metal construction for electrochemical nonenzymatic glucose detection. 2023. 8(1): p. 2200272.
  18. Lee, S.-H., et al., Direct observation of plasmon-induced interfacial charge separation in metal/semiconductor hybrid nanostructures by measuring surface potentials. 2018. 18(1): p. 109-116.
  19. Huang, Y., et al., Degradation of Black Phosphorus (BP): The Role of Oxygen and Water. 2015.
  20. Nicolosi, V., et al., Liquid Exfoliation of Layered Materials. 2013. 340(6139): p. 1420.
  21. Rohiman, A., et al., Study of Colloidal Gold Synthesis Using Turkevich Method. 2011.
  22. Chen, Z., et al., Development of Screen-Printable Nafion Dispersion for Electrochemical Sensor. 2022. 12(13): p. 6533.
  23. Yi, Y., et al., Two-dimensional black phosphorus: Synthesis, modification, properties, and applications. 2017. 120: p. 1-33.
  24. Ghobadi, T.G.U., et al., Strategies for Plasmonic Hot-Electron-Driven Photoelectrochemical Water Splitting. 2018. 2.
  25. Ding, Y., et al., A novel NiO–Au hybrid nanobelts based sensor for sensitive and selective glucose detection. 2011. 28(1): p. 393-398.
  26. Kresse, G. and J.J.C.m.s. Furthmüller, Efficiency of ab-initio total energy calculations for metals and semiconductors using a plane-wave basis set. 1996. 6(1): p. 15-50.
  27. Kresse, G. and D.J.P.R.B. Joubert, From ultrasoft pseudopotentials to the projector augmented-wave method. 1999. 59(3): p. 1758-1775.
  28. Wang, V., et al., VASPKIT: A user-friendly interface facilitating high-throughput computing and analysis using VASP code. Computer Physics Communications, 2021. 267: p. 108033.
  29. Blöchl, P.E., Projector augmented-wave method. Physical Review B, 1994. 50(24): p. 17953-17979.
  30. Zhang, R., B. Li, and J.J.T.J.o.P.C.C. Yang, A first-principles study on electron donor and acceptor molecules adsorbed on phosphorene. 2015. 119(5): p. 2871-2878.
  31. Liu, Y., et al., Van der Waals heterostructures and devices. 2016. 1(9): p. 1-17.
  32. Kumar, S., K. Ojha, and A.K.J.A.M.I. Ganguli, Interfacial charge transfer in photoelectrochemical processes. 2017. 4(7): p. 1600981.
  33. Wei, C. and Z.J.J.S.M. Xu, The comprehensive understanding of as an evaluation parameter for electrochemical water splitting. 2018, Wiley Online Library. p. 1800168.
  34. Retter, U. and H. Lohse, Electrochemical impedance spectroscopy, in Electroanalytical Methods: Guide to experiments and applications. 2009, Springer. p. 159-177.
  35. Lavín, Á., et al., On the determination of uncertainty and limit of detection in label-free biosensors. 2018. 18(7): p. 2038.
Figure 1. Schematic illustration of the glucose oxidation on the BP/Au electrode.
Preprints 200306 g001
Figure 2. (a,b,c) TEM images of BP/Au heterojunction in 200 nm, 50 nm, and 5 nm resolution ratios. (d) The SAED pattern of BP/Au heterojunction. (e) UV–vis absorption spectra of AuNPs, BP, and BP/Au. (f) The XRD patterns of AuNPs, BP, and BP/Au. (g–i) SEM-EDS mapping of P and Au elements from the selected area.
Preprints 200306 g002
Figure 3. Electronic structure analysis of the BP/AuOH heterojunction. (a) The band structure of pristine AuOH; (b) The band structure of the BP/AuOH heterojunction; (c) Total and partial densities of states (TDOS/PDOS) of the BP/AuOH heterojunction; (d) The charge density difference map of the BP/AuOH heterojunction (charge accumulation: red-yellow-green; charge depletion: blue).
Preprints 200306 g003
Figure 4. (a) UV-vis absorption spectra of BP/Au, pure BP, and AuNPs. (b) C–V polarization curve of BP/Au, pure BP, and AuNPs in 1 m KOH electrolyte. (c) LSV curves and Tafel plots. The curves in the inset correspond to the calculated Tafel slope of BP/Au, pure BP, and AuNPs, respectively. (d) Electrochemical AC impedance spectroscopy of BP/Au, pure BP, and AuNPs in 1 m KOH electrolyte.
Preprints 200306 g004
Figure 5. (a) Cyclic voltammetry curves of BP/Au electrode in 0.1 M KOH electrolyte with and without glucose (Glu). (b) Comparison of the current density difference (Δj) for BP, AuNPs, and BP/Au electrodes in 0.1 M KOH electrolyte with and without glucose (Glu). (c) Chronoamperometric responses of the BP/Au electrode toward glucose under dark and light conditions. The numbers indicate glucose concentrations (μM). (d) Relationship between current density and glucose concentration for BP/Au electrode under dark and light conditions. Dashed lines represent linear fittings, with R2 as the goodness of fit. (e) Chronoamperometric selectivity test of BP/Au electrode toward glucose and interfering substances. Arrows indicate the addition of substances (concentrations labeled). (f) The current density of BP/Au electrode stored for 1, 15, and 30 days. The values abovementioned the bars represent the measured current density.
Preprints 200306 g005
Disclaimer/Publisher’s Note: The statements, opinions and data contained in all publications are solely those of the individual author(s) and contributor(s) and not of MDPI and/or the editor(s). MDPI and/or the editor(s) disclaim responsibility for any injury to people or property resulting from any ideas, methods, instructions or products referred to in the content.
Copyright: This open access article is published under a Creative Commons CC BY 4.0 license, which permit the free download, distribution, and reuse, provided that the author and preprint are cited in any reuse.
Prerpints.org logo

Preprints.org is a free preprint server supported by MDPI in Basel, Switzerland.

Subscribe

Disclaimer

Terms of Use

Privacy Policy

Privacy Settings

© 2026 MDPI (Basel, Switzerland) unless otherwise stated