Submitted:
17 February 2026
Posted:
27 February 2026
You are already at the latest version
Abstract
Given the urgency imposed by the UNEP Global Plastics Treaty and emerging safety regulations, robust methodologies are needed to assess chemical complexity and ensure the safe reuse of recycled plastics. This study introduces an advanced, multi-technique analytical framework to characterize feedstock composition and hazardous contaminants in mixed plastic waste streams (nine samples P1 to P9), including post-consumer, post-commercial, and post-industrial sources, collected from industrial recycling facilities. To mirror the uncertainty that commercial sorters face, waste samples were analysed blind—their polymer identities, fillers, and additives were undisclosed until after testing. Using a comprehensive suite of techniques—Fourier Transform Infrared Spectroscopy (FTIR), Raman spectroscopy, Differential Scanning Calorimetry (DSC), Thermogravimetric Analysis (TGA), Thermogravimetry–mass spectrometry (TG–MS), Inductively Coupled Plasma Optical Emission Spectroscopy (ICP-OES), X-ray Fluorescence (XRF), and Ion Chromatography this study identifies dominant polymers (HDPE, LDPE, PP), residual additives, non-intentionally added substances (NIAS), and inorganic contaminants such as chlorine, lead, and transition metals. The results inform tailored recycling strategies, including mechanical recycling for clean streams, pre-treatment for moderately contaminated fractions, and chemical recycling for highly contaminated or chlorine-rich plastics. This paper (Part I) focuses on the comprehensive feedstock characterization and contaminant profiling. A companion paper (Part II) presents a detailed analysis of the pyrolysates generated from these same plastic samples using comprehensive two-dimensional gas chromatography coupled with time-of-flight mass spectrometry (GC×GC–TOF–MS), with an emphasis on identifying degradation products, additive-derived NIAS, and recyclability-relevant heteroatom compounds. Together, these papers offer an end-to-end understanding of contamination dynamics—from waste input to pyrolysis output—thereby informing safe and circular strategies for plastic recycling. This work provides a replicable model for identifying and mitigating toxicological risks in plastic recycling and supports regulatory compliance with emerging global standards.
Keywords:
mixed plastic waste
; feedstock characterization
; hazardous contaminant profiling
; advanced analytical techniques
; non-intentionally added substances (NIAS)
; thermal and elemental analysis
; heavy metals in plastics
; halogenated plastics
; recycling strategy
; UNEP Global Plastics Treaty
1. Introduction
Plastics have become indispensable in modern life, yet the sheer volume of plastic waste now poses a global crisis. The world produces over 400 million metric tons of plastic annually[1], but only about 9% of plastic waste is recycled, while the vast majority is landfilled, incinerated, or leaks into the environment[2]. This imbalance has resulted in widespread pollution—an estimated 70% of used plastics end up as litter or in dumpsites, contaminating oceans, rivers, and soils[2]. Plastics persist for decades, and their fragmentation into microplastics and nanoplastics enables bioaccumulation across trophic levels, including humans. Recent studies have detected microplastic particles in human blood, lungs, and even placental tissue, raising new concerns about chronic exposure and toxicological risks[3,4]. Such mismanaged plastic waste is fueling environmental and health concerns: it accumulates as marine litter and microplastics, threatens wildlife, and even infiltrates the human food chain[5,6,7]. Moreover, the plastics life cycle contributes significantly to climate change, accounting for roughly 3.4% of global greenhouse gas emissions[8]. These multifaceted impacts underscore the urgency of improving plastic waste management on a global scale.
Policymakers worldwide are responding to the plastic pollution challenge with ambitious frameworks and regulations. Plastic waste reduction is now interwoven with international sustainability agendas, including the United Nations Sustainable Development Goals (notably SDG 12 on responsible consumption and SDG 14 on marine conservation). In March 2022, the United Nations adopted a historic resolution to negotiate a legally binding Global Plastics Treaty by the end of 2024[9,10]. This treaty, in its current draft, takes a life-cycle approach, aiming to curb new plastic production, phase out the most hazardous plastic products, and address pollution from all plastic sources, including microplastics and toxic additives. Concurrently, regional initiatives have gained momentum. Under the European Green Deal, for example, the EU is strengthening legislation to reduce plastic waste—implementing EU-wide bans on many single-use plastics, imposing new rules to cut packaging waste, and targeting microplastic pollution[11]. Dozens of nations have likewise enacted policies such as plastic bag bans, product take-back mandates, and recycled content standards. As of 2024, over 120 countries have introduced partial or total bans on single-use plastic items (like shopping bags) or related fees to discourage their use[12,13]. These collective efforts reflect a growing global consensus that decisive action is needed to rein in plastic pollution and foster a circular economy for plastics.
Despite these policy advances, formidable scientific and technical challenges remain[9,14]. Plastics represent a very large group of individual polymers with varying chemical and technical characteristics[15], making plastic waste one of the most complex material mixtures from a recycling perspective[16]. The most widely used polymers include PET, HDPE, LDPE, PVC, PP, and PS[16,17]. Additionally, other polymers with 'enhanced' properties, known as 'engineered polymers,' such as ABS, PC, and PUR, are also manufactured. 'Pure' plastics often exhibit high degradability along with poor thermal, mechanical, and/or aesthetic properties, necessitating specific chemical adjustments (e.g., plasticizers, antioxidants, and/or stabilizers) to achieve the desired functionality[18,19].
One critical bottleneck is the heterogeneous and chemically complex nature of post-consumer and post-commercial plastic waste streams, which often include legacy additives[20,21,22], fillers[23], pigments[24], degradation products[25,26], and non-intentionally added substances (NIAS)[27,28]. Recent studies have identified over 10,000 chemical substances in plastics[29]—many of which are either inadequately regulated or entirely unknown—and several hundred have been found to migrate from recycled plastics into food, water, or the environment[30,31,32,33,34,35,36]. NIAS and additive residues include endocrine-disrupting compounds (e.g., phthalates, bisphenol analogs)[37,38], heavy metals (e.g., lead, cadmium, chromium)[39], and persistent organic pollutants (e.g., chlorinated paraffins[40], flame retardants[3,22,41]), which can leach out or transform under thermal processing, especially during recycling. Alarmingly, recent analyses of recycled plastic pellets from around the world found hundreds of residual toxic chemicals (including pesticides and pharmaceuticals) in the recycled material[27,32,42,43,44]. These findings suggest that recycled plastics can carry a “chemical legacy” of prior use, contamination, or inadequate purification that renders them unsuitable for sensitive applications like food packaging or consumer goods. This chemical burden is not merely a quality issue but a public health and environmental hazard, particularly when recycled plastics are exposed to heat, pressure, or aqueous conditions that may mobilize these substances. Many of these recent studies note, obtaining accurate, real-time compositional information on mixed plastic waste is essential to enable proper sorting and recycling[45].
1.1. Post-consumer, post-industrial, and post-commercial plastic waste types
A further complication is that current research[46,47] has not fully kept pace with the complexity of today’s plastic waste streams. Many studies focus on single-source waste (for instance, analyzing consumer packaging waste or specific industrial scraps in isolation), but relatively few have examined mixed waste streams that integrate post-consumer, commercial, and industrial plastics together. This represents a significant knowledge gap: without a holistic understanding, we risk optimizing recycling processes for one waste segment at the expense of others. Post-consumer plastic waste (from household use) is often highly diverse in polymer composition and carries a “cocktail” of additives and impurities acquired through product use and disposal. By contrast, post-industrial plastics (industrial scrap or off-cuts) tend to be cleaner and more uniform, making them easier to recycle, while post-commercial waste (from commercial activities) falls somewhere in between. Each waste category differs not only in origin but also in the type and severity of contamination, with significant implications for downstream recycling strategies and contaminant removal processes.
Much of the existing research has focused on clean, single-source waste streams—such as post-consumer packaging, PET bottles, or industrial off-cuts—rather than the real-world mixtures of post-consumer, commercial, and industrial plastic waste typically encountered in material recovery facilities. This segmentation has led to a knowledge gap: without holistic analysis of integrated streams, we risk designing recycling systems that optimize for one waste class at the expense of others. For instance, post-consumer plastics often carry residues like food waste, inks, or adhesives, requiring more extensive washing and pre-treatment, whereas post-industrial plastics may be cleaner but less abundant or homogeneous in polymer type. Post-commercial plastics, such as shrink wrap, retail display materials, or institutional can liners, may share characteristics with both other categories, yet have distinct volumes and collection pathways.
These challenges highlight a critical need for advanced, multi-technique characterization of plastic waste streams to determine their exact polymer composition, contaminant profiles, and degradation signatures. Without such data, accurate sorting, risk assessment, or selection of appropriate recycling routes (e.g., mechanical vs. chemical vs. destruction) is not possible. Many recent studies emphasize the necessity of real-time, high-resolution compositional analysis of mixed waste plastics to support both quality control and regulatory compliance[40,48,49,50,51,52]. To develop effective circular economy solutions for plastic waste, research must bridge these silos and characterize the full spectrum of plastic waste streams in an integrated fashion. To date, such comparative studies remain rare, and a systematic framework for categorizing, analyzing, and valorizing these waste classes is still lacking in the peer-reviewed literature.
1.2. Literature Survey
A comprehensive survey of literature (2015–2024) highlights significant research dedicated to characterizing mixed plastic waste streams from post-consumer, post-commercial, and post-industrial sources. The studies summarized in Table 1 (Supplementary material) demonstrate extensive application of analytical methods such as FTIR, DSC, TGA, Py-GC/MS, GC×GC-MS, ICP-OES, and XRF to elucidate polymer types, contaminant profiles, and recyclability. All studies above contribute uniquely to understanding mixed plastic waste. They span post-consumer municipal waste, specialized streams like Waste Electrical and Electronic Equipment (WEEE) and Automotive Shredder Residue (ASR), and contrast mechanical recycling challenges (e.g., sorting, material quality limits) with chemical recycling or energy recovery approaches. Each study’s scope (lab vs. pilot vs. model) and focus (identifying polymers vs. contaminants vs. thermal behavior) align with different aspects of recycling system optimization, from on-the-ground sorting practices to high-level policy and life-cycle considerations. The table groups them by waste type and analytical theme for clarity, while preserving the technical details (e.g., detection limits, methods used, and practical implications) crucial for academic reference.
For instance, Dahlbo et al. (2018) demonstrated the recycling potential of post-consumer packaging waste, identifying significant proportions recoverable for mechanical recycling but noted limited data on chemical contaminants. Roosen et al. (2020) provided comprehensive polymer and elemental impurity data from European packaging waste, concluding that impurities significantly hinder mechanical recycling processes. Gala et al. (2020) similarly highlighted contamination issues limiting recycling of MSW plastic films, emphasizing the high energetic potential alongside substantial contamination. Studies focusing on WEEE plastics, such as Beccagutti et al. (2016) and Chaine et al. (2022), emphasized the presence of hazardous halogenated compounds, particularly brominated flame retardants (BFRs), indicating significant barriers to mechanical recycling. Liu et al. (2024) further confirmed that these contaminants can persist through recycling processes, appearing in consumer products, raising significant environmental and health concerns. Research by Eriksen & Astrup (2019) and Horodytska et al. (2018) underscored that design complexity and contamination of multi-material plastics drastically reduce recyclability, recommending chemical recycling or redesigning products for enhanced recyclability. Additionally, advanced analytical techniques demonstrated potential improvements in polymer identification (Gnoffo & Frache, 2024; Lee et al., 2021), although their scalability remains unproven. Common gaps identified across these studies include limited detailed analysis of organic additives, insufficient linkage between contaminant characterization and practical recycling strategies, and a notable lack of integration among analytical methods, contaminant remediation, and recycling process improvements. Addressing these gaps is critical to advancing effective recycling strategies and achieving circular economy objectives.
1.3. Advanced Analytical Approaches for Mixed Plastics
Since 2015, researchers have increasingly employed advanced analytical and multi-technique approaches to better characterize mixed plastic waste streams[53]. Pyrolysis-GC/MS (Py-GC/MS), for instance, has effectively overcome traditional IR spectroscopy limitations by accurately identifying and quantifying individual polymers in complex mixtures (Gnoffo & Frache, 2024)[54]. However, translating these laboratory results to real-world waste samples is challenging due to complexities like pigments, fillers, contaminants, and varied polymer types such as PVC and PET. Moreover, Py-GC/MS is a destructive analysis that does not inherently facilitate separation processes, highlighting the current gap in integrating this method into industrial quality control systems for recycled plastics.
The thermogravimetric analysis methods, notably TGA-FTIR and TGA-MS, have become valuable supplementary tools for identifying major polymer types based on decomposition temperatures and characteristic evolved gases. For example, Goedecke et al. (2020)[49] demonstrated their utility in distinguishing PVC through characteristic HCl gas emissions or PET via benzoic acid derivatives. Although beneficial, the full potential of these methods, particularly through coupling with machine learning for automated classification of mixed plastic waste, remains largely untapped[45]. Comprehensive two-dimensional gas chromatography coupled with time-of-flight mass spectrometry (GC×GC-TOF-MS) has provided unprecedented resolution and detailed compositional data for complex pyrolysis oils from recycled plastics. Strien et al. (2024)[55] highlighted its superiority over conventional GC-MS for characterizing highly aliphatic hydrocarbons essential in petrochemical feedstocks. Nevertheless, practical adoption is limited due to high costs, complex data interpretation requirements, and difficulty translating extensive analytical data into actionable recycling insights.
Machine learning techniques are emerging to automate spectral identification of plastics, as demonstrated by Lee et al. (2021)[56] with their PlasticNet neural network, which combines ATR-FTIR spectroscopy with AI for real-time sorting. While highly accurate with pure plastics, current models still struggle with mixed or contaminated samples, and depend heavily on comprehensive spectral databases. Successful integration, however, has the potential to significantly improve plastic sorting efficiency and feedstock purity.
Other analytical advancements include ED-XRF for rapid elemental screening of chlorine, bromine, and heavy metals, already widely adopted in WEEE and packaging sorting. ICP-OES has been critical for quantifying metal contaminants that act as catalyst poisons in recycling processes, though its implementation remains limited. Meanwhile, newer thermal extraction methods (TED-GC/MS) offer enhanced sensitivity for detecting trace polymer contaminants, such as identifying low concentrations of PVC via early HCl release. Finally, the integration of multivariate and AI-driven analytical techniques represents a promising frontier, capable of providing real-time identification and quantification of contaminants, though these methods are still at early, largely prototypical stages.
1.4. Integrating Characterization with Recycling Strategies: Gaps and Outlook
A recurring theme across recent studies is the necessity of comprehensive analytical characterization to enable effective plastic recycling, though several critical gaps remain. One primary gap is the lack of integrated multi-technique analysis: most studies apply isolated methods, resulting in fragmented data. For example, polymer composition and elemental impurities are often assessed separately. Roosen et al. (2020)[57] highlighted that comprehensive studies combining full polymer characterization with quantitative impurity analysis are limited. Future studies must integrate spectroscopic, thermal, and chromatographic techniques to fully characterize waste streams, especially to support emerging recycling technologies such as solvent dissolution or chemical recycling.
Another significant gap is the inadequate characterization of trace additives and contaminants (e.g., plasticizers, UV stabilizers, antioxidants, dyes), which critically impact recycled plastic quality. While regulated substances (halogens, heavy metals) are commonly analyzed, many proprietary additives remain overlooked. Dahlbo et al. (2018)[58] emphasized that detailed chemical composition is essential for ensuring recycling quality and limiting hazardous substances. Additionally, food residues, oils, and biofilms on plastics—factors impacting recycling quality and necessitating cross-disciplinary analysis involving food chemistry and microbiology—remain understudied. Scaling laboratory findings to industrial recycling operations also poses challenges. Lab-scale analytical results, typically based on clean, small samples, must translate to large, heterogeneous industrial streams. Although some industrial applications (e.g., XRF scanners at e-waste facilities) successfully sort hazardous fractions like brominated plastics, the subsequent recycling or recovery pathways remain unclear or limited, often resorting to incineration rather than material recovery.
A notable disconnect exists between analytical characterization data and practical recycling recommendations. Although many studies broadly suggest recycling improvements (such as pyrolysis for contaminated plastics or better design for mono-material packaging), actionable details or pilot-scale validations remain rare. Few studies explicitly link analytical data to recycling outcomes, highlighting a need for collaborative interdisciplinary projects where characterization specialists directly inform recycling process trials. Finally, bridging the gap between analytical findings and policy or standardization remains essential. Industry reports (e.g., by BSEF) complement academic findings, highlighting contaminants like brominated flame retardants in WEEE plastics, informing regulatory threshold discussions. However, explicit regulatory standards (e.g., specifying allowable contaminant levels) remain under development. Robust analytical characterization will be crucial to enforce such standards and ensure recycled plastic safety.
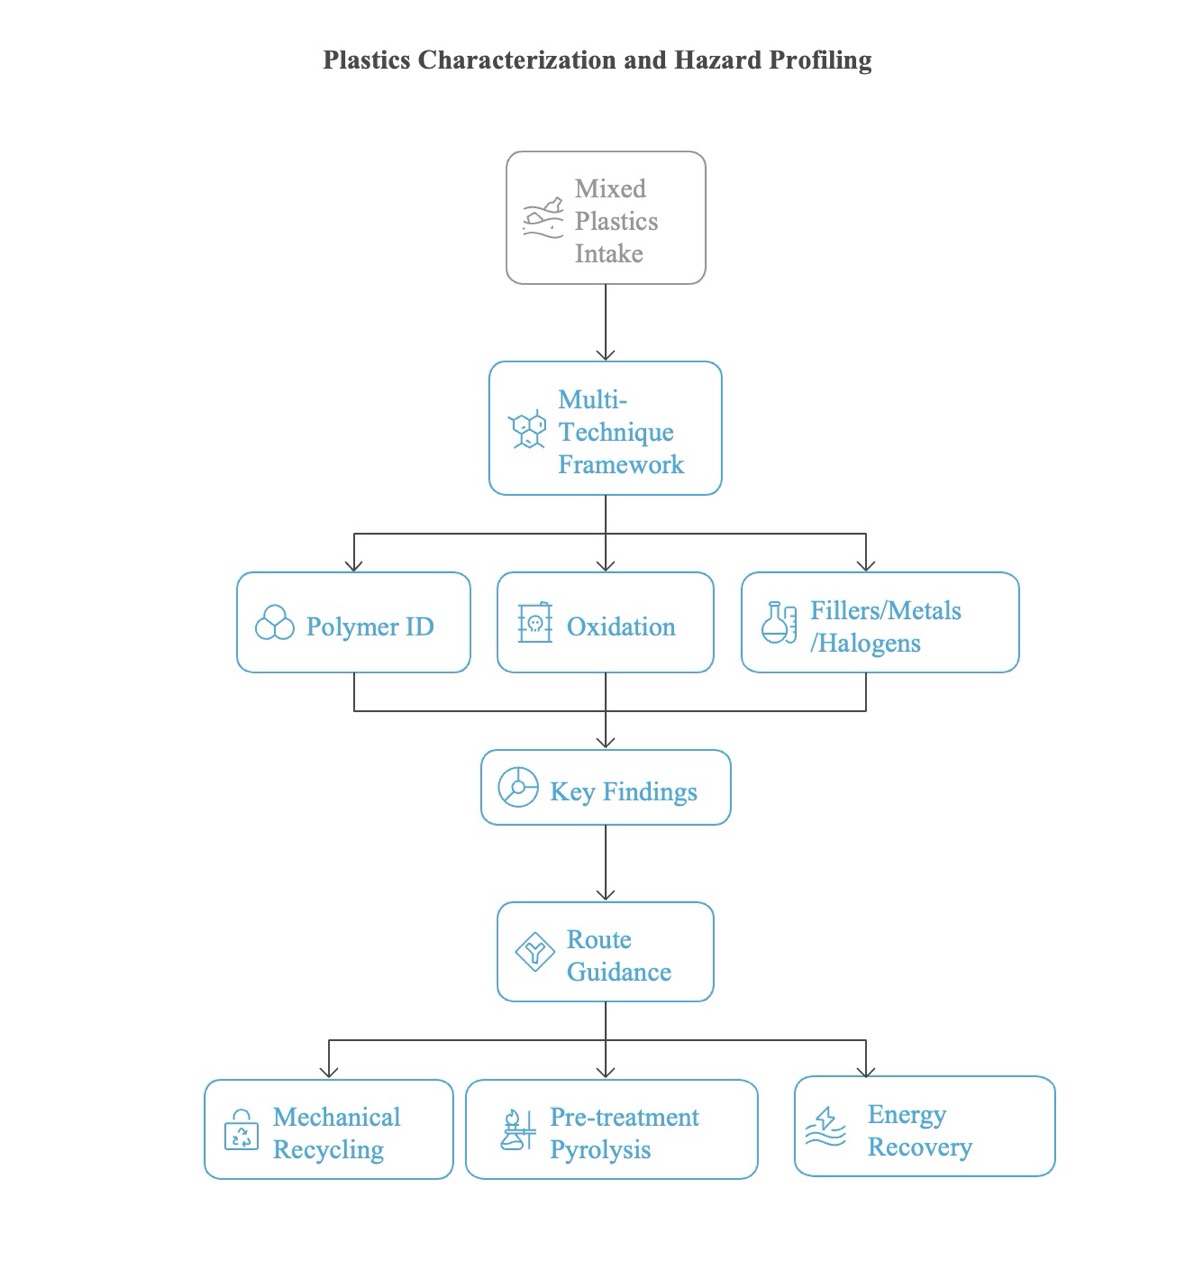
1.5. Integrated Analytical and Recycling Framework for Mixed Plastic Waste
The framework begins by sourcing plastic wastes from diverse origins—post-consumer, commercial, and industrial streams—collected at industrial recycling facilities. Unlike many lab studies that work with well-defined polymers, we intentionally treated the nine samples (P1–P9) as unknowns at the point of receipt. This ‘black-box’ approach reproduces the ambiguity recyclers face when bales arrive with incomplete labelling.”After initial sample preparation, a comprehensive analytical characterization is conducted using multiple advanced techniques, including spectroscopic (FTIR, Raman), thermal (DSC, TGA), elemental (ICP-OES, XRF), and organic contaminant analysis (GC-MS, Py-GC×GC-MS), alongside migration assessments (the latter analyses are detailed in a companion paper). The characterization results are integrated into a detailed risk evaluation, identifying polymers, additives, and contaminants and assessing their environmental and health implications. Based on these insights, recycling pathways—mechanical recycling for low-contamination materials, chemical recycling methods like pyrolysis or gasification for highly contaminated fractions, and necessary pre-treatment processes—are selected. Importantly, this stage includes an iterative feedback loop: if new risks or data inconsistencies are identified, further re-analysis or re-evaluation is conducted, refining recycling choices.
Practical recommendations are then formulated for industry stakeholders and regulatory compliance, explicitly aligned with global regulatory frameworks such as the UNEP Plastics Treaty. Another critical iterative feedback occurs here: regulatory requirements or industry constraints can prompt additional analytical characterization, recycling pathway adjustments, or further economic assessments. Ultimately, this iterative and adaptive framework ensures ongoing improvements and alignment with practical and regulatory needs. The holistic integration of advanced characterization, iterative risk evaluation, economic feasibility, and regulatory feedback ensures effective, sustainable recycling practices that contribute meaningfully to circular economy goals and reduce the environmental and human health risks associated with plastic waste.
Figure 1.
Integrated analytical and recycling framework for mixed plastic waste, showing key stages from sampling to recycling strategy selection. Iterative feedback loops allow refinement based on analytical results, technical feasibility, and regulatory needs, supporting circular economy outcomes.
1.6. Goals and Objectives of the Present Study
This two-part study aims to bridge critical knowledge gaps by establishing a comprehensive, multi-technique analytical framework for characterizing hazardous contaminants in mixed plastic waste and evaluating their fate during chemical recycling. Part I (this paper) focuses on the feedstock characterization of nine representative plastic waste samples (P1–P9), collected from industrial recycling facilities in Saudi Arabia. The primary goal of this paper is to assess polymer composition, elemental and halogen contamination, and thermal behavior in order to inform practical, source-specific recycling strategies.
To achieve this, a suite of advanced analytical techniques—including Fourier Transform Infrared (FTIR) spectroscopy, Raman spectroscopy, Differential Scanning Calorimetry (DSC), Thermogravimetric Analysis (TGA), Thermogravimetry–Mass Spectrometry (TG–MS), Inductively Coupled Plasma Optical Emission Spectroscopy (ICP-OES), X-ray Fluorescence (XRF), and Combusition Ion Chromatography (CIC)—was applied to accurately identify polymer types, inorganic additives, and halogen contamination across the samples. These methods were further used to assess thermal degradation pathways and material stability, linking decomposition behavior to polymer identity, filler content, and oxidation. The results provide insight into hazardous contamination risks, with particular attention given to chlorine, heavy metals, and legacy additives that may hinder mechanical recycling or contribute to the formation of toxic byproducts during thermal recycling.
Based on these findings, the study proposes tailored recycling recommendations: mechanical recycling for cleaner, low-additive samples and chemical recycling or energy recovery for heavily contaminated or halogen-rich materials. This feedstock-level assessment also establishes a baseline characterization protocol to support regulatory compliance, including future benchmarks under the UNEP Global Plastics Treaty, and to inform safe, sustainable circular economy practices.
In Part II (the companion paper), we extend this investigation by applying comprehensive two-dimensional GC–TOF–MS (GC×GC–TOF–M) to analyze the pyrolysates derived from these same samples. That work focuses on identifying degradation products, additive-derived compounds, and non-intentionally added substances (NIAS) that may persist in the recycled outputs and affect product quality, health, safety, or regulatory acceptability.
Insights from the blind study now inform a decision tree that regulators and plant operators can deploy to meet upcoming treaty obligations without incurring prohibitive analytical costs. Together, these two papers offer an integrated feedstock-to-product perspective on contamination dynamics in plastic recycling, forming a replicable model for responsible chemical recycling system design and performance evaluation under emerging global standards.
2. Materials and Methods
2.1. Plastic Waste Samples (P1–P9)
Plastic waste samples labeled P1 to P9 were provided by Napco National, a leading participant in Saudi Arabia’s circular economy initiatives. Napco National collects plastics from diverse sources, including industrial, commercial, and municipal solid waste (MSW), processing them at advanced recycling plants in Jeddah and Dammam. Jeddah, a major industrial and port city with over 4 million residents, generates more than 5,000 tons of solid waste daily, comprising consumer packaging, electronics, automotive components, and various plastic products. These waste streams primarily contain globally prevalent polymers such as polyethylene (PE), polypropylene (PP), polyethylene terephthalate (PET), polystyrene (PS), and polyvinyl chloride (PVC), collectively representing about 92% of worldwide plastic demand. The samples (P1–P9) encompassed a broad spectrum of post-consumer, post-commercial, and post-industrial plastic wastes, including films, lumps, clogs, non-woven diaper trims, consumer packaging, and discarded household items. Napco National employs meticulous sorting by polymer type and color, complemented by rigorous washing, shredding, and density-based separation to minimize contamination. Subsequently, plastics undergo extrusion at controlled temperatures (typically ~180–220 °C for polyolefins) with melt filtration systems to produce recycled pellets. Despite these structured processes, the exact origins of individual samples (whether predominantly post-consumer, commercial, or industrial) were not explicitly identified by Napco. Therefore, comprehensive analytical characterization was essential to determine polymer types, additives, contaminants, polymer degradation, and blend compatibility.
2.2. Analytical Methodology for Plastic Waste Characterization: Instrumentation and Experimental Procedures
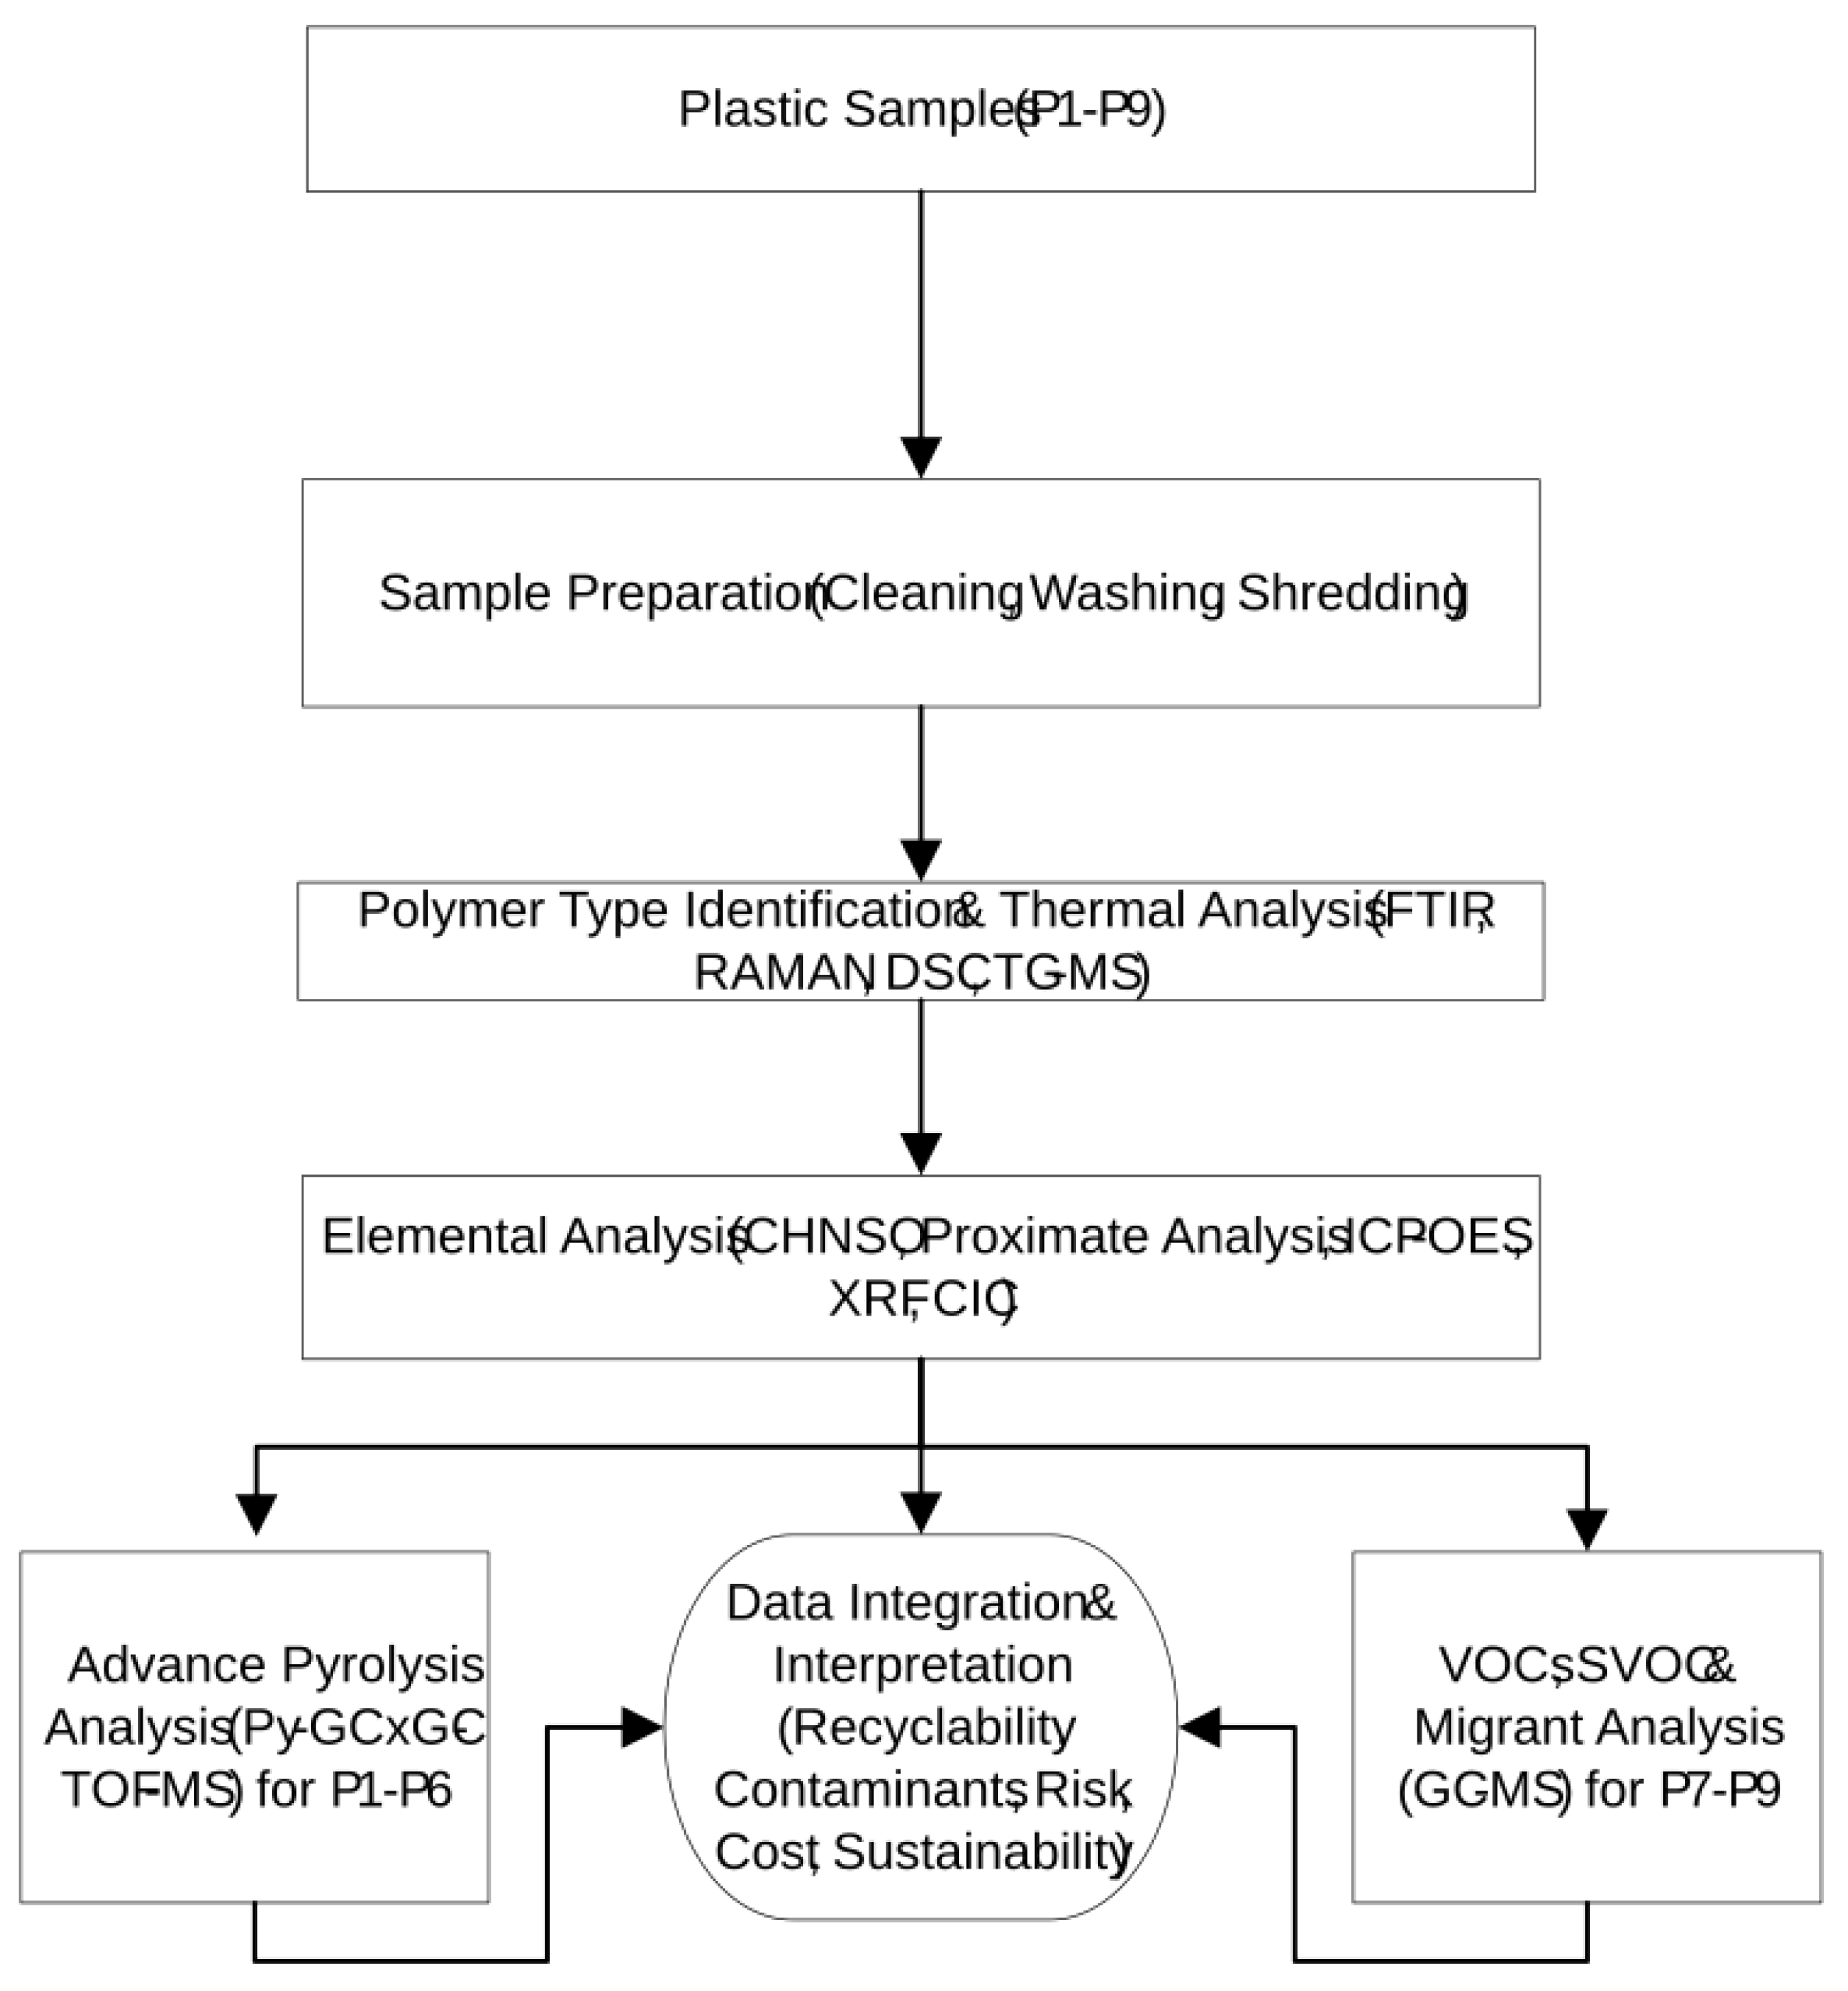
An integrated, multi-technique analytical framework was employed to comprehensively characterize nine plastic waste samples (P1–P9) representing post-consumer, post-commercial, and post-industrial origins. The analytical workflow was organized into three core stages: polymer identification and thermal behavior analysis; thermal stability and decomposition profiling; and elemental and halogen quantification.
To identify polymer types and evaluate thermal transitions, Fourier Transform Infrared Spectroscopy (FTIR), Raman spectroscopy, and Differential Scanning Calorimetry (DSC) were applied. FTIR spectra were collected using a Thermo Fisher Nicolet iS10 instrument in attenuated total reflectance (ATR) mode, with a wavenumber range of 500–4000 cm¹ and 4 cm¹ resolution. Raman microscopy was conducted using a WITec Apyron confocal Raman system equipped with a 473 nm excitation laser and CCD detector, providing detailed vibrational fingerprints of polymer backbones and filler interference. DSC measurements were performed on a TA Instruments DSC 250. Each sample was heated from 30 °C to 300 °C at 10 °C/min under nitrogen flow (50 mL/min) to determine melting behavior and crystallinity, assisting in distinguishing LDPE, HDPE, and PP compositions and assessing thermal history or additive plasticization.
Thermal degradation and polymer stability were further investigated using Thermogravimetric Analysis (TGA) and TGA coupled with Mass Spectrometry (TG–MS). TGA was carried out on a NETZSCH STA-449-F1 analyzer in an argon atmosphere, with heating from 25 °C to 750 °C at 10 °C/min. This provided decomposition profiles, ash content, and multi-step degradation signatures associated with the presence of mineral fillers or oxidized additives. For evolved gas analysis, the TGA was interfaced with a quadrupole mass spectrometer scanning from m/z 2 to 128. This setup enabled real-time identification of decomposition products such as hydrocarbons (e.g., ethylene, propylene), water (from oxidation or additives), and CO₂ (from carbonate fillers), thereby complementing TGA-derived mass loss data with molecular-level specificity.
Elemental and halogen content was assessed through a combination of ultimate, proximate, spectrometric, and chromatographic methods. Ultimate CHNSO analysis was performed using a PerkinElmer Series II 2400 analyzer, with combustion at 975 °C in oxygen for carbon, hydrogen, nitrogen, and sulfur, and pyrolysis at 1043 °C under helium for oxygen. Proximate analysis for moisture, volatile matter, ash, and fixed carbon followed ASTM D3172-13(2021)e1 using the same TGA system. For trace metal analysis, samples were microwave-digested in a Milestone UltraWAVE system with 5 mL HNO₃ (69%) and 1 mL H₂O₂ (35%), then diluted and analyzed via Inductively Coupled Plasma Optical Emission Spectroscopy (ICP-OES, Agilent 5110) to quantify elements such as Pb, Cd, Fe, Zn, Ca, and others relevant to plastic additives and pigments. Elemental screening was also performed using Wavelength Dispersive X-ray Fluorescence (WD-XRF, Bruker S8 TIGER), which enabled non-destructive detection of chlorine, bromine, and selected metal oxides.
Halogen content (Cl, Br, F, I) was determined using Combustion Ion Chromatography (CIC), following standard oxidative combustion procedures. Each solid sample was subjected to high-temperature combustion in an oxygen-rich environment to convert halogens into their respective hydrogen halides (e.g., HCl, HBr). The resulting combustion gases were absorbed in an aqueous solution and analyzed by ion chromatography using a calibrated anion-exchange column.
Quantification was based on external calibration with halide standards, with detection limits of approximately 1 mg/kg for all halogens. The method enabled accurate measurement of total fluorine (F), chlorine (Cl), bromine (Br), and iodine (I) as inorganic or organically bound halides.
Lastly, Gel Permeation Chromatography (GPC) was performed on samples P1–P6 to assess their molecular weight distribution and degradation history.
All plastic waste samples (P1–P9) underwent standardized preparatory procedures, including cleaning, cutting, and shredding. This paper (Part I) presents the results of these core analyses, focusing on feedstock characterization, polymer identification, contamination profiling, and recyclability assessment. In the companion paper (Part II), specialized chemical characterization of thermal degradation products is reported. Specifically, samples P1-P6 were subjected to pyrolysis followed by Py–GC×GC–TOF–MS, enabling molecular-level identification of pyrolysis products, additive residues, and non-intentionally added substances (NIAS). In parallel, samples P7–P9 were analyzed via GC–MS to identify VOCs, SVOCs, and potential migrants in water. These findings are discussed in detail in Part II, where they are used to evaluate the chemical safety and processing requirements of pyrolysis-derived oils and leachates.
Figure 2.
Analytical characterization workflow for plastic waste samples (P1–P9). Core analyses (FTIR, DSC, TGA, CHNSO, ICP-OES, XRF, TG–MS) were applied to all samples, followed by specialized pathways: pyrolysis GC×GC–TOF–MS for P1– and VOC/SVOCs and migration testing via GC–MS for P7–P9. This two-track approach enabled a comprehensive evaluation of both polymer identity and contamination risks.
3. Results and Discussions
3.1. Identification of waste plastic samples (FTIR, Raman, Thermal Analysis)
FTIR Spectroscopy
FTIR is a widely used analytical tool for rapidly identifying plastic polymer types and detecting common additives and degradation-related contaminants. It works by measuring the absorption of infrared light by specific functional groups, producing characteristic spectral fingerprints in the mid-IR region. These fingerprints enable polymer differentiation, although FTIR has limitations when analyzing complex mixtures where overlapping signals can obscure clear identification. In such cases, spectral libraries and multivariate data analysis are often used to enhance accuracy. In the FTIR spectra of the plastic samples, polypropylene (PP) is characterized by absorption peaks associated with CH₃ bending vibrations near 1375 cm⁻¹ and CH₂ bending around 1456 cm⁻¹. It also shows C–H stretching near 2841 and 2917 cm-1, while a peak near 841 cm-1 may indicate tertiary carbons in the polymer backbone. LDPE typically exhibits strong absorption around 1464 cm⁻¹ (CH₂ bending), weaker absorption near 720 cm⁻¹ (CH₂ rocking), and strong C–H stretching near 2847 and 2914 cm⁻¹. HDPE shares many of these bands but often shows sharper, more defined peaks due to its greater crystallinity. A peak near 874 cm¹ may reflect branching or structural side chains. While FTIR can confirm the presence of PE, it cannot reliably distinguish between LDPE, HDPE, and VLDPE, as their spectra are dominated by similar C–H vibrations. Differences in density and branching among these types do not significantly affect infrared absorption. Therefore, additional techniques such as DSC or density measurements are required to differentiate these subclasses, as they can reveal variations in crystallinity and thermal behavior arising from different molecular structures.
Figure 3 presents the FTIR spectra of samples P1–P9 overlaid with standard polymer references. Based on this, P1, P5, P7, and P8 exhibit distinct absorption bands consistent with polyethylene, including CH₂ rocking (~720 cm⁻¹) and bending (~1460 cm⁻¹). Samples P5 and P8 also show peaks around 875 cm⁻¹, suggestive of branching, and 1715 cm⁻¹, indicative of oxidation or environmental degradation. P3, P4, and P9 are identified as polypropylene, based on CH₃ bending (~1375 cm⁻¹) and CH₂/CH₃ stretching (2839–2952 cm⁻¹). Among these, P9 displays a more complex FTIR spectrum, with additional peaks possibly related to unsaturation or additive incorporation. These may reflect polymer backbone modifications or the presence of co-monomers. P2 shows PE-like features but also exhibits peaks at 1644 cm⁻¹ (C=C stretching) and 3393 cm⁻¹ (O–H stretching), pointing to environmental oxidation or moisture contamination. P6 appears to be a PE–PP blend, supported by overlapping CH₂ and CH₃ peaks and a carbonyl band (~1715 cm⁻¹), again suggesting oxidation or additive presence.
In summary, the FTIR analysis confirms that the polymers in the nine samples are predominantly polyethylene (HDPE/LDPE) and polypropylene, with variations arising from additives, oxidation, or blending. P9’s more complex spectrum, relative to the clearer PP signatures of P3 and P4, likely results from co-monomer incorporation, additive residues, or greater environmental aging.
RAMAN spectroscopy
In Raman spectroscopy is a complementary technique to FTIR for identifying polymers, offering molecular fingerprints based on vibrational modes observed in the inelastic scattering of light. It is particularly useful for non-destructive analysis and detecting specific backbone structures or additives. In this study, reference spectra of standard polymers (PE, PP, PMMA, PVC, and PET) were used for comparison (Supplementary material). The Raman spectra of waste samples P1–P6 were compared to these standards to support polymer identification established via FTIR.
The reference PE spectrum matched well with samples P1, P2, and P5, confirming their classification as polyethylene. Similarly, the characteristic peaks of PP were observed in sample P3, consistent with its identification as polypropylene. The PMMA and PVC standards displayed distinct spectral features that were not present in any of the samples, indicating that none of the waste materials matched these polymers. Sample P4 could not be conclusively identified due to a weak Raman signal, likely caused by sample opacity or fluorescence. Sample P6 also exhibited strong fluorescence interference, a phenomenon often associated with the presence of additives, degradation products, or pigments, which absorb and re-emit light and obscure the Raman signal. As a result, P6 could not be conclusively identified by Raman either.
When compared with FTIR, Raman spectroscopy provided consistent results for samples only when strong signals were obtained. However, both techniques have limitations in distinguishing between polyethylene subtypes, such as HDPE and LDPE, as these variants share nearly identical CH₂ vibrational bands. The similarity of their spectral features limits the ability of Raman and FTIR to differentiate between them. In this study, FTIR spectra generally exhibited stronger signals and were thus prioritized for primary polymer identification (and Raman not pursued further). Nonetheless, complete differentiation between LDPE and HDPE remains uncertain without additional thermal or structural analysis techniques such as DSC or density testing.
3.2. Thermal Analysis
Thermal characterization of the plastic samples was carried out using DSC, TGA/ DTG, and TG–MS. These methods provided complementary insights into polymer identity, filler content, degradation pathways, and thermal stability. DSC was used to determine melting behavior and crystallinity. Samples showed characteristic melt transitions for polyethylene (LDPE/HDPE) and PP, which supported FTIR and Raman-based polymer identification. In particular, DSC helped differentiate between LDPE and HDPE—polymers that have nearly indistinguishable FTIR/Raman spectra—by detecting differences in crystallinity and melting temperatures. TGA measured mass loss as a function of temperature, offering information on polymer decomposition and residue content. Combined with DTG, which tracks the rate of weight change, this enabled the resolution of overlapping degradation events and the identification of multi-step decomposition patterns, often associated with fillers or additives. TG–MS provided real-time detection of evolved gases during decomposition, linking specific weight-loss stages to volatile species. This was especially valuable for identifying CO₂ release from CaCO₃ fillers (in samples like P2 and P5), water from oxidized polymers, and hydrocarbon fragments (C₂/C₃) indicative of PE or PP backbones. These results not only reinforced the polymer assignments made via FTIR/Raman but also revealed signs of environmental degradation or additive presence that were not evident spectroscopically. This integrated approach was critical for assessing the recyclability of each sample and determining whether mechanical or chemical recycling routes would be more appropriate.
DSC: Most samples exhibit clear melting points corresponding to their primary polymer compositions, as revealed by the DSC analysis . Samples P1, P2, P4, and P8 display melting points around 125 °C to 130 °C, indicating they primarily comprise HDPE. However, the DSC profiles of P1 and P4 show slight broadening in the 105 °C to 115 °C range, suggesting the presence of minor amounts of LDPE. Similarly, P8 exhibits some thermal anomalies at higher temperatures, indicating the possible presence of inorganic fillers. In contrast, P3, P6, and P9 show melting points around 160 °C to 165 °C, characteristic of PP. While these samples are predominantly PP, minor signs of LDPE contamination are observed in P6 and P9 through small thermal events around 105 °C to 115 °C. Samples P5 and P7, with melting points in the 109 °C to 115 °C range, primarily comprise LDPE. However, DSC broadening at higher temperatures in P5 suggests the presence of fillers or additives. DSC analysis supports the polymer identification for each sample. The main melting peaks correspond to the dominant polyolefin types: samples with melting temperatures around 125–135 °C are rich in HDPE, whereas those melting near 160 °C are characteristic of PP. For instance, P1, P2, P4, and P8 all show a principal melt peak at ∼130 °C (indicative of HDPE), often with a minor shoulder around 110 °C from a small LDPE fraction. Conversely, P3, P6, and P9 exhibit melting around 160 °C (typical of PP) with slight endotherms near 110 °C due to residual PE. Samples P5 and P7 display melting in the 109–115 °C range, consistent with LDPE. Notably, some DSC curves are broadened or show additional features (e.g., in P5 and P8), suggesting the presence of fillers or additives that affect the thermal transitions.
TGA and DTG: The TGA analysis further confirms the primary polymer compositions and provides additional information on the presence of fillers or contaminants (see Table 1). P1, P3, P4, and P6 show single-stage degradation with degradation onset temperatures around 350 °C to 420 °C and T_max between 450 °C and 500 °C, confirming their composition as relatively pure HDPE or PP, respectively. The total mass loss for these samples is close to 99%, indicating near-complete degradation of the polymer with no significant residue. For these samples, TG–MS detected only the expected hydrocarbon fragments (C₁–C₃ gases) and no notable CO₂ release, consistent with the absence of inorganic fillers. However, P2, P5, P7, P8, and P9 exhibit two-stage degradation patterns. The primary degradation occurs between 350 °C and 500 °C, consistent with decomposition of the polymer matrix, while a secondary mass-loss event between 600 °C and 700 °C suggests the presence of thermally stable additives or fillers. This second mass loss, though smaller (ranging from ~1% to 4%), indicates inorganic materials such as calcium carbonate (CaCO₃) or carbon black that decompose or oxidize at higher temperatures. In particular, P5 and P8 display more pronounced secondary weight losses, suggesting a higher filler content in those samples. Indeed, TG–MS later confirmed that these high-temperature weight-loss events are associated with CO₂ evolution (m/z 44) from CaCO₃ fillers in samples like P2 and P5.
Figure 4.
Differential Scanning Calorimetry (DSC) thermograms of plastic waste samples P1–P9. Endothermic peaks near 125–135 °C indicate HDPE-rich compositions, while melting transitions around 160–165 °C correspond to polypropylene (PP). Broader or dual melting peaks in samples such as P1, P6, and P9 suggest blends of PE and PP or the presence of additives and fillers. Peaks between 109–115 °C in P5 and P7 are characteristic of LDPE. Thermal transitions support polymer classification and complement FTIR and TGA results.
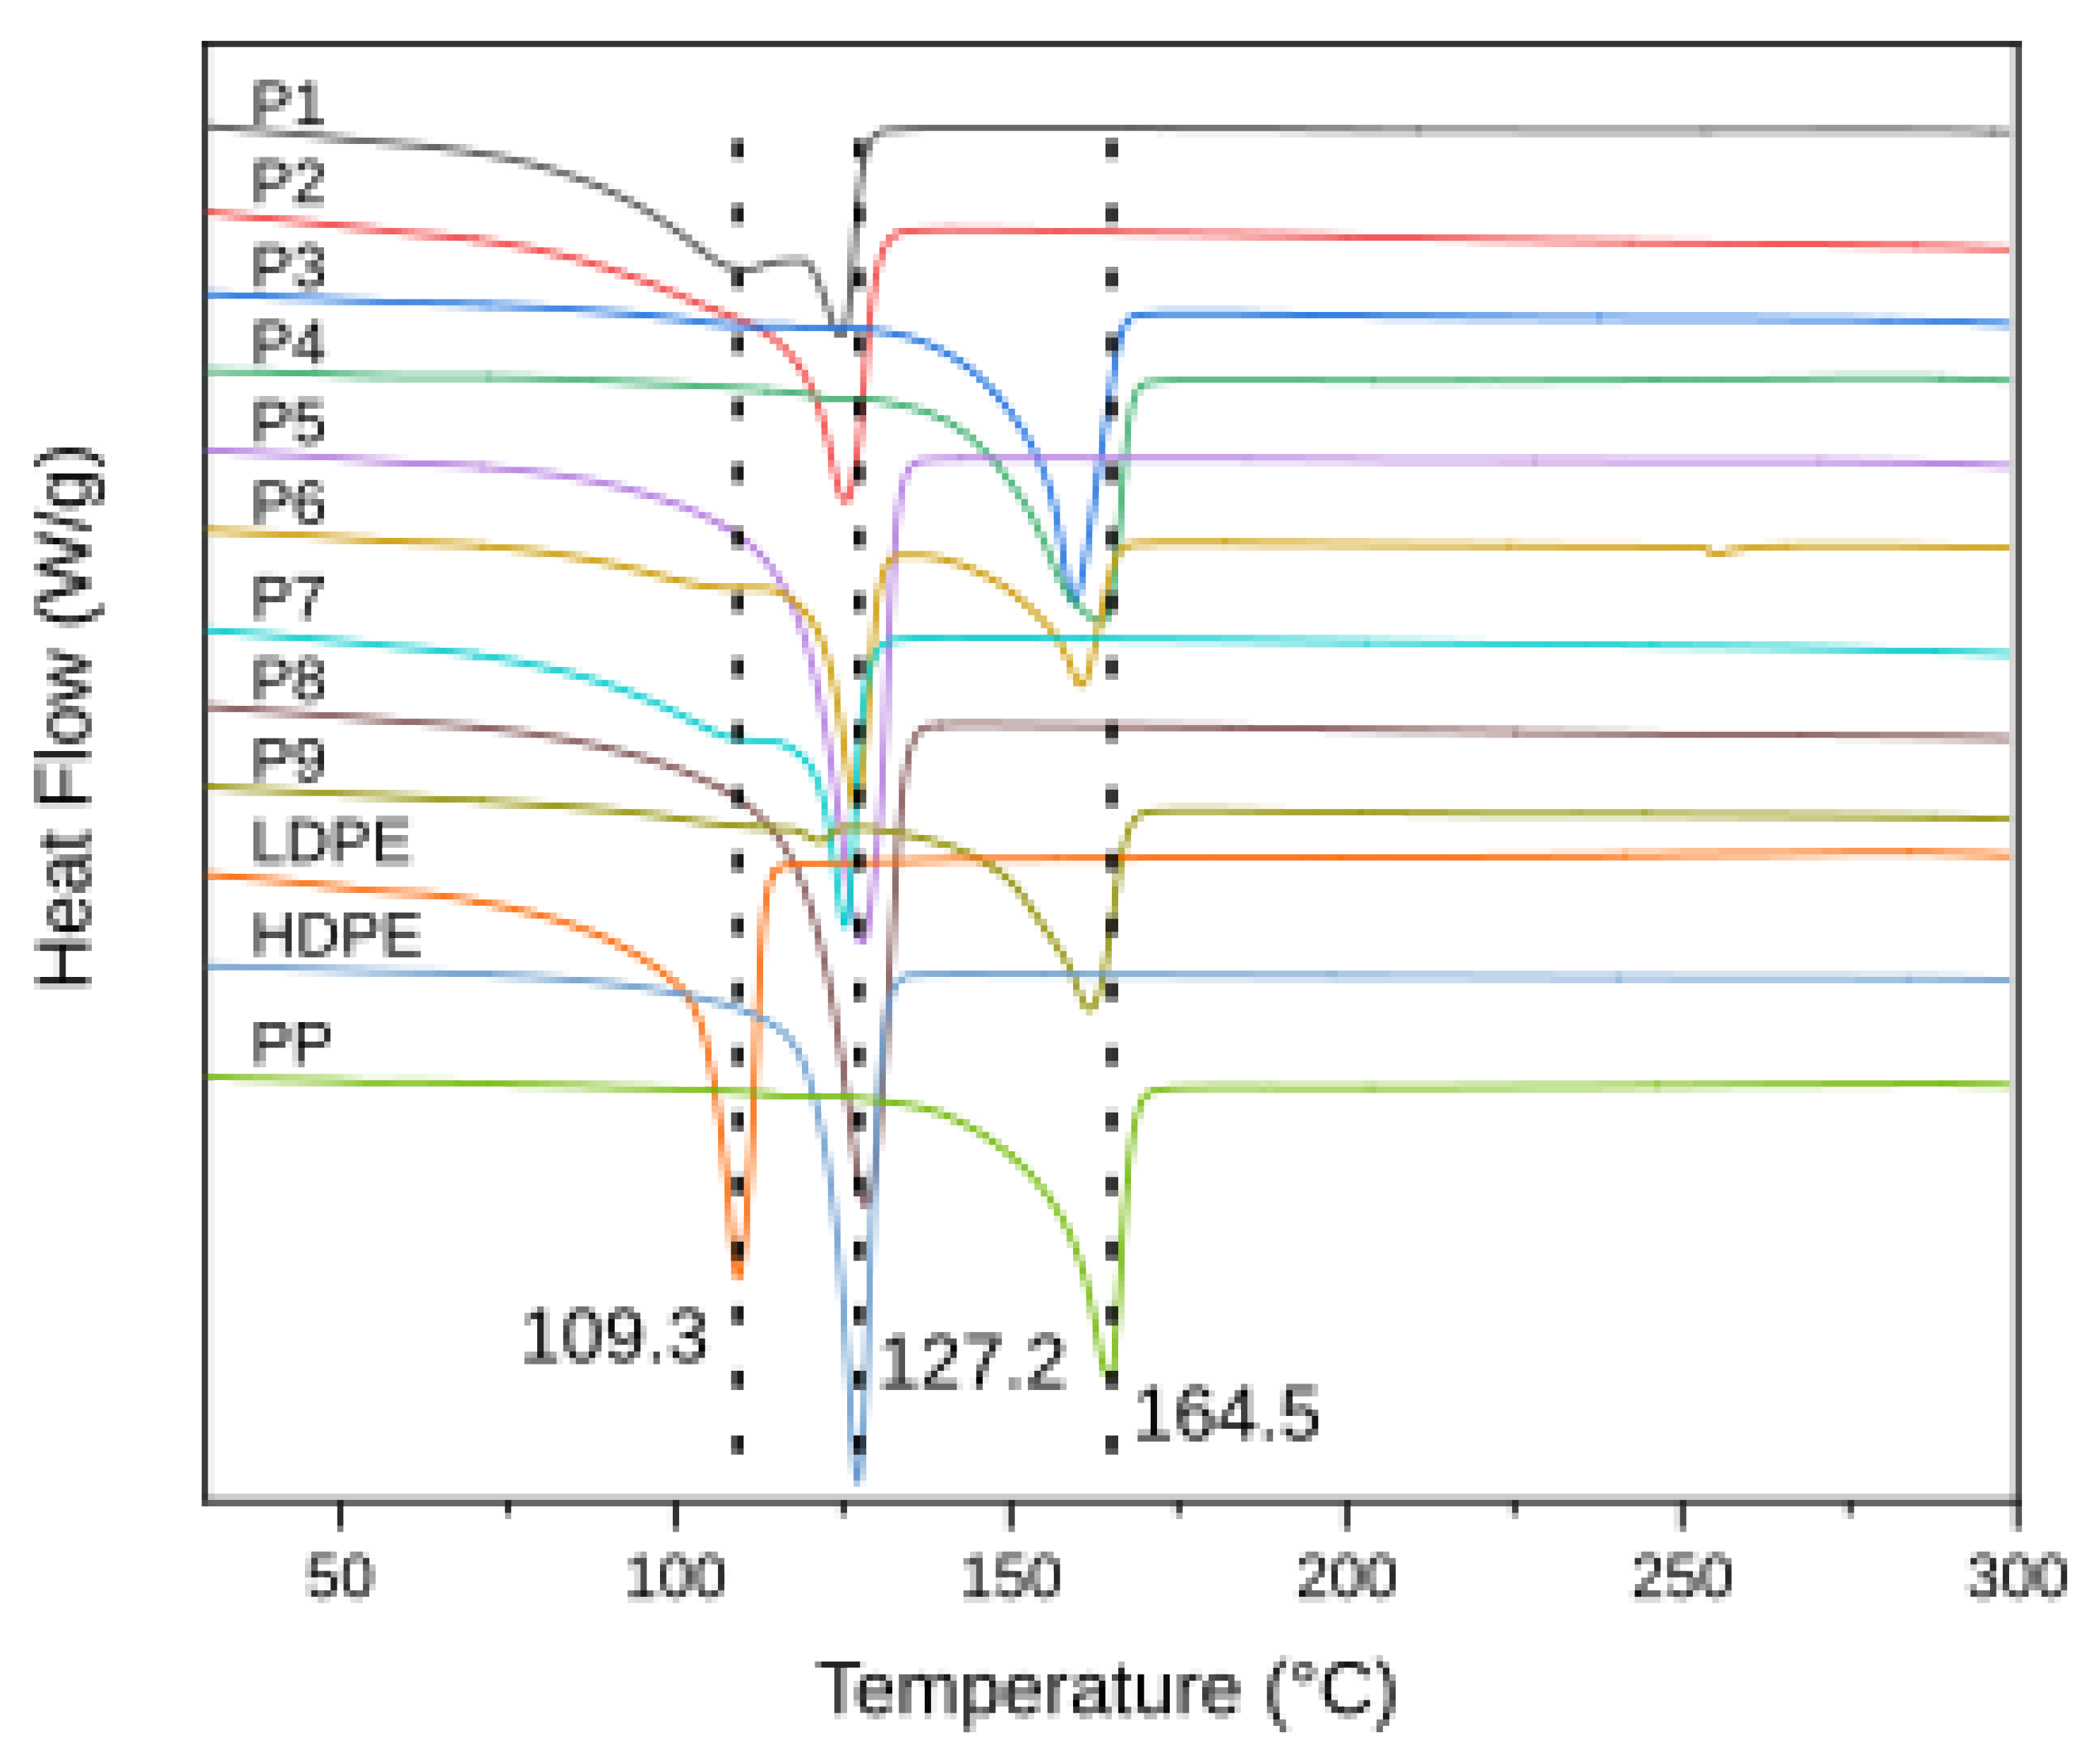
Figure 5.
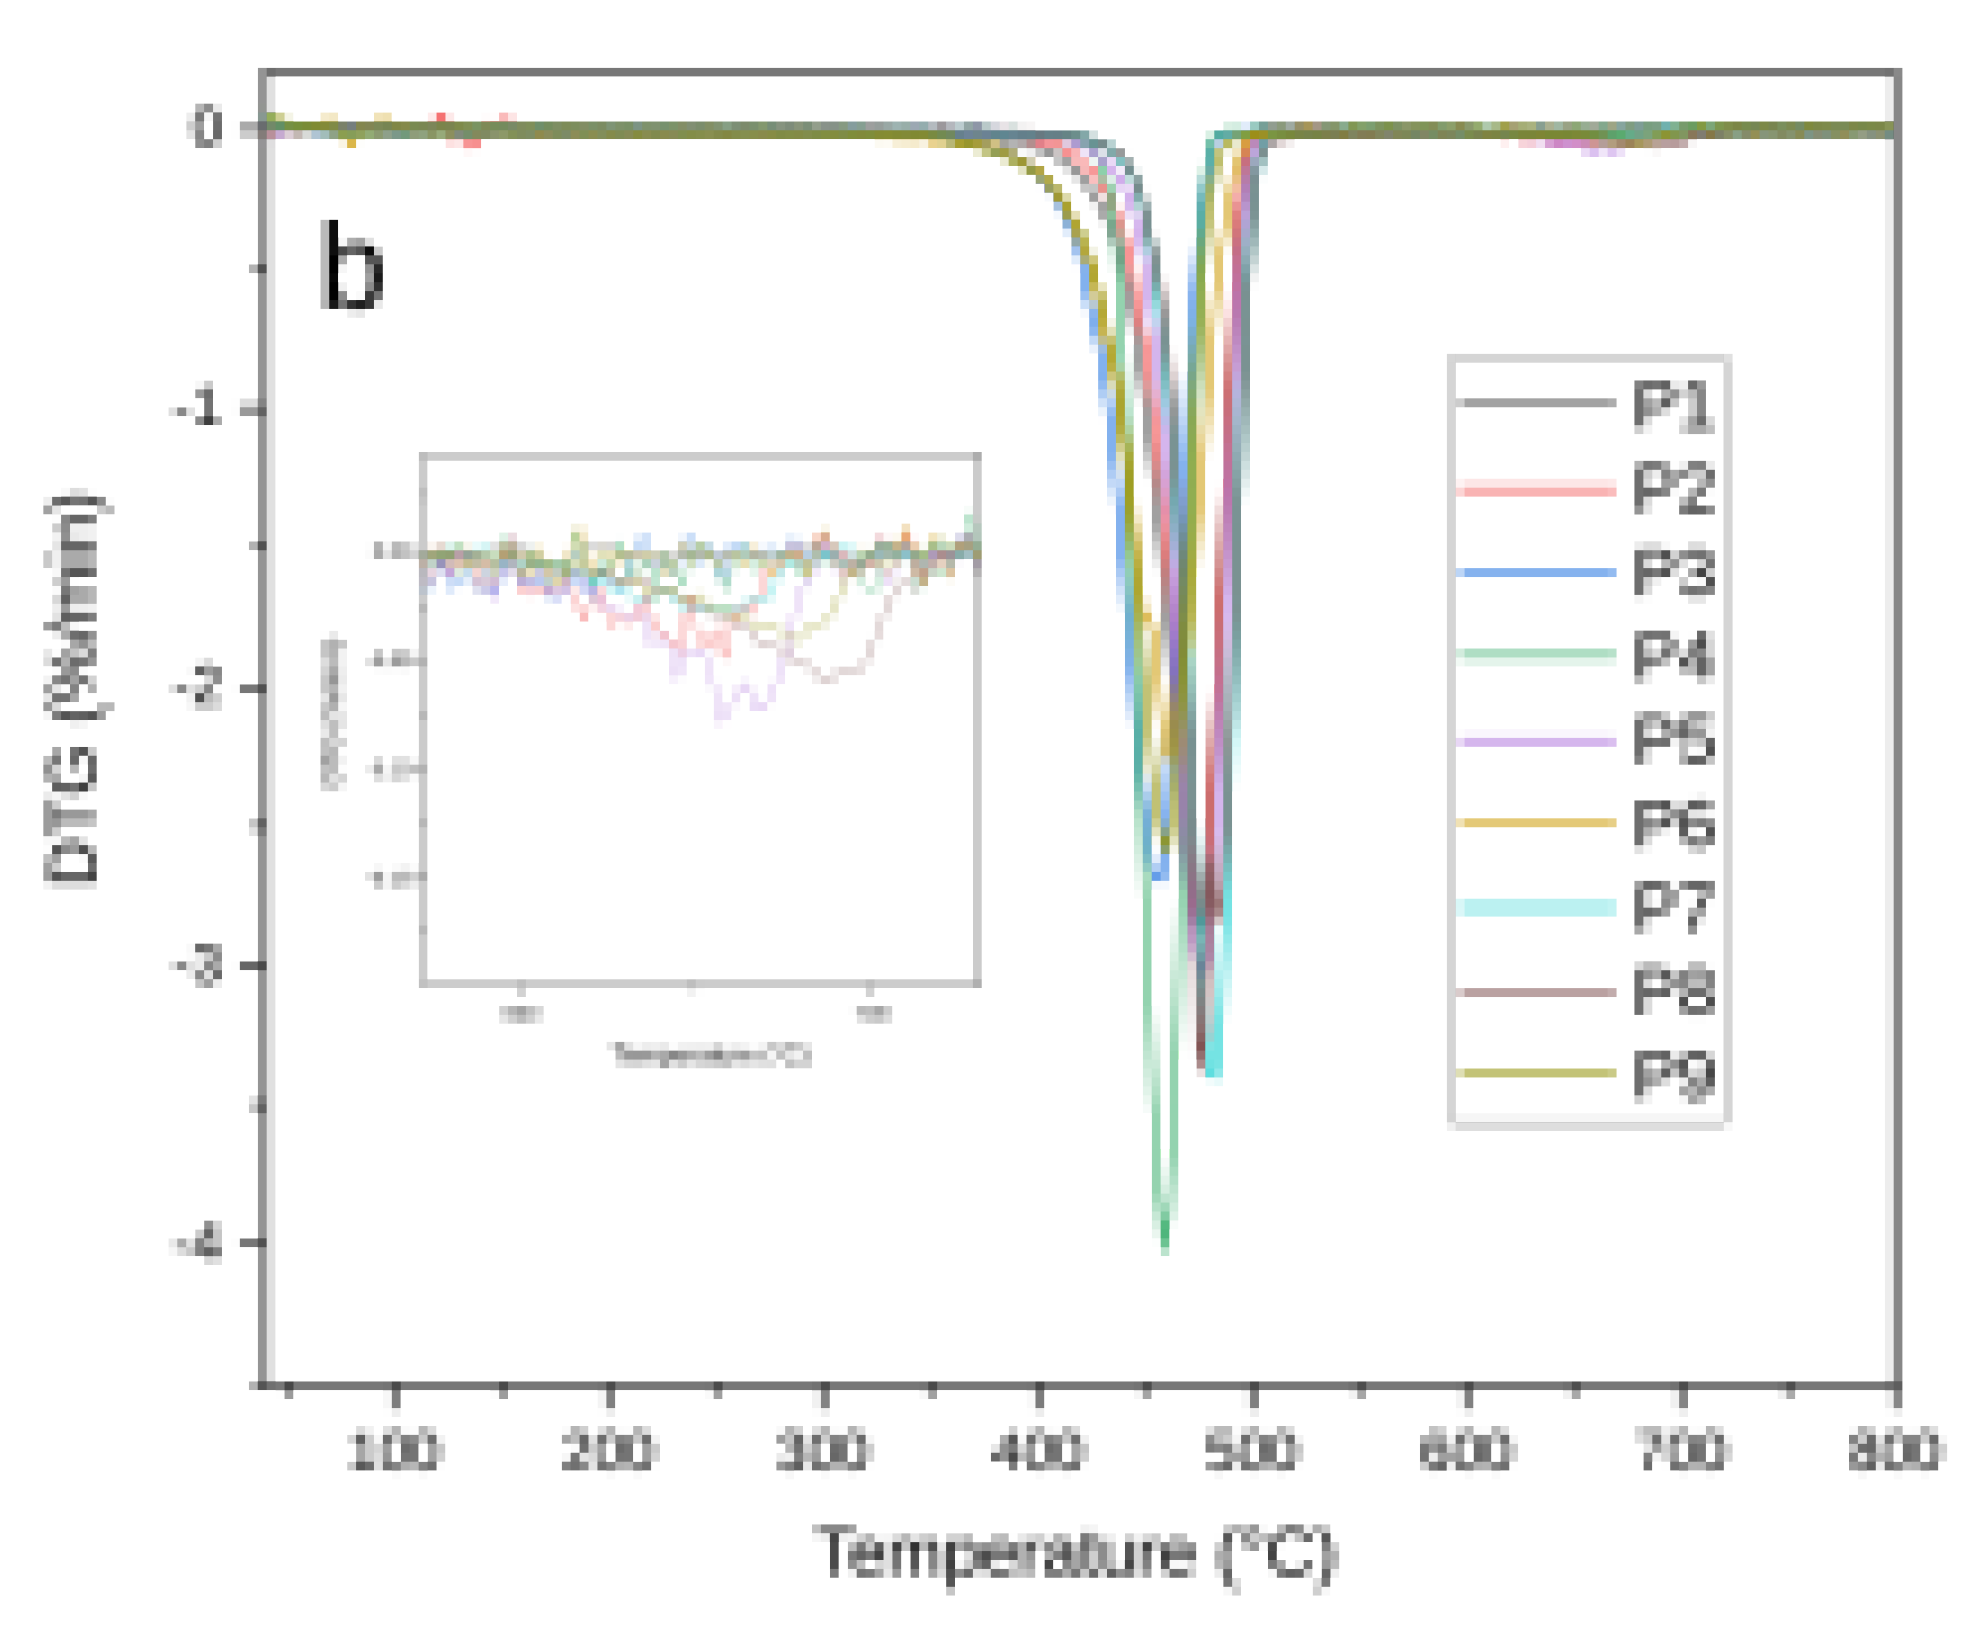
(a) Thermogravimetric analysis (TGA) curves of plastic waste samples P1–P9. Most samples exhibit a sharp single-step weight loss around 450–480 °C, typical of polyolefins. Samples P2, P5, and P8 show additional mass loss above 600 °C, indicating the presence of thermally stable fillers such as calcium carbonate. Residual mass varies, reflecting differences in inorganic content across samples; (b).DTG ) curves. Most samples exhibit a primary degradation peak between 450–480 °C, characteristic of polyolefins. Secondary mass-loss stages above 600 °C in samples such as P2, P5, and P8 indicate the presence of thermally stable fillers (e.g., CaCO₃). DTG profiles help resolve overlapping degradation events, confirming polymer purity or the presence of additives.
Figure 5.
(a) Thermogravimetric analysis (TGA) curves of plastic waste samples P1–P9. Most samples exhibit a sharp single-step weight loss around 450–480 °C, typical of polyolefins. Samples P2, P5, and P8 show additional mass loss above 600 °C, indicating the presence of thermally stable fillers such as calcium carbonate. Residual mass varies, reflecting differences in inorganic content across samples; (b).DTG ) curves. Most samples exhibit a primary degradation peak between 450–480 °C, characteristic of polyolefins. Secondary mass-loss stages above 600 °C in samples such as P2, P5, and P8 indicate the presence of thermally stable fillers (e.g., CaCO₃). DTG profiles help resolve overlapping degradation events, confirming polymer purity or the presence of additives.
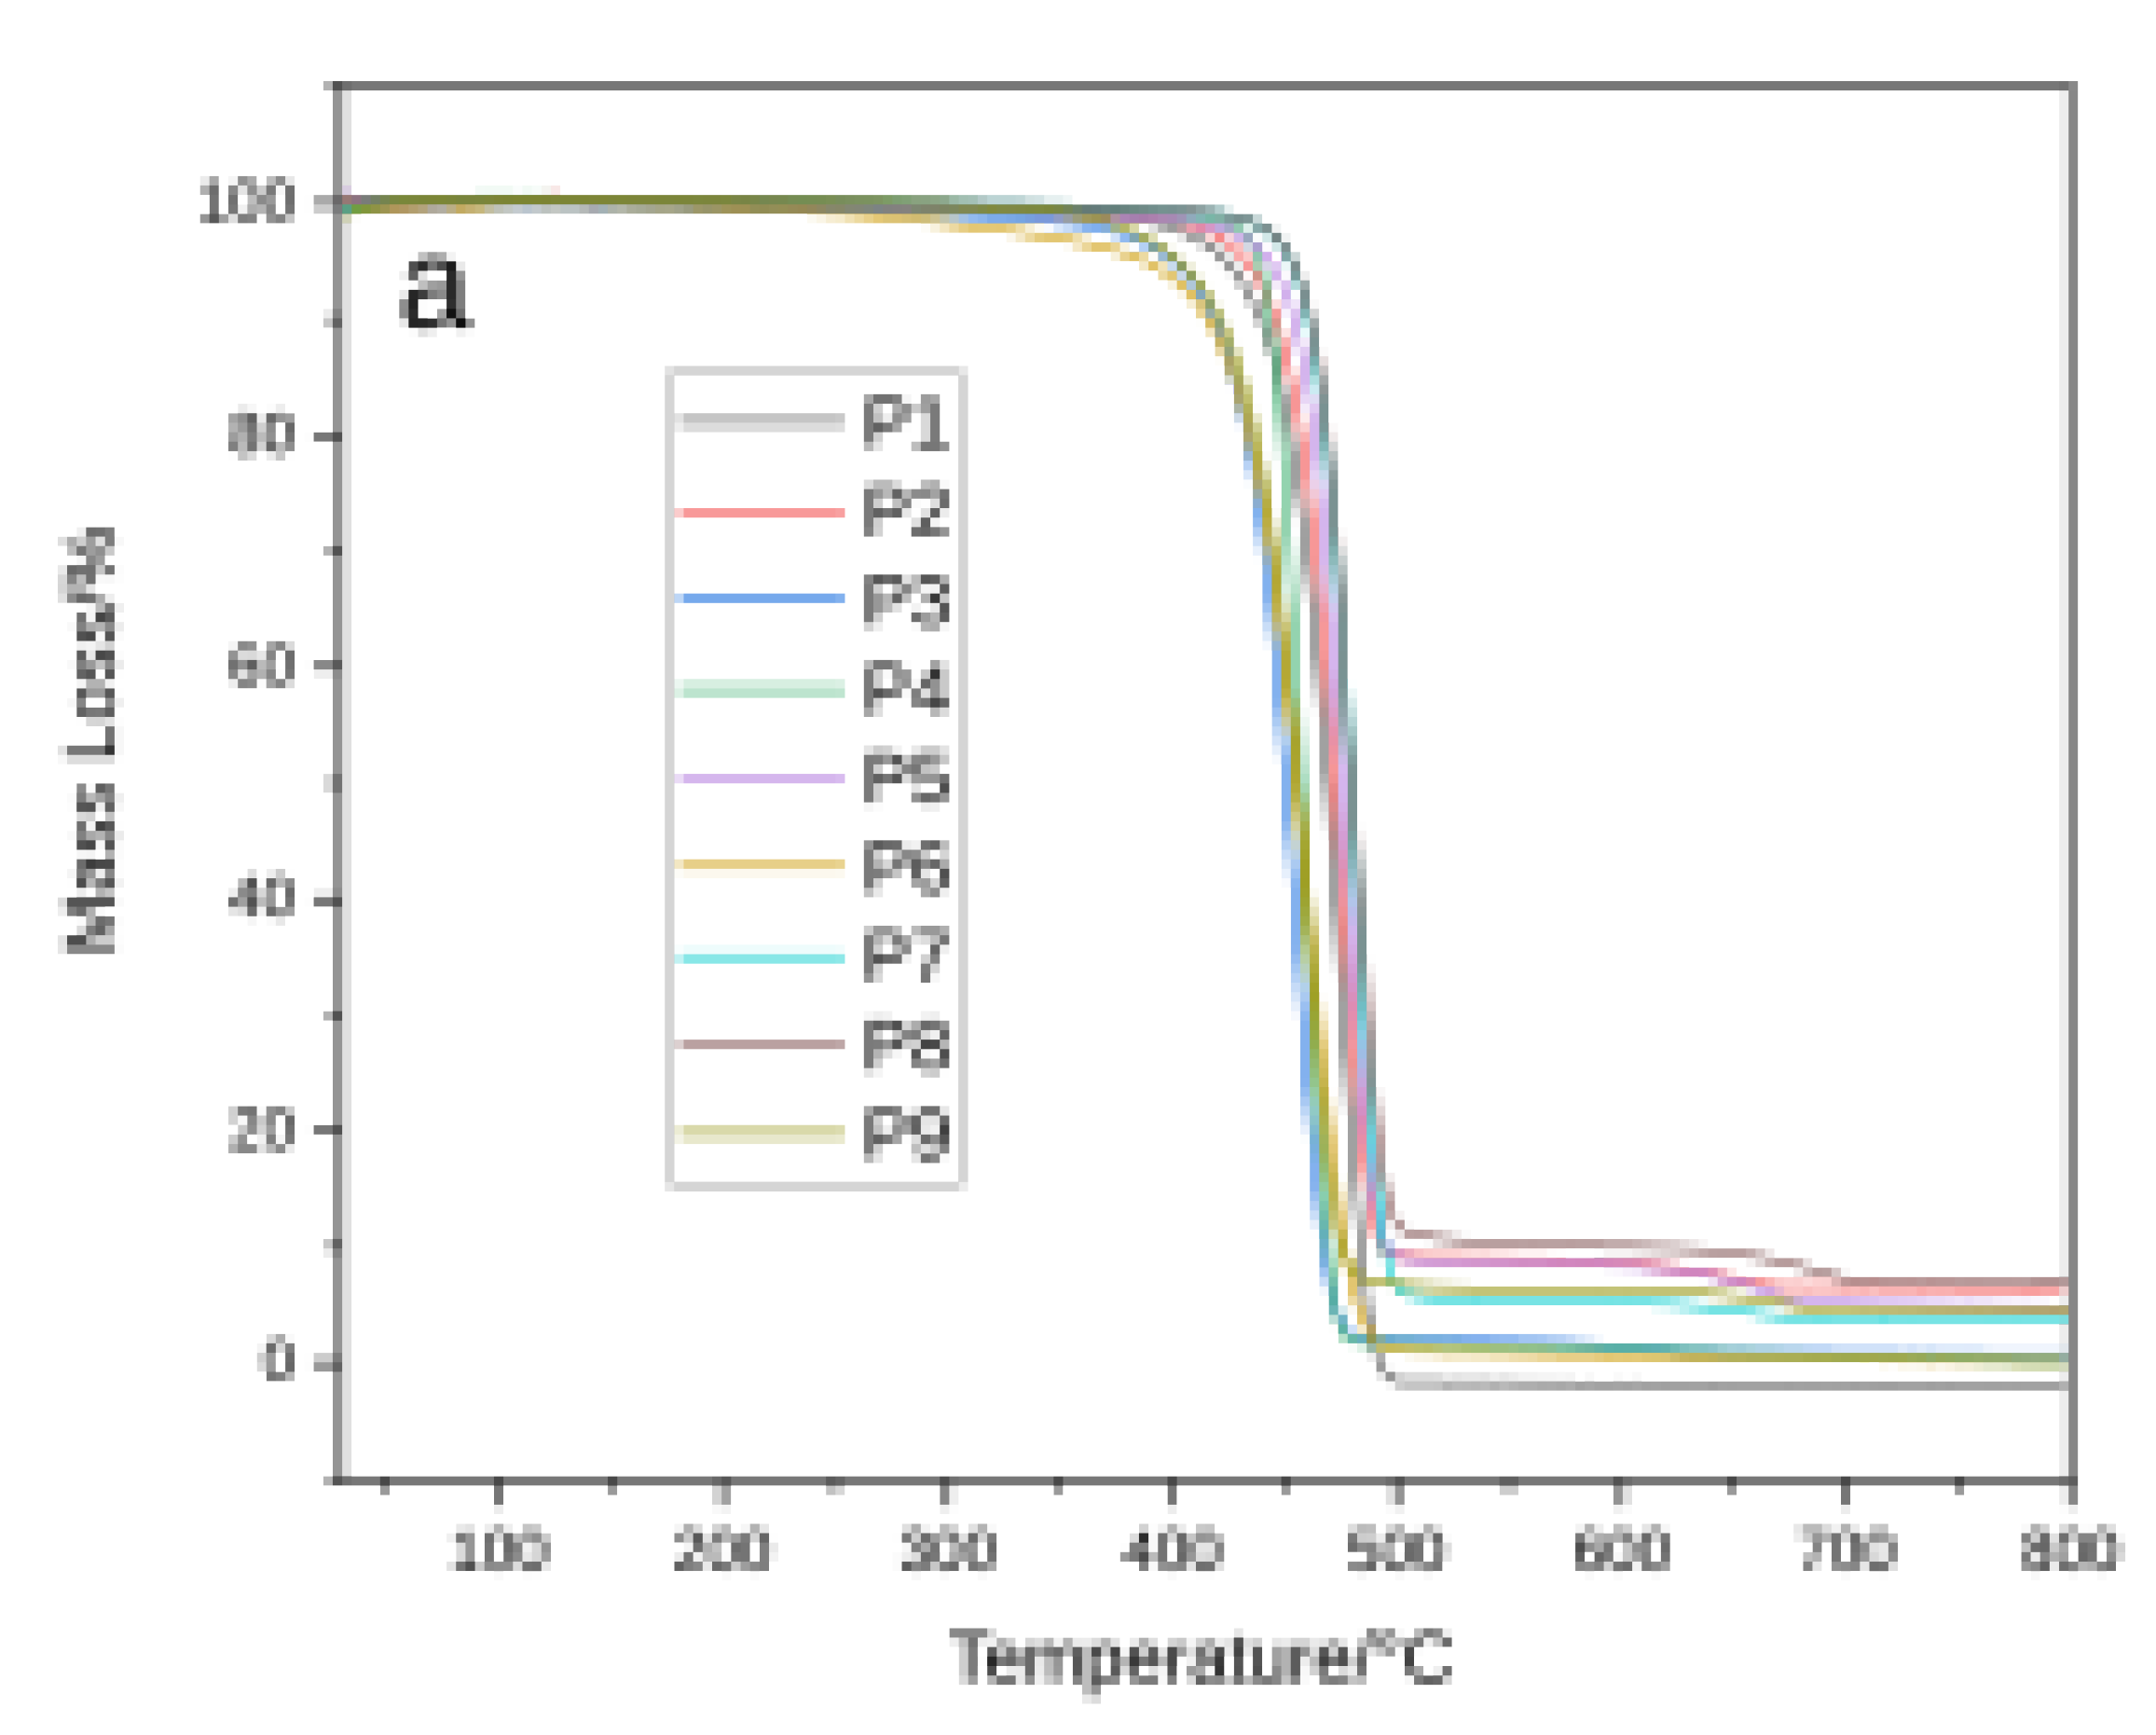
TGA results revealed two distinct thermal decomposition behaviors among the samples (Figure 5a, Table 1). Most “pure” polymer samples (P1, P3, P4, P6) undergo a single major mass-loss event starting around 350–400 °C and peaking at ≈450–480 °C, with nearly complete weight loss (~99%) and minimal residue. This one-step degradation indicates that those samples are essentially neat polyolefins with little inorganic content. In contrast, samples P2, P5, P7, P8, and P9 exhibit a second, smaller weight-loss stage at higher temperature (roughly 600–700 °C) accompanied by higher residue, pointing to the presence of thermally stable fillers/additives. In particular, P2 and P5 show pronounced secondary mass losses (~2–4% around 650–700 °C), correlating with significant inorganic filler content. Evolved gas analysis confirms that this high-temperature step is due to CaCO₃ filler decomposition, which releases CO₂[59]. (Calcium carbonate typically calcines in this range, yielding CO₂ and leaving CaO, consistent with the ≥5% ash residues in these samples.) By contrast, the one-step samples show no CO₂ release and leave <1% ash. The main decomposition temperatures for all samples (~450–480 °C Tmax) are in line with reported thermal stability ranges of polyolefins[60]. Notably, PP-rich samples tend to degrade at slightly lower temperatures (≈440–460 °C) than PE-rich ones (≈460–475 °C)[60], reflecting PP’s lower thermal stability due to its highly branched structure (tertiary C–C bonds cleave more readily)[61]. For example, the PP-based P3 shows a DTG peak ~458 °C, whereas HDPE-dominated P1 peaks ~475 °C; a mixed PP/PE sample like P6 falls in between (~462 °C).
The DTG profiles precisely identify the degradation rates and stages (see Figure 5b). For samples P1, P3, P4, and P6, the DTG curves show a single sharp peak corresponding to a one-step degradation, confirming that these are relatively pure polyolefins with minimal contamination or filler. On the other hand, P2, P5, P7, P8, and P9 exhibit multiple peaks in their DTG curves. The first DTG peak, occurring around 450 °C to 500 °C, represents the main polymer degradation, while a second, smaller peak around 600 °C to 700 °C aligns with the decomposition of fillers or additive residues. This secondary DTG peak is most pronounced in P5, P7, and P8, supporting the conclusion that these samples contain significant inorganic filler content. In summary, samples P1, P2, P4, and P8 are primarily HDPE (with P2 and P8 containing notable filler content and P1 and P4 having minor LDPE contamination). P3, P6, and P9 are mostly PP (with P9 containing filler and P6 showing a minor LDPE component). P5 and P7 are predominantly LDPE, with both samples containing fillers, particularly P5, which shows the highest filler content.
TG–MS Analysis of Evolved Gases (supplementary): To further investigate the decomposition behavior and evolved volatiles during heating, we performed thermogravimetry–mass spectrometry (TG–MS) on six representative samples (P1–P6) (see supplementary data) . In these experiments, each sample was heated from 30 °C to 800 °C at 10 °C/min under an argon atmosphere, while the attached mass spectrometer continuously monitored the evolved gases by tracking ion fragments in the m/z 2–128 range. This hyphenated technique directly links the mass loss events observed in TGA to specific gaseous products, complementing the TGA/DTG curves with molecular identification of the volatiles. Figure 8 shows the TG and DTG curves for P1–P6, highlighting their thermal decomposition profiles, and Figure 9 presents the evolution profiles of key ion fragments corresponding to major evolved gases. As shown in the TGA results, all six samples undergo their main decomposition between roughly 350 °C and 500 °C, but with slight shifts reflecting polymer type. PE-based samples P1 and P2 exhibit T_max around ~475 °C, whereas the PP-based samples P3 and P4 show a lower T_max around ~458 °C due to PP’s slightly lower thermal stability. Sample P5 (identified as LDPE) has a primary degradation peak at ~477 °C and, notably, a secondary weight-loss event at ~667 °C. This high-temperature event is attributable to filler decomposition, consistent with the CaCO₃ content indicated by its two-step TGA profile. Sample P6, a PP/PE blend, displays a decomposition peak at ~462 °C, intermediate between that of pure PP and PE, reflecting its mixed polymer composition. These TGA/DTG trends align with known decomposition ranges for PE and PP polymers.
TG–MS of representative samples (P1–P6) further elucidated the decomposition pathways by identifying key evolved gases. All samples released a suite of C₁–C₃ hydrocarbon volatiles upon heating, consistent with the random-chain scission of polyolefins[62]. However, the distribution of these fragments varied with polymer composition: PP-derived samples produced relatively more m/z 41 and 43 (propene and propane), whereas PE-rich samples generated higher m/z 28 and 29 signals (ethylene and ethane). These trends reflect polypropylene’s tendency to form C₃ fragments at its tertiary carbons versus polyethylene’s yield of C₂ fragments from random scission.
Importantly, the TG–MS data corroborate these thermal observations – for instance, the secondary weight-loss in P2 and P5 is accompanied by a surge in m/z 44 (CO₂) in the mass spectra, directly confirming the decomposition of CaCO₃ filler in those samples. Mass spectral analysis of the evolved gases reveals that all samples release a similar suite of low-molecular-weight compounds upon pyrolysis, with dominant ion fragments at m/z 2, 15, 18, 28, 29, 41, 43, and 44 corresponding to H₂, CH₄, H₂O, C₂H₄, C₂H₆, C₃H₆, C₃H₈, and CO₂, respectively. These are exactly the gases expected from the thermal cracking of polyolefins. The relative intensity of these fragments, however, varies with polymer composition. PE-rich samples (P1, P2, P5) produce higher signals for m/z 28 and 29, indicative of abundant ethylene and ethane evolution, whereas PP-rich samples (P3, P4) generate proportionally more m/z 41 and 43, attributable to propylene and propane. The mixed-polymer sample P6 emits all of the above fragments, essentially combining the PE and PP gas profiles with an overall fragment distribution centered around ~495 °C. Notably, m/z 44 (CO₂) appears as a distinct peak at high temperatures in the spectra of P2 and P5, confirming the thermal decomposition of CaCO₃ fillers via CO₂ release around ~690 °C. Likewise, m/z 18 (H₂O) is more pronounced in the evolved gas profile of the more oxidized sample P2, reflecting moisture release or the breakdown of oxygenated additives (i.e., NIAS) in that sample. The absence of significant m/z 64 or 81 signals (which could indicate chlorinated species like HCl or chlorobenzenes) in TG–MS suggests that chlorine-containing gases were either below detection or released at low levels (this is examined more directly via halogen analysis later). Overall, thermal analysis corroborated the FTIR/Raman polymer IDs, quantified filler content (via ash), and did not reveal unexpected materials (e.g., no sign of PET which would leave a char or distinct decomposition profile).
In sum, the integrated thermal analysis (DSC, TGA, DTG) coupled with evolved-gas analysis provides a comprehensive picture of each sample’s composition and thermal stability. These results validate the polymer identifications (PE vs PP) via their characteristic decomposition products and link secondary weight-loss events to inorganic fillers, information crucial for devising appropriate recycling strategies.
Table 2 summarizes the major ion signals detected from each sample alongside their chemical assignments and interpretations. Across all six samples, the primary pyrolysis products are small hydrocarbons (C₁–C₃ alkanes/alkenes) and minor amounts of H₂O and CO₂. The PE-derived samples show a clear emphasis on C₂ fragments, confirming their polyethylene makeup, whereas the PP-derived samples are characterized by a higher relative yield of C₃ fragments, confirming their polypropylene origin. The presence or absence of CO₂ in the TG–MS profile serves as a clear marker for inorganic carbonate fillers in the samples. Furthermore, the TG–MS results help distinguish subtle differences not evident from TGA alone – for instance, the elevated H₂O signal in P2 indicates absorbed moisture or degradation of additives, which correlates with that sample’s high O content from CHN analysis.

Table 2.
TG–MS evolved gas summary for selected plastic samples (P1–P6). Each sample’s dominant mass fragment ions are listed with their corresponding volatile species, and the interpretation relating to polymer identity and additives/fillers is provided.
Table 2.
TG–MS evolved gas summary for selected plastic samples (P1–P6). Each sample’s dominant mass fragment ions are listed with their corresponding volatile species, and the interpretation relating to polymer identity and additives/fillers is provided.
| Sample | Dominant m/z Fragments | Key Evolved Species (assignment) | Interpretation (Polymer Type & Additives) |
|---|---|---|---|
| P1 | 28, 29, 41, 43 | C₂H₄ (ethylene), C₂H₆ (ethane), C₃H₆ (propylene), C₃H₈ (propane) | Pure PE (HDPE/LDPE); typical C₂–C₃ hydrocarbon gases; no filler (no CO₂ detected). |
| P2 | 18, 28, 29, 41, 43, 44 | H₂O (water), C₂H₄, C₂H₆, C₃H₆, C₃H₈, CO₂ (carbon dioxide) | HDPE; usual PE pyrolysis volatiles plus CO₂ release from CaCO₃ filler and elevated H₂O from additives/aging (NIAS). |
| P3 | 28, 41, 43 | C₂H₄, C₃H₆, C₃H₈ | Polypropylene; dominated by C₃ hydrocarbons (propylene/propane); no filler or moisture evident. |
| P4 | 28, 41, 43 | C₂H₄, C₃H₆, C₃H₈ | Polypropylene (similar to P3); mainly C₃ pyrolysis products; no filler present. |
| P5 | 28, 29, 41, 43, 44 | C₂H₄, C₂H₆, C₃H₆, C₃H₈, CO₂ | LDPE (with minor HDPE); typical PE volatiles plus CO₂ from significant CaCO₃ filler. |
| P6 | 28, 29, 41, 43 | C₂H₄, C₂H₆, C₃H₆, C₃H₈ | Mixed PE/PP; emits both C₂ and C₃ fragments consistent with a PE–PP blend; no notable CO₂ (minimal filler). |
Overall, the integration of TG–MS with conventional DSC/TGA analysis provides a more complete thermal characterization of the plastic waste samples. This combined approach offers molecular-level insight into the thermal decomposition pathways of the samples, complementing the detailed compound analysis from Py–GC×GC–TOF–MS and supporting the development of appropriate recycling and safety strategies (reported in companion paper 2).
Molecular Weight Distribution (GPC Analysis). The results (Table 3) show notable differences in peak (Mp), number-average (Mn), and weight-average (Mw) molecular weights across samples. Samples P3 and P4 (PP-rich) exhibited the highest Mn values (76,526 and 56,685 g/mol, respectively), indicating preserved chain integrity and minimal degradation, consistent with their FTIR spectra (absence of oxidation bands) and clean, single-stage TGA profiles. In contrast, P5 showed the lowest Mn (43,309 g/mol) and Mw (235,918 g/mol), aligning with evidence of oxidation (carbonyl peaks in FTIR), CaCO₃ filler (CO₂ evolution in TG–MS), and multi-stage thermal degradation. The relatively low Mn values of P1, P2, and P6 also suggest mild oxidative degradation or mixed chain populations. Overall, the GPC data reinforces the thermal and spectroscopic findings, providing molecular-level evidence for processing history and recyclability: samples with higher molecular weights and narrow distributions (e.g., P3, P4) are better suited for mechanical recycling, while degraded or blended samples (e.g., P5, P6) may require pretreatment or chemical recycling routes.
The integrated summary in Table 4 provides a multi-dimensional profile of each plastic waste sample (P1–P9), combining spectroscopic signatures (FTIR, Raman), thermal behavior (DSC, TGA, TG–MS), and compositional indicators (ash content, CO₂ evolution) to infer both material identity and likely origin. Samples classified as post-industrial (P1, P3, P4) show single-polymer composition (HDPE or PP), minimal oxidation or filler content, and nearly complete volatilization during thermal analysis—features consistent with clean production scrap. In contrast, post-consumer samples (P2, P5, P6) exhibit signs of environmental aging (e.g., carbonyl bands, increased O content), two-stage decomposition profiles, and CaCO₃-related CO₂ evolution—indicative of packaging films or containers exposed to use and weathering. Post-commercial samples (P7–P9) display moderate contamination and polymer blends, with slightly elevated ash content and minor oxidation, suggesting their origin from heterogeneous waste streams like retail packaging, liners, or industrial wrap. This combined analytical approach enables not only accurate polymer identification but also reconstructs the usage and contamination history of the samples, essential for determining their appropriate recycling route.
3.3. Comprehensive elemental, trace metal, and halogen profiling
The proximate and ultimate analyses provide a comprehensive picture of plastic composition and thermal behavior. While proximate analysis assesses moisture, volatile matter, fixed carbon, and ash—critical indicators of how materials behave under heat—ultimate analysis focuses on elemental composition (C, H, N, O), which informs energy content and emission potential. Together, these datasets help determine recyclability, environmental impact, and suitability for thermal processing such as pyrolysis or incineration.
Table 5.
Proximate analysis of plastics. (aND: None detected, detect limitation of N is 0.1%.).
| Plastics | Proximate analysis (wt%) Proximate analysis (wt%) Proximate analysis (wt%) Proximate analysis (wt%) |
|||
|---|---|---|---|---|
| Plastics | Moisture | Volatile matter | Fixed Carbon | Ash |
| P1 | 0.07 | 99.41 | 0.02 | 0.50 |
| P2 | 0.12 | 93.29 | 0.01 | 6.58 |
| P3 | 0.05 | 96.80 | 0.93 | 2.22 |
| P4 | 0.07 | 98.92 | 0.90 | 0.11 |
| P5 | 0.07 | 89.38 | 0.34 | 10.21 |
| P6 | 0.13 | 97.00 | 0.99 | 1.88 |
| P7 | 0.06 | 96.10 | 1.01 | 2.83 |
| P8 | 0.02 | 92.62 | 2.70 | 4.66 |
| P9 | 0.20 | 95.58 | 0.95 | 3.37 |
Proximate Analysis
As evident from (see 5 ), all samples exhibit low moisture content, ranging from 0.02% (P8) to 0.20% (P9), indicating minimal water retention, which is ideal for high-temperature processes such as pyrolysis or incineration, as it reduces the energy needed for drying. These samples were already treated with mechanical recycling, and drying was part of the process. Most samples display very high volatile matter content, with P1 (99.41%), P4 (98.92%), and P6 (97.00%) being particularly high. This suggests that these plastics decompose primarily into volatile products during thermal processing, leaving little solid residue. Fixed carbon content is generally low, with the highest observed in P8 (2.70%). Fixed carbon represents the solid residue left after volatile matter is driven off, and low values indicate that most carbon will be converted to volatile compounds with minimal char formation. Samples P5 (10.21%), P2 (6.58%), and P8 (4.66%) exhibit relatively higher ash content, indicating the presence of inorganic fillers or contaminants. Higher ash content can pose challenges in recycling and energy recovery, leaving more solid residue after thermal degradation, requiring additional disposal or handling.
Ultimate analysis
Table ). All samples show high carbon content, ranging from 79.80% (P8) to 86.04% (P4), typical for plastics and indicative of high energy value, making them suitable for energy recovery processes like pyrolysis or incineration. Hydrogen content ranges from 12.68% (P2) to 14.03% (P1 and P7), contributing to the high calorific value of the plastics supporting their use in fuel generation. Nitrogen was either not detected or found in trace amounts (e.g., P7, P8, and P9), suggesting these plastics are unlikely to produce significant nitrogenous pollutants such as NOx during combustion or pyrolysis. Oxygen content is relatively low, ranging from 0.61% (P4) to 2.85% (P8), which is consistent with the presence of polyolefins like Polyethylene (PE) and Polypropylene (PP), primarily composed of carbon and hydrogen. Higher oxygen content in some samples may indicate minor oxidation or the presence of oxygen-containing additives or fillers.
Table 6.
Ultimate analysis of plastics. (AND: None detected, detect limitation of N is 0.1%.).
| Plastics | Ultimate analysis (wt%) Ultimate analysis (wt%) Ultimate analysis (wt%) Ultimate analysis (wt%) Ultimate analysis (wt%) |
||||
|---|---|---|---|---|---|
| Plastics | C | H | N | O | Total |
| P1 | 85.90 | 14.03 | NDa | 1.23 | 101.16 |
| P2 | 79.90 | 12.68 | ND | 1.46 | 94.05 |
| P3 | 84.20 | 13.43 | ND | 0.92 | 98.55 |
| P4 | 86.04 | 13.66 | ND | 0.61 | 100.31 |
| P5 | 84.03 | 13.15 | ND | 1.37 | 98.55 |
| P6 | 84.71 | 13.36 | ND | 0.82 | 98.88 |
| P7 | 82.92 | 14.03 | 0.14 | 1.52 | 98.60 |
| P8 | 79.80 | 13.23 | 0.14 | 2.85 | 96.02 |
| P9 | 82.57 | 13.94 | 0.11 | 2.00 | 98.63 |
Overall, samples P1, P4, and P6—characterized by high volatiles, low ash, and low fixed carbon—are ideal candidates for pyrolysis, producing mainly liquid and gas with minimal residue. In contrast, P2, P5, and P8 contain higher ash and would require additional handling or pretreatment. The low nitrogen and oxygen contents across most samples suggest high energy yield and low emissions risk. Samples P8 and P9, which show slightly higher oxygen and ash levels, may contain fillers or additives that affect recyclability but remain within manageable limits.
ICP-OES
Additives that include stabilizers, plasticizers, or pigments may contain metals that could be identified using specific metal detection techniques like ICP-OES or XRF. Integrating these findings with the polymer types established via Raman, FTIR, and DSC analysis can help predict the behavior of these plastics in recycling streams and ensure the quality of the resulting recycled material. The ICP-OES (see Table 7) results provides a comprehensive view of the elemental composition of metals and other critical elements in plastic samples P1 to P9, revealing important insights into their recyclability. It highlights elements like calcium, iron, sodium, potassium, copper, and lead while identifying differences in detecting elements such as barium, chlorine, aluminum, and silicon. These elements, found in varying concentrations, directly influence the suitability of the samples for different recycling processes.
High calcium content in samples P2, P5, P7, P8, and P9 is detected. This indicates calcium carbonate fillers. Similarly, it identifies significant iron content in samples P3, P5, P7, P8, and P9, which points to potential contamination from industrial processes or metal-based additives. Iron complicates mechanical recycling, as it can affect the quality of the recycled product and cause damage to processing equipment. Iron would remain in the residual ash in thermal recycling, but its impact on plastic degradation needs further investigation.
The detection of sodium and potassium in samples such as P2, P3, and P8 suggests contamination from salts or other additives introduced during post-consumer use or processing. These elements can influence the melting behavior of plastics, potentially affecting the quality of the material in mechanical recycling processes. Elevated sodium levels can also lead to corrosion issues in equipment used for thermal recycling. In addition, it detected lead and copper in specific samples, raising concerns about the environmental risks these toxic metals pose during recycling. Their presence indicates contamination, possibly from electronic waste or industrial handling, and they may require special handling to prevent harmful emissions during incineration or pyrolysis.
Aluminum-based additives are often used in plastics, and while aluminum is less problematic for thermal recycling, its presence can interfere with mechanical recycling by reducing the quality of the plastic. Titanium dioxide (TiO₂) and silicon-based fillers, identified in both analyses, are commonly used to enhance plastic properties but also contribute to increased ash content during thermal processes, further complicating residue management.
The samples did not detect arsenic, cadmium, lead, antimony, or tin. The absence of these elements suggests that specific additives containing these metals were not incorporated into the materials. For example, the non-detection of cadmium and lead aligns with eliminating cadmium-based and lead-based pigments and stabilizers, which are being phased out due to their significant health and environmental risks. Similarly, the lack of tin indicates that organotin stabilizers, commonly used in PVC, were likely not employed, suggesting the use of safer alternatives. The absence of antimony, a common component in flame retardants like antimony trioxide, suggests that non-antimony-based flame retardants may have been used if any were incorporated.
Additionally, no detection of arsenic points to the exclusion of older wood preservatives and insecticides that contain the element. These results likely reflect compliance with stringent regulatory standards such as RoHS (Restriction of Hazardous Substances) and REACH (Registration, Evaluation, Authorisation and Restriction of Chemicals), which limit the use of hazardous substances in manufacturing. This suggests that the plastic samples analyzed align with more health-conscious and environmentally friendly production practices.
Halogen Analysis (CIC)
A dedicated halogen analysis of samples P1–P9 was conducted via combustion ion chromatography to quantify total fluorine (F), chlorine (Cl), bromine (Br), and iodine (I). Table 8 summarizes the halogen concentrations. These elements are crucial to evaluate because halogens, even at low levels, can significantly impact recyclability and environmental safety.
The results show that fluorine was below detection (< 10 ppm) in all samples, indicating no significant presence of fluoropolymers (e.g., PTFE) or fluorinated additives. Bromine was also not detected in any sample, which is an important finding: it suggests that brominated flame retardants (common in electronics and some textiles) are absent or < ~5 ppm. This is consistent with our earlier observation that none of the samples were e-waste plastics (also supported by FTIR/Raman, which showed no brominated polymer signatures, and by the low Br in XRF). The absence of bromine means the risk of brominated dioxin/furan formation during thermal processing is minimal, and it obviates the need for BFR-specific management strategies in these particular wastes.
Chlorine, however, was present in multiple samples. Ion chromatography revealed measurable chloride in P1 (~0.05 wt% Cl, or 500 ppm) despite P1 being a predominantly industrial HDPE sample – this was an unexpected but important result, suggesting a trace PVC or chlorinated contaminant in P1. More significantly, P2, P3, P4, P7, P8, and P9 all contained higher chlorine levels, ranging from a tens to a few hundred ppm (consistent with the XRF finding Cl). These chlorine levels clearly point to small inclusions of PVC plastic or chlorinated additives/adhesives in those mixed streams. For instance, P2 (post-consumer HDPE) might include residual PVC packaging or labels; P7, P8 (post-consumer films) could contain traces of PVDC cling film or chlorinated flame retardants; P3, P4, P9 (PP-rich) might have minor PVC or chlorinated polypropylene from specific products. Notably, P1’s chlorine detection is “remarkable” in context – as a clean industrial sample, one would expect near-zero Cl, yet ~0.05% Cl was found. This likely comes from a small PVC fragment or chlorine-based additive inadvertently mixed into P1’s batch, underscoring that even well-sorted industrial scrap can harbor problematic contaminants.
Iodine (I) was not detected in any sample, and if present, it is below ~1 ppm. Iodine-containing plastics are rare (some specialized medical polymers or additives use iodine), so this result is not surprising.
From a recyclability standpoint, chlorine is the primary halogen of concern in these samples. Chlorine at the levels found (0.05% up to ~1%) can have several detrimental effects. In mechanical recycling, even a fraction of a percent of PVC can ruin batches of polyolefins by causing discoloration and release of HCl at processing temperatures ~180–240 °C. In pyrolysis or incineration, chlorine will form HCl gas and can catalyze the formation of dioxins and furans if not managed[63]. Indeed, studies show that just a few hundred ppm of chlorine in feedstock can yield oils with organochlorine levels that make them unsuitable for use without further refining[64,65]. Our data confirm the need for dechlorination steps or strict PVC removal before thermal recycling of these wastes. For example, P1, though mostly clean HDPE, should have that trace PVC removed (e.g., via density separation) before processing. The lack of Br suggests these wastes won’t produce brominated dioxins under thermal treatment, and no special bromine scrubbing will be needed in pyrolysis flue gases. This is fortunate, as brominated flame retardants require more complex handling (their absence indicates our samples are primarily packaging, not electronic plastics).
In conclusion, the halogen analysis indicates that chlorine contamination is the foremost concern among halogens for this set of samples. Multiple samples contain chlorine in amounts that could significantly affect recycling processes. Fluorine, bromine, and iodine are effectively absent, which simplifies the hazard profile (no concern of PFAS or BFRs here). To safely recycle these materials, any chlorine-rich pieces (e.g., PVC fragments) should be removed or neutralized. Thermal processes must be equipped with acid gas scrubbers and perhaps catalytic baghouses to destroy any chlorinated organics formed. Mechanical recycling should avoid blending high-Cl fractions into new products that aren’t designed to tolerate chlorine. These findings underscore the need for stringent sorting (to eliminate PVC) and possibly chemical dechlorination treatments for streams like P1 or P7–P9 if they are destined for pyrolysis. By addressing chlorine proactively, we can prevent corrosion of equipment and formation of toxic byproducts, thereby ensuring that recycling these mixed wastes is both effective and environmentally responsible.
Table 3.
Halogen concentrations in the waste plastic samples.
| Sample | F (ppm) | Cl (ppm) | Br (ppm) | I (ppm) | |||||
|---|---|---|---|---|---|---|---|---|---|
| P1 | ND. | 488.14 | ND. | ND. | |||||
| P2# | ND. | ND. | ND. | ND. | |||||
| P3 | ND. | 120.94 | ND. | ND. | |||||
| P4 | ND. | 189.52 | ND. | ND. | |||||
| P5 | ND. | 67.57 | ND. | ND. | |||||
| P6 | ND. | 47.30 | ND. | ND. | |||||
| P7 | ND. | 179.36 | ND. | ND. | |||||
| P8 | ND. | 116.94 | ND. | ND. | |||||
| P9 | ND. | 62.41 | ND. | ND. | |||||
|
#P2 sample was not enough for this analysis. Hence no result. #P2 sample was not enough for this analysis. Hence no result. #P2 sample was not enough for this analysis. Hence no result. #P2 sample was not enough for this analysis. Hence no result. #P2 sample was not enough for this analysis. Hence no result. #P2 sample was not enough for this analysis. Hence no result. #P2 sample was not enough for this analysis. Hence no result. #P2 sample was not enough for this analysis. Hence no result. #P2 sample was not enough for this analysis. Hence no result. #P2 sample was not enough for this analysis. Hence no result. | |||||||||
| Detect limitation: 1ppm Detect limitation: 1ppm Detect limitation: 1ppm |
|||||||||
| ND less than 1ppm ND less than 1ppm ND less than 1ppm |
|||||||||
Elemental Signatures and Potential Sources in Plastic Waste Samples
This table presents a detailed overview of inorganic elements detected across the plastic waste samples (P1–P9) and their likely sources. Many of these elements are introduced intentionally as part of additives, stabilizers, pigments, or flame retardants, while others result from cross-contamination during usage, environmental exposure, or recycling processes. Common elements like calcium, zinc, titanium, and silicon reflect widespread use of fillers and stabilizers, whereas trace metals such as copper, lead, and vanadium may derive from pigments, e-waste, or fossil fuel residues. The detection of chlorine in multiple samples highlights the risk of PVC contamination or chlorinated additives. Rare earth and transition elements like niobium, ruthenium, and zirconium likely originate from electronics or specialized coatings. Understanding these elemental profiles is essential for identifying contaminant sources and informing safe, tailored recycling or pretreatment strategies.
Table 4.
Detected inorganic elements and their likely sources in plastic waste samples P1–P9. This information helps trace material provenance and informs pre-treatment and recycling strategies to manage legacy contaminants and improve process safety and product quality.
Table 4.
Detected inorganic elements and their likely sources in plastic waste samples P1–P9. This information helps trace material provenance and informs pre-treatment and recycling strategies to manage legacy contaminants and improve process safety and product quality.
| Element | Detected in Samples | Source Description |
|---|---|---|
| Al (Aluminum) | P1–P6 | Commonly present from aluminum foil layers in plastic packaging (metalized films or laminate foils used as food packaging)[66]. Aluminum-based additives are also sometimes used in polymers.[67] |
| Ca (Calcium) | P1–P5 | Frequently found as filler or stabilizer in plastics. For example, calcium carbonate (CaCO₃) is a common filler to improve mechanical properties and reduce cost, and calcium compounds (like calcium stearate) serve as PVC heat stabilizers[23,68,69]. |
| Cl (Chlorine) | P3, P4, P6 | Largely originates from PVC plastic and chlorinated additives. Polyvinyl chloride contains about 56–67% chlorine by weight, making chlorine a major component of PVC polymers[65]. Chlorinated flame retardants or plasticizers can also introduce chlorine into plastic waste. |
| Cu (Copper) | P1, P4, P6 | Often detected due to copper-based pigments and electrical components. For instance, copper phthalocyanine is a widely used blue/green pigment in plastics[70], and shredded e-waste plastics may contain embedded copper wiring or circuitry[71]. |
| Fe (Iron) | P1–P6 | Common from iron oxide pigments and steel wear debris. Iron oxides (e.g. Fe₂O₃) are used as color pigments (red, brown, black) in plastic products[72]. Additionally, metal particles from machinery (e.g. shredder or extruder wear) can contribute iron contamination in recycled plastics[73]. |
| K (Potassium) | P2, P3 | Potassium in plastic waste is often a residue from fertilizers or organic matter like MSW and sludge[74]. Plastic packaging used for potash or other K-containing fertilizers can carry fertilizer dust, and agricultural plastics contaminated with soil/manure may contain potassium from those sources[75]. |
| Mg (Magnesium) | P1, P3–P6 | Magnesium compounds are added to plastics as stabilizers and flame retardants. For example, magnesium hydroxide (Mg(OH)₂) is a common halogen-free flame retardant in polyolefin cables and plastics[76], and magnesium stearate is used as a lubricant/stabilizer in polymer processing[77] and as food additive[78]. |
| Na (Sodium) | P1–P6 | Sodium in plastic samples often comes from salt or other sodium-containing residues. Sea plastics can be encrusted with sodium chloride, and food packaging (e.g. for salty foods or brine) may leave Na deposits[79]. Sodium compounds are also used in some additives (e.g. sodium-based stabilizers or blowing agents). |
| Nb (Niobium) | P2 | Niobium is a less common element in plastics, but it can appear from electronic components. Niobium is used in some electronic capacitors (as a substitute for tantalum) and specialty alloys, so e-waste plastics or wiring can introduce niobium contaminants[80]. |
| P (Phosphorus) | P1–P6 | Widely present due to organophosphate additives. Phosphorus-based flame retardants and plasticizers are common – for example, tris(phenyl) phosphate (TPP) is used as a flame-retardant plasticizer in PVC and engineering plastics. Other phosphorous flame retardants (e.g. aryl phosphates, red phosphorus) are added to plastics to improve fire resistance[81]. |
| Ru (Ruthenium) | P3, P5 | Rarely present except via catalyst residues. Ruthenium is used as an industrial catalyst in certain chemical and polymer processes. For instance, Ru-based catalysts are employed in advanced plastic upcycling and hydrogenation (e.g. Ru/TiO₂ catalyzes polypropylene breakdown to hydrocarbons)[82]. Trace Ru in plastic waste may indicate residual catalyst contamination from such processes. |
| S (Sulfur) | P1, P3–P6 | Sulfur is found in plastics from both pigments and additives[83]. Certain inorganic pigments (like cadmium sulfide yellow or zinc sulfide in lithopone white) contain sulfur, and many rubber/plastic products are vulcanized with sulfur. Sulfur-based flame retardants and antioxidant additives (e.g. thioethers) also leave sulfur residues[53]. |
| Si (Silicon) | P1–P6 | Indicates silica-based fillers or silicone residues[84]. Silicon additives appear as fillers (e.g. talc is a Mg–silicate, and fumed silica is used to reinforce plastics) and in sealants/adhesives (silicone rubbers) present in plastic assemblies. X-ray analysis often finds silicon-based fillers added to improve plastic strength. |
| Sn (Tin) | P1 | Primarily from organotin stabilizers in PVC. Organotin compounds (like tributyltin and dibutyltin dilaurate) have been used as heat stabilizers in vinyl plastics[85]. The detection of Sn in plastic usually signals the presence of these PVC stabilizers. (Tin may also come from solder or metal foil contamination, but in polymers it’s chiefly from additives.) |
| Sr (Strontium) | P7, P8, P9 | Strontium (Sr) found in plastic waste likely originates from industrial contamination, recycled fillers, or pigments. Common sources include coal combustion residues, ceramics, and glass manufacturing, where Sr is used as a functional additive or colorant. Typically, found in MSW. |
| Ti (Titanium) | P2, P4–P6 | Titanium in plastics is mainly from titanium dioxide (TiO₂) pigment and UV stabilizers[86]. TiO₂ is the dominant white pigment in plastics, added for color and UV protection. It is routinely identified as a filler in plastic waste analyses. Other Ti additives (like organotitanate coupling agents) are also used for UV stabilization[87]. |
| V (Vanadium) | P3, P5 | Vanadium tends to enter plastics via hydrocarbon residues. Heavy fuel oils and lubricants contain vanadium (a trace element in crude oil), so plastic debris tainted with bunker fuel or engine oil can show V contamination[88,89]. Historically, some Ziegler-Natta polymerization catalysts used vanadium, but the most common pathway in waste is fuel/oil staining[90]. |
| Zn (Zinc) | P1–P6 | Ubiquitous in plastics as a stabilizer and pigment component. Zinc compounds (like zinc stearate and zinc oxide) are used as heat stabilizers in PVC and as UV absorbers[91]. Zinc oxide and sulfide appear in white pigments and fillers (e.g. lithopone = ZnS·BaSO₄)[92]. As a result, Zn is commonly detected in plastic waste elemental analyses. |
| Zr (Zirconium) | P2 | Typically comes from ceramic or coating contaminants. Zirconium-based compounds are used in ceramic materials and also as paint/ink additives. For example, zirconium chemicals in printing inks promote adhesion and heat resistance – printed plastic packaging or ceramic dust can thus introduce Zr[93]. It is not a deliberate plastic ingredient but enters via these contamination pathways. |
4. Discussion and Recycling Recommendations
Overall, our comprehensive characterization reveals clear differences between the post-consumer versus post-industrial derived samples, as well as commonalities that inform recycling decisions. The post-consumer heavy samples (P2, P5, P6, P7, P8) are characterized by higher levels of contamination, including inorganic fillers, mixed polymer types, and slight oxidation/degradation, relative to the post-industrial samples (P1, P3, P4), which are more uniform and cleaner. This finding is in line with expectations: waste from consumer streams is harder to recycle due to dirt, additives, and unknown usage history. However, even the ostensibly clean industrial samples showed a degree of cross-contamination (e.g., the PVC trace in P1), highlighting that strict sorting and quality control are crucial for all feedstocks.
On a positive note, none of the samples showed extreme levels of hazardous additives like brominated flame retardants (BFRs) or other persistent organic pollutants. Bromine was undetected in all samples, indicating these wastes are primarily packaging materials rather than electronics or automotive shredder residue. This is encouraging because it means we likely avoid issues like brominated dioxin formation or the need for special BFR removal processes in recycling. The dominant polymers across all samples are polyolefins (PE and PP), which is fortunate from a recycling standpoint. These polymers, when free of contaminants, can be readily mechanically recycled or converted via pyrolysis into hydrocarbon products akin to refinery fuels. They do not inherently introduce toxic elements upon heating (as long as external contaminants like PVC are absent). In fact, our small-scale pyrolysis GC–MS (Part II) confirms that P1–P6 yield mostly aliphatic hydrocarbons, consistent with prior studies of polyolefin pyrolysis oils. Such oils are suitable as fuel or feedstock after appropriate refining. One point to watch is the presence of olefins in those oils – literature warns that high olefin content can cause gum formation and may require mild hydrogenation for stability [65]. This suggests that while chemical recycling of these samples is feasible, some downstream upgrading might be necessary for the liquid products.
Based on the specific contamination profiles and polymer compositions we determined, each waste plastic sample (or group of similar samples) requires a tailored recycling approach. We summarize our recommendations as follows:
P3, P4, P9 (mainly PP): These are relatively pure polypropylene wastes, making them suitable for closed-loop mechanical recycling into new PP products. P9 does contain some filler and moisture, so minor preprocessing (drying, removing any non-PP attachments) is advised, but overall, their high PP purity is ideal for reprocessing. Maintaining separate PP recycling streams for these can yield high-quality recyclate.
P1, P2, P6 (pure or mixed PE/PP from consumers): These can be mechanically recycled if properly sorted and purified (especially P2, which is HDPE from bottles and is a prime candidate for conventional recycling after removing contaminants). At the same time, they are excellent candidates for chemical recycling (pyrolysis) because they have high volatile content and produce high oil yields with low intrinsic toxicity. For P1, it is critical to remove any PVC fragments, given its detectable chlorine – this could be done via float-sink separation since PVC is denser than HDPE. Once dechlorinated, P1’s mostly HDPE composition would yield a clean oil or recyclate.
P5, P7, P8 (filled or aged PE films): These are heavily contaminated with fillers (CaCO₃) and have undergone aging (oxidation) in use, which makes their mechanical properties inferior. They are likely best suited for chemical recycling (pyrolysis) or, if not economically viable, energy recovery. Before pyrolysis, pre-washing to remove surface contaminants (dirt, salts) would improve process performance. During pyrolysis, their high ash content means more char production, so units should be equipped to handle solid residues and possibly utilize them (e.g., in cement). If these materials are ever reintroduced into new plastics, blending with virgin polymer or adding stabilizers will be necessary to compensate for their degraded properties.
Highly contaminated cases (any sample with excessive chlorine or toxic metals): When a batch is so contaminated that recycling is impractical or unsafe, controlled incineration with energy recovery becomes the option of last resort. This should be done in facilities with proper flue gas cleaning to capture HCl, heavy metals, and any dioxins. For example, if P5’s elevated lead content could not be removed, sending that material to a modern waste-to-energy plant (with acid gas scrubbers and dust filters) would prevent lead from entering consumer products and recover some energy value. Such disposal should be a fallback after exhausting recycling possibilities.
Implementing these recommendations will help ensure that the recycling process for each waste stream is both efficient and environmentally responsible, maximizing material recovery while minimizing hazardous emissions. In practice, an optimal solution will likely involve a combination of strategies: advanced sorting and mechanical recycling for the clean fractions, and chemical or thermal treatment for the contaminated fractions. Our findings, when compared with prior studies, validate that these samples behave as expected for their type – e.g., post-consumer films inevitably carry fillers and need pyrolysis or incineration, whereas clean industrial scraps can go back into new products. Importantly, our data underscore known critical points that must be managed (chlorine content, heavy metals, etc.) to make recycling safe. This knowledge contributes to developing an optimized recycling program for mixed post-consumer/commercial/industrial plastics, moving us closer to a more sustainable circular economy for plastics.
5. Conclusion
In this work, we established a comprehensive analytical framework to characterize mixed plastic waste feedstocks and identify their contaminants, directly linking those findings to appropriate recycling pathways. By applying a battery of advanced techniques (FTIR, DSC, TGA/TG–MS, ICP-OES, CIC), we confirmed that all nine samples (P1–P9) are overwhelmingly composed of polyolefins (PE and PP), but with varying degrees of fillers and legacy contaminants. Clean, homogeneous samples (e.g., industrial scraps) can be readily looped into mechanical recycling, whereas dirtier, heterogenous samples (especially consumer films with CaCO₃ and Cl contamination) are better suited for chemical recycling or energy recovery with suitable emission controls. We provided concrete recycling recommendations for each sample group and demonstrated that even low levels of certain contaminants (like 0.05–1% chlorine or a few hundred ppm lead) can critically influence processing choices.
Overall, our multi-technique approach proved effective in uncovering the “hidden” contamination profile of each waste stream – information that is vital for designing safe and efficient recycling processes. The results highlight the need for rigorous upstream sorting (to remove PVC and e-waste plastics) and possibly pre-treatment steps (washing, dehalogenation) for mixed wastes before recycling. They also show that with proper handling, the predominance of polyolefins in these wastes is a strength: these materials can be transformed into valuable recycled products or fuels, supporting circular economy goals. By systematically linking waste characterization to tailored recycling strategies, this study provides a model for how the plastics recycling industry can meet emerging regulatory standards and sustainability targets. Our findings echo broader calls for science-based solutions in tackling plastic pollution, demonstrating how detailed analytical data can directly inform policy and practice.
In sum, Part I of this study delivers an in-depth feedstock profiling that not only diagnoses the challenges (e.g., chlorine, heavy metals, fillers) in mixed plastic waste but also guides actionable solutions for each challenge. This forms a foundation for Part II, where we evaluate the outputs of chemical recycling of these samples. Together, these efforts move us closer to closing the loop on plastics in a responsible manner, by ensuring that materials are recycled with minimal risk to human health and the environment, in alignment with high standards like those being negotiated in the Global Plastics Treaty. The integrated methodology demonstrated here can be replicated and adapted to other waste streams worldwide, helping industry and regulators make data-driven decisions to achieve safer and more circular plastic lifecycles.
| List of Acronyms | ||
| Acronym | Full Form | |
| ABS | Acrylonitrile Butadiene Styrene Acrylonitrile Butadiene Styrene |
|
| ATR | Attenuated Total Reflectance Attenuated Total Reflectance |
|
| BFR | Brominated Flame Retardants Brominated Flame Retardants |
|
| CERP | Clean Energy Research Platform Clean Energy Research Platform |
|
| CHNSO | Carbon, Hydrogen, Nitrogen, Sulfur, and Oxygen (Ultimate Elemental Analysis) Carbon, Hydrogen, Nitrogen, Sulfur, and Oxygen (Ultimate Elemental Analysis) |
|
| CIC | Combustion Ion Chromatography Combustion Ion Chromatography |
|
| DSC | Differential Scanning Calorimetry Differential Scanning Calorimetry |
|
| DTG | Derivative Thermogravimetry Derivative Thermogravimetry |
|
| EU | European Union European Union |
|
| FTIR | Fourier Transform Infrared Spectroscopy Fourier Transform Infrared Spectroscopy |
|
| GC-MS | Gas Chromatography–Mass Spectrometry Gas Chromatography–Mass Spectrometry |
|
| GC×GC–TOF–MS | Comprehensive Two-Dimensional Gas Chromatography with Time-of-Flight Mass Spectrometry Comprehensive Two-Dimensional Gas Chromatography with Time-of-Flight Mass Spectrometry |
|
| GPC | Gel Permeation Chromatography Gel Permeation Chromatography |
|
| HDPE | High-Density Polyethylene High-Density Polyethylene |
|
| ICP-OES | Inductively Coupled Plasma–Optical Emission Spectroscopy Inductively Coupled Plasma–Optical Emission Spectroscopy |
|
| LDPE | Low-Density Polyethylene Low-Density Polyethylene |
|
| MSW | Municipal Solid Waste Municipal Solid Waste |
|
| NIAS | Non-Intentionally Added Substances Non-Intentionally Added Substances |
|
| PSE | Physical Science and Engineering Division (KAUST) Physical Science and Engineering Division (KAUST) |
|
| PET | Polyethylene Terephthalate Polyethylene Terephthalate |
|
| PMMA | Polymethyl Methacrylate Polymethyl Methacrylate |
|
| POPs | Persistent Organic Pollutants Persistent Organic Pollutants |
|
| PP | Polypropylene Polypropylene |
|
| PS | Polystyrene | |
| PVC | Polyvinyl Chloride Polyvinyl Chloride |
|
| Py-GC/MS | Pyrolysis Gas Chromatography–Mass Spectrometry Pyrolysis Gas Chromatography–Mass Spectrometry |
|
| RoHS | Restriction of Hazardous Substances Restriction of Hazardous Substances |
|
| SCW | Supercritical Water Supercritical Water |
|
| SDG | Sustainable Development Goals Sustainable Development Goals |
|
| SVOCs | Semi-Volatile Organic Compounds Semi-Volatile Organic Compounds |
|
| TGA | Thermogravimetric Analysis Thermogravimetric Analysis |
|
| TG–MS | Thermogravimetry–Mass Spectrometry Thermogravimetry–Mass Spectrometry |
|
| UNEP | United Nations Environment Programme United Nations Environment Programme |
|
| VOCs | Volatile Organic Compounds Volatile Organic Compounds |
|
| WD-XRF | Wavelength Dispersive X-ray Fluorescence Wavelength Dispersive X-ray Fluorescence |
|
| WEEE | Waste Electrical and Electronic Equipment Waste Electrical and Electronic Equipment |
|
| XRF | X-ray Fluorescence X-ray Fluorescence |
|
Acknowledgments
The author acknowledges support from the Clean Energy Research Platform (CERP) at King Abdullah University of Science and Technology (KAUST) for the ongoing research program. This work was also supported by the KAUST Competitive Research Grant Program (CRG2022) through the Office of Research Funding and Services (Award #5034). Sincere thanks are extended to Sufiyan Khan (Facility Management, KAUST) for insightful discussions on waste management in KAUST. We also thank Napco National for providing waste samples and technical insight, and the KAUST Core laboratory staff for their assistance with analytical methodology development. The author used ChatGPT and Grammarly to improve clarity and grammar in preparing this manuscript. The final content was thoroughly reviewed and edited by the author, who assumes full responsibility for its accuracy and integrity.
Data availability
Data will be made available on request.
Declaration of Competing Interest:
The authors declare that they have no known financial interests or personal relationships that could have appeared to influence the work reported in this paper.
References
- Stegmann, P., et al., Plastic futures and their CO2 emissions. Nature, 2022. 612(7939): p. 272-276.
- Jensen, A.C.a.M.S. Plastic pollution is a public health crisis. How do we reduce plastic waste? 2022.
- Chaine, C., et al., Recycling plastics from WEEE: a review of the environmental and human health challenges associated with brominated flame retardants. International journal of environmental research and public health, 2022. 19(2): p. 766.
- Dzierżyński, E., et al., Microplastics in the human body: Exposure, detection, and risk of carcinogenesis: A state-of-the-art review. Cancers, 2024. 16(21): p. 3703.
- Tsakona, M., Drowning in plastics: marine litter and plastic waste vital graphics. 2021.
- Turner, A., Black plastics: Linear and circular economies, hazardous additives and marine pollution. Environment international, 2018. 117: p. 308-318.
- Wang, S., International law-making process of combating plastic pollution: Status Quo, debates and prospects. Marine Policy, 2023. 147: p. 105376.
- OECD, Global Plastics Outlook: Economic Drivers, Environmental Impacts and Policy Options. 2022, Organisation for Economic Co-operation and Development (OECD) Publishing: Paris.
- Aanesen, M., et al., Insights from international environmental legislation and protocols for the global plastic treaty. Scientific Reports, 2024. 14(1): p. 2750. 1.
- Vince, J., et al., The Zero Draft Plastics Treaty: Gaps and challenges. Cambridge Prisms: Plastics, 2024. 2: p. e24.
- Sinkevičius, V. EU calls for agreement on global rules to end plastic pollution, in EU Environment newsletter. 2023, European Commission, Energy, Climate change, Environment.: Directorate-General for Environment, Brussel, Belgium.
- Wikipedia, Plastic bag ban. 2025, Wikipedia.
- Herberz, T., C.Y. Barlow, and M. Finkbeiner, Sustainability assessment of a single-use plastics ban. Sustainability, 2020. 12(9): p. 3746.
- Saxena, S., Pyrolysis and Beyond: Sustainable Valorization of Plastic Waste. Applications in Energy and Combustion Science, 2024: p. 100311.
- Hansen, E., et al., Hazardous substances in plastic materials. COWI in cooperation with Danish Technological Institute, 2013: p. 7-8.
- Ragaert, K., L. Delva, and K. Van Geem, Mechanical and chemical recycling of solid plastic waste. Waste management, 2017. 69: p. 24-58.
- Villanueva, A. and P. Eder, End-of-waste criteria for waste plastic for conversion. Institute for prospective Technological studies, 2014.
- Barrick, A., et al., Plastic additives: Challenges in ecotox hazard assessment. PeerJ, 2021. 9: p. e11300.
- Hahladakis, J.N., et al., An overview of chemical additives present in plastics: Migration, release, fate and environmental impact during their use, disposal and recycling. Journal of hazardous materials, 2018. 344: p. 179-199.
- Cook, E., C.A. Velis, and M. Derks, Plastic waste reprocessing for circular economy: A systematic review of risks to occupational and public health from legacy substances and extrusion. 2020.
- Santos, M., et al., The Hidden Risks of Recycled Plastic Toys: A Literature Review on Legacy Additives and Child Safety. Sustainability & Circularity NOW, 2025. 2(continuous publication).
- Sharkey, M., et al., Phasing-out of legacy brominated flame retardants: The UNEP Stockholm Convention and other legislative action worldwide. Environment International, 2020. 144: p. 106041.
- Xanthos, M., Functional fillers for plastics. 2010: John Wiley & Sons.
- Radhakrishnan, H., et al., Influence of Functional Additives, Fillers, and Pigments on Thermal and Catalytic Pyrolysis of Polyethylene for Waste Plastics Upcycling. Green Chemistry, 2025.
- Aguado, J., D. Serrano, and G. San Miguel, Analysis of products generated from the thermal and catalytic degradation of pure and waste polyolefins using Py-GC/MS. Journal of Polymers and the Environment, 2007. 15: p. 107-118.
- Sørensen, L., et al., UV degradation of natural and synthetic microfibers causes fragmentation and release of polymer degradation products and chemical additives. Science of the Total Environment, 2021. 755: p. 143170.
- Horodytska, O., A. Cabanes, and A. Fullana, Non-intentionally added substances (NIAS) in recycled plastics. Chemosphere, 2020. 251: p. 126373.
- Kato, L.S. and C.A. Conte-Junior, Safety of plastic food packaging: the challenges about non-intentionally added substances (NIAS) discovery, identification and risk assessment. Polymers, 2021. 13(13): p. 2077.
- Wiesinger, H., Z. Wang, and S. Hellweg, Deep dive into plastic monomers, additives, and processing aids. Environmental science & technology, 2021. 55(13): p. 9339-9351.
- Almroth, B.C., Scientists found hundreds of toxic chemicals in recycled plastics., in ScienceDaily. 2023, ScienceDaily: 2023.
- Almroth, B.C., et al., Addressing the toxic chemicals problem in plastics recycling. Cambridge Prisms: Plastics, 2025. 3: p. e3.
- Carmona, E., et al., A dataset of organic pollutants identified and quantified in recycled polyethylene pellets. Data in brief, 2023. 51: p. 109740.
- Geueke, B., et al., Systematic evidence on migrating and extractable food contact chemicals: most chemicals detected in food contact materials are not listed for use. CritiCal reviews in Food sCienCe and nutrition, 2023. 63(28): p. 9425-9435.
- Geueke, B., et al., Hazardous chemicals in recycled and reusable plastic food packaging. Cambridge Prisms: Plastics, 2023. 1: p. e7.
- Groh, K.J., et al., Overview of known plastic packaging-associated chemicals and their hazards. Science of the total environment, 2019. 651: p. 3253-3268.
- Groh, K.J., et al., Overview of intentionally used food contact chemicals and their hazards. Environment International, 2021. 150: p. 106225.
- Coniglio, M.A., et al., Non-intentionally added substances. 2020: Springer.
- Ong, H.-T., H. Samsudin, and H. Soto-Valdez, Migration of endocrine-disrupting chemicals into food from plastic packaging materials: an overview of chemical risk assessment, techniques to monitor migration, and international regulations. Critical reviews in food science and nutrition, 2022. 62(4): p. 957-979.
- Turner, A. and M. Filella, Hazardous metal additives in plastics and their environmental impacts. Environment International, 2021. 156: p. 106622.
- Nevondo, V., et al., Analytical insights into short-chain chlorinated paraffins in consumer products, leachates, and sediments in Gauteng, South Africa. International Journal of Environmental Science and Technology, 2025: p. 1-18.
- Bifulco, A., et al., Recycling of flame retardant polymers: Current technologies and future perspectives. Journal of Materials Science & Technology, 2024.
- Carney Almroth, B., et al., Chemical simplification and tracking in plastics. Science, 2023. 382(6670): p. 525-525.
- Wrona, M., et al., Identification of Intentionally and Non-intentionally Added Substances in Recycled Plastic Packaging Materials, in Food Packaging Materials: Current Protocols. 2024, Springer. p. 75-98.
- Núñez, S.S., et al., Heavy metals, PAHs and POPs in recycled polyethylene samples of agricultural, post-commercial, post-industrial and post-consumer origin. Waste Management, 2022. 144: p. 113-121.
- Long, F., et al., Online characterization of mixed plastic waste using machine learning and mid-infrared spectroscopy. ACS Sustainable Chemistry & Engineering, 2022. 10(48): p. 16064-16069. 48.
- Farrelly, T., et al., Independent science key to breaking stalemates in global plastics treaty negotiations. Cambridge Prisms: Plastics, 2025. 3: p. e6.
- Farrelly, T., et al., Global plastics treaty needs trusted science. Science, 2024. 384(6693): p. 281-281.
- Beccagutti, B., et al., Characterization of some real mixed plastics from WEEE: a focus on chlorine and bromine determination by different analytical methods. Sustainability, 2016. 8(11): p. 1107.
- Goedecke, C., et al., Evaluation of thermoanalytical methods equipped with evolved gas analysis for the detection of microplastic in environmental samples. Journal of Analytical and Applied Pyrolysis, 2020. 152: p. 104961.
- Hall, W.J. and P.T. Williams, Analysis of products from the pyrolysis of plastics recovered from the commercial scale recycling of waste electrical and electronic equipment. Journal of Analytical and Applied Pyrolysis, 2007. 79(1-2): p. 375-386.
- Hochegger, A. One-dimensional and comprehensive two-dimensional gas chromatographic approaches for the characterization of post-consumer recycled plastic materials . Analytical and Bioanalytical Chemistry 2023, 415(13), 2447–2457. [Google Scholar] [CrossRef]
- Kusch, P. Application of pyrolysis-gas chromatography/mass spectrometry (Py-GC/MS), in Comprehensive analytical chemistry; Elsevier, 2017; pp. 169–207. [Google Scholar]
- Cuthbertson, A.A. Characterization of polymer properties and identification of additives in commercially available research plastics . Green Chemistry 2024, 26(12), 7067–7090. [Google Scholar] [CrossRef]
- Gnoffo, C.; Frache, A. Identification of plastics in mixtures and blends through pyrolysis-gas chromatography/mass spectrometry . Polymers 2023, 16(1), 71. [Google Scholar] [CrossRef]
- Strien, J.R. Pyrolysis of Polyolefin-Enriched Mixed Plastic Waste Streams: Effects of Pretreatments and Presence of Hydrogen during Pyrolysis . Energy & Fuels 2024, 39(1), 686–698. [Google Scholar] [CrossRef]
- Lee, H.-J. Variation and uncertainty of microplastics in commercial table salts: critical review and validation . Journal of hazardous materials 2021, 402, 123743. [Google Scholar] [CrossRef]
- Roosen, M. Detailed analysis of the composition of selected plastic packaging waste products and its implications for mechanical and thermochemical recycling . Environmental science & technology 2020, 54(20), 13282–13293. [Google Scholar]
- Dahlbo, H. Recycling potential of post-consumer plastic packaging waste in Finland . Waste management 2018, 71, 52–61. [Google Scholar] [CrossRef]
- Budiyantoro, C.; et al. The effect of CaCO3 filler component on mechanical properties of polypropylene . IOP Conference Series: Materials Science and Engineering, 2018; IOP Publishing. [Google Scholar]
- Choi, S. The Effect of Coupling Agents and Graphene on the Mechanical Properties of Film-Based Post-Consumer Recycled Plastic . Polymers 2024, 16(3), 380. [Google Scholar] [CrossRef]
- Hernandez Fernandez, J., J. Carrascal Sanchez, and J. Lopez Martinez, Sustainable Catalysts from Industrial FeO Waste for Pyrolysis and Oxidation of Hospital Polypropylene in Cartagena . 2024.
- Uçar, S. The influence of the waste ethylene vinyl acetate copolymer on the thermal degradation of the waste polypropylene . Fuel processing technology 2008, 89(11), 1201–1206. [Google Scholar] [CrossRef]
- Kanan, S.; Samara, F. Dioxins and furans: A review from chemical and environmental perspectives . Trends in Environmental Analytical Chemistry 2018, 17, 1–13. [Google Scholar] [CrossRef]
- Gao, P. Pyrolysis of municipal plastic waste: Chlorine distribution and formation of organic chlorinated compounds . Science of The Total Environment 2024, 912, 169572. [Google Scholar] [CrossRef]
- Oberoi, S.; Malik, M. Polyvinyl chloride (PVC), chlorinated polyethylene (CPE), chlorinated polyvinyl chloride (CPVC), chlorosulfonated polyethylene (CSPE), polychloroprene rubber (CR)—Chemistry, applications and ecological impacts—I . In Ecological and Health Effects of Building Materials; 2022; pp. 33–52. [Google Scholar]
- Deshwal, G.K.; Panjagari, N.R. Review on metal packaging: Materials, forms, food applications, safety and recyclability . Journal of food science and technology 2020, 57(7), 2377–2392. [Google Scholar] [CrossRef]
- Saiyed, S.M.; Yokel, R.A. Aluminium content of some foods and food products in the USA, with aluminium food additives . Food additives and contaminants 2005, 22(3), 234–244. [Google Scholar] [CrossRef]
- DeArmitt, C., Functional fillers for plastics, in Applied plastics engineering handbook. 2011, Elsevier. p. 455-468.
- Ramakrishna, C., T. Thriveni, and A.J. Whan, The Role of Mineral Fillers for Enhancing the Mechanical Properties of Recycled Plastics . International Journal in IT & Engineering 2015, 3(3), 314–335.
- Cârdan, I. Blue micro-/nanoplastics abundance in the environment: a double threat as a Trojan horse for a plastic-Cu-phthalocyanine pigment and an opportunity for nanoplastic detection via micro-Raman spectroscopy . Environmental Science: Nano 2025, 12(4), 2357–2370. [Google Scholar] [CrossRef]
- Murali, A. Determination of metallic and polymeric contents in electronic waste materials and evaluation of their hydrometallurgical recovery potential . International Journal of Environmental Science and Technology 2022, 1–14. [Google Scholar] [CrossRef]
- Pfaff, G. Iron oxide pigments . Physical Sciences Reviews 2021, 6(10), 535–548. [Google Scholar] [CrossRef]
- Sadi, S.H.F. Recycling Waste Polymers from Automotive Shredder Residue (ASR); Application in Iron Making . 2013. [Google Scholar]
- Zhao, J. Slagging characteristics caused by alkali and alkaline earth metals during municipal solid waste and sewage sludge co-incineration . Energy 2020, 202, 117773. [Google Scholar] [CrossRef]
- Bley, H. Nutrient release, plant nutrition, and potassium leaching from polymer-coated fertilizer . Revista Brasileira de Ciência do Solo 2017, 41. [Google Scholar] [CrossRef]
- Li, Y. Recent advances in halogen-free flame retardants for polyolefin cable sheath materials . Polymers 2022, 14(14), 2876. [Google Scholar] [CrossRef]
- Grossman, R.F. Lubricants, in Polymer Modifiers and Additives; CRC Press, 2000; pp. 385–414. [Google Scholar]
- Hobbs, C.A. Magnesium stearate, a widely-used food additive, exhibits a lack of in vitro and in vivo genotoxic potential . Toxicology reports 2017, 4, 554–559. [Google Scholar] [CrossRef]
- Orriss, R. Effects of Contaminants in Ethylene Plants: Sodium and Iron . in AIChE Conference, Spring Meeting, 1996. [Google Scholar]
- Niu, B.; Xu, Z. Innovating e-waste recycling: From waste multi-layer ceramic capacitors to NbPb codoped and ag-Pd-Sn-Ni loaded BaTiO3 nano-photocatalyst through one-step ball milling process . Sustainable materials and technologies 2019, 21, p. e00101. [Google Scholar] [CrossRef]
- Mihajlović, I. Recent development of phosphorus flame retardants in thermoplastic blends and nanocomposites, in Flame retardants: Polymer blends, composites and nanocomposites; Springer, 2015; pp. 79–114. [Google Scholar]
- Kots, P.A. Polypropylene plastic waste conversion to lubricants over Ru/TiO2 catalysts . Acs Catalysis 2021, 11(13), 8104–8115. [Google Scholar] [CrossRef]
- Ranta-Korpi, M. Ash forming elements in plastics and rubbers.; VTT Technical Research Centre of Finland: Espoo, Finland, 2014; Volume 131. [Google Scholar]
- Chruściel, J.J. Silicon-Based Polymers and Materials; Walter de Gruyter GmbH & Co KG, 2022. [Google Scholar]
- Li, D.; Liu, P. Trends and prospects for thermal stabilizers in polyvinyl chloride . Journal of Vinyl and Additive Technology 2022, 28(4), 669–688. [Google Scholar] [CrossRef]
- Gázquez, M.J., S.M.P. Moreno, and J.P. Bolívar, TiO2 as white pigment and valorization of the waste coming from its production, in Titanium dioxide (Tio₂) and its applications; Elsevier, 2021; pp. 311–335.
- Alicja, K.; Grzegorz, C. Strontium leaching from municipal waste subjected to incineration . Environmental Geochemistry and Health 2024, 46(7), 220. [Google Scholar] [CrossRef]
- Vogel, C. Speciation of antimony and vanadium in municipal solid waste incineration ashes analyzed by XANES spectroscopy . Journal of Material Cycles and Waste Management 2024, 26(4), 2152–2158. [Google Scholar] [CrossRef]
- White, D.J. and L.S. Levy,Vanadium: environmental hazard or environmental opportunity? A perspective on some key research needs . Environmental Science: Processes & Impacts 2021, 23(4), 527–534. [CrossRef] [PubMed]
- Ishikura, H. Developments in vanadium-catalysed polymerisation reactions: A review . Inorganica Chimica Acta 2021, 515, 120047. [Google Scholar] [CrossRef]
- Morsy, A. Utilizing a blend of expandable graphite and calcium/zinc stearate as a heat stabilizer environmentally friendly for polyvinyl chloride . SPE Polymers 2024. 5, 1, 45–57. [Google Scholar] [CrossRef]
- Liu, W. Fabrication of anti-bacterial, hydrophobic and UV resistant galactomannan-zinc oxide nanocomposite films . Polymer 2021, 215, 123412. [Google Scholar] [CrossRef]
- Moles, P.J.M. Chemicals, The use of zirconium in Surface Coatings . Data sheet, 2002; 117776–1780. [Google Scholar]
Figure 3.
FTIR spectra of plastic waste samples P1–P9, showing characteristic absorption bands for polyolefins. Strong CH₂ bending (~1460 cm⁻¹) and CH₂ rocking (~720 cm⁻¹) indicate polyethylene in several samples (e.g., P1, P5, P7), while CH₃ bending (~1375 cm⁻¹) and broader C–H stretches (~2840–2950 cm⁻¹) suggest polypropylene in others (e.g., P3, P4, P9). Peaks near 1715 cm⁻¹ and 874 cm⁻¹ in select samples indicate oxidation and branching or filler-related features.
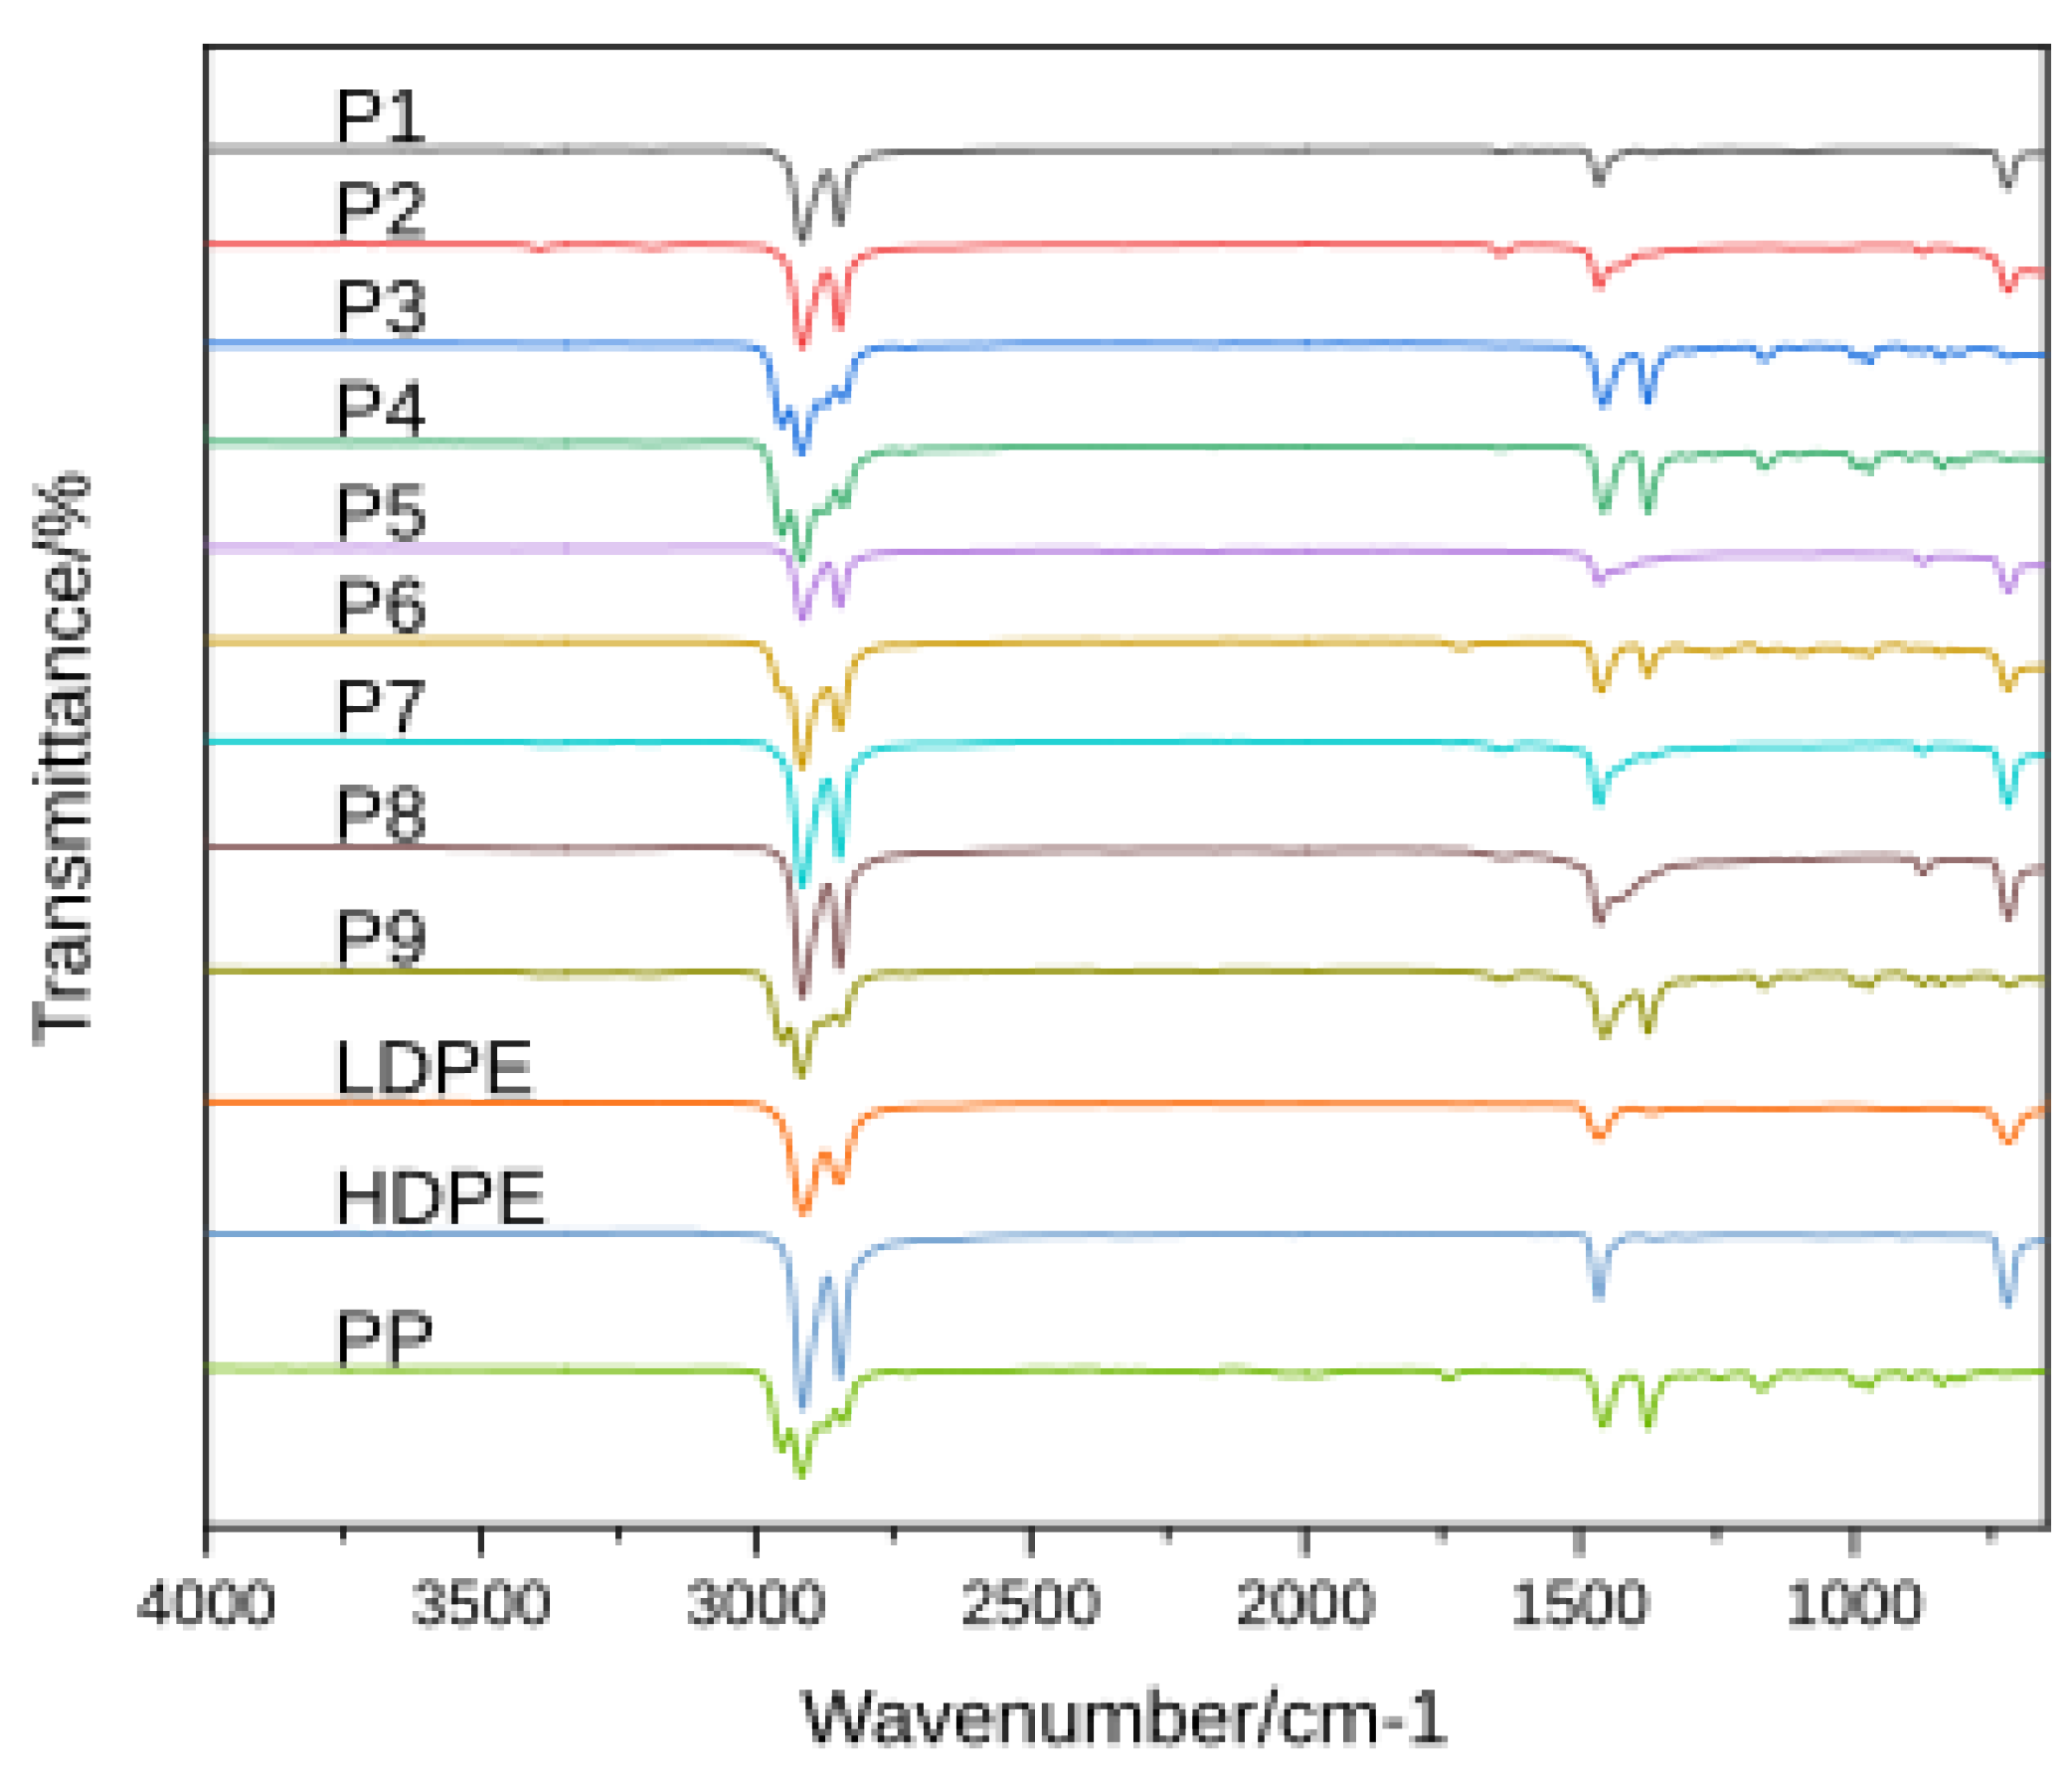
Table 1.
Thermogravimetric data of plastics.
| Sample ID | T0 (°C) | Tf (°C) | Tmax (°C) | ΔTG (%) |
| P1 | 365 | 502.2 | 475 | 99.99 |
| P2 | 376 | 503.3 | 476 | 90.77 |
| P2 | 611 | 673.3 | 658 | 2.32 |
| P2 | Total ΔTG Total ΔTG Total ΔTG |
93.09 | ||
| P3 | 353 | 485.5 | 458 | 98.23 |
| P4 | 416 | 486.3 | 459 | 99.23 |
| P5 | 392 | 519.9 | 477 | 91.23 |
| P5 | 620 | 679.9 | 667 | 3.69 |
| P5 | Total ΔTG Total ΔTG Total ΔTG |
94.92 | ||
| P6 | 355 | 504.7 | 462 | 99.29 |
| P7 | 417.9 | 520.4 | 482.9 | 94.89 |
| P7 | 660.4 | 1.3 | ||
| P7 | Total ΔTG Total ΔTG Total ΔTG |
96.19 | ||
| P8 | 410.3 | 535.3 | 475.3 | 93.25 |
| P8 | 687.8 | 3.12 | ||
| P8 | Total ΔTG Total ΔTG Total ΔTG |
96.37 | ||
| P9 | 376 | 503.3 | 460.7 | 95.6 |
| P9 | 680.7 | 1.86 | ||
| P9 | Total ΔTG Total ΔTG Total ΔTG |
97.46 | ||
Table 3.
GPC results for selected plastic samples (P1–P6).
| Sample | Mp | Mn | Mw | Mz |
| P1 | 147,040 | 44,959 | 238,891 | 683,064 |
| P2 | 137,869 | 44,937 | 228,606 | 596,549 |
| P3 | 156,596 | 76,526 | 197,794 | 365,870 |
| P4 | 188,593 | 56,685 | 250,303 | 575,682 |
| P5 | 99,747 | 43,309 | 235,918 | 899,948 |
| P6 | 122,743 | 48,623 | 170,115 | 375,282 |
Table 4.
Integrated analytical summary of plastic waste samples (P1–P9), combining polymer identification (via FTIR, Raman, DSC), thermal decomposition behavior (TGA, TG–MS), evidence of oxidation or contamination (e.g., fillers, CaCO₃, additives), and inferred origin based on composition and condition. This diagnostic framework enables targeted recycling recommendations and highlights contamination trends across post-consumer, post-industrial, and post-commercial streams,.
| Sample | Identified Polymer(s) | Spectral Signatures (FTIR ) | Thermal Behavior (DSC & TGA/TG–MS) | Additives/Contamination Evidence | Suggested Origin |
|---|---|---|---|---|---|
| P1 | Poly(ethylene) – mixture of LDPE & HDPE | FTIR: CH₂ rocking and bending, C–H stretches indicative of PE; Raman confirms PE (matches standard). | DSC: two melting peaks at ~110 °C and 130 °C (LDPE & HDPE). TGA: single-stage decomposition ~475 °C with ~99% mass loss; TG–MS shows only hydrocarbon volatiles (C1–C3 alkanes/alkenes), typical of pure polyolefins. | No significant additives – no FTIR carbonyl (oxidation) band, negligible residue (<0.5% ash) indicating minimal inorganic content. | Post-Industrial |
| P2 | Poly(ethylene) – high-density (HDPE) | FTIR: CH₂ bending and rocking modes of PE, plus weak C=C and O–H bands suggesting slight oxidation; aromatic hints (trace impurities). Raman confirms PE polymer matrix. | DSC: single melting peak ~130 °C (HDPE). TGA: two-stage mass loss – main PE degradation ~476 °C, and a second minor step ~700 °C. TG–MS detects C1–C3 hydrocarbons and a notable CO₂ release in the >650 °C range, confirming CaCO₃ filler decomposition. Residual ash ~6.6%. | CaCO₃ filler evidenced by 6–7% ash and CO₂ evolution; mild oxidative degradation (C=C, O–H in FTIR). These indicate inorganic additives and weathering contaminants. | Post-Consumer |
| P3 | Poly(propylene) (PP) | FTIR: CH₂ and CH₃ stretching and bending vibrations characteristic of isotactic PP. Raman confirms PP identity (matches PP reference spectrum). | DSC: melting peak ~160 °C (PP). TGA: single-stage degradation around 460 °C (DTG peak) with ~99% mass loss. TG–MS shows predominant C3 hydrocarbon fragments (propylene/propane m/z 41, 43) and other alkane/alkene volatiles, as expected for pure PP pyrolysis. | No additives detected – FTIR shows no carbonyl or other extraneous bands; minimal residue (~1% ash) indicating virtually no filler. | Post-Industrial |
| P4 | Poly(propylene) (PP) | FTIR: CH₃ bending and CH₂ stretching bands consistent with PP. Raman signal was weak (fluorescence) but no contradictions to PP assignment. | DSC: melting peak ~160 °C (PP). TGA: single-stage decomposition ~458–460 °C, nearly complete mass loss (~99%). TG–MS profile shows only PP-derived volatiles (C3 hydrocarbons), with no secondary decomposition stage. | No significant additives – no signs of oxidation in FTIR; negligible inorganic residue (~0.9% ash). | Post-Industrial |
| P5 | Poly(ethylene) – high-density (HDPE) | FTIR: CH₂ bands of PE with broad C=O absorption (~1710 cm⁻¹) indicating oxidized polyethylene. Raman confirms PE polymer backbone (matches PE standard). | DSC: melting point ~125–130 °C (HDPE). TGA: multi-stage degradation – primary polymer breakdown ~477 °C (HDPE) and a second weight-loss event onset ~650–700 °C. TG–MS detects C1-C3 hydrocarbon volatiles and a strong CO₂ evolution peaking near 700 °C, corresponding to filler (CaCO₃) decomposition. ~10% residue remains. | Pronounced CaCO₃ filler presence (10.2% ash) confirmed by CO₂ release; clear oxidation signs (carbonyl in FTIR) from weathering. Possibly other additives (e.g. stabilizers) indicated by multi-step TGA profile. | Post-Consumer |
| P6 | Polyolefin blend – LDPE, HDPE & PP | FTIR: overlapping CH₂ (PE) and CH₃ (PP) bands; weak C=O stretch suggesting slight oxidation. Raman spectroscopy inconclusive (fluorescence interference), but overall spectra imply mixed PE/PP. | DSC: multiple melting points ~110 °C (LDPE), 130 °C (HDPE), 165 °C (PP) – confirming a PE/PP blend. TGA: broad multi-step degradation with an initial peak ~460 °C (PP) and shoulder ~470–480 °C (PE); nearly complete mass loss (~98%). TG–MS shows a composite volatile profile (mixed C2–C3 fragments from both PE and PP), no distinct second high-temperature gas release (low ash ~2%). | Minor oxidation (trace carbonyl in FTIR) but no substantial inorganic filler (residual <2%). The combined thermal profile reflects the PP/PE mixture without significant additives. | Post-Consumer |
| P7 | Poly(ethylene) – low & high density (LDPE & HDPE) | FTIR: CH₂ rocking/stretching of PE with an extra C=C stretching band, implying unsaturation (oxidative degradation or additive). (Raman not measured for this sample.) | DSC: dual melting peaks ~110 °C (LDPE) and 130 °C (HDPE). TGA: two-step decomposition – main polymer volatilization ~475 °C, plus a minor second loss up to ~750 °C. TG–MS (by analogy to similar samples) would show PE pyrolysis hydrocarbons and a small CO₂ release at high T (consistent with slight CaCO₃ content). Residue ~3%. | Inorganic filler (CaCO₃) is indicated by ~2.8% ash and a minor 700 °C decomposition event; FTIR C=C and slight O–H signals denote polymer oxidation. Overall additives are low-level (e.g. film filler, antioxidants byproducts). | Post-Consumer / Post-Commercial |
| P8 | Poly(ethylene) – high-density (HDPE) | FTIR: CH₂ vibrations of PE and faint C=C band (possible branching or oxidative unsaturation). (Raman not measured.) | DSC: melting peak ~125 °C (HDPE). TGA: nearly single-step degradation ~470 °C with a very small secondary weight loss around 700 °C; ~4–5% residue. TG–MS (inferred) predominantly shows C2–C3 hydrocarbon gases with a minor CO₂ signal from filler. | Moderate CaCO₃ filler present (~4.7% ash) evidenced by the slight high-T mass loss and expected CO₂ release; mild oxidation (unsaturation in FTIR) suggesting some aging or additive breakdown. | Post-Consumer / Post-Commercial |
| P9 | Polyolefin mix – HDPE & PP | FTIR: combined CH₂ (PE) and CH₃ (PP) bands confirm a PE/PP mixture; C=C stretching indicates unsaturation or additive. (Raman not measured.) | DSC: two melting transitions (~130 °C and 165 °C) corresponding to HDPE and PP. TGA: multi-stage decomposition – overlapping PE/PP degradation around 460–480 °C, plus a subtle secondary drop at higher temperature. ~3% residue remains. TG–MS was not run, but the sample is expected to release typical PE/PP pyrolysis gases (no large CO₂ peak, consistent with low filler). | Minor inorganic content (~3.4% ash, possibly pigment or trace filler); slight polymer oxidation (C=C in FTIR). No significant additives apart from the small contamination by the secondary polymer (mixed plastic stream). | Post-Commercial |
Table 7.
ICP-OES result of waste plastic samples.
| Element (ppm) | Al | As | Ba | Ca | Cd | Fe | K | Mg | Na | P |
|---|---|---|---|---|---|---|---|---|---|---|
| P1 | 54.05 | ND | ND | 27.43 | ND | ND | ND | ND | 9.35 | 20.99 |
| P2 | 1155.80 | ND | ND | 26900.00 | ND | 28.28 | 4993.74 | 2718.60 | 9698.56 | 121.36 |
| P3 | 76.17 | ND | ND | 5362.95 | ND | 14.67 | ND | 25.57 | 44.19 | 38.34 |
| P4 | 37.81 | ND | ND | 881.50 | ND | 25.15 | ND | 31.06 | 85.88 | 40.51 |
| P5 | 213.93 | ND | ND | 15362.08 | ND | 14.52 | ND | 57.62 | 19.93 | 90.88 |
| P6 | 185.45 | ND | ND | 152.80 | ND | ND | ND | 20.44 | 16.51 | 26.76 |
| P7 | 216.80 | ND | 22.51 | 15401.03 | ND | 74.28 | 21.15 | 404.86 | 106.25 | 34.69 |
| P8 | 68.92 | ND | ND | 35608.29 | ND | 18.53 | ND | 75.49 | 24.40 | 70.97 |
| P9 | 216.86 | ND | 50.58 | 20896.63 | ND | 335.78 | 15.58 | 445.74 | 86.72 | 45.71 |
| Element (ppm) | Pb | S | Sb | Si | Sn | Sr | Te | Ti | Zn | Sum. /% |
| P1 | ND | ND | ND | 222.47 | ND | ND | ND | ND | ND | 0.03 |
| P2 | ND | 332.83 | ND | 827.45 | ND | ND | ND | 451.88 | 53.68 | 4.73 |
| P3 | ND | 91.17 | ND | 43.24 | ND | ND | ND | 208.8 | 35.72 | 0.59 |
| P4 | ND | 16.73 | ND | 74.01 | ND | ND | ND | 33.15 | 6.8 | 0.12 |
| P5 | ND | 279.02 | ND | 117.46 | ND | ND | ND | 277.05 | 30.65 | 1.65 |
| P6 | ND | 12.5 | ND | 94.02 | ND | ND | ND | 232.33 | 24.7 | 0.08 |
| P7 | 20.56 | 268.74 | ND | 733.47 | ND | 99.78 | ND | 1664.25 | 153.23 | 1.92 |
| P8 | ND | 451.26 | ND | 127.88 | ND | 12.18 | ND | 1124.93 | 52.51 | 3.76 |
| P9 | 9.98 | 291.14 | ND | 367.09 | ND | 10.88 | ND | 1828.17 | 28.91 | 2.46 |
Disclaimer/Publisher’s Note: The statements, opinions and data contained in all publications are solely those of the individual author(s) and contributor(s) and not of MDPI and/or the editor(s). MDPI and/or the editor(s) disclaim responsibility for any injury to people or property resulting from any ideas, methods, instructions or products referred to in the content. |
© 2026 by the authors. Licensee MDPI, Basel, Switzerland. This article is an open access article distributed under the terms and conditions of the Creative Commons Attribution (CC BY) license (http://creativecommons.org/licenses/by/4.0/).
Copyright: This open access article is published under a Creative Commons CC BY 4.0 license, which permit the free download, distribution, and reuse, provided that the author and preprint are cited in any reuse.


