
Submitted:
25 February 2026
Posted:
26 February 2026
You are already at the latest version
Abstract
This study evaluates the efficacy and safety of [²²⁵Ac]Ac-PSMA-617 targeted alpha therapy (TAT) in patients with metastatic castration-resistant prostate cancer (mCRPC) who demonstrated Prostate-Specific Antigen (PSA) based non-responsiveness to prior [¹⁷⁷Lu]Lu-PSMA-617 therapy. Moving beyond traditional PSA-level assessments, we integrate blood biomarkers, PSMA-PET based total tumor volume (TTV) and salivary glands uptake. This retrospective analysis provides a comprehensive framework for evaluating treatment efficacy. Twelve patients underwent 2–6 cycles of [²²⁵Ac]Ac-PSMA-617, with a median activity of 8 MBq. PSA decline was observed in 8/12 patients, with 5/12 achieving a > 50% reduction. TTV results showed partial response in 7/12, stable disease in 3/12, and progression in 2/12, correlating strongly with PSA trends. Salivary glands showed significantly lower post-TAT PSMA-PET SUVmax and SUVmean (-63.7% and -45.5%, respectively). Moreover, elevated PSA, ALP, and LDH, along with low hemoglobin, platelet count, and creatinine, were associated with reduced overall survival (OS). Median progression-free survival (PFS) and OS were 27 and 53 weeks, respectively. The Barthel Index remained stable indicating preserved functional independence. These findings suggest that combining PSA, TTV, and blood biomarkers enhances the predictive accuracy and supports a more holistic evaluation of treatment efficacy. Validation in larger cohorts is warranted.
Keywords:
metastatic castration-resistant prostate cancer (mCRPC)
; Prostate-Specific Antigen (PSA)
; targeted alpha therapy (TAT)
; [225Ac]Ac-PSMA-617
; [¹⁷⁷Lu]Lu-PSMA
; salivary glands uptake
; therapeutic efficacy
; overall survival (OS)
; median progression-free survival (PFS)
; biomarker-guided evaluation
1. Introduction
Metastatic castration-resistant prostate cancer (mCRPC) presents a significant therapeutic challenge, as it usually shows limited or no durable response to newer treatments such as novel antiandrogen agents, taxane-based chemotherapy, or Radium-223 (223Ra) [1,2]. In this context, radioligand therapy (RLT) has emerged as a promising alternative, with clinical studies such as the VISION trial demonstrating favorable outcomes for [177Lu]Lu-PSMA-617, despite its associated resistance or recurrence rates [3,4,5,6]. These challenges have led researchers to explore the potential of alpha-emitting radionuclides, which offer higher energy transfer rates and shorter path lengths than beta-emitting agents, making them an attractive option for PSMA (Prostate-Specific Membrane Antigen)-targeted RLT in mCRPC [7].
Actinium-225 (225Ac), with an alpha particle energy range of 5.8–8.4 MeV and a half-life of 9.9 days, has been frequently used in TAT [8,9]. It is often paired with its daughter radionuclide, Bismuth-213, which has a short half-life of 46 minutes, making [225Ac]Ac-PSMA-617 a promising candidate for mCRPC treatment [10]. Since 2017, numerous reports have confirmed that [²²⁵Ac]Ac-PSMA-617 therapy induces significant declines in prostate-specific antigen (PSA) levels following treatment [11,12,13,14,15,16,17,18]. Furthermore, it is associated with improved progression-free survival (PFS), especially in patients who have previously been refractory to [177Lu]Lu-PSMA-617. Given the promising yet varied clinical outcomes, a comprehensive clinical analysis is essential to provide a holistic understanding of treatment efficacy, patient outcomes, and associated toxicities. This analysis will offer valuable insights into the therapeutic benefit of [225Ac]Ac-PSMA-617.
In [225Ac]Ac-PSMA-617 therapy, the salivary gland is one of the organs at risk (OAR) due to physiological PSMA expression, leading to potential off-target uptake and xerostomia [19]. Quantifying this uptake is crucial for assessing toxicity, optimizing therapy, and evaluating the tumor sink effect, which occurs when tumor reduction alters biodistribution, increasing uptake in non-target tissues. Semi-quantitative PET analysis represents a pragmatic and essential approach for evaluating treatment outcomes and assessing therapeutic efficacy.
Despite encouraging preliminary results, the potential relationship of biomarkers, such as blood biomarkers and also total tumor volume (TTV), with treatment efficacy and overall survival (OS) remains largely unexplored and underreported. This study retrospectively evaluates the treatment efficacy and outcomes of [225Ac]Ac-PSMA-617 in patients with mCRPC, focusing on the correlation between patient treatment characteristics (e.g., PSA levels and TTV) and OS. Additionally, we investigate potential associations between baseline and post-treatment blood biomarker profiles and OS, an area not addressed in previous studies.
To contextualize and compare our findings, we conduct a systematic meta-analysis to consolidate existing data on the efficacy and safety of [²²⁵Ac]Ac-PSMA-617 therapy in mCRPC. By integrating outcomes from multiple cohorts, the meta-analysis enhances statistical power and offers a comprehensive evaluation of PSA response rates, progression-free survival (PFS), OS, and treatment-related toxicities, including xerostomia, renal dysfunction, and hematologic effects. Through the synthesis of both retrospective findings and pooled evidence, this study provides a robust, evidence-based perspective on therapeutic efficacy, safety, and predictive biomarkers informing future strategies for treatment optimization.
2. Results
2.1. Patients and Treatment Administration
A total of 12 patients with metastatic castration-resistant prostate cancer were selected who underwent [225Ac]Ac-PSMA-617 targeted alpha therapy (Table 1). The patients had received various prior treatments including local treatments, androgen receptor–targeted therapy (AR-TT), chemotherapy, and [²²³Ra]Ra-dichloride before initiation of [²²⁵Ac]Ac-PSMA-617 TAT. Local treatments included radical prostatectomy (67%), and radiotherapy (42%), both of which remain key in local/locally advanced disease management. Most patients had undergone multiple lines of AR-TT, including abiraterone (75%) and enzalutamide (83%). Recent analyses suggest that AR-TT inhibitors continue to contribute significantly to survival in mCRPC even in patients heavily pretreated by other modalities [20]. Chemotherapy was also widely used: docetaxel (67%), established as first-line chemotherapy in mCRPC [21,22], and cabazitaxel (42%), which showed efficacy after docetaxel failure [23,24]. Notably, one patient (8%) initially referred for [²²³Ra]Ra-dichloride therapy due to extensive osseous metastases demonstrated no response to the therapy. All patients received [¹⁷⁷Lu]Lu-PSMA-617 therapy following multidisciplinary Tumor Board approval, ensuring uniform eligibility criteria and therapeutic intent across the cohort, with a median of 4 cycles (range 2-8). The patients then were transitioned to [²²⁵Ac]Ac-PSMA-617 TAT. The distribution of [²²⁵Ac]Ac-PSMA-617 treatment cycles was as follows: three patients (25%) underwent five cycles, three patients (25%) received three cycles, and another three patients (25%) received two cycles. Additionally, two patients (17%) completed four cycles, and one patient (8%) received 6 cycles. The median injected radioactivity (injected activity (IA)) was 8 MBq, ranging from 5.0 MBq to 11.0 MBq (approximately IA= 10 kBq/kg).
Baseline serum biomarkers and hematologic parameters were assessed in mCRPC patients prior to administration of [¹⁷⁷Lu]Lu-PSMA-617 and [²²⁵Ac]Ac-PSMA-617 therapy. Table 2 summarizes an overview of laboratory values before treatment initiation.
Treatment cycles for each patient are illustrated using a swimmer plot (Figure 1), highlighting the number of [¹⁷⁷Lu]Lu-PSMA-617 and [²²⁵Ac]Ac-PSMA-617 administrations as well as intervals between therapies. Patients received 2 to 8 cycles of [¹⁷⁷Lu]Lu-PSMA-617 and 2 to 6 cycles of [²²⁵Ac]Ac-PSMA-617.
2.2. Safety
Safety evaluations demonstrated stable clinical and biochemical profiles following [225Ac]Ac-PSMA-617 TAT. No patient exhibited signs or symptoms of urinary tract obstruction, as confirmed by repetition or sequential pre-treatment dynamic renal scintigraphy using [99mTc]Tc-MAG3.
Hematologic and renal biomarkers, including hemoglobin, white blood cell (WBC) count, platelet count, creatinine, estimated glomerular filtration rate (eGFR), alkaline phosphatase (ALP), and lactate dehydrogenase (LDH), remained stable throughout therapy. Comparative analyses between baseline and follow-up values showed no statistically significant changes (Figure 2), suggesting minimal hematologic and renal toxicity associated with [²²⁵Ac]Ac-PSMA-617.
PSA levels were analyzed pre and post RLT and TAT to assess treatment response (Figure 3). In the non-response group, PSA significantly increased from pre- to post- [²²⁵Ac]Ac-PSMA-617 TAT (***p < 0.001), whereas in the response group, PSA significantly decreased (**p < 0.01). Comparisons at other time points, including pre- and post-[¹⁷⁷Lu]Lu-PSMA-617 RLT, did not show statistically significant changes.
Functional status, assessed by the Barthel Index, which measures the patients’ ability to perform activities of daily living, remained preserved with a median score of 100 (100 points: the individual is completely independent in all 10 Activities of Daily Living (ADLs) and no physical assistance is required for any daily activity.) before and after TAT. This indicates that patients maintained full independence in daily living, underscoring the favorable tolerability of therapy.
Regarding salivary gland uptake (SGU), in our cohort, PSMA-SGU decreased by −63.7% after [225Ac]Ac-PSMA-617, closely matching the findings of Feuerecker et al. [25], who reported a −61% reduction in PSMA-SGU after one cycle of [225Ac]Ac-PSMA-617. Similarly, SUVmean fell by −45.5% in our data versus −42.4% in the Feuerecker series, supporting a reproducible, large functional impairment of salivary glands after targeted alpha therapy.
2.3. PSA-Based Biochemical Response After [²²⁵Ac]Ac-PSMA-617 Therapy
Figure 4 presents waterfall plots showing individual patients’ changes in PSA levels after the first cycle (panel I) and after the last cycle (panel II) of [225Ac]Ac-PSMA-617.
After the first cycle, 9 out of 12 patients (75%) exhibited a measurable decline in PSA levels, including 6 patients (50%) with reductions exceeding 30% and 3 patients (25%) surpassing the 50% threshold. Conversely, 3 patients (25%) showed either stable PSA levels or biochemical progression.
At the end of treatment, 8 patients (67%) maintained PSA reductions, with 5 patients (42%) showing > 50% decreases. Notably, 6 out of 7 patients with initial PSA declines ≥ 30% sustained their responses, suggesting durability of biochemical benefit.
The PSA kinetics offer critical insight into early therapeutic efficacy and align with molecular imaging outcomes (see Section 2.4), reinforcing the potential of TAT for disease control in patients refractory to prior [¹⁷⁷Lu]Lu-PSMA therapy.
2.4. Molecular Imaging Response Following [²²⁵Ac]Ac-PSMA-617 Therapy
Molecular treatment response was evaluated using [⁶⁸Ga]Ga-PSMA-11 PET/CT, focusing on changes in total tumor volume (TTV) and tracer uptake. Among the cohort:
- (7/12) exhibited partial molecular response.
- (3/12) demonstrated stable disease.
- (2/12) showed progressive disease.
Across the 32 treatment cycles administered:
- (24/32) resulted in partial molecular response,
- (4/32) in stable disease,
- (4/32) in progression.
These imaging outcomes mirrored PSA trends, reinforcing the concordance between biochemical and radiographic response. The disease control rate (DCR) was calculated as:
- 85.7% per cycle,
- 83.4% per patient, reflecting partial response or stable disease in 10 of 12 patients.
Figure 5 and Figure 6 illustrate representative [⁶⁸Ga]Ga-PSMA-11 PET/CT images, including individuals previously refractory to [¹⁷⁷Lu]Lu-PSMA-617 therapy who demonstrated near-complete molecular and biochemical responses after three cycles of TAT. Others who had progressed after treatment pauses showed disease stabilization following [²²⁵Ac]Ac-PSMA-617 TAT.
2.5. Survival Outcomes
Progression-free survival (PFS) and overall survival (OS) were analyzed using Kaplan-Meier methodology (Figure 7). The observed survival metrics were:
- Median PFS: 27 weeks (95% CI: 23–31 weeks)
- Median OS: 53 weeks (95% CI: 36–70 weeks)
- Probability of OS >100 weeks: 16%
Univariate analysis revealed that elevated PSA, ALP, and LDH, along with low hemoglobin, platelet count, and creatinine, were associated with poorer OS (Table 3).
Multivariate modeling (Table 4) further identified key predictors:
- LDH (p = 0.0024) and WBC count (p = 0.0013) were independently associated with reduced OS.
- Conversely, higher creatinine (p = 0.0058), hemoglobin (p = 0.0141), and eGFR (p < 0.0001) were linked to improved survival outcomes.
These findings suggest that integrating blood biomarkers alongside PSA and imaging parameters can offer enhanced prognostic insight and support tailored therapeutic strategies in mCRPC.
Kaplan-Meier plots showing (a) progression-free survival (PFS) and (b) overall survival (OS) in mCRPC patients treated with [²²⁵Ac]Ac-PSMA-617 TAT.
Median PFS was 27 weeks (95% CI: 23–31 weeks).
Median OS was 53 weeks (95% CI: 36–70 weeks).
Survival probabilities were:
31% for PFS >30 weeks
50% for OS >50 weeks
16% for OS >100 weeks
The dark lines represent Kaplan-Meier survival curves, while lighter lines indicate the upper and lower bounds of the 95% confidence intervals.
2.6. Meta-Analysis: Contextualizing [²²⁵Ac]Ac-PSMA-617 Efficacy and Safety Across Studies
To place our retrospective findings within a broader clinical framework, we conducted a meta-analysis of 8 published studies encompassing 675 patients treated with [²²⁵Ac]Ac-PSMA-617 for metastatic castration-resistant prostate cancer (mCRPC) [7,10,12,13,14,15,16,17]. This synthesis aimed not to replicate prior results, but to validate and contrast our cohort outcomes against pooled international data, particularly regarding PSA response rates. A meta-analysis of median PFS and OS was not performed because hazard ratios (and their associated variances) were not available in the pooled data. Figure 8 compares the outcomes of our retrospective cohort (n = 12) against pooled estimates from a meta-analysis (n = 675) across eight clinical measures. The meta-analytic pooled effect size was 0.56 (95% CI: 0.41–0.71), with a statistically significant overall effect (z = 7.50, p < 0.0001), indicating a meaningful proportion of events across studies.
Figure 9 presents the pooled PSA response rate for patients achieving a > 50% decline (ES = 0.60, 95% CI: 0.51–0.70) and includes a funnel plot showing no evidence of publication bias (Begg’s test p = 0.811, Egger’s test p = 0.782). The funnel plot illustrates that studies with larger sample sizes tend to have smaller standard errors and appear higher on the plot.
Pooled Efficacy Outcome
The meta-analysis revealed a pooled PSA response rate of 0.60 (≥ 50% decline). The result supports the clinical relevance of [²²⁵Ac]Ac-PSMA-617, particularly in heavily pretreated or refractory to [177Lu]Lu-PSMA-617 therapy mCRPC patients. The pooled PSA response rate aligns with our findings, though our cohort’s lower response may reflect more advanced disease burden prior [177Lu]Lu-PSMA RLT.
Study-Level Insights
Table 5 presents current strategies for the prevention of TAT-induced xerostomia, while Table 6 summarizes individual study outcomes. Notably, the study by Alan-Selcuk et al. [14] was excluded due to statistical heterogeneity, reinforcing the importance of methodological consistency in pooled analyses.
3. Discussion
Metastatic castration-resistant prostate cancer represents a major cause of cancer-related mortality among men and remains a significant therapeutic challenge despite advances in systemic treatments. Radioligand therapy with [¹⁷⁷Lu]Lu-PSMA-617 has demonstrated significant clinical efficacy in patients with mCRPC following prior lines of systemic treatment including hormone therapy, and chemotherapy; however, a subset of patients unfortunately exhibits limited or no response on PSA reduction [11,13,17]. In our department, [²²⁵Ac]Ac-PSMA-617 TAT has been administrated to a selectively chosen patient cohort following multidisciplinary tumor board evaluation. This approach used to improve therapeutic efficacy. Within the framework of our retrospective analysis, we assessed targeted alpha therapy and directly compared its therapeutic outcomes with those of [¹⁷⁷Lu]Lu-PSMA-617 using hematological and renal function biomarkers. While PSA remains a standard biomarker for assessing therapeutic response in mCRPC, its limitations are increasingly evident, particularly in patients receiving beta or alpha therapies where discordance between PSA kinetics and clinical or imaging response is not uncommon [26]. Recent studies have emphasized incorporating additional biomarkers to achieve a more comprehensive assessment of treatment efficacy. Biochemical markers such as alkaline phosphatase (ALP) and gamma-glutamyl transferase (GGT) have demonstrated correlations with treatment outcomes, particularly in patients treated with [¹⁷⁷Lu]Lu-PSMA-617 based on the Fanti et al. study [27]. They mentioned that lower GGT and ALP at treatment start were significantly associated with a lower risk of progression during [¹⁷⁷Lu]Lu-PSMA-617 therapy and GGT>31 U/l at treatment start remained a statistically significant predictor, associated with 1.5 times higher risk of progression. A multicenter trial including 61 patients pretreated with abiraterone/enzalutamide (75.4%) and docetaxel/cabazitaxel (68.9%) who received three cycles of PSMA-RLT depicted that the levels of basal Hb were able to predict survival of patients. Similarly, normal pre-treatment Hb levels were predictive for a ≥ 50% PSA decline during therapy, while lower pre-treatment Hb levels were associated with a lack of PSA reduction [28]. However, the paper by Grubmüller et al. did not confirm this finding possibly caused by the relatively low patient number included in this trial [29]. Moreover, the presence of high LDH levels was associated with poor OS in several trials assessing its predictive impact during RLT [30,31,32]. Interestingly, LDH kinetics within two to three months during therapy have been reported as predictive biomarker in a retrospective trial including 137 patients [30], however, another trial did not confirm this finding [29]. Integrating these biochemical biomarkers with PSA kinetics could offer a more comprehensive framework for evaluating therapeutic efficacy and optimizing treatment selection in mCRPC. Based on our pooled meta-analysis, median PFS and OS could not be reliably estimated due to the unavailability of hazard ratios and their associated variances. Nevertheless, [²²⁵Ac]Ac-PSMA targeted alpha therapy (TAT) demonstrated substantial therapeutic benefit in heavily pretreated mCRPC patients, with reported median OS ranging from 7.7 to 15.5 months, median PFS from 3.1 to 15.2 months, and PSA response rates between 26% and 90% (Table 6). However, notable safety concerns were observed, particularly xerostomia (77%) grade I-II and hematologic toxicities (4%–35%), whereas renal toxicity remained comparatively low (up to 7%). Collectively, these findings highlight a favorable efficacy profile but emphasize the importance of carefully weighing safety considerations in clinical decision-making (Table 6). We evaluated the efficacy and outcomes of [225Ac]Ac-PSMA-617 in 12 mCRPC patients using biochemical and molecular tumor responses, DCR, and survival analysis. A PSA decline was observed in 75% of patients after the first cycle, with a PSA decline of > 50% in 25%. At the last follow-up, 67% of patients had a PSA decline, with 42% showing a > 50% reduction, while 25% had progressive disease (Figure 4). The mean PFS was approximately 27 weeks (6.3 months), and the mean OS was around 53 weeks (12.4 months) (Figure 7). No significant changes in ALP, creatinine, eGFR, hemoglobin, LDH, platelet, or WBC levels were observed between pre- and post-therapy, suggesting minimal hematologic and renal toxicity (Figure 2).
When comparing our findings with the pooled meta-analysis, both observed favorable PSA responses (Figure 8 and Figure 9). However, our study reported a lower PSA response rate (42% with > 50% decline) compared to the meta-analysis (60%). This discrepancy may be attributed to differences in patient populations, as our cohort included patients refractory to previous [177Lu]Lu-PSMA-617 therapy, which may have contributed to the lower biochemical response observed.
Regarding safety, the meta-analysis highlighted xerostomia as significant concerns (Table 5). Our study corroborated these findings, noting increased salivary gland uptake over successive therapy cycles, potentially contributing to xerostomia. In addition, renal toxicity remained minimal, as reflected in stable eGFR and creatinine levels.
Our results align closely with those of van der Doelen et al. [7], where a significant proportion of patients experienced PSA declines exceeding 50%. However, our findings contrast with those of Yadav et al. (39%) [2], possibly due to differences in prior therapies. Additionally, our cohort had previously received [177Lu]Lu-PSMA-617 therapy, whereas only two patients in van der Doelen et al.’s study had prior radioligand therapy before TAT, making direct comparisons of treatment resistance challenging.
Similarly, Zacherl et al. reported that 50% of patients had PSA declines following a single cycle of [225Ac]Ac-PSMA-I&T. Differences in PSA responses between our study and theirs may be attributed to variations in radiopharmaceutical uptake [17]. Feuerecker et al. also reported higher PSA response rates (65% with > 50% reduction), possibly due to differences in disease stage, metastatic sites, tumor burden, and biodistribution [13].
PET/CT imaging using PSMA peptide remains the preferred modality for evaluating treatment efficacy in RLT and TAT. Our study incorporated TTV analysis as a quantitative measure of treatment response. Post-[225Ac]Ac-PSMA-617 therapy assessment using [68Ga]Ga-PSMA-11 PET/CT demonstrated a partial response in 58% of patients, with 43% achieving > 50% PSA declines. This correlation between TTV and PSA response suggests TTV could serve as a valuable biomarker, though larger cohort validation is needed.
A recent large-scale study by Sathekge et al. involving 488 patients reported a median OS of 15.5 months and PFS of 7.9 months [15] while our study found an OS of 12.4 months and a PFS of 6.3 months. Variations in OS may stem from differences in patient characteristics and prior treatments. Unlike Sathekge et al., we incorporated blood biomarker analysis (Table 2), revealing significant correlations between treatment outcomes and specific biomarkers.
Emerging evidence suggests a new scoring system (V-score) based on post-treatment PSMA PET/CT imaging rather than PSA levels and uptake values [33]. While promising, this approach has been primarily explored in neuroendocrine tumors (NETs) and lymphomas, with limited application in mCRPC. Our study represents a potential first step in evaluating the role of V-scoring and blood biomarkers results for TAT efficacy assessment, warranting further investigation. Additionally, the correlation between TTV and PSA response suggests that TTV extracted from [68Ga]Ga-PSMA PET/CT images could aid in absorbed dose estimation, addressing post-TAT dosimetry challenges posed by suboptimal [225Ac]Ac-PSMA imaging.
Our study indicated that the multivariate (Table 4) and univariate blood biomarker (Table 3) results can impact on further treatment efficacy stratification. While PSA and ALP did not independently predict OS, elevated LDH and WBC levels correlated with poorer survival, suggesting a higher tumor burden and inflammatory response. Conversely, hemoglobin, creatinine, and eGFR levels were linked to improved OS, reflecting overall patient status. These findings underscore the importance of integrating blood biomarkers into treatment monitoring and personalized management strategies.
Notably, the Barthel Index remained unchanged following both [177Lu]Lu-PSMA RLT and [225Ac]Ac-PSMA TAT, suggesting that both therapies are generally well-tolerated without compromising functional independence (Table 1). This reinforces the potential of sequential TAT to maintain quality of life while providing therapeutic benefits.
The tumor sink effect observed in patients responding to [225Ac]Ac-PSMA-617 therapy, characterized by increased salivary gland uptake in sequential therapy cycles and then decreased uptake in the follow-up PET/CT image (Figure 5 and Figure 6), may serve as an indirect marker of treatment response. However, its contribution to xerostomia warrants careful monitoring.
While our study had limitations, including its retrospective design, and small sample size, it provides valuable insights into the efficacy of [225Ac]Ac-PSMA-617 therapy. The exclusion of some patients with prior [177Lu]Lu-PSMA-617 therapy due to lack of follow-up imaging after actinium therapy helped ensures a more homogeneous study population. Future multi-center studies with larger cohorts and prospective designs will be essential to further validate these findings and enhance their applicability to broader patient populations.
It’s important to emphasize that our cohort represented a particularly challenging clinical context. All patients had previously undergone multiple cycles of [¹⁷⁷Lu]Lu-PSMA-617 (Figure 1), finally resulting in biochemical non-responsiveness and signs of progressive disease. At the time of transition to [²²⁵Ac]Ac-PSMA-617 TAT, several patients already exhibited early symptoms of xerostomia highlighting not only the cumulative treatment burden but also the clinical complexity of decision-making in this setting. The initiation of TAT in these patients was far from straightforward; it involved balancing the potential therapeutic benefit of high-LET alpha particle therapy against the known and anticipated risks of dose-limiting toxicity. This underscores the need for tailored interventions, informed consent, and quality-of-life–focused treatment planning, especially when patients are navigating refractory disease states. It is important to note that severity grading is inconsistently reported across pooled studies often limited to Common Terminology Criteria for Adverse Events (CTCAE) Grade 1–2 without longitudinal follow-up. In our cohort, all affected patients retained functional salivary output, suggesting a predominance of mild-to-moderate (Stage I) toxicity. Thus, this comparison likely reflects a worst-case prevalence scenario, rather than a direct severity match. The elevated xerostomia rate in our cohort likely stems from cumulative radioligand exposure, low tumor burden (tumor sink effect), and prior [¹⁷⁷Lu]Lu-PSMA exposure. These observations underscore the importance of toxicity-aware dosing and personalized mitigation approaches. In response to this challenge, we implemented external cooling (ice packs) during radioligand infusion. Despite its practicality and favorable tolerability, recent evidence including findings from Muniz et al. [34] demonstrated limited efficacy in reducing salivary uptake. To enhance protective efforts, we now plan to introduce prophylactic oral vitamin C, which has demonstrated promising SUVmean reductions ranging from 26–52% in prospective PSMA-PET/CT studies. These efforts reflect an evolving, patient-centered strategy to reduce glandular toxicity, preserve quality of life, and refine supportive care protocols. Looking ahead, future therapeutic planning in mCRPC should prioritize clinical frameworks that better navigate the trade-offs between efficacy and tolerability especially for patients with prior radioligand exposure and symptomatic toxicity. Our findings highlight the need for tools that integrate disease burden, prior [¹⁷⁷Lu]Lu-PSMA exposure, and functional salivary gland status into predictive algorithms or TAT suitability scores. Personalized models could enable risk stratification for severe xerostomia and help optimize dosing schedules accordingly. Moreover, integration of validated patient-reported outcome instruments would allow longitudinal tracking of xerostomia severity and reversibility, providing a foundation for survivorship planning and therapeutic adaptation.
4. Materials and Methods
4.1. Patients and Ethics
This retrospective study included consecutive patients with mCRPC who received [225Ac]Ac-PSMA-617 therapy after demonstrating resistance to prior treatments. Patients were considered treatment refractory if they no longer responded to androgen deprivation therapy (ADT), chemotherapy, radiotherapy, and multiple cycles of [177Lu]Lu-PSMA-617 RLT (median [min-max]: 3 [2,3,4,5,6,7,8] cycles). Other resistance was determined by a sustained increase in serum PSA levels, progression of existing disease, or the appearance of new metastases despite castrate testosterone levels. To be included in the analysis, patients had to have complete follow-up data available at least 6 weeks after each cycle. Eligibility for [225Ac]Ac-PSMA-617 TAT required progression on or resistance to [177Lu]Lu-PSMA-617 RLT, or the presence of extensive metastasis despite prior treatments.
Treatment decisions were approved by a tumor board after a comprehensive review of each patient’s medical history and current status. The study was conducted at the Department of Nuclear Medicine, Philipps University Hospital, Marburg, Germany, between July 2021 and January 2024.
Treatment was administered on a compassionate use basis in accordance with the German Medical Products Act (Arzneimittelgesetz – AMG §13 (2b)). To be eligible, patients must have had disease progression despite other treatments such as chemotherapy, radiotherapy, or second-generation anti-androgen therapy, or the tumor board determined that these interventions were contraindicated. All patients were informed of the experimental nature of [225Ac]Ac-PSMA-617 therapy and signed consent forms.
This retrospective study was approved by the Ethics Committee of the School of Medicine at Philipps University of Marburg (Ethics vote reference number: 24-109 RS, approval date: 25/04/2024).
4.2. [225Ac]Ac-PSMA-617 Administration
The PSMA-617 peptide was labeled with [225Ac]AcCl3 (ITM Isotope Technologies, Garching, Germany), and after radiosynthesis and quality control, it was administered intravenously. The administered activity was 100 kBq/kg of [225Ac]Ac-PSMA-617, an activity proposed by Kratochwil et al. [11] as a balanced amount to enhance therapeutic efficacy while minimizing adverse effects. Details of the labeling process are described in Appendix A.
To potentially reduce salivary gland perfusion, radiopharmaceutical uptake, and toxicity, patients’ salivary glands were covered with cool packs 30 minutes before and up to 4 hours after radiopharmaceutical administration. In the event of post-injection nausea, patients were treated with Granisetron.
In compliance with the German Radiation Protection Act, [225Ac]Ac-PSMA-617 therapy was administered on an inpatient basis, with patients remaining in the nuclear medicine ward for at least 48 hours post-administration before being discharged when deemed medically appropriate. A minimum of two cycles of therapy were scheduled, administered at 6-week intervals. Subsequent dosage, cycle number, and interval were adjusted individually based on the disease burden, patient condition, and logistical factors.
4.3. Safety, Efficacy, and Treatment Outcome Evaluation
4.3.1. Safety Monitoring
Safety was evaluated based on laboratory data, including blood biomarkers (hemoglobin, white blood cell count, platelet count, creatinine level, estimated glomerular filtration rate (eGFR), alkaline phosphatase (ALP), lactate dehydrogenase (LDH), and renal function tests). These were assessed at baseline, after each subsequent cycle, and during follow-up. Bone marrow, and renal toxicities—common side effects of this treatment modality—were graded using laboratory data. Renal toxicity was graded based on changes in eGFR, and hematological adverse effects (e.g., anemia, leukopenia, thrombocytopenia) were also tracked.
4.3.2. Salivary Gland Uptake
Quantitative parameters, including SUVmax and SUVmean, were extracted for the salivary glands as organs at risk (OAR) through segmentation of [68Ga]Ga-PSMA-11 PET/CT images. Segmentation was performed using HERMES software (HERMES Medical Solutions, Sweden), which enabled precise delineation of salivary glands for accurate measurement and analysis.
4.3.3. Renal Function
Each patient underwent dynamic renal scintigraphy using [99mTc]Tc-MAG3 prior to each cycle to detect any potential urinary tract obstruction [35].
4.3.4. Functional Status
The Barthel-Index was calculated to evaluate the patient’s functional status at baseline and after treatment. This index assesses a patient’s ability to perform daily activities, with scores ranging from zero (complete dependence) to 100 (complete independence) [36]. The index was administered by trained clinicians at our institution.
4.3.5. Efficacy and Treatment Outcome Evaluation
It was characterized using four endpoints:
- Biochemical response was defined based on the percentage change in PSA from baseline, with the criteria of the Prostate Cancer Working Group 3 (PCWG3) guidelines [37]. A biochemical response is defined as a decline in PSA levels after treatment. In this study, we considered a decline > 30% in PSA level as a positive sign of therapeutic efficacy. A partial response was defined as a decline of > 50%, while biochemical disease progression was defined as an increase of > 25% in PSA from baseline.
-
Molecular tumor response after every two cycles of TAT was categorized based on changes from baseline in TTV as reflected by [68Ga]Ga-PSMA-11 uptake values extracted from PET/CT images, which were most often acquired after every 2 cycles of TAT:
- Molecular partial response: > 30% decrease.
- Molecular progressive disease: > 20% increase.
- Molecular stable disease: ≤ 30% change, (changes < 30% decrease or < 20% increase)
TTV segmentation was performed using HERMES software. Disease progression was evaluated using Response Evaluation Criteria in Solid Tumors (PERCIST 1.0) [38].
- Disease control rate (DCR) was calculated by dividing the number of patients exhibiting a partial response or stable disease on molecular imaging by the total number of patients.
- PFS was defined as the interval between the initial TAT administration and the first documentation of biochemical or molecular disease progression on imaging, or the date of last contact (if no progression was observed). OS was defined as the interval between the first TAT administration and the patient’s death or the date of last clinical visit.
4.4. Meta-Analysis
A meta-analysis was conducted to assess the efficacy and safety of [²²⁵Ac]Ac-PSMA TAT in patients with mCRPC. A comprehensive clinical literature search was performed using PubMed, Scopus, and Web of Science databases to identify relevant studies published up to 2024. Inclusion criteria encompassed prospective and retrospective studies reporting at least one clinical outcome, including OS, PFS, PSA response, and treatment-related toxicities such as xerostomia, hematologic toxicity, and renal toxicity.
Using meta-analysis, the pooled PSA response rate (PSA decline < 50%) across eligible studies was estimated. Relevant data were extracted from each study, including the number of patients achieving a PSA response as defined by study-specific criteria. A random-effects meta-analysis and 95% confidence intervals were conducted using the Restricted Maximum Likelihood (REML) estimation method to account for potential heterogeneity among studies. The effect size was defined as the proportion of events (prop), with standard errors (se) provided by each study.
Heterogeneity was assessed using the following metrics:
- τ² (tau-squared) = 0.0055, indicating low between-study variance.
- I² = 29.76%, suggesting moderate heterogeneity.
- H² = 1.42, indicating the presence of some inconsistency across studies.
The test for homogeneity yielded a non-significant result (Q(1) = 1.42, p < 0.10), suggesting that the observed heterogeneity is not statistically significant. The statistical significance of the overall effect was evaluated using the Z-test. All analyses were performed using STATA software, version 18 (StataCorp LLC, College Station, TX, USA).
4.5. Statistics
No formal sample size calculation was made for this retrospective observational study. PSA levels and other laboratory markers following [225Ac]Ac-PSMA-617 TAT were compared with baseline using a one-way analysis of variance (ANOVA). Kaplan-Meier survival curves were generated for both PFS and OS. Univariate analysis was performed to assess the association between hematologic biomarkers and OS. Each biomarker was analyzed individually to determine its potential prognostic significance. Threshold levels were established based on the median values obtained after two cycles of therapy. Statistical significance was determined using p-values, with a threshold set at p < 0.05. Following univariate analysis, a multivariate analysis was conducted to evaluate the independent impact of blood biomarkers on OS. Results were expressed as beta coefficients (β) to quantify the strength and direction of associations. All statistical analyses were performed using GraphPad Prism 8.0.1 (GraphPad Software, Boston, MA, USA).
5. Conclusions
This study regards TAT with [225Ac]Ac-PSMA-617 as a treatment option for mCRPC patients who had developed resistance to [177Lu]Lu-PSMA-617 therapy. [68Ga]Ga-PSMA-11 PET imaging and blood biomarkers may serve as useful predictors for assessing treatment efficacy and outcomes in mCRPC patients receiving [225Ac]Ac-PSMA-617 TAT. Although PSA level monitoring is a widely used approach to evaluate treatment response, incorporating TTV measurements and blood biomarkers could provide additional insights into therapeutic effectiveness. In addition, the findings in our patient population suggested that a > 50% decrease in PSA levels following the first two cycles of TAT can serve as a predictive marker for favorable treatment outcomes in subsequent cycles. Interestingly, pre-therapeutic biomarkers extracted from blood tests such as PSA, hemoglobin, creatinine, and platelet count may help as the prognostic biomarkers for survival outcomes and efficacy evaluation after TAT. Tumor uptake, biodistribution, and TTV are promising parameters for evaluating the efficacy and outcomes of TAT. The tumor sink effect could be considered in subsequent [225Ac]Ac-PSMA-617 therapy cycles, as tumor burden reduction may increase salivary gland uptake, potentially worsening toxicity, and optimizing therapy with semi-quantitative PET analysis can balance efficacy and safety. Post-treatment dosimetry and the estimation of absorbed doses for organs at risk following TAT present a novel challenge due to the suboptimal quality of post-treatment [225Ac]Ac-PSMA-617 SPECT and planar images. It is proposed that [68Ga]Ga-PSMA-11 PET images may be employed as a predictor of absorbed dose for post-TAT dosimetry evaluation in organs at risk.
Author Contributions
All authors contributed equally to this work.
Funding
This research received no external funding.
Acknowledgments
We thank Ms. Birgit Herbst-Brück, Ms. Eva Rittich, and Ms. Ann-Katrin Mink, for their valuable technical assessment in the Radiopharmacy section. We also appreciate the assistance provided by the ward staff and the medical technologists in the Department of Nuclear Medicine.
Conflicts: of Interest: The authors declare no conflict of interest.
Abbreviations
| 68Ga | Gallium-68 |
| 177Lu | Lutetium-177 |
| 223Ra | Radium-223 |
| 225Ac | Actinium-225 |
| ADT | Androgen Deprivation Therapy |
| ALP | Alkaline Phosphatase |
| CI | Confidence Interval |
| eGFR | estimated Glomerular Filtration Rate |
| LDH | Lactate dehydrogenase |
| mCRPC | metastatic Castration-Resistant Prostate Cancer |
| OS | Overall Survival |
| PET/CT | Positron Emission Tomography/Computed Tomography |
| PFS | Progression-Free Survival |
| PSA | Prostate-Specific Antigen |
| PSMA | Prostate-Specific Membrane Antigen |
| RLT | Radioligand Therapy |
| TAT | Targeted Alpha Therapy |
| WBC | White Blood Cell |
| SUV | Standardized Uptake Value |
| CTCAE | Common Terminology Criteria for Adverse Events |
| SGU | Salivary Gland Uptake |
Appendix A
Appendix A.1. Radiopharmaceutical Preparation
Vipivotide tetraxetan (PSMA-617, 10µg/GBq) was added to 1 mL of 0.1M sodium ascorbate stock solution. The mixed solution was added into the vial containing 225AcCl3 (ITM Isotope Technologies, Garching, Germany), then was shaken gently. Then, the vial was heated at 90 ˚C for 25 minutes. After cooling to room temperature, the [225Ac]Ac-PSMA-617 product was diluted with 5 mL of NaCl and filtered through a sterile filter.
Instant radio thin-layer chromatography (rTLC) was performed for quality control at room temperature by pipetting 5µL of the final product onto an iTLC-SA strip using Natrium-Citrate-buffer and an iTLC-SG strip using Ammonium acetate (MeOH-NH4Ac) buffer. The radiochemical yield was determined using a TLC scanner Marita Star (Elysia Raytest) ≥ 95%, and the pH was 7–8. Additionally, bacterial endotoxin level was tested <10 EU/mL using he Endosafe nexgen-PTS (Charles River) before releasing for patient application.
References
- Kratochwil, C. PSMA-targeted radionuclide therapy of metastatic castration-resistant prostate cancer with 177Lu-labeled PSMA-617. J. Nucl. Med. 2016, vol. 57(no. 8), 1170–1176. [Google Scholar] [CrossRef]
- Yadav, M. P.; Ballal, S.; Sahoo, R. K.; Tripathi, M.; Seth, A.; Bal, C. Efficacy and safety of 225Ac-PSMA-617 targeted alpha therapy in metastatic castration-resistant prostate cancer patients. Theranostics 2020, vol. 10(no. 20), 9364. [Google Scholar] [CrossRef] [PubMed]
- Sartor. Lutetium-177–PSMA-617 for metastatic castration-resistant prostate cancer. N. Engl. J. Med. 2021, vol. 385(no. 12), 1091–1103. [Google Scholar] [CrossRef] [PubMed]
- Violet, J. Long-term follow-up and outcomes of retreatment in an expanded 50-patient single-center phase II prospective trial of 177Lu-PSMA-617 theranostics in metastatic castration-resistant prostate cancer. J. Nucl. Med. 2020, vol. 61(no. 6), 857–865. [Google Scholar] [CrossRef]
- Sartor; Herrmann, K. Prostate cancer treatment: 177Lu-PSMA-617 considerations, concepts, and limitations. J. Nucl. Med. 2022, vol. 63(no. 6), 823–829. [Google Scholar] [CrossRef] [PubMed]
- Yadav, M. P.; Ballal, S.; Sahoo, R. K.; Dwivedi, S. N.; Bal, C. Radioligand therapy with 177Lu-PSMA for metastatic castration-resistant prostate cancer: a systematic review and meta-analysis. Am. J. Roentgenol. 2019, vol. 213(no. 2), 275–285. [Google Scholar] [CrossRef]
- van der Doelen, M. J. Clinical outcomes and molecular profiling of advanced metastatic castration-resistant prostate cancer patients treated with 225Ac-PSMA-617 targeted alpha-radiation therapy. In in Urologic Oncology: Seminars and Original Investigations; Elsevier, 2021; pp. 729–e7. [Google Scholar]
- Rumiantcev, M. Estimation of relative biological effectiveness of 225Ac compared to 177Lu during [225Ac] Ac-PSMA and [177Lu] Lu-PSMA radiopharmaceutical therapy using TOPAS/TOPAS-nBio/MEDRAS. EJNMMI Phys. 2023, vol. 10(no. 1), 53. [Google Scholar] [CrossRef]
- Audi, G.; Kondev, F. G.; Wang, M.; Huang, W. J.; Naimi, S. The NUBASE2016 evaluation of nuclear properties. Chin. Phys. C 2017, vol. 41(no. 3), 30001. [Google Scholar] [CrossRef]
- Sathekge, M. Predictors of overall and disease-free survival in metastatic castration-resistant prostate cancer patients receiving 225Ac-PSMA-617 radioligand therapy. J. Nucl. Med. 2020, vol. 61(no. 1), 62–69. [Google Scholar] [CrossRef]
- Kratochwil, C. Targeted α-therapy of metastatic castration-resistant prostate cancer with 225Ac-PSMA-617: dosimetry estimate and empiric dose finding. J. Nucl. Med. 2017, vol. 58(no. 10), 1624–1631. [Google Scholar] [CrossRef]
- Kratochwil, C. Targeted α-therapy of metastatic castration-resistant prostate cancer with 225Ac-PSMA-617: swimmer-plot analysis suggests efficacy regarding duration of tumor control. J. Nucl. Med. 2018, vol. 59(no. 5), 795–802. [Google Scholar] [CrossRef]
- Feuerecker, B. Activity and adverse events of actinium-225-PSMA-617 in advanced metastatic castration-resistant prostate cancer after failure of lutetium-177-PSMA. Eur. Urol. 2021, vol. 79(no. 3), 343–350. [Google Scholar] [CrossRef]
- Alan-Selcuk, N. Clinical Experience with [225Ac] Ac-PSMA Treatment in Patients with [177Lu] Lu-PSMA–Refractory Metastatic Castration-Resistant Prostate Cancer. J. Nucl. Med. 2023, vol. 64(no. 10), 1574–1580. [Google Scholar] [CrossRef]
- Sathekge, M. M. Actinium-225-PSMA radioligand therapy of metastatic castration-resistant prostate cancer (WARMTH Act): a multicentre, retrospective study. Lancet Oncol. 2024, vol. 25(no. 2), 175–183. [Google Scholar] [CrossRef]
- Sathekge, M. 225 Ac-PSMA-617 in chemotherapy-naive patients with advanced prostate cancer: a pilot study. Eur. J. Nucl. Med. Mol. Imaging 2019, vol. 46, 129–138. [Google Scholar] [CrossRef] [PubMed]
- Zacherl, M. J. First clinical results for PSMA-targeted α-therapy using 225Ac-PSMA-I&T in advanced-mCRPC patients. J. Nucl. Med. 2021, vol. 62(no. 5), 669–674. [Google Scholar]
- Ovčariček, P. Petranović; Garo, M. L.; Giovanella, L. PSMA-targeted radioligand therapy in metastatic prostate cancer: Comprehensive analysis of recent evidence. In Springer; 01 Mar 2025. [Google Scholar] [CrossRef]
- Groener, D. Impact of [177Lu] Lu-PSMA-617 radioligand therapy on reference organ uptake assessed by [68Ga] Ga-PSMA-11-PET/CT. Cancers (Basel). 2023, vol. 15(no. 15), 3878. [Google Scholar] [CrossRef] [PubMed]
- Turco, F.; Gillessen, S.; Herrmann, K.; Paone, G.; Omlin, A. Treatment Landscape of Prostate Cancer in the Era of PSMA Radiopharmaceutical Therapy. J. Nucl. Med. 2025, vol. 66(no. 5), 665 LP–672. [Google Scholar] [CrossRef]
- Tannock, I.F. Docetaxel plus prednisone or mitoxantrone plus prednisone for advanced prostate cancer. N. Engl. J. Med. 2004, vol. 351(no. 15), 1502–1512. [Google Scholar] [CrossRef]
- Petrylak, D. P. Docetaxel and estramustine compared with mitoxantrone and prednisone for advanced refractory prostate cancer. N. Engl. J. Med. 2004, vol. 351(no. 15), 1513–1520. [Google Scholar] [CrossRef] [PubMed]
- de Bono, J. S. Prednisone plus cabazitaxel or mitoxantrone for metastatic castration-resistant prostate cancer progressing after docetaxel treatment: a randomised open-label trial. Lancet (London, England) 2010, vol. 376(no. 9747), 1147–1154. [Google Scholar] [CrossRef]
- de Wit, R. Cabazitaxel versus Abiraterone or Enzalutamide in Metastatic Prostate Cancer. N. Engl. J. Med. 2019, vol. 381(no. 26), 2506–2518. [Google Scholar] [CrossRef]
- Feuerecker, B. Comparative analysis of morphological and functional effects of 225Ac-and 177Lu-PSMA radioligand therapies (RLTs) on salivary glands. Int. J. Mol. Sci. 2023, vol. 24(no. 23), 16845. [Google Scholar] [CrossRef]
- Tidd-Johnson, A. Prostate cancer screening: Continued controversies and novel biomarker advancements. Curr. Urol. 2022, vol. 16(no. 4), 197–206. [Google Scholar] [CrossRef] [PubMed]
- Kafka, M. Real-world Outcomes and Predictive Biomarkers for (177)Lutetium Prostate-specific Membrane Antigen Ligand Treatment in Metastatic Castration-resistant Prostate Cancer: A European Association of Urology Young Academic Urologists Prostate Cancer Working Gr. Eur. Urol. Oncol. 2024, vol. 7(no. 3), 421–429. [Google Scholar] [CrossRef]
- Rasul, S. Prediction of response and survival after standardized treatment with 7400 MBq (177)Lu-PSMA-617 every 4 weeks in patients with metastatic castration-resistant prostate cancer. Eur. J. Nucl. Med. Mol. Imaging 2021, vol. 48(no. 5), 1650–1657. [Google Scholar] [CrossRef] [PubMed]
- Grubmüller, B. Response assessment using (68)Ga-PSMA ligand PET in patients undergoing (177)Lu-PSMA radioligand therapy for metastatic castration-resistant prostate cancer. Eur. J. Nucl. Med. Mol. Imaging 2019, vol. 46(no. 5), 1063–1072. [Google Scholar] [CrossRef] [PubMed]
- Yordanova, A. The value of tumor markers in men with metastatic prostate cancer undergoing [(177) Lu]Lu-PSMA therapy. Prostate 2020, vol. 80(no. 1), 17–27. [Google Scholar] [CrossRef]
- Rathke, H. Response Prediction of (177)Lu-PSMA-617 Radioligand Therapy Using Prostate-Specific Antigen, Chromogranin A, and Lactate Dehydrogenase. J. Nucl. Med. 2020, vol. 61(no. 5), 689–695. [Google Scholar] [CrossRef]
- Ferdinandus, J. Prognostic biomarkers in men with metastatic castration-resistant prostate cancer receiving [177Lu]-PSMA-617. Eur. J. Nucl. Med. Mol. Imaging 2020, vol. 47(no. 10), 2322–2327. [Google Scholar] [CrossRef]
- Mittlmeier, L. M. Feasibility of different tumor delineation approaches for 18F-PSMA-1007 PET/CT imaging in prostate cancer patients. Front. Oncol. 2021, vol. 11, 663631. [Google Scholar] [CrossRef] [PubMed]
- Muniz, M. Salivary toxicity from PSMA-targeted radiopharmaceuticals: what we have learned and where we are going. Cancer Treat. Rev. 2024, vol. 127, 102748. [Google Scholar] [CrossRef]
- Ahmadzadehfar, H.; Rahbar, K.; Essler, M.; Biersack, H. J. PSMA-Based Theranostics: A Step-by-Step Practical Approach to Diagnosis and Therapy for mCRPC Patients. Semin. Nucl. Med. 2020, vol. 50(no. 1), 98–109. [Google Scholar] [CrossRef]
- Hobart, J. C.; Thompson, A. J. The five item Barthel index. J. Neurol. Neurosurg. Psychiatry 2001, vol. 71(no. 2), 225–230. [Google Scholar] [CrossRef]
- Scher, H. I. Trial Design and Objectives for Castration-Resistant Prostate Cancer: Updated Recommendations From the Prostate Cancer Clinical Trials Working Group 3. J. Clin. Oncol. Off. J. Am. Soc. Clin. Oncol. 2016, vol. 34(no. 12), 1402–1418. [Google Scholar] [CrossRef] [PubMed]
- Wahl, R. L.; Jacene, H.; Kasamon, Y.; Lodge, M. A. From RECIST to PERCIST: Evolving Considerations for PET response criteria in solid tumors. J. Nucl. Med. 2009, vol. 50 Suppl 1, no. Suppl 1, 122S–50S. [Google Scholar] [CrossRef] [PubMed]
Figure 1.
Swimmer plot illustrating the treatment timeline for each mCRPC patient, including administration time of [¹⁷⁷Lu]Lu-PSMA-617 (blue), [²²⁵Ac]Ac-PSMA-617 (red), and pauses between therapies (green).
Figure 1.
Swimmer plot illustrating the treatment timeline for each mCRPC patient, including administration time of [¹⁷⁷Lu]Lu-PSMA-617 (blue), [²²⁵Ac]Ac-PSMA-617 (red), and pauses between therapies (green).
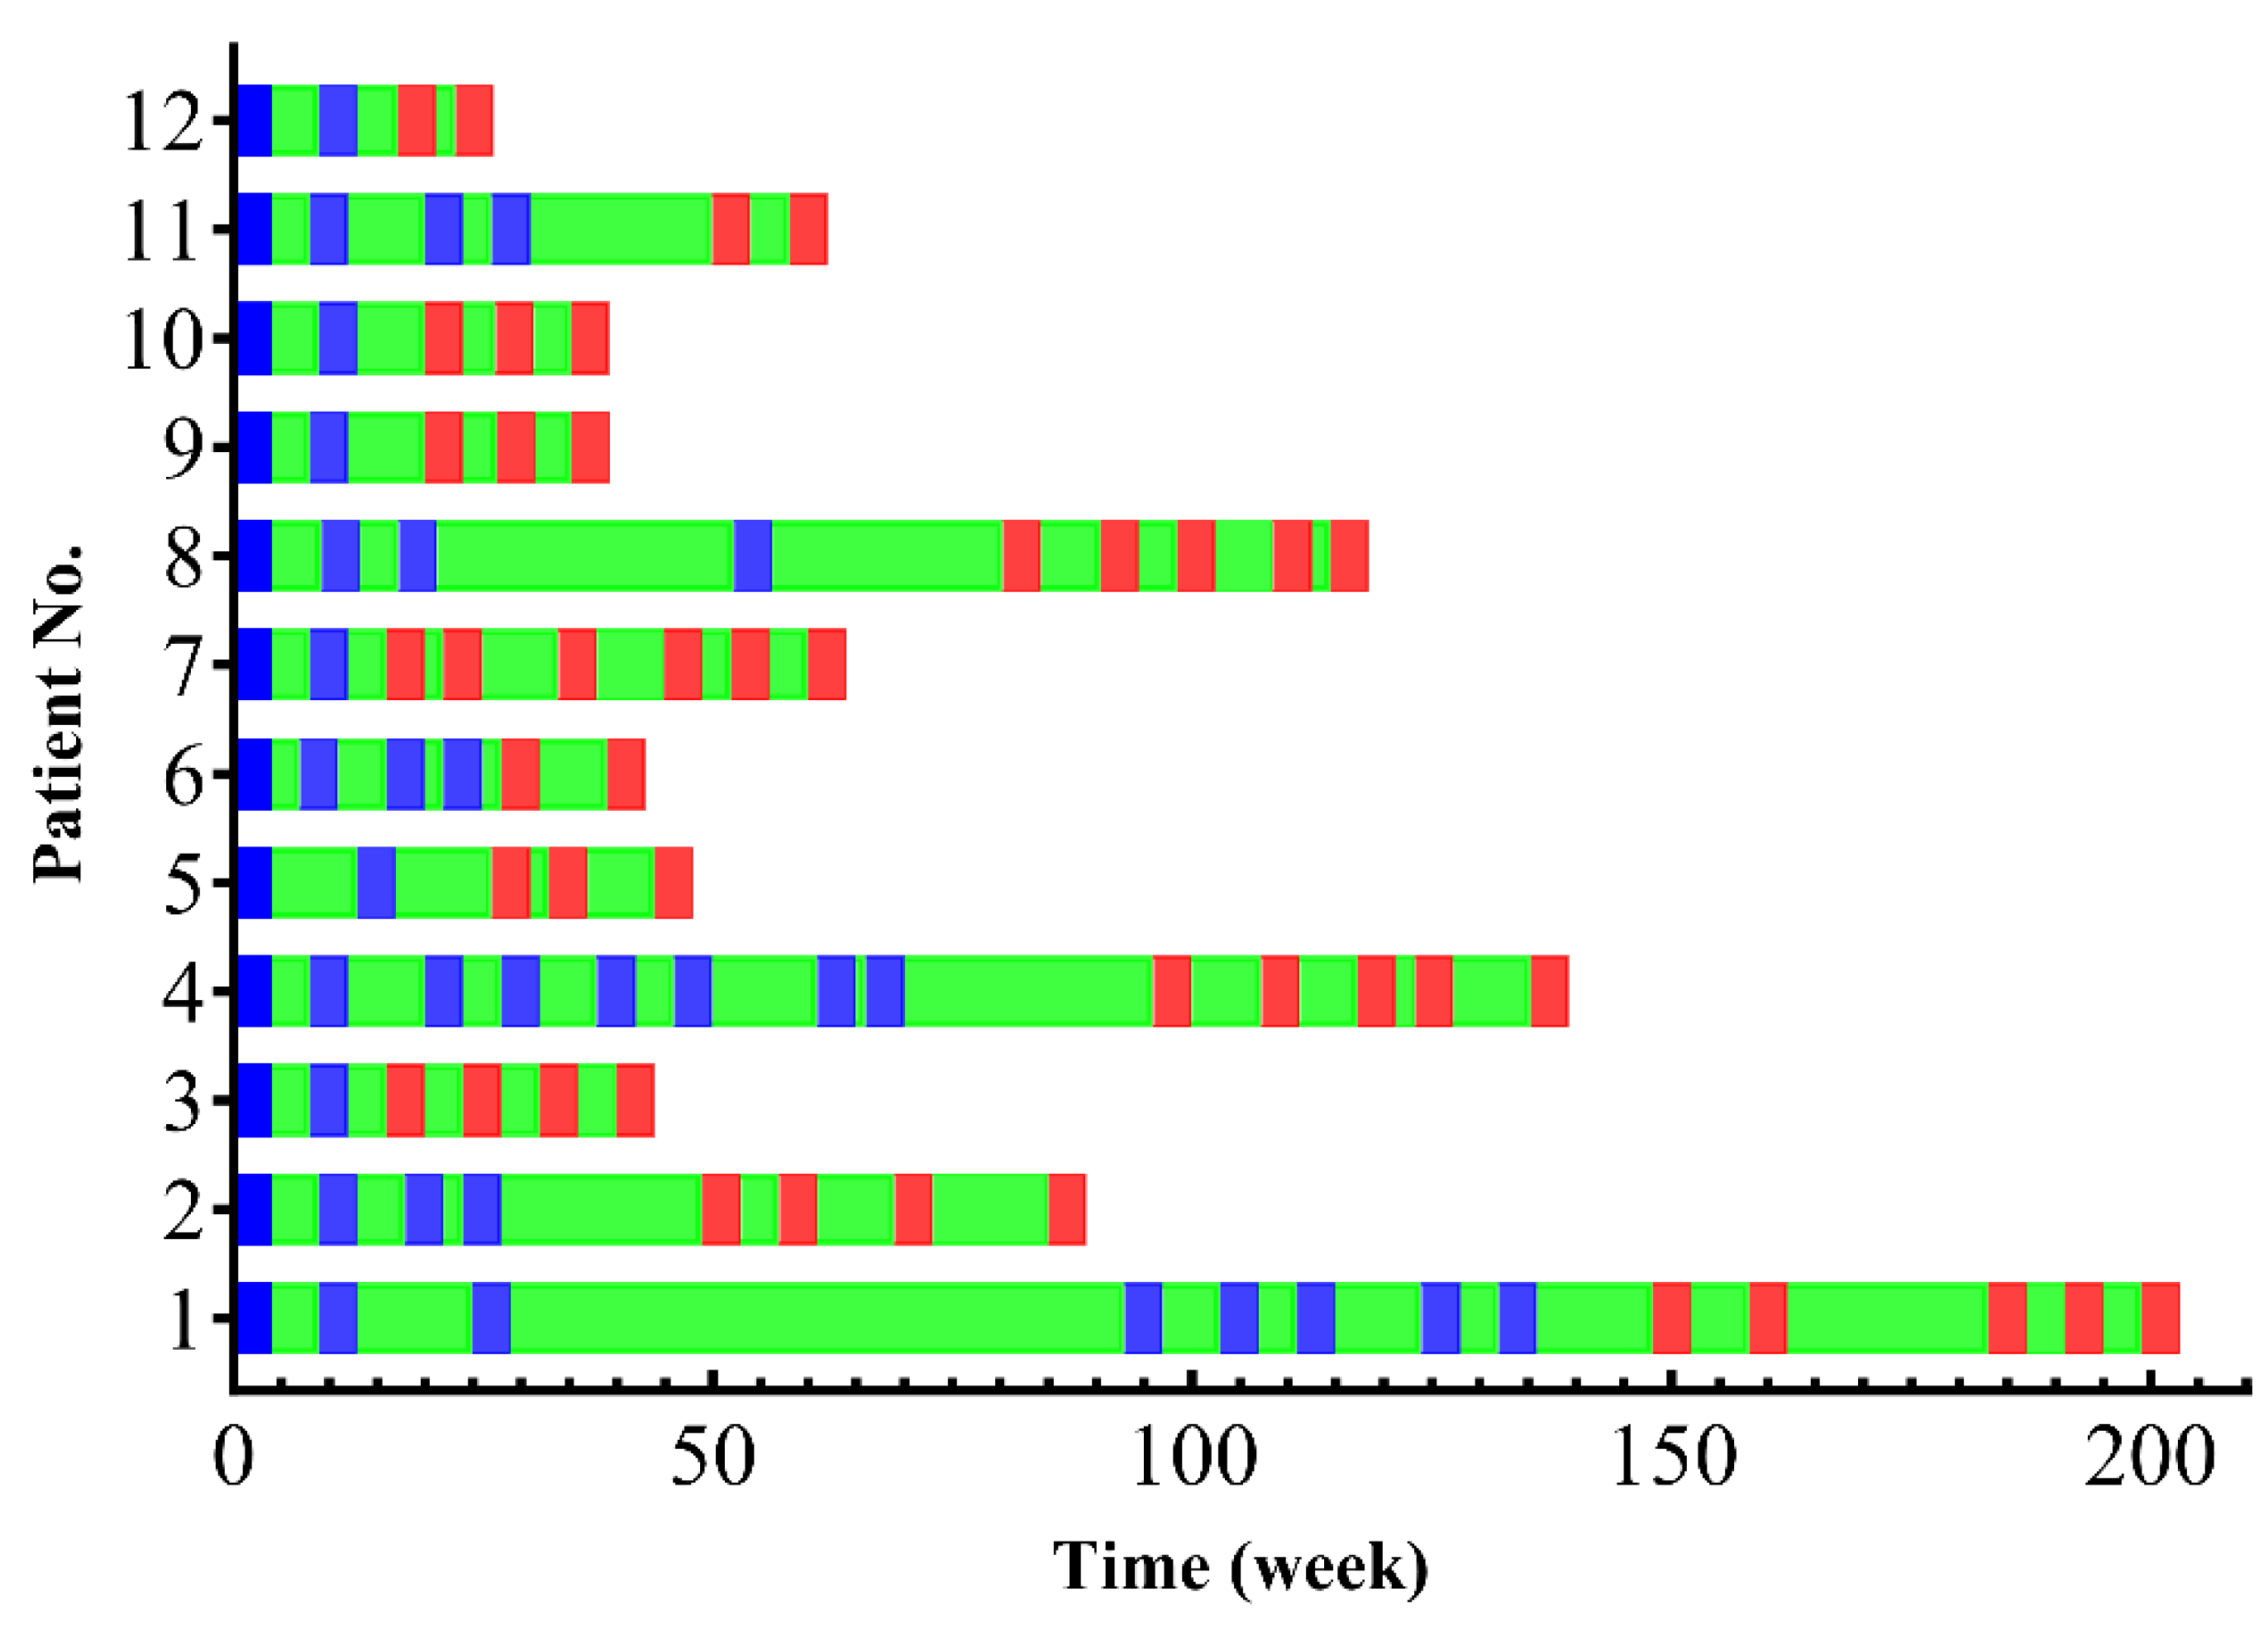
Figure 2.
Box plots illustrate biomarkers of hematological (I: Hemoglobin, II: WBC, III: Platelets, VI: Alk. Phosphatase, and VII: LDH), and renal function (IV: Creatinine and V: eGFR) determined a) before and b) at the last follow-up after [177Lu]Lu-PSMA-617 RLT (blue bar), c) before and d) at the last follow-up after [225Ac]Ac-PSMA-617 TAT (red bar). On average, there were no significant differences between before [177Lu]Lu-PSMA RLT or before [225Ac]Ac-PSMA TAT and the last follow-up in any biomarkers. The box demonstrates the 1st quartile and 3rd quartile of values, the Whiskers extend to the lowest and highest values.
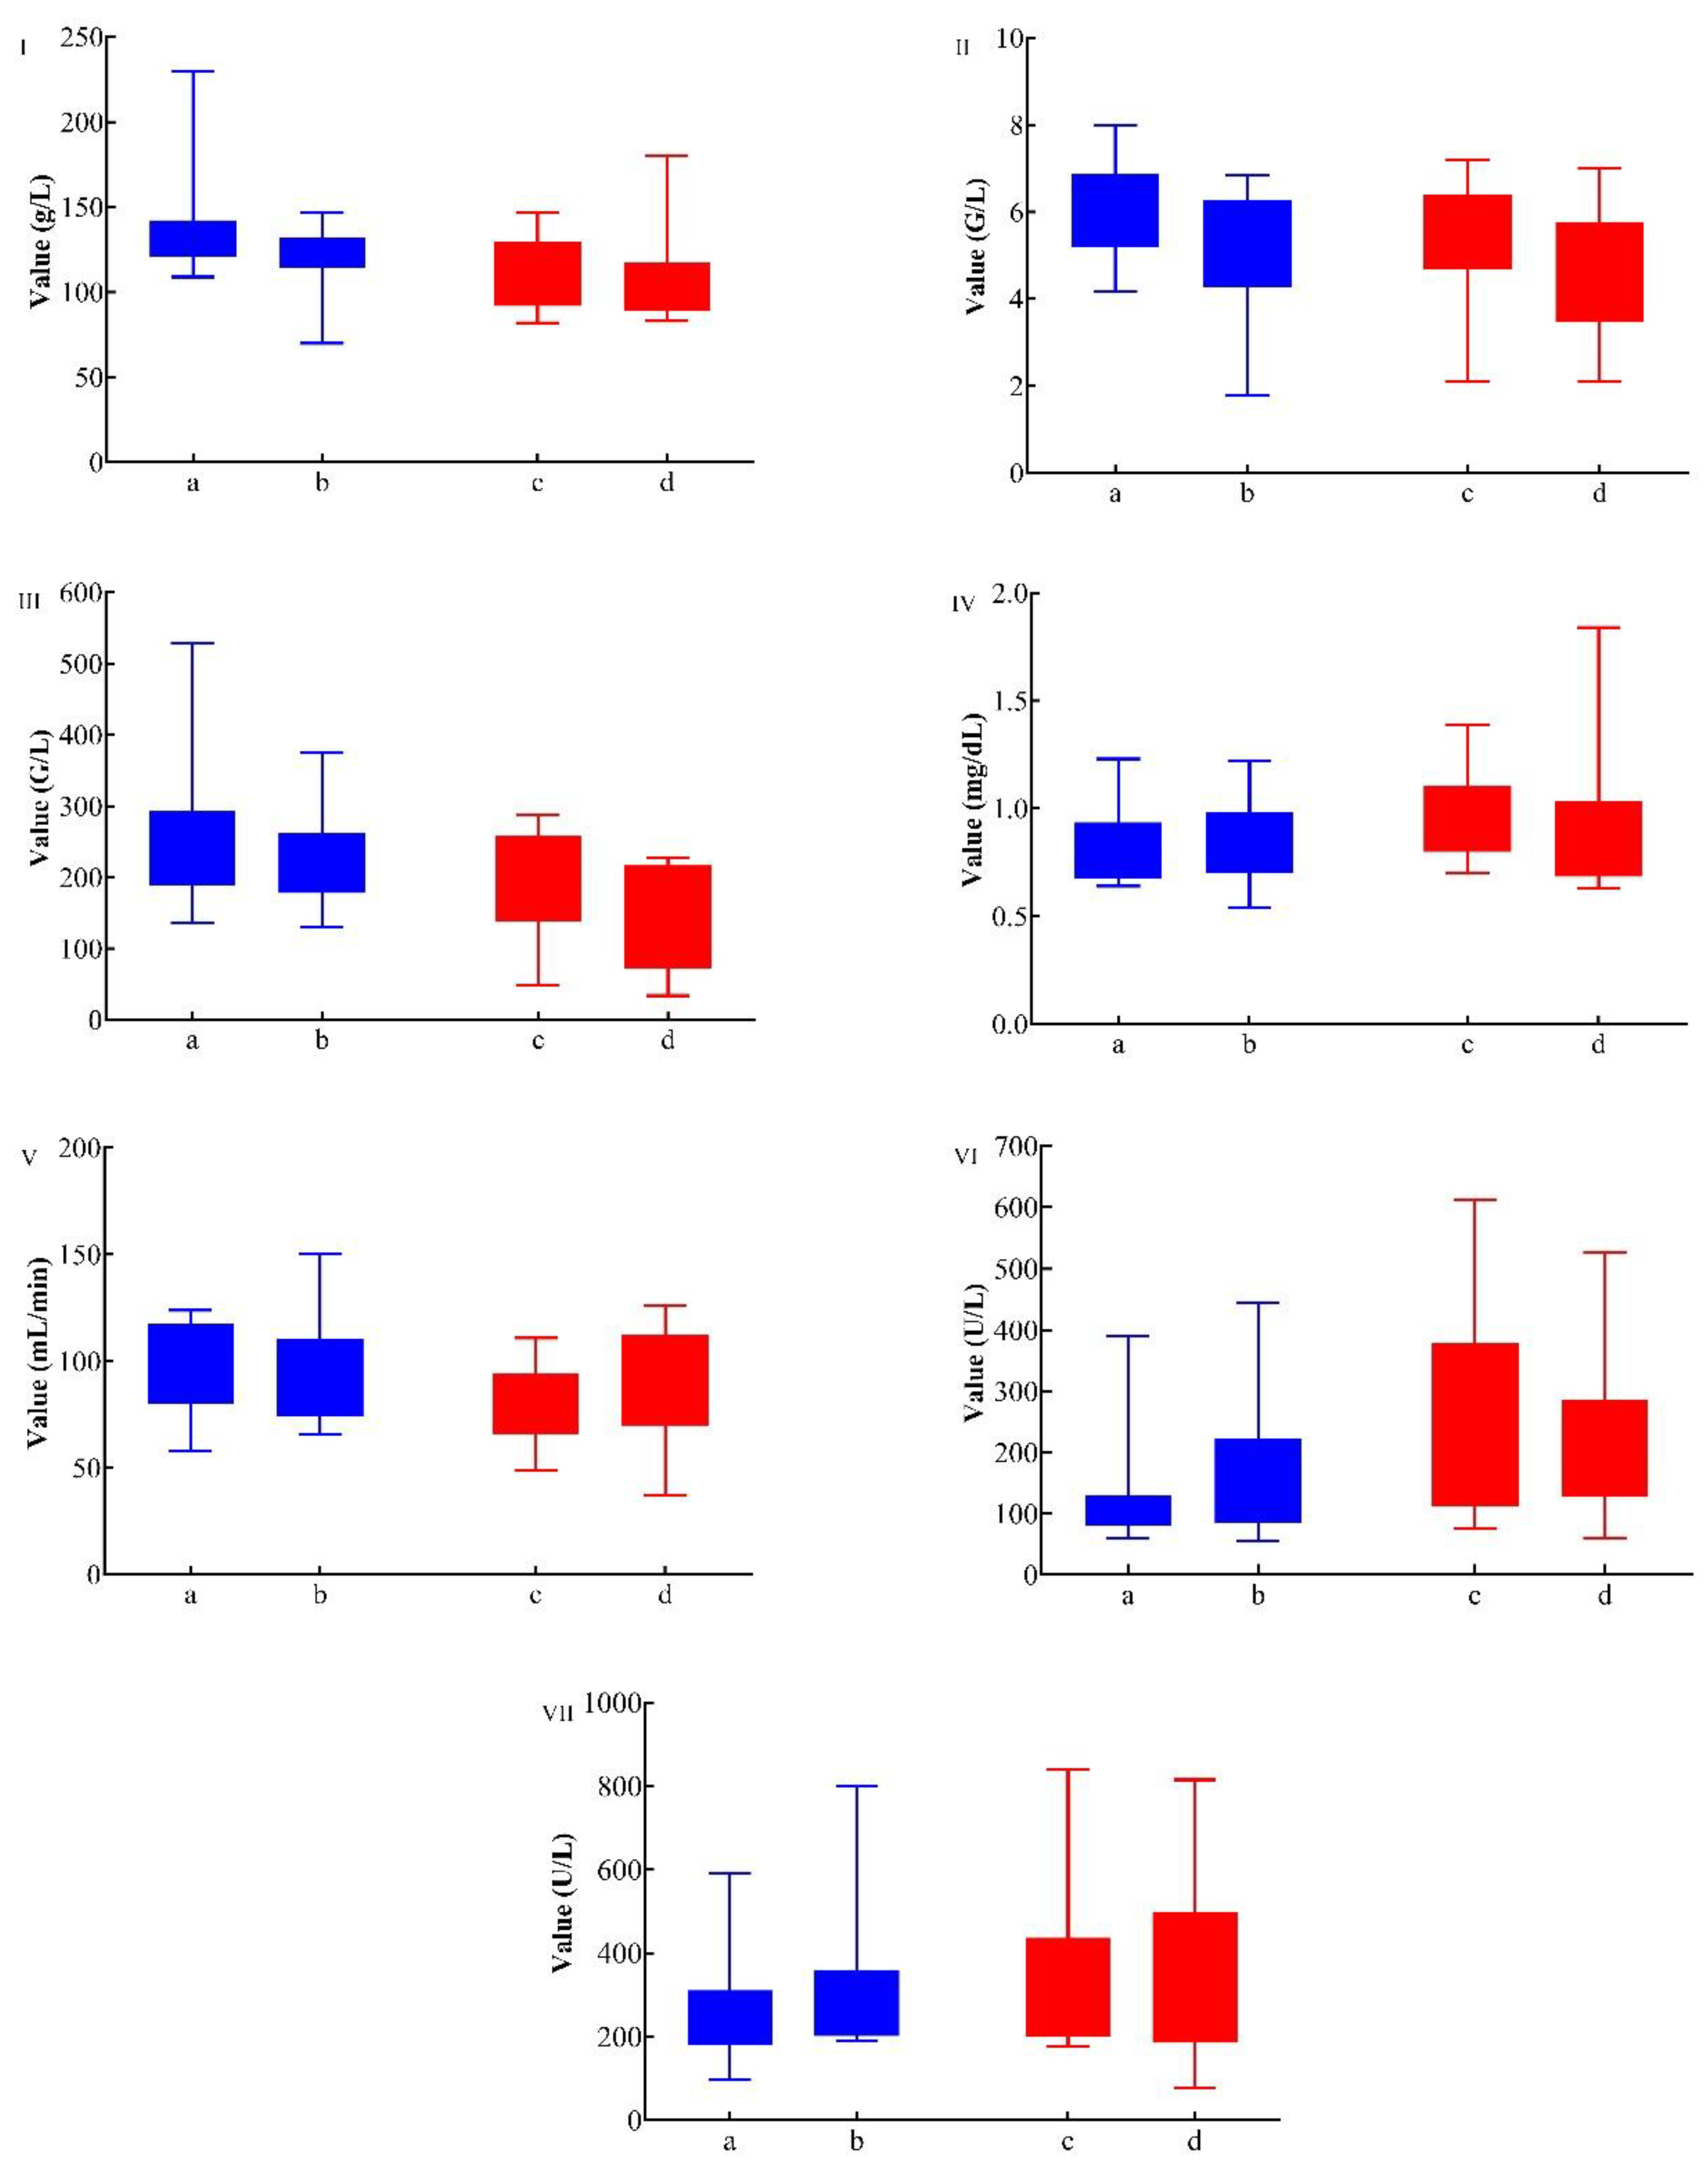
Figure 3.
Box plot illustrates PSA level in a) pre- and b) post-[177Lu]Lu-PSMA-617 RLT (blue bar), c) pre and d) post [225Ac]Ac-PSMA-617 TAT in non-response group (red bar), e) pre and f) post [225Ac]Ac-PSMA-617 TAT in response group (green bar).
Figure 3.
Box plot illustrates PSA level in a) pre- and b) post-[177Lu]Lu-PSMA-617 RLT (blue bar), c) pre and d) post [225Ac]Ac-PSMA-617 TAT in non-response group (red bar), e) pre and f) post [225Ac]Ac-PSMA-617 TAT in response group (green bar).
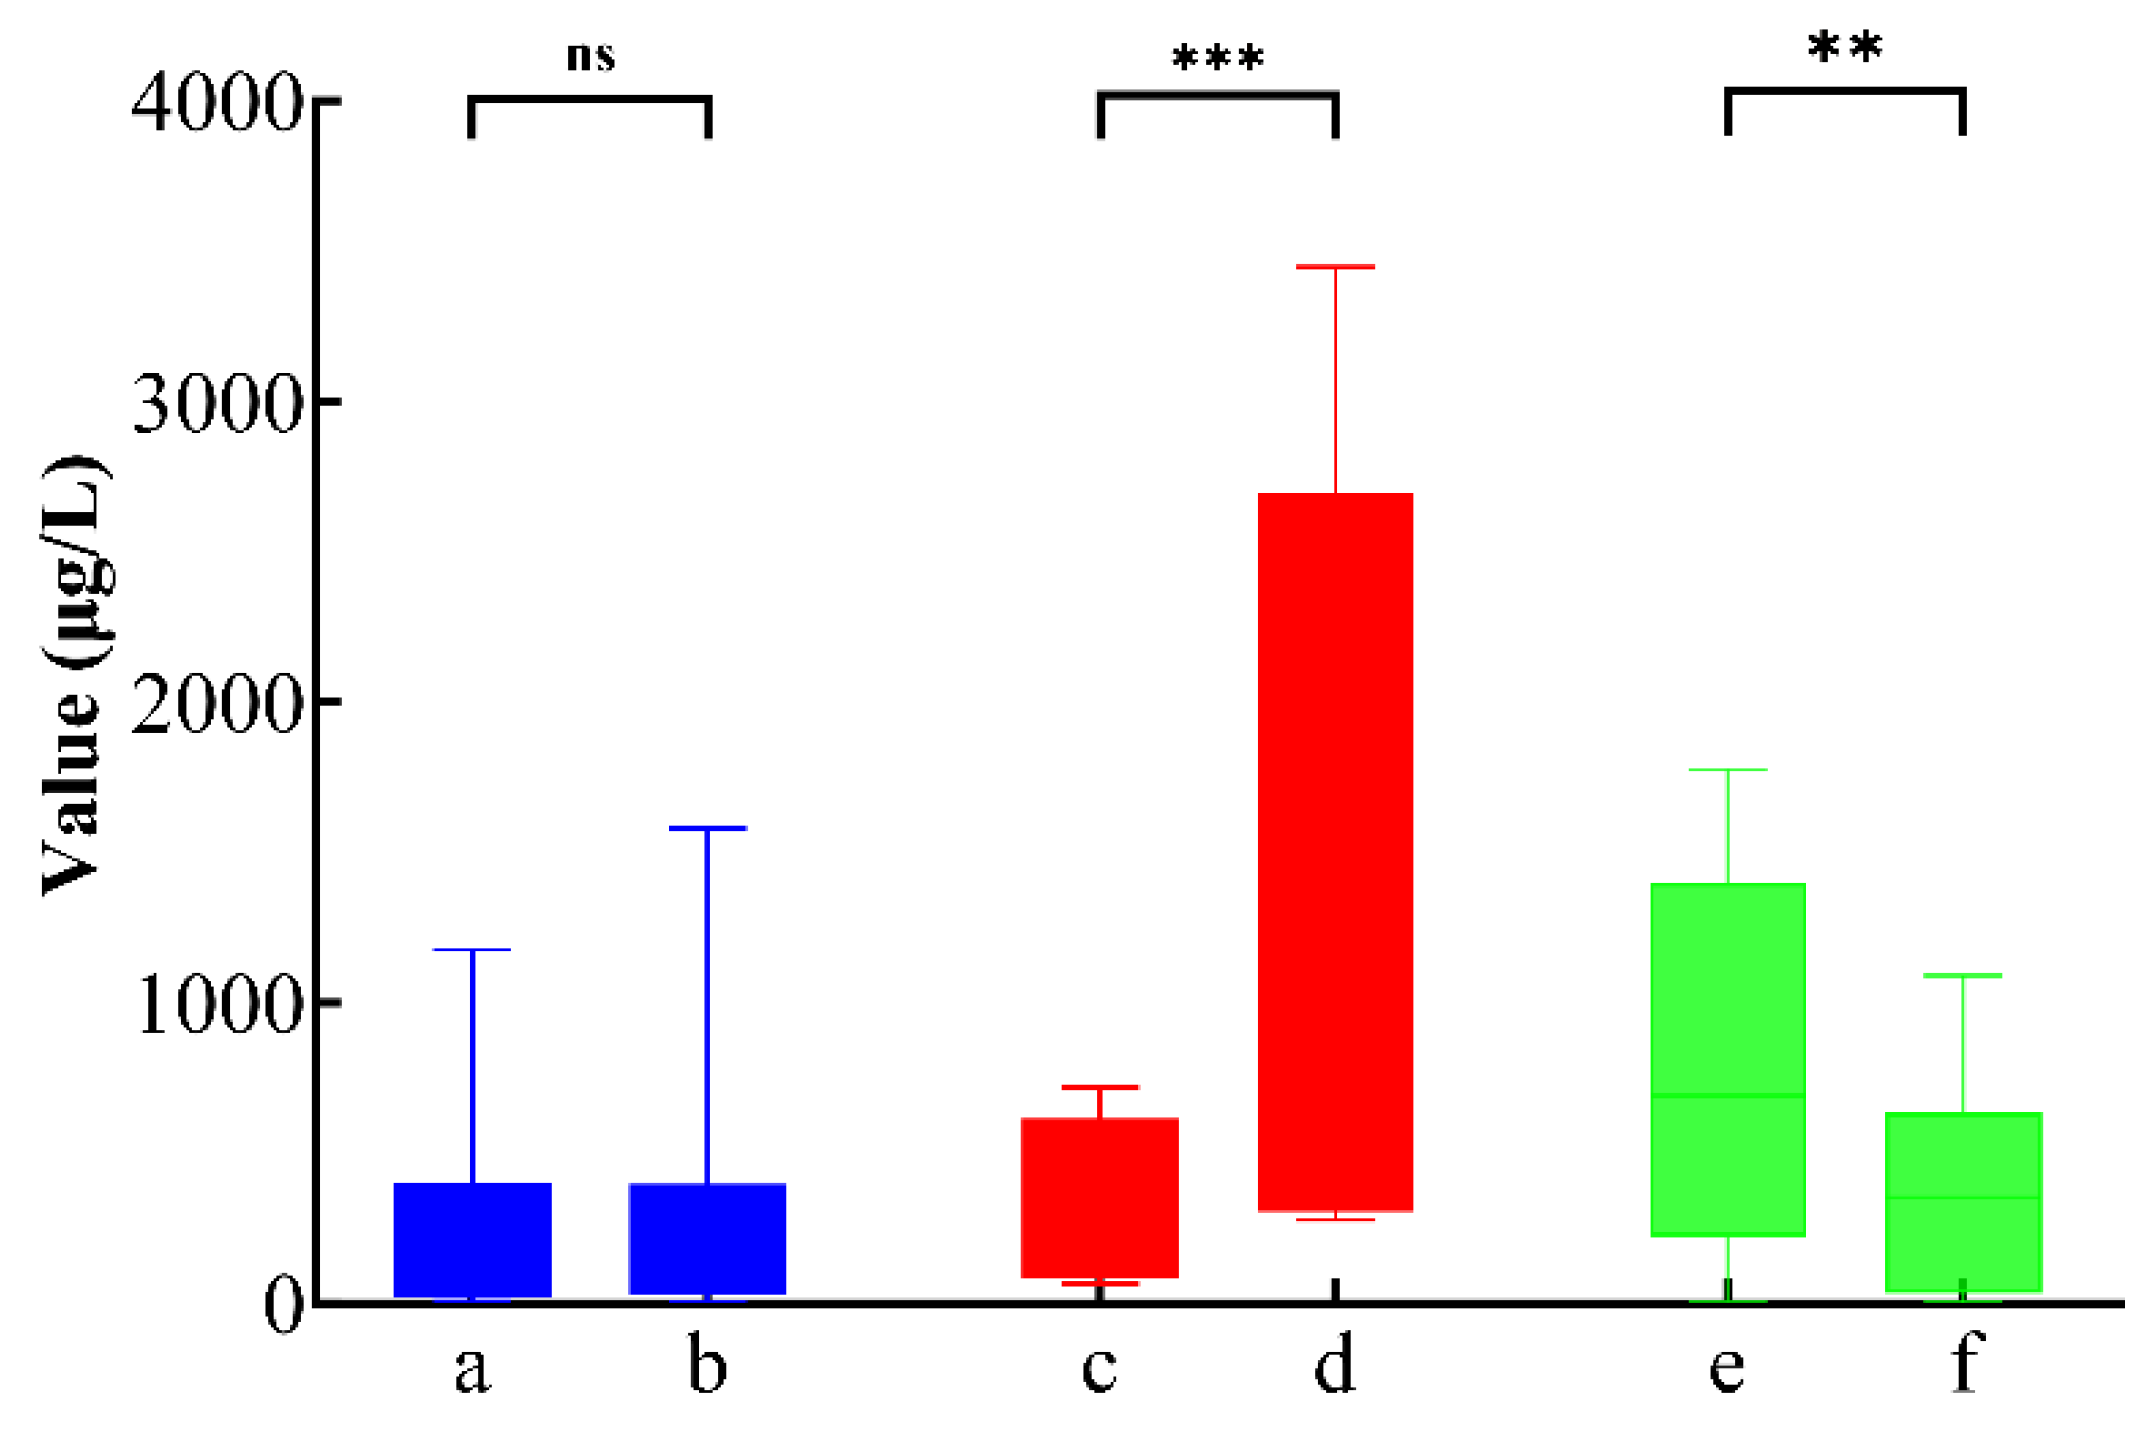
Figure 4.
PSA-based biochemical response to [²²⁵Ac]Ac-PSMA-617 TAT. (I) Waterfall plot showing individual percentage changes in PSA levels after the first cycle of [²²⁵Ac]Ac-PSMA-617 and (II) PSA changes at the most recent follow-up. Patients with PSA decline are shown in green; those with PSA increase are shown in red. After the first cycle, 75% (9/12) of patients showed PSA decline, with 25% (3/12) achieving > 50% reduction. At follow-up, 67% (8/12) maintained PSA decline, with 42% (5/12) showing > 50% reduction. PSA responses were durable in 6/7 patients with initial ≥ 30% decline.
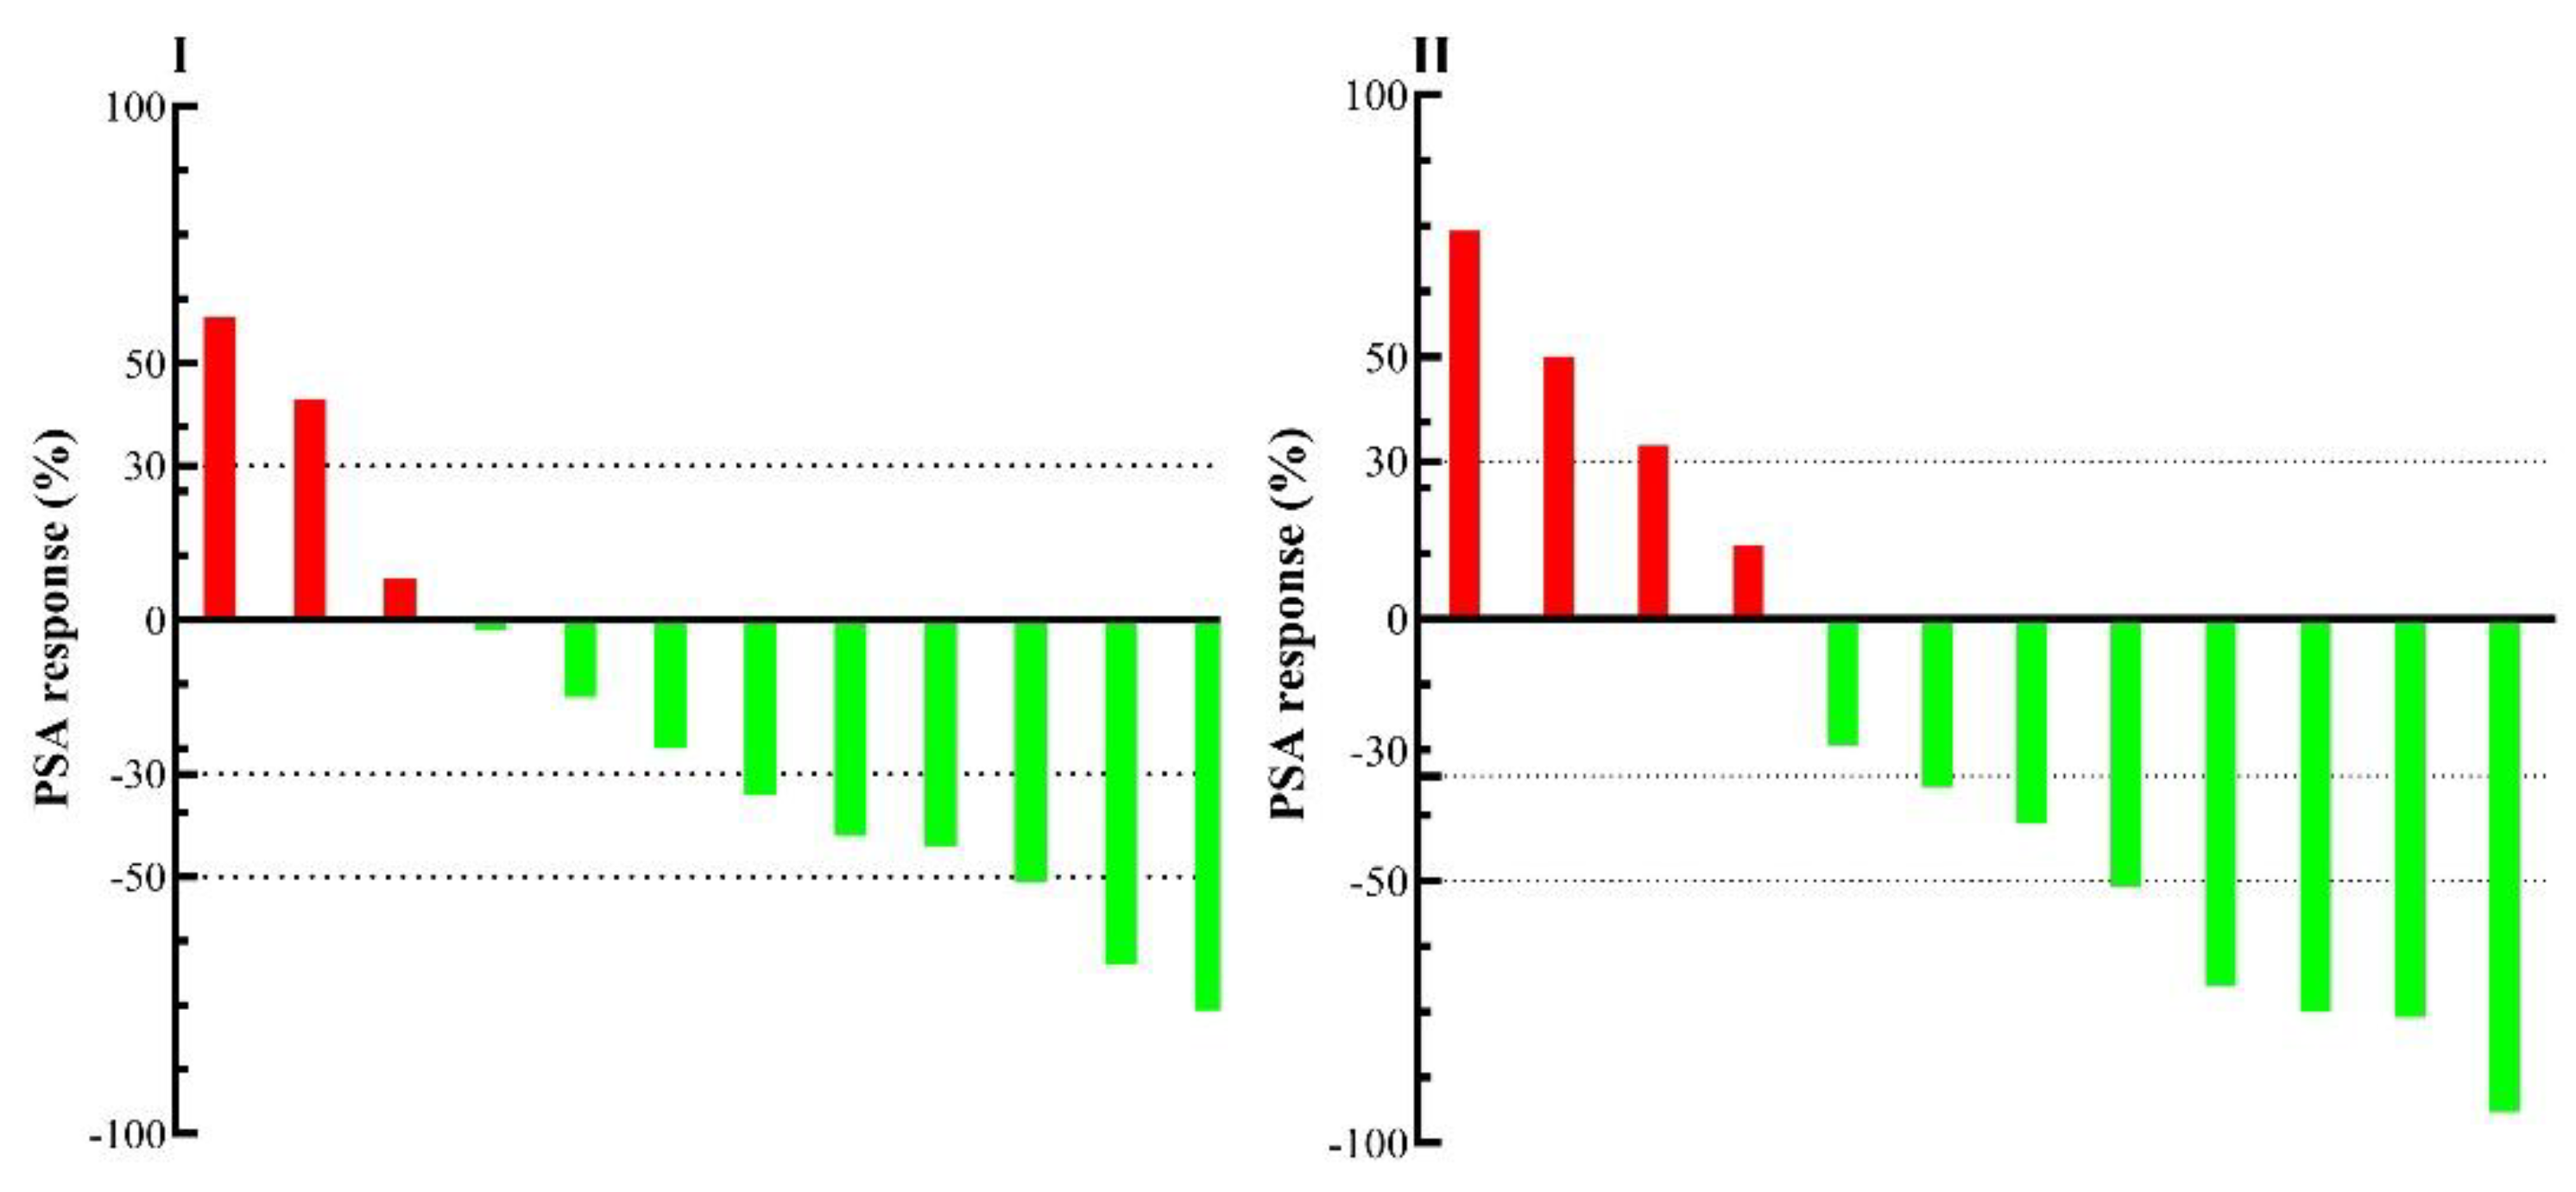
Figure 5.
Molecular imaging and PSA response in two patients responding to TAT. [⁶⁸Ga]Ga-PSMA-11 PET/CT images and schematic plots for two patients with mCRPC refractory to [¹⁷⁷Lu]Lu-PSMA-617 therapy. (a) Baseline scan; (b) after two cycles of [¹⁷⁷Lu]Lu-PSMA-617; (c) after three cycles of [²²⁵Ac]Ac-PSMA-617. Graphs depict PSA level (µg/L, green), total tumor volume (mL, red), and tumor SUVmax (g/mL, blue). Both patients demonstrated near-complete molecular and biochemical responses, with PSA declining to undetectable levels and marked TTV reduction.
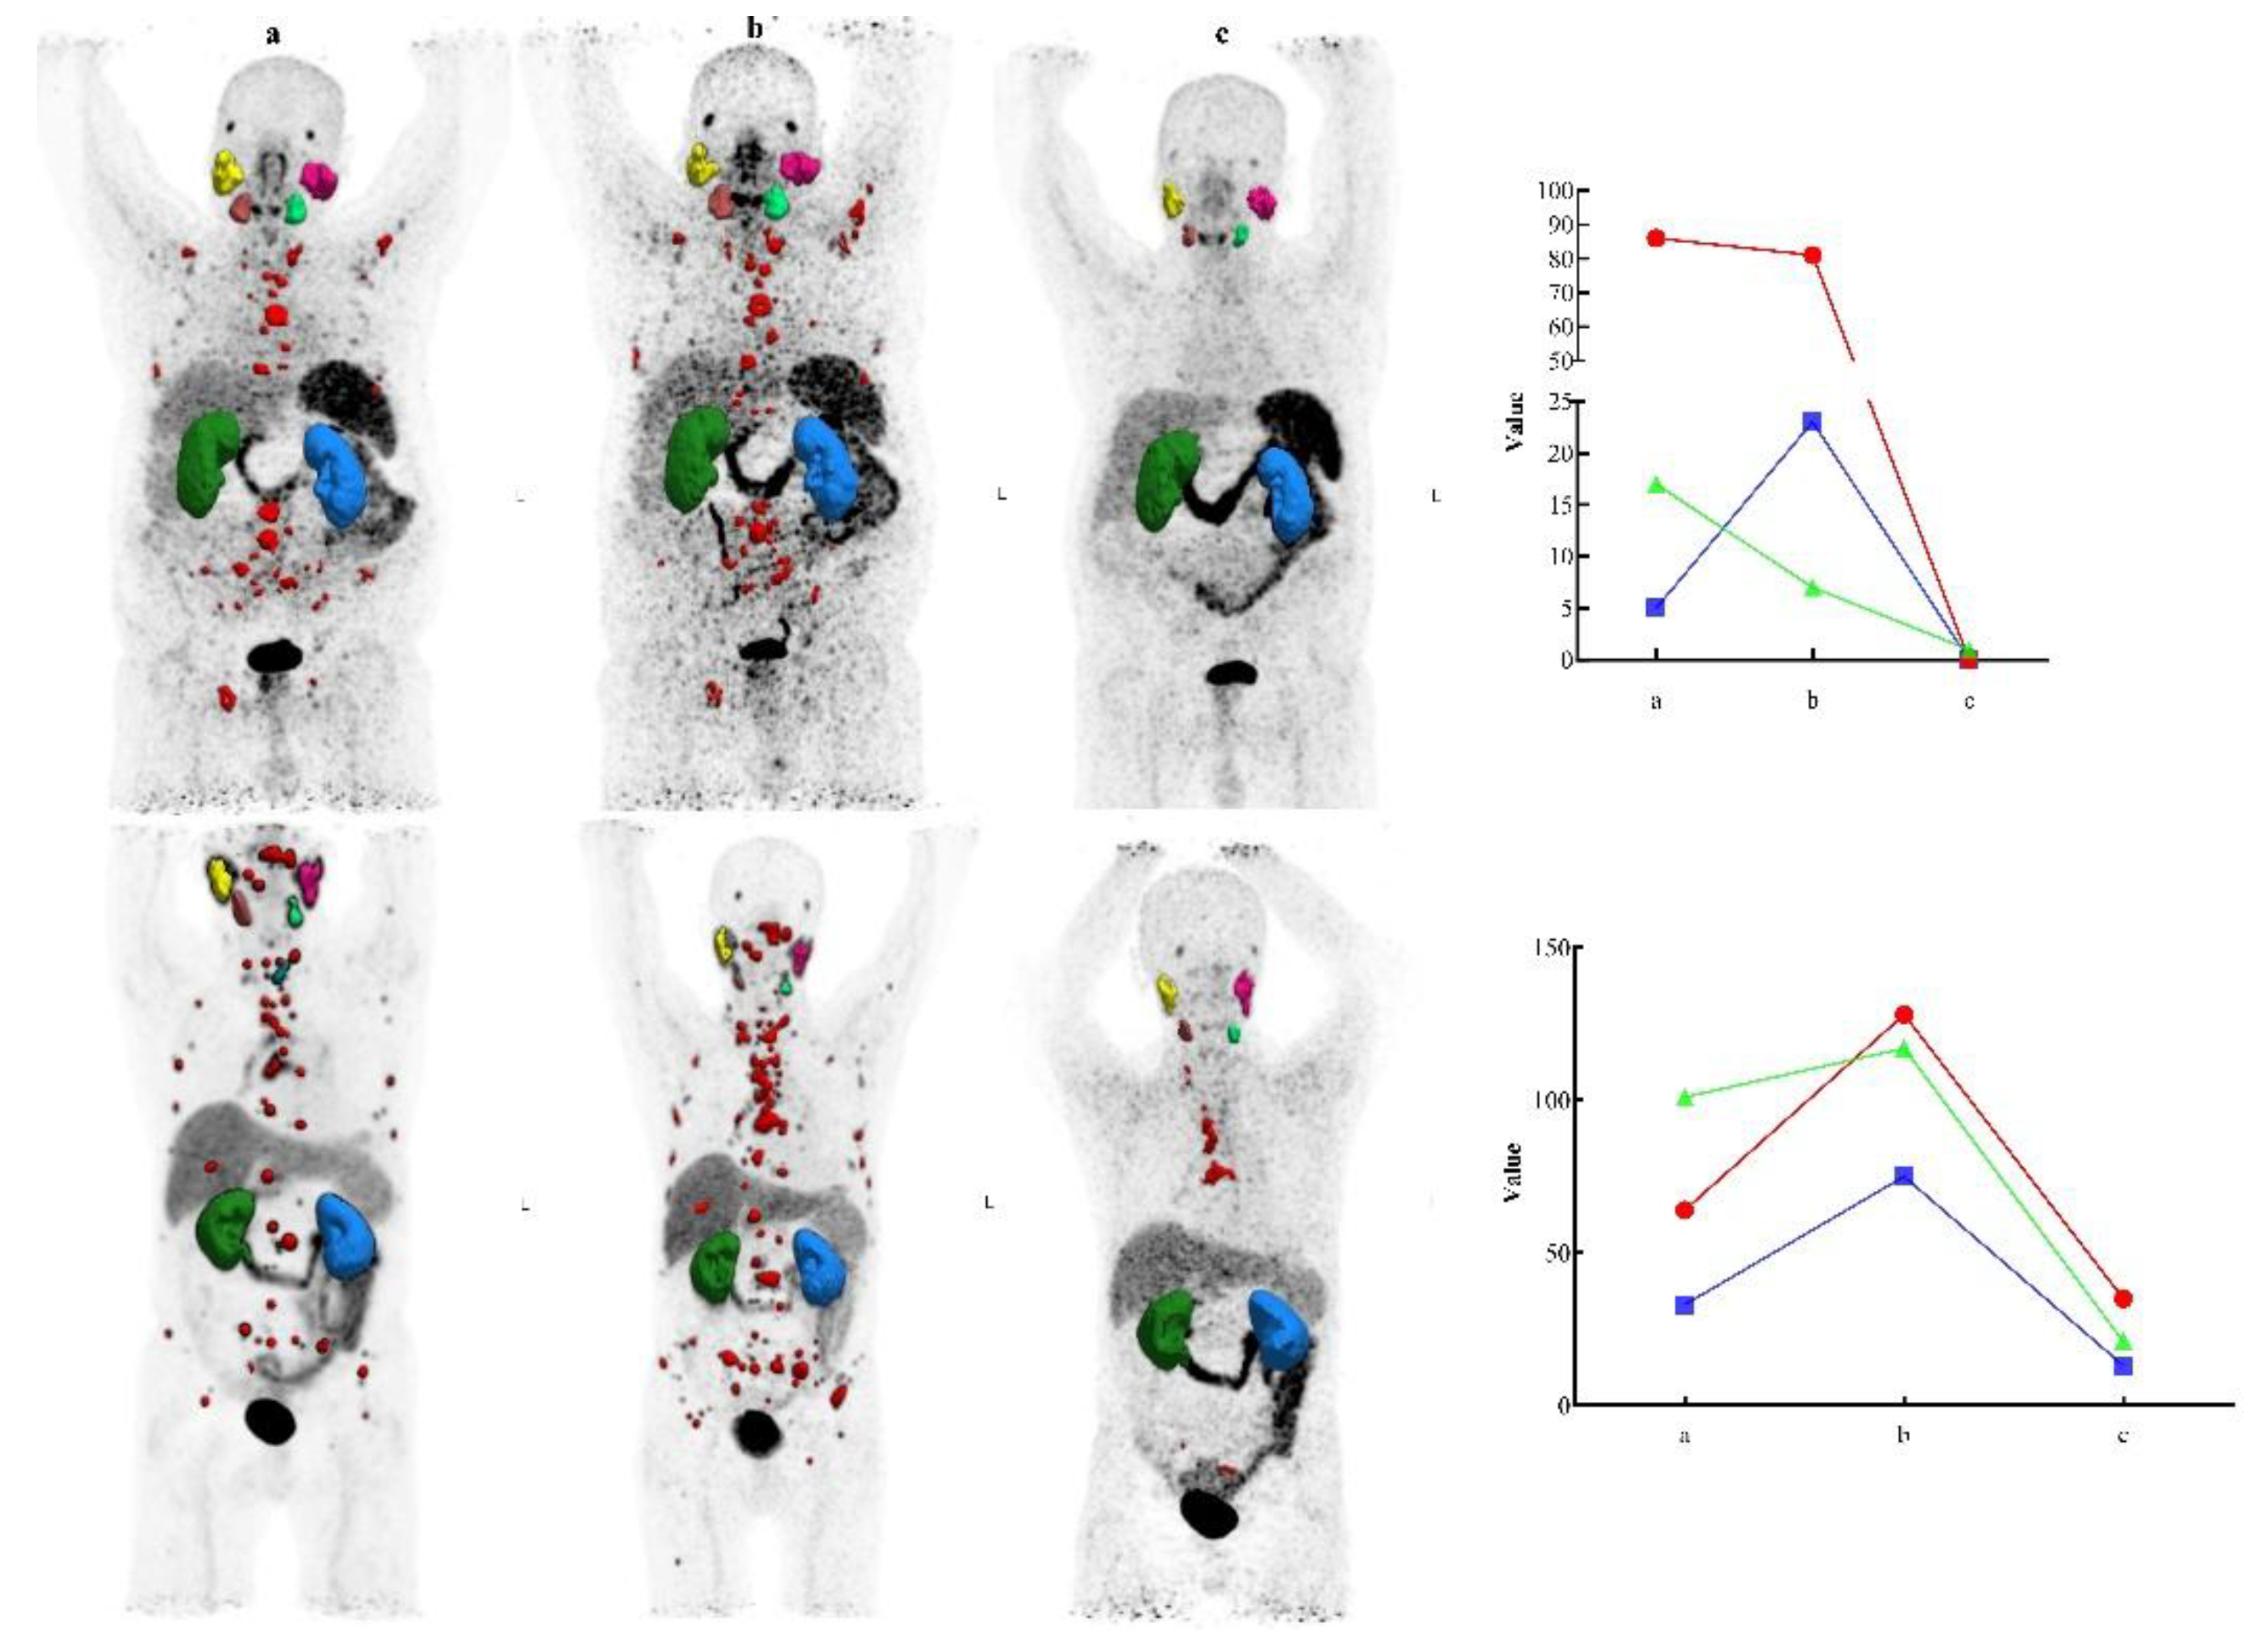
Figure 6.
Disease stabilization after TAT in two patients with prior progression. [⁶⁸Ga]Ga-PSMA-11 PET/CT images are shown for two patients with mCRPC who had progressed after [¹⁷⁷Lu]Lu-PSMA-617 and underwent a long treatment pause. The top and bottom rows correspond to patient no. 2 and patient no. 8, respectively. (a=a’) baseline; (b=b’) after two cycles of [¹⁷⁷Lu]Lu-PSMA-617; (c=c’) after four cycles of [¹⁷⁷Lu]Lu-PSMA-617; (d) 21 weeks post-treatment pause; (d’) 40 weeks post-treatment pause (e) after two cycles of [225Ac]Ac-PSMA-617; (e’) 25 weeks post-treatment pause; (f) after four cycles of [225Ac]Ac-PSMA-617; (f’) after three cycles of [225Ac]Ac-PSMA-617. Graphs show PSA level (µg/L, green), TTV (mL, red), and SUVmax (g/mL, blue). A direct correlation was observed between changes in PSA levels and dynamic TTV, consistent with PERCIST 1.0 criteria. Both patients exhibited halting of disease progression and partial molecular response following TAT. Notably, the first patient (top row) presented with bone metastases.
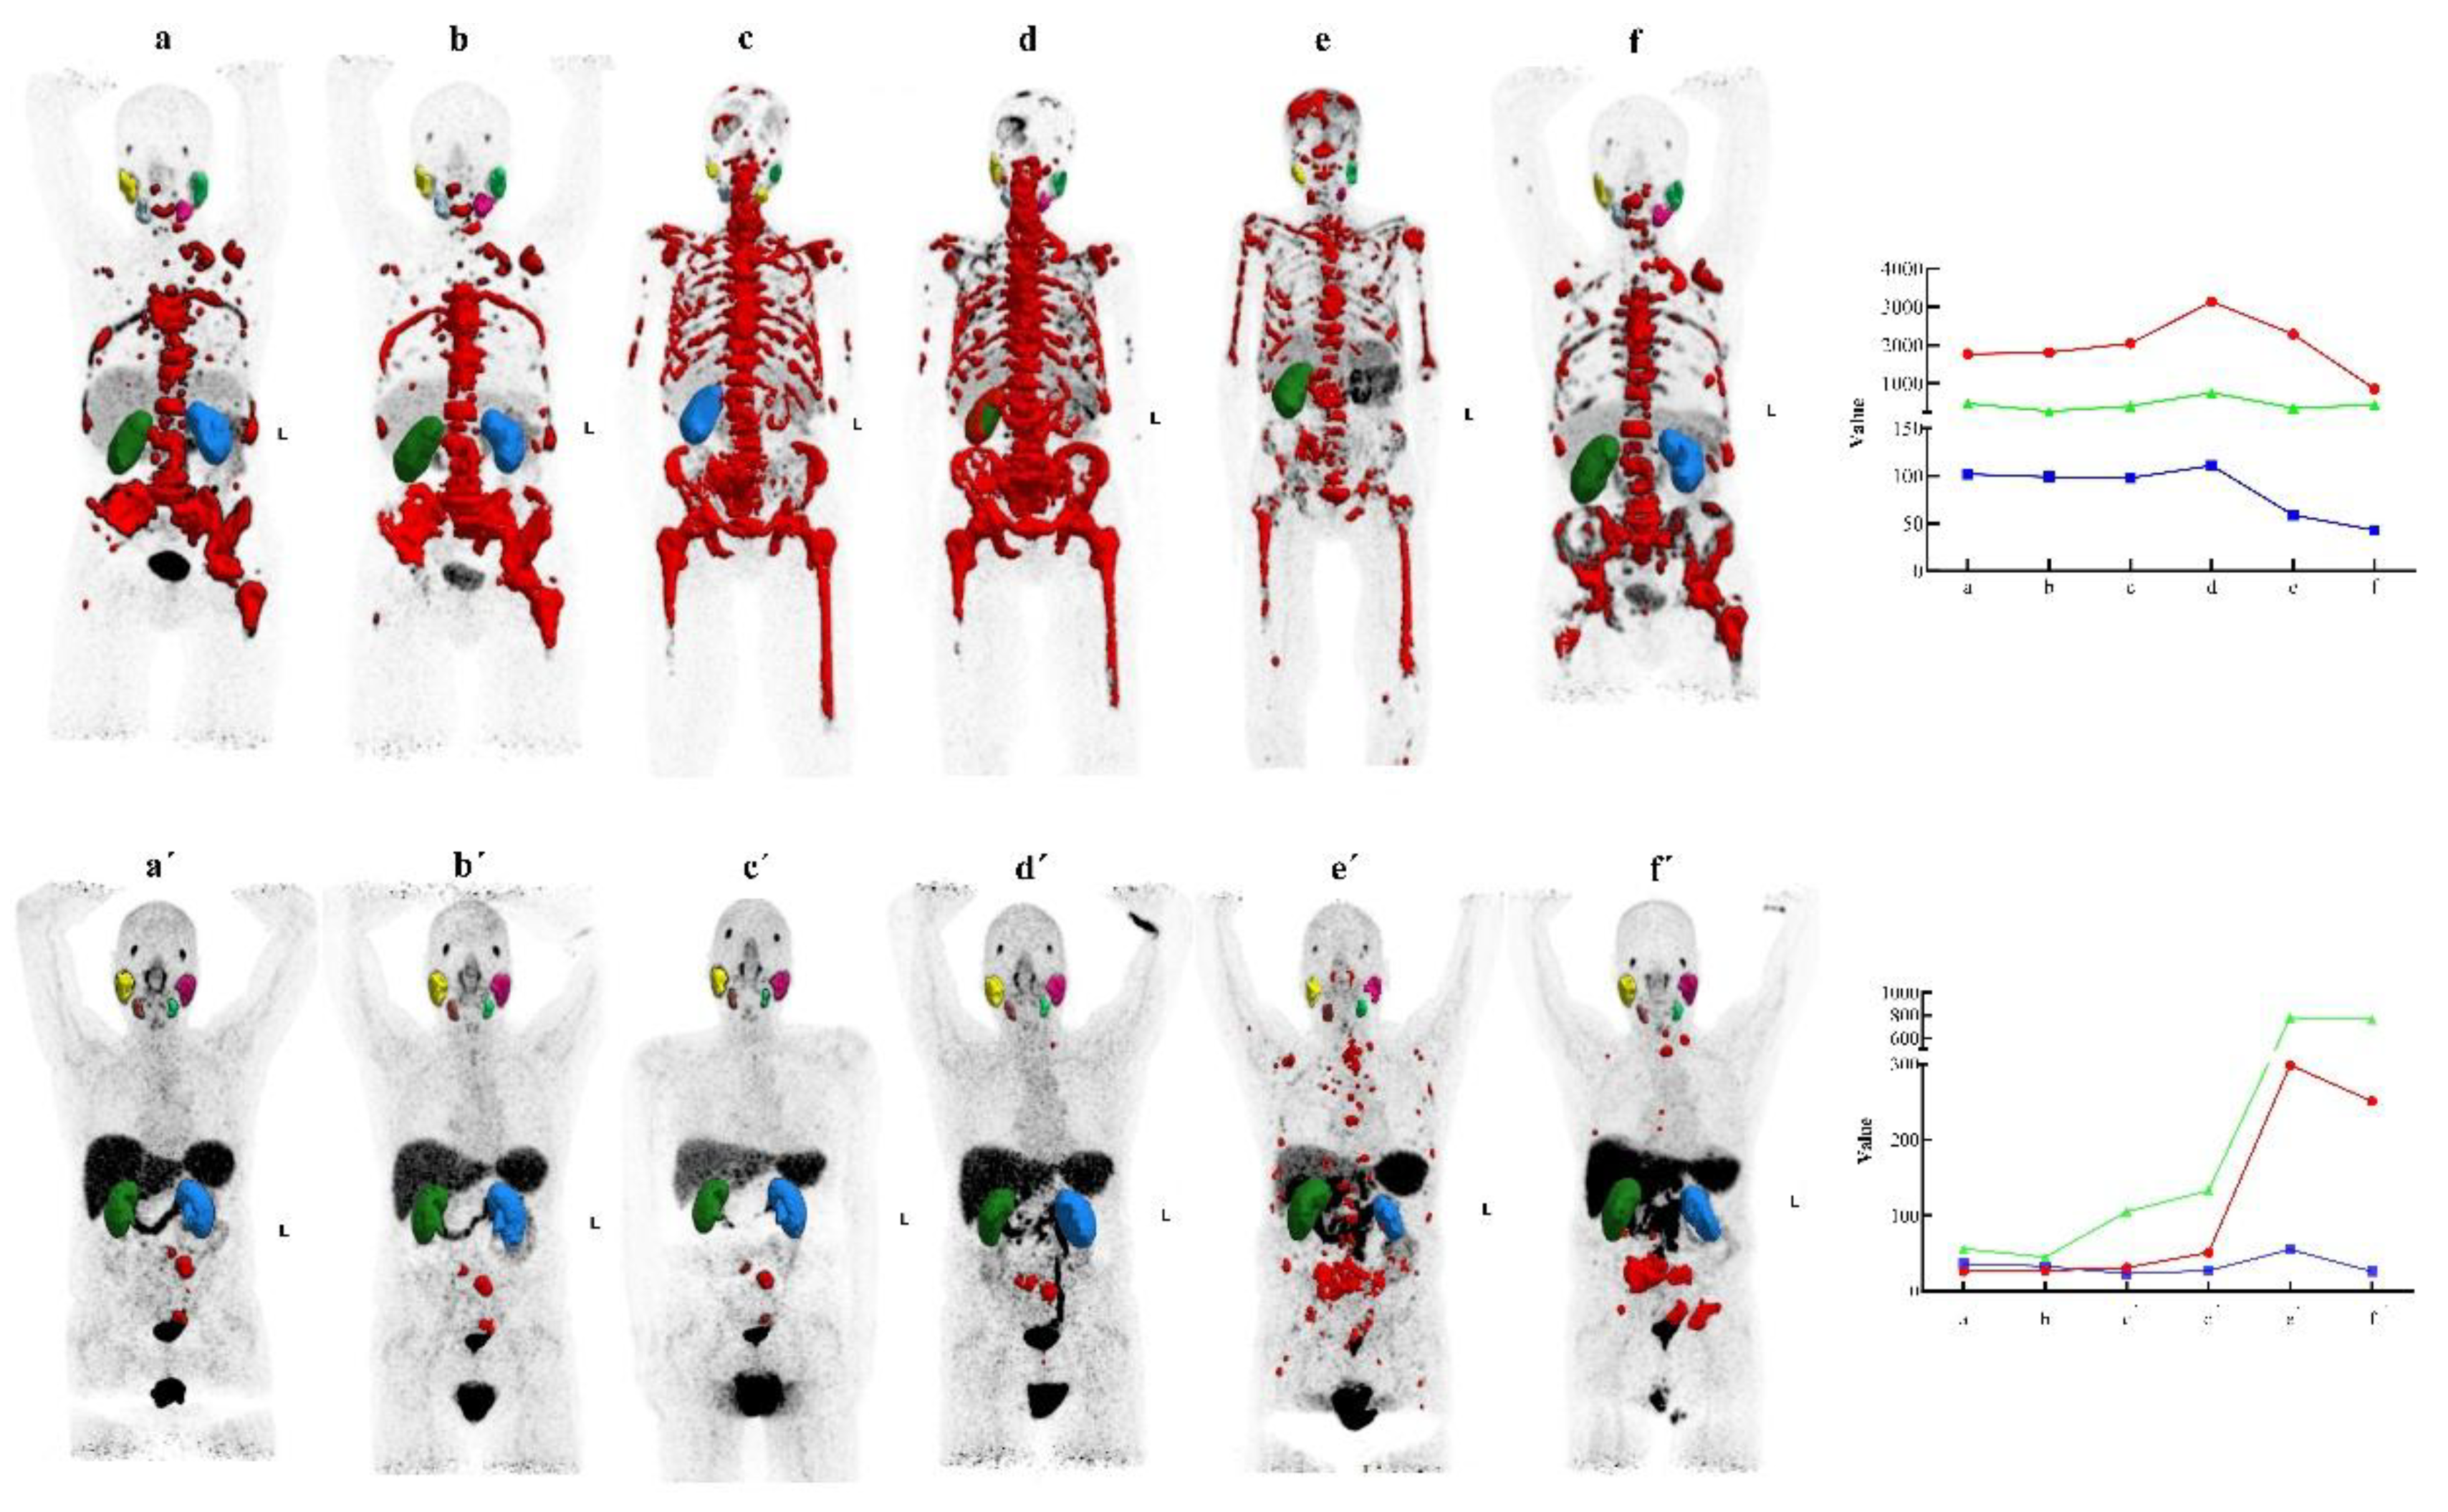
Figure 7.
Kaplan-meier survival analysis after [²²⁵Ac]Ac-PSMA-617 therapy.
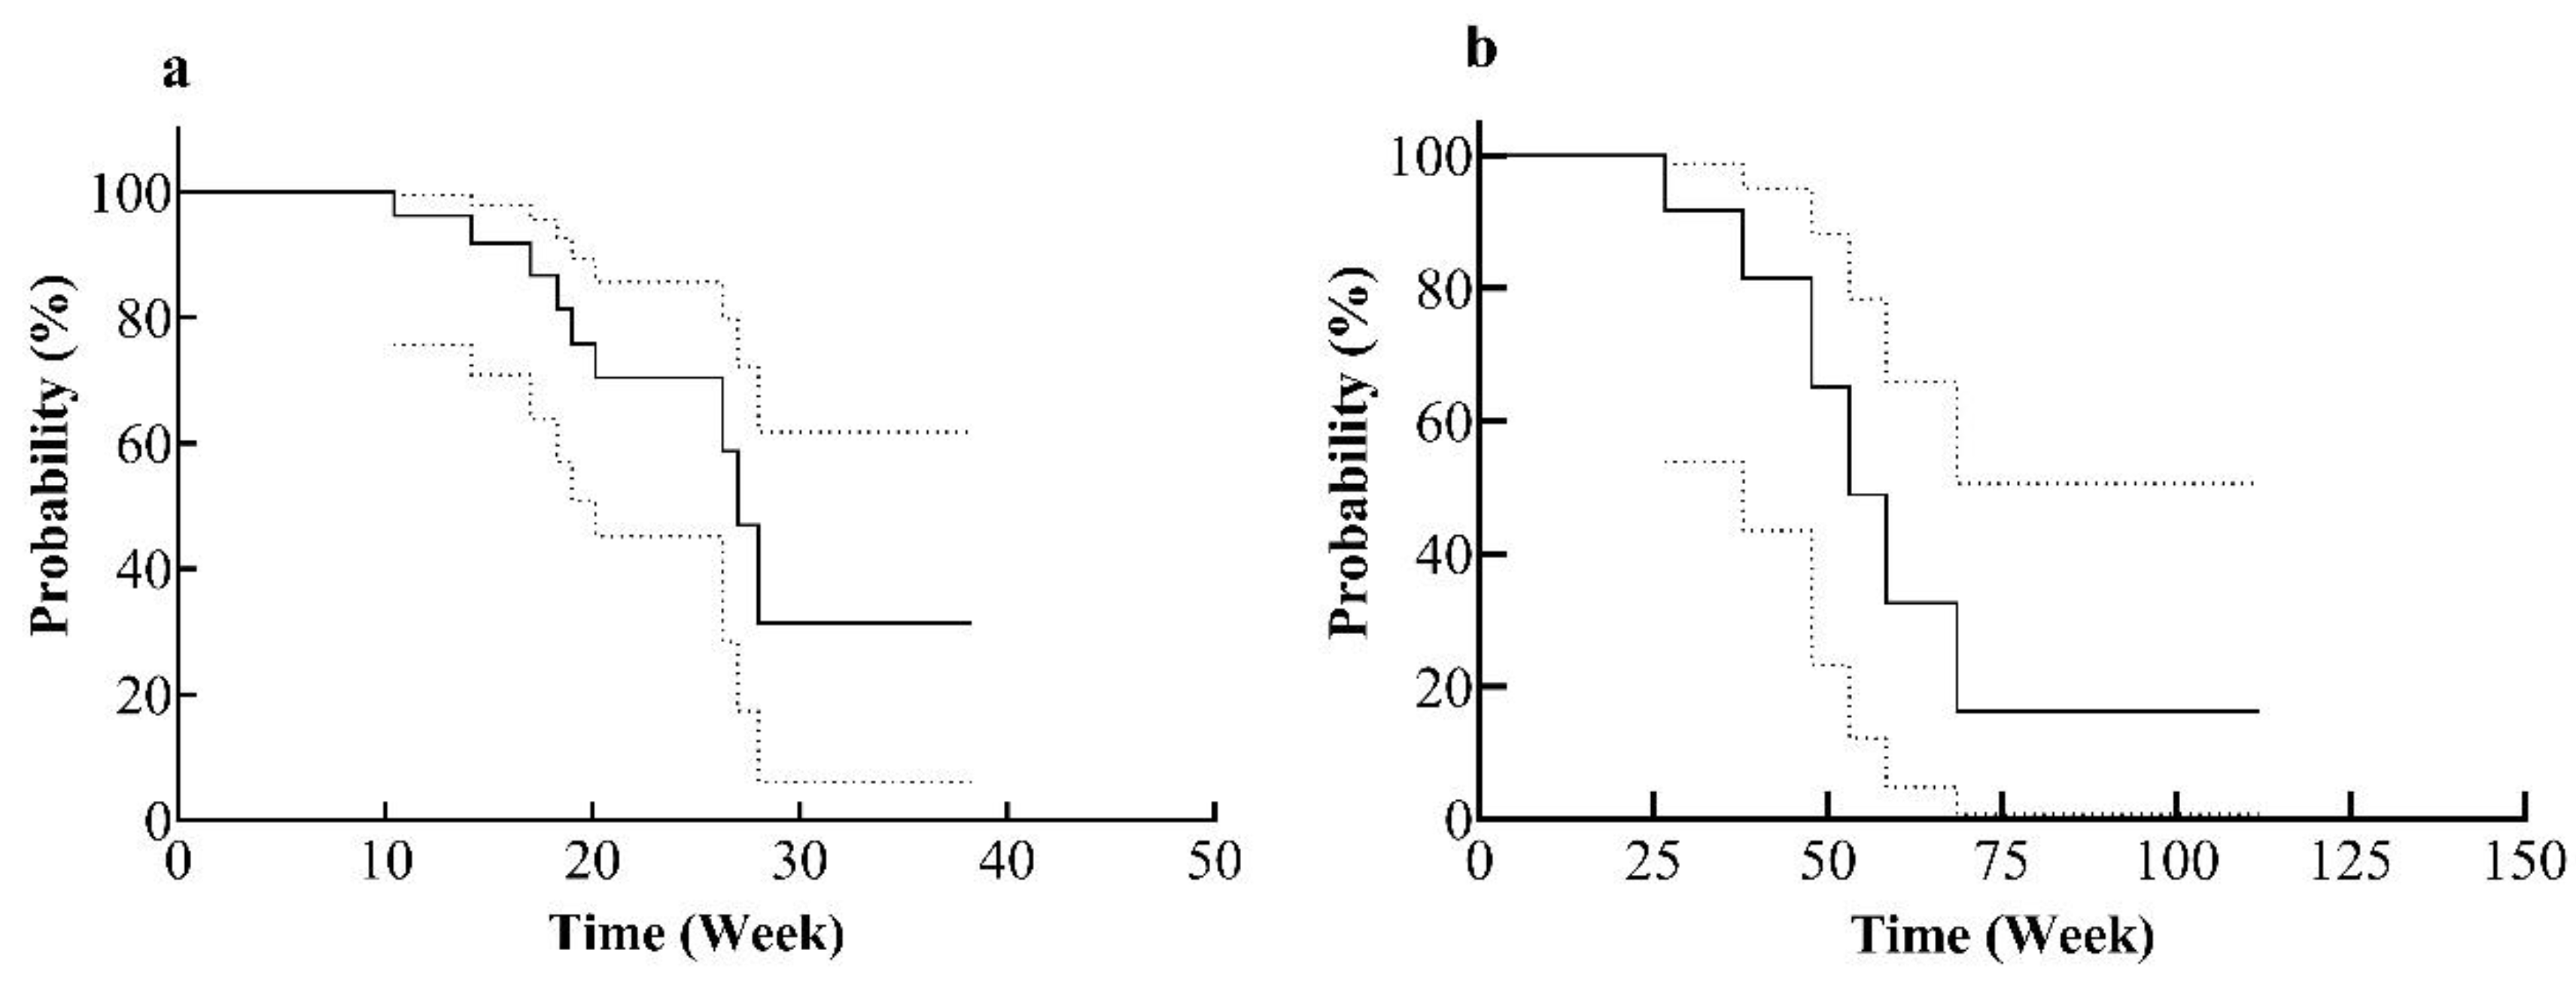
Figure 8.
Contextualizing our cohort outcomes against meta-analytic benchmarks. Bar chart comparing the retrospective cohort (n = 12) outcomes to pooled estimates from a meta-analysis (n = 675) across eight clinical measures.
Figure 8.
Contextualizing our cohort outcomes against meta-analytic benchmarks. Bar chart comparing the retrospective cohort (n = 12) outcomes to pooled estimates from a meta-analysis (n = 675) across eight clinical measures.
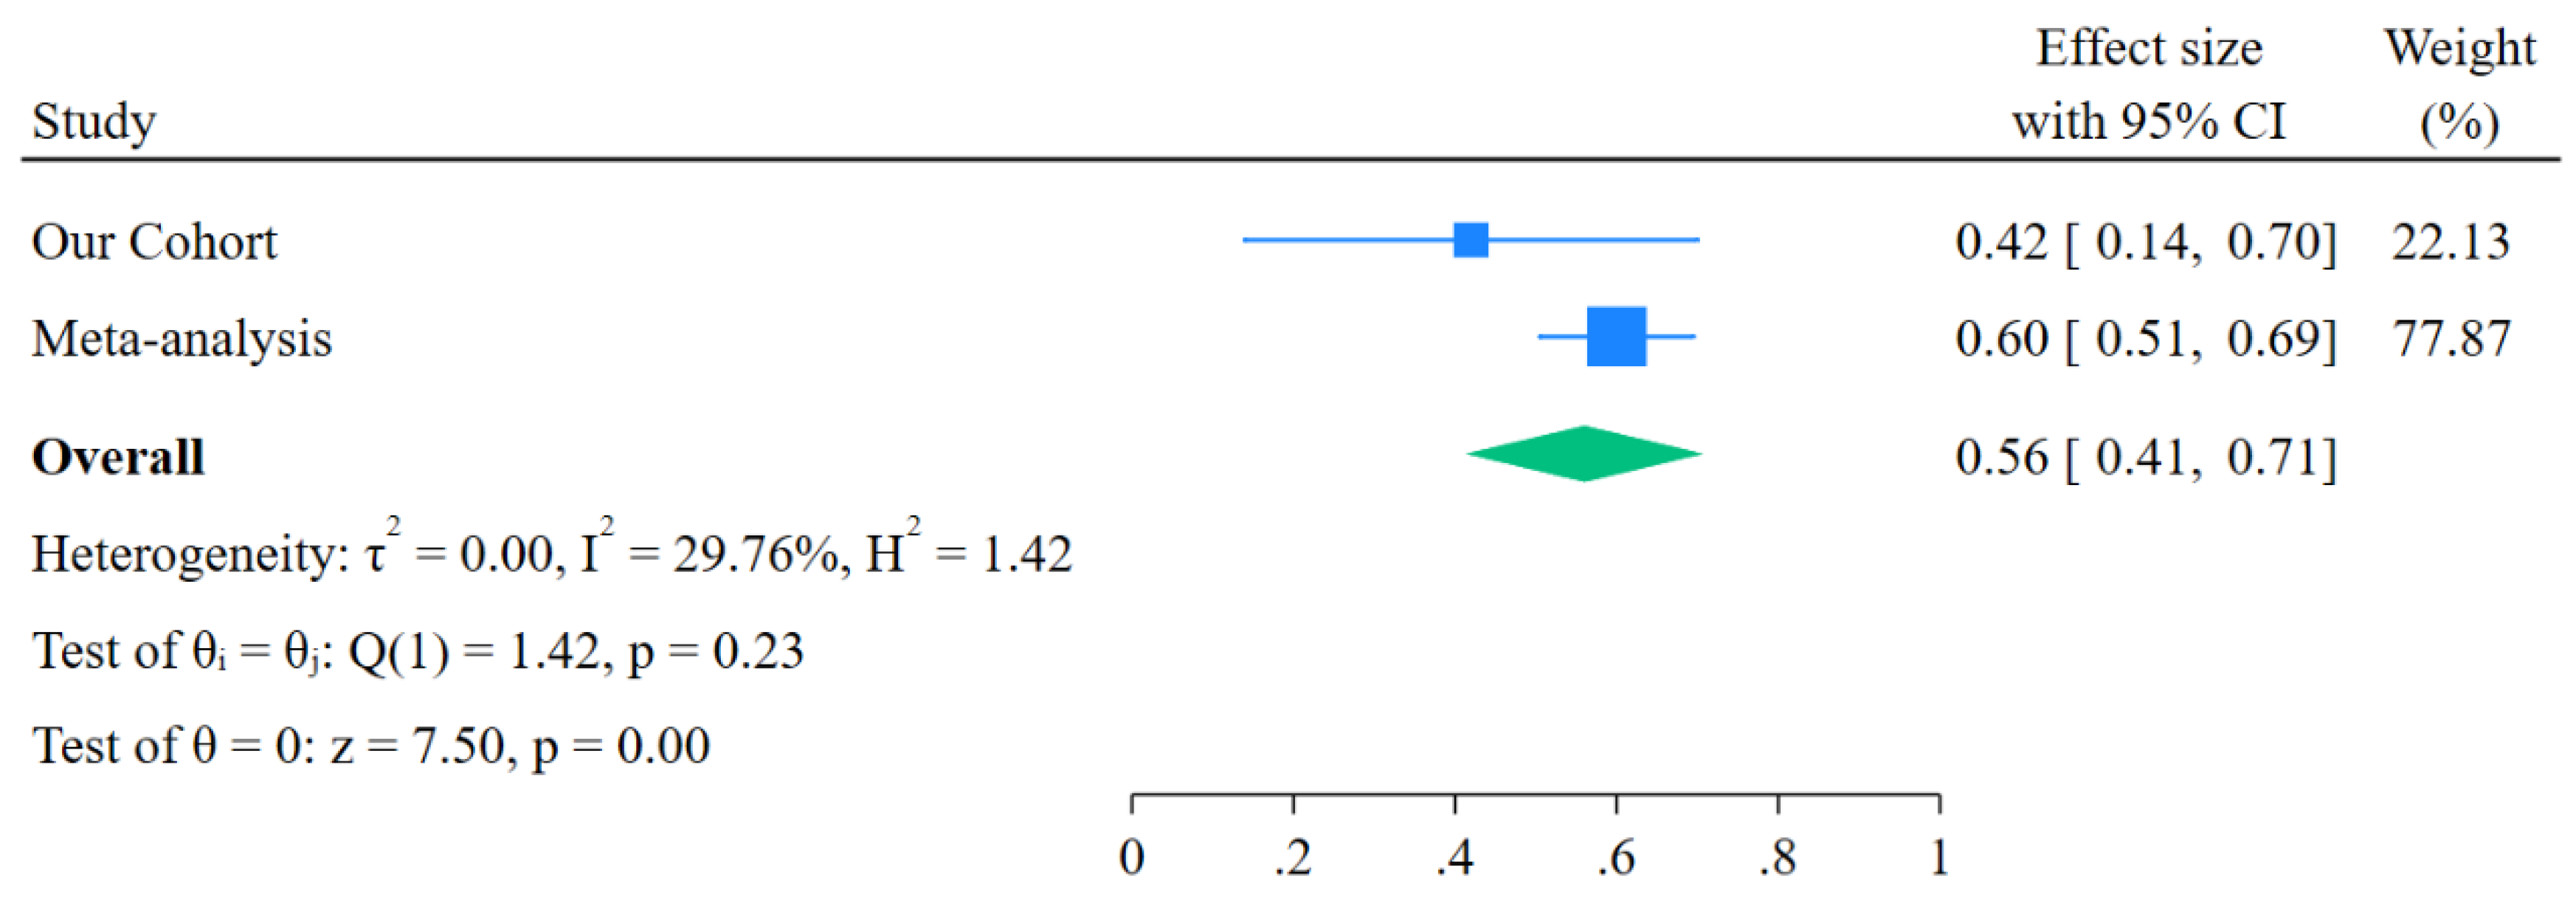
Figure 9.
The pooled results showed a superior control rate for patients achieving a PSA decline greater than 50% (ES=0.60, 95% CI: 0.51-0.70), the funnel plot showed no evidence of publication bias, with Begg’s test p=0.811, Egger’s test p=0.782. X-axis (ES) shows the effect size from each study and Y-axis (se(ES)) represents the standard error of each study’s effect size.
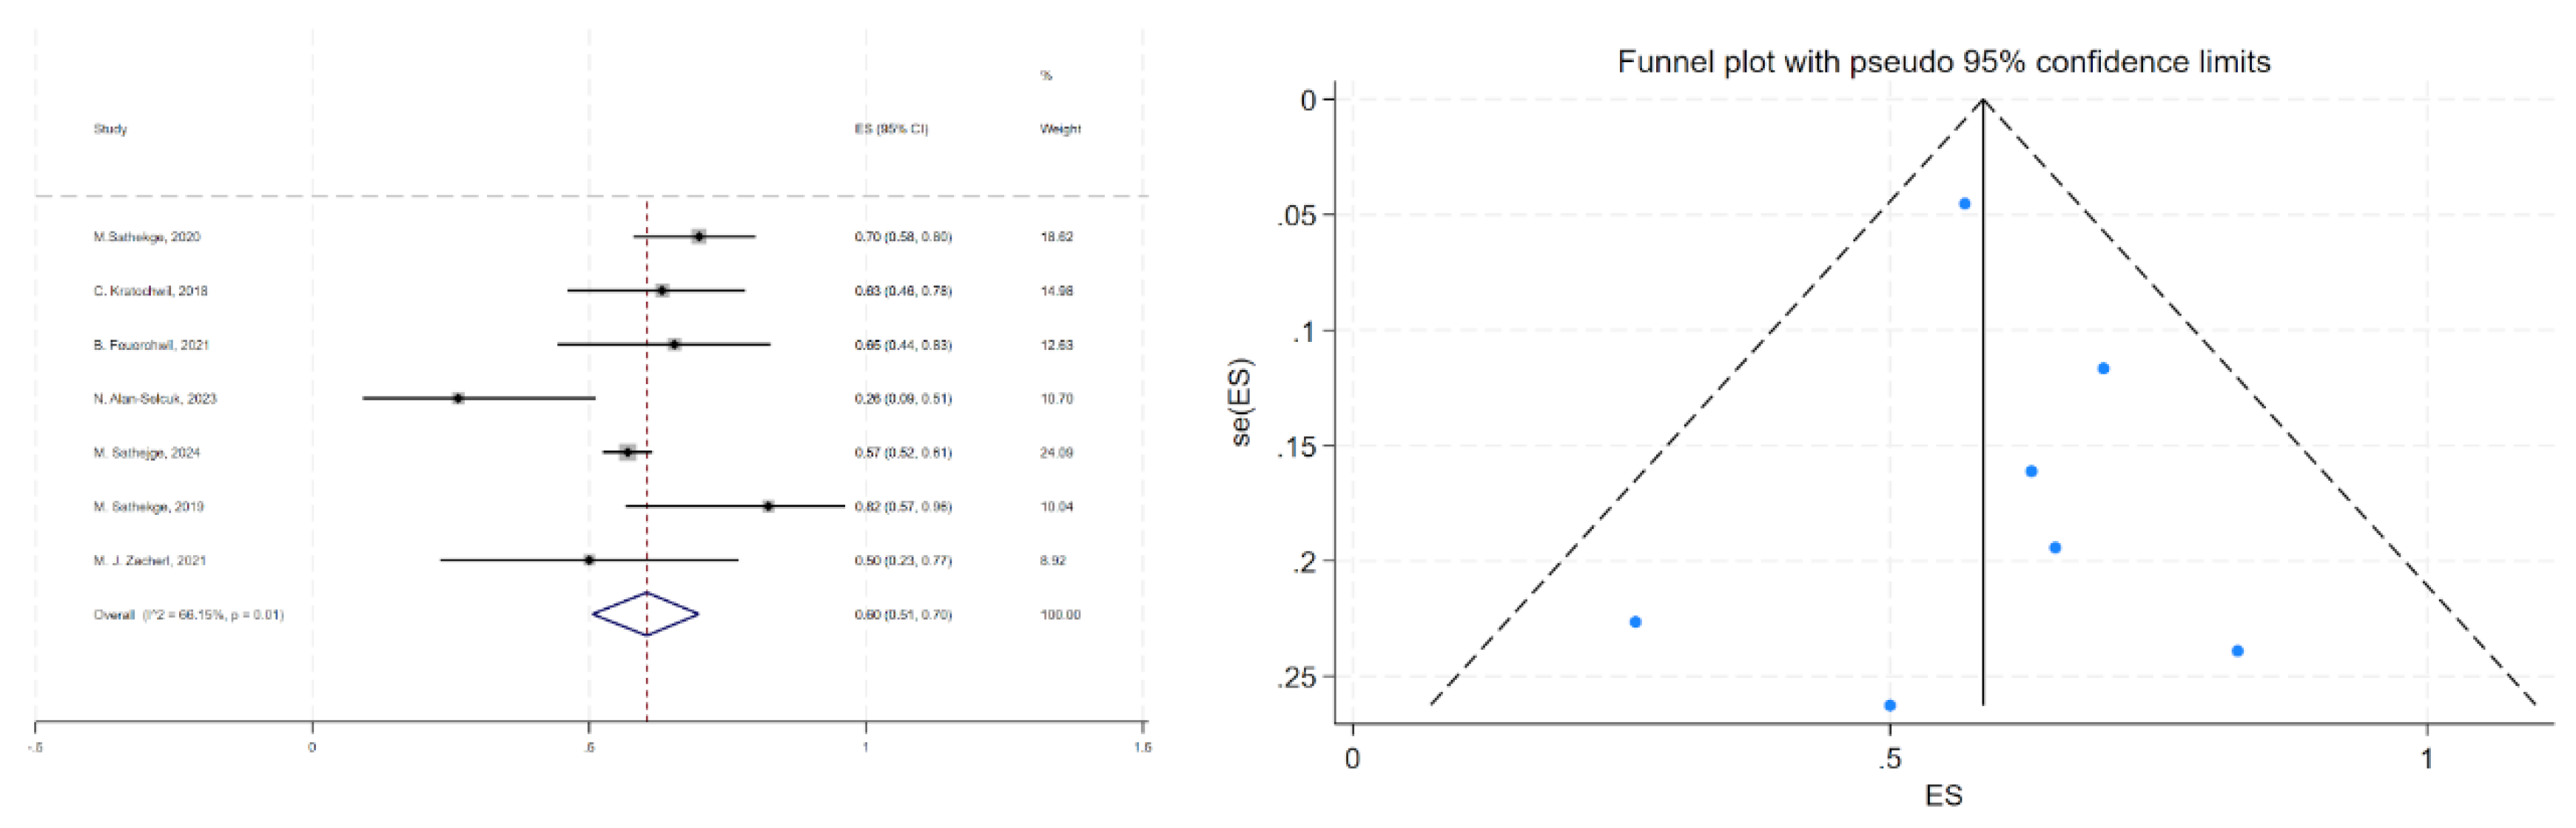

Table 1.
Clinical characteristics and prior treatments of mCRPC patients prior to [²²⁵Ac]Ac-PSMA-617 targeted alpha therapy: including age, barthel index, performance status, previous therapies, and metastatic sites at time of TAT.
Table 1.
Clinical characteristics and prior treatments of mCRPC patients prior to [²²⁵Ac]Ac-PSMA-617 targeted alpha therapy: including age, barthel index, performance status, previous therapies, and metastatic sites at time of TAT.
| Characteristic | Data |
|
Demographics Age (years) | |
| Median (min-max) | 72 (63–81) |
| Barthel index, median (range) | |
| Before [177Lu]Lu-PSMA-617 RLT | 100 (95-100) |
| Before [225Ac]Ac-PSMA-617 TAT | 100 (95-100) |
| Previous Therapies, n (%) | |
| Radical prostatectomy | 8/12 (67%) |
| Local Radiotherapy | 5/12 (42%) |
| Hormone Therapy | |
| Enzalutamide | 10/12 (83%) |
| Abiraterone | 9/12 (75%) |
| Trenantone | 9/12 (75%) |
| Bicalutamide | 2/12 (17%) |
| Chemotherapy | |
| Docetaxel | 8/12 (67%) |
| Cabazitaxel | 5/12 (42%) |
| Contraindication for chemotherapy (inclusive refusal by patient) |
4/12 (33%) |
| Radioligand Therapy | |
| [223Ra]Ra-dichloride | 1/12 (8%) |
| [177Lu]Lu-PSMA-617: Number of cycles: median (min–max) |
12/12 (100%) 4 (2-8) |
| Targeted Alpha Therapy | |
| [225Ac]Ac-PSMA-617: Number of cycles: median (min–max) |
4 (2-6) |
| Individual activity (MBq): median (min–max) |
8.0 (5.0-11.0) |
| Metastatic sites at time of TAT, n (%) | |
| Bone | 12/12 (100%) |
| Regional lymph node | 6/12 (50%) |
| Liver | 2/12 (17%) |
| Lung | 1/12 (8%) |
Table 2.
Baseline serum biomarkers and hematologic parameters in mCRPC patients prior to [¹⁷⁷Lu]Lu-PSMA-617 and [²²⁵Ac]Ac-PSMA-617 therapy. SD represents the standard deviation.
Table 2.
Baseline serum biomarkers and hematologic parameters in mCRPC patients prior to [¹⁷⁷Lu]Lu-PSMA-617 and [²²⁵Ac]Ac-PSMA-617 therapy. SD represents the standard deviation.
| Laboratory blood test |
[177Lu]Lu-PSMA-617 initiation: Mean (min-max) ± SD |
[225Ac]Ac-PSMA-617 initiation: Mean (min-max) ± SD |
| PSA (µg/L) | 250.3 (9.1-1177) ± 323.4 | 589.4 (7.1-1775) ± 567.6 |
| Alk. Phosphatase (U/L) | 140.7 (59-391) ± 103.8 | 241.3 (75-612) ± 159.1 |
| Platelets (G/L) | 249.4 (136–528) ± 98.7 | 199.4 (49-287) ± 68.1 |
| Creatinine (mg/dL) | 0.8 (0.6–1.2) ± 0.2 | 0.9 (0.7-1.1) ± 0.2 |
| WBC (G/L) | 6.1 (4.2-8) ± 1.2 | 5.5 (2.1-7.2) ± 1.4 |
| eGFR (mL/min) | 96.5 (58–124) ± 20.5 | 81.1 (49-111) ± 18.4 |
| LDH (U/L) | 342.4 (98–1429) ± 348.1 | 500.5 (178-1637) ± 476.5 |
| Hemoglobin (g/L) | 146.1 (109-333) ± 57.3 | 113.8 (82-147) ± 20.5 |
Table 3.
Univariate analysis of PSA, hematologic biomarkers and tumor biomarkers after 2 cycles of [225Ac]Ac-PSMA-617, association with overall survival in mCRPC.
Table 3.
Univariate analysis of PSA, hematologic biomarkers and tumor biomarkers after 2 cycles of [225Ac]Ac-PSMA-617, association with overall survival in mCRPC.
| Variable | Threshold | OS, median (weeks) | 95% CI | pvalue | Significance |
| PSA | ≥319 µg/L | 43.5 | 27–59 | 0.002 | ** |
| <319 µg/L | 50 | 38–112 | 0.998 | ns | |
| Hemoglobin | ≥108 g/L | 56.5 | 31–112 | 0.100 | ns |
| <108 g/L | 42.5 | 27–50 | <0.001 | *** | |
| Platelets | ≥180 G/L | 49 | 27–112 | 0.006 | ** |
| <180 G/L | 42.5 | 38–69 | <0.001 | *** | |
| Creatinine | ≥0.84 mg/dL | 50 | 46–112 | 0.006 | ** |
| <0.84 mg/dL | 38 | 27–54 | 0.003 | ** | |
| eGFR | ≥89 mL/min | 38.5 | 27–69 | 0.084 | ns |
| <89 mL/min | 49 | 46–112 | 0.093 | ns | |
| ALP | ≥163 U/L | 42.5 | 27–59 | 0.012 | * |
| <163 U/L | 52 | 31–112 | 0.028 | * | |
| LDH | ≥268 U/L | 42 | 27–54 | 0.014 | * |
| <268 U/L | 54.5 | 39–112 | 0.048 | * |
Table threshold level has been determined based on the median of results available for 12 patients after each cycle of TAT. (*[p ≤ 0.05]; **[p ≤ 0.01]; ***[p ≤ 0.001]; ns: not statistically significant).
Table 4.
Multivariate predictors of overall survival based on PSA and hematologic biomarkers after [225Ac]Ac-PSMA-617 in mCRPC patients.
Table 4.
Multivariate predictors of overall survival based on PSA and hematologic biomarkers after [225Ac]Ac-PSMA-617 in mCRPC patients.
| Variable | Beta Coefficient | 95% CI | pValue | Significance |
| PSA | -0.0006914 | -0.001985 to 0.0006116 | 0.2958 | ns |
| TTV | -0.002331 | -0.003969 to -0.0007455 | 0.0045 | ** |
| ALP | -0.001495 | -0.003980 to 0.0008700 | 0.2254 | ns |
| LDH | -0.00149 | -0.002466 to -0.0005337 | 0.0024 | ** |
| Creatinine | 2.332 | 0.6757 to 3.992 | 0.0058 | ** |
| Hemoglobin | 0.02273 | 0.004784 to 0.04117 | 0.0141 | * |
| eGFR | 0.04402 | 0.02905 to 0.05947 | <0.0001 | **** |
| WBC | -0.2683 | -0.4331 to -0.1060 | 0.0013 | ** |
| Platelets | -0.008833 | -0.01462 to -0.003296 | 0.0022 | ** |
*[p ≤ 0.05]; **[p ≤ 0.01]; ***[p ≤ 0.001]; ****[p ≤ 0.0001]; ns: not statistically significant.
Table 5.
Summary of current and emerging strategies for the prevention and treatment of TAT-induced xerostomia, categorized by mechanism, stage of use, and evidence maturity.
Table 5.
Summary of current and emerging strategies for the prevention and treatment of TAT-induced xerostomia, categorized by mechanism, stage of use, and evidence maturity.
| Strategy | Mechanism | Stage of Use | Evidence/Effectiveness | Readiness Level |
| External Cooling (Ice Packs) | Vasoconstriction to reduce uptake | Used in our cohort | No significant reduction in gland SUV [Muniz et al., 2024] | Widely accessible but limited efficacy |
| Oral Vitamin C (Ascorbic Acid) | Parasympathetic stimulation to increase clearance | Investigational | 26–52% decrease in gland SUVmean [Muniz et al., 2024] | Low-cost, promising data |
| Botulinum Toxin A Injection | Chemical denervation (temporary atrophy) | Investigational | ~64% SUV reduction; saliva preservation in TAT patients [Muniz et al., 2024] | Clinically feasible, promising |
| Monosodium Glutamate (MSG) | Competitive inhibition at PSMA binding sites | Investigational | 24–35% SUVmax reduction in glands [Muniz et al., 2024] | Early clinical trial phase |
| Stem Cell Therapy | Regeneration of gland tissue | In trials (Phase 1/2) | 33–50% increase in saliva flow [Muniz et al., 2024] | High potential, not yet approved |
| Pilocarpine/Cevimeline | Muscarinic stimulation of saliva | Symptom palliation | Significant dry mouth relief in head/neck cancer trials | Routinely used in oncology practice |
| ALTENS (Electrical Nerve Stimulation) | Neuromodulation | Symptom palliation | Comparable to pilocarpine, fewer side effects | Available in select centers |
Table 6.
Comparison of Key Outcome Measures in Clinical Studies Using [225Ac]Ac-PSMA-617 for mCRPC Therapy.
Table 6.
Comparison of Key Outcome Measures in Clinical Studies Using [225Ac]Ac-PSMA-617 for mCRPC Therapy.
| Study (Authors, Year) | Patient (#) | Injected Activity | Median PFS (months) | Median OS (months) | PSA Response (≥ 50%) | Xerostomia (% of patients) | Hematologic Toxicities (% of patients) | Renal Toxicities (% of patients) |
|---|---|---|---|---|---|---|---|---|
| Kratochwil et al., 2017 | 14 | 50-200 kBq/kg | None reported | None reported | 82% | None reported | Not specified | None reported |
| Kratochwil et al., 2018 | 40 | 100 kBq/kg | 9 | None reported | 63% | None reported | None reported | None reported |
| Sathekge et al., 2019 | 17 | 4-13 MBq (escalation) | None reported | 12 | 90% | 100% (Grade 1/2) | 6% (Grade 3 anemia) | 6% (Grade 4) |
| Yadav et al., 2020 | 28 | 100 kBq/kg | 12 | 17 | 39% | 29% | None reported | None reported |
| Sathekge et al., 2020 | 73 | 4-8 MBq (escalation) | 15.2 | 18 | 70% | 85% | Anemia in 37% | 7% (grade III or IV) |
| van der Doelen et al., 2021 | 13 | None reported | None reported | 8.5 | 69% | 100% | None reported | None reported |
| Feuerecker et al., 2021 | 26 | Median 9 MBq per cycle | 3.5 | 7.7 | 65% | 100% (Grade 1/2) | 35% (anemia) | None reported |
| Zacherl et al., 2021 | 14 | Median 7.8 MBq | None reported | None reported | 50% | 36% (Grade 1/2) |
21% (Grade 3 anemia) | None reported |
| Alan-Selcuk et al., 2023 | 23 | Mean 7.6 MBq | 3.1 | 7.7 | 26% | 100% | 4% (Grade 3 anemia) | 4% (Grade 3 nephrotoxicity) |
| Sathekge et al., 2024 | 488 | Median 8 MBq | 7.9 | 15.5 | 57% | 68% | 24% (13% Grade ≥3 anemia, 4% leukopenia, 7% thrombocytopenia) | 5% (renal toxicity) |
Disclaimer/Publisher’s Note: The statements, opinions and data contained in all publications are solely those of the individual author(s) and contributor(s) and not of MDPI and/or the editor(s). MDPI and/or the editor(s) disclaim responsibility for any injury to people or property resulting from any ideas, methods, instructions or products referred to in the content. |
© 2026 by the authors. Licensee MDPI, Basel, Switzerland. This article is an open access article distributed under the terms and conditions of the Creative Commons Attribution (CC BY) license (http://creativecommons.org/licenses/by/4.0/).
Copyright: This open access article is published under a Creative Commons CC BY 4.0 license, which permit the free download, distribution, and reuse, provided that the author and preprint are cited in any reuse.


