
Submitted:
15 February 2026
Posted:
27 February 2026
You are already at the latest version
Abstract
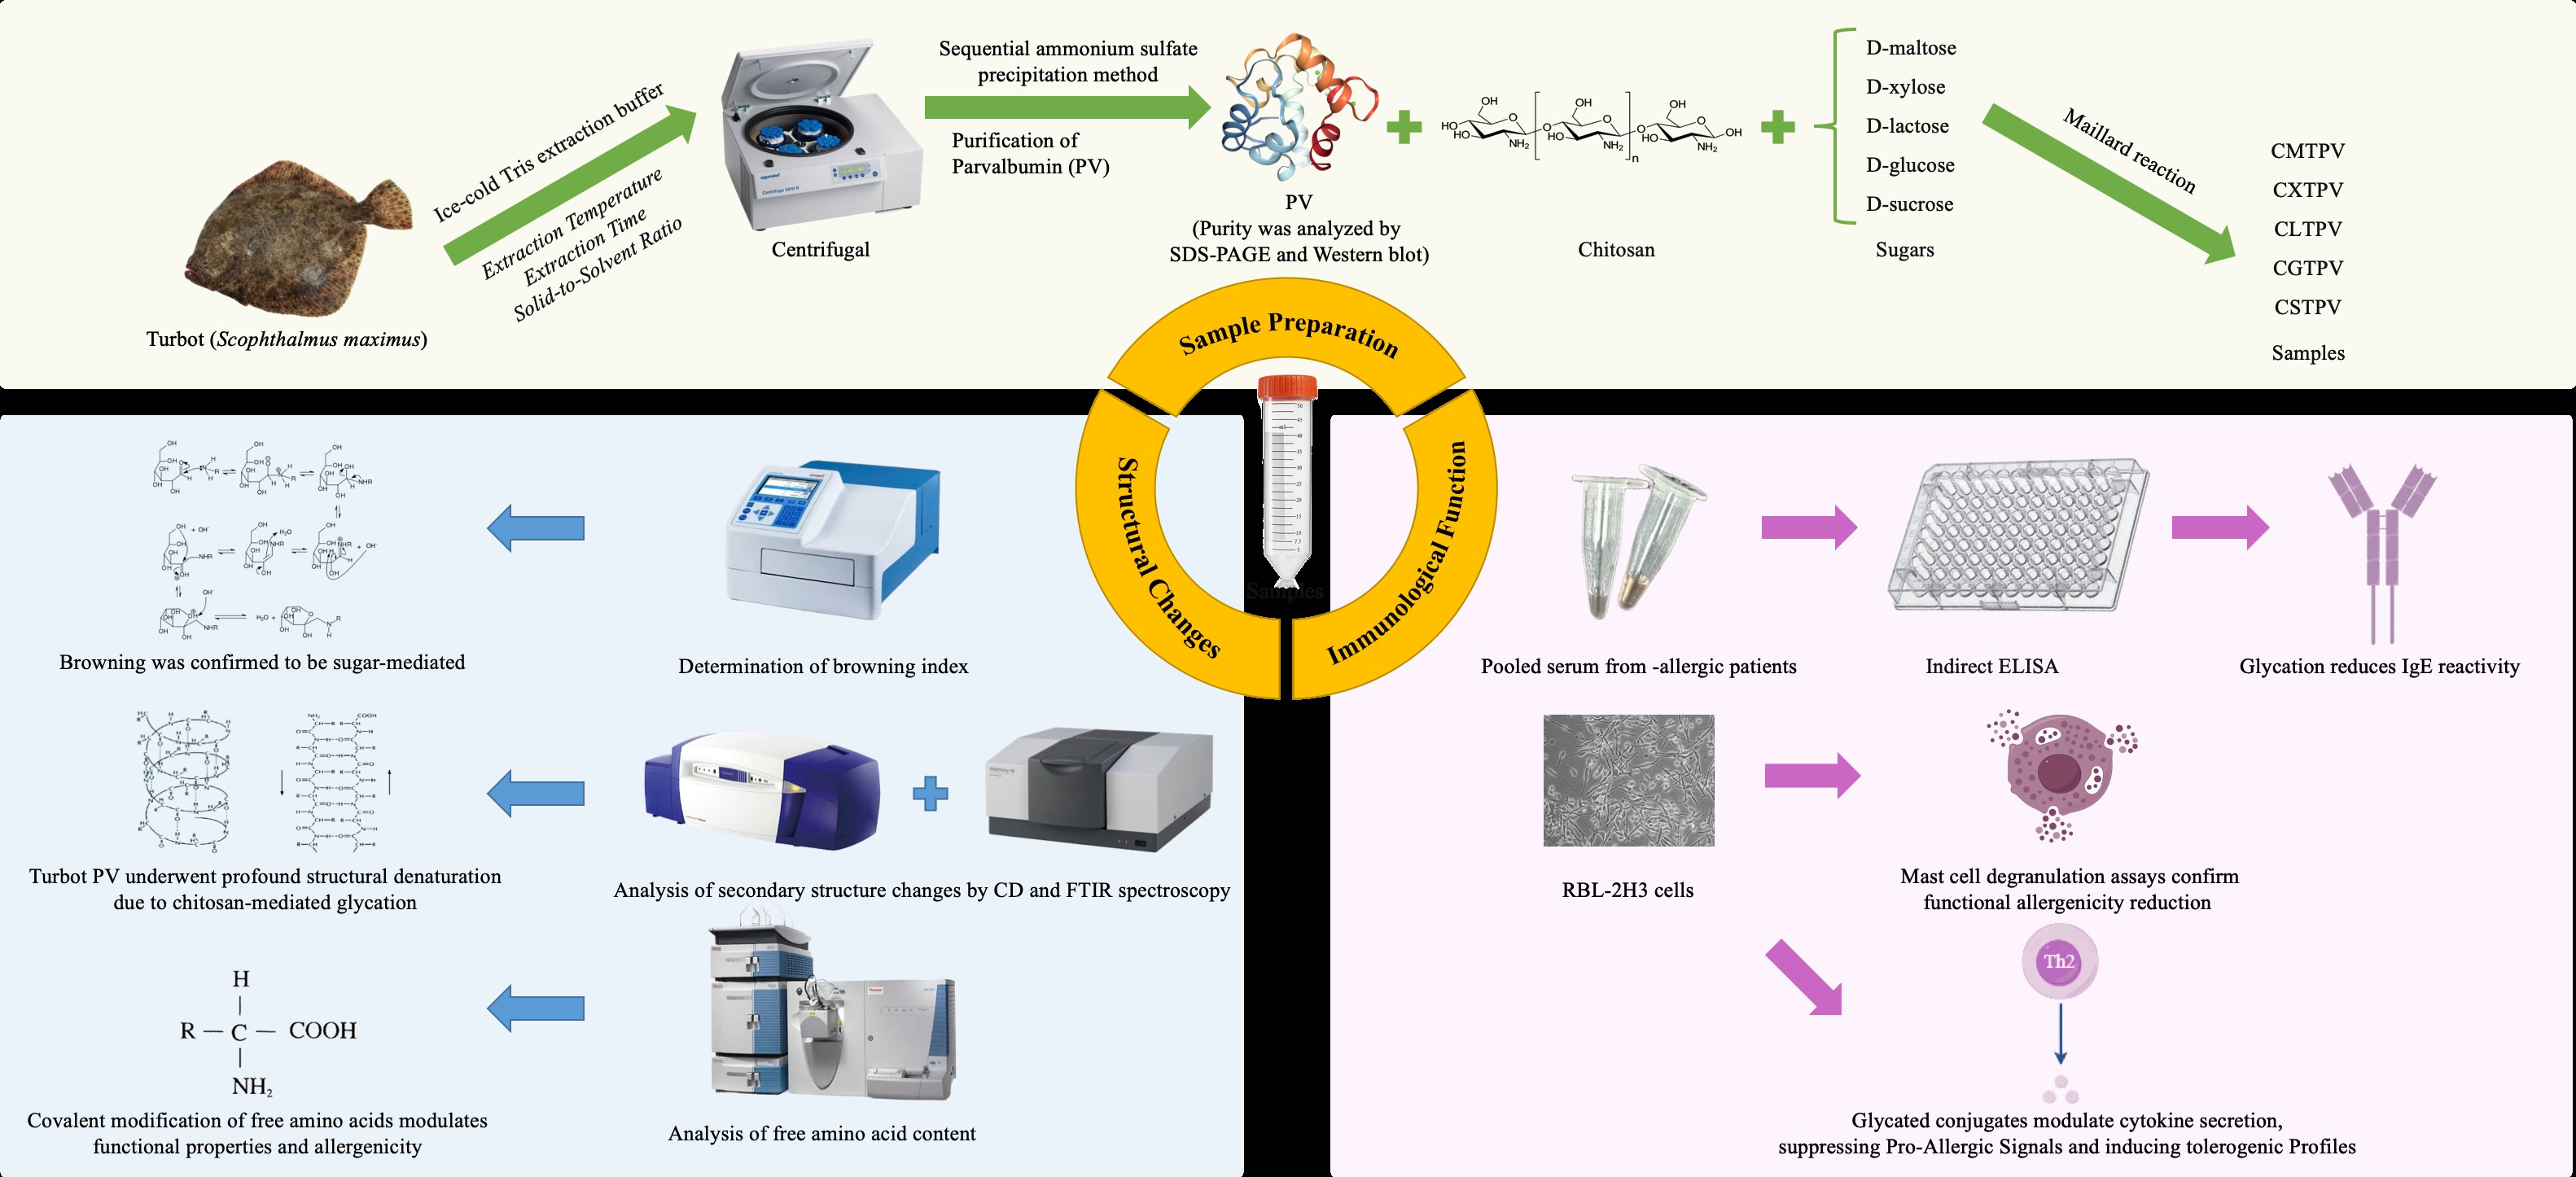
Fish allergy, primarily driven by Parvalbumin (PV), is a global health concern with limited effective mitigation strategies. This study explored Maillard conjugation using chitosan (CS) and various saccharides to modify the structural, functional, and allergenic properties of turbot (Scophthalmus maximus) PV. Structural analyses: Sodium dodecyl sulfate-polyacrylamide gel electrophoresis (SDS-PAGE), Western blotting (WB), Fourier transform infrared (FTIR) spectroscopy, and Circular dichroism (CD) confirmed the successful conjugation and significant alterations in secondary structure, including a loss of α-helical content and an increase in β-sheet/random coil fractions. Glycation markedly enhanced antioxidant activity, with total phenolic content (TPC) increasing up to 10.3-fold and 2,2-diphenyl-1-picrylhydrazyl (DPPH) radical scavenging reaching 74.5% in the CS-xylose-PV conjugate (CXTPV). Indirect Enzyme-linked immunosorbent assay (ELISA) showed significant (p < 0.05), sugar-dependent reductions in IgE-binding capacity (up to ~72% for CXTPV). Rat basophilic Leukemia-2H3 (RBL-2H3) cell line assays demonstrated suppressed β-hexosaminidase release (~75% reduction), decreased Interleukin-6 (IL-6) secretion, and potent inhibition of Interleukin-4 (IL-4) production, indicating attenuated allergenic potential and immunomodulatory effects. CXTPV exhibited the strongest overall performance. These results highlight CS-saccharide Maillard conjugation as an effective strategy developed for hypoallergenic marine-derived ingredients with enhanced bioactive properties.
Keywords:
parvalbumin
; fish allergy
; chitosan
; maillard reaction
; allergenicity reduction
; epitope masking
; antioxidant activity
; immunomodulation
1. Introduction
Food allergy is a growing public health concern, with fish allergy among the most prevalent and severe immunoglobulin E (IgE)-mediated reactions [1]. In most fish species, including turbot (Scophthalmus maximus), the primary allergen is Parvalbumin (PV), a calcium-binding muscle protein with a molecular weight (MW) ranging between 12-14 kDa [2] and responsible for nearly 90-95% of allergic reactions [2,3]. Its well-known stability is that it is relatively stable to heat and digestion, which limits the efficiency of the classical process methods for obtaining hypoallergenic fish substrate [4].
The Maillard reaction (MR) or protein glycation is a non-enzymatic reaction, which occurs in the presence of heat between free amino groups of proteins and reducing sugars [5,6]. This complex cascade of chemical reactions, often classified into initial, intermediate, and final stages, is fundamental to the development of color, flavor, and aroma in many thermally processed foods [7]. This reaction, crucial for food chemistry, significantly alters protein structure and immunoreactivity [8,9].
To exploit this reaction for allergen-specific allergy mitigation, we identified chitosan (CS) as a biopolymer support. CS, a cationic biopolymer extracted from chitin, is composed of the linear chain of β-(1-4)-linked glucosamine and N-acetylglucosamine [10]. Its high-MW linear chain of β-(1-4)-linked glucosamine and N-acetylglucosamine can mask IgE-binding epitopes on turbot PV via steric hindrance [11], and provides a high density of free amino groups. These reactive amino groups are not only key to the MR itself but they also allow CS to make covalent adducts with reducing sugars [12]. In addition to lowering allergenicity, Maillard-induced conjugation confers sugar-dependent functional properties, such as increased antioxidant and antimicrobial activities to final bio-material [13]. The properties of these conjugates, combined with the overall biocompatibility of CS, positions it as a promising ingredient for functional foods and biomedical applications.
Traditional thermal processing creates nonspecific structural changes and is difficult to eliminate PV allergenicity consistently or irreversibly [14,15]. We propose that a rationally engineered macromolecular conjugation approach should be the lead paradigm. This study aims to verify the enhanced efficacy of a Maillard-induced conjugate between PV and a CS-saccharide complex. The overall hypothesis is that this structural alteration will be successful in generating a synergistic decrease in allergenic potential, via effective steric occlusion and electrostatic disruption of canonical IgE-binding epitopes. This mechanism is strongly in line with recent study demonstrating an inhibition of IgG/IgE binding through direct sugar glycation of epitopes and conformational changes [16,17]. Various studies have shown that it effectively reduces PV immunoreactivity [15,18]. Concurrently, the process will generate advanced functional Maillard reaction products (MRPs) with rigorous antioxidant activity [11,13]. The compelling rationale of this dual-objective approach is based on the unique ability of site-specific covalent glycation to permanently mask critical IgE-binding epitopes through steric hindrance and conformational disruption, a decisive mechanistic advantage over reversible thermal unfolding [18], while simultaneously harnessing CS-saccharide chemistry to generate advanced MRPs with potent antioxidant and functional properties. This study aims to validate the enhanced efficacy of Maillard-induced conjugation between turbot PV and CS-saccharide complex evidenced by a synergistic decrease in alle-rgenic potential through efficient epitopes steric and con-formational masking alongside the production of novel MRPs exhibiting strong antioxidant activity. Through rigorous comparative analysis of the structural, functional, and immunological properties of the conjugates relative to a thermally processed PV control, this work establishes a rational and robust framework for developing low-allergenic PV with enhanced bioactivity.
2. Materials and Methods
2.1. Materials
Fresh turbot (Scophthalmus maximus) were purchased from a local seafood market (Beijing, China) and immediately transported on ice to the laboratory within 30 mins. CS (medium MW, ≥75% degree of deacetylation), D-(+)-glucose, D-maltose, D-lactose, D-xylose, D-sucrose, Bradford reagent, tris(hydroxymethyl)aminomethane hydrochloride (Tris-HCl; pH 8.0), glycine, ethylenediaminetetraacetic acid (EDTA), and all other analytical-grade chemicals were obtained from Sigma-Aldrich (Shanghai, China). Horseradish peroxidase (HRP)-conjugated anti-human IgE antibodies were purchased from Abcam (Shanghai, China). Rat basophilic leukemia-2H3 (RBL-2H3) cells were sourced from the National Biomedical Cell Resource Bank (Shanghai, China). Human serum pools from individuals with documented fish allergy (confirmed by clinical history and specific IgE testing) were used for IgE-binding analysis. Sera were aliquoted and stored at -80 °C until use. Enzyme-linked immunosorbent assay (ELISA) kits for β-hexosaminidase, interleukin-4 (IL-4), and interleukin-6 (IL-6) were acquired from MultiSciences Biotech Co., Ltd. (Hangzhou, China). All other reagents were of analytical grade unless otherwise specified.
2.2. Preparation of Fish Fillet and PV Extraction
Fresh turbot (Scophthalmus maximus) was prepared, and fish fillets were extracted according to an approved method with slight modifications [19]. To initiate the PV extraction, a standard protocol was followed: 5 g of the fish fillet sample was homogenized with 30 mL of ice-cold Tris extraction buffer (0.1 mol/L, pH 7.4, containing 0.5 mmol/L glycine with or without 0.1 mmol/L dithiothreitol) at a solid-to-solvent ratio of 1:6 (w/v). The homogenate was then subjected to an initial extraction condition of 4 °C for 12 h, followed by centrifugation and collection of the supernatant.
2.2.1. Optimization of PV Extraction Parameters
The extraction process was systematically optimized by varying three key parameters: temperature, time, and solid-to-solvent ratio. Unless otherwise stated, the standard conditions of 4 °C for 12 h and a 1:6 (w/v) ratio were used as a baseline, and one parameter was varied at a time.
2.2.1.1. Effect of Extraction Temperature
Extraction was performed at different temperatures (0 °C, 4 °C, 8 °C, 12 °C) for a constant duration of 12 h and at a continuous solid-to-solvent ratio of 1:6 (w/v).
2.2.1.2. Effect of Extraction Time
Based on the results of the temperature optimization, extraction was subsequently carried out at the optimal temperature for different time intervals (6, 12, 24, 36, and 48 h), maintaining a constant solid-to-solvent ratio of 1:6 (w/v).
2.2.1.3. Effect of Solid-to-Solvent Ratio
The extractions were conducted using different solid-to-solvent ratios (1:2, 1:6, 1:10, and 1:14, w/v). These were performed at both the previously determined optimal temperature and the standard 4 °C, as well as at both the optimal time and the standard 12 h duration, to evaluate the interaction between these factors. For all experiments, the extracts were centrifuged, and the supernatant was dialyzed against 0.1 mol/L phosphate-buffered saline (PBS, pH 7.4). The final PV extract was stored at -20 °C for further analysis.
2.3. Purification of PV
PV was purified from the crude extract using a sequential ammonium sulfate precipitation method adapted from Swoboda et al. [20] with some slight modifications. The crude extract was first brought to 65% saturation with ammonium sulfate, and the precipitate was discarded after centrifugation. The supernatant was then raised to 90% saturation, and the resulting pellet containing the enriched PV fraction was collected. The pellet was dissolved with 20 mM Tris-HCl (pH 8.0) containing 1 mM EDTA and dialyzed against 50 mM sodium bicarbonate buffer (pH 8.3) for 24-36 h to remove salts. The dialyzed sample was concentrated using a 3.5 kDa MW cutoff centrifugal concentrator. Sodium dodecyl sulfate-polyacrylamide gel electrophoresis (SDS-PAGE) and Western Blot (WB) were used to analyze the purity of the extracted PV. Protein concentration was determined before storage at -80 °C.
2.4. Preparation of CS-PV-Sugar Conjugates and Control
The glycation of PV with CS was performed using a controlled-heating method based on the principles of MR conjugation, with slight modifications [21]. Five sugars, D-maltose, D-xylose, D-lactose, D-glucose, and D-sucrose, were selected for glycation with CS and turbot PV. A CS stock solution was first prepared at 1% (w/v) in 1% (v/v) acetic acid, while individual 1% (w/v) sugar solutions were prepared in 0.01 M PBS, pH 7.4. Each sugar solution was then mixed with the CS stock at a 1:1 mass ratio under constant stirring for 30 mins at room temperature. Purified PV was dissolved in PBS to a concentration of 2 mg/mL. For conjugation, each CS-sugar mixture was combined with the PV solution at a 1:1:1 mass ratio, and the pH of all final reaction mixtures was adjusted to 7.4. The glycation reaction proceeded by lyophilizing for 48 h and then incubating under controlled conditions (with an incubator) at 60 °C for 72 h, yielding the corresponding conjugates: CS-xylose-turbot-PV(CXTPV), CS-glucose-turbot PV (CGTPV), CS-sucrose-turbot PV (CSTPV), CS-maltose-turbot PV (CMTPV), and CS-lactose-turbot PV (CLTPV). A native control (NTPV) was prepared in parallel by heating a PV-PBS mixture, without CS or sugar, under the same conditions. All reactions were terminated by immediate cooling in an ice bath for 20 mins. Finally, the conjugates and control were freeze-dried and stored at -20 °C.
2.5. Characterization of Structural Changes
The browning index, as an indicator of the degree of the MR, was estimated by measuring absorbance at 420 nm according to the standard method [6]. Absorbance at 420 nm in diluted crude extract samples (200 μL) was measured using a microplate reader (Supermax, Shanghai, China).
2.5.1. SDS-PAGE analysis
The Protein samples were mixed with SDS-PAGE loading buffer according to the method of Tai et al. [14]. Samples were heated for 5 mins at 95 °C to denature the proteins and loaded onto a polyacrylamide gel (15%), and electrophoresis was conducted at a constant voltage of 100-140 V for 2-3 h. Gels were stained with Coomassie Brilliant Blue to visualize protein bands.
2.5.2. WB Analysis
This analysis was conducted according to the method of Wu et al. [17] with some slight modifications. Proteins from the SDS-PAGE gel were transferred to a nitrocellulose or PVDF membrane. The membrane was blocked with Bovine Serum Albumin (BSA), a blocking agent. The membrane was probed with anti-PV IgG antibodies (obtained from mouse sera immunized with fish PV) to confirm the identity and general antigenicity of the protein bands. Membranes were incubated with an HRP-conjugated mouse anti-mouse Immunoglobulin G (IgG). Signals were developed using an enhanced chemiluminescent (ECL) kit and detected.
2.5.3. Circular Dichroism (CD) Spectroscopy
The secondary structure of the protein samples was characterized by CD spectroscopy [22]. Measurements were performed on a CD Spectrometer (Applied Photophysics, UK) in the far-UV range (195-250 nm) with a nitrogen purge. Proteins were diluted to 0.2 mg/mL before analysis. The CD spectra data were processed using the Omnic software, and the relative content of secondary structure elements was quantitatively evaluated using the Beta Structure Selection (BeStSel) platform.
2.5.4. Fourier Transform Infrared (FTIR) spectroscopy
To assess the changes in the protein structure, FTIR spectroscopy was performed on the glycated and control samples, following established methods for spectral acquisition and the analysis of the Amide 1 region [23,24]. Freeze-dried sample powders were thoroughly mixed with potassium bromide (KBr) at a ratio of approximately 1:100 (sample: KBr) and pressed into transparent pellets under vacuum. Spectra were recorded in transmission mode (4000-400 cm⁻¹, 4 cm⁻¹ resolution, 64 scans). Secondary structure was quantified by deconvoluting the amide I region (1600-1700 cm⁻¹). Spectral deconvolution and the initial estimation of secondary structure components were performed using the BeStSel algorithm. The deconvoluted amide I bands were subsequently fitted and refined using Prism software, with sub-bands assigned as follows: ∼1690 cm⁻¹ (β-turn), ∼1675 cm⁻¹ (α-helix), ∼1655 cm⁻¹ (random coil), and ∼1640 cm⁻¹ (β-sheet). The quality-corrected R² values for all fitted curves exceeded 0.99.
2.5.5. Analysis of Free Amino Acid Content
The analysis of free amino acids was performed using liquid chromatography-mass spectrometry (LC-MS) according to an established method with minor modifications [25]. An aliquot of the mixed sample was homogenized with 0.9 mL of 50% acetonitrile solution for 5 mins. The resulting mixture was vortexed and then centrifuged at 12,000 rpm for 10 minutes. The supernatant was filtered through a 0.22 μm microporous membrane before LC-MS analysis. Chromatographic separation was achieved using a Waters BEH Amide column (2.1 × 100 mm, 1.7 μm) maintained at 35 °C. The mobile phase was delivered at a constant flow rate of 0.35 mL/min, and an injection volume of 2.0 μL was used. Detection was performed using an electrospray ionization source in positive-ion mode.
2.6. Analyses of Bioactive Compounds and Antioxidant Activity
2.6.1. Total Phenolic Content (TPC)
TPC was determined following the method used by Sidonia et al. [26]. Aliquots of 0.5 mL of the samples were mixed with 2.5 mL of Folin-Ciocalteu reagent and 2 mL of NaCO3 (7.5%; w/v). The mixture was heated at 450C for 15 mins in a water bath in darkness and left to stand 30 mins before the absorbance was measured at 765 nm. The total phenolic content is expressed as gallic acid equivalents (GAE)/100 g of fresh matter based on a standard curve of gallic acid (0-100 mg/kg).
2.6.2. 2,2-diphenyl-1-picrylhydrazyl (DPPH) Radical Scavenging Capacity
The method of Du et al. [27] was used to evaluate the DPPH radical-scavenging capacity of hydrolysates and MRPs, with minor adjustments. The DPPH working solution is obtained by dissolving DPPH powder in ethanol. 20 μL of the sample was combined with 180 μL DPPH working solution (0.2 mM) and incubated in the dark at room temperature for 30 mins. Subsequently, the absorbance of the mixed solution was detected at 517 nm utilizing a microplate with L-ascorbic acid as a positive control. The DPPH free radical scavenging rate is calculated as follows:
2.7. Indirect ELISA
CS-Glycated samples and NTPV were quantified using an indirect enzyme-linked immunosorbent assay (ELISA) with allergen-specific IgE, as adapted from methods used in food allergy research [15], with minor modifications. The plate was coated with 100 μL/well PV (2g/mL) at 4 °C overnight. After washing five times with washing buffer (0.05% Tween 20 in PBS), the plate was blocked with 200 μL/well of blocking buffer (5% BSA in PBS) at 37 °C for 1.5 h. Pooled serum from turbot-allergic patients was diluted in 1% BSA/PBS. To assess non-specific binding, it was incubated for 2 h at 37 °C. Following another wash, the plates were incubated with a mouse monoclonal IgE-specific, HRP-conjugated mouse anti-human IgE secondary antibody for 1 h at 37 °C. The plates were washed thoroughly, and the reaction was developed using 3,3’,5,5’-Tetramethylbenzidine (TMB) substrate. The color development was stopped with 50 μL 2M H₂SO₄, and the absorbance was measured at 450 nm. A native control group labelled as “PV (untreated)” was without CS or sugar, and no heating. It was added to serve as a baseline for the experiment.
2.8. Mediator and Cytokine Release
2.8.1. Cell Culture
The RBL-2H3 cells were grown according to the method of Song and Li [29] with minor modifications. Initially, the cells were cultured in Dulbecco’s Modified Eagle’s Medium (DMEM) supplemented with 10% Fetal Bovine Serum (FBS), streptomycin (100 μg/mL), and penicillin (100 U/mL). Next, the cells were incubated in a 5% CO2/95% air atmosphere at 37 °C.
2.8.2. β-hexosaminidase release
RBL-2H3 cell degranulation assay was performed according to Passante et al. [30] with slight modifications. RBL-2H3 cells (5 x 10⁵ cells per mL, 200 μL per well) were inoculated into a 96-well plate. 24 h later, the cells were washed with PBS, and then 10 μL of diluted serum in minimum essential medium without FBS was added to each well. After being cultured in an incubator for 24 h, the cells were washed 3 times with Tyrode’s buffer [135 mM NaCl, 5 mM KCl, 1 mM MgCl2, 1 mM CaCl2, 20 mM HEPES, 5.6 mM glucose, 0.05% BSA (pH 7.4)]. 50 μL of the samples (100 ng mL-1) dissolved in Tyrode’s buffer was added. The positive control group used 1% TritionX-100, while the blank group labelled “CONTROL” used Tyrode’s buffer instead of the samples. After reacting for 45 mins at 370C, the reaction was terminated with an ice bath, and 30 μL of supernatant was drawn and added to another 96-well plate. Subsequently, 50 μL of citric acid solution with 1mM 4-nitrophenyl-N-acetyl-o-glucosaminide was added to each well, and cells were incubated for 1 h at 370C. Sodium carbonate buffer (200 μL) was added to each well, and a multifunctional microplate reader was used to measure the absorbance at 405 nm in each well. The β-hexosaminidase release levels were calculated as:
2.8.3. Cytokine Analysis
The Glycated samples and NTPV were centrifuged for 10 mins at 3000 × g at 4 °C to pellet debris and granules. IL-4 and IL-6 were measured in the resulting supernatant by ELISA, following the manufacturer’s instructions [18]. A control group, labelled as “CONTROL”, used low-serum medium instead of the samples.
2.9. Statistical Analysis
Data (n=3, n=6) were analyzed using one-way ANOVA with Tukey’s post-hoc test (GraphPad Prism v9.0). Results are mean ± SD; p < 0.05 is considered significant.
3. Results
3.1. Extraction, Purification, and Identification of PV
Turbot PV was isolated from turbot muscle using a cold-buffered extraction protocol, followed by ammonium sulfate precipitation and dialysis, to obtain a highly pure, intact protein preparation suitable for subsequent glycation and allergenicity studies. SDS-PAGE served as a key quality-control step to evaluate purity, MW, and integrity [31]. Temperature was the first parameter optimized. SDS-PAGE revealed that extraction at 0-4 °C yielded the highest PV band intensity, with higher temperatures (8-120C) resulting in reduced recovery, likely due to increased proteolytic activity and thermal denaturation (Figure 1A). The influence of temperature on extraction efficiency was first evaluated. Extraction at low temperatures (0 °C and 4 °C) yielded the highest recovery of soluble protein (Figure 1A).
Extraction time was evaluated at 4 °C using a 1:6 (w/v) solvent-to-sample ratio. The maximum PV yield was achieved at 12 h, with a decline observed at longer durations (24-48 hours) (Figure 1B). The solvent-to-sample ratio was optimized at 4 °C for 12 h. A 1:6 (w/v) ratio provided the highest extraction efficiency, whereas higher ratios (1:10-1:18) showed no significant improvement (Figure 1C). The purified turbot PV appeared as a major band at approximately 14 kDa on SDS-PAGE (Figure 1D) and was specifically recognized by anti-PV IgG antibody in WB analysis (Figure 1E). The gentle extraction conditions successfully preserved antigenic epitopes and conformational integrity, enabling reliable evaluation of subsequent structural and immunological modifications. The quality of this preparation allows for meaningful studies on the effects of Maillard conjugation on allergenicity and bioactivity.
3.2. Synthesis and Characterization of CS-Sugar-PV Conjugates via the MR
3.2.1. Spectrophotometric Analysis of MR progression
Browning intensity (A420) is the most widely used, simple, and rapid method to monitor non-enzymatic browning, reflecting the accumulation of high- MW melanoidins and advanced glycation end-products (AGEs) in the final stages of the MR. [32]. The results revealed a clear sugar-dependent hierarchy among the conjugates: CXTPV (2.275 ± 0.093) > CGTPV (1.305 ± 0.022) > CMTPV (0.977 ± 0.007) > CLTPV (0.705 ± 0.010) > CSTPV (0.244 ± 0.013) (p < 0.05). The NTPV exhibited negligible browning (0.049 ± 0.001). All glycated conjugates showed significantly higher A420 values compared to NTPV (p < 0.05), with CXTPV, which displayed the highest absorbance (Figure 2A).
Visual examination of the reaction solutions after 72 h incubation confirmed progressive color development in the same hierarchical order, ranging from no color NTPV to deep brown (CXTPV) (Figure 2B). The 46.4-fold increase for CXTPV demonstrates the superior reactivity of the pentose sugar xylose. The minimal value for NTPV definitely proves that browning resulted from sugar-mediated glycation, but not the heat treatment alone.
3.2.2. Analysis of Glycation and Native Control by SDS-PAGE and WB
MR forms covalent sugar adducts and cross-links, which appear on gels as high-molecular-weight smearing and reduced band intensity. These patterns provide direct visual proof of chemical conjugation and structural alteration, confirming that glycation leads to significant protein aggregation and denaturation [33]. SDS-PAGE analysis revealed a distinct MW shift for all glycated conjugates compared to the NTPV (Figure 3A), which migrated as a sharp band at approximately 14 kDa. The conjugates, CXTPV, CGTPV, CMTPV, CLTPV, and CSTPV, displayed smeared, higher-molecular-weight bands than those of NTPV.
The identity of shifted bands was confirmed by WB with an anti-PV IgG antibody, demonstrating that the high-MW species contained PV (Figure 3B). However, the intensity and clarity of the IgG signal differed greatly with an extensively glycated conjugate, such as CXTPV, dispalying a fainter, more diffuse reactivity. These structural modifications suggest that glycation, with specific reducing sugars, particularly, can significantly alter PV’s IgE/IgG binding capacity. These changes in conformation indicate that glycation with individual reducing sugars, notably, can have a profound effect on PV’s ability to bind IgE/IgG. This effective glycation, extremely rich in reactive sugars such as xylose, directly
3.3. Conformational Rearrangement of Glycated Conjugates and NTPV
3.3.1. Evidence from CD
CD spectroscopy was employed to quantitatively assess conformational changes in the secondary structure of turbot PV induced by CS-saccharide glycation [34]. To elucidate the structural consequences of MR on turbot PV, we analyzed the protein via CD spectroscopy. The spectral data (Figure 4A) revealed that NTPV exhibits a characteristic α-helical profile, with a positive peak in the 195-200 nm range, a maximum ellipticity at 198 nm, and two distinct negative peaks with minima at 209 nm and 220 nm. This pattern in the NTPV’s spectrum displayed the classic α-helical signature with two distinct negative minima at 209 nm and 222 nm (Figure S1). In sharp contrast, all glycated conjugates showed a spectra of disordered and aggregated structures, with a continuous broad negative peak in the 208-240 nm range and a diminished positive peak in the 190-208 nm range (Figures S2-S6). The conjugates revealed a dramatic, sugar-dependent loss of α-helical structure and a significant increase in β-sheet and random coil content. The spectral transformation suggests a glycation-induced conformational change from an ordered α-helical fold to a state dominated by β-sheet/random coil structures.
Quantitative analysis of the far-UV CD spectra revealed significant alterations in PV’s secondary structure upon CS-saccharide glycation (Table 1). NTPV exhibited an α-helix content of 29.67 ± 0.82%, with a β-sheet content of 21.10 ± 0.62%. In contrast, all glycated conjugates displayed a highly significant reduction in α-helix content (p < 0.001), ranging from 6.16 ± 0.21% (CGTPV) to 2.05 ± 0.06% (CSTPV), accompanied by a corresponding increase in β-sheet content, ranging from 32.12 ± 0.96% (CGTPV) to 37.42 ± 1.10% (CSTPV). The greatest loss of α-helix and gain in β-sheet were observed in CSTPV and CXTPV, while random coil and β-turn contents varied across the conjugates, confirming a consistent shift from helical to β-sheet-rich structures in all glycated samples compared to NTPV.
3.3.2. Evidence from FTIR
FTIR spectroscopy is primarily used to detect the formation of covalent bonds and specific functional groups, such as the loss of free amino groups and the appearance of Schiff bases or Amadori products, that confirm the occurrence of the MR [35]. FTIR spectroscopy confirmed covalent conjugation and sugar-dependent structural changes in CS-saccharide-PV conjugates (Figure 4B). NTPV displayed characteristic protein bands: a broad O–H/N–H stretch at 3289 cm⁻¹, C–H stretch at 2936 cm⁻¹, Amide I (C=O) at 1650 cm⁻¹, Amide II (N–H bend) at 1564 cm⁻¹, C–H bend at 1407 cm⁻¹, C–N/C–O stretches at 1058 and 920 cm⁻¹, C–H out-of-plane bend at 648 cm⁻¹, and a peak at 529 cm⁻¹ (Figure S7). In contrast, the 529 cm⁻¹ peak was absent in all glycated samples, indicating disruption of higher-order structures or disulfide bonds. A sharp N-H band at 3188 cm⁻¹ in NTPV vanished in all conjugates, suggesting N-H modification. The Amide II intensity at 1564 cm⁻¹ increased, possibly due to contributions from saccharide N-H groups. The 1407 cm⁻¹ band intensified, consistent with N-linked glycation or saccharide C–H addition; this aligned with enhanced 648 cm⁻¹ intensity. The 1200-900 cm⁻¹ region (C–O/C–N stretches) showed lower-wavenumber shifts, broadening, loss of 976 cm⁻¹ shoulder, and a new 920 cm⁻¹ peak, reflecting saccharide influence. CXTPV showed prominent C=O and ~1050 cm⁻¹ peaks (Figure S8). CGTPV and CMTPV exhibited wider C-O/C-N bands (Figures S9 and S10). CLTPV and CSTPV displayed peak splitting in this region (Figures S11 and S12). CSTPV lacked a clear C=O band, indicating extensive modification.
The relative proportions are shown in Table 2. Compared with the NTPV, the MR induced distinct structural alterations, depending on the saccharide involved. NTPV exhibited a balanced secondary structure profile with 29.1% α-helix, 27.9% β-turn, 24.3% random coil, and 18.9% β-sheet, which is characteristic of a well-folded calcium-binding protein. In contrast, glycation-induced systematic reorganization: CGTPV, CMTPV, and CLTPV exhibited increased β-sheet content (22-25%) and decreased α-helix and β-turn content. CSTPV caused the most extreme perturbation, resulting in the highest random coil (31.86%) and the lowest α-helix (18.26%), indicating severe structural unfolding. CSTPV caused the most extreme unfolding (31.86% random coil, 18.26% α-helix). In contrast, CXTPV exhibited an increased α-helical content (31.76%) and reduced β-sheet, suggesting xylose mediated the stabilization of certain structural elements.
3.4. Free Amino Acid Analysis Reveals Sugar-Dependent Glycation Signatures
Free amino acids, particularly lysine and arginine, serve as primary nucleophiles that initiate the MR by forming Schiff bases with reducing sugars [36]. Their covalent modification drives protein cross-linking, structural alteration, and advanced glycation end-product (AGE) formation, directly influencing functionality and allergenicity. Free amino acid analysis revealed conjugate-specific alterations compared to NTPV, providing direct evidence of MR progression rather than thermal effects alone (Table 3). Lysine showed consistent depletion across all glycated conjugates, with CXTPV exhibiting the greatest loss (56%), followed by CMTPV (50%) and CGTPV (43%), indicating the most extensive covalent modification. The CLTPV conjugate demonstrated the most extreme alterations, with 800% increases in both phenylalanine and tryptophan and a 554% increase in histidine, indicating aggressive protein cross-linking and structural unfolding. In contrast, the CMTPV conjugate displayed a unique and singular 853% increase in glutamic acid, a signature of non-enzymatic deamination. The CGTPV conjugate showed marked accumulation of aromatic and basic residues, with 453% and 473% increases in phenylalanine and tryptophan, respectively, characteristic of AGE. The CSTPV and CXTPV conjugates showed more defined profiles; CSTPV showed significant increases in glycine (131%) and arginine (114%), while CXTPV showed the highest overall glycine level (199% increase) alongside pronounced lysine depletion.
3.5. Glycation Confers Potent Antioxidant Activity to PV Conjugates
A significant increase in TPC following glycation serves as a key functional biomarker, indicating that the MR concurrently attenuates allergenicity and confers enhanced antioxidant capacity, transforming the protein into a dual-action ingredient for hypoallergenic food applications [12,13]. TPC values (mg GAE/g protein) were markedly higher in all glycated conjugates compared to NTPV (5.4%) (Figure 5A). CXTPV showed the most substantial increase, reaching 10.3-fold higher than NTPV, while CSTPV, CGTPV, CLTPV, and CMTPV exhibited 6- to 9-fold elevations. This pronounced enhancement directly quantifies the abundance of reducing MRPs, which fulfill a dual role: as antioxidant species and as a covalent, steric matrix that disrupts conformational IgE-epitopes.
The DPPH assay is a widely used method to measure antioxidant activity based on free radical scavengingad [37]. The functional impact of glycation was evaluated by measuring the antioxidant activity and total reducing capacity of the conjugates (Figure 5B). NTPV exhibited minimal activity (13.5%), confirming that heat treatment alone is insufficient. All CS-glycated conjugates showed significant increases (p < 0.05), with a clear hierarchy: CXTPV (74.5%, 5.5-fold increase) > CGTPV (68.2%) > CMTPV (62.1%) > CLTPV (51.2%) > CSTPV (46.4%). The superior performance of CXTPV highlights the high reactivity of xylose (aldopentose) in driving potent MRP formation when conjugated via the CS platform.
3.6. Immunological and Functional Profiling of Glycated PV Conjugates
3.6.1. Indirect ELISA Reveals a Sugar-Dependent Reduction in IgE-Binding Capacity
ELISA is a standard, highly sensitive immunological method used to quantify the specific binding of IgE antibodies to allergenic proteins, enabling the measurement of both conformational and linear epitopes recognized by patient sera [38]. The IgE-binding capacity serves as a critical indicator of sensitization potential and the presence of allergenic epitopes, providing an essential first-line assessment of the immunogenicity of PV-modified allergens [18]. In this study, indirect ELISA was employed to determine the IgE-binding capacity of NTPV and its CS-saccharide glycated conjugates. The untreated PV (Figure 6A) exhibited high IgE-binding (mean ± SD: 87.27 ± 11.72). The NTPV showed similarly high reactivity (100.0 ± 6.0) compared to the untreated PV. All CS-saccharide glycated conjugates demonstrated a significant reduction in IgE-binding capacity. A clear, sugar-dependent hierarchy of efficacy was observed: CXTPV revealed the most potent suppression (24.97 ± 2.16), followed by CMTPV (27.77 ± 0.60), CGTPV (34.67 ± 0.85), CSTPV (39.66 ± 1.04), and CLTPV (45.03 ± 0.60). The lead conjugate, CXTPV, achieved approximately a 72% reduction in IgE binding compared to NTPV. These results suggest that thermal processing in the absence of reducing sugars does not attenuate allergenicity.
3.6.2. Mast Cell Degranulation Assays Confirm Functional Allergenicity Reduction
The measurement of β-hexosaminidase release serves as a reliable, quantitative, and widely accepted surrogate marker of mast cell degranulation and early-phase allergic activation. [39]. This well-established in vitro model provides a sensitive and reproducible readout of IgE-mediated mast cell activation, enabling direct assessment of the ability of glycation to attenuate allergen-induced degranulation and thereby reduce the elicitation phase of the allergic response. In this study, the β-hexosaminidase release assay was employed using RBL-2H3 cells to functionally evaluate the allergenic potential of NTPV and the CS-saccharide glycated conjugates. Stimulation with the NTPV process control elicited a robust degranulation response, with a mean β-hexosaminidase release of 41.88 ± 1.84%. In contrast, all glycated conjugates induced a statistically significant (p < 0.001) and profound suppression of this response (Figure 6B). A clear, sugar-dependent hierarchy of efficacy was observed, with the CXTPV showing the most potent inhibition (10.30 ± 1.51% release, ~75% reduction), followed by CMTPV (13.77 ± 1.25%, ~67% reduction), CGTPV (15.07 ± 1.82%, ~64% reduction), CSTPV (18.28 ± 4.35%, ~56% reduction), and CLTPV (21.07 ± 2.59%, ~50% reduction). This hierarchy in functional silencing directly correlated with the decrease in IgE-binding capacity observed by indirect ELISA.
3.6.3. Glycated Conjugates Modulate Cytokine Secretion, Suppressing Pro-Allergic Signals and Inducing Tolerogenic Profiles
IL-4 is a pivotal Th2 cytokine that initiates and sustains allergic responses. It drives IgE production, Th2 cell differentiation, and mast cell activation, while amplifying broader pro-allergic cytokine networks. In food allergy, elevated IL-4 is directly linked to increased IgE, intestinal mast cell proliferation, heightened anaphylaxis, and a breakdown of immune tolerance [40]. To functionally assess the impact of glycation on allergic responses, the secretion of key cytokines (IL-4, IL-6) from RBL-2H3 cells was quantified. This cell line is a well-established and validated model for studying IgE-mediated mucosal mast cell function and cytokine production in food allergy research [41]. Our work significantly demonstrates that the degree of immunomodulation is critically dependent on our CS-saccharide conjugation platform. The CS scaffold, with its high density of free amino groups, actively drives extensive covalent modification, creating a dense matrix of Maillard products on the protein surface [42]. This matrix facilitates the superior, sugar-dependent shielding of allergenic epitopes. Stimulation with the NTPV (Figure 7A) elicited a robust IL-4 response (837.5 ± 32.6 pg/mL). The robust IL-4 secretion from RBL-2H3 cells stimulated by NTPV signifies an adverse, pro-allergic response, as this cytokine is a master regulator that initiates and sustains the Th2-type immune response central to food allergy [43]. In stark contrast, all CS-saccharide glycated conjugates induced a profound and statistically significant (p < 0.001) reduction in IL-4 secretion. A clear, sugar-dependent hierarchy was observed: CXTPV was the most potent, reducing IL-4 by ~80% to 170.0 ± 12.6 pg/mL. This was followed, in order of decreasing efficacy, by CMTPV, CGTPV, CSTPV, and CLTPV (~40% reduction).
IL-6 is a multifunctional pro-inflammatory cytokine rapidly secreted by activated mast cells, including the RBL-2H3 cell line, following IgE-mediated stimulation and degranulation. IL-6 plays a central role in amplifying allergic inflammation by promoting immune cell recruitment, enhancing Th2 polarization in synergy with IL-4, increasing vascular permeability, and contributing to the maintenance of chronic allergic responses [44,45]. IL-6 secretion is recognized as a functional marker of mast cell activation and late-phase inflammatory signaling [46,47]. In this study, IL-6 secretion was quantified to evaluate the immunomodulatory effects of CS-saccharide glycation on PV. Stimulation with NTPV induced a robust IL-6 response (1206.7 ± 37.4 pg/mL). In contrast, all CS-saccharide glycated conjugates caused a profound and statistically significant reduction (p < 0.001) in IL-6 secretion (Figure 7B). A clear sugar-dependent hierarchy emerged: CXTPV (273.3 ± 21.1 pg/mL, ~77% suppression) > CMTPV (433.3 ± 21.1 pg/mL) > CGTPV (533.3 ± 21.1 pg/mL) > CSTPV (663.3 ± 21.1 pg/mL) > CLTPV (793.3 ± 21.1 pg/mL, ~34% reduction). The marked suppression of IL-6, most pronounced with CXTPV (~77% reduction), represents a highly beneficial anti-inflammatory and potentially anti-allergic outcome.
4. Discussion
MR induced glycation has been receiving more and more attention as a non-thermal technology for allergenic protein reduction while adding functional properties such as antioxidant ability [9,38]. Our study extends this approach to turbot PV by employing CS as a macromolecular scaffold, conjugated with five different saccharides (xylose, glucose, maltose, lactose, and sucrose). Our findings reveal that CS-saccharide glycation significantly reduces IgE-binding activity and mast cell activation but notably increases antioxidant ability. These findings support the hypothesis that this dual modification synergistically reduces allergenicity by masking epitopes and disrupting conformation. This occurs concurrently with the generation of bioactive MRPs that enhance antioxidant activity [14,17,18].The optimized extraction conditions (4 °C, 12 h, 1:6 w/v) yielded high-purity PV that retained its native approximately 14 kDa band and immunoreactivity on SDS-PAGE and WB, consistent with optimized protocols for fish allergen that preserve PV integrity and IgG/IgE-binding activity [18,20]. Maintaining this structural integrity is crucial to an accurate evaluation of processing-induced modifications (such as glycation) on allergenicity, permitting a consistent comparative evaluation of epitope masking or disruption without induction of extraction artefacts that might interfere with IgE-binding or cellular activation studies [31,48].
The saccharide-dependent hierarchy observed for browning intensity is also in agreement with reported MR kinetics, as pentoses, including such as xylose exhibit faster enolization and dicarbonyl formation due to a higher proportion of reactive open-chain forms compared to hexoses or non-reducing disaccharides [49]. The pronounced enhancement in the presence of CS would, furthermore underpin its catalytic action by providing a large number of free amino groups to act as a better nucleophile scaffold that bring reactants into close proximity to enhance Schiff base formation and advance the MRPs [12]. In sugar-based systems it has been demonstrated that CS enhances glycation efficiency, and facilitates MRP/melanoidin formation when functioning as a reactive scaffold [14], a mechanism that explains the superior reactivity of CS-pentose conjugates. This association of sugar chemistry and the nucleophilic microenvironment of CS constitutes an adjustable approach to regulate glycation levels and MRP formation, provides mechanistic insight into the observed differences among conjugates and supporting the broader potential of polysaccharide-mediated Maillard conjugation to modulate functional outcomes in processed food proteins.
Covalent conjugation was demonstrated by SDS-PAGE and WB that showed higher-MW smearing and decreased intensity of the bands. These findings are in accordance with those of Tai et al. [15], who reported similar MW shifts and decreased immunoreactivity in microwave-assisted glycated mandarin fish PV. They attributed these changes to the covalent attachment of sugars and partial epitope masking. These outcomes closely parallel the present results and reinforce the role of glycation in inducing structural modification and reducing antibody recognition. These patterns have been well described for Maillard-bound food proteins in which formation of heterogeneous covalent adducts and cross-links leads to polydisperse species that are sterically blocking epitope accessibilities, as well as creating the changes in electrophoretic mobilities [33,50]. In stark contrast, the NTPV showed no significant MW increase, smearing, or band shifts on SDS-PAGE, consistent with PV’s well-documented thermostability [51]. Heating at 60 °C on its own usually retains the native band (and related conformational integrity) of PV, as thermal denaturation tends to be at least partial/reversible and not accompanied by covalent cross-linking or glycation adduct formation any more than is required for detectable polydispersity or upward mobility shift [38]. This structural evidence consistent with a more general mechanism of glycation-mediated perturbation of conformational and linear epitopes leading to reduced IgE/IgG binding observed in fish PV systems.
CD and FTIR analyses demonstrated a significant loss of α-helical content and an increase in β-sheet content, indicating glycation-induced conformational rearrangement and denaturation. These structural changes are consistent with those reported by Zhao et al. [52], who found that Maillard modification of recombinant silver carp PV caused a significant reduction in α-helix and an increase in β-sheet content, leading to reduced IgE/IgG binding. Similarly, Huang et al. [53] reported that glycation of Salangid icefish PV induced marked unfolding and loss of secondary structure compared to ultra-high-pressure treatment, reinforcing the notion that MR-mediated denaturation disrupts conformational epitopes in fish PV. Free amino acid analysis supported the central role of lysine as a nucleophile in MR initiation, having previously been shown to react readily with reducing sugars and form Schiff bases [36,54,55]. The observed conjugate-specific changes of amino acid profiles also provide evidence for sugar-dependent reaction pathways and additional modification reactions, as described earlier in model systems [56,57]. Li et al. [57] showed that differing sugar structures result in different AGE formation and reactivity patterns with glucose-lysine-arginine Maillard model systems, emphasizing the influence of saccharide identity on pathway branching. Similarly, Liu et al. [58] demonstrated that site-directed mutagenesis of lysine, arginine, and cysteine residues resulted in marked changes in IgE-binding of shrimp allergens during processing, highlighting the key role of selected amino acid substitutions for modulating immunological features. These results are consistent with the concept of electronic control for glycation outcomes that is largely due to chemical nature of the reducing sugar and corresponding nucleophilic attack pathways, offering a mechanistic basis for varied behavior among conjugates. These findings align with the principle that glycation outcomes are tightly governed by the chemical nature of the reducing sugar and the resulting nucleophilic attack patterns, providing a mechanistic context for the observed differences among conjugates [57].
The sugar-specific reactivity not only affects structural modification, but also contributes to the production of a wide range of MRPs which are reported to impact both functionality and allergenicity in processed food proteins [54,56]. Thermal processing without glycation generally does not induce large changes in free amino acid composition (aside from possibly minor losses via denaturation/oxidation), due to the absence of the nucleophilic attack on lysine/arginine residues by reducing sugars that initiates Schiff base formation, Amadori rearrangement and then depletion/accumulation patterns documented for actual Maillard conjugates [59,60]. The increased antioxidant enhancing effect in MRPs in the present study may be due to known radical scavenging and reducing properties of MRPs, including melanoidins, developed during glycation [28,61]. Viturat et al. [14] reported higher anti-oxidation potential in CS-glucose Maillard adducts due to MRP, melanoidin formation with the aid of CS skeleton for reactive sites and keeping stable bioactive conformations. Similarly, Du et al. [28] reported that MRPs prepared from marine protein hydrolysates have potent DPPH radical scavenging and phenolic characteristics, indicating the importance of advanced Maillard intermediates to the total antioxidant activity. These results highlight that sugar-specific glycation routes, mediated by polysaccharide supports such as CS, induce the formation of versatile MRPs endowed with strong antioxidant properties [12,14]. This phenomenon is shared by several food systems, in which the chemical identity of the reducing sugar and the presence of amino groups determine both MRP formation and their radical-quenching capacity, thereby underscoring the multifunctional character of glycated proteins involved in processed foods [10,62]. In contrast, thermal processing alone may not have been able to exhibit any or significant enhancement of the antioxidant capacity [63]. This is further supported by enhanced antioxidant derivates over the native forms, where structural modifications amplify bioactivity beyond baseline thermal effects [61].
The immunological results of this study are consistent with the known pathways by which glycation affects allergenicity in food proteins, such as covalent modification of lysin and other residues contained in or in the vicinity of IgE-binding epitopes, thereby leading to steric hindrance or conformational alteration that affect antibody recognition [32,34,64]. The NTPV provides an important context for interpreting these effects. Thermal processing is known to be inadequate in reducing PV allergenicity because of its high stability towards heat, ability to refold, and resistance to irreversible epitope disruption [15,53,65]. Conventional heating does not create the covalent adducts nor drive far reaching conformational changes required for substantial hypoallergenicity, leaving IgE binding epitopes relatively intact and still capable of triggering efficient mast cell activation as well as Th2 responses. In contrast, CS-saccharide glycation achieves profound immunological attenuation by covalent modification specific for antigen and structural rearrangement irrespective to the limitation of heat treatment alone. Wu et al. [18] previously showed that glycosylation of turbot PV markedly reduced IgE reactivity and suppressed Th2 cytokine production in KU812 basophils, demonstrating that such modifications can interfere with both sensitization and effector phases of the allergic response. The inhibition of β-hexosaminidase release in RBL-2H3 cells further suggests suppression of FcεRI cross-linking and mast cell degranulation, which has been previously established as a result of decreased epitope accessibility after glycation [49,66]. Reduction in IL-4 and IL-6 secretion are consistent with the attenuation of early-phase activation and late-phase inflammation signaling, because it has been demonstrated that glycosylated allergens can down-modulate Th2 polarization and pro-inflammatory amplification [18]. Importantly, the reduction of these cytokines represents a protective rather than adverse immunomodulatory effect in allergic disease: IL-4 serves as a central driver of IgE class switching and Th2 dominance [43,67], whereas excessive IL-6 promotes inflammation, eosinophil recruitment, and perpetuation of chronic allergic responses [64,67]. These effects of lowering cytokines parallel mechanisms utilized by successful anti-allergic treatments, such as those which target the Th2 pathway or mast cell activation [40,46], reinforce the protective potential of Maillard-type glycation as a strategy to shift the immune response away from pro-allergic states.
In summary, our study demonstrates glycation’s capacity to simultaneously weaken immediate effector mechanisms and dampen downstream inflammatory amplification, offering a dual immunological benefit that extends beyond simple epitope masking and represents a meaningful advancement over thermal treatment alone in allergen mitigation.
5. Conclusion
This study demonstrates that Maillard-induced conjugation of turbot PV with CS and various saccharides contribute both positively to the reduction of allergenicity, as well as addition to functional properties. Structural analyses confirmed successful covalent modification, resulting in a significant loss of native α-helical content, an increase in β-sheet and random coil fractions, and epitope masking. The CXTPV in general exerted the highest capacity of inhibition on IgE binding (up to 72% reduction), suppression of β-hexosaminidase release, and profound decreases in IL-4 and IL-6 secretion from RBL-2H3 cells, alongside the highest antioxidant activity (10.3-fold increase in TPC and 74.5% DPPH scavenging). The dual benefits of attenuated IgE-mediated responses and enhanced antioxidant capacity positions CS-saccharide Maillard conjugation as a new strategy for the achievement of hypoallergenic marine food ingredients. This approach offers advantages over conventional processing methods, which often fail to eliminate PV allergenicity while preserving nutritional value sufficiently. The current study is only confined to in vitro immunological and functional assay. Although RBL-2H3 cell models and indirect ELISA are of great mechanistic value, no in vivo validation and complex food matrix analyses have been performed. The present work however is limited to in vitro immunological and functional assessments. Although RBL-2H3 cell models and indirect ELISA are of great mechanistic value,there is a lack of in vivo validation and testing of complex food matrices. Future research should focus on confirming these effects in vivo, assessing long-term stability and sensory impact in real food systems, and exploring potential AGE safety concerns. Such studies would further strengthen the applicability of this strategy for developing safer, functional marine protein ingredients.
Supplementary Materials
The following supporting information can be downloaded at the website of this paper posted on Preprints.org.
Author Contributions
Conceptualization, H.C and L.D.; methodology, L.D., Q.H. and M.L.; validation, L.D., Q.H. and S.Y.; formal analysis, L.D. and Q.H.; investigation, L.D., Q.H. and S.Y.; resources, H.C.; data curation, L.D.; writing-original draft preparation, L.D.; writing-review and editing, M.L, Q.H, S.Y, and S.H.; visualization, L.D., M.L., and S.H; supervision, H.C.; project administration, H.C.; funding acquisition, H.C. All authors have read and agreed to the published version of the manuscript.
Funding
The Cross-Innovation Open Project of Food Flavor and Health, Beijing Technology & Business University (Project No. FFHCI-2025034) this work is funded by “The Cross-Innovation Open Project of Food Flavor and Health, Beijing Technology & Business University (Project No. FFHCI-2025034)”.
Institutional Review Board Statement
Not applicable.
Informed Consent Statement
Not applicable.
Data Availability Statement
The original contributions presented in this study are included in the article/Supplementary Material. Further enquiries can be directed to the corresponding author.
Acknowledgments
The Authors wish to express their appreciation to the “The Cross-Innovation Open Project of Food Flavor and Health, Beijing Technology & Business University (Project No. FFHCI-2025034)” for their financial support.
Conflicts of Interest
The authors declare no conflict of interest.
Abbreviations
The following abbreviations are used in this manuscript:
| PV | Parvalbumin |
| MR | Maillard Reaction |
| ELISA | Enzyme-linked Immunosorbent Assay |
| MW | Molecular weight |
| DPPH | 2,2-diphenyl-1-picrylhydrazyl |
| TPC | Total Phenolic Content |
| IgE | Immunoglobulin E |
| FTIR | Fourier-Transform Infrared |
| CD | Circular Dichroism |
| SDS-PAGE | Sodium Dodecyl Sulfate-Polyacrylamide Gel Electrophoresis |
| CS | Chitosan |
| HRP | Horseradish peroxidase |
| IL-4 | Interleukin-4 |
| IL-6 | Interleukin-6 |
| RBL-2H3 | Rat Basophilic Leukemia |
| WB | Western Blot |
| MRPs | Maillard Reaction Products |
| PBS | Phosphate Buffered Saline |
| FBS | Fetal Bovine Serum |
| BSA | Bovine Serum Albumin |
| DMEM | Dulbecco’s Modified Eagle’s Medium |
| KBr | Potassium bromide |
| BeStSel | Beta Structure Selection |
| LC-MS | Liquid Chromatography-Mass Spectrometry |
| IgG | Immunoglobulin G |
| Phe | Phenylalanine |
| Tryp | Tryptophan |
| TMB | 3,3’,5,5-Tetramethylbenzidine |
| kDa | kilodaltons |
| CXTPV | Chitosan xylose Turbot parvalbumin |
| CGTPV | Chitosan glucose Turbot Parvalbumin |
| CMTPV | Chitosan maltose Turbot Parvalbumin |
| CSTPV | Chitosan Sucrose Turbot Parvalbumin |
| CLTPV | Chitosan lactose Turbot Parvalbumin |
| NTPV | Native Turbot Parvalbumin |
| AGE | Advanced Glycation End-products |
| EDTA | Ethylenediaminetetraacetic acid |
| Tris-HCL | Tris(hydroxymethyl)aminomethane hydrochloride |
| GAE | Gallic acid equivalents |
References
- Sicherer SH, Sampson HA. Food allergy: A review and update on epidemiology, pathogenesis, diagnosis, prevention, and management. Journal of Allergy and Clinical Immunology 2018;141:41–58. [CrossRef]
- Saptarshi SR, Sharp MF, Kamath SD, Lopata AL. Antibody reactivity to the major fish allergen parvalbumin is determined by isoforms and impact of thermal processing. Food Chem 2014;148:321–8. [CrossRef]
- Mukherjee S, Horka P, Zdenkova K, Cermakova E. Parvalbumin: A Major Fish Allergen and a Forensically Relevant Marker. Genes (Basel) 2023;14. [CrossRef]
- Wai CYY, Leung NYH, Leung ASY, Tang MF, Marknell DeWitt Å, Rosa Duque JS, et al. Fish Allergenicity Ladder and Parvalbumin Epitopes for Predicting Clinical Cross-Reactivity and Reintroduction in Chinese Population. Allergy: European Journal of Allergy and Clinical Immunology 2025;80:2810–23. [CrossRef]
- Kuehn A, Swoboda I, Arumugam K, Hilger C, Hentges F. Fish allergens at a glance: Variable allergenicity of parvalbumins, the major fish allergens. Front Immunol 2014;5. [CrossRef]
- Teodorowicz G, Bastiaan-Net S, Hoppenbrouwers T, Wichers HJ. The Maillard reaction and food allergy: Impacts on sensitisation and on elicitation. Encyclopedia of Food Allergy, Elsevier; 2024, p. V1:212-V1:224. [CrossRef]
- Ames JM. THE MAILLARD REACTION. n.d.
- Shi B, Guo X, Liu H, Jiang K, Liu L, Yan N, et al. Dissecting Maillard reaction production in fried foods: Formation mechanisms, sensory characteristic attribution, control strategy, and gut homeostasis regulation. Food Chem 2024;438. [CrossRef]
- Yu C, He X, Ji N, Kang S, Li D, Zhang H, et al. Maillard reaction affecting immunobinding activity and digestibility of tropomyosin in Alectryonella plicatula food matrix. Food Science and Human Wellness 2024;13:2959–69. [CrossRef]
- Teodorowicz M, Van Neerven J, Savelkoul H. Food processing: The influence of the maillard reaction on immunogenicity and allergenicity of food proteins. Nutrients 2017;9. [CrossRef]
- Aranaz I, Alcántara AR, Civera MC, Arias C, Elorza B, Caballero AH, et al. Chitosan: An overview of its properties and applications. Polymers (Basel) 2021;13. [CrossRef]
- Affes S, Maalej H, Li S, Abdelhedi R, Nasri R, Nasri M. Effect of glucose substitution by low-molecular weight chitosan-derivatives on functional, structural and antioxidant properties of maillard reaction-crosslinked chitosan-based films. Food Chem 2022;366. [CrossRef]
- Fu L, Wang C, Wang J, Ni S, Wang Y. Maillard reaction with ribose, galacto-oligosaccharide or chitosan-oligosaccharide reduced the allergenicity of shrimp tropomyosin by inducing conformational changes. Food Chem 2019;274:789–95. [CrossRef]
- Viturat S, Thongngam M, Lumdubwong N, Zhou W, Klinkesorn U. Ultrasound-assisted formation of chitosan-glucose Maillard reaction products to fabricate nanoparticles with enhanced antioxidant activity. Ultrason Sonochem 2023;97. [CrossRef]
- Tai J, Qiao D, Huang X, Hu H, Li W, Liang X, et al. Structural Property, Immunoreactivity and Gastric Digestion Characteristics of Glycated Parvalbumin from Mandarin Fish (Siniperca chuaisi) during Microwave-Assisted Maillard Reaction. Foods 2023;12. [CrossRef]
- Dong X, Raghavan V. Modifications of the Structural, Nutritional, and Allergenic Properties of Atlantic Cod Induced by Novel Thermal Glycation Treatments. Foods 2024;13. [CrossRef]
- Chen W mei, Wang Y, Shao Y hong, Tu Z cai, Liu J. Glycation combined with phosphorylation: Investigating the structure changes and allergenic potential of parvalbumin in silver carp (Hypophthalmichthy molitrix). Food Biosci 2024;58. [CrossRef]
- Wu Y, Lu Y, Huang Y, Lin H, Chen G, Chen Y, et al. Glycosylation reduces the allergenicity of turbot (Scophthalmus maximus) parvalbumin by regulating digestibility, cellular mediators release and Th1/Th2 immunobalance. Food Chem 2022;382. [CrossRef]
- Huang Z, Pang L, Li S, Su Y, Zhao Q, Zhang W, et al. Effects of physical processing on food protein allergenicity: A focus on differences between animal and alternative proteins. Food Chem 2024;460. [CrossRef]
- Ma J, Pavase TR, Li ZX, Lin H. Optimisation of an extraction technique of fish allergens suitable for detection and diagnosis. Czech Journal of Food Sciences 2017;35:24–31. [CrossRef]
- Swoboda I, Bugajska-Schretter A, Verdino P, Keller W, Sperr WR, Valent P, et al. Recombinant Carp Parvalbumin, the Major Cross-Reactive Fish Allergen: A Tool for Diagnosis and Therapy of Fish Allergy. The Journal of Immunology 2002;168:4576–84. [CrossRef]
- Oliver CM, Melton LD, Stanley RA. Creating proteins with novel functionality via the maillard reaction: A review. Crit Rev Food Sci Nutr 2006;46:337–50. [CrossRef]
- Micsonai A, Wien F, Kernya L, Lee YH, Goto Y, Réfrégiers M, et al. Accurate secondary structure prediction and fold recognition for circular dichroism spectroscopy. Proc Natl Acad Sci U S A 2015;112:E3095–103. [CrossRef]
- McAvan BS, France AP, Bellina B, Barran PE, Goodacre R, Doig AJ. Quantification of protein glycation using vibrational spectroscopy. Analyst 2020;145:3686–96. [CrossRef]
- Kong J, Yu S. Fourier transform infrared spectroscopic analysis of protein secondary structures. Acta Biochim Biophys Sin (Shanghai) 2007;39:549–59. [CrossRef]
- How ZT, Busetti F, Linge KL, Kristiana I, Joll CA, Charrois JWA. Analysis of free amino acids in natural waters by liquid chromatography–tandem mass spectrometry. J Chromatogr A 2014;1370:135–46. [CrossRef]
- Martínez S, Fuentes C, Carballo J. Antioxidant Activity, Total Phenolic Content and Total Flavonoid Content in Sweet Chestnut (Castanea sativa Mill.) Cultivars Grown in Northwest Spain under Different Environmental Conditions. Foods 2022;11. [CrossRef]
- Du M, Yu W, Ding N, Jian M, Cheng Y, Gan J. Antioxidant, aroma, and sensory characteristics of Maillard reaction products from Urechis unicinctus hydrolysates: development of food flavorings. Front Nutr 2024;11. [CrossRef]
- Song Y, Li Z, Gao Q, Pavase TR, Lin H. Effect of malonaldehyde cross-linking on the ability of shrimp tropomyosin to elicit the release of inflammatory mediators and cytokines from activated RBL-2H3 cells. J Sci Food Agric 2016;96:4263–7. [CrossRef]
- Passante E, Ehrhardt C, Sheridan H, Frankish N. RBL-2H3 cells are an imprecise model for mast cell mediator release. Inflammation Research 2009;58:611–8. [CrossRef]
- Huang Y, Li Z, Wu Y, Li Y, Pramod S, Chen G, et al. Comparative analysis of allergenicity and predicted linear epitopes in α and β parvalbumin from turbot (Scophthalmus maximus). J Sci Food Agric 2023;103:2313–24. [CrossRef]
- Gou J, Liang R, Huang H, Ma X. Maillard Reaction Induced Changes in Allergenicity of Food. Foods 2022;11. [CrossRef]
- Etxabide A, Kilmartin PA, Maté JI, Prabakar S, Brimble M, Naffa R. Analysis of Advanced Glycation End products in ribose-, glucose- and lactose-crosslinked gelatin to correlate the physical changes induced by Maillard reaction in films. Food Hydrocoll 2021;117. [CrossRef]
- Matsuo K, Hashimoto S, Imaura R, Ibrahim MIA. Advances in Synchrotron Radiation-Based Vacuum-Ultraviolet Circular Dichroism for Biomolecular Structural Analysis. Chem Asian J 2026;21. [CrossRef]
- Zhang X, Li Y, Tao Y, Wang Y, Xu C, Lu Y. A novel method based on infrared spectroscopic inception-resnet networks for the detection of the major fish allergen parvalbumin. Food Chem 2021;337. [CrossRef]
- Yuan Y, Hayat K, Cai J, Xu D, Xia S, Cui H, et al. Mechanism of pyrazines and thioethers formation promoted by high oxygen concentration in the methionine-glucose Maillard reaction system. J Sci Food Agric 2025;105:3296–305. [CrossRef]
- Rumpf J, Burger R, Schulze M. Statistical evaluation of DPPH, ABTS, FRAP, and Folin-Ciocalteu assays to assess the antioxidant capacity of lignins. Int J Biol Macromol 2023;233. [CrossRef]
- Schrama D, Raposo de Magalhães C, Cerqueira M, Carrilho R, Revets D, Kuehn A, et al. Fish Processing and Digestion Affect Parvalbumins Detectability in Gilthead Seabream and European Seabass. Animals 2022;12. [CrossRef]
- Yi X, Deng W, Yang C, Huang L, Wu Z, Li X, et al. Glycitein Attenuates Soybean β-Conglycinin Allergenicity via Structural Remodeling, Immune Modulation, and Gut Microbiota Regulation. J Agric Food Chem 2025;73:32287–301. [CrossRef]
- Kashiwakura J ichi, Yoshihara M, Saitoh K, Kagohashi K, Sasaki Y, Kobayashi F, et al. Propolis suppresses cytokine production in activated basophils and basophil-mediated skin and intestinal allergic inflammation in mice. Allergology International 2021;70:360–7. [CrossRef]
- Wang X, Zhang P, Tang Y, Chen Y, Zhou E, Gao K. Mast cells: a double-edged sword in inflammation and fibrosis. Front Cell Dev Biol 2024;12. [CrossRef]
- Yang H, Zhang Y, Zhou F, Guo J, Tang J, Han Y, et al. Preparation, Bioactivities and Applications in Food Industry of Chitosan-Based Maillard Products: A Review. Molecules 2021;26. [CrossRef]
- Hinkkanen VI, Savinko T, Palosuo K, Alenius H, Mäkelä MJ, Karisola P. Regular Allergen Exposure During Oral Immunotherapy Alters the Transcriptomic Innate Immune Response After Cellular Restimulation in Children With Egg Allergy. J Investig Allergol Clin Immunol 2025:0. [CrossRef]
- Yoshioka Y, Inoue M, Yoshioka H, Kitakaze T, Furuyashiki T, Abe N, et al. Enzymatically synthesized glycogen inhibited degranulation and inflammatory responses through stimulation of intestine. J Clin Biochem Nutr 2020;67:67–73. [CrossRef]
- Wang X, Lin R, Chen L, Liu F, Zhong F. Bifidobacterium animalis Subsp. Lactis Bla36 Postbiotics Ameliorate Allergic Rhinitis in Juvenile Mice by Repairing the Mucosal Barrier and Modulating Inflammatory Pathways. J Agric Food Chem 2025;73:29604–18. [CrossRef]
- Revez JA, Bain LM, Watson RM, Towers M, Collins T, Killian KJ, et al. Effects of interleukin-6 receptor blockade on allergen-induced airway responses in mild asthmatics. Clin Transl Immunology 2019;8. [CrossRef]
- Bachus H, McLaughlin E, Lewis C, Papillion AM, Benveniste EN, Hill DD, et al. IL-6 prevents Th2 cell polarization by promoting SOCS3-dependent suppression of IL-2 signaling. Cell Mol Immunol 2023;20:651–65. [CrossRef]
- Amado MG, Pazos M, Carrera M. Mass Spectrometry-Based Proteomics for Seafood Allergen Detection and Quantification: Current Trends and Technological Frontiers. Int J Mol Sci 2025;26. [CrossRef]
- Lee J, Roux S, Descharles D, Rega B, Bonazzi C. Unravelling caramelization and Maillard reactions in glucose and glucose + leucine model cakes: Formation and degradation kinetics of volatile markers extracted during baking. Food Research International 2024;183. [CrossRef]
- Corzo-Martínez M, Soria AC, Belloque J, Villamiel M, Moreno FJ. Effect of glycation on the gastrointestinal digestibility and immunoreactivity of bovine β-lactoglobulin. Int Dairy J 2010;20:742–52. [CrossRef]
- Zhou J, Bai Y, Gao Y, Tian H, Wang M, Kang X, et al. Efficient Hydrolysis of Fish Parvalbumin by Marine Bacterial Protease VSP2V-280: Allergen Removal. Food Sci Nutr 2025;13. [CrossRef]
- Zhao YJ, Cai QF, Jin T chuan, Zhang LJ, Fei DX, Liu GM, et al. Effect of Maillard reaction on the structural and immunological properties of recombinant silver carp parvalbumin. LWT 2017;75:25–33. [CrossRef]
- Huang Y, Hu Y, Liu J, Liu H. A Comparison of the Structural Changes and IgG Immunobinding Activity of Parvalbumin in Salangid Icefish (Neosalanx taihuensis) After Glycation and Ultra-High Pressure Treatment. Foods 2025;14. [CrossRef]
- Luo J, Yao X, Soladoye OP, Zhang Y, Fu Y. Phosphorylation modification of collagen peptides from fish bone enhances their calcium-chelating and antioxidant activity. LWT 2022;155. [CrossRef]
- Li X, Qin Y, Wang B, Wang C, Chen M, Liu R, et al. Effect of dextran molecular weight on Maillard glycation of soy protein isolate: Structural modifications and flavor-binding behavior. Food Hydrocoll 2026;172. [CrossRef]
- Permyakov EA, Uversky VN. What Is Parvalbumin for? Biomolecules 2022;12. [CrossRef]
- Li LF, Wang M Di, Zhang CY, Jin MY, Chen HL, Luo H, et al. Influence of hydroxyl substitution on the inhibition of flavonoids in advanced glycation end-products formation in glucose-lysine-arginine Maillard reaction models. Food Research International 2025;207. [CrossRef]
- Liu M, Huan F, Han TJ, Liu SH, Li MS, Yang Y, et al. Combination Processing Method Reduced IgE-Binding Activity of Litopenaeus vannamei by Modifying Lysine, Arginine, and Cysteine on Multiple Allergen Epitopes. J Agric Food Chem 2021;69:4865–73. [CrossRef]
- Lamberts L, Rombouts I, Delcour JA. Study of nonenzymic browning in α-amino acid and γ-aminobutyric acid/sugar model systems. Food Chem 2008;111:738–44. [CrossRef]
- Zhang X, Jiang Q, Liu J, Wang H, Lu H, Liu D, et al. Effect of Different High-Temperature Heating Methods on the Glycation Reaction and Advanced Glycation Reaction Products of β-Lactoglobulin. Foods 2025;14. [CrossRef]
- Anraku M, Gebicki JM, Iohara D, Tomida H, Uekama K, Maruyama T, et al. Antioxidant activities of chitosans and its derivatives in in vitro and in vivo studies. Carbohydr Polym 2018;199:141–9. [CrossRef]
- Sugiura K, Koike S, Suzuki T, Ogasawara Y. Carbonylation of skin collagen induced by reaction with methylglyoxal. Biochem Biophys Res Commun 2021;562:100–4. [CrossRef]
- Sun Y, Hayakawa S, Chuamanochan M, Fujimoto M, Innun A, Izumori K. Antioxidant effects of Maillard reaction products obtained from ovalbumin and different D-aldohexoses. Biosci Biotechnol Biochem 2006;70:598–605. [CrossRef]
- Desai A, Jung MY, Olivera A, Gilfillan AM, Prussin C, Kirshenbaum AS, et al. IL-6 promotes an increase in human mast cell numbers and reactivity through suppression of suppressor of cytokine signaling 3. Journal of Allergy and Clinical Immunology 2016;137:1863-1871.e6. [CrossRef]
- Dong X, Raghavan V. Modifications of the Structural, Nutritional, and Allergenic Properties of Atlantic Cod Induced by Novel Thermal Glycation Treatments. Foods 2024;13. [CrossRef]
- Hirano T, Koyanagi A, Ago H, Yamamoto M, Kitaura J, Kasai M, et al. Allosteric inhibition of IgE–FcεRI interactions by simultaneous targeting of IgE F(ab’)2 epitopes. Commun Biol 2024;7. [CrossRef]
- Jo H, Kim M, Jeoung J, Kim W, Park YH, Jung HS, et al. Rocaglamide Suppresses Allergic Reactions by Regulating IL-4 Receptor Signaling. Molecules 2025;30. [CrossRef]
Figure 1.
Optimization of turbot PV extraction from fish muscle. (A) SDS-PAGE of extracts obtained at different temperatures (0, 4, 8, and 12 °C) for 12 h with a 1:6 (w/v) solvent-to-sample ratio. (B) SDS-PAGE of extracts obtained at different extraction times (6, 12, 24, 36, and 48 h) at 4 °C with a 1:6 (w/v) ratio. (C) SDS-PAGE of extracts obtained at different solvent-to-sample ratios (1:6, 1:10, 1:14, and 1:18 w/v) at 4 °C for 12 h. (D) Quantification of PV band intensity (relative purity) from SDS-PAGE gels shown in panels (red boxes) (A)-(C). Values are mean ± SD (n = 3). (E) WB analysis confirming PV identity using anti-PV IgG antibody on the optimized extract (4 °C, 12 h, 1:6 ratio). MW markers, M, are indicated on the left in kilodaltons (kDa).
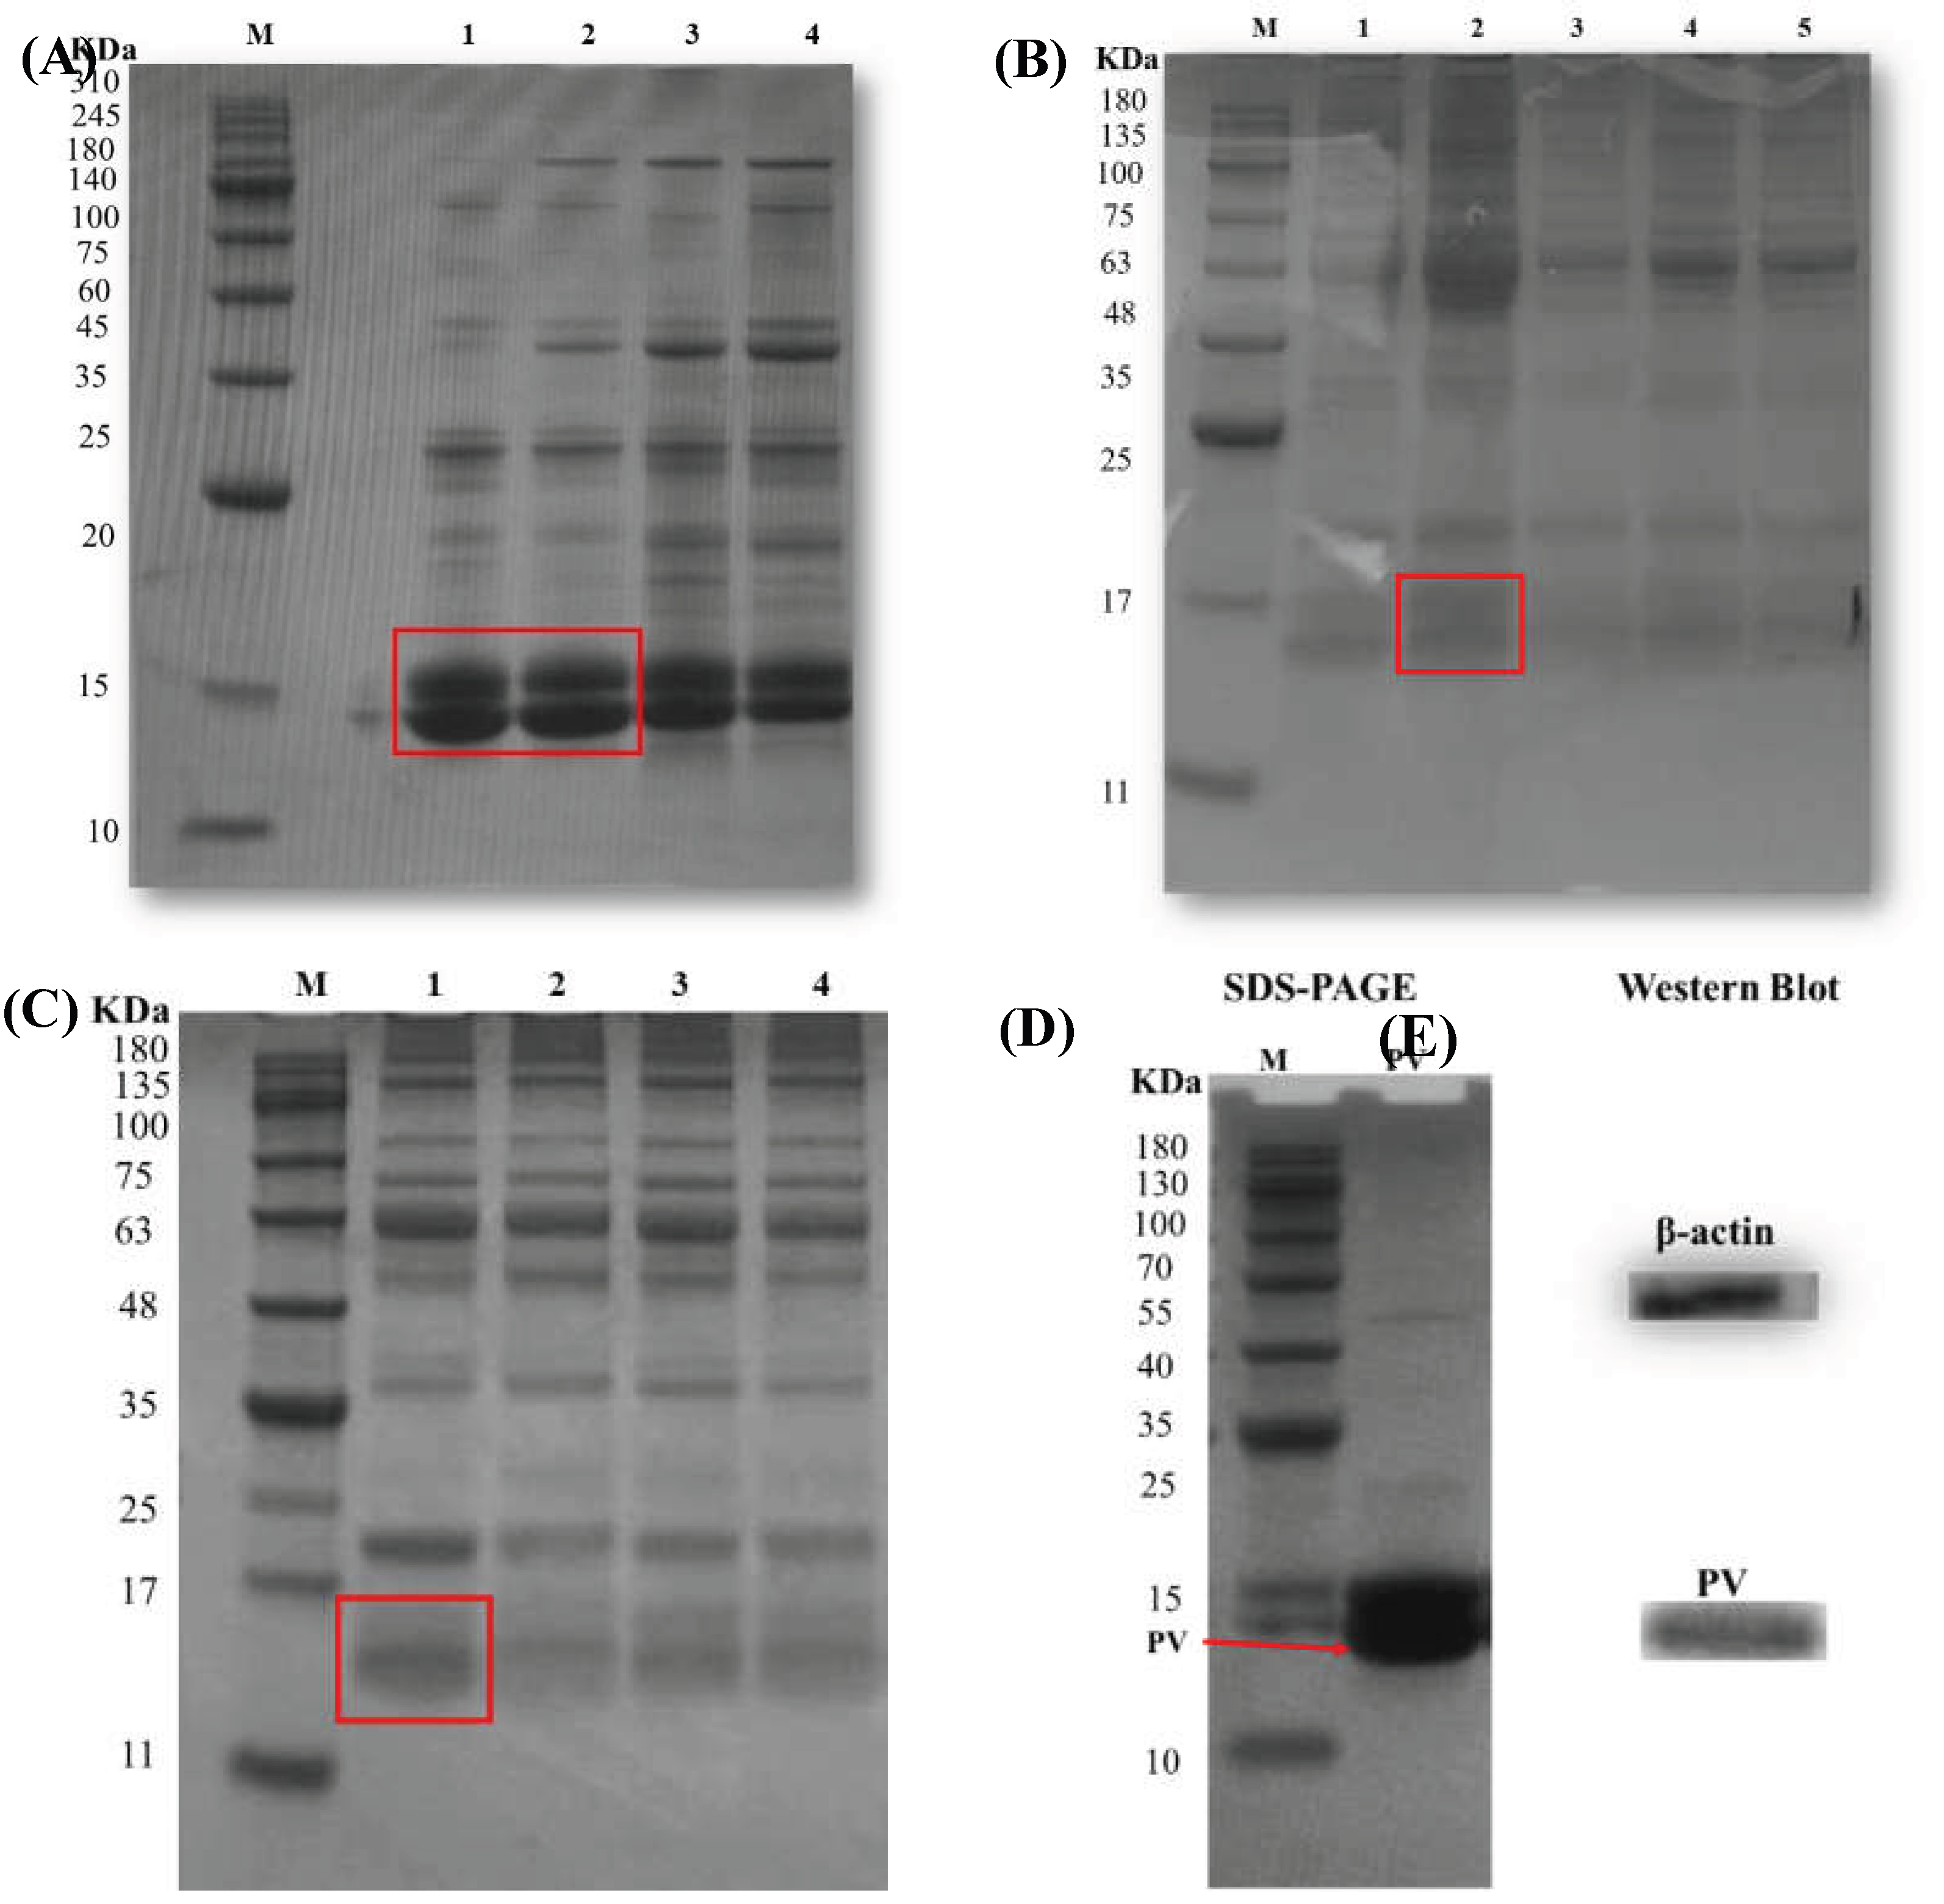
Figure 2.
MR Browning of NTPV and CS-saccharide glycated conjugates. (A) Absorbance at 420 nm (A420) of NTPV and glycated conjugates (CXTPV, CGTPV, CMTPV, CLTPV, CSTPV). Data are presented as mean ± SD (n = 3). Different letters above bars denote significant differences (p < 0.05). (B) Photographs of the corresponding reaction solutions after 72 h incubation at 60 °C, illustrating color development.
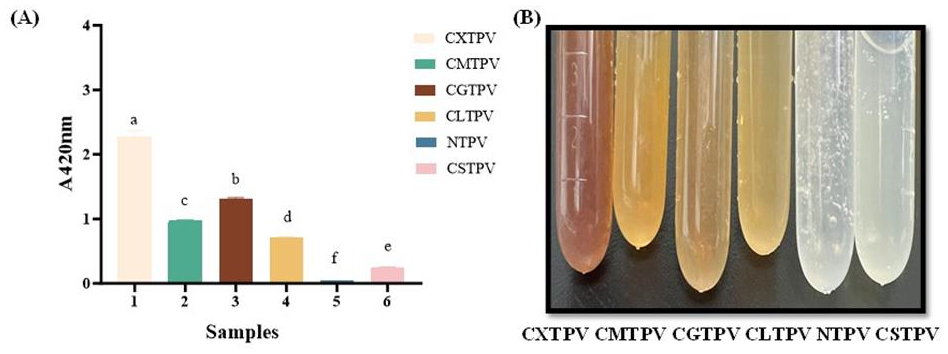
Figure 3.
SDS-PAGE and WB analysis of NTPV and CS-saccharide glycated conjugates. (A) SDS-PAGE under reducing conditions. NTPV displays a sharp band at ~12 kDa, indicated by red boxes. Glycated conjugates show smeared, high-molecular-weight bands indicative of covalent attachment and polydispersity. Gel was stained with Coomassie Brilliant Blue. (B) Corresponding WB probed with anti-PV IgG antibody. NTPV exhibits immunoreactivity at ~14 kDa, while glycated conjugates show shifted immunoreactive bands at higher MW.
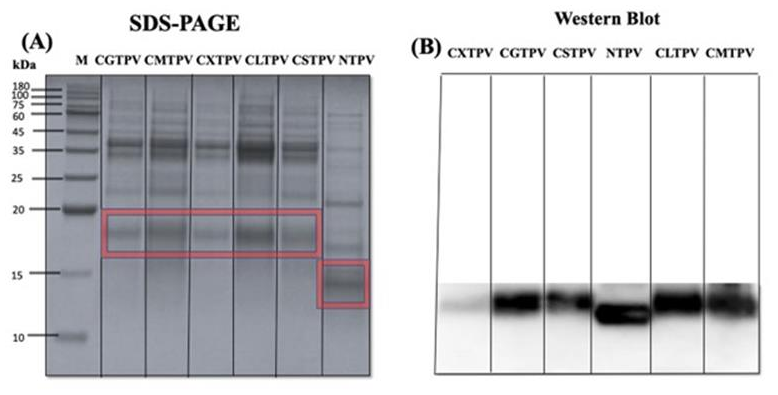
Figure 4.
Structural changes in NTPV and CS-saccharide glycated conjugates assessed by spectroscopy. (A) Far-UV CD spectra. NTPV shows typical α-helical features (positive band ~198 nm; negative minima ~209 nm and 220-222 nm). Glycated conjugates exhibit reduced helical content and increased disordered structure. (B) FTIR spectra. Glycated conjugates display loss of the N-H stretch (~3188 cm⁻¹) and modifications in the fingerprint region (1200-900 cm⁻¹) relative to NTPV.
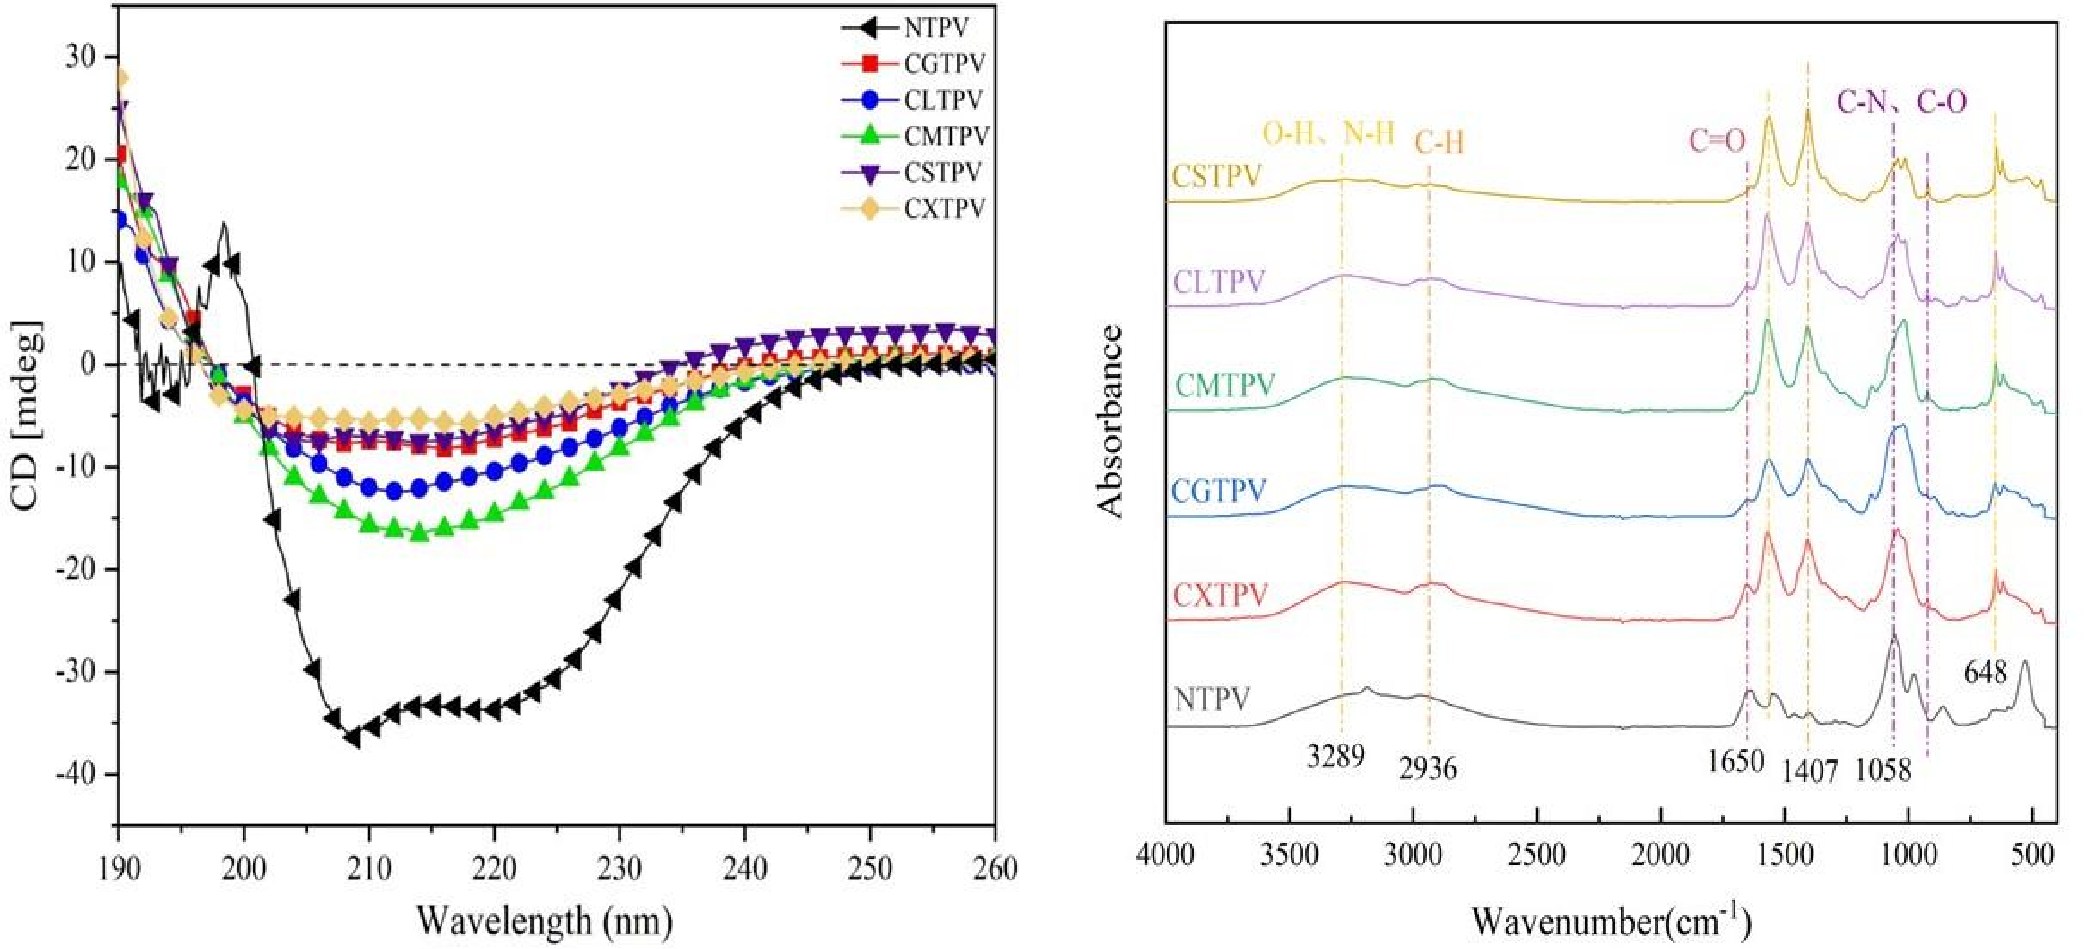
Figure 5.
Antioxidant capacity NTPV and CS-saccharide glycated conjugates (CXTPV, CGTPV, CMTPV, CLTPV, CSTPV). (A) TPC in mg gallic acid equivalents (GAE) per g protein. All conjugates displayed significantly elevated TPC compared to NTPV (p < 0.05). Data are mean ± SD (n = 3). Different letters above bars denote significant differences (p < 0.05). (B) DPPH radical scavenging activity expressed as a percentage. All conjugates exhibited significantly higher activity than NTPV (p < 0.05). Data are mean ± SD (n = 3). Different letters above bars denote significant differences (p < 0.05).
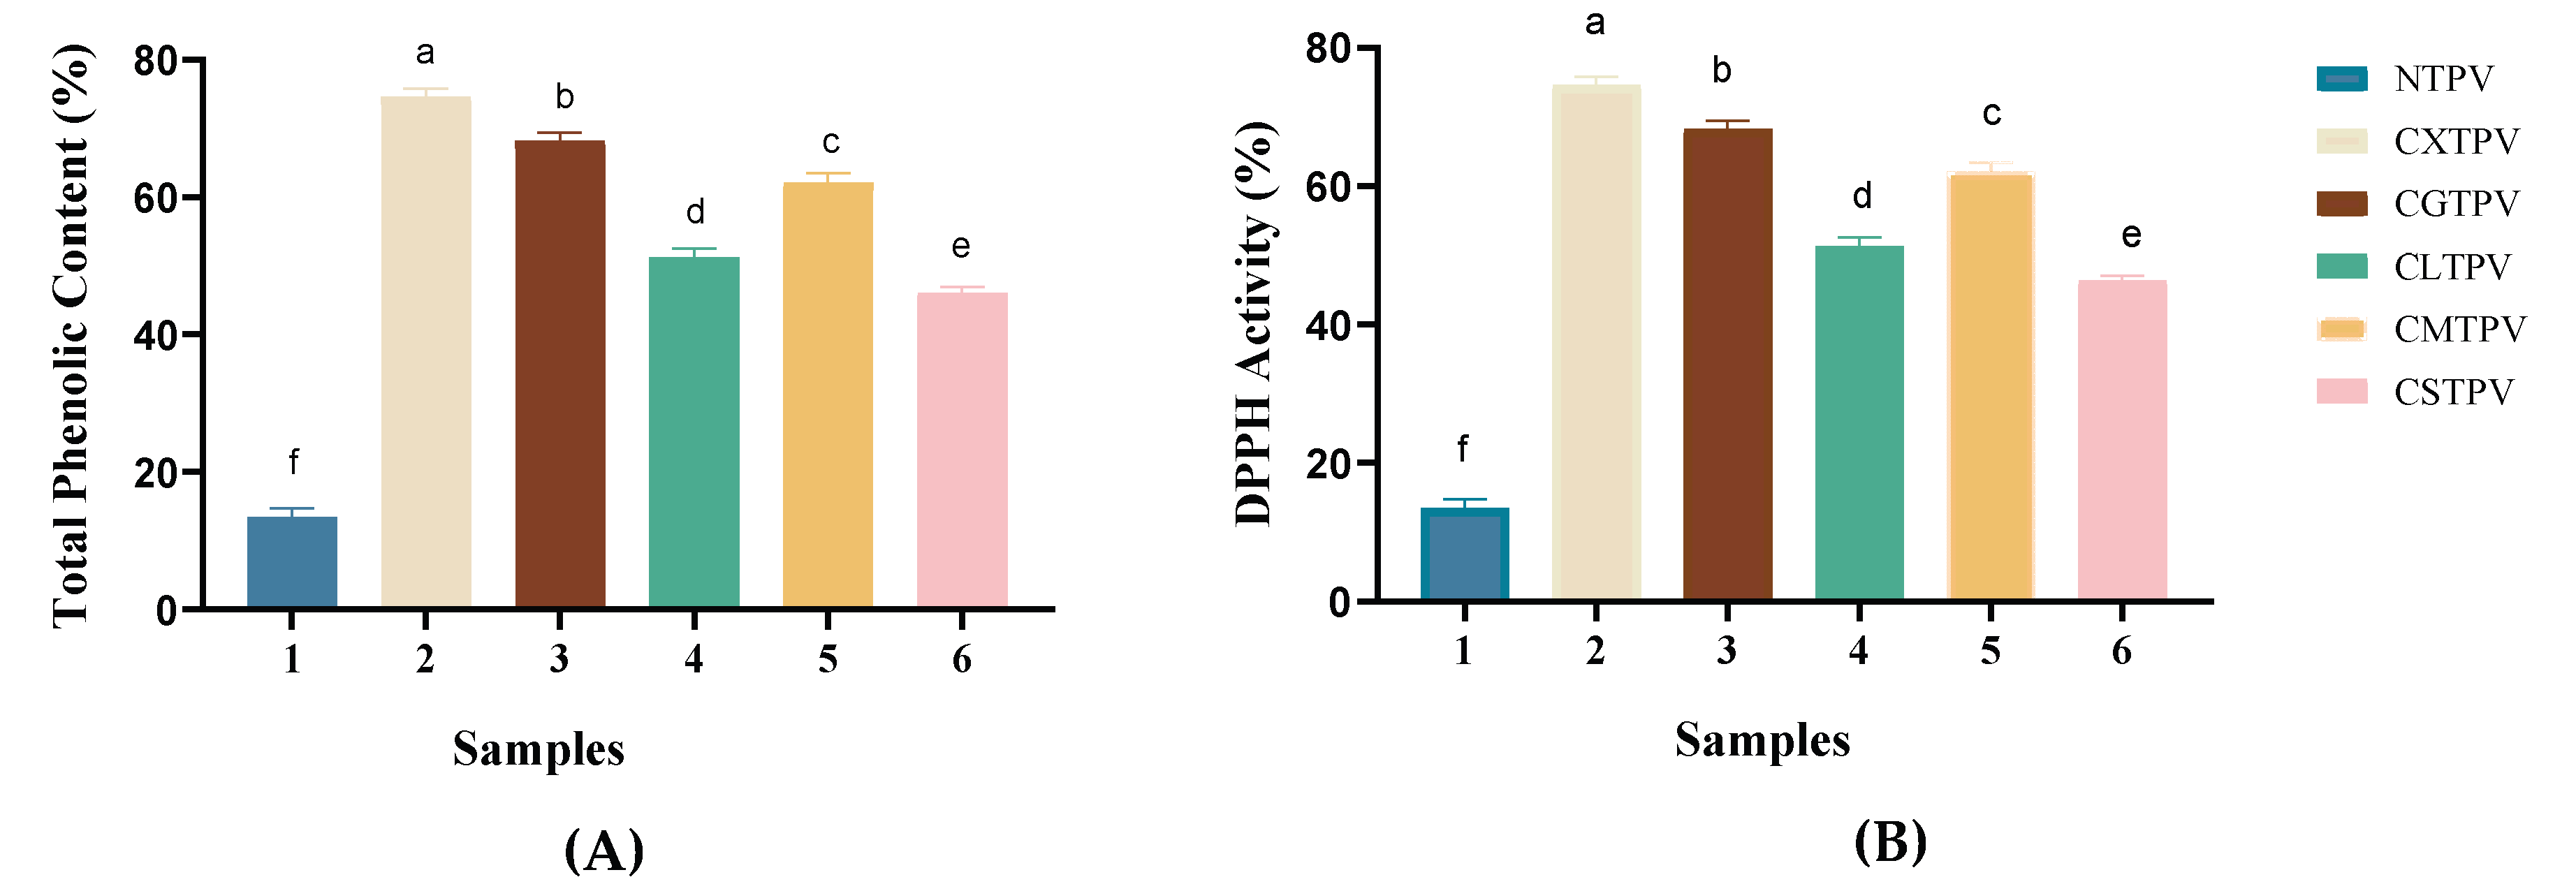
Figure 6.
Reduction of IgE reactivity and mast cell degranulation by glycated PV conjugates. (A) Indirect ELISA showing IgE-binding capacity of NTPV and CS-saccharide conjugates (CXTPV, CMTPV, CGTPV, CSTPV, CLTPV). Values are expressed as mean ± SD (n = 3); all conjugates are significantly lower than NTPV (p < 0.001). Different letters denote significant differences (p < 0.05). (B) β-Hexosaminidase release assay in RBL-2H3 cells. Values are mean ± SD (n = 6); all conjugates are significantly lower than NTPV (p < 0.001). Different letters denote significant differences (p < 0.05). CONTROL: Tyrode’s buffer only treatment; PV (untreated).
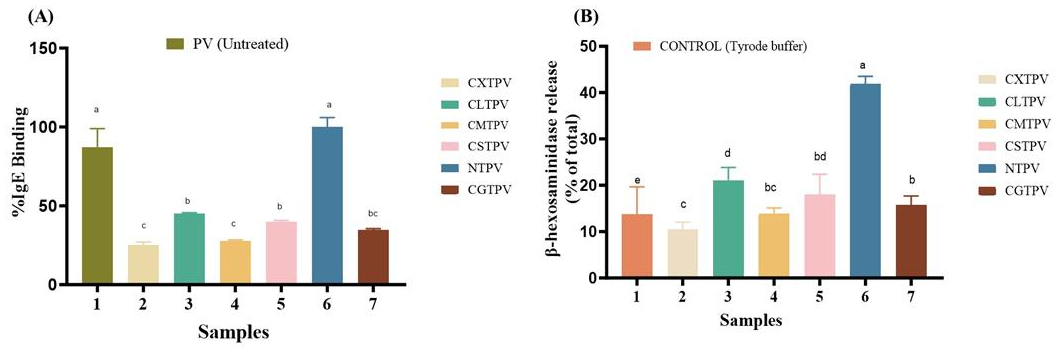
Figure 7.
Effect of CS-saccharide glycation on cytokine secretion in RBL-2H3 mast cells stimulated with NTPV and conjugates. (A) IL-4 concentration in culture supernatants (pg/mL). Data are mean ± SD (n = 3). All conjugates significantly reduced IL-4 compared to NTPV (p < 0.001). Different letters above bars denote significant differences (p < 0.05). (B) IL-6 concentration in culture supernatants (pg/mL). Data are mean ± SD (n = 3). All conjugates significantly reduced IL-6 compared to NTPV (p < 0.001). Different letters above bars denote significant differences (p < 0.05). CONTROL: low-serum medium treatment.
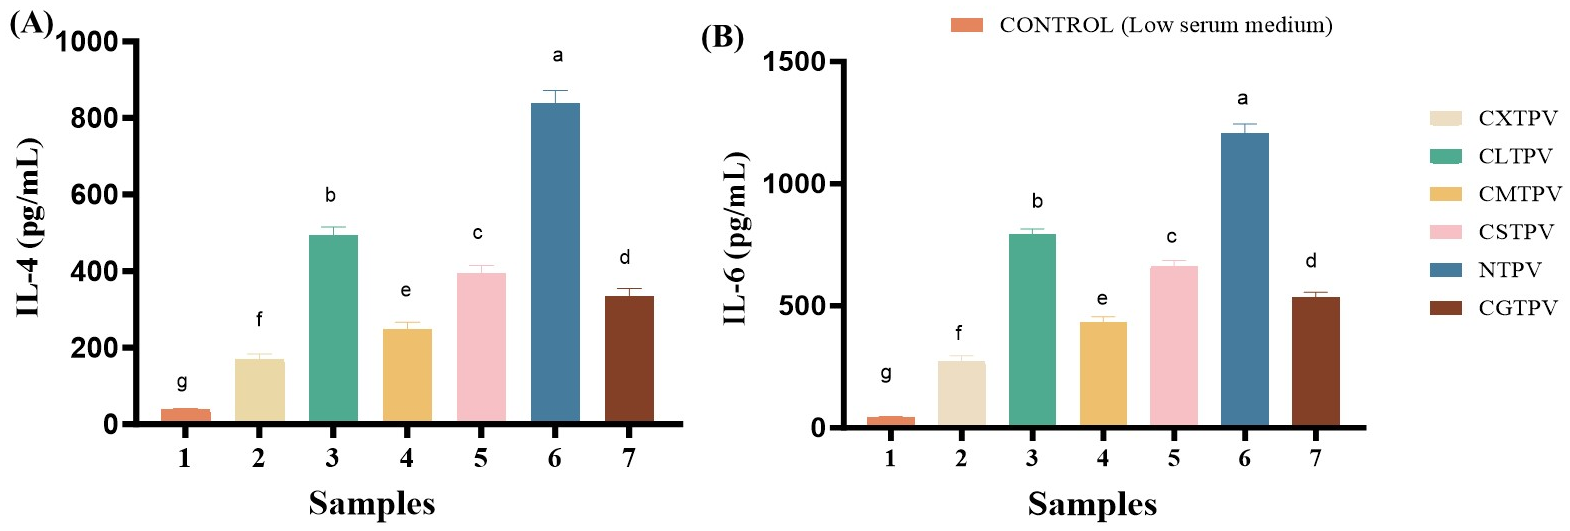

Table 1.
Secondary structure composition (%) of NTPV and glycated PV conjugates derived from far-UV circular dichroism spectroscopy.
Table 1.
Secondary structure composition (%) of NTPV and glycated PV conjugates derived from far-UV circular dichroism spectroscopy.
| Sample | α-helix | β-sheet | β-turn | Random Coil |
|---|---|---|---|---|
| NTPV | 29.67 ± 0.82a | 21.10 ± 0.62a | 10.07 ± 0.27a | 35.82 ± 0.99a |
| CGTPV | 6.16 ± 0.21b | 32.12 ± 0.96b | 16.23 ± 0.46b | 41.98 ± 1.09b |
| CLTPV | 4.28 ± 0.11c | 33.81 ± 0.98c | 11.62 ± 0.30c | 46.99 ± 1.44c |
| CMTPV | 3.40 ± 0.09cd | 33.81 ± 0.96c | 13.17 ± 0.38d | 46.28 ± 1.38c |
| CSTPV | 2.05 ± 0.06d | 37.42 ± 1.10d | 14.96 ± 0.41e | 40.94 ± 1.16d |
| CXTPV | 2.21 ± 0.08d | 36.94 ± 1.06d | 14.24 ± 0.40e | 42.61 ± 1.19bd |
Note: Values (SD, n=3) within a column followed by different lowercase letters are significantly different (p < 0.05). .
Table 2.
Secondary structure composition (%) of NTPV and CS-saccharide conjugated turbot PV determined by FTIR spectroscopy.
Table 2.
Secondary structure composition (%) of NTPV and CS-saccharide conjugated turbot PV determined by FTIR spectroscopy.
| Sample | Β-sheet% | Random curl% | α-helix% | β-turn% |
| NTPV | 18.91±0.07e | 24.31±0.05c | 29.06±0.06bc | 27.88±0.04a |
| CXTPV | 16.57±0.06f | 24.37±0.05c | 31.76±0.04a | 27.43 ±0.03b |
| CGTPV | 22.11±0.04d | 26.46±0.06b | 29.23±0.04b | 22.33±0.04f |
| CMTPV | 25.13±0.05a | 23.36±0.06e | 28.97±0.04c | 22.72±0.06e |
| CLTPV | 24.80±0.04b | 23.80±0.03d | 27.86±0.04d | 23.65±0.05d |
| CSTPV | 24.14±0.04c | 31.86±0.04a | 18.26±0.06e | 25.87±0.04c |
Note: Values (SD, n=3) within a column followed by different lowercase letters are significantly different (p < 0.05).
Table 3.
Concentration of Free Amino Acids (mg/L, N=3) in NTPV and CS-Glycated PV.
| Amino acid | NTPV | CGTPV | CSTPV | CXTPV | CLTPV | CMTPV |
| Phe | 0.43 ± 0.04a | 2.38 ± 0.05b | 1.59 ± 0.04c | 1.35 ± 0.05c | 3.87 ± 0.06d | 1.10 ± 0.04e |
| Tryp | 0.15 ± 0.04a | 0.86 ± 0.04b | 0.24 ± 0.06ac | 0.13 ± 0.04a | 1.35 ± 0.04d | 0.29 ± 0.04c |
| Leucine | 0.96 ± 0.06a | 1.48 ± 0.05b | 0.97 ± 0.04a | 2.06 ± 0.04c | 2.50 ± 0.04d | 0.73 ± 0.03e |
| Glycine | 3.25 ± 0.06a | 8.05 ± 0.04b | 7.50 ± 0.04c | 9.73 ± 0.04d | 4.89 ± 0.04e | 8.77 ± 0.05f |
| Threonine | 0.14 ± 0.03a | 0.66 ± 0.04b | 0.30 ± 0.04c | 0.26 ± 0.04c | 0.77 ± 0.05b | 0.35 ± 0.04c |
| Glutamic | 0.26 ± 0.04a | 0.56 ± 0.06b | 0.66 ± 0.04bc | 0.44 ± 0.04ab | 0.96 ± 0.04c | 2.43 ± 0.04d |
| Histidine | 0.71 ± 0.04a | 1.96 ± 0.04b | 0.83 ± 0.04a | 0.91 ± 0.04a | 4.64 ± 0.04c | 0.84 ± 0.04a |
| Arginine | 1.18 ± 0.04a | 2.86 ± 0.05b | 2.53 ± 0.04c | 1.77 ± 0.04d | 2.48 ± 0.04c | 2.41 ± 0.06c |
| Glutamine | 1.62 ± 0.04a | 1.82 ± 0.04b | 1.85 ± 0.04b | 1.03 ± 0.04c | 1.46 ± 0.04a | 1.12 ± 0.04c |
| Lysine | 2.36 ± 0.06a | 1.34 ± 0.04b | 1.56 ± 0.04c | 1.03 ± 0.04d | 1.46 ± 0.04c | 1.19 ± 0.06d |
| Ornithine | 2.27 ± 0.04a | 3.82 ± 0.06b | 2.63 ± 0.04c | 1.65 ± 0.04d | 4.22 ± 0.06e | 1.87 ± 0.04f |
Note: Values (SD, n=3) within a column followed by different lowercase letters are significantly different (p < 0.05).
Disclaimer/Publisher’s Note: The statements, opinions and data contained in all publications are solely those of the individual author(s) and contributor(s) and not of MDPI and/or the editor(s). MDPI and/or the editor(s) disclaim responsibility for any injury to people or property resulting from any ideas, methods, instructions or products referred to in the content. |
© 2026 by the authors. Licensee MDPI, Basel, Switzerland. This article is an open access article distributed under the terms and conditions of the Creative Commons Attribution (CC BY) license (http://creativecommons.org/licenses/by/4.0/).
Copyright: This open access article is published under a Creative Commons CC BY 4.0 license, which permit the free download, distribution, and reuse, provided that the author and preprint are cited in any reuse.


