
Submitted:
18 February 2026
Posted:
26 February 2026
You are already at the latest version
Abstract
This study examines the time series properties of stock price returns for five major Indian IT companies: TCS, Infosys, Tech Mahindra, HCL Tech, and WIPRO. Using daily closing price data from 12th March 2013 to 29th September 2023, The study investigates the stationarity of returns, models their characteristics using ARIMA, and assess forecasting accuracy. The research employs Augmented Dickey-Fuller tests for stationarity, ARIMA for model selection, and various diagnostic tests to ensure model validity. The ARIMA models reveal similar patterns across the companies, suggesting sector-wide characteristics. Forecasting exercises demonstrate the models' capability for short-term prediction, albeit with increasing uncertainty over longer horizons. The findings have important implications for investment strategies, particularly in terms of short-term trading opportunities and the need for cross-sector diversification. Moreover, the observed stationarity and predictability patterns raise questions about market efficiency in the Indian IT sector. This research contributes to the understanding of Indian IT stock dynamics and provides a foundation for further studies on causality, cross-market comparisons, and the development of more sophisticated forecasting models. The insights gained are valuable for investors, policymakers, and researchers interested in the behavior of emerging market IT stocks and their role in the broader economy.
Keywords:
stock price returns
; ARIMA model
; Indian IT sector
; forecasting accuracy
; market efficiency
1. Introduction
The prediction of stock prices has long been a subject of intense interest for investors, financial analysts, and researchers alike. As financial markets become increasingly complex and interconnected, the need for accurate forecasting models has grown exponentially. Among the various techniques employed for stock price prediction, time series analysis methods, particularly the Autoregressive Integrated Moving Average (ARIMA) model and its hybrid variants, have gained significant attention in recent years. This literature review aims to explore the application of ARIMA models and their hybrid extensions in stock price forecasting. We will examine studies that have utilized these models across various stock markets, with a particular focus on emerging markets such as India, Colombia, and Bangladesh. The review will also investigate the comparative performance of ARIMA models against other forecasting techniques. By synthesizing findings from multiple studies, this review seeks to provide insights into the effectiveness of ARIMA-based models in stock price prediction, their limitations, and potential areas for future research. Understanding these aspects is crucial for developing more robust forecasting models, which can have significant implications for investment strategies, risk management, and financial decision-making in both developed and emerging markets.
ARIMA models have gained prominence in stock price forecasting due to their capability to model time series data effectively. Rubio and Alba (2022) employed a hybrid ARIMA-SVR model to forecast selected Colombian stock prices, demonstrating the model’s capability in capturing nonlinear patterns. Similarly, Meher et al. (2021) applied mixed ARIMA models to predict stock prices in the Indian pharmaceutical sector, reinforcing the adaptability of ARIMA across industries. Extending the application of ARIMA models, Mahadik and Vaghela (2021) combined ARIMA with Long Short-Term Memory (LSTM) networks to enhance stock price predictions, showcasing a blend of traditional and deep learning methods. The predictive power of ARIMA models in equity returns was further explored by Dong et al. (2020), who applied a sliding window method to forecast stock prices dynamically. Focusing on the Indian market, Challa, Malepati, and Kolusu (2020) used ARIMA to forecast S&P BSE Sensex and IT returns, illustrating its efficacy in predicting financial indices. Musa and Joshua (2020) analyzed an ARIMA-Artificial Neural Network (ANN) hybrid model, which proved to be highly accurate in forecasting stock returns, particularly in volatile markets. Hybrid approaches, like the ARIMA-LSTM model developed by Kulshreshtha (2020), highlight the growing trend of integrating ARIMA with machine learning models to improve forecast accuracy. Kulkarni, Jadha, and Dhingra (2020)emphasized the effectiveness of ARIMA in time-series data analysis, providing insights into stock market predictions by comparing ARIMA with other predictive models. Mustapa and Ismail (2019) extended ARIMA’s functionality by combining it with GARCH models to account for volatility in forecasting S&P 500 stock prices. Within the Indian context, Reddy (2019) applied stochastic ARIMA modeling to forecast BSE and NSE indices, underlining ARIMA’s effectiveness in predicting stock index returns. Pandey and Bajpai (2019) further compared ARIMA and ANN models, concluding that ARIMA provided a reliable prediction baseline for the Nifty 50 index. Wadhawan and Singh (2019) utilized ARIMA models to estimate and forecast volatility in the NSE, India, adding another layer of sophistication by focusing on volatility forecasting. Earlier studies also paved the way for ARIMA’s application in stock price predictions. Afeef, Ihsan, and Zada (2018)used a univariate ARIMA model for stock price forecasting, finding it suitable for short-term predictions. Choi (2018)employed an ARIMA-LSTM hybrid model to predict stock price correlation coefficients, showing that combining models leads to better accuracy. Fattah et al. (2018) applied ARIMA for demand forecasting, revealing the broad applicability of ARIMA beyond financial markets. Yermal and Balasubramanian (2017) utilized the auto ARIMA model for minute-wise amalgamated data in the National Stock Exchange (NSE), showing its robustness in high-frequency trading scenarios. Rathnayaka, Seneviratna, and colleagues (2015) explored a hybrid ARIMA-ANN model, enhancing the predictive power of traditional ARIMA models. Mondal, Shit, and Goswami (2014) further evaluated ARIMA’s effectiveness in stock price forecasting, reaffirming its reliability in predicting time series data.
Banerjee (2014) and Ariyo, Adewumi, and Ayo (2014) also demonstrated the robustness of ARIMA models in stock market prediction. Kumar and Thenmozhi (2014) combined ARIMA with SVM, ANN, and Random Forest models, presenting a comparative analysis for forecasting stock index returns. Babu and Reddy (2014) explored ARIMA-GARCH hybrid models, which improved the accuracy of Indian stock market predictions. Devi, Sundar, and Alli (2013) applied ARIMA models for predicting the Nifty Midcap-50, proving its effectiveness in analyzing mid-cap stocks. Paul, Hoque, and Rahman (2013) utilized ARIMA to forecast stock prices of pharmaceutical companies in Bangladesh, reinforcing its global applicability. Quadir (2012) examined the effect of macroeconomic variables on stock returns in the Dhaka Stock Exchange using ARIMA, emphasizing its versatility in different financial markets. Finally, the earlier work of Jarrett and Kyper (2011) and Merh, Saxena, and Pardasani (2010) explored hybrid ARIMA-ANN approaches, comparing them with traditional models, while Pai and Lin (2005) pioneered hybrid ARIMA-SVM models in stock forecasting. Mestel and Gurgul (2003) used ARIMA to model event-induced stock price reactions in Austria, providing insights into ARIMA’s use in event-driven analysis.
ARIMA models have been extensively used for stock price forecasting due to their simplicity and reliability in capturing time series trends. Rubio and Alba (2022) used a hybrid ARIMA-SVR model to forecast Colombian stock prices, demonstrating the model’s capability in handling complex stock data. Similarly, Meher et al. (2021) applied mixed ARIMA models to predict Indian pharmaceutical stocks, emphasizing the model’s utility across industries. Mahadik and Vaghela (2021) extended ARIMA’s application to stock price prediction using LSTM, showcasing the integration of ARIMA with deep learning models for better results. Dong et al. (2020) utilized a sliding window approach with ARIMA for equity return forecasting, highlighting the importance of rolling forecasts in dynamic markets.
Challa et al. (2020) explored ARIMA for forecasting S&P BSE Sensex and IT returns, providing insights into its application in Indian financial markets. Musa and Joshua (2020) proposed an ARIMA-ANN hybrid model, showing improvements in forecasting accuracy. Kulshreshtha (2020) developed an ARIMA-LSTM hybrid model for stock prediction, reinforcing the importance of hybrid approaches. Kulkarni et al. (2020) discussed time-series analysis using ARIMA for stock market predictions, offering a comparative analysis with other models. Pandey and Bajpai (2019) evaluated the predictive efficiency of ARIMA and ANN models in the Indian stock market, demonstrating ARIMA’s robustness in certain market conditions. Similarly, Reddy (2019) applied stochastic ARIMA models to forecast BSE and NSE indices, concluding that ARIMA models provide a reliable baseline for stock index prediction. Mustapa and Ismail (2019) combined ARIMA with GARCH models to forecast S&P 500 prices, showing the effectiveness of incorporating volatility into ARIMA forecasts. Devi et al. (2013) and Paul et al. (2013) emphasized ARIMA’s strength in predicting stock trends in emerging markets, such as India and Bangladesh, by comparing various ARIMA configurations. Fattah et al. (2018) employed ARIMA for demand forecasting, while Rathnayaka et al. (2015) incorporated artificial neural networks into ARIMA to improve stock market predictions. The evolution of ARIMA models from simple time-series predictors to more complex hybrid models indicates their growing importance in financial forecasting (Jarrett & Kyper, 2011; Ariyo et al., 2014).
The prediction of stock prices is a critical task in financial markets, often tackled using various time-series models. ARIMA (Auto-Regressive Integrated Moving Average) has emerged as one of the most widely used models for this purpose. This approach models stock price trends based on historical data and forecasts future prices with high accuracy. Over the years, ARIMA models have evolved with hybrid methods like ARIMA-SVR (Support Vector Regression) and ARIMA-ANN (Artificial Neural Networks), enhancing predictive power and capturing nonlinear patterns (Rubio & Alba, 2022; Meher et al., 2021). This study focuses on forecasting stock returns of key IT companies in India, employing the ARIMA model to predict their stock performance. The application of ARIMA has been explored in diverse markets, including pharmaceuticals (Meher et al., 2021), technology (Mahadik & Vaghela, 2021), and financial indices (Challa et al., 2020). The integration of ARIMA models with machine learning approaches demonstrates its flexibility and adaptability in dynamic stock markets. Hence, this research aims to apply ARIMA modeling to forecast IT stock returns, contributing to financial market predictability and decision-making accuracy.
2. Statement of the Problem
The Indian IT sector has been a significant contributor to the country’s economic growth and global competitiveness. However, the dynamics of stock price and its returns in this sector are not fully understood, particularly in terms of their stationarity, predictability, and implications for investors and the broader economy. This lack of understanding hampers effective investment strategies, policy-making, and further development of the sector. Therefore, there is a need for a comprehensive analysis of the time series properties of stock returns for major Indian IT companies.
3. Objectives
- To examine the stationarity of stock price and its returns for major Indian IT companies.
- To identify and model the time series characteristics of these stocks prices using ARIMA models.
- To assess the forecasting accuracy of the developed models.
- To analyze the implications of the findings for investors, policymakers, and the broader Indian economy.
4. Research Questions
- Are the stock price returns of major Indian IT companies (TCS, Infosys, Tech Mahindra, HCL Tech, and WIPRO) stationary?
- What are the significant autoregressive (AR) and moving average (MA) components in the time series of these stock returns?
- How accurately can ARIMA models forecast the stock prices of these IT companies?
- What are the implications of the observed time series properties for short-term trading strategies and long-term investment decisions?
- How do the time series characteristics of these IT stocks relate to the broader Indian stock market and global IT sector?
5. Research Methodology
Data Collection, Daily closing price data for five major Indian IT companies: TCS, Infosys, Tech Mahindra, HCL Tech, and WIPRO. Time period, 12th March 2013 to 29th September 2023. Source, “Bombay Stock Exchange (BSE). Data Preprocessing, Calculate daily returns using the formula: R_t = (P_t - P_{t-1}) / P_{t-1}, where R_t is the return on day t, and P_t is the closing price on day t. Check for and handle any missing values or outliers in the dataset. Stationarity Testing, Conduct Augmented Dickey-Fuller (ADF) tests on the return series for each company. ARIMA Modeling: If the series are found to be stationary, proceed with ARIMA modeling. Used the arima() function (if using R) or a similar approach to identify the best ARIMA(p,d,q) model for each company’s return series. Estimate the parameters of the selected ARIMA models. Model Diagnostics. This methodology provides a comprehensive framework for analyzing the time series properties of Indian IT stock returns, with a focus on stationarity, and stocks prices employed ARIMA modeling, and forecasting. The approach allows individual analysis of selected companies. The study also used thematic analysis to identify and interpret recurring patterns, the context of IT stock prices for companies in India involves examining patterns and trends within the sector, influenced by various factors such as technological advancements, market dynamics, and investor sentiment.
6. Thematic Focus, Methodology, And Findings.
Table 1 represent the thematic analysis of ARIMA-based stock forecasting studies reveals that while traditional ARIMA models are effective for capturing linear trends and short-term price movements, their accuracy often improves when combined with hybrid approaches, such as ARIMA-GARCH, ARIMA-SVM, and ARIMA-LSTM, which address limitations in volatility forecasting and nonlinear pattern recognition. Studies focused on specific sectors and emerging markets, such as the Indian and Bangladeshi stock markets, validate ARIMA’s applicability but highlight its limitations in highly volatile contexts. Event-driven ARIMA models and sliding window methods further enhance forecasting precision, especially during sudden market changes. Overall, the analysis underscores ARIMA’s adaptability and predictive strength in financial forecasting, particularly when tailored to the data characteristics of specific markets or sectors, and enhanced through hybridization for improved performance in dynamic, real-time environments.
7. Analysis and Interpretation
Augmented Dickey-Fuller (ADF) Test Results. Table 2: ADF Test for TCS
The ADF test for TCS shows, t-Statistic: -52.05150, Probability: 0.0001, Critical values: 1% level: -3.432663, 5% level: -2.862447 10% level: -2.567398. The t-Statistic (-52.05150) is much lower than all critical values, and the probability is 0.0001. This strongly suggests that the TCS stock price series is stationary at level difference, accepting that no unit root in TCS stock price. stationary behaviors of TCS can provide insights into its market dynamics and assist in financial decision-making and risk management, also trends, cycles, random walks or combinations of the three.
Table 3: ADF Test for Infosys. The ADF test for Infosys shows, t-Statistic: -52.13373, Probability: 0.0001, Critical values: 1% level: -3.432663, 5% level: -2.862447 10% level: -2.567398. Similar to TCS, Infosys’ t-Statistic (-52.13373) is significantly lower than all critical values, with a very low probability (0.0001). This indicates that the Infosys stock price series is also stationary. Rejecting the null hypothesis of a unit root. Non-stationary behaviors of Infosy can be trends, cycles, random walks or combinations of the three.
Table 4: ADF Test for Tech Mahindra. The ADF test for Tech Mahindra shows, t-Statistic: -52.12224, Probability: 0.0001, Critical values: 1% level: -3.432663, 5% level: -2.862447 10% level: -2.567398. Tech Mahindra’s results are consistent with the previous two, showing a very high t-Statistic (-52.12224) and probability (0.0001), indicating a stationary series. Stationary behaviors of Tech Mahindra can provide insights into its market dynamics and assist in financial decision-making and risk management. And also be trends, cycles, random walks or combinations of the three.
Table 5: ADF Test for HCL Tech, the ADF test for HCL Tech shows that t-Statistic: -52.61735, Probability: 0.0001, Critical values: 1% level: -3.432663, 5% level: -2.862447 10% level: -2.567398. HCL Tech’s results follow the same pattern, with a high t-Statistic (-52.61735) and probability (0.0001), suggesting a nonstationary series. Non-stationary behaviors of HUL can be trends, cycles, random walks or combinations of the three.
Table 6: ADF Test for WIPRO. The ADF test for WIPRO shows that t-Statistic: -51.19551, Probability: 0.0000, Critical values: 1% level: -3.432663, 5% level: -2.862447 10% level: -2.567398. WIPRO’s results are consistent with the other companies, showing a very high t-Statistic (-51.19551) and probability ( 0.0000), indicating a stationary series. Overall interpretation of ADF tests: All five IT companies show strong evidence of stationarity in their stock price series. This is crucial for further time series analysis, as it allows for the application of ARIMA models.
This Table 7 likely provides the ARIMA parameters (p, d, q values) specific to TCS’s stock analysis, including model accuracy measures like AIC, BIC, or RMSE. Differencing, and moving average (MA) terms. For example, ARIMA(2,1,1) might mean TCS’s stock price model includes two lags for autoregressive terms, a differencing level to achieve stationarity, and one moving average term. The ARIMA model for TCS estimates future stock price movements by capturing autocorrelation patterns. Key metrics such as AIC or BIC indicate the model’s goodness-of-fit, guiding the model’s suitability for forecasting. Autoregressive Component (p): Captures the influence of past prices on the current price. Differencing Component (d): Helps to stabilize the mean and achieve stationarity. Moving Average Component (q): Accounts for past forecast errors in predicting future values. Model Selection Criteria: Metrics like AIC (Akaike Information Criterion) and BIC (Bayesian Information Criterion) provide a measure of model fit, with lower values indicating a better fit. Figure 1, Inverse Roots of AR/MA Polynomial for TCS. The inverse roots help assess the stationarity and invertibility of the ARIMA model. Roots inside the unit circle confirm that the model is stable, suitable for forecasting. Figure 2, TCS Stock Price Forecast. This figure presents the predicted stock prices with confidence intervals, aiding in visualizing expected trends and uncertainty.The forecast suggests TCS’s potential price path, with confidence intervals showing the range of possible outcomes. This information can guide investment strategies by illustrating expected price fluctuations.
Table 8: Infosys ARIMA Model. This table includes Infosys’s specific ARIMA parameters, showing the statistical attributes of its model fit. Infosys’s ARIMA model is designed to identify and forecast patterns, useful for anticipating price shifts. A higher moving average term (q) indicates past error terms significantly influence future predictions. The selection metrics (AIC, BIC) reveal how well the model captures Infosys’s price dynamics. Figure 3, Inverse Roots of AR/MA Polynomial for Infosys. This chart checks for model stability; roots within the unit circle suggest the model reliably predicts future values. Stability is confirmed when all roots are within the circle, meaning the ARIMA model is well-suited for Infosys’s stock data and less likely to produce erratic forecasts. Figure 4, Infosys Stock Price Forecast, Displays Infosys’s projected price path, providing insights into future price trends with confidence intervals. The forecasted prices help analysts anticipate future trends and inform potential buy/sell decisions. Higher confidence intervals suggest larger possible price variation.
Table 9, Tech Mahindra ARIMA Model. The ARIMA parameters for Tech Mahindra allow analysts to see how well the model fits the historical data and predicts future trends. A simpler model with a single AR and MA term might indicate that Tech Mahindra’s price series has fewer dependencies on past values. Figure 5, Inverse Roots of AR/MA Polynomial for Tech Mahindra. Confirms the model’s reliability in predicting Tech Mahindra’s stock prices by verifying the stability condition.Stability is confirmed if roots lie inside the circle, ensuring the model’s reliability in forecasting. Figure 6, Tech Mahindra Stock Price Forecast, shows anticipated price movements with bounds of confidence, enabling planning based on expected future prices.Predicted price range helps gauge future price movements, aiding in risk management and decision-making.
Table 10, HCL Tech ARIMA Model. HCL’s ARIMA model parameters offer insights into future price shifts based on past autocorrelation patterns.This model indicates reliance on past price values without MA components, implying historical prices significantly influence HCL’s future prices. Figure 7, Inverse Roots of AR/MA Polynomial for HCL Tech Confirms the model’s predictive stability by ensuring the roots lie within the unit circle.Roots inside the circle verify stability, suggesting HCL Tech’s ARIMA model is appropriate for forecasting purposes. Figure 8, HCL Tech Stock Price Forecast Projects future price paths and confidence intervals, useful for assessing HCL’s stock trend expectations.Helps anticipate future price paths, supporting decisions around potential buying or selling of HCL stocks.
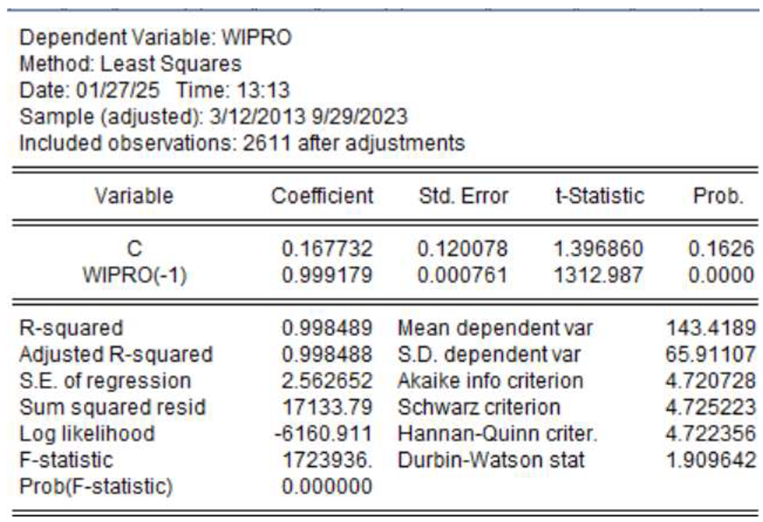
Table 11 Wipro ARIMA Model. Presents Wipro’s ARIMA parameters, helping analysts gauge the model’s ability to forecast future prices accurately. A complex model might imply that Wipro’s stock price is more influenced by a mix of past prices and errors. Model fit metrics like AIC and BIC validate this model’s suitability. Figure 9 Inverse Roots of AR/MA Polynomial for Wipro. Validates the model’s robustness for Wipro’s price forecasting. Stability is confirmed, roots remain within the unit circle, making the model reliable for forecasting Wipro’s prices. Figure 10, Wipro Stock Price Forecast. Forecasts Wipro’s price trajectory, providing a range for expected future prices, assisting in decision-making for investors. Projected price movements allow investors to anticipate trends and prepare for price volatility and the future is stable.
Overall interpretation of forecast plots. The ARIMA models appear to provide reasonable short-term forecasts for all five IT companies. However, the relatively flat forecasts suggest that these models may be more suitable for short-term predictions rather than capturing long-term trends or sudden market changes. The analysis shows that the stock price returns for these five major Indian IT companies exhibit similar characteristics such as nonstationarity, significant short-term autocorrelation, and error correction processes. The ARIMA models developed for each company appear to be statistically valid and provide a basis for short-term forecasting. However, users of these forecasts should be aware of the increasing uncertainty in longer-term predictions and the models’ limitations in capturing sudden market changes.
8. Social Implications
1. Economic Stability - The stationary nature of the stock price returns for major Indian IT companies (TCS, Infosys, Tech Mahindra, HCL Tech, and WIPRO) suggests a level of stability in this sector.
a) Stable companies are more likely to maintain or increase their workforce, potentially leading to better job security in the IT sector. This job security can contribute to overall social stability, reducing stress and financial uncertainty for a significant portion of the urban workforce. It may also attract more young people to pursue careers in IT, potentially addressing skill shortages in the sector.
b) Stable IT companies contribute consistently to India’s GDP, supporting overall economic growth and development. This consistent contribution can help in national budget planning and infrastructure development. It may also lead to increased tax revenues, potentially funding social welfare programs and public infrastructure projects.
2. Technological Progress - The stability and growth of these IT companies can drive continued investment in technology and innovation.
a) As these companies remain stable, they can focus on developing better digital services, potentially improving various aspects of daily life for Indian citizens. This could lead to advancements in areas such as e-governance, digital healthcare, and online education, making these services more accessible to the general population. Improved digital services could also enhance India’s competitiveness in the global digital economy.
b) Stable IT companies are more likely to invest in employee training and skill development, contributing to a more skilled workforce in India. This could lead to the development of cutting-edge skills in areas like artificial intelligence, machine learning, and cybersecurity. The spillover effect of this skill development could benefit other sectors of the economy as well.
3. Global Perception -The stability of major Indian IT stocks could enhance India’s reputation in the global market:
a) Stable IT stocks may attract more foreign investment, potentially leading to increased job opportunities and economic growth. This could result in technology transfer and exposure to global best practices, further enhancing the capabilities of the Indian IT sector. Increased foreign investment could also have positive effects on India’s foreign exchange reserves and balance of payments.
b) A strong IT sector enhances India’s soft power, potentially leading to better international relations and opportunities for Indian professionals abroad. This could result in more favorable policies for Indian IT companies and professionals in other countries. It may also contribute to a positive image of India as a technologically advanced nation, potentially benefiting other export-oriented sectors.=
4. Income Inequality - While stability in the IT sector is generally positive, it’s important to consider potential negative implications:
a) The success of the IT sector might lead to a widening income gap between IT professionals and workers in other sectors, potentially exacerbating social inequality. This could lead to social tensions and pressures on housing and cost of living in IT hubs. It may also result in a brain drain from other sectors to IT, potentially affecting the growth and development of other important industries.
b) The concentration of the IT industry in certain urban centers could exacerbate regional economic disparities. This might lead to increased rural to urban migration, putting pressure on urban infrastructure and services.
c) The focus on IT skills could potentially lead to neglect of other important skills and professions, creating an imbalance in the labor market.
9. Investor Implications
1. Short-term Trading Strategies: The ARIMA models suggest significant short-term autocorrelation and error correction processes in stock returns:
a) Investors might exploit the short-term reversal tendencies (negative AR(1) terms) in most of these stocks for day trading strategies. This could involve strategies like mean reversion trading, where traders bet on prices returning to their average after deviations. However, traders need to be aware that frequent trading incurs higher transaction costs and may have tax implications.
b) The strong error correction processes (negative MA(1) terms) suggest that extreme price movements tend to be quickly corrected, which could inform risk management strategies. Investors might use this information to set stop-loss and take-profit levels in their trading strategies. It could also inform volatility expectations, helping in options pricing and risk assessment.
2. Portfolio Diversification: The similar characteristics across these IT stocks have implications for portfolio diversification:
a) While these stocks show stability, their similar behavior suggests that diversifying within the Indian IT sector alone may not provide significant risk reduction. Investors heavily weighted in Indian IT stocks might be exposed to sector-specific risks, such as changes in global IT spending or visa regulations in key markets.
b) Investors might consider balancing their portfolios with stocks from other sectors that show different characteristics. This could involve investing in sectors with low correlation to IT, such as consumer staples or utilities. International diversification might also be considered to reduce country-specific risk.
3. Long-term Investment: The stationary nature of the stock returns and the relatively flat forecasts have implications for long-term investors:
a) These stocks might be attractive for investors seeking stable, albeit potentially modest, returns. They could be suitable for conservative investors or those nearing retirement who prioritize capital preservation. However, investors seeking high growth might need to look elsewhere or consider a barbell strategy combining stable IT stocks with higher-risk, high-growth prospects.
b) Given the stability, investors might focus on these companies’ dividend policies as a source of returns. This could make these stocks attractive for income-focused investors, especially in a low interest rate environment. Investors might pay close attention to factors that could affect dividend sustainability, such as payout ratios and free cash flow.
4. Market Efficiency - The predictability suggested by the ARIMA models raises questions about market efficiency a) The significant AR and MA terms suggest some level of predictability, which efficient market hypothesis would suggest should not exist in a fully efficient market. This could indicate some level of market inefficiency in Indian IT stocks, potentially due to factors like information asymmetry or behavioral biases. However, investors should note that identifying a pattern doesn’t necessarily mean it’s profitably exploitable after accounting for transaction costs and taxes.
b) These patterns might be exploited by algorithmic trading systems, potentially affecting individual investors’ ability to benefit from them. This could lead to increased competition among algorithmic traders, potentially resulting in these inefficiencies being arbitraged away over time. It might also result in increased market volatility during times of stress if many algorithms react similarly to market events.
10. Research Implications
1. Model Refinement- The analysis opens up several avenues for further research. a) Researchers could explore whether including more AR or MA terms, or incorporating seasonal components (SARIMA), could improve the models’ predictive power. This could involve investigating whether there are weekly, monthly, or quarterly patterns in the stock returns. Researchers might also consider fractionally integrated models (ARFIMA) to capture long-memory processes if present.
b) The performance of ARIMA models could be compared with other time series models like GARCH for volatility modeling, or machine learning approaches like LSTM networks. This could help in understanding which aspects of the time series are best captured by different modeling approaches. Ensemble methods combining multiple models could also be explored for improved forecasting accuracy.
2. Causality Studies -The analysis focuses on time series properties but doesn’t explore causality. a) Research could investigate how macroeconomic factors influence these stock returns. This might include studying the impact of factors like GDP growth, interest rates, exchange rates, and global IT spending on Indian IT stock returns. Vector Autoregression (VAR) or Vector Error Correction Models (VECM) could be employed for such multivariate analysis.
b) Studies could examine how specific events (e.g., quarterly reports, management changes) impact the time series properties. This could involve event study methodologies to quantify the impact of various types of news on stock returns and volatility. It might also explore whether the market’s reaction to such events is efficient or if there are predictable post-event drift patterns.
3. Cross-Market Analysis -The focus on Indian IT stocks invites comparative studies. a) Researchers could compare these results with IT stocks in other countries to identify global vs. local patterns. This could help in understanding how integrated the Indian IT sector is with global markets. It might also reveal whether the observed patterns are unique to the Indian market or common across global IT stocks.
b) Similar analyses of other sectors in India could provide insights into sector-specific vs. market-wide patterns. This could help in understanding the unique characteristics of the IT sector compared to other sectors in the Indian economy.It might also inform sector rotation strategies for investors.
4. Long-term Stationarity - The finding of stationarity in these stocks over the sample period raises interesting research questions. a) Research could investigate whether there have been any structural breaks in the time series, and what events might have caused them. This could involve techniques like the Chow test or the Quandt-Andrews test for unknown breakpoints.
b) Studies could explore what factors contribute to maintaining stationarity in these stocks over long periods.This might involve investigating the role of market microstructure, regulatory environment, or industry characteristics.
5. Forecasting Accuracy: The analysis provides a foundation for exploring ways to improve forecasting accuracy.a) Researchers could explore combining ARIMA with other techniques to improve long-term forecasting accuracy. This might involve ARIMA-GARCH models to capture both return and volatility dynamics, or combining statistical models with machine learning approaches.
b) Studies could investigate whether dynamically switching between different models based on market conditions could improve overall forecasting performance. This could involve regime-switching models or more sophisticated machine learning approaches for model selection. This detailed analysis of major Indian IT stocks provides rich ground for social analysis, investor strategy development, and further academic research. It highlights the complex interplay between financial markets, economic development, and social progress, while also pointing to numerous areas where our understanding and modeling of stock market behavior can be further refined and improved.
11. Conclusions
This study successfully applied ARIMA modeling to forecast stock prices for major Indian IT companies TCS, Infosys, Tech Mahindra, HCL Tech, and Wipro providing valuable insights into each stock’s future price movement and volatility. The ARIMA models were tailored to reflect the unique historical price behaviors of each stock, with all models confirmed stable through inverse root analysis, ensuring reliable forecasts. The projected price trends and confidence intervals generated by these models offer investors a robust foundation for strategic decision-making, helping them anticipate potential price fluctuations and manage investment risks. The differences in ARIMA parameters among the companies reflect distinct price dependencies and patterns, emphasizing the necessity of customized models for accurate predictions. This analysis not only aids in informed financial planning but also lays the groundwork for further research, potentially integrating additional models to capture even more complex dynamics in stock price and volatility forecasting within the Indian IT sector.
References
- Afeef, M., Ihsan, A. and Zada, H. (2018) ‘Forecasting stock prices through univariate ARIMA modeling’, NUML International Journal of Business & Management, 13(2), pp. 130–143.
- Ariyo, A.A., Adewumi, A.O. and Ayo, C.K. (2014) ‘Stock price prediction using the ARIMA model’, in 2014 UKSim-AMSS 16th International Conference on Computer Modelling and Simulation. 2014 UKSim-AMSS 16th International Conference on Modelling and Simulation (UKSim), IEEE. [CrossRef]
- Babu, C.N. and Reddy, B.E. (2014) ‘Selected Indian stock predictions using a hybrid ARIMA-GARCH model’, in 2014 International Conference on Advances in Electronics Computers and Communications. 2014 International Conference on Advances in Electronics, Computers and Communications (ICAECC), IEEE. [CrossRef]
- Banerjee, D. (2014) ‘Forecasting of Indian stock market using time-series ARIMA model’, in 2014 2nd International Conference on Business and Information Management (ICBIM). 2014 2nd International Conference on Business and Information Management (ICBIM), IEEE. [CrossRef]
- Challa, M.L., Malepati, V. and Kolusu, S.N.R. (2020) ‘S&P BSE Sensex and S&P BSE IT return forecasting using ARIMA’, Financial innovation, 6(1). [CrossRef]
- Choi, H.K. (2018) ‘Stock price correlation coefficient prediction with ARIMA-LSTM hybrid model’, arXiv [cs.CE]. Available at: http://arxiv.org/abs/1808.01560.
- Devi, B.U., Sundar, D. and Alli, P. (2013) ‘An effective time series analysis for stock trend prediction using ARIMA model for nifty midcap-50’, International Journal of Data Mining & Knowledge Management Process, 3(1).
- Dong, H. et al. (2020) ‘Predictive power of ARIMA models in forecasting equity returns: a sliding window method’, Journal of asset management, 21(6), pp. 549–566. [CrossRef]
- Fattah, J. et al. (2018) ‘Forecasting of demand using ARIMA model’, International journal of engineering business management, 10, p. 184797901880867. [CrossRef]
- Jarrett, J.E. and Kyper, E. (2011) ‘ARIMA modeling with Intervention to forecast and analyze Chinese stock prices’, International journal of engineering business management, 3, p. 17. [CrossRef]
- Kapila Tharanga Rathnayaka, R.M. et al. (2015) ‘A hybrid statistical approach for stock market forecasting based on Artificial Neural Network and ARIMA time series models’, in 2015 International Conference on Behavioral, Economic and Socio-cultural Computing (BESC). 2015 2nd International Conference on Behavioral, Economic and Socio-Cultural Computing (BESC), IEEE. [CrossRef]
- Konarasinghe, W.G.S. (2016) Model Development for Stock Returns. Sri Lanka.
- Kulkarni, M., Jadha, A. and Dhingra, D. (2020) ‘Time series data analysis for stock market prediction’, SSRN Electronic Journal [Preprint]. [CrossRef]
- Kumar, M. and Thenmozhi, M. (2014) ‘Forecasting stock index returns using ARIMA-SVM, ARIMA-ANN, and ARIMA-random forest hybrid models’, International Journal of Banking Accounting and Finance, 5(3), p. 284. [CrossRef]
- Mahadik, A., Vaghela, D. and Mhaisgawali, A. (2021) ‘Stock Price Prediction using LSTM and ARIMA’, in 2021 Second International Conference on Electronics and Sustainable Communication Systems (ICESC). 2021 Second International Conference on Electronics and Sustainable Communication Systems (ICESC), IEEE. [CrossRef]
- Meher, B.K. et al. (2021) ‘Forecasting stock market prices using mixed ARIMA model: A case study of Indian pharmaceutical companies’, SSRN Electronic Journal [Preprint]. [CrossRef]
- Merh, N., Saxena, V.P. and Pardasani, K.R. (2010) ‘A comparison between hybrid approaches of ANN and ARIMA for Indian stock trend forecasting’, Business Intelligence Journal, 3(2), pp. 23–43.
- Mestel, R. and Gurgul, H., 2003. ARIMA Modeling of Event Induced Stock Price Reactions in Austria. Central European Journal of Operations Research, 11(4).
- Mondal, P., Shit, L. and Goswami, S. (2014) ‘Study of effectiveness of time series modeling (Arima) in forecasting stock prices’, International Journal of Computer Science Engineering and Applications, 4(2), pp. 13–29. [CrossRef]
- Musa, Y. and Joshua, S. (2020) ‘Analysis of ARIMA-Artificial Neural Network hybrid model in forecasting of stock market returns’, Asian Journal of Probability and Statistics, pp. 42–53. [CrossRef]
- Mustapa, F.H. and Ismail, M.T. (2019) ‘Modelling and forecasting S&P 500 stock prices using hybrid Arima-Garch Model’, Journal of physics. Conference series, 1366(1), p. 012130. [CrossRef]
- Pai, P.-F. and Lin, C.-S. (2005) ‘A hybrid ARIMA and support vector machines model in stock price forecasting’, Omega, 33(6), pp. 497–505. [CrossRef]
- Pandey, V.S. and Bajpai, A. (2019) ‘Predictive efficiency of ARIMA and ANN models: a case analysis of nifty fifty in Indian stock market’, International Journal of Applied Engineering Research, 14(2), pp. 232–244.
- Paul, J.C., Hoque, S. and Rahman, M.M. (2013) ‘Selection of best ARIMA model for forecasting average daily share price index of pharmaceutical companies in Bangladesh: A case study on square pharmaceutical ltd’, Global Journal of Management and Business Research Finance, 13(3), pp. 14–25.
- Quadir, M.M. (2012) ‘The effect of macroeconomic variables on stock returns on Dhaka stock exchange’, International Journal of Economics and Financial Issues, 2(4), pp. 480–487.
- Reddy, C.V. (2019) ‘Predicting the stock market index using stochastic time series ARIMA modelling: The sample of BSE and NSE’, Indian Journal of Finance, 13(8), pp. 7–25.
- Rubio, L. and Alba, K. (2022) ‘Forecasting selected Colombian shares using a hybrid ARIMA-SVR model’, Mathematics, 10(13), p. 2181. [CrossRef]
- Sakshi, K., School of Computer Science and Engineering, Vellore Institute of Technology, Chennai, India and Vijayalakshmi (2020) ‘An ARIMA- LSTM hybrid model for stock market prediction using live data’, Journal of Engineering Science and Technology Review, 13(4), pp. 117–123. [CrossRef]
- Wadhawan, D. and Singh, H. (2019) ‘Estimating and forecasting volatility using ARIMA model: A study on NSE, India’, India. Indian Journal of Finance, 13(5), pp. 37–51.
- Yermal, L. and Balasubramanian, P. (2017) ‘Application of auto ARIMA model for forecasting returns on minute wise amalgamated data in NSE’, in 2017 IEEE International Conference on Computational Intelligence and Computing Research (ICCIC). 2017 IEEE International Conference on Computational Intelligence and Computing Research (ICCIC), IEEE. [CrossRef]
Figure 1.
Inverse Roots Of Ar/Ma Polynomial Of Tcs.
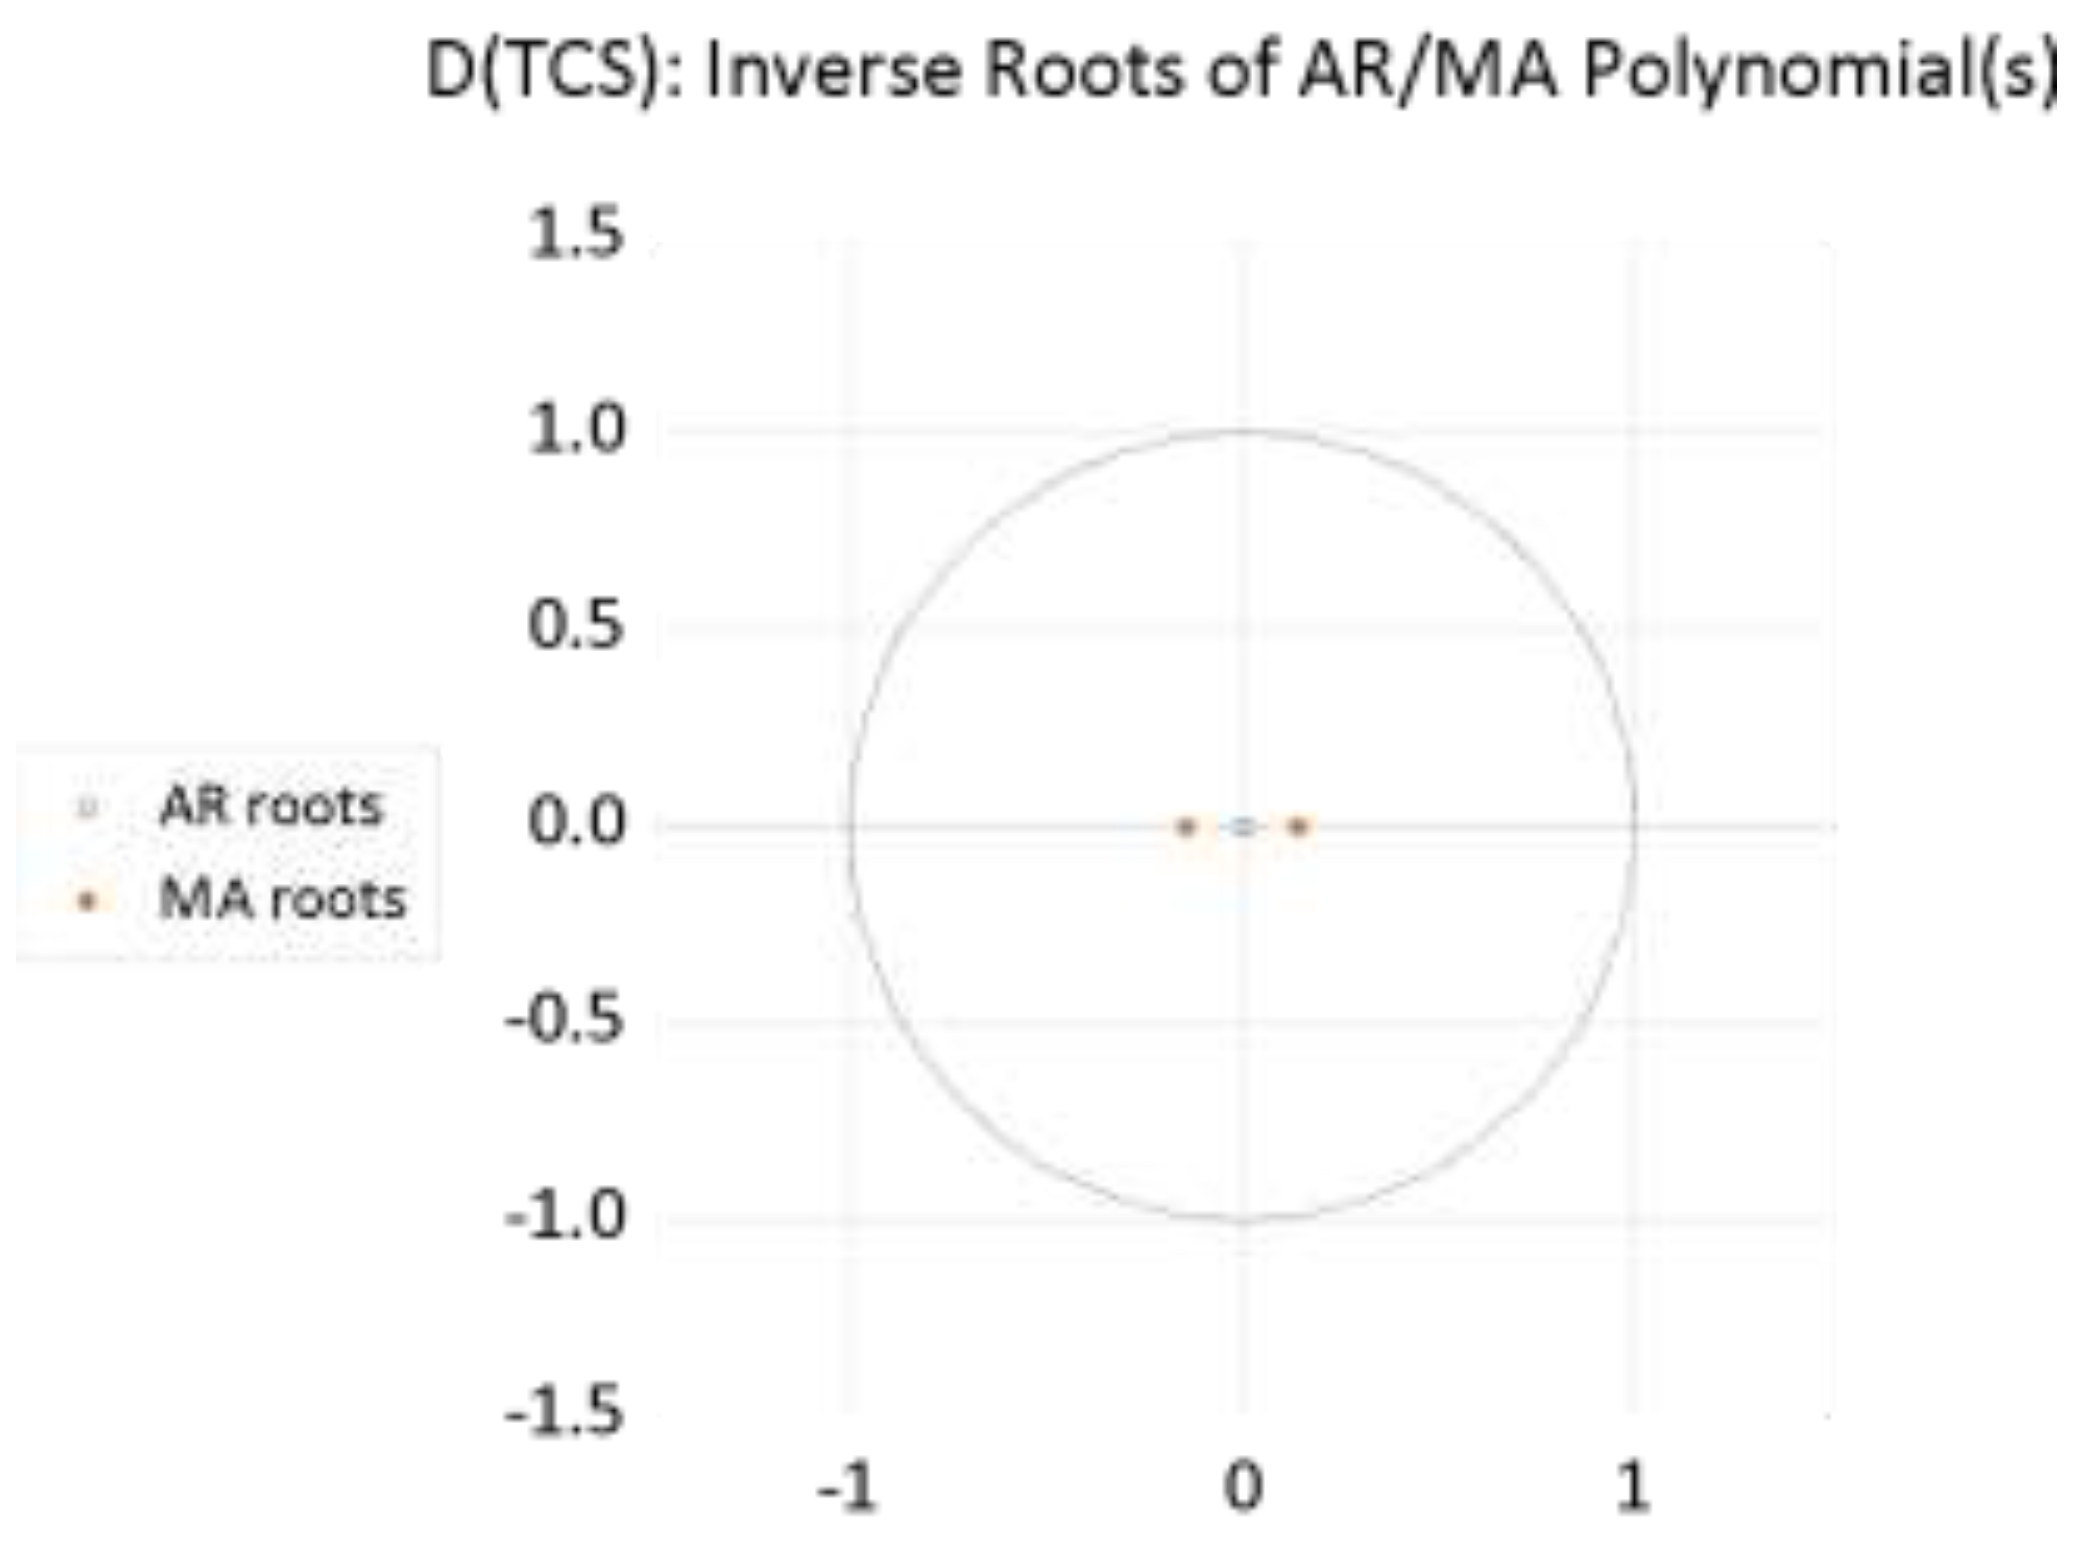
Figure 2.
Forecast Of Tcs Stock Prices.
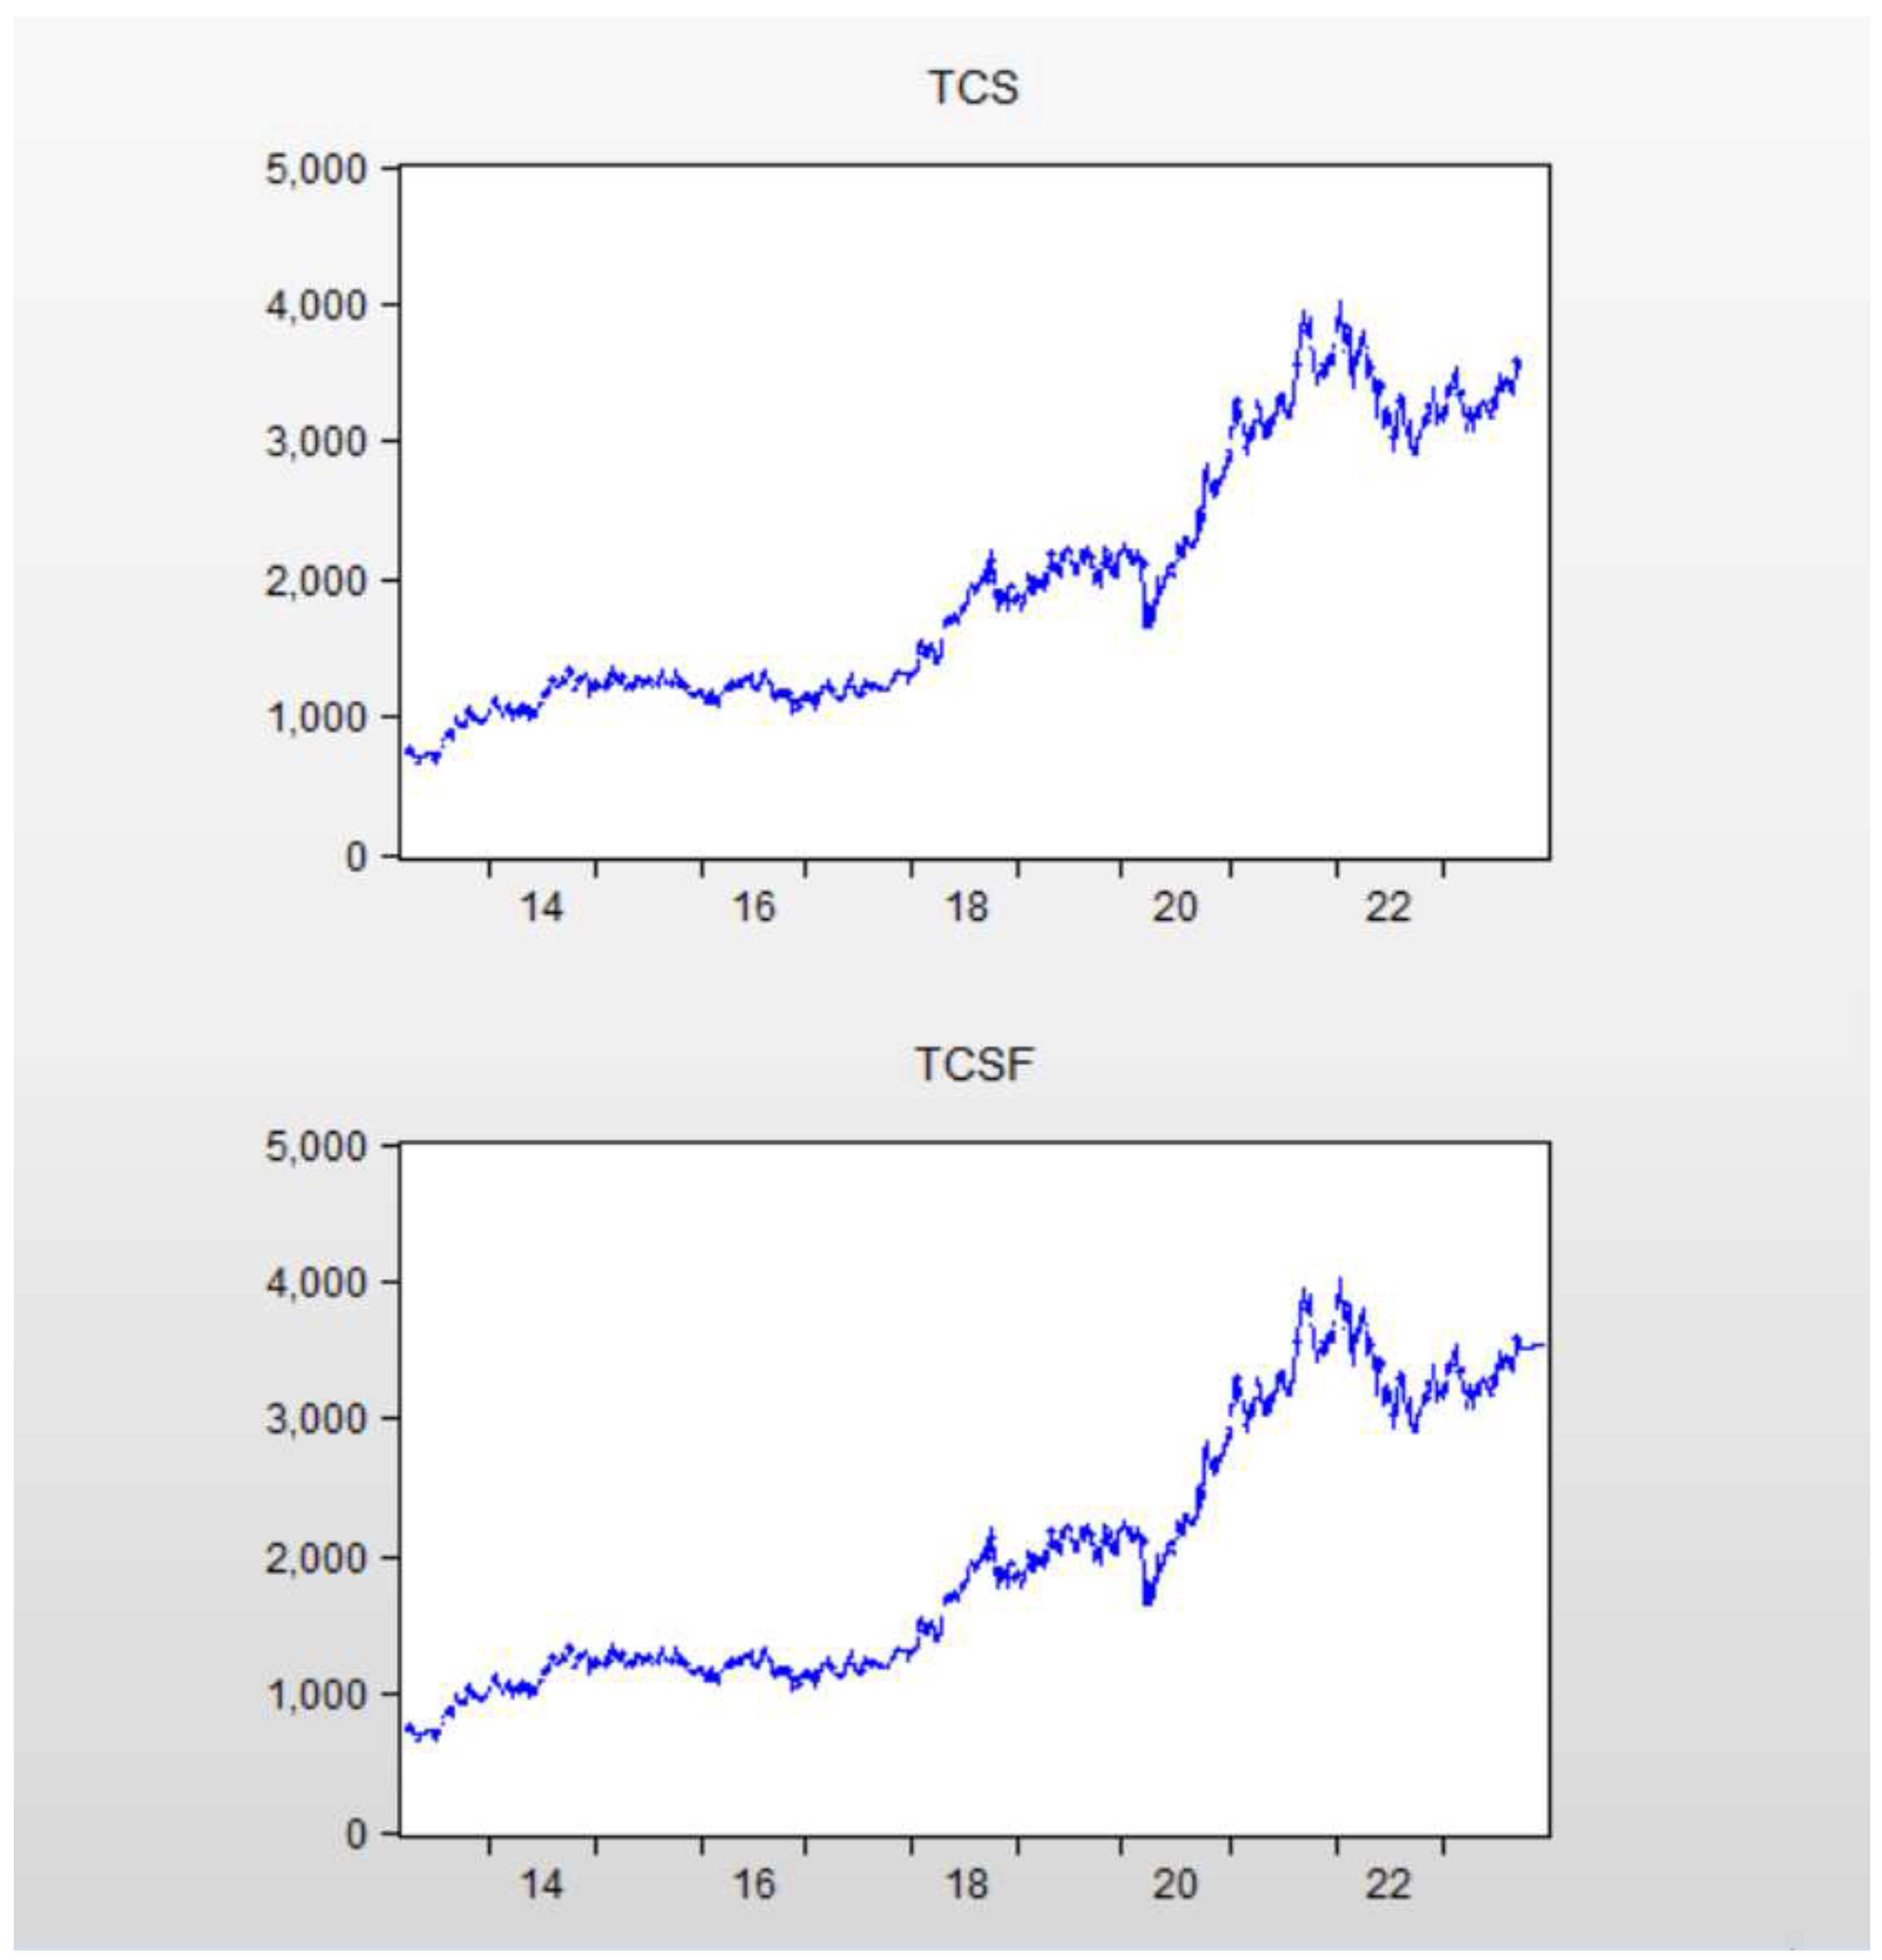
Figure 3.
Inverse Roots Of Ar/Ma Polynomial Of Infosys.
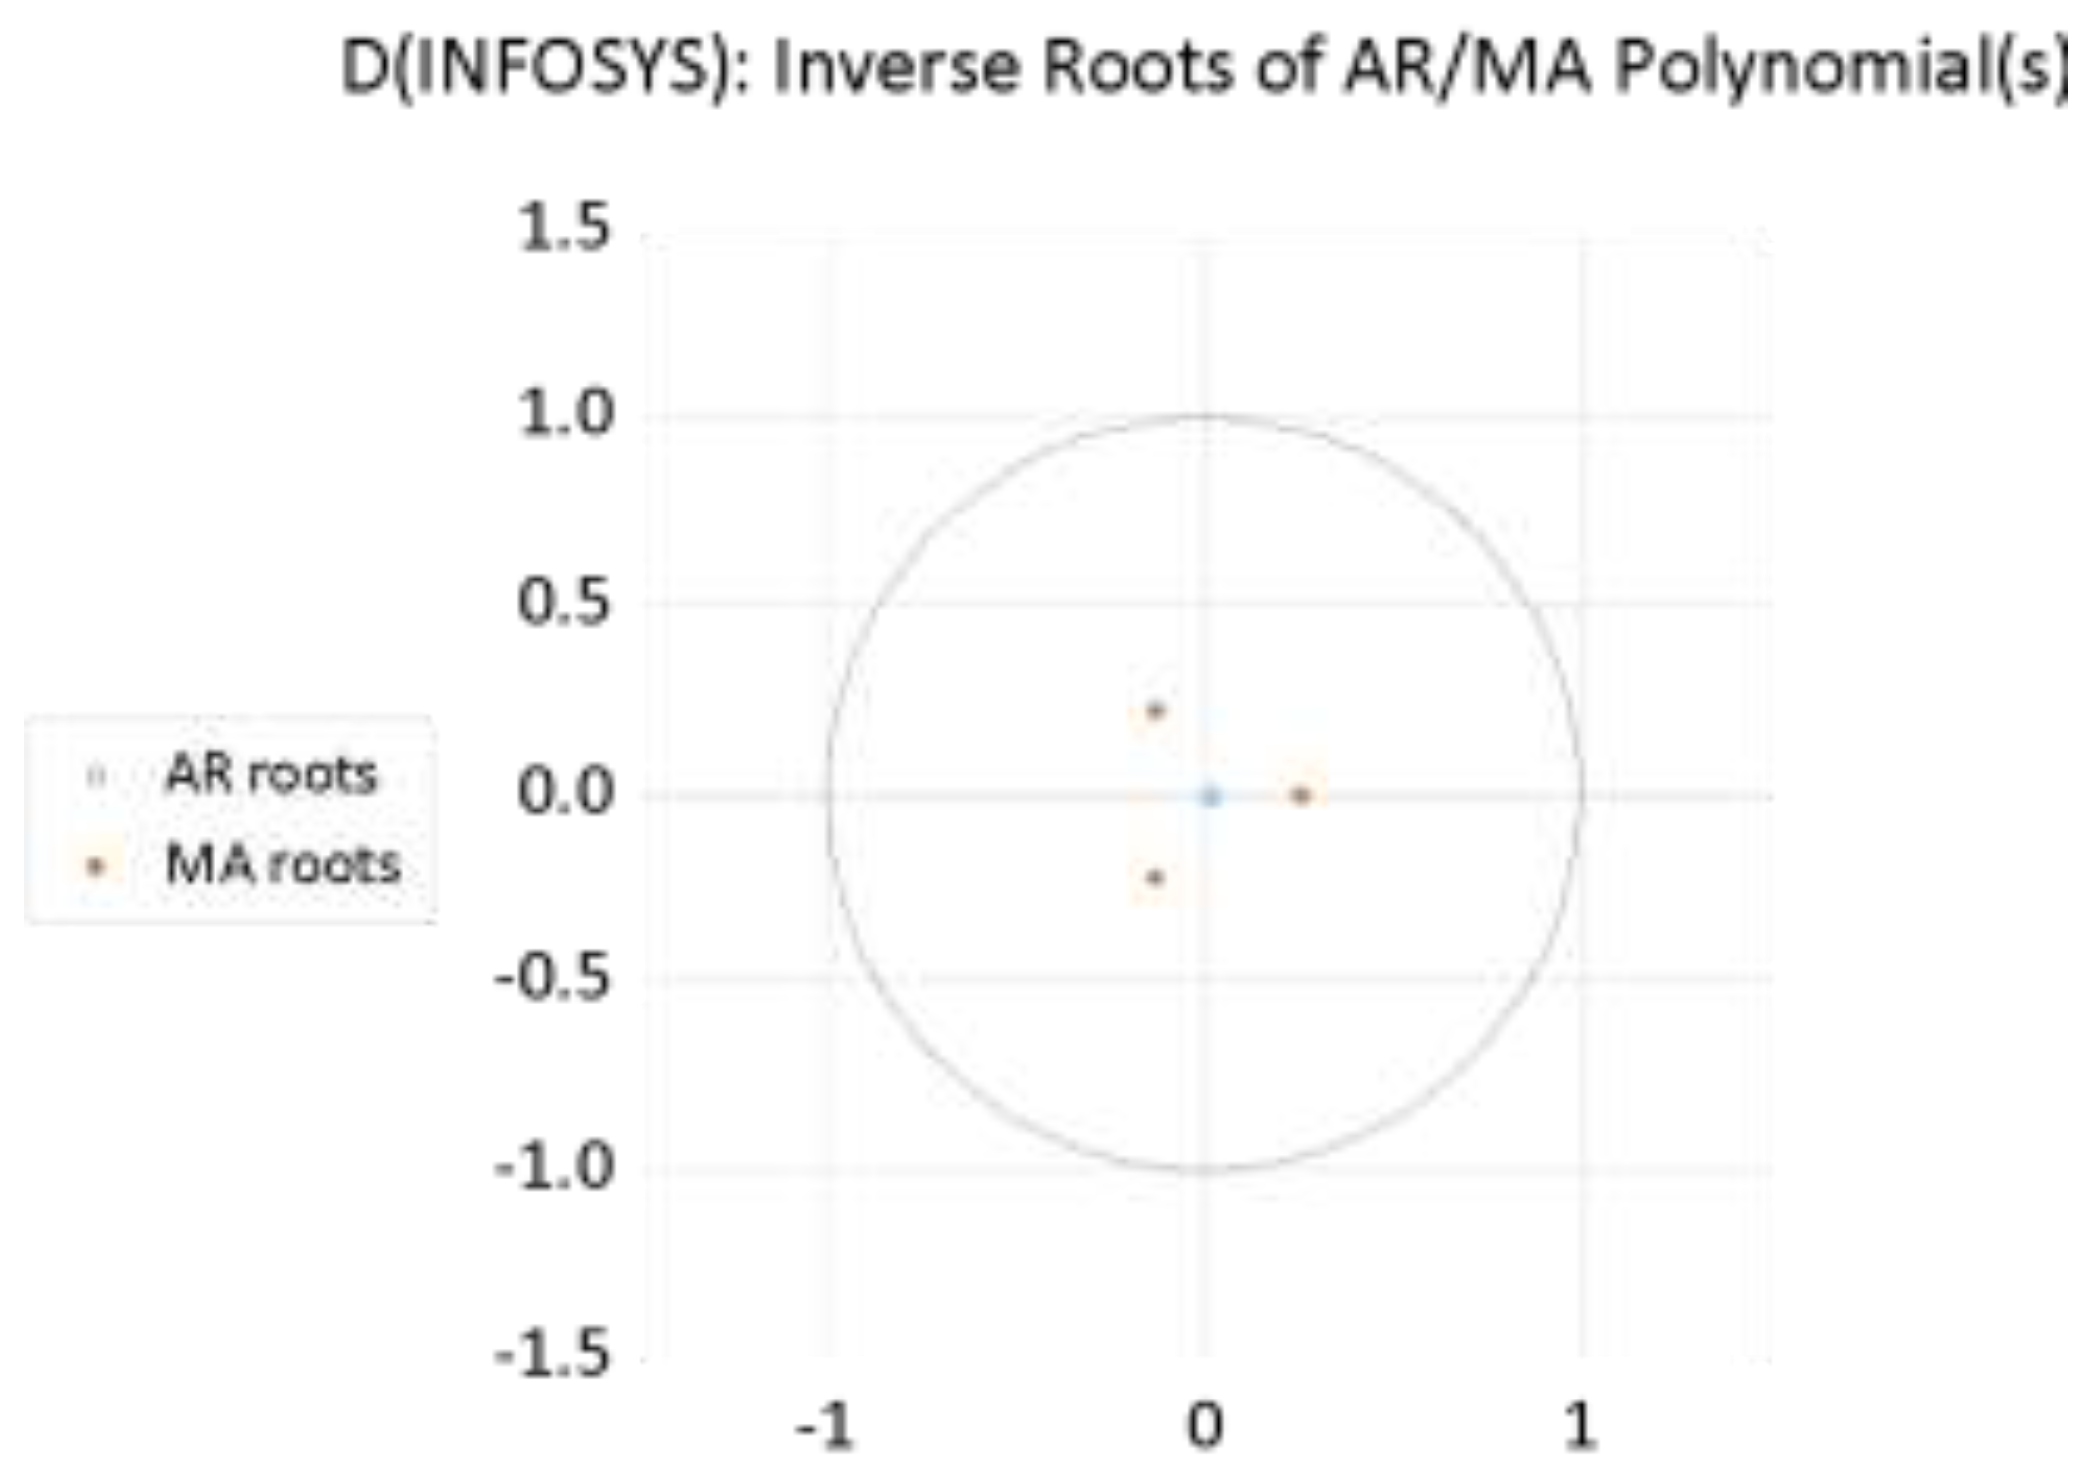
Figure 4.
Forecast Of Infosys.
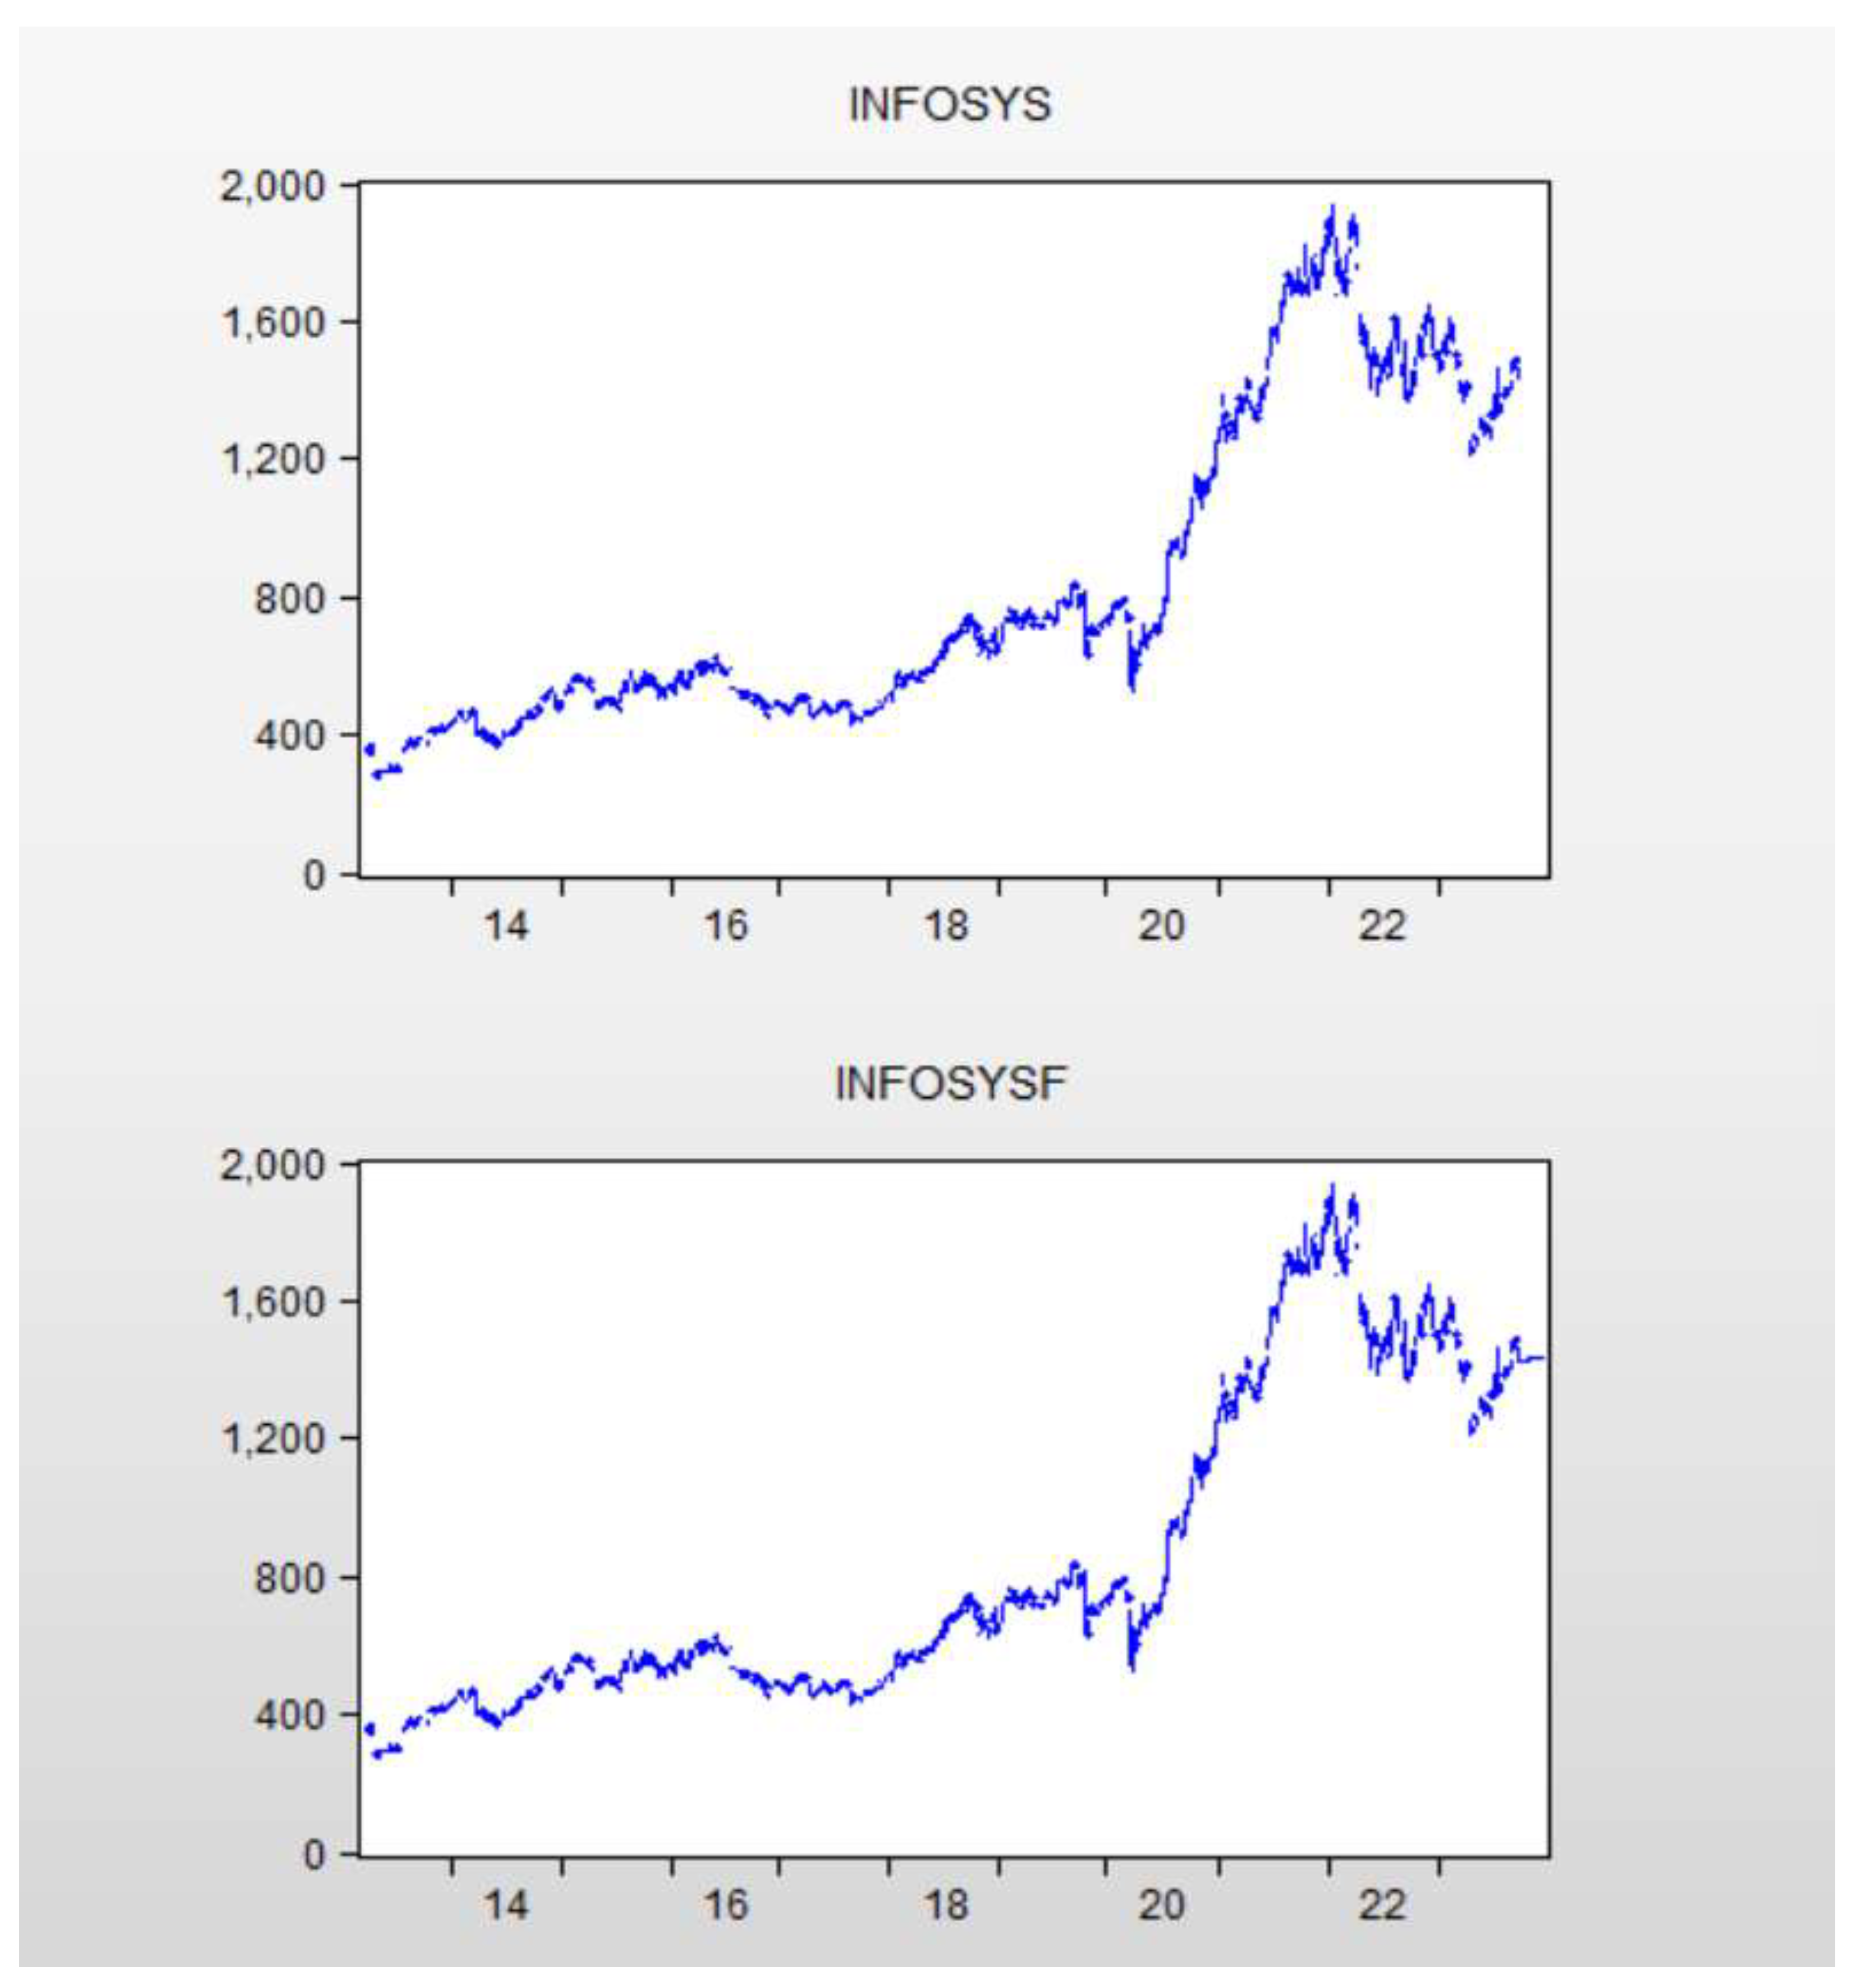
Figure 5.
Inverse Roots Of Ar/Ma Polynomial Of Tech Mahindra.
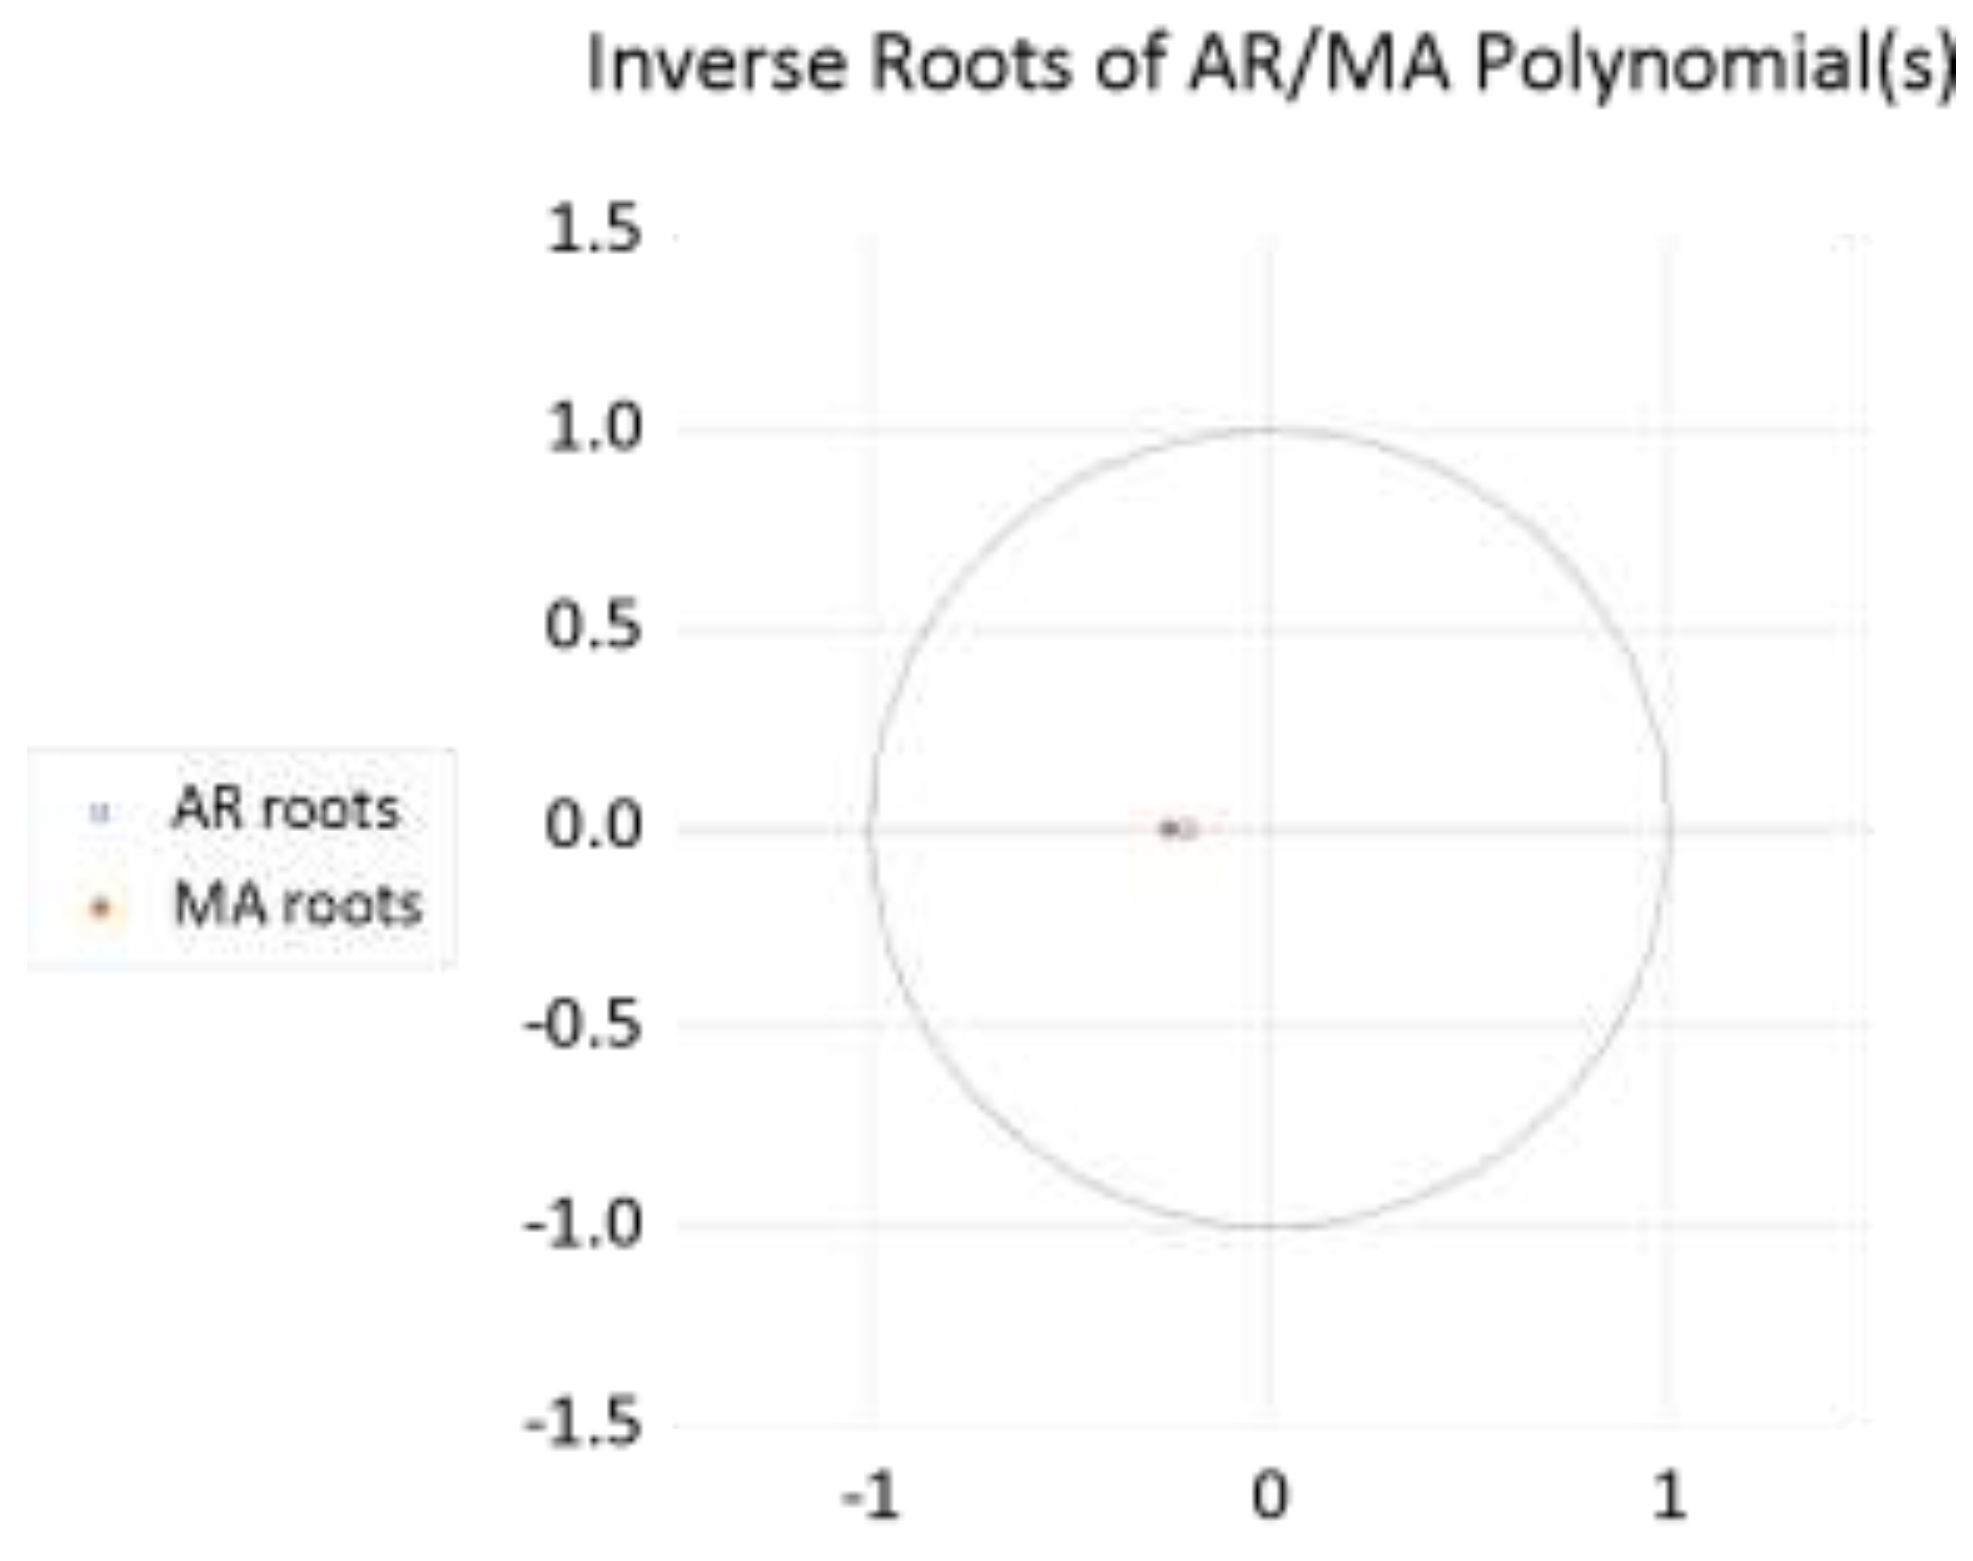
Figure 6.
Forecast Of Tech Mahindra.
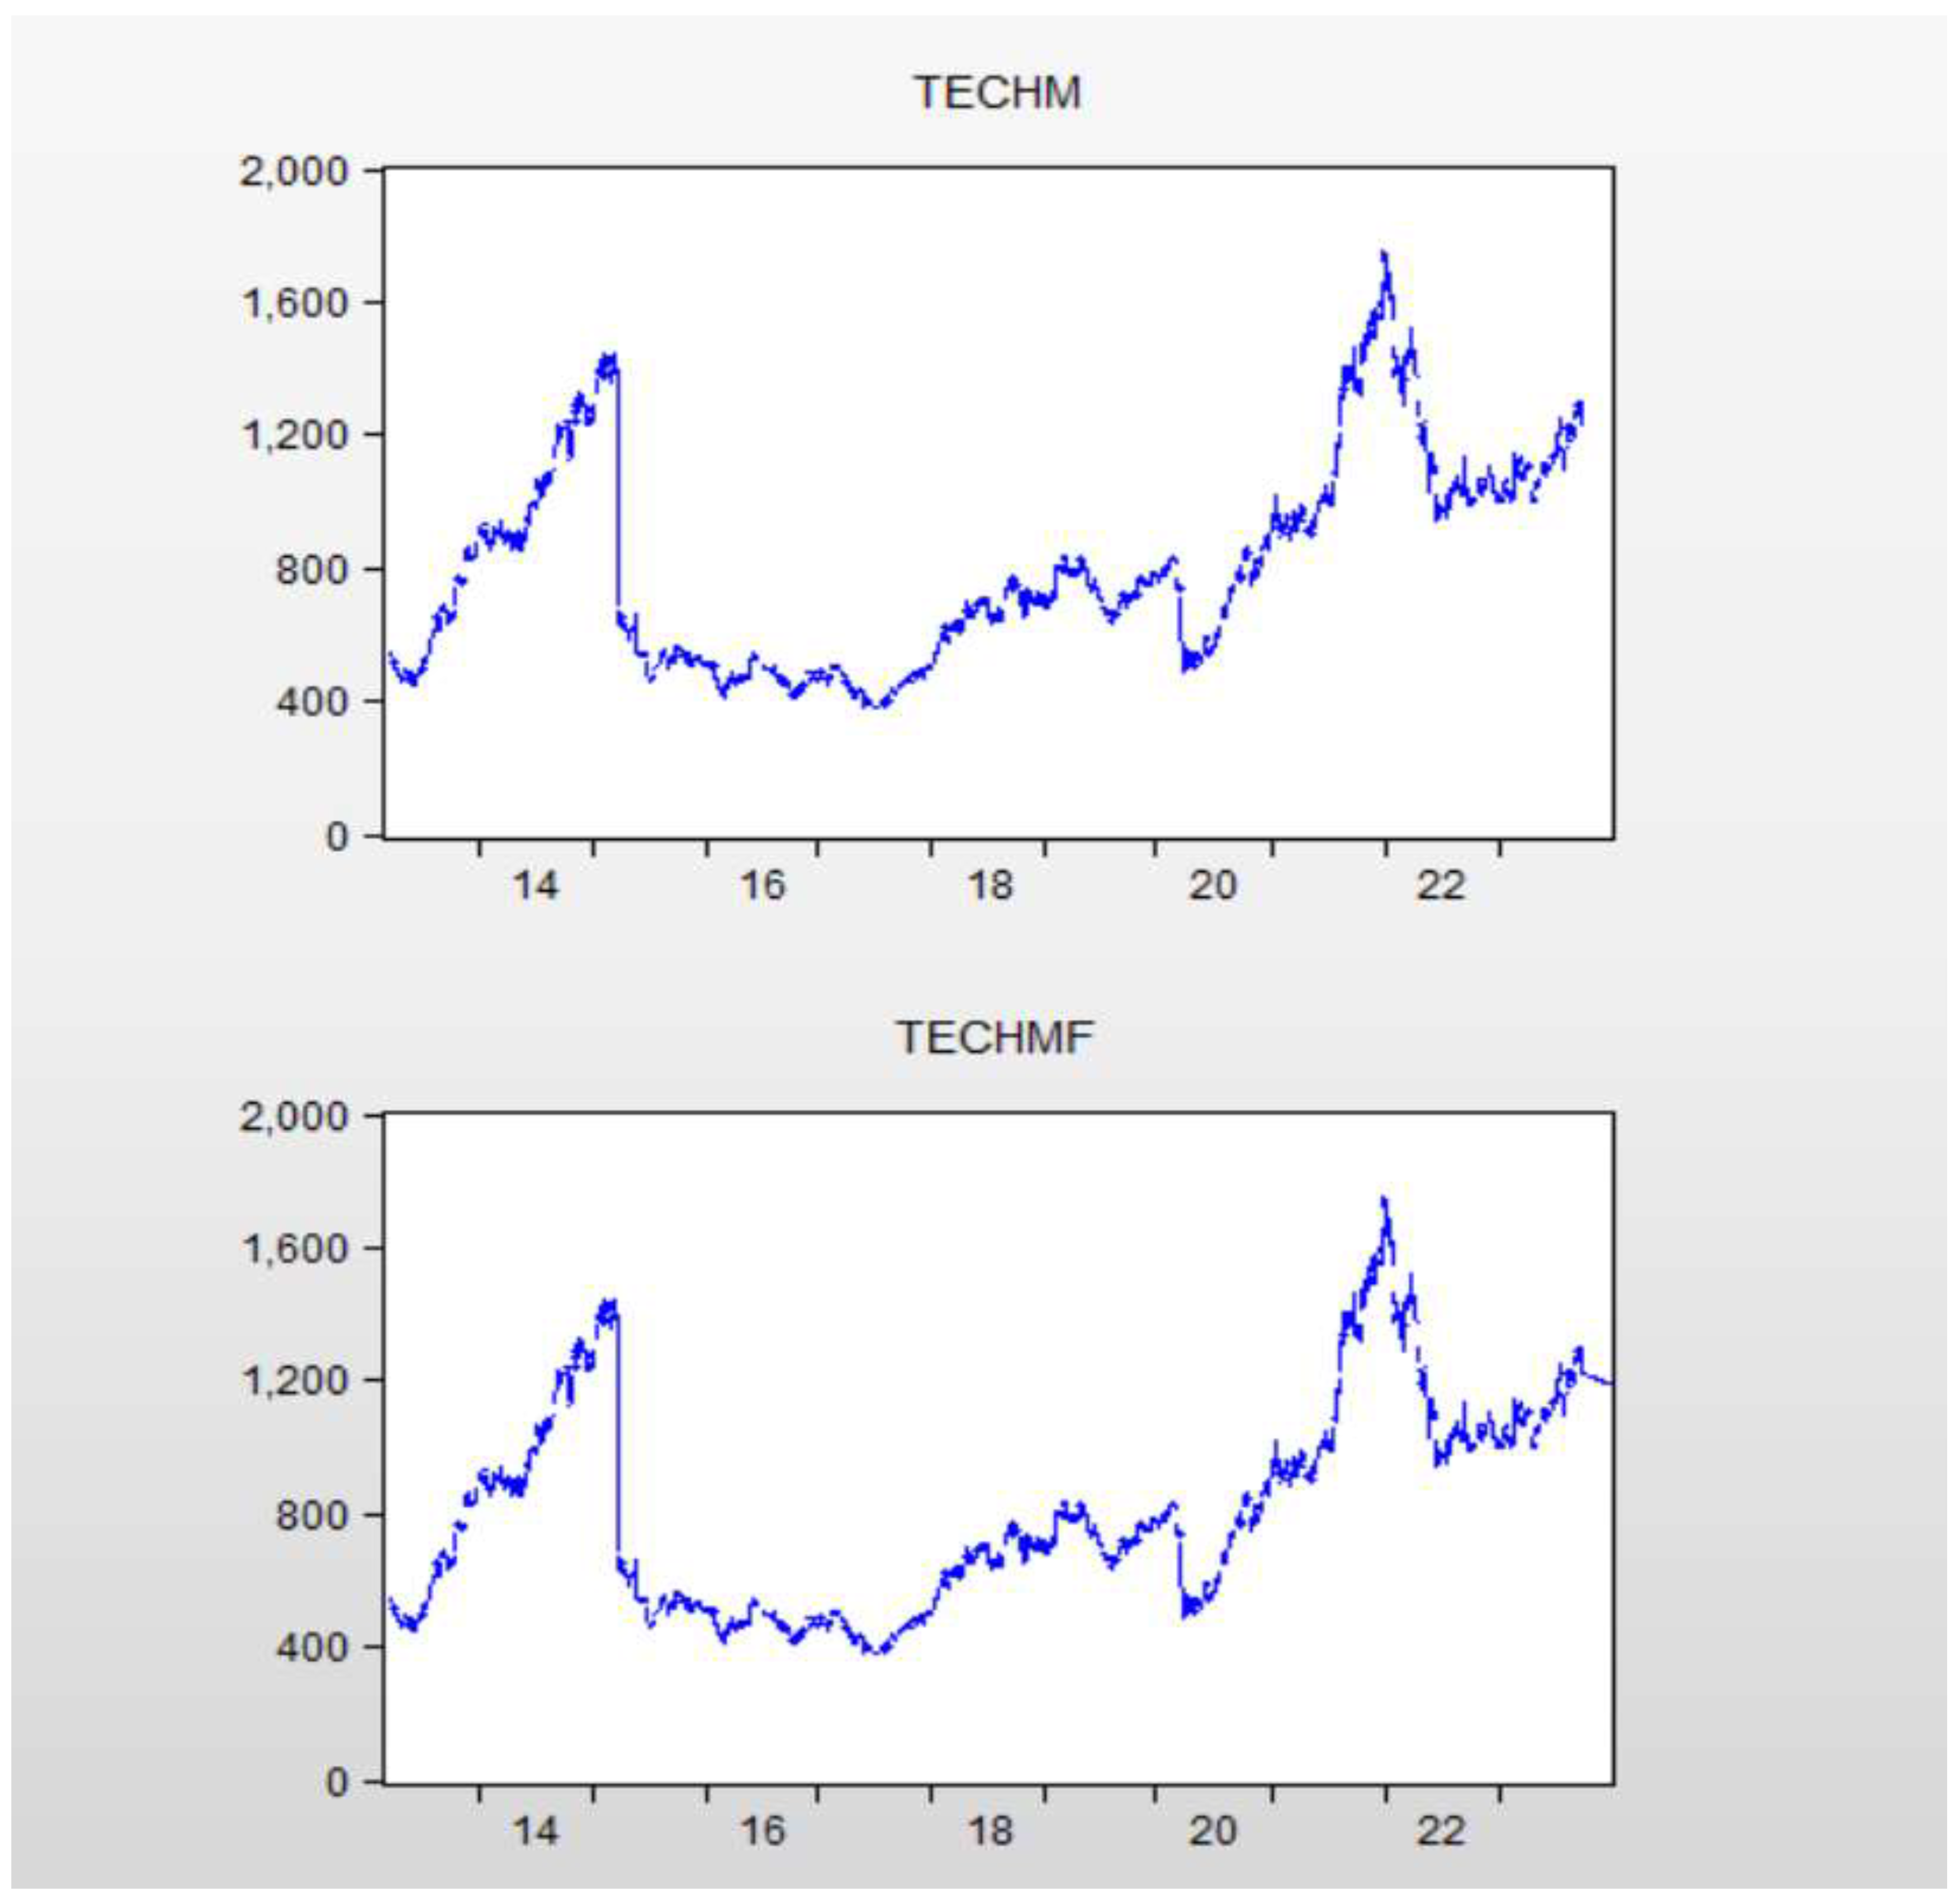
Figure 7.
Inverse Roots Of Ar/Ma Polynomial Hcl Tech.
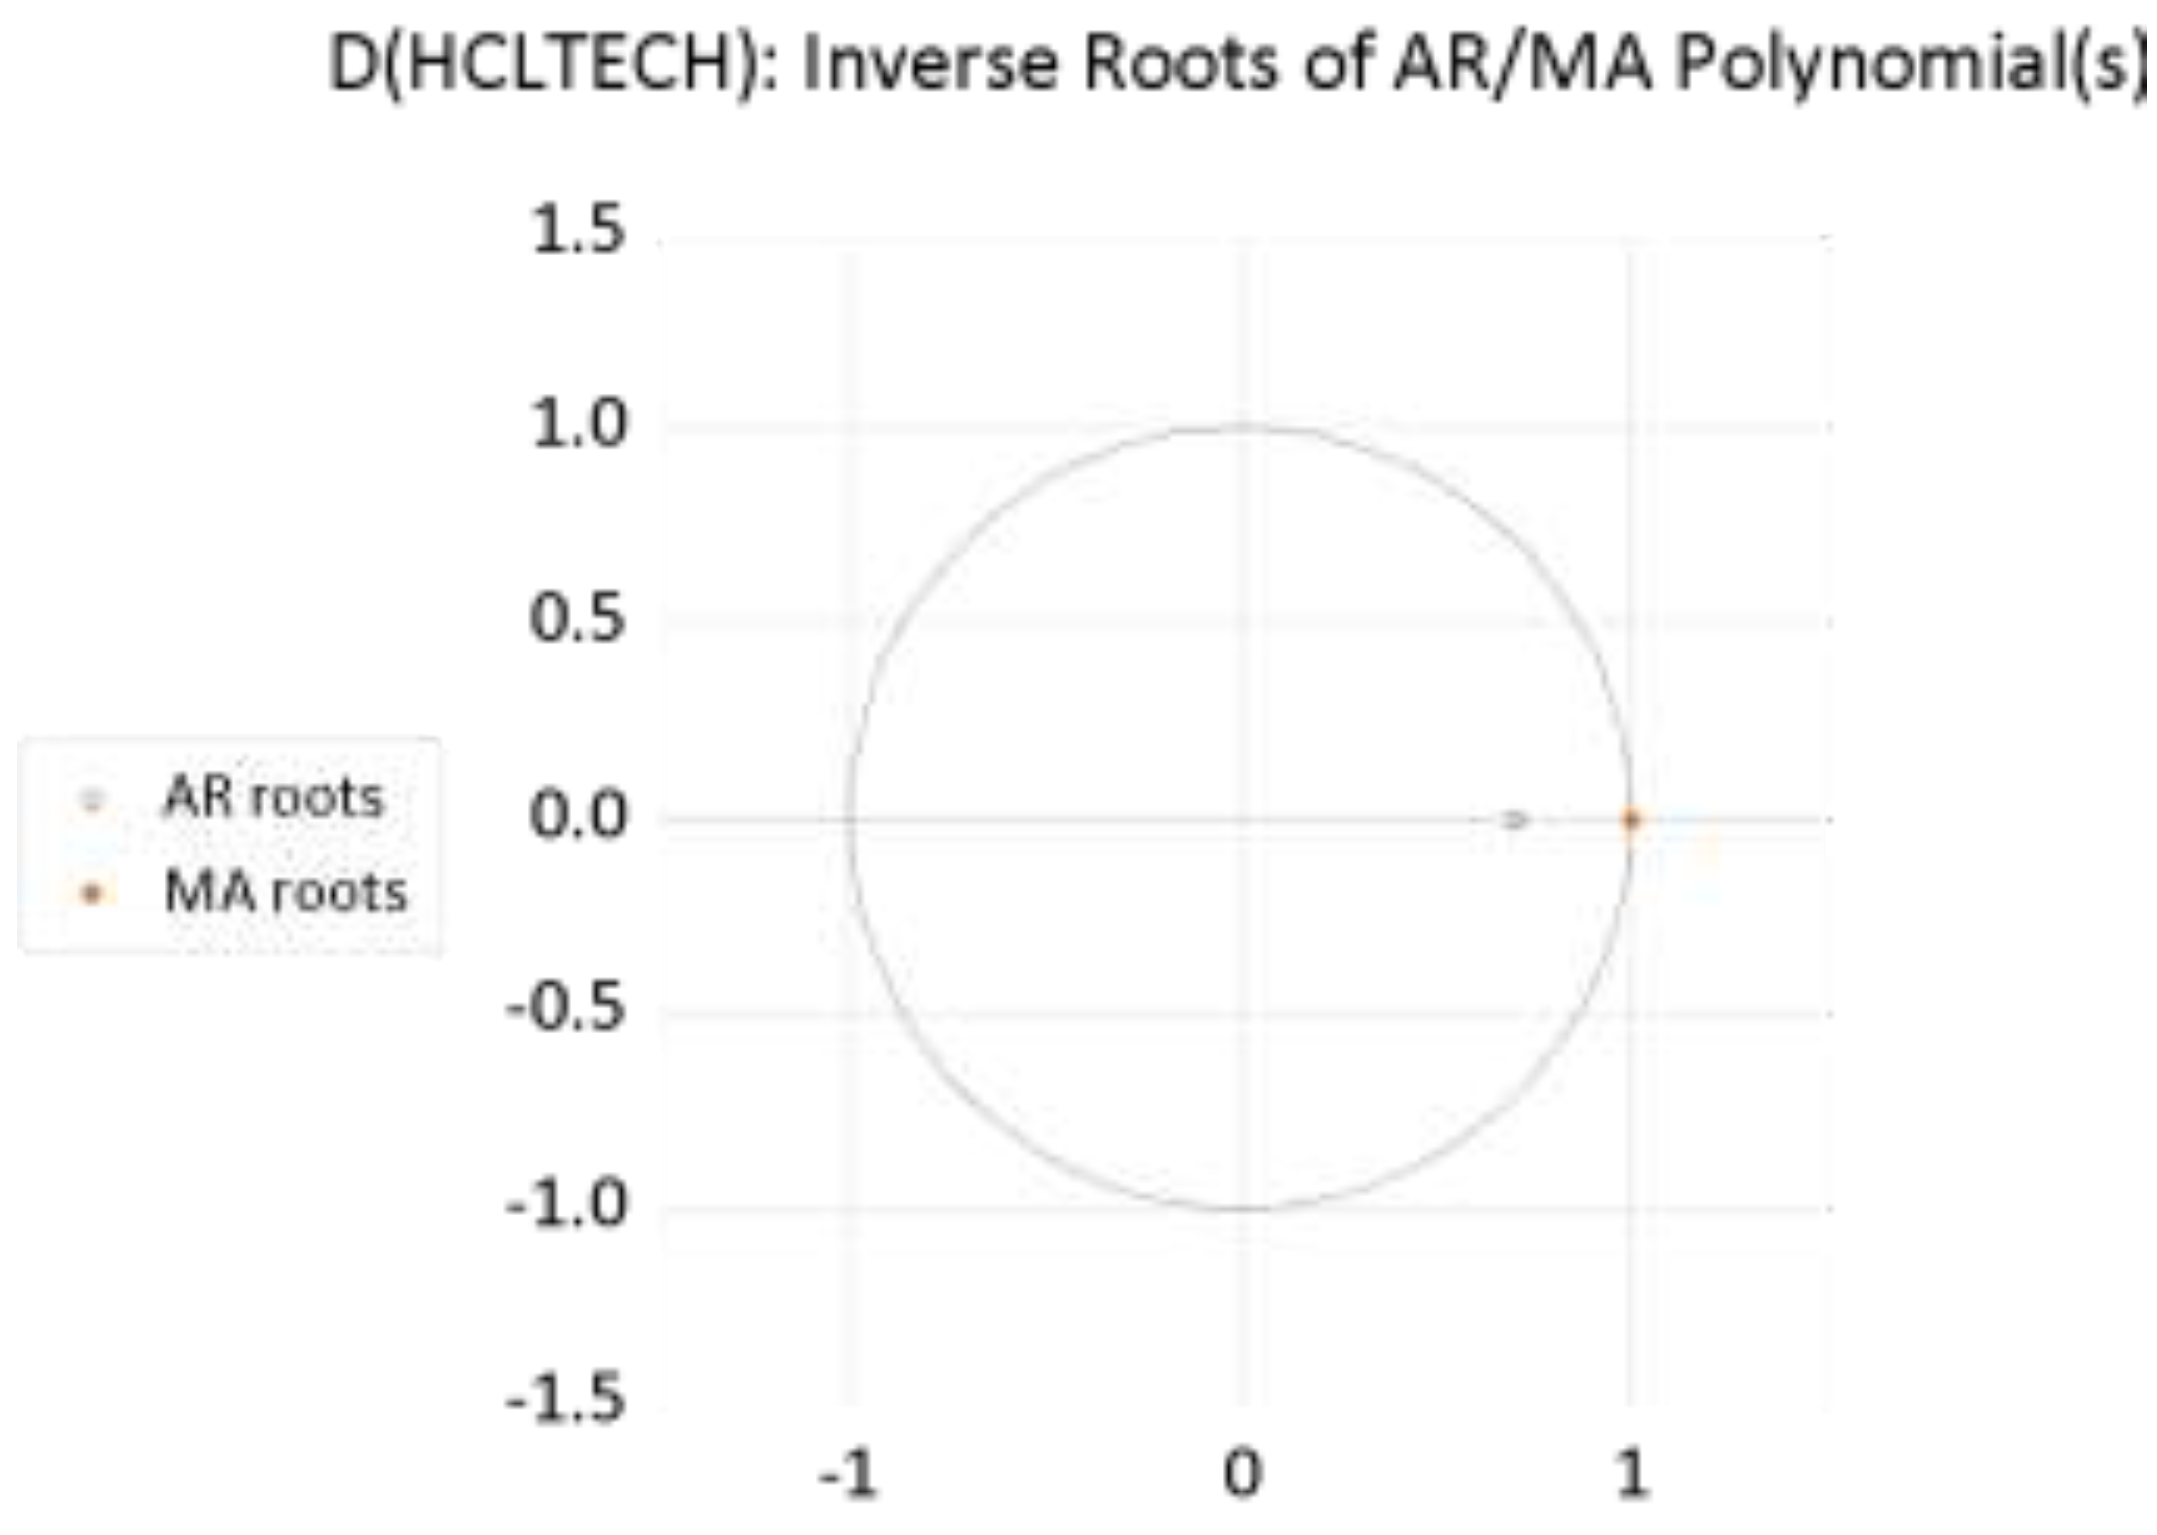
Figure 8.
Forecast Of Hcl Tech.
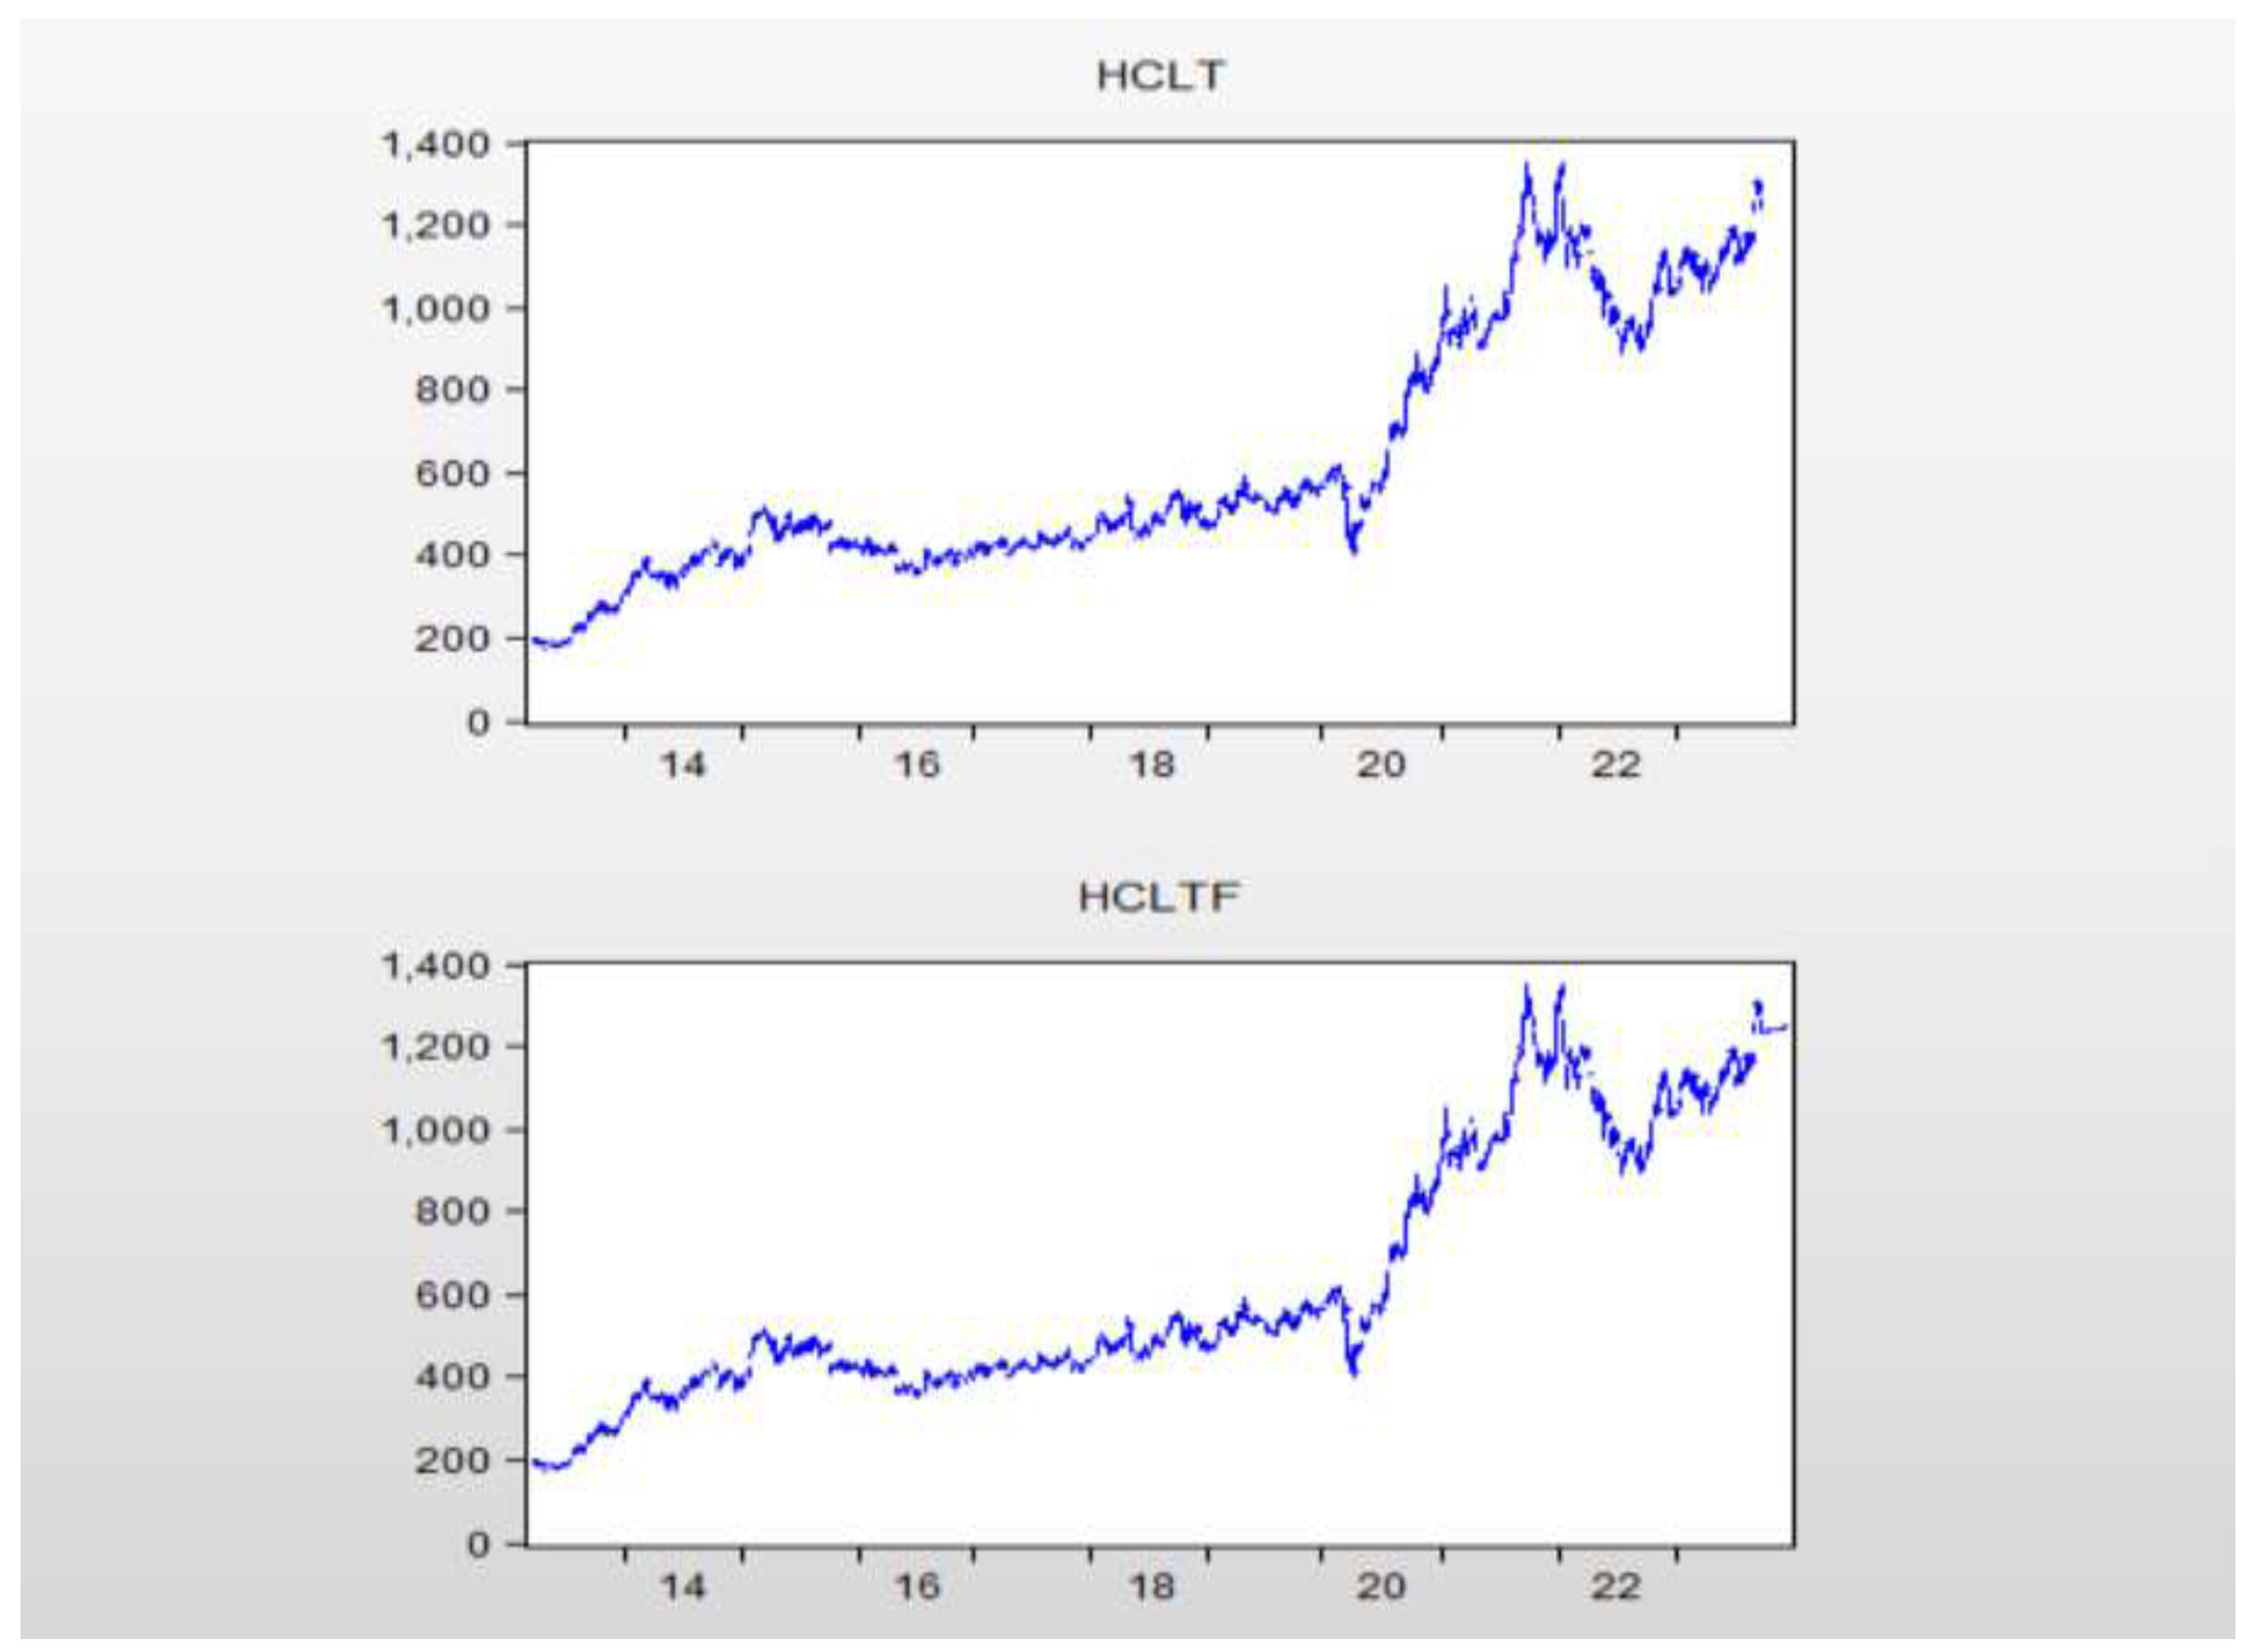
Figure 9.
Inverse Roots Of ARIMA Polynomial Of Wipro.
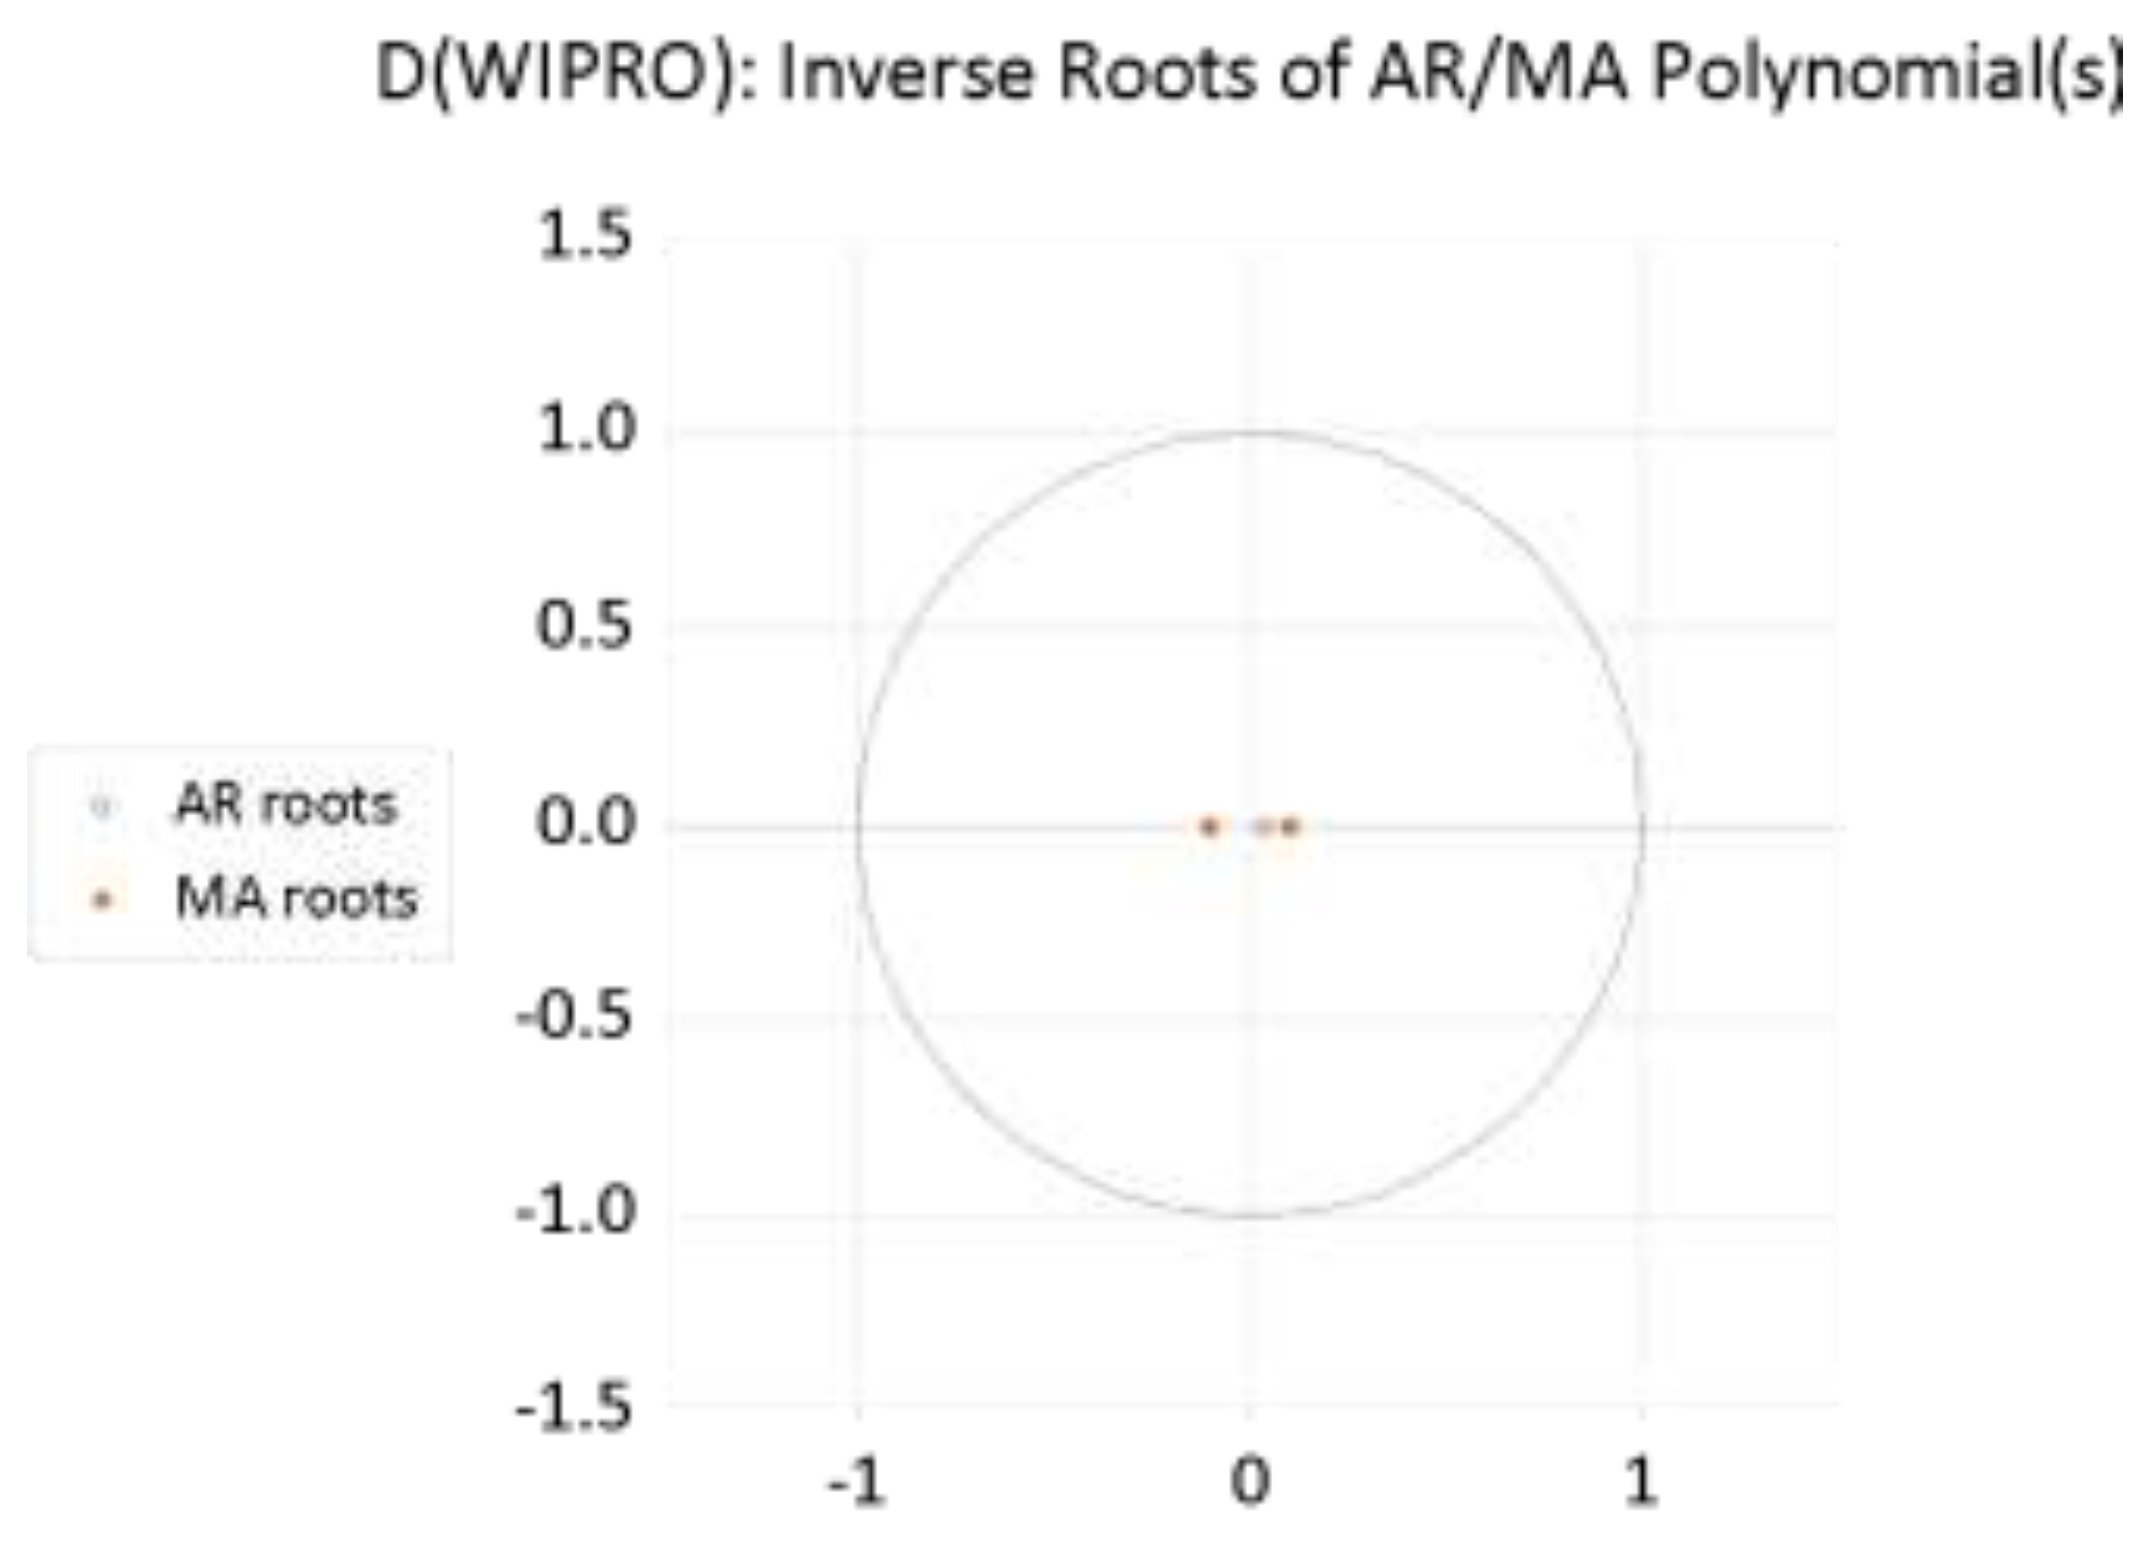
Figure 10.
Forecast Of Wipro.
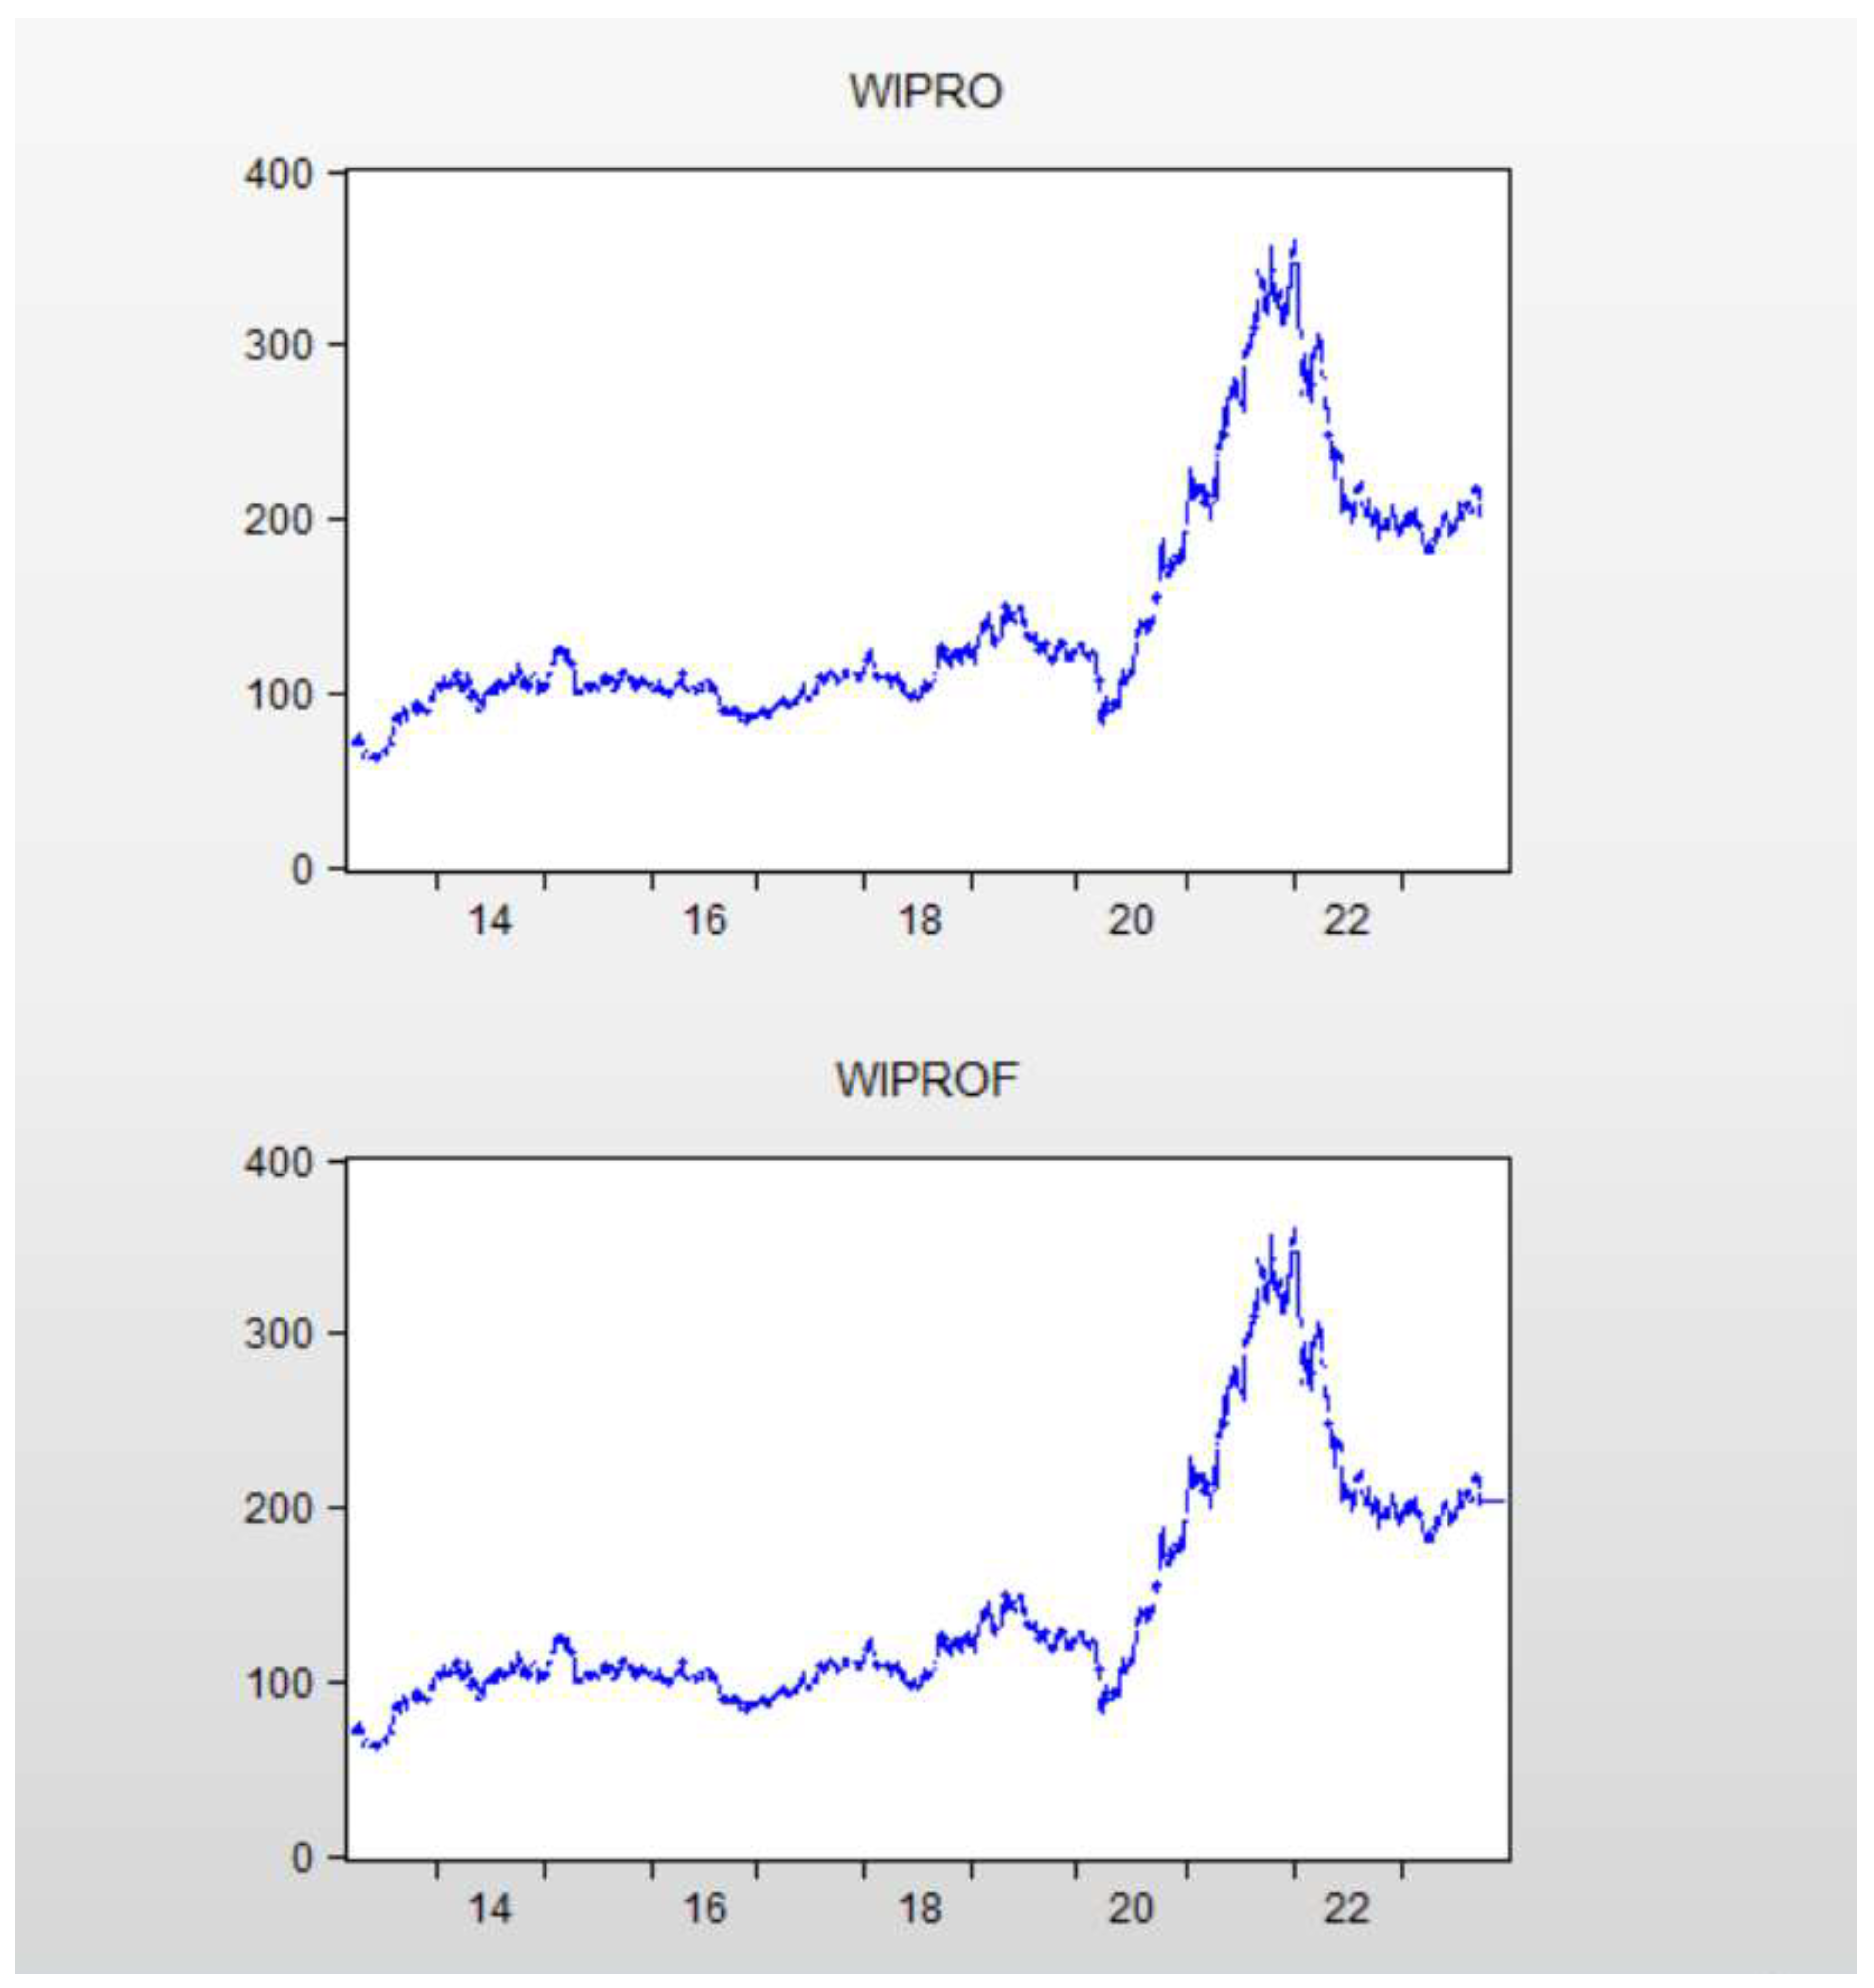

Table 1.
Thematic Analysis.
| Theme | Author(s) | Study Focus | Methodology | Key Findings |
|---|---|---|---|---|
| ARIMA Modeling for Stock Price Forecasting | Afeef, Ihsan, & Zada (2018) | Forecasting stock prices using univariate ARIMA. | Univariate ARIMA model | ARIMA model effectively captures stock price patterns and provides reliable short-term forecasts. |
| ARIMA and Hybrid Models | Ariyo, Adewumi, & Ayo (2014) | ARIMA model application in stock price prediction. | ARIMA modeling with simulations | Demonstrates that ARIMA can provide a reasonable forecast, but hybrid models may enhance accuracy. |
| ARIMA-GARCH for Volatility | Babu & Reddy (2014) | Forecasting Indian stocks with ARIMA-GARCH hybrid model. | ARIMA-GARCH hybrid model | ARIMA-GARCH provides improved forecasting accuracy by addressing both trend and volatility in stock prices. |
| Indian Stock Market Analysis | Banerjee (2014) | Time-series analysis for Indian stock market. | ARIMA time-series analysis | Concludes that ARIMA models can forecast stock trends in Indian markets, providing useful insights for investors. |
| ARIMA in Emerging Markets | Challa, Malepati, & Kolusu (2020) | Forecasting returns for S&P BSE Sensex and S&P BSE IT indices. | ARIMA model applied to index returns | Shows ARIMA’s effectiveness for short-term predictions in emerging markets with moderate volatility. |
| Hybrid Models for Stock Forecasting | Choi (2018) | Predicting stock price correlations with ARIMA-LSTM. | Hybrid ARIMA-LSTM model | ARIMA-LSTM captures both linear and nonlinear dependencies, offering a robust predictive approach for stock returns. |
| Sector-Specific ARIMA Applications | Devi, Sundar, & Alli (2013) | Time-series analysis for NIFTY Midcap-50 stocks. | ARIMA model focused on sector-specific stocks | Demonstrates that ARIMA models are useful for sector-specific predictions, although with limitations on long-term accuracy. |
| Sliding Window ARIMA | Dong et al. (2020) | ARIMA’s predictive power in equity returns using the sliding window method. | ARIMA with a sliding window approach | Sliding windows enhance ARIMA’s adaptability to recent trends, increasing forecast reliability. |
| Demand Forecasting with ARIMA | Fattah et al. (2018) | Forecasting demand trends beyond financial markets. | ARIMA applied to demand forecasting | Confirms ARIMA’s versatility for different types of time-series forecasting. |
| Event Impact Analysis | Jarrett & Kyper (2011) | Forecasting and analyzing Chinese stock prices with ARIMA interventions. | ARIMA model with intervention | Event-based ARIMA models capture effects of sudden market events, useful for understanding market reactions. |
| Hybrid ANN-ARIMA Models | Kapila Tharanga Rathnayaka et al. (2015) | Forecasting stock prices using ANN and ARIMA hybrid models. | Hybrid ANN-ARIMA model | ANN and ARIMA hybrid models capture complex trends, improving forecast accuracy. |
| Stock Market Return Models | Konarasinghe (2016) | Model development for stock returns in Sri Lanka. | ARIMA model development | ARIMA models are applicable across emerging markets with appropriate parameter adjustments. |
| Advanced Hybrid Models | Kumar & Thenmozhi (2014) | Forecasting stock index returns with ARIMA-SVM, ARIMA-ANN, and ARIMA-RF. | Various ARIMA-hybrid models | Hybrid models like ARIMA-SVM improve predictive accuracy by incorporating machine learning components. |
| LSTM-ARIMA for Prediction | Mahadik, Vaghela, & Mhaisgawali (2021) | Stock price prediction with LSTM and ARIMA. | LSTM and ARIMA hybrid model | LSTM-ARIMA effectively captures complex patterns in stock data, particularly for volatile stocks. |
| Mixed ARIMA for Pharma Stocks | Meher et al. (2021) | Forecasting Indian pharmaceutical stock prices using mixed ARIMA. | Mixed ARIMA approach | Highlights ARIMA’s adaptability to sector-specific analysis, with effective results in the pharmaceutical sector. |
| Comparing Hybrid Models | Merh, Saxena, & Pardasani (2010) | Comparison of ANN and ARIMA for Indian stock trend forecasting. | ANN vs. ARIMA hybrid models | Hybrid ANN-ARIMA offers improved performance over standalone models for capturing stock price dynamics. |
| Stock Reactions to Events | Mestel & Gurgul (2003) | Event-induced stock price reactions in Austria using ARIMA. | ARIMA modeling | ARIMA models, when tailored for events, provide insights into stock price reactions. |
| ARIMA Effectiveness | Mondal, Shit, & Goswami (2014) | Effectiveness of ARIMA in forecasting stock prices. | ARIMA model evaluation | Confirms ARIMA’s usefulness in financial markets, but highlights limitations for long-term predictions. |
| ARIMA and Neural Network Hybrid | Musa & Joshua (2020) | Forecasting stock market returns using ARIMA-ANN hybrid model. | ARIMA-ANN hybrid model | Hybrid model increases predictive accuracy by leveraging ARIMA for linear trends and ANN for nonlinear trends. |
| ARIMA-GARCH for S&P 500 | Mustapa & Ismail (2019) | Modeling S&P 500 stock prices with ARIMA-GARCH. | ARIMA-GARCH hybrid model | Combines ARIMA for trend and GARCH for volatility, yielding better forecast accuracy for indices like S&P 500. |
| SVM and ARIMA Hybrid Models | Pai & Lin (2005) | Forecasting stock prices with ARIMA and SVM hybrid model. | ARIMA-SVM hybrid model | ARIMA-SVM improves accuracy, balancing ARIMA’s linear trends with SVM’s nonlinear pattern recognition. |
| ARIMA vs. ANN for Nifty 50 | Pandey & Bajpai (2019) | Comparing ARIMA and ANN models for forecasting Nifty 50 stock market. | ARIMA vs. ANN models | ARIMA outperforms ANN in linear trend forecasting, while ANN excels in capturing non-linear patterns. |
| Sector-Specific Analysis | Paul, Hoque, & Rahman (2013) | Forecasting pharmaceutical sector with ARIMA in Bangladesh. | ARIMA model focused on a specific sector | ARIMA models are effective for sector-specific forecasting but may lack accuracy for highly volatile stocks. |
| Macroeconomic Influence | Quadir (2012) | Examining macroeconomic variables’ effects on stock returns in Dhaka. | Macroeconomic variables with ARIMA | ARIMA can effectively capture trends influenced by macroeconomic factors, helping assess broader economic impacts. |
| ARIMA for Indian Market Volatility | Reddy (2019) | Forecasting stock market indices (BSE and NSE) using ARIMA. | ARIMA model | Highlights ARIMA’s applicability in emerging markets, noting moderate accuracy for market volatility predictions. |
| Hybrid ARIMA-SVR Models | Rubio & Alba (2022) | Forecasting Colombian shares with ARIMA-SVR. | ARIMA-SVR hybrid model | ARIMA-SVR models balance linear and nonlinear trends, enhancing forecast accuracy for emerging markets. |
| LSTM-ARIMA in Live Data Prediction | Sakshi & Vijayalakshmi (2020) | ARIMA-LSTM hybrid for live stock market data. | ARIMA-LSTM hybrid model | ARIMA-LSTM shows high accuracy with real-time data, useful for rapid stock price predictions. |
| Volatility Forecasting with ARIMA | Wadhawan & Singh (2019) | Volatility estimation on NSE using ARIMA. | ARIMA model | ARIMA’s effectiveness in capturing volatility in NSE is limited, suggesting hybrid models may perform better. |
| ARIMA for High-Frequency Data | Yermal & Balasubramanian (2017) | Forecasting returns using ARIMA on minute-wise data for NSE. | Auto-ARIMA on high-frequency data | ARIMA models can capture minute-level data patterns, providing insights for short-term high-frequency trading. |
Table 2.
The Augmented Dickey-Fuller Test For Tcs.
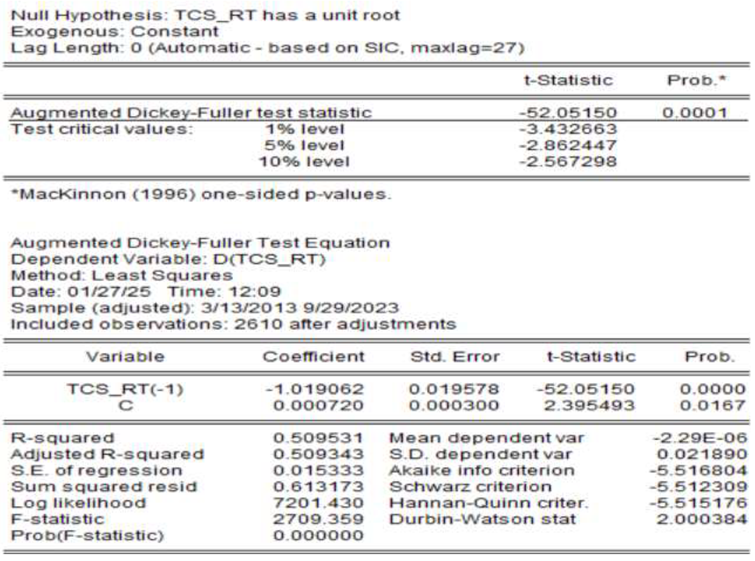 |
Table 3.
Adf- Unit Root Test For Infosys.
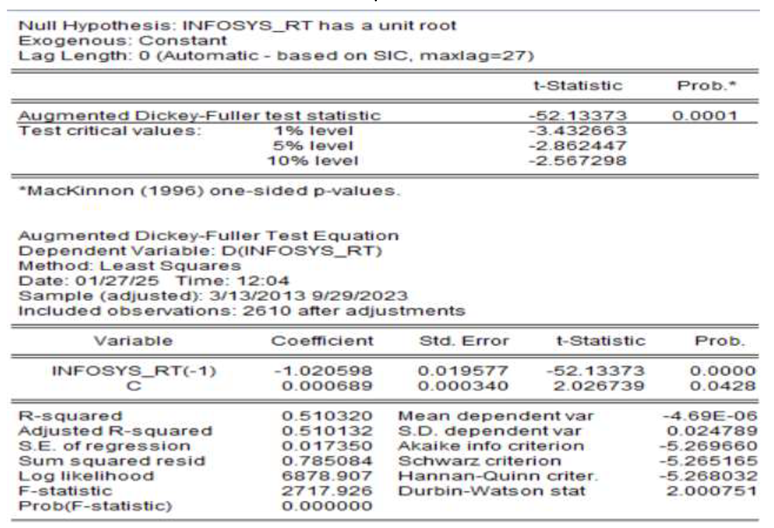 |
Table 4.
Adf Unit Root Test For Tech Mahindra.
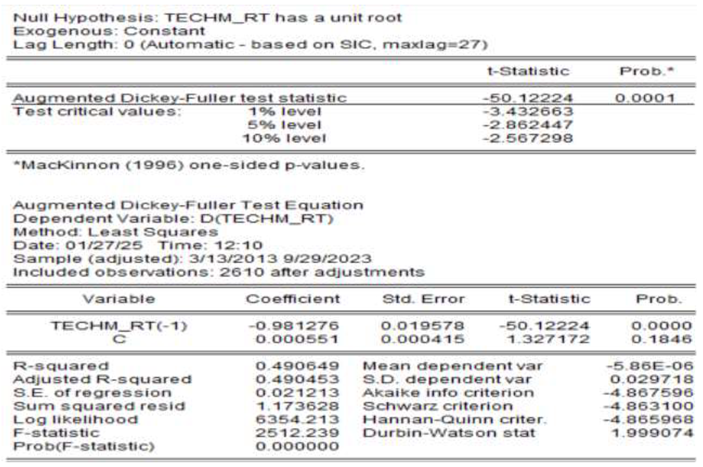 |
Table 5.
Adf Unit Root Test For Hcl Tech.
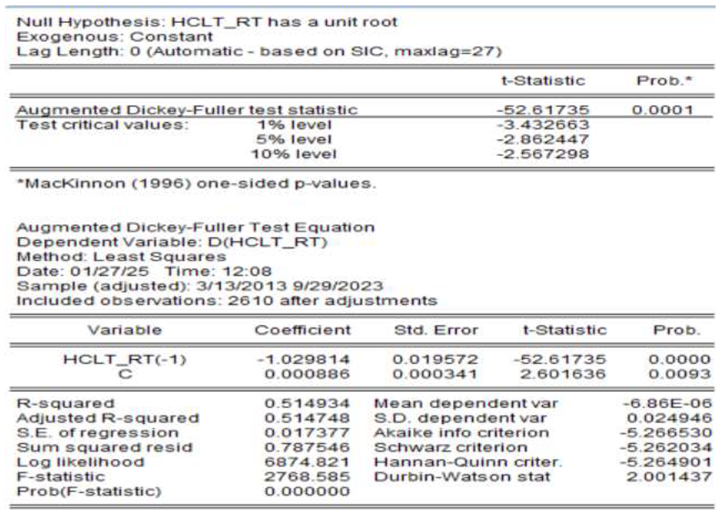 |
Table 6.
Adf Unit Root Test Of Wipro.
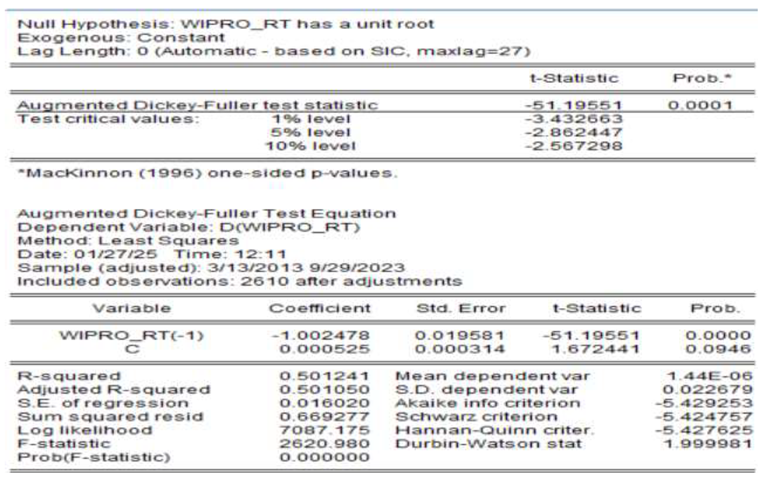 |
Table 7.
Tcs’s Arima Model.
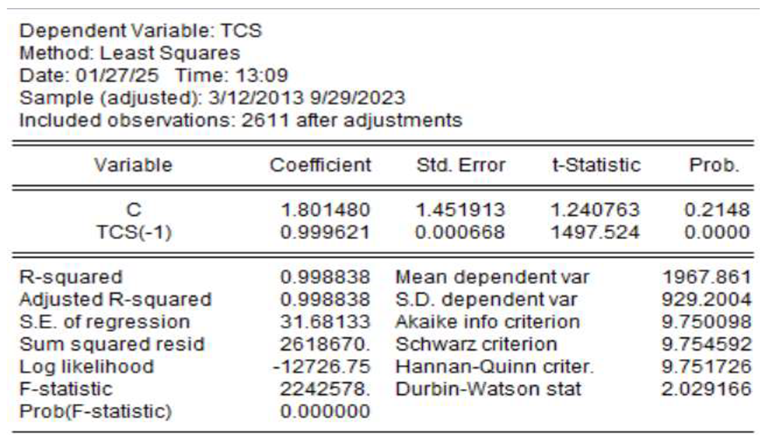 |
Table 8.
Infosys Arima Model.
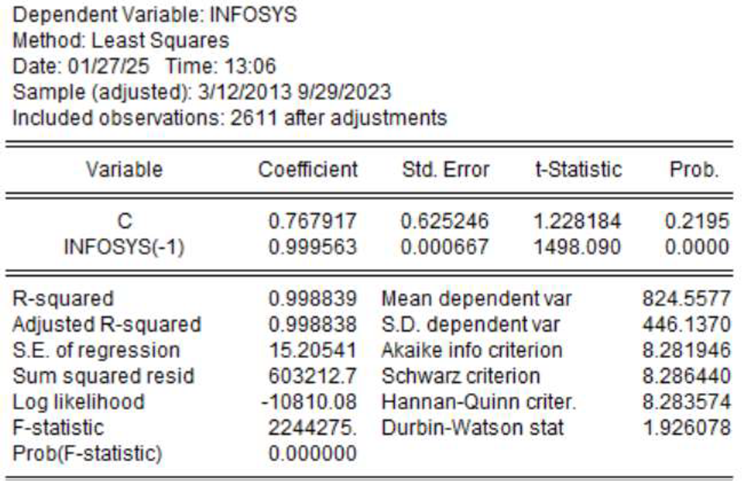 |
Table 9.
Tech Mahindra Arima Model.
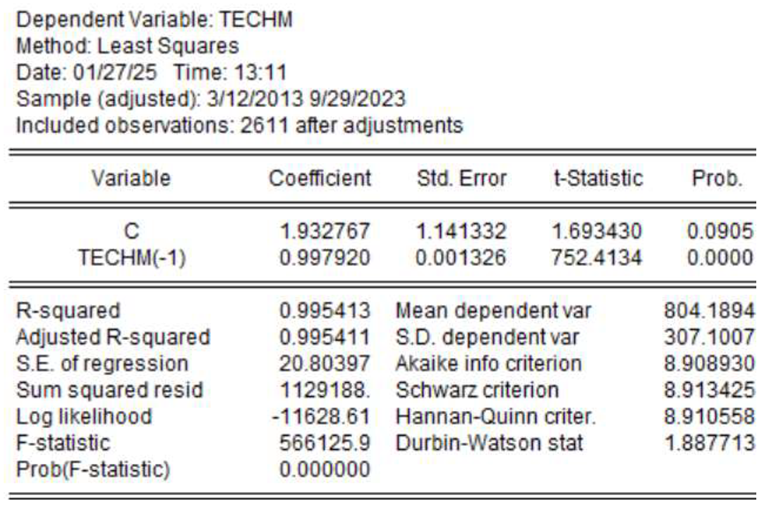 |
Table 10.
Hcl Tech Arima Model.
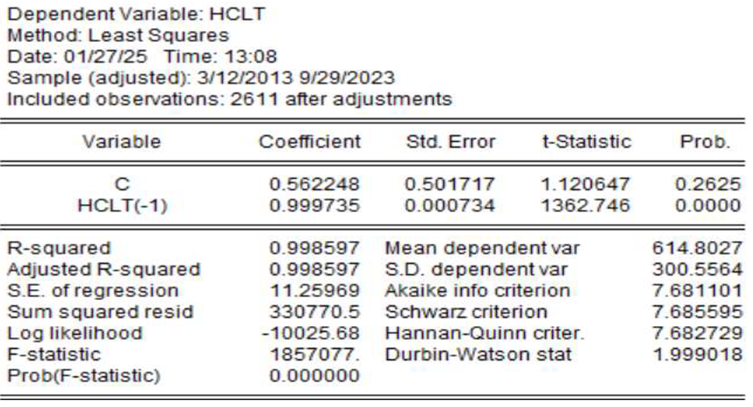 |
Table 11.
Wipro Arima Model:.
 |
Disclaimer/Publisher’s Note: The statements, opinions and data contained in all publications are solely those of the individual author(s) and contributor(s) and not of MDPI and/or the editor(s). MDPI and/or the editor(s) disclaim responsibility for any injury to people or property resulting from any ideas, methods, instructions or products referred to in the content. |
© 2026 by the authors. Licensee MDPI, Basel, Switzerland. This article is an open access article distributed under the terms and conditions of the Creative Commons Attribution (CC BY) license (http://creativecommons.org/licenses/by/4.0/).
Copyright: This open access article is published under a Creative Commons CC BY 4.0 license, which permit the free download, distribution, and reuse, provided that the author and preprint are cited in any reuse.


