
Submitted:
21 February 2026
Posted:
25 February 2026
You are already at the latest version
Abstract
Background/Objectives: Chronic lymphocytic leukemia (CLL) is characterized by genetic and ep-igenetic alterations. This study aimed to assess the methylation status of E-Cadherin and MMP-9 gene promoters and to explore their relationships with disease pathogenesis and hematological parameters in CLL patients. Methods: A case–control study was conducted including 70 newly diagnosed CLL patients and 70 age- and sex-matched healthy controls. Promoter methylation of E-Cadherin and MMP-9 genes was evaluated using methylation-specific PCR (MSP) and methyla-tion-sensitive restriction enzyme PCR (MSRE-PCR), respectively. Results: The median patient age was 62 years, and 68.5 % were males. Binet stage A was the most common (57.3 %). E-Cadherin promoter methylation was detected in 75.7 % of CLL patients and 77.1 % of controls (p = 0.91), showing no significant association with disease occurrence, however, it showed a significant correlation with higher lymphocyte counts (p = 0.01). In contrast, MMP-9 promoter methylation was significantly less frequent in CLL cases (70.0 %) than in controls (100 %, p = 0.001). Un-methylated MMP-9 correlated significantly with female gender (p = 0.02), lower hemoglobin (p = 0.031), and reduced platelet counts (p = 0.001) and higher lymphocytes counts (p = 0.035). Conclusion: MMP-9 promoter hypomethylation may play a pathogenic role in CLL and is associated with female gender and cytopenia, whereas E-Cadherin methylation appears non-specific. MMP-9 methylation status could therefore serve as a potential biomarker for CLL biology and prognosis.
Keywords:
chronic lymphocytic leukemia
; DNA methylation
; MMP-9
; E-Cadherin
; epigenetics
; prognosis
1. Introduction
Chronic lymphocytic leukemia (CLL) is the most prevalent adult leukemia in Western nations. It is distinguished by clonal proliferation and accumulation of mature B lymphocytes in peripheral blood, bone marrow, and lymphoid organs [1]. Despite its indolent character in many situations, CLL has a widely variable clinical presentation and prognosis. Some individuals are asymptomatic for years, while others deteriorate quickly, necessitating early treatment intervention. This diversity has stimulated much investigation into the biochemical and molecular factors that drive CLL development.
Epigenetic alterations, particularly DNA methylation, have emerged as critical players in CLL pathogenesis [2]. DNA methylation involves the addition of methyl groups to the 5-position of cytosine residues in CpG dinucleotides, often leading to transcriptional silencing of tumor suppressor genes [3]. Aberrant DNA methylation profiles have been observed in various malignancies, including hematologic cancers, where they serve not only as early events in carcinogenesis but also as prognostic and predictive biomarkers [4,5].
One gene of interest in this context is E-Cadherin (CDH1), a transmembrane glycoprotein that mediates calcium-dependent cell-cell adhesion in epithelial tissues. E-Cadherin loss is a hallmark of epithelial-mesenchymal transition (EMT), a process that facilitates tumor cell migration and invasion [6]. Though CLL is a hematological malignancy, recent evidence suggests that EMT-related pathways may influence leukemic cell trafficking and interactions with the microenvironment [7]. Promoter methylation of CDH1 has been documented in various cancers and is associated with gene silencing and poor clinical outcomes [8]. However, data on its methylation status in CLL remain sparse and inconclusive.
Another key molecule involved in tumor progression is Matrix Metalloproteinase-9 (MMP-9). MMP-9 is a member of the MMP family responsible for degrading extracellular matrix components, thereby facilitating tumor invasion, metastasis, and angiogenesis [9]. In CLL, MMP-9 is not only overexpressed but also contributes to the survival and drug resistance of leukemic cells through autocrine and paracrine mechanisms [10]. Studies have shown that MMP-9 expression may be regulated epigenetically, and promoter hypomethylation is often linked with its overexpression in cancers [11]. Investigating the methylation status of the MMP-9 promoter may thus provide insight into its role in CLL pathobiology and prognosis.
Despite increasing interest in epigenetics in CLL, studies assessing the methylation patterns of E-Cadherin and MMP-9 gene promoters in newly diagnosed patients are limited, particularly in Middle Eastern populations. Moreover, the clinical relevance of these epigenetic markers—such as their association with white blood cell count, hemoglobin level, platelet count, and Rai staging—remains to be fully clarified.
The present study aims to evaluate the promoter methylation status of E-Cadherin and MMP-9 genes in newly diagnosed CLL patients compared to healthy controls, using methylation-specific PCR (MSP) and methylation-sensitive restriction enzyme PCR (MSRE-PCR). We also explore the association of these epigenetic changes with clinical and hematological parameters. This work seeks to enhance understanding of the epigenetic landscape of CLL and to determine the potential of E-Cadherin and MMP-9 promoter methylation as biomarkers for disease prognosis and progression. To our knowledge, few studies have jointly evaluated E-Cadherin and MMP-9 promoter methylation in CLL, particularly in Middle Eastern populations. This study therefore aims to characterize their methylation patterns in CLL and to assess their potential clinical and hematologic associations.
2. Materials and Methods
Study Design and Participants
A case-control research was carried out at Azadi Teaching Hospital in Duhok, Iraq. The study included 70 newly diagnosed chronic lymphocytic leukemia (CLL) patients and 70 age- and sex-matched healthy control subjects. All CLL patients were diagnosed using the World Health Organization (WHO) 2017 criteria [12], which include persistent absolute lymphocytosis (≥5 × 10⁹/L), small mature lymphocytes with clumped chromatin, and B-cell lineage markers (CD19+, CD20+) with co-expression of CD5 and CD23. All patients with cytogenetic or molecular abnormalities, including TP53 mutations, were excluded. A priori sample size calculation was not performed; however, the selected number (n=70 per group) provided adequate power for detecting methylation frequency differences exceeding 20%.
Ethical Approval and Informed Consent
The study protocol was approved by the Research and Ethics Committee of the College of Medicine, University of Duhok. All participants provided written informed consent prior to sample collection, in accordance with the Declaration of Helsinki.
Sample Collection and Hematological Assessment
All participants provided peripheral blood samples (5 mL) in EDTA tubes. Hematological parameters such as hemoglobin concentration, total white blood cell count (WBC), absolute lymphocyte count, and platelet count were determined using a Medonic hematology analyzer (Sweden). The Binet staging approach was used for clinical CLL staging [13].
DNA Extraction and Bisulfite Conversion
Genomic DNA was isolated from whole blood using a modified salting-out procedure, which is inexpensive and produces high-purity DNA appropriate for methylation investigations [14,15]. To conduct methylation analysis, 1 μg of genomic DNA was converted to sodium bisulfite using the EpiTect Fast Bisulfite Conversion Kit (Qiagen, Germany) per the manufacturer’s recommendations. This chemical modification converts unmethylated cytosine residues to uracil while leaving methylated cytosines unchanged, allowing for differential amplification in subsequent PCR steps.
Methylation Analysis
The methylation status of the E-Cadherin (CDH1) and MMP-9 gene promoters was assessed using two different techniques:
Methylation-Specific PCR (MSP) was used for E-Cadherin gene promoter analysis. Two sets of primers were employed [16]—one specific for the methylated sequence and another for the unmethylated version: Methylated CDH1 primers: Forward: 5’-GGTGAATTTTTAGTTAATTAGCCGGTAC-3’; Reverse: 5’-CATAACTAACCGAAAACGCCG-3’. Unmethylated CDH1 primers: Forward: 5’-GGTAGGTGAATTTTTAGTTAATTAGTGGTA-3’; Reverse: 5’-ACCCATAACTAACCAAAAACACCA-3’. PCR amplification was performed in a final volume of 25 µL with an initial denaturation at 95°C for 5 minutes, followed by 35 cycles of 94°C for 30 seconds, 52°C for 30 seconds (annealing), and 72°C for 30 seconds, with a final extension at 72°C for 7 minutes. Amplified products (204 bp for methylated and 211 bp for unmethylated alleles, Figure 1 and Figure 2) were analyzed by 2% agarose gel electrophoresis stained with safedye.
Methylation-Sensitive Restriction Enzyme PCR (MSRE-PCR) was used to determine the methylation status of the MMP-9 gene promoter using specific primers [17]: Forward: 5’-GCTTCATCCCCCTCCCTCC-3’ and Reverse: 5’-AGCACCAGGACCAGGGGC-3’. Genomic DNA was first digested with the restriction enzyme AciI, which selectively cuts unmethylated CpG sites. PCR was then conducted with the aid of thermal cycler (Applied Biosystems 2720, Singapore) under the following cycling conditions: 95°C for 5 minutes, followed by 35 cycles of 94°C for 30 seconds, annealing at 70°C for 30 seconds, and extension at 72°C for 30 seconds, with a final extension at 72°C for 10 minutes. A 369 bp product indicated a methylated promoter (uncut by the enzyme), whereas absence of amplification implied unmethylation due to enzyme digestion. PCR products were visualized using 100 bp DNA ladders as molecular markers on 2% agarose gels under UV illumination (Figure 3). Commercial methylated and unmethylated control DNA (EpiTect PCR Control DNA Set, Qiagen) were included in each batch of reactions to ensure assay reliability.
Because leukemic burden may vary between patients, potentially influencing methylation signal strength. band intensity was not used as a quantitative measure, and samples were classified according to predefined criteria: Presence of the 369 bp band after AciI digestion indicated methylation while absence or near-complete loss of amplification indicated unmethylation. Faint residual bands were interpreted relative to commercial methylated and unmethylated controls included in every batch.
Statistical Analysis
The data were processed with SPSS version 26.0 (IBM, USA). Categorical data were reported as frequencies and percentages, whereas continuous variables were presented as means ± standard deviation. The Chi-square test was used to compare categorical data and the independent sample t-test for continuous variables. A p-value of <0.05 was considered statistically significant.
3. Results
Patient Demographics and Clinical Features
This study included 70 newly diagnosed CLL patients (48 males and 22 females) and 70 age- and sex-matched healthy controls. The median age of patients was 62 years (range: 44–80 years), with a male predominance of 68.6 % (male-to-female ratio 2.18:1). The distribution of clinical stages according to Binet classification (Table 1) showed that most patients were in stage A (54.3 %), followed by stage B (28.6 %) and stage C (17.1 %). Female patients were more frequently diagnosed at stage A (77.3 %) compared with males (43.8 %, p = 0.022), suggesting earlier-stage disease among women. Hematological parameters revealed a predominance of mild anemia and moderate thrombocytopenia (Table 2).
E-Cadherin Promoter Methylation
Methylation-specific PCR showed E-Cadherin promoter methylation in 75.7 % (n = 53) of CLL patients and 77.1 % (n = 54) of healthy controls, revealing no significant difference (p = 0.91).Among patients, methylation was observed in 86.4 % (n=19) of females and 72.9 % (n=35) of males (p = 0.44). There were no significant associations between E-Cadherin methylation and hemoglobin, platelet, total white blood cells (WBC) count and advanced staging, however a significant association was found with absolute lymphocyte count (p = 0.01) (Table 3).
MMP-9 Promoter Methylation
In contrast to E-Cadherin, significant differences in methylation status were observed for the MMP-9 gene promoter. Methylation-sensitive restriction enzyme PCR revealed that 70.0% (n = 49) of CLL patients had methylated MMP-9 promoters, compared to 100% (n = 70) of controls (p = 0.001), indicating that promoter hypomethylation is significantly associated with the disease. The remaining 30% (n = 21) of patients exhibited unmethylated MMP-9 promoters, a pattern not seen in any control sample.
Unmethylated MMP-9 was significantly associated with female gender (≈ 53 % vs. 19 % in males, p = 0.02), lower hemoglobin levels (p = 0.031), lower platelet counts (p = 0.001), and higher lymphocyte counts (p = 0.035) (Table 4). No significant differences were observed for WBC, or clinical stage (p > 0.05). These findings imply that MMP-9 promoter demethylation may be linked to particular clinical and biological features, particularly thrombocytopenia, anemia and gender-related differences, although it may not directly reflect disease stage.
4. Discussion
Epigenetic dysregulation, particularly aberrant DNA methylation, is increasingly recognized as a fundamental mechanism in the pathogenesis of CLL. Unlike genetic mutations, epigenetic alterations are potentially reversible and may reflect both the cellular origin of the leukemic clone and its interaction with the tumor microenvironment. In CLL, DNA methylation abnormalities include promoter-specific hypermethylation, regional hypomethylation, and disease-associated methylation signatures, all of which may contribute to biological heterogeneity and variable clinical behavior [3,4].
DNA methylation typically occurs at CpG dinucleotides within promoter regions and is generally associated with transcriptional repression. Promoter hypermethylation of tumor suppressor genes can result in gene silencing and contribute to oncogenesis [3]. In hematologic malignancies, aberrant methylation patterns complement genetic alterations and participate in leukemogenesis [2]. However, methylation changes are context-dependent. While hypermethylation may silence tumor suppressor genes, hypomethylation may activate oncogenic or pro-survival genes. Therefore, the biological consequence of methylation depends on the functional role of the affected gene.
E-Cadherin (CDH1) is a well-established tumor suppressor gene frequently silenced by promoter hypermethylation in solid tumors, where it contributes to epithelial–mesenchymal transition and tumor progression [8]. In the present study, E-Cadherin promoter methylation was detected at comparable frequencies in both CLL patients and healthy controls, suggesting that CDH1 methylation may represent a non-specific or age-related epigenetic event rather than a leukemia-specific driver alteration. Similar observations have been reported in other malignancies, where CDH1 methylation does not uniformly correlate with malignant transformation [16]. Although E-Cadherin may influence cellular adhesion and leukemic cell–microenvironment interactions [7], our findings do not support a significant pathogenic or prognostic role in CLL.
In contrast, MMP-9 promoter hypomethylation was significantly more frequent in CLL patients than in controls. Matrix metalloproteinase-9 (MMP-9) plays a central role in extracellular matrix degradation, tissue remodeling, and cellular migration [9]. Beyond its proteolytic function, MMP-9 has been shown to promote leukemic B-cell survival. Redondo-Muñoz et al. demonstrated that MMP-9 enhances CLL cell survival through its hemopexin domain, supporting its functional relevance in disease biology [10]. From an epigenetic perspective, promoter hypomethylation is often associated with increased transcriptional activity. Campos et al. reported that hypomethylation of the MMP9 promoter correlates with elevated MMP-9 mRNA levels, further supporting a mechanistic link between methylation status and gene expression [17].
The significant association observed between unmethylated MMP-9 and anemia, thrombocytopenia, and higher lymphocyte counts suggests that epigenetic activation of MMP-9 may contribute to enhanced leukemic expansion and marrow microenvironment disruption. Cytopenias in CLL frequently reflect bone marrow infiltration and altered stromal interactions [1]. Although no statistically significant association was identified between MMP-9 methylation and Binet stage [13], clinical staging systems primarily reflect tumor burden rather than molecular or epigenetic alterations. Therefore, methylation changes may represent early or independent biological events not fully captured by clinical staging.
CLL is characterized by substantial biological heterogeneity driven by cytogenetic abnormalities and molecular features [5]. Increasing evidence indicates that epigenetic signatures may further distinguish biologically distinct subgroups. DNA methylation profiling studies suggest that CLL methylation patterns may correlate with cellular origin and disease aggressiveness [2]. Although methylation-based stratification is not yet incorporated into routine clinical practice, it represents a promising complementary approach to established prognostic markers.
From a therapeutic perspective, epigenetic alterations are potentially reversible. DNA methyltransferase inhibitors such as azacitidine and decitabine are approved for other hematologic malignancies and function by inducing DNA hypomethylation and reactivating silenced tumor suppressor genes. However, their role in CLL remains investigational. Importantly, global hypomethylating therapy may have complex biological effects. In cases where hypomethylation activates pro-survival genes such as MMP-9, indiscriminate demethylation could theoretically enhance oncogenic signaling. Therefore, epigenetic targeting in CLL would likely require careful molecular stratification and rational combination strategies.
In summary, our findings suggest that not all methylation events in CLL are disease-specific. The functional impact of methylation depends on the biological role of the affected gene. While E-Cadherin methylation appears non-specific, MMP-9 promoter hypomethylation may represent a biologically meaningful alteration associated with leukemic cell survival and cytopenia. Prospective longitudinal and functional validation studies are necessary to determine whether MMP-9 methylation status possesses independent prognostic or therapeutic significance.
Despite the relevance of the findings, several limitations should be acknowledged. First, the sample size was relatively modest, which may have limited the statistical power to detect additional or weaker associations. Second, the study was designed as a cross-sectional case–control investigation focusing exclusively on newly diagnosed CLL patients at baseline. Consequently, longitudinal follow-up data were not available at the time of analysis, precluding assessment of survival outcomes, time-to-first-treatment, disease progression, or treatment response. Furthermore, the study did not incorporate gene expression or protein-level analyses to directly correlate promoter methylation status with functional consequences. The absence of mRNA quantification and protein assays limits the ability to confirm whether the observed methylation alterations translate into biologically meaningful changes in gene activity. Future studies incorporating mRNA expression profiling and protein evaluation methods—such as ELISA, Western blotting, or immunohistochemistry—would strengthen the mechanistic interpretation of these findings. The absence of B-cell purification may introduce cellular heterogeneity and those future studies should include cell-sorted populations (e.g., CD19+ selection). Finally, the methods used in the current study, may not detect low-level subclonal methylation differences, that is why high-resolution techniques such as bisulfite sequencing or methylation arrays would provide more detailed quantitative assessment.
Prospective longitudinal studies with larger cohorts are warranted to determine whether these epigenetic markers possess independent prognostic value and can reliably predict disease progression or therapeutic response in CLL.
5. Conclusions
Methylation of E-Cadherin promoter was common in both CLL patients and healthy controls, indicating it is not specific or useful for CLL diagnosis or prognosis. In contrast, MMP-9 promoter hypomethylation was significantly more frequent in CLL patients and was associated with lower platelet counts, lower Hemoglobin levels, higher lymphocytes count and female gender, suggesting a link to disease aggressiveness and possible gender-related differences. These results propose MMP-9 promoter methylation as a potential biomarker for CLL progression, though further longitudinal and functional studies are needed to confirm its clinical significance.
Funding
This research received no external funding.
Institutional Review Board Statement
the study was approved by the Research and Ethics Committee of the College of Medicine, University of Duhok (Approval No. 26062022-5-12). All participants provided written informed consent prior to sample collection, in accordance with the Declaration of Helsinki.
Informed Consent Statement
Informed consent was obtained from all subjects involved in the study.
Data Availability Statement
Data available on request.
Acknowledgments
Not applicable.
Conflicts of Interest
The authors declare no conflicts of interest.
References
- Hallek, M. Chronic lymphocytic leukemia: 2020 update on diagnosis, risk stratification and treatment. Am J Hematol. 2019, 94, 1266–1287. [Google Scholar] [CrossRef] [PubMed]
- Saeed, W.H.; Eissa, A.A.; Al-Doski, A.A. Impact of TP53 gene promoter methylation on chronic lymphocytic leukemia pathogenesis and progression. J Blood Med. 2019, 10, 399–404. [Google Scholar] [CrossRef] [PubMed]
- Esteller, M. Epigenetics in cancer. N Engl J Med. 2008, 358, 1148–1159. [Google Scholar] [CrossRef] [PubMed]
- Calin, G.A.; Dumitru, C.D.; Shimizu, M.; Bichi, R.; Zupo, S.; Noch, E.; et al. Frequent deletions and down-regulation of micro- RNA genes miR15 and miR16 at 13q14 in chronic lymphocytic leukemia. Proc Natl Acad Sci U S A 2002, 99, 15524–15529. [Google Scholar] [CrossRef] [PubMed]
- Abruzzo, L.V.; Herling, C.D.; Calin, G.A.; Oakes, C.; Barron, L.L.; Banks, H.E.; et al. Trisomy 12 chronic lymphocytic leukemia expresses a unique set of activated and targetable pathways. Haematologica 2018, 103, 2069–2078. [Google Scholar] [CrossRef] [PubMed]
- Berx, G.; Van Roy, F. The E-cadherin/catenin complex: an important gatekeeper in breast cancer tumorigenesis and malignant progression. Breast Cancer Res. 2001, 3, 289–293. [Google Scholar] [CrossRef] [PubMed]
- Calissano, C.; Damle, R.N.; Hayes, G.; Murphy, E.J.; Hellerstein, M.K.; Moreno, C.; et al. In vivo intraclonal and interclonal kinetic heterogeneity in B-cell chronic lymphocytic leukemia. Blood 2009, 114, 4832–4842. [Google Scholar] [CrossRef] [PubMed]
- Graff, J.R.; Herman, J.G.; Lapidus, R.G.; Chopra, H.; Xu, R.; Jarrard, D.F.; et al. E-cadherin expression is silenced by DNA hypermethylation in human breast and prostate carcinomas. Cancer Res. 1995, 55, 5195–5199. [Google Scholar] [PubMed]
- Vandooren, J.; Van den Steen, P.E.; Opdenakker, G. Biochemistry and molecular biology of gelatinase B or matrix metalloproteinase-9 (MMP-9): the next decade. Crit Rev Biochem Mol Biol. 2013, 48, 222–272. [Google Scholar] [CrossRef] [PubMed]
- Redondo-Muñoz, J.; Ugarte-Berzal, E.; Terol, M.J.; Van den Steen, P.E.; Hernández del Cerro, M.; Roderfeld, M.; et al. Matrix metalloproteinase-9 promotes chronic lymphocytic leukemia B cell survival through its hemopexin domain. Cancer Cell. 2010, 17, 160–172. [Google Scholar] [CrossRef] [PubMed]
- Aitchison, E.E.; Dimesa, A.M.; Shoari, A. Matrix metalloproteinases in glioma: Drivers of invasion and therapeutic targets. BioTech 2025, 14, 28. [Google Scholar] [CrossRef] [PubMed]
- Swerdlow, S.H.; Campo, E.; Harris, N.L.; Jaffe, E.S.; Pileri, S.; Stein, H.; et al. WHO classification of tumours of haematopoietic and lymphoid tissues (Revised 4th edition); IARC: Lyon, 2017; pp. 285–290. [Google Scholar]
- Binet, J.-L.; Catovsky, D.; Chandra, P.; Dighiero, G.; Montserrat, E.; et al. Chronic lymphocytic leukaemia: proposals for a revised prognostic staging system. Report from the International Workshop on CLL. Br J Haematol. 1981, 48, 365–367. [Google Scholar] [CrossRef] [PubMed]
- Kashmoola, M.; Eissa, A.; Al-Takay, D.; Al-Allawi, N. Molecular characterization of G6PD deficient variants in Nineveh province, Northwestern Iraq. Indian Journal of Hematology and Blood Transfusion 2015, 31, 133–136. [Google Scholar] [CrossRef] [PubMed]
- Iranpur-Mubarakeh, V.; Esmailizadeh, A.K. Rapid extraction of high-quality DNA from whole blood stored at 4°C for long period. Protocol Online, 2010. Available online: http://www.protocol-online.org/prot/Protocols/Rapid-Extraction-of-High-Quality-DNA-from-Whole-Blood-Stored-at-4-C-for-Long-Period-4175.html.
- Starska, K.; Forma, E.; Lewy-Trenda, I.; Papież, P.; Woś, J.; Bryś, M. Diagnostic impact of promoter methylation and E-cadherin gene and protein expression levels in laryngeal carcinoma. Contemp Oncol 2013, 17, 263–271. [Google Scholar] [CrossRef] [PubMed]
- Campos, K.; Gomes, C.C.; Farias, L.C.; Silva, R.M.; Letra, A.; Gomez, R.S. DNA methylation of MMP9 is associated with high levels of MMP-9 messenger RNA in periapical inflammatory lesions. J Endod. 2016, 42, 127–130. [Google Scholar] [CrossRef] [PubMed]
Figure 1.
Gel electrophoresis for the detection of E-Cadherin methylation status. Lane 1: represents 100-1500bp ladder; Lane 2; Methylated commercial E-Cadherin control DNA (204bps); Lane 3; Un-methylated commercial E-Cadherin control DNA. Lane 4&6: disclose Methylated E-Cadherin DNA patient samples; and lane 5: represents um-methylated E-Cadherin DNA patient samples.
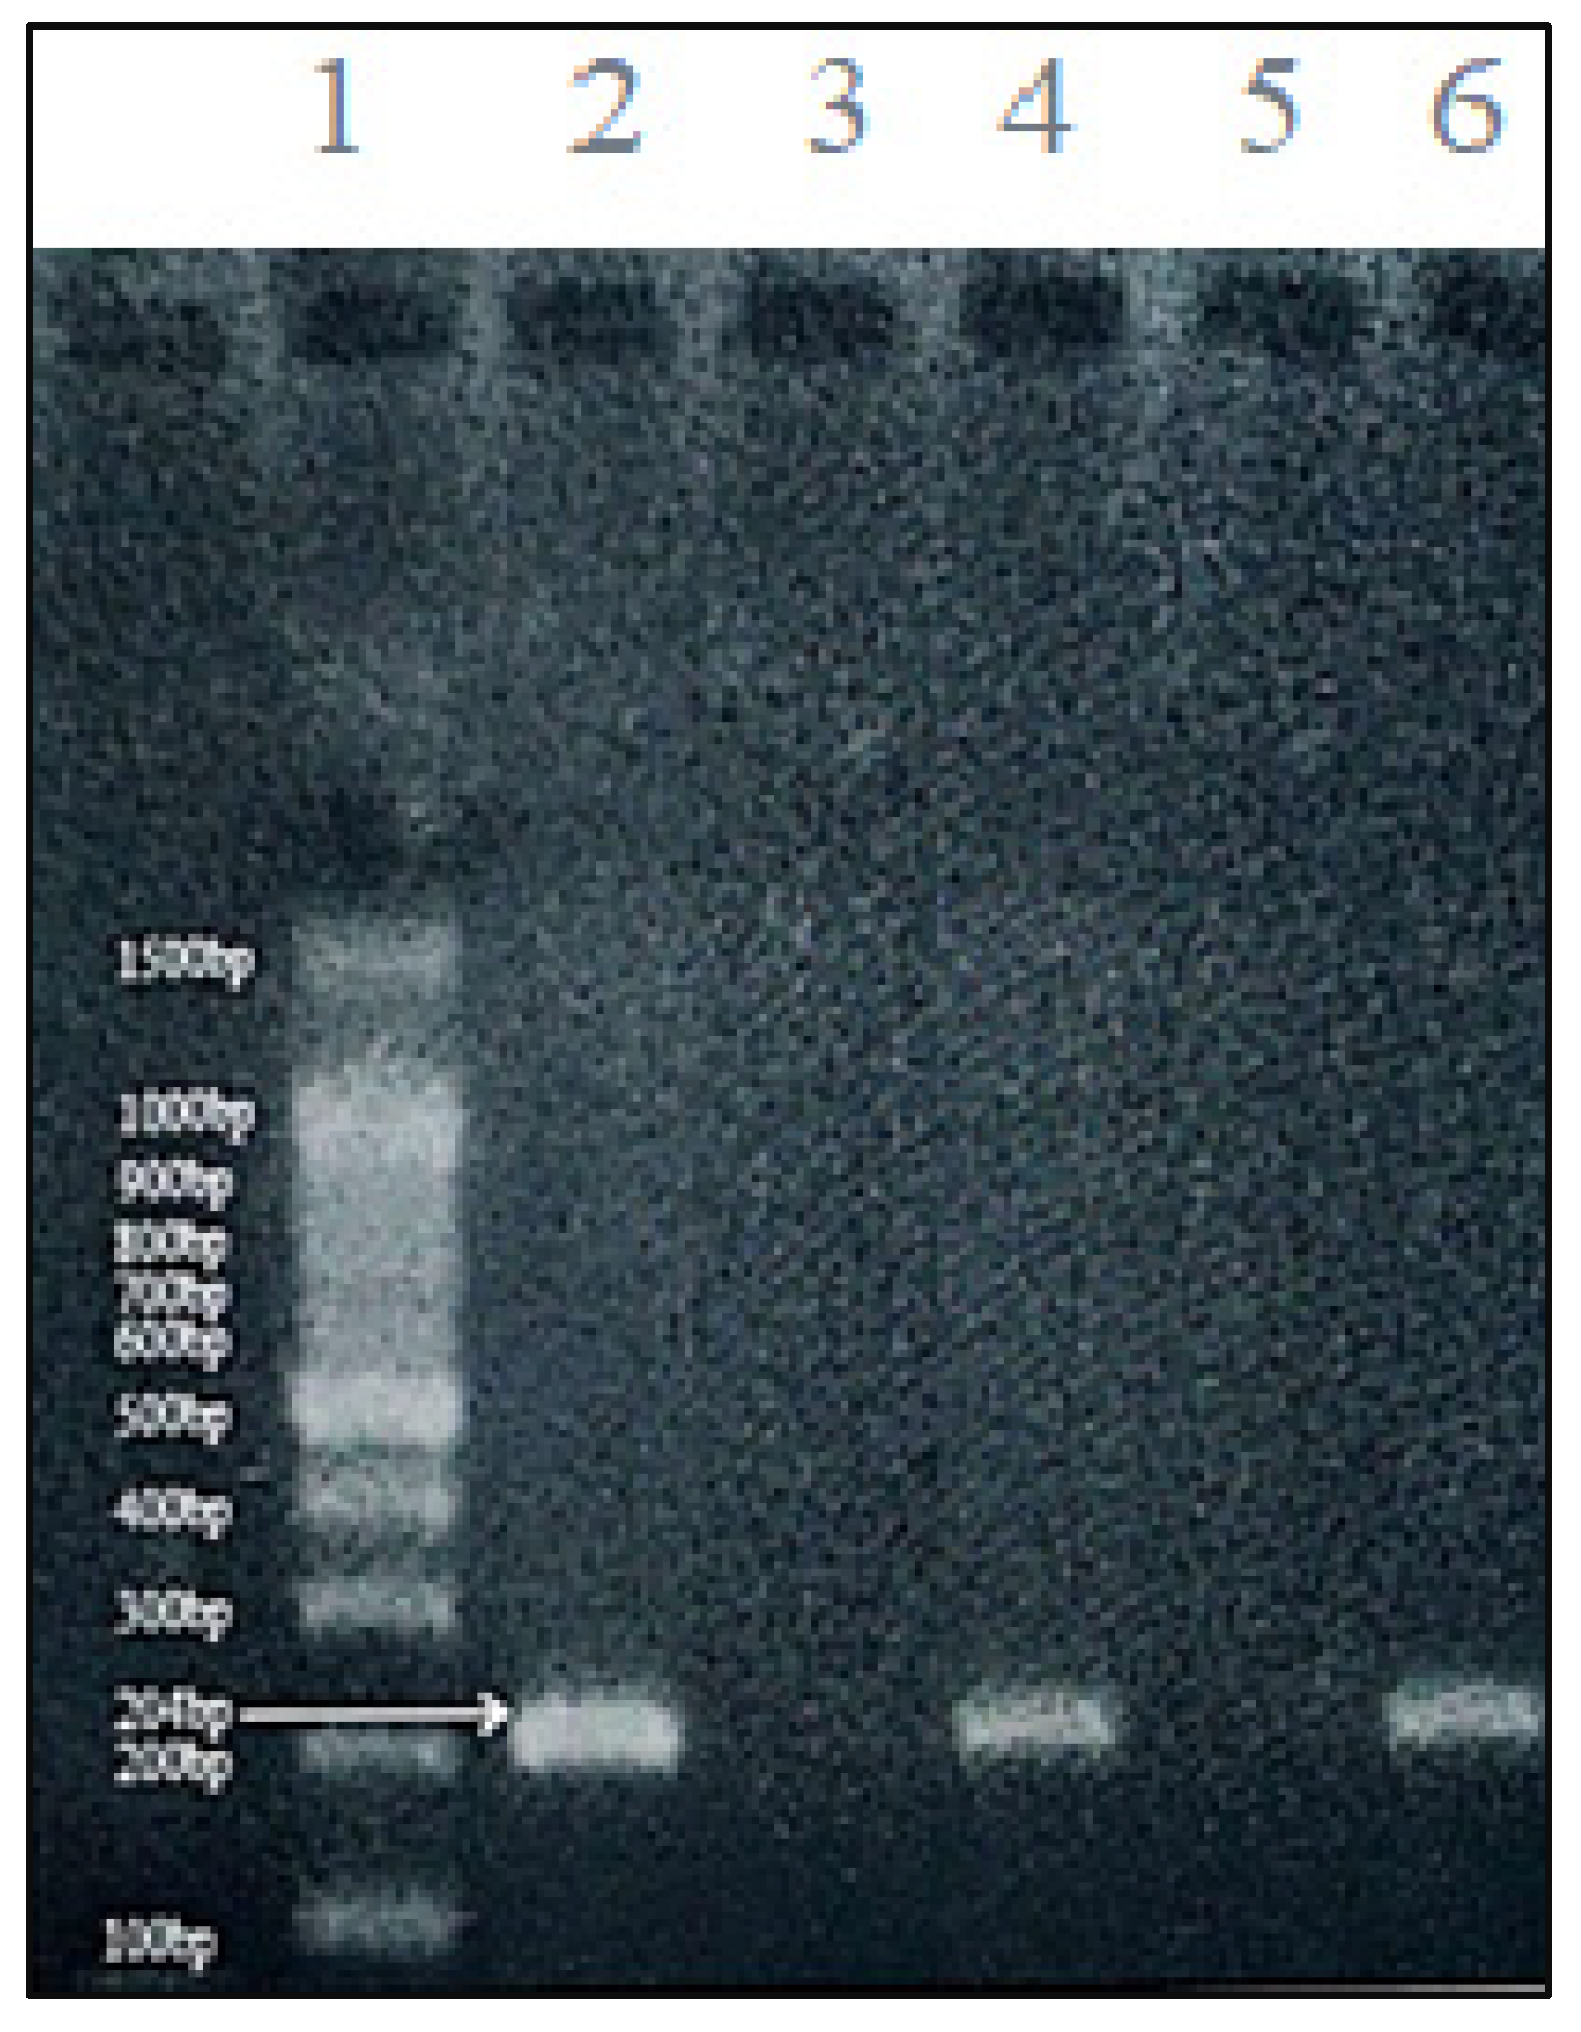
Figure 2.
Gel electrophoresis for the detection of E-Cadherin methylation status. Lane 1: represents 100-1500bp ladder; Lane 2: Un-methylated commercial E-Cadherin control DNA (211bps); Lane 3: Methylated commercial E-Cadherin control DNA. Lane 4: represents Methylated E-Cadherin DNA patient samples. Lane 5&6 disclose reveal Um-methylated E-Cadherin DNA patient samples.
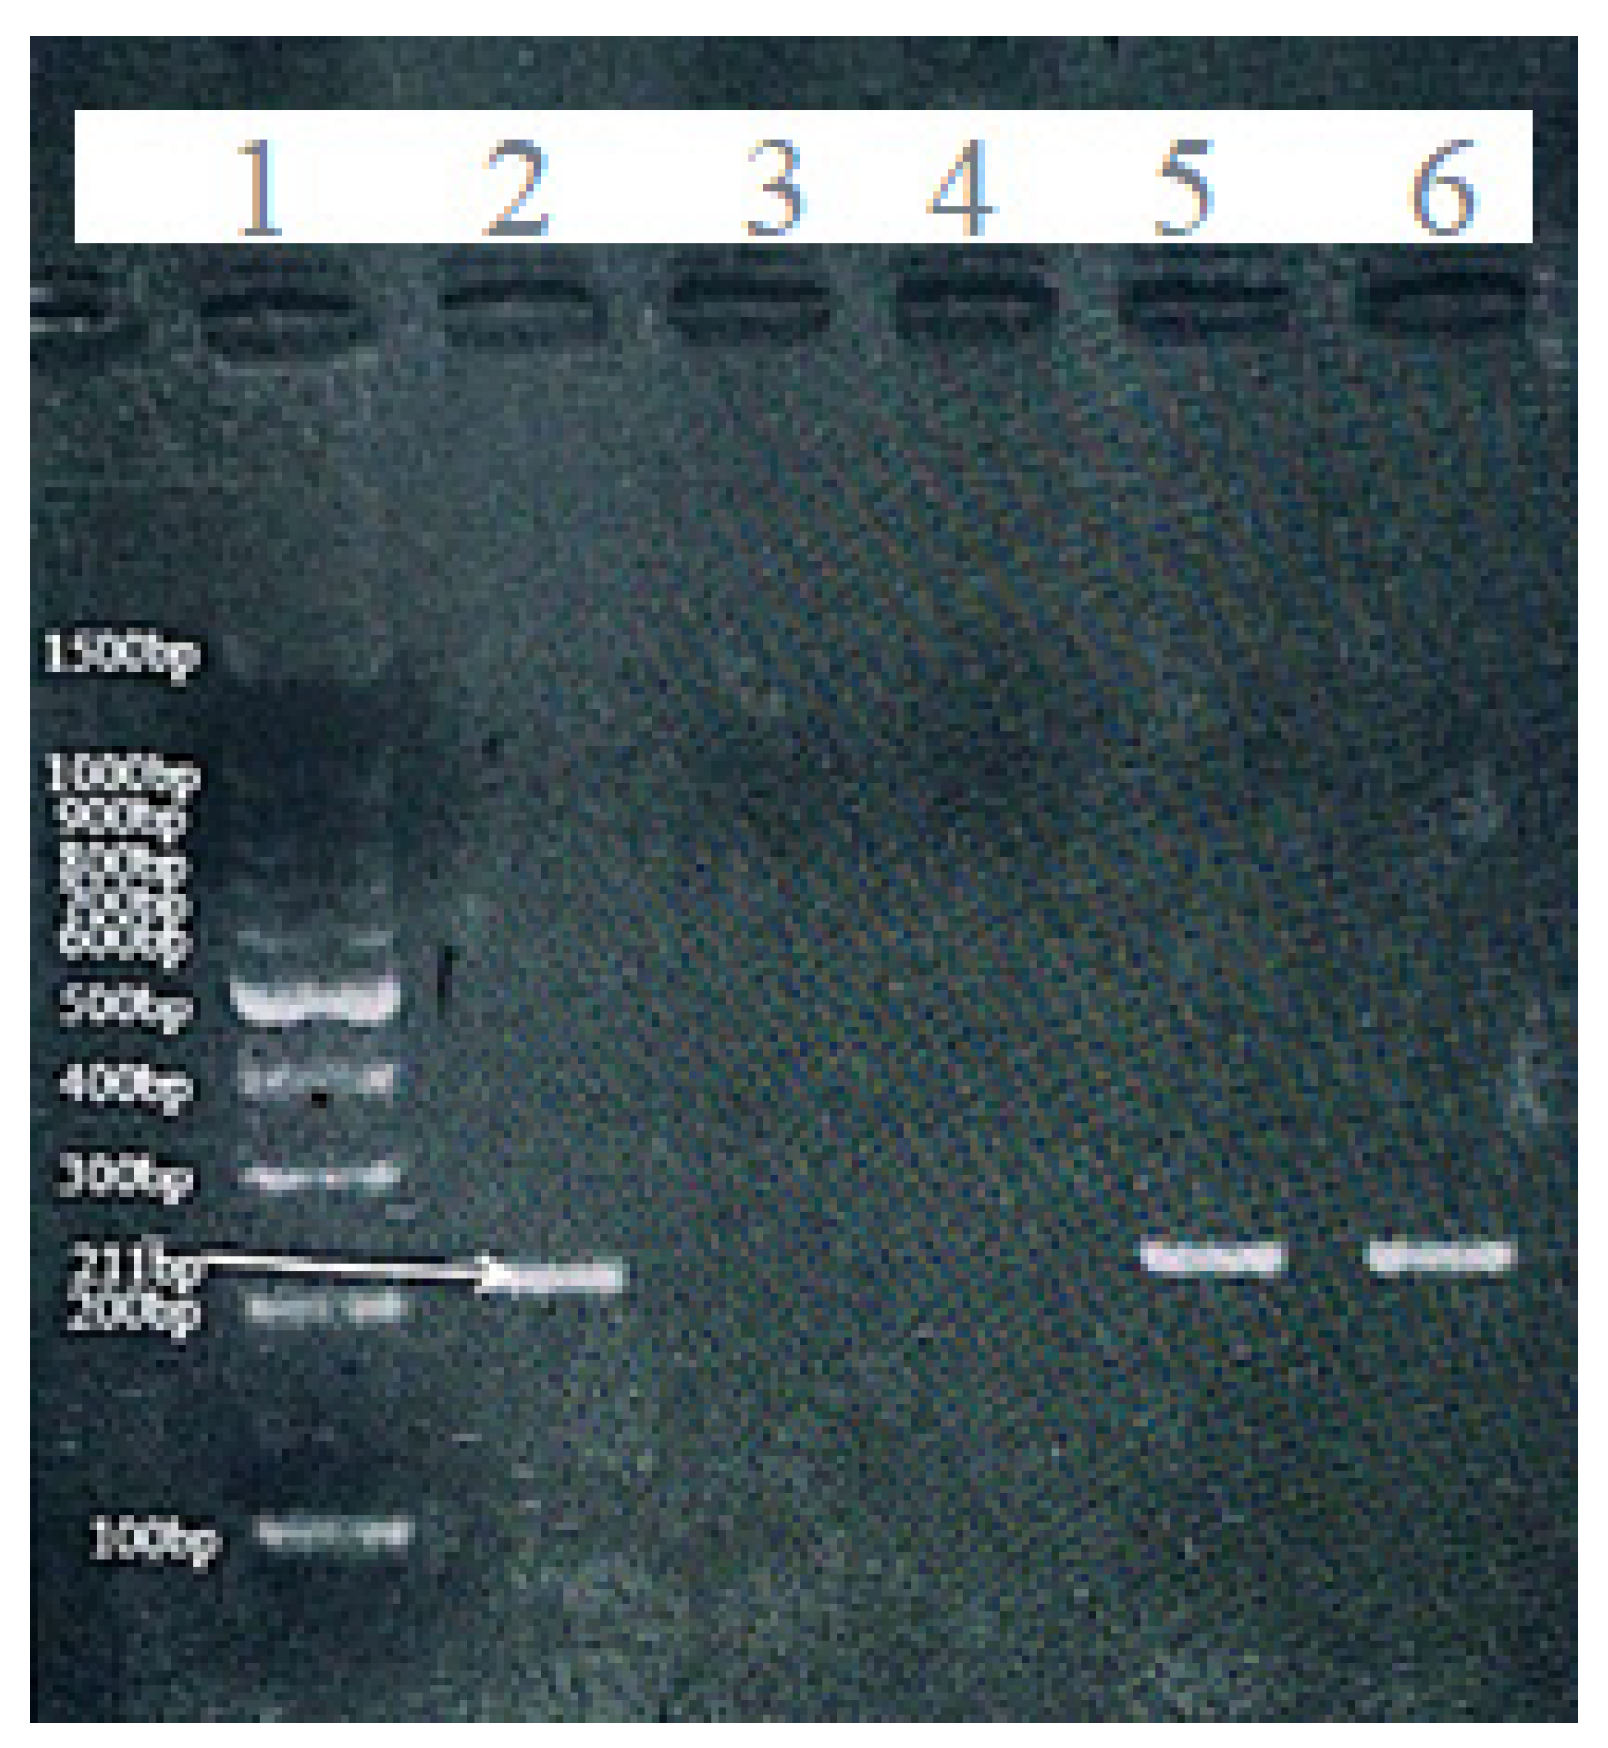
Figure 3.
Gel electrophoresis of MMP-9 suing MSRE-PCR. Lane 1: 100-1500bp ladder. Lane2: methylated commercial MMP-9 control DNA (369bps). Lane 3: Un-Methylated commercial MMP-9 control DNA. Lane 4,5,7: methylated MMP-9 DNA patient samples; and Lane 6: Un-Methylated MMP-9 DNA patient sample.
Figure 3.
Gel electrophoresis of MMP-9 suing MSRE-PCR. Lane 1: 100-1500bp ladder. Lane2: methylated commercial MMP-9 control DNA (369bps). Lane 3: Un-Methylated commercial MMP-9 control DNA. Lane 4,5,7: methylated MMP-9 DNA patient samples; and Lane 6: Un-Methylated MMP-9 DNA patient sample.
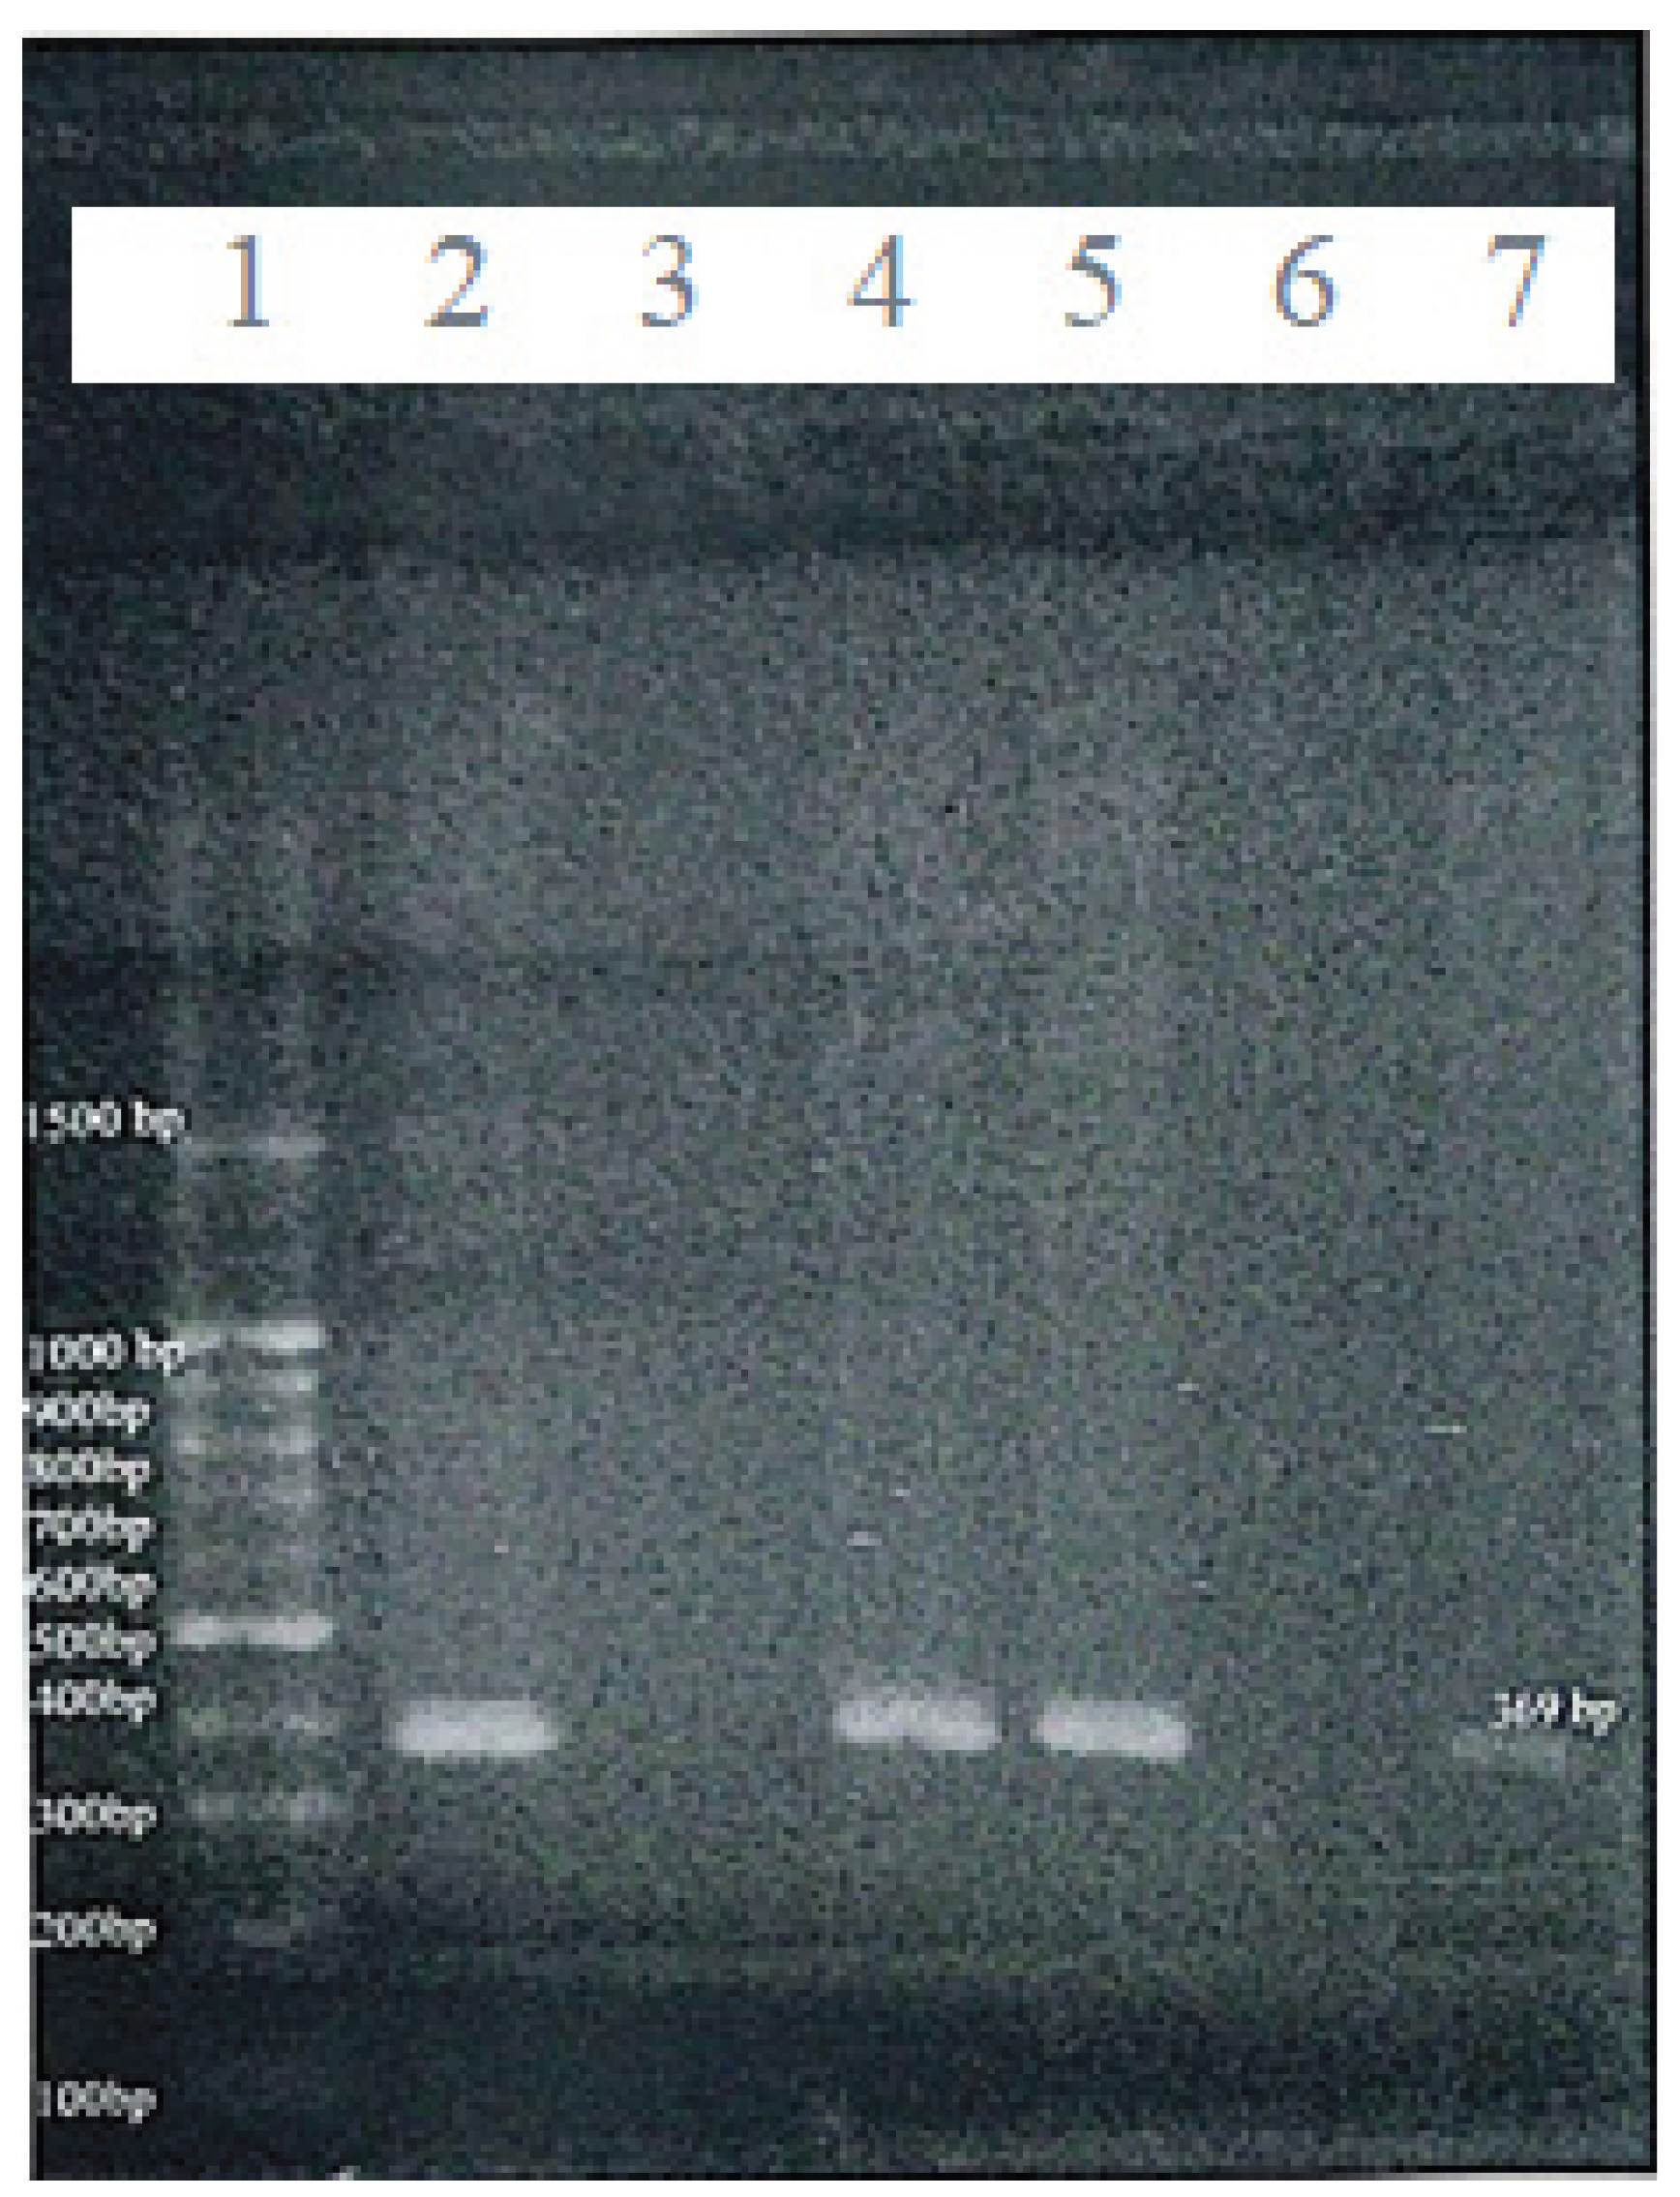

Table 1.
Binet stage distribution in relation to gender (n = 70).
| Stage | Males n (%) | Females n (%) | Total n (%) | p-value |
|---|---|---|---|---|
| A | 21 (43.8%) | 17 (77.3%) | 38 (54.3%) | 0.022 |
| B | 16 (33.3%) | 4 (18.2%) | 20 (28.6%) | |
| C | 11 (22.9%) | 1 (4.5%) | 12 (17.1%) | |
| Total | 48 (100%) | 22 (100%) | 70 (100%) |
Table 2.
Hematological parameters of CLL patients (n = 70).
| Parameter | Category | n (%) |
|---|---|---|
| Hemoglobin (g/L) | Normal (>120) | 30 (42.9%) |
| Mild anemia (100–120) | 31 (44.3%) | |
| Severe anemia (<100) | 9 (12.9%) | |
| Platelet count ×10⁹/L | >150 | 36 (51.4%) |
| 100–150 | 21 (30.0%) | |
| <100 | 13 (18.6%) | |
| WBC ×10⁹/L | <50 | 65 (92.9%) |
| 50–100 | 4 (5.7%) | |
| >100 | 1 (1.4%) | |
| Lymphocyte count ×10⁹/L | 5–20 | 34 (48.6%) |
| 20–50 | 32 (45.7%) | |
| >50 | 4 (5.7%) |
Table 3.
Relationship of E-Cadherin gene methylation to hematological parameters and stage (n = 70).
Table 3.
Relationship of E-Cadherin gene methylation to hematological parameters and stage (n = 70).
| Parameter | Methylated n (%) | Unmethylated n (%) | Total n (%) | χ² | p-value* |
|---|---|---|---|---|---|
| Hemoglobin (g/L) | |||||
| >120 | 26 (37.1%) | 4 (5.7%) | 30 (42.9%) | 3.099 | 0.212 |
| 100–120 | 21 (30.0%) | 10 (14.3%) | 31 (44.3%) | ||
| <100 | 7 (10.0%) | 2 (2.9%) | 9 (12.9%) | ||
| Platelet count ×10⁹/L | |||||
| >150 | 30 (42.9%) | 6 (8.6%) | 36 (51.4%) | 2.588 | 0.274 |
| 100–150 | 16 (22.9%) | 5 (7.1%) | 21 (30.0%) | ||
| <100 | 8 (11.4%) | 5 (7.1%) | 13 (18.6%) | ||
| WBC ×10⁹/L | |||||
| <50 | 48 (68.6%) | 16 (22.9%) | 64 (91.4%) | 1.944 | 0.378 |
| 50–100 | 4 (5.7%) | 0 | 4 (5.7%) | ||
| >100 | 2 (2.9%) | 0 | 2 (2.9%) | ||
| Lymphocytes ×10⁹/L | |||||
| 5–20 | 21 (30.0%) | 13 (18.6%) | 34 (48.6%) | 9.044 | 0.011 |
| 20–50 | 29 (41.4%) | 3 (4.3%) | 32 (45.7%) | ||
| >50 | 4 (5.7%) | 0 | 4 (5.7%) | ||
| Stage (Binet) | |||||
| A | 29 (41.4%) | 9 (12.9%) | 38 (54.3%) | 0.555 | 0.758 |
| B | 14 (20.0%) | 5 (7.1%) | 19 (27.1%) | ||
| C | 11 (15.7%) | 2 (2.9%) | 13 (18.6%) | ||
*Significant at p < 0.05.
Table 4.
Relationship of MMP-9 gene methylation to hematological parameters and stage (n = 70).
| Parameter | Methylated n (%) | Unmethylated n (%) | Total n (%) | χ² | p-value |
|---|---|---|---|---|---|
| Hemoglobin (g/L) | |||||
| >120 | 26 (37.1%) | 4 (4.7%) | 30 (42.9%) | 6.87 | 0.031 |
| 100–120 | 18 (25.7%) | 13 (18.6%) | 31 (44.3%) | ||
| <100 | 5 (7.1%) | 4 (5.7%) | 9 (12.9%) | ||
| Platelet count ×10⁹/L | |||||
| >150 | 31 (44.3%) | 5 (7.1%) | 36 (51.4%) | 14.93 | 0.001 |
| 100–150 | 8 (11.4%) | 13 (18.6%) | 21 (30.0%) | ||
| <100 | 10 (14.3%) | 3 (4.3%) | 13 (18.6%) | ||
| WBC ×10⁹/L | |||||
| <50 | 47 (67.1%) | 18 (25.7%) | 65 (92.9%) | 4.45 | 0.108 |
| 50–100 | 1 (1.4%) | 3 (4.3%) | 4 (5.7%) | ||
| >100 | 1 (1.4%) | 0 | 1 (1.4%) | ||
| Lymphocytes ×10⁹/L | |||||
| 5–20 | 27 (38.6%) | 6 (8.6%) | 33 (47.1%) | 6.69 | 0.035 |
| 20–50 | 21 (30.0%) | 12 (17.1%) | 33 (47.1%) | ||
| >50 | 1 (1.4%) | 3 (4.3%) | 4 (5.7%) | ||
| Stage (Binet) | |||||
| A | 23 (32.9%) | 14 (20.0%) | 37 (52.9%) | 3.23 | 0.199 |
| B | 17 (24.3%) | 3 (4.3%) | 20 (28.6%) | ||
| C | 9 (12.9%) | 4 (5.7%) | 13 (18.5%) | ||
*P value < 0.05 considered to be significant.
Disclaimer/Publisher’s Note: The statements, opinions and data contained in all publications are solely those of the individual author(s) and contributor(s) and not of MDPI and/or the editor(s). MDPI and/or the editor(s) disclaim responsibility for any injury to people or property resulting from any ideas, methods, instructions or products referred to in the content. |
© 2026 by the author. Licensee MDPI, Basel, Switzerland. This article is an open access article distributed under the terms and conditions of the Creative Commons Attribution (CC BY) license.
Copyright: This open access article is published under a Creative Commons CC BY 4.0 license, which permit the free download, distribution, and reuse, provided that the author and preprint are cited in any reuse.


