Submitted:
19 February 2026
Posted:
25 February 2026
You are already at the latest version
Abstract
Wheat streak mosaic (WSM), historically attributed to wheat streak mosaic virus (WSMV) and transmitted by the wheat curl mite (WCM; Aceria tosichella), remains a major cause of yield loss in the Texas High Plains. In recent years, Triticum mosaic virus (TriMV), also transmitted by WCM, has emerged as an increasingly important component of the WSM disease complex. Under field conditions, TriMV is most frequently detected in mixed infections with WSMV. Management of WSM relies primarily on resistant cultivars carrying genes such as Wsm1 or Wsm2. Although synergistic interactions between WSMV and TriMV have been documented under controlled conditions, their dynamics during natural field infections—particularly during the latent phase between initial infection and symptom development—remain poorly understood. Moreover, the extent to which host genotype influences virus–virus interactions and vector acquisition dynamics in the field has not been fully resolved. Replicated field trials conducted over two growing seasons were used to quantify temporal accumulation patterns and relative ratios of WSMV and TriMV in susceptible (TAM 304) and resistant cultivars differing in resistance source (BT [Wsm1] and Joe [Wsm2]) under natural disease spread. WSMV remained the predominant virus in mixed infections across cultivars, sampling times, and disease stages. However, as plants aged and entered senescence, WSMV titers declined more rapidly than TriMV titers, resulting in a progressive reduction in the WSMV-to-TriMV ratio. From early in-fection through disease development, the Wsm1 cultivar (BT) consistently supported significantly lower TriMV accumulation than the Wsm2 cultivar (Joe), providing a mechanistic explanation for the comparatively stronger disease suppression associated with WSM. Mites feeding on BT also acquired lower TriMV titers. Although viral con-centrations in wheat tissue were strongly correlated with those detected in feeding mites, substantial differences in plant-level WSMV-to-TriMV ratios among cultivars were not mirrored within the vector. These findings indicate that while host resistance regulates absolute virus accumulation, vector-associated factors may influence the relative pro-portions of viruses detected following acquisition, with important implications for WSM epidemiology and resistance deployment in field systems.
Keywords:
Wsm1
; Wsm2 genes
; wheat genetics
; and virus-virus interaction in host and vector
1. Introduction
In the Texas Panhandle, hard red winter wheat—grown on approximately three million acres for both grain production and winter cattle grazing—faces persistent pressure from wheat streak mosaic (WSM) [1]. This disease complex is caused by wheat streak mosaic virus (WSMV), Triticum mosaic virus (TriMV), or their co-infection, with both viruses transmitted by the wheat curl mite (Aceria tosichella). Although WSMV has historically been the dominant pathogen, TriMV has expanded rapidly in the region since 2008 and is now frequently detected in mixed infections in commercial fields [2,3]. WSM severely reduces plant vigor, causing mosaic symptoms, chlorotic streaking, and stunting; early-season infection can result in plant death and substantial forage and grain losses. Reported economic losses in 2010 ranged from $118.1 to $464.5 per hectare [1]. Irrigated systems, which account for roughly one-third of regional wheat acreage, are particularly vulnerable due to compromised water use efficiency in infected plants [4].
Production practices further influence disease risk. Wheat is planted from late August through mid-September to maximize fall forage, but early planting increases exposure to the “green bridge,” a continuum of volunteer wheat and grassy hosts that sustains wheat curl mite (WCM) populations and virus reservoirs [5,6,7,8,9,10]. Wind-dispersed mites move from surrounding vegetation into newly established fields, often initiating infections at field margins [11]. As temperatures rise in spring, WCM generation time shortens to 7–10 days, accelerating population growth and virus spread [12,13]. Management options are limited: no acaricides are registered for effective in-season control, and host resistance—primarily through Wsm1 or Wsm2—can be temperature sensitive, often diminishing above 27 °C [14,15,16].
Mixed infection by WSMV and TriMV is associated with synergistic interactions that increase viral titers and exacerbate symptom severity relative to single infections [17,18]. While viral accumulation has been well characterized in late-stage symptomatic plants, less is known about early infection dynamics under field conditions, particularly regarding how host genotype influences virus–virus interactions and vector acquisition during disease establishment. Because earlier infection is strongly associated with greater yield loss [8,9], understanding these early spatiotemporal dynamics is critical for epidemiological modeling and resistance deployment.
The present study evaluated seasonal changes in WSMV and TriMV accumulation and relative ratios in susceptible and resistant wheat cultivars as disease spread naturally from a trap wheat strip. We quantified viral titers in both plant tissues and feeding WCM populations to assess how host genotype and infection timing influence virus–virus and virus–vector interactions under field conditions.
2. Materials and Methods
The experiment was conducted during the 2021–2022 wheat growing season in Bushland, Texas, under a center-pivot irrigation system. A 9-m-wide strip of TAM 304 wheat was planted in July along the southern edge of the experimental field to serve as a trap crop for wheat curl mites (WCM). This strip functioned as a natural inoculum source for WSMV and TriMV for the main experimental plots, which were planted in September 2021.
A panel of three wheat cultivars was evaluated, including two single-gene resistant cultivars, Breakthrough (BT; Wsm1) and Joe (Wsm2), and one susceptible cultivar, TAM 304. Cultivars were planted in three replications in a randomized complete block design in straight rows approximately 980 ft in length. Prior to symptom development (February 2022), flags were installed at 100-ft intervals along each block (locations L1–L9), with L1 positioned closest to the trap strip.
Immediately after symptom development in the trap strip, plant and mite samples were collected to confirm mixed infection (WSMV, TriMV, and HPWMoV) in the trap crop. HPWMoV was not detected in experimental plot samples and was therefore excluded from further analyses. As disease spread progressed—typically from field margins inward due to wind-mediated mite dispersal [11,19]—plant sampling was conducted weekly at each flagged location for seven consecutive weeks. The experimental unit for plant-level analyses was the flagged plot location within each replication. Collected plant samples were analyzed by quantitative PCR (qPCR) to determine WSMV and TriMV titers and their relative ratios using absolute quantification with standard curves as described by Bryan et al. (2019) [3].
The experiment was repeated during the 2022–2023 growing season. Although WSM symptoms typically emerge between May and July, unusually heavy rainfall in May and June 2023 limited field access during early infection stages. As a result, data collection in the second season was restricted to a three-week period from late May to mid-June.
During the 2021–2022 season, virus accumulation and titer ratios were also quantified in WCM and the plants they infested. Symptomatic plants exhibiting characteristic mite feeding damage were collected from five flagged positions closest to the trap strip. Using a fine brush, 15–25 mites of mixed developmental stages were collected from individual plants, and the specific plant tissues on which mites were actively feeding were sampled separately. Pooling of mites was necessary to obtain sufficient RNA for reliable qPCR quantification from field-collected samples. Samples were placed in 1.5 mL centrifuge tubes and stored at −80 °C until analysis. Mites were collected from five plants per cultivar, with two sampling events during the mid-season (n = 10 per cultivar). Viral loads and ratios in mite and plant samples were quantified using qPCR as described by Bryan et al. (2019) [3].
2.1. Data Analysis
Data analyses were conducted in R version 3.6.0 [20]. Because of the significant rainfall event during the 2022–2023 season, data from the two growing seasons were analyzed separately. Spatiotemporal accumulation of WSMV and TriMV in plants, as well as their ratios, was analyzed using mixed-effects models [21]. Block was included as a random effect to account for field heterogeneity, and flagged location nested within replication was included as a random effect to account for spatial structure. Variety, time, and their interaction were treated as fixed effects. Virus accumulation and ratios in mites and corresponding plant tissues were analyzed using mixed-effects models, with replication included as a random effect and cultivar treated as a fixed effect. Statistical significance was determined at p < 0.05.
3. Results
3.1. Seasonal Virus Accumulation—Year 1 (2021–2022)
Virus accumulation varied significantly over time in all cultivars during the first growing season (Figure 1). Across cultivar groups and sampling locations, WSMV and TriMV titers increased following initial infection, peaked at approximately 4–5 weeks, and subsequently declined as plants entered senescence. Consistent with this trend, the WSMV-to-TriMV ratio increased 2–3 weeks after infection at each location before declining later in the season, reflecting a comparatively sharper reduction in WSMV titers.
At later infection stages, WSMV accumulation was lower in BT (Wsm1) than in Joe (Wsm2) (Figure 1D). More notably, TriMV accumulation was significantly lower in BT than in Joe and TAM 304 across nearly all locations and sampling intervals (Figure 1E–H), with the exception of Week 1 at flag location 1 and Week 4 at flag location 4.
Spatially, infected plants were initially concentrated along the southern edge of the plots adjacent to the trap strip. Over time, infections progressed northward across the field (Figure 2). All sampled plants exhibiting symptoms tested positive for both WSMV and TriMV, indicating consistent mixed infections. Across sampling points, BT plants exhibited reduced accumulation of both viruses relative to Joe and TAM 304.
3.2. Seasonal Virus Accumulation—Year 2 (2022–2023)
In the second season, data collection was limited to a three-week period (late May to mid-June). During this interval, WSMV and TriMV titers declined across all cultivars as plants senesced (Figure 3A–F). Consistent with Year 1, BT exhibited significantly lower TriMV accumulation across all locations and sampling times (Figure 3D–F). This reduction resulted in significantly higher WSMV-to-TriMV ratios in BT compared to Joe and TAM 304 (Figure 3G–I).
Spatial infection patterns mirrored those observed in the first season. Symptomatic plants were initially concentrated near the southern inoculum source and subsequently detected across the field (Figure 4A–F). All infected plants sampled during this season also showed mixed infection.
3.3. Virus Accumulation in Wheat Curl Mites
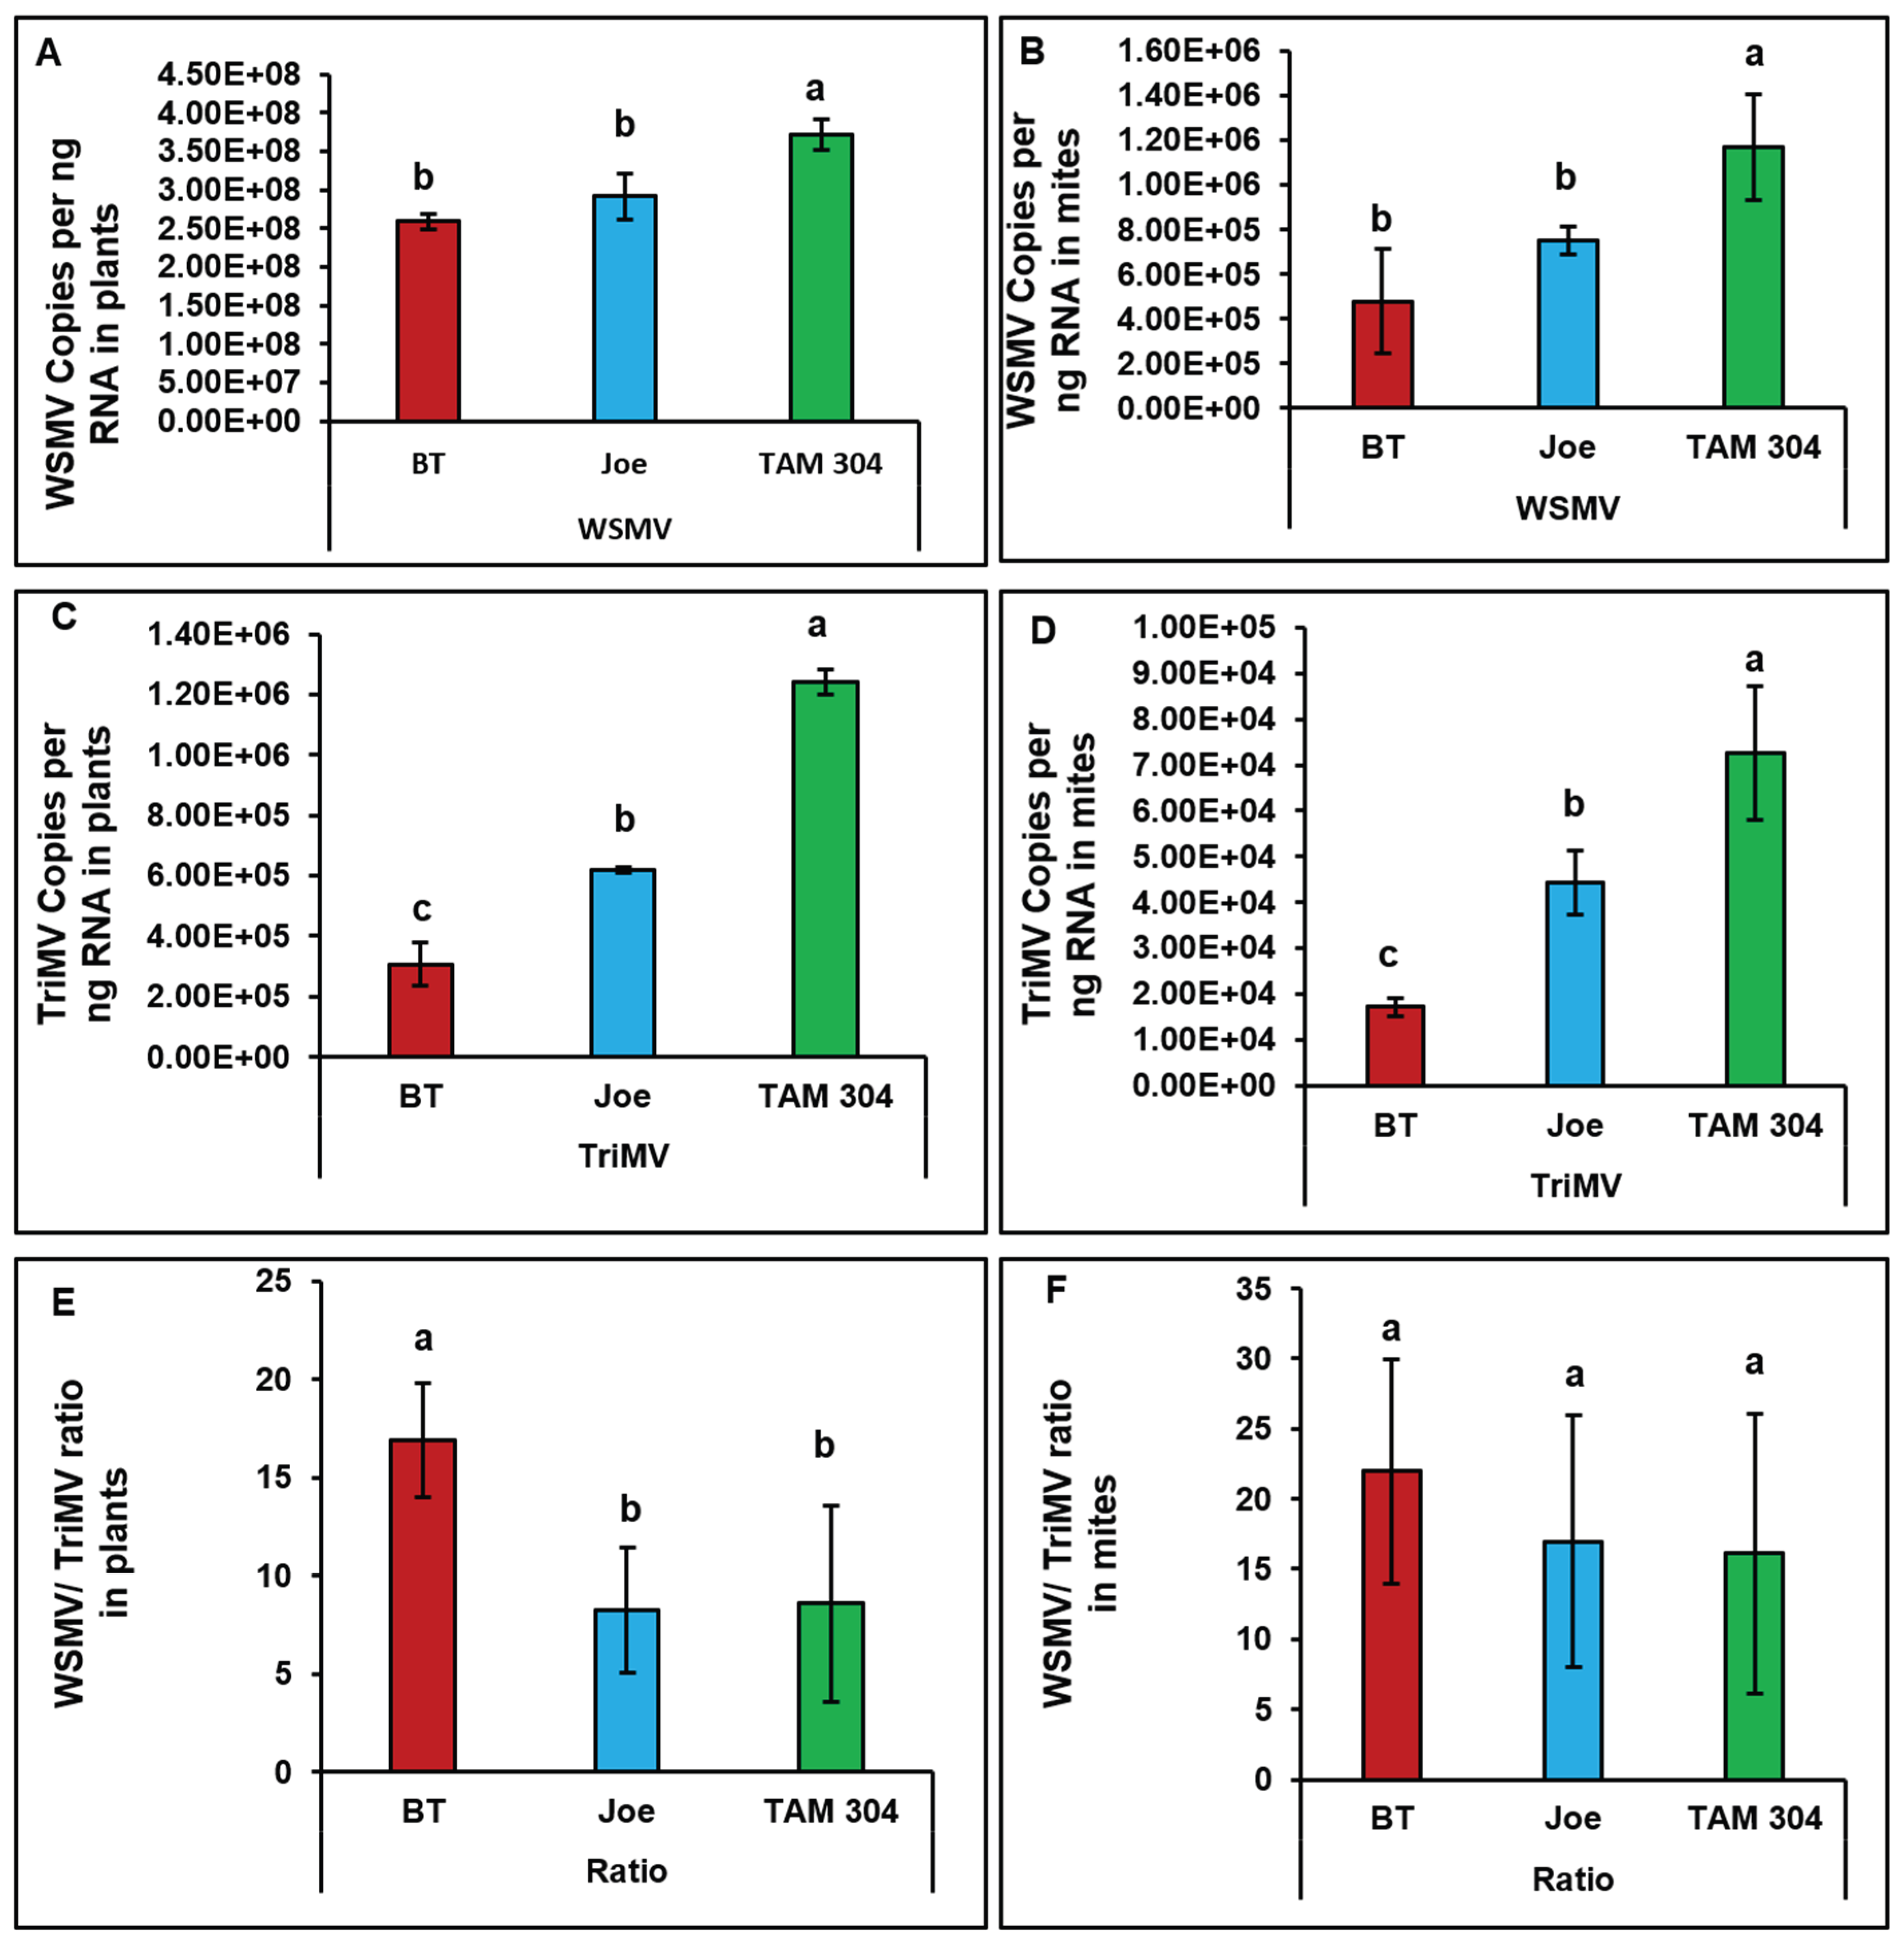
WSMV and TriMV accumulation differed significantly among cultivars at the plant level (Figure 5A,C), with the lowest titers observed in BT and the highest in TAM 304. Correspondingly, WSMV-to-TriMV ratios were significantly higher in BT plants than in Joe or TAM 304 (Figure 5E).
Virus accumulation in mites feeding on infected plants followed the same relative pattern observed in plant tissues, indicating a strong association between source plant titers and mite viral load (Figure 5B,D). However, despite significant differences in WSMV-to-TriMV ratios among cultivars at the plant level, viral ratios within mites did not differ significantly among cultivars (Figure 5F).
4. Discussion
Wheat curl mite-transmitted wheat streak mosaic continues to cause substantial economic losses across the U.S. Great Plains. Although WSMV has historically been regarded as the principal causal agent of this disease complex, accumulating evidence indicates that TriMV is a major contributor to symptom development and is frequently detected in mixed infections [22,23]. Previous work demonstrated that WSMV and TriMV interact synergistically to intensify disease severity relative to single infections, independent of cultivar genotype [18]. This synergism, however, appears to be largely driven by TriMV, whose accumulation increases significantly in co-infected plants compared to singly infected plants [18].
In the present field study, the cultivar carrying the Wsm1 gene (Breakthrough, BT) provided stronger protection against WSM than cultivars carrying Wsm2 or lacking resistance. This protection was associated with reduced TriMV accumulation beginning early in infection and persisting through later disease stages, resulting in lower overall symptom severity (field observations). These findings align with prior controlled experiments showing that viral accumulation in WCM is density-dependent, with higher virus titers in host plants corresponding to higher titers in mites [18]. Although significant differences in WSMV-to-TriMV ratios were observed among cultivars at the plant level, these differences were not reflected in mites, suggesting complex and dynamic virus–vector–host interactions. The relatively uniform viral ratio within mites, regardless of plant-level differences, may partly explain the frequent occurrence of mixed infections observed under field conditions [3].
Viral accumulation in wheat is shaped by host developmental stage, genetic background, vector movement, and environmental conditions [24]. During the 2021 and 2022 growing seasons in Bushland, Texas, temperatures increased steadily from April to June (daily highs 15–32 °C; daily lows 1–15 °C), remaining within ranges permissive for WSM development. Under controlled conditions (20–26 °C), cultivars carrying Wsm1 exhibit moderate viral accumulation and mild-to-moderate synergistic disease, whereas susceptible cultivars support higher titers and severe symptom expression [25]. Consistent with those findings, TriMV replication in BT was slower than in Joe (Wsm2) and the susceptible cultivar under field conditions. Although WSMV accumulation was also reduced in BT at certain sampling points, consistent suppression was more apparent during later stages of infection. Collectively, these data suggest that reduced disease severity in Wsm1-containing cultivars primarily reflects early and sustained suppression of TriMV.
In mixed infections, viral titers are rarely additive and instead reflect synergistic or antagonistic interactions. Ratios substantially exceeding unity are generally interpreted as evidence of synergism [26]. Because WSMV and TriMV belong to distinct taxonomic groups, their interactions within wheat are temporally dynamic and context dependent [27]. Previous studies showed that prior TriMV infection enhances WSMV accumulation, whereas established WSMV infection can delay TriMV replication [28]. In the current study, WSMV titers consistently exceeded TriMV titers across cultivars and sampling times. However, the WSMV-to-TriMV ratio declined over time due to a marked reduction in WSMV levels, indicating that host physiological age strongly modulates these interactions. Field infections likely arise from simultaneous or sequential mite-mediated inoculation, and possibly seed transmission [29]. Although precise infection timing could not be determined, the consistent detection of both viruses in mite populations from trap crops and field plots supports the likelihood of simultaneous inoculation. The presence of additional endemic wheat viruses in the region may further influence disease dynamics, warranting future studies addressing multi-virus interactions in field settings.
Earlier controlled experiments demonstrated that viral accumulation in WCM is influenced by host genotype and infection status, with density-dependent relationships between plant and mite titers [18]. The present field data corroborate these findings: mites feeding on plants with higher WSMV or TriMV titers accumulated correspondingly higher viral loads. However, unlike previous reports indicating a higher WSMV-to-TriMV ratio in mites relative to plant tissue [3,18], no significant ratio differences between mites and their source plants were detected here. This discrepancy likely reflects methodological differences. Prior studies analyzed individual mites, revealing substantial variation in viral ratios among individuals. In contrast, pooled mite samples (15–25 mites per replicate) were used in this study, potentially averaging individual-level variation and yielding ratios similar to those of the source tissue.
Notably, despite significantly higher WSMV-to-TriMV ratios in BT plants compared to Joe and TAM 304, viral ratios within mites did not differ among cultivars. Several non-mutually exclusive explanations may account for this pattern, including differential acquisition efficiency or differences in viral persistence within the vector. However, the pooled sampling design used here does not allow discrimination among these possibilities. Regardless of mechanism, these data suggest that processes associated with virus acquisition or persistence in the vector may contribute to the convergence of viral ratios following acquisition from heterogeneous host sources. Future studies examining virus accumulation in individual mites will be necessary to determine whether this convergence reflects differential acquisition efficiency, within-vector dynamics, or effects of pooled sampling. From a management perspective, this finding is important: even when resistant cultivars reduce overall viral accumulation, surviving mites may still harbor balanced viral loads capable of initiating severe disease in subsequent susceptible crops or volunteer wheat hosts that serve as a green bridge.
5. Conclusions
This study highlights the dynamic complexity of the WSM disease complex under field conditions. Interactions between WSMV and TriMV are strongly influenced by host genotype, vector biology, and environmental context. Cultivars carrying the Wsm1 gene provided enhanced protection in the Texas Panhandle environment by restricting TriMV accumulation, thereby reducing overall disease severity even when WSMV remained detectable. The density-dependent relationship between plant and mite viral titers reinforces the central role of host resistance in reducing landscape-level inoculum pressure. Furthermore, the consistent WSMV-to-TriMV ratio observed in mites across cultivars suggests possible biological constraints on viral acquisition or within-vector regulation. Together, these findings advance understanding of virus–vector–host interactions in WSM and provide mechanistic insight to inform breeding strategies and integrated disease management programs.
Author Contributions
Conceptualization, S.G. and K.R.G.; methodology, S.G.; software, S.G.; validation, K.R.G. and S.G.; formal analysis, S.G.; investigation, S.G.; resources, K.R.G.; data curation, S.G.; writing—original draft preparation, S.G.; writing—review and editing, K.R.G.; visualization, S.G.; supervision, K.R.G.; project administration, K.R.G.; funding acquisition, K.R.G. All authors have read and agreed to the published version of the manuscript.
Funding
This research was funded by the Texas A&M AgriLife Research Insect Vectored Diseases Grant awarded to PI Gadhave.
Data Availability Statement
The raw data from this study will be made available upon request to the corresponding author.
Acknowledgments
The authors are grateful to Dr. Charlie Rush, Dr. Fekede Workneh, and Jewel Arthur for their assistance with the field experiment design.
Conflicts of Interest
The authors declare no conflicts of interest.
References
- Velandia, M.; Rejesus, R.M.; Jones, D.C.; Price, J.A.; Workneh, F.; Rush, C.M. Economic Impact of Wheat Streak Mosaic Virus in the Texas High Plains. Crop Protection 2010, 29, 699–703. [Google Scholar] [CrossRef]
- Tatineni, S.; Mondal, S.; Wegulo, S.N.; Hein, G.L. Triticum Mosaic Virus: An Overview of Biology, Functional Genomics, Gene Expression Vector, and Management Strategies. Virology 2025, 603, 110377. [Google Scholar] [CrossRef]
- Bryan, B.; Paetzold, L.; Workneh, F.; Rush, C.M. Incidence of Mite-Vectored Viruses of Wheat in the Texas High Plains and Interactions With Their Host and Vector. Plant Dis 2019, 103, 2996–3001. [Google Scholar] [CrossRef]
- Pradhan, G.P.; Xue, Q.; Jessup, K.E.; Hao, B.; Price, J.A.; Rush, C.M. Physiological Responses of Hard Red Winter Wheat to Infection by Wheat Streak Mosaic Virus. Phytopathology 2015, 105, 621–627. [Google Scholar] [CrossRef]
- Bowden, R.L.; Brooks, H.L.; Peterson, D.E.; Shroyer, J.P. Be a Good Neighbor: Control Your Volunteer Wheat. Kansas State University, 1991. [Google Scholar]
- Christian, M.L. Survival of Wheat Streak Mosaic Virus in Grass Hosts in Kansas from Wheat Harvest to Fall Wheat Emergence. Plant Dis 1993, 77, 239. [Google Scholar] [CrossRef]
- Connin, R. V. The Host Range of the Wheat Curl Mite, Vector of Wheat Streak-Mosaic1. J Econ Entomol 1956, 49, 1–4. [Google Scholar] [CrossRef]
- Hunger, R.M. Effects of Planting Date and Inoculation Date on Severity of Wheat Streak Mosaic in Hard Red Winter Wheat Cultivars. Plant Dis 1992, 76, 1056. [Google Scholar] [CrossRef]
- Price, J.A. Ecology and Epidemiology of Wheat Streak Mosaic Virus, Triticum Mosaic Virus, and Their Mite Vector in Wheat and Grassland Fields. Ph.D. Thesis, Texas Tech University, Lubbock, TX, USA, 2015. [Google Scholar]
- Thomas, J.A.; Hein, G.L.; Lyon, D.J. Spread of Wheat Curl Mite and Wheat Streak Mosaic Virus Is Influenced by Volunteer Wheat Control Methods. Plant Health Prog 2004, 5. [Google Scholar] [CrossRef]
- Workneh, F.; Jones, D.C.; Rush, C.M. Quantifying Wheat Yield Across the Field as a Function of Wheat Streak Mosaic Intensity: A State Space Approach. Phytopathology 2009, 99, 432–440. [Google Scholar] [CrossRef] [PubMed]
- Staples, R.; Allington, W. B. Streak Mosaic of Wheat in Nebraska and Its Control. Research Bulletin 178 1956. [Google Scholar]
- McMechan, A.J.; Tatineni, S.; French, R.; Hein, G.L. Differential Transmission of Triticum Mosaic Virus by Wheat Curl Mite Populations Collected in the Great Plains. Plant Dis 2014, 98, 806–810. [Google Scholar] [CrossRef] [PubMed]
- Price, J.A.; Simmons, A.R.; Rashed, A.; Workneh, F.; Rush, C.M. Winter Wheat Cultivars with Temperature-Sensitive Resistance to Wheat Streak Mosaic Virus Do Not Recover from Early-Season Infections. Plant Dis 2014, 98, 525–531. [Google Scholar] [CrossRef]
- Seifers, D.L.; Martin, T.J.; Harvey, T.L.; Haber, S.; Haley, S.D. Temperature Sensitivity and Efficacy of Wheat Streak Mosaic Virus Resistance Derived from CO960293 Wheat. Plant Dis 2006, 90, 623–628. [Google Scholar] [CrossRef]
- Seifers, D.L. Temperature Sensitivity and Efficacy of Wheat Streak Mosaic Virus Resistance Derived from Agropyron Intermedium. Plant Dis 1995, 79, 1104. [Google Scholar] [CrossRef]
- Nunna, H.; Palmer, N.A.; Sarath, G.; Wegulo, S.N.; Tatineni, S. Synergistic Interaction between Wheat Streak Mosaic Virus and Triticum Mosaic Virus Modulates Wheat Transcriptome to Favor Disease Severity. Front Plant Sci 2025, 15. [Google Scholar] [CrossRef] [PubMed]
- Gautam, S.; Gadhave, K.R. Impact of Wheat Resistance Genes on Wheat Curl Mite Fitness and Wheat Streak Mosaic Dynamics Under Single and Mixed Infections. Viruses 2025, 17, 1010. [Google Scholar] [CrossRef]
- Workneh, F.; Price, J.A.; Jones, D.C.; Rush, C.M. Wheat Streak Mosaic: A Classic Case of Plant Disease Impact on Soil Water Content and Crop Water-Use Efficiency. Plant Dis 2010, 94, 771–774. [Google Scholar] [CrossRef] [PubMed]
- R Core Team. 2019 R: A Language and Environment for Statistical Computing.
- Bates, D.; Mächler, M.; Bolker, B.; Walker, S. Fitting Linear Mixed-Effects Models Using Lme4. J Stat Softw 2015, 67. [Google Scholar] [CrossRef]
- Burrows, M.; Franc, G.; Rush, C.; Blunt, T.; Ito, D.; Kinzer, K.; Olson, J.; O’Mara, J.; Price, J.; Tande, C.; et al. Occurrence of Viruses in Wheat in the Great Plains Region, 2008. Plant Health Prog 2009, 10. [Google Scholar] [CrossRef]
- Byamukama, E.; Seifers, D.L.; Hein, G.L.; De Wolf, E.; Tisserat, N.A.; Langham, M.A.C.; Osborne, L.E.; Timmerman, A.; Wegulo, S.N. Occurrence and Distribution of Triticum Mosaic Virus in the Central Great Plains. Plant Dis 2013, 97, 21–29. [Google Scholar] [CrossRef]
- Jeger, M.; Hamelin, F.; Cunniffe, N. Emerging Themes and Approaches in Plant Virus Epidemiology. Phytopathology 2023, 113, 1630–1646. [Google Scholar] [CrossRef] [PubMed]
- Tatineni, S.; Graybosch, R.A.; Hein, G.L.; Wegulo, S.N.; French, R. Wheat Cultivar-Specific Disease Synergism and Alteration of Virus Accumulation During Co-Infection with Wheat Streak Mosaic Virus and Triticum Mosaic Virus. Phytopathology 2010, 100, 230–238. [Google Scholar] [CrossRef] [PubMed]
- SYLLER, J. Facilitative and Antagonistic Interactions between Plant Viruses in Mixed Infections. Mol Plant Pathol 2012, 13, 204–216. [Google Scholar] [CrossRef] [PubMed]
- Tatineni, S.; Alexander, J.; Qu, F. Differential Synergistic Interactions Among Four Different Wheat-Infecting Viruses. Front Microbiol 2022, 12. [Google Scholar] [CrossRef]
- Tatineni, S.; Alexander, J.; Gupta, A.K.; French, R. Asymmetry in Synergistic Interaction Between Wheat Streak Mosaic Virus and Triticum Mosaic Virus in Wheat. Molecular Plant-Microbe Interactions® 2019, 32, 336–350. [Google Scholar] [CrossRef]
- Gautam, S.; Chinnaiah, S.; Herron, B.; Workneh, F.; Rush, C.M.; Gadhave, K.R. Seed Transmission of Wheat Streak Mosaic Virus and Triticum Mosaic Virus in Differentially Resistant Wheat Cultivars. Viruses 2023, 15, 1774. [Google Scholar] [CrossRef]
Figure 1.
Spatiotemporal accumulation and titer ratios of wheat streak mosaic virus (WSMV) and Triticum mosaic virus (TriMV) in wheat cultivars during the 2021–22 growing season. (A–D) WSMV copies per ng of RNA at flagged locations 1 through 4 over a seven-week period. (E–H) TriMV copies per ng of RNA at flagged locations 1 through 4. (I–L) The corresponding WSMV-to-TriMV titer ratios at each location. Data points represent the mean values for cultivars Breakthrough (BT), Joe, and TAM 304, with error bars indicating standard error. Data is shown for flag locations F1 through F4, beginning at the field edge near the trap strip; locations F5 through F9 were excluded from the graphs as infection occurred too late for effective visualization. Viral loads were measured using qRT-PCR and absolute quantification of coat protein (CP) gene copies against plasmid standards. On the logarithmic Y-axis, distinct letters indicate statistically significant differences between means (p<0.05).
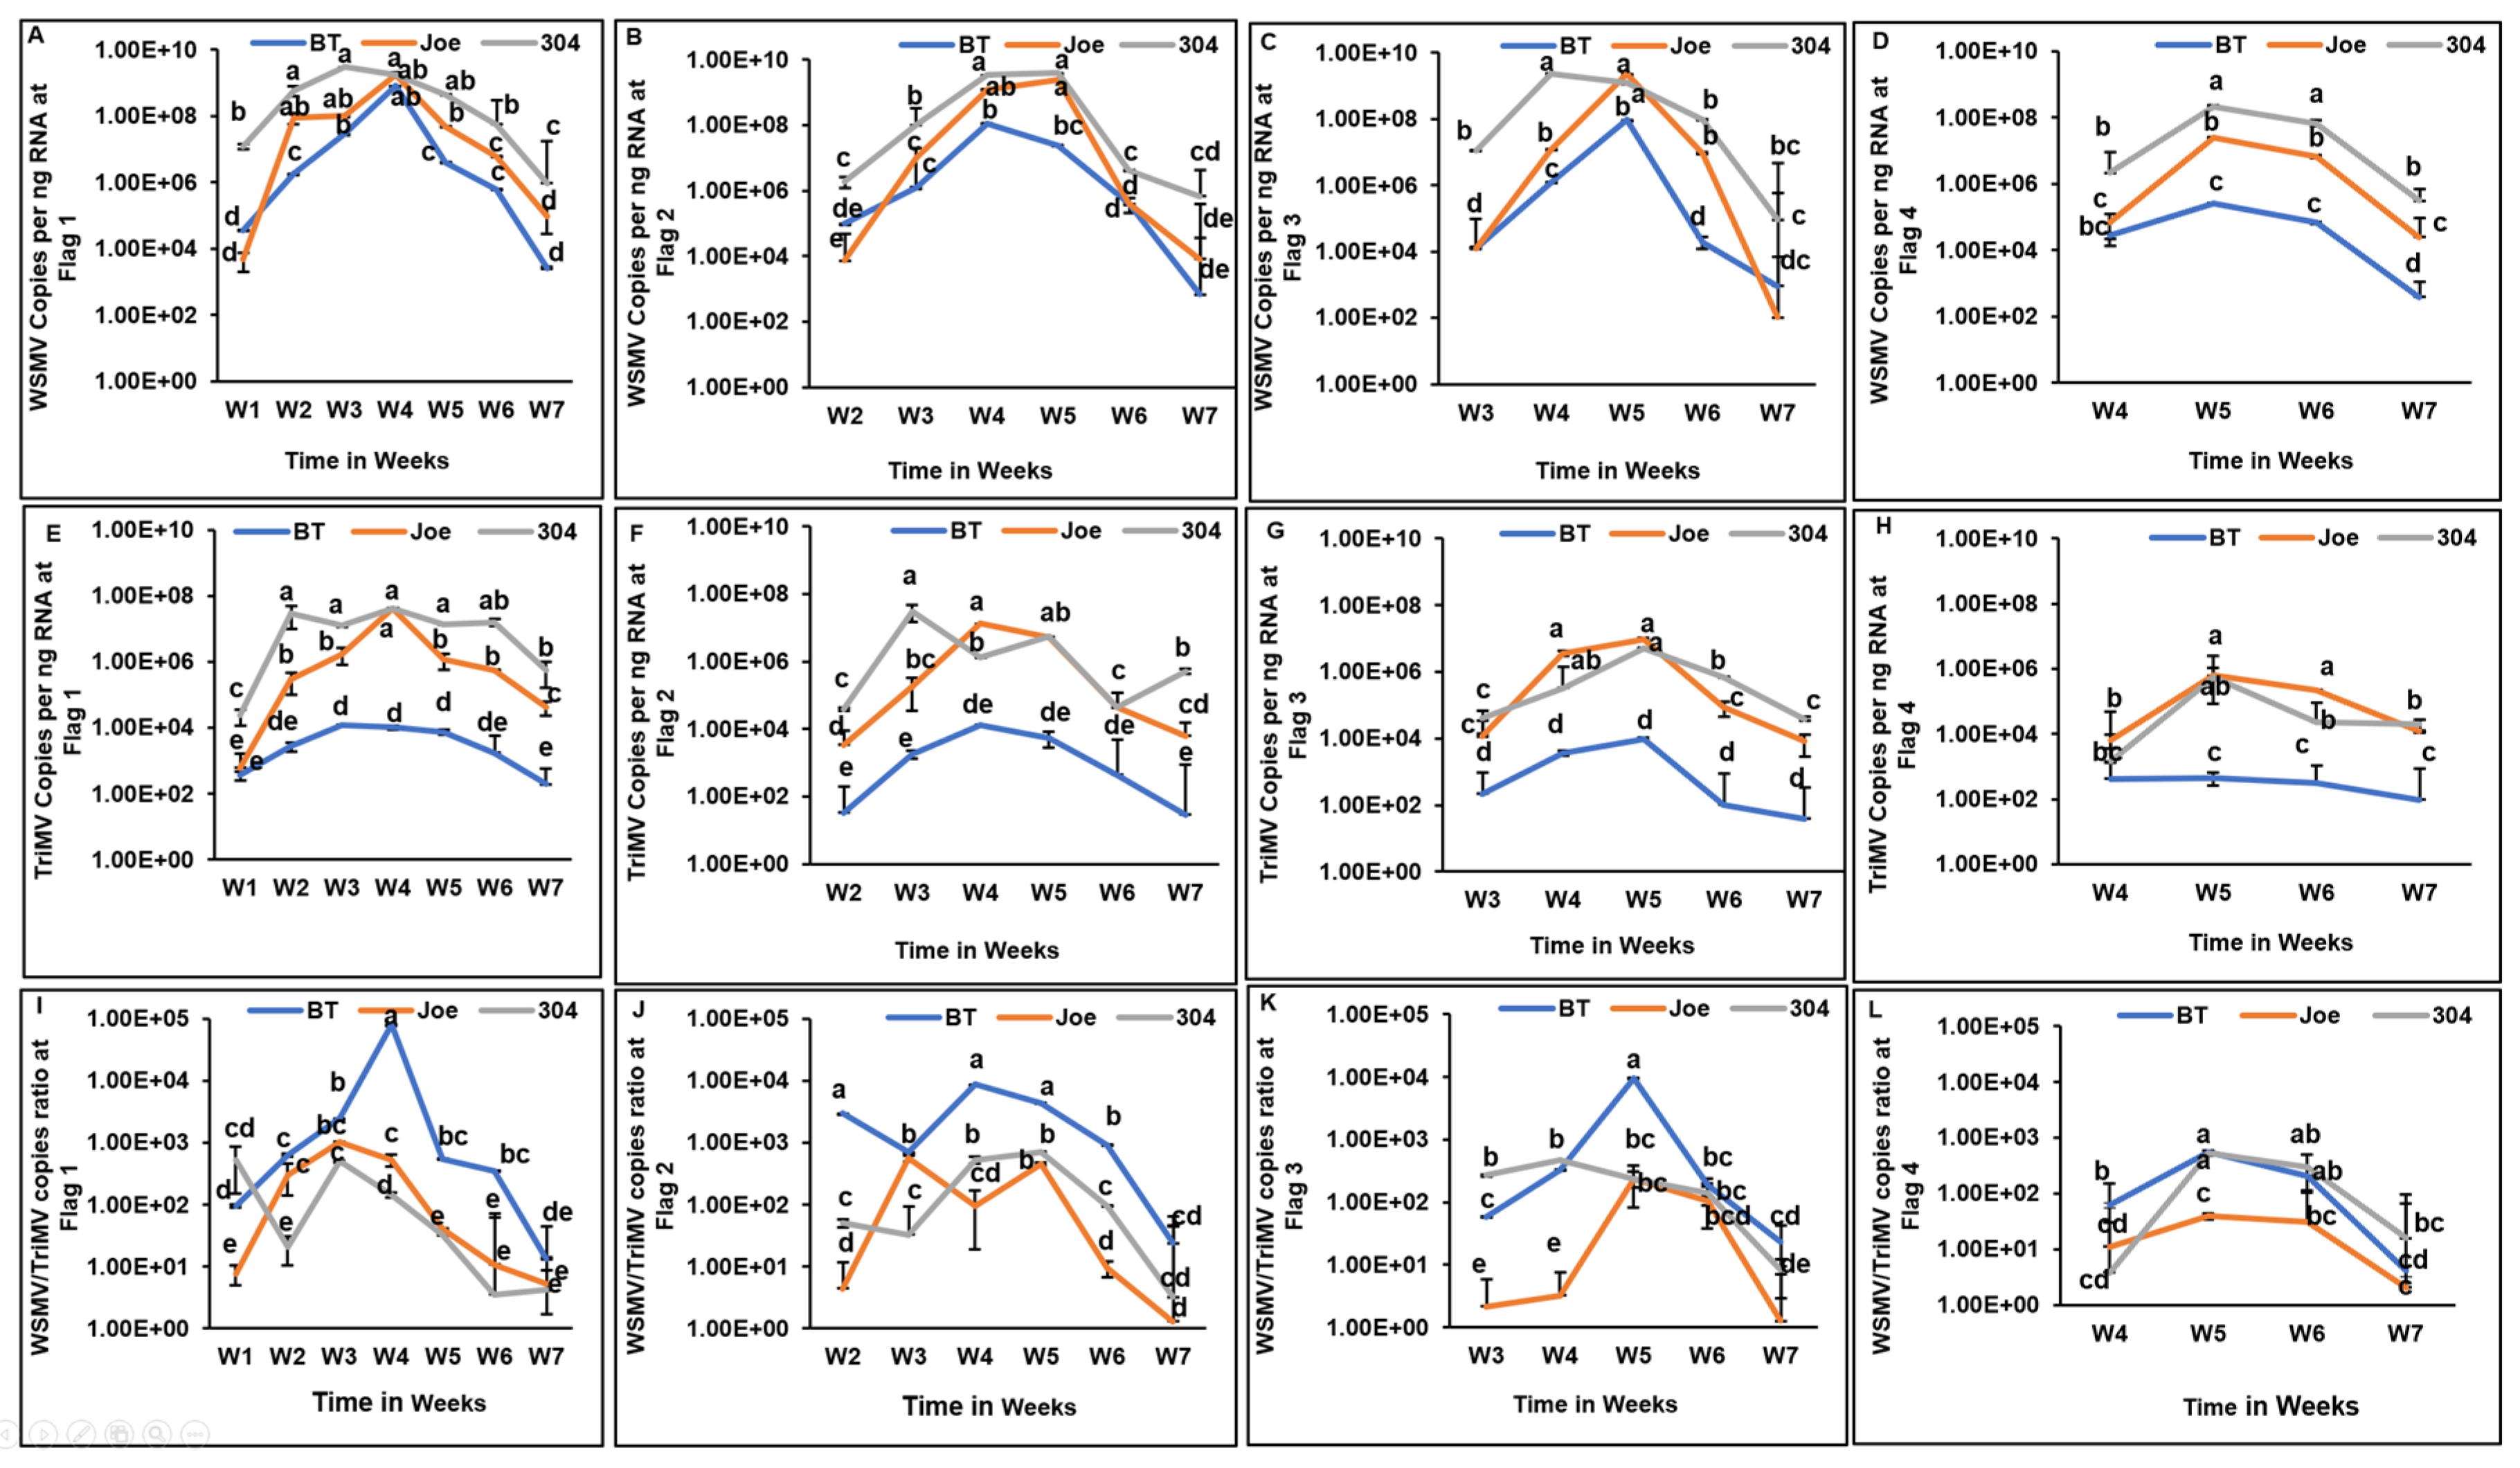
Figure 2.
Heat maps (A–N) illustrating the spatiotemporal accumulation of wheat streak mosaic virus (WSMV) and Triticum mosaic virus (TriMV) over a seven-week period across nine flagged locations (F1–F9) in various wheat cultivars (TAM, BT, and Joe). Panels A, C, E, G, I, K, and M represent WSMV accumulation, while panels B, D, F, H, J, L, and N represent TriMV accumulation for weeks 1 through 7, respectively. The color intensity correlates with viral copy number, providing a comparative visualization of viral titer progression over time.
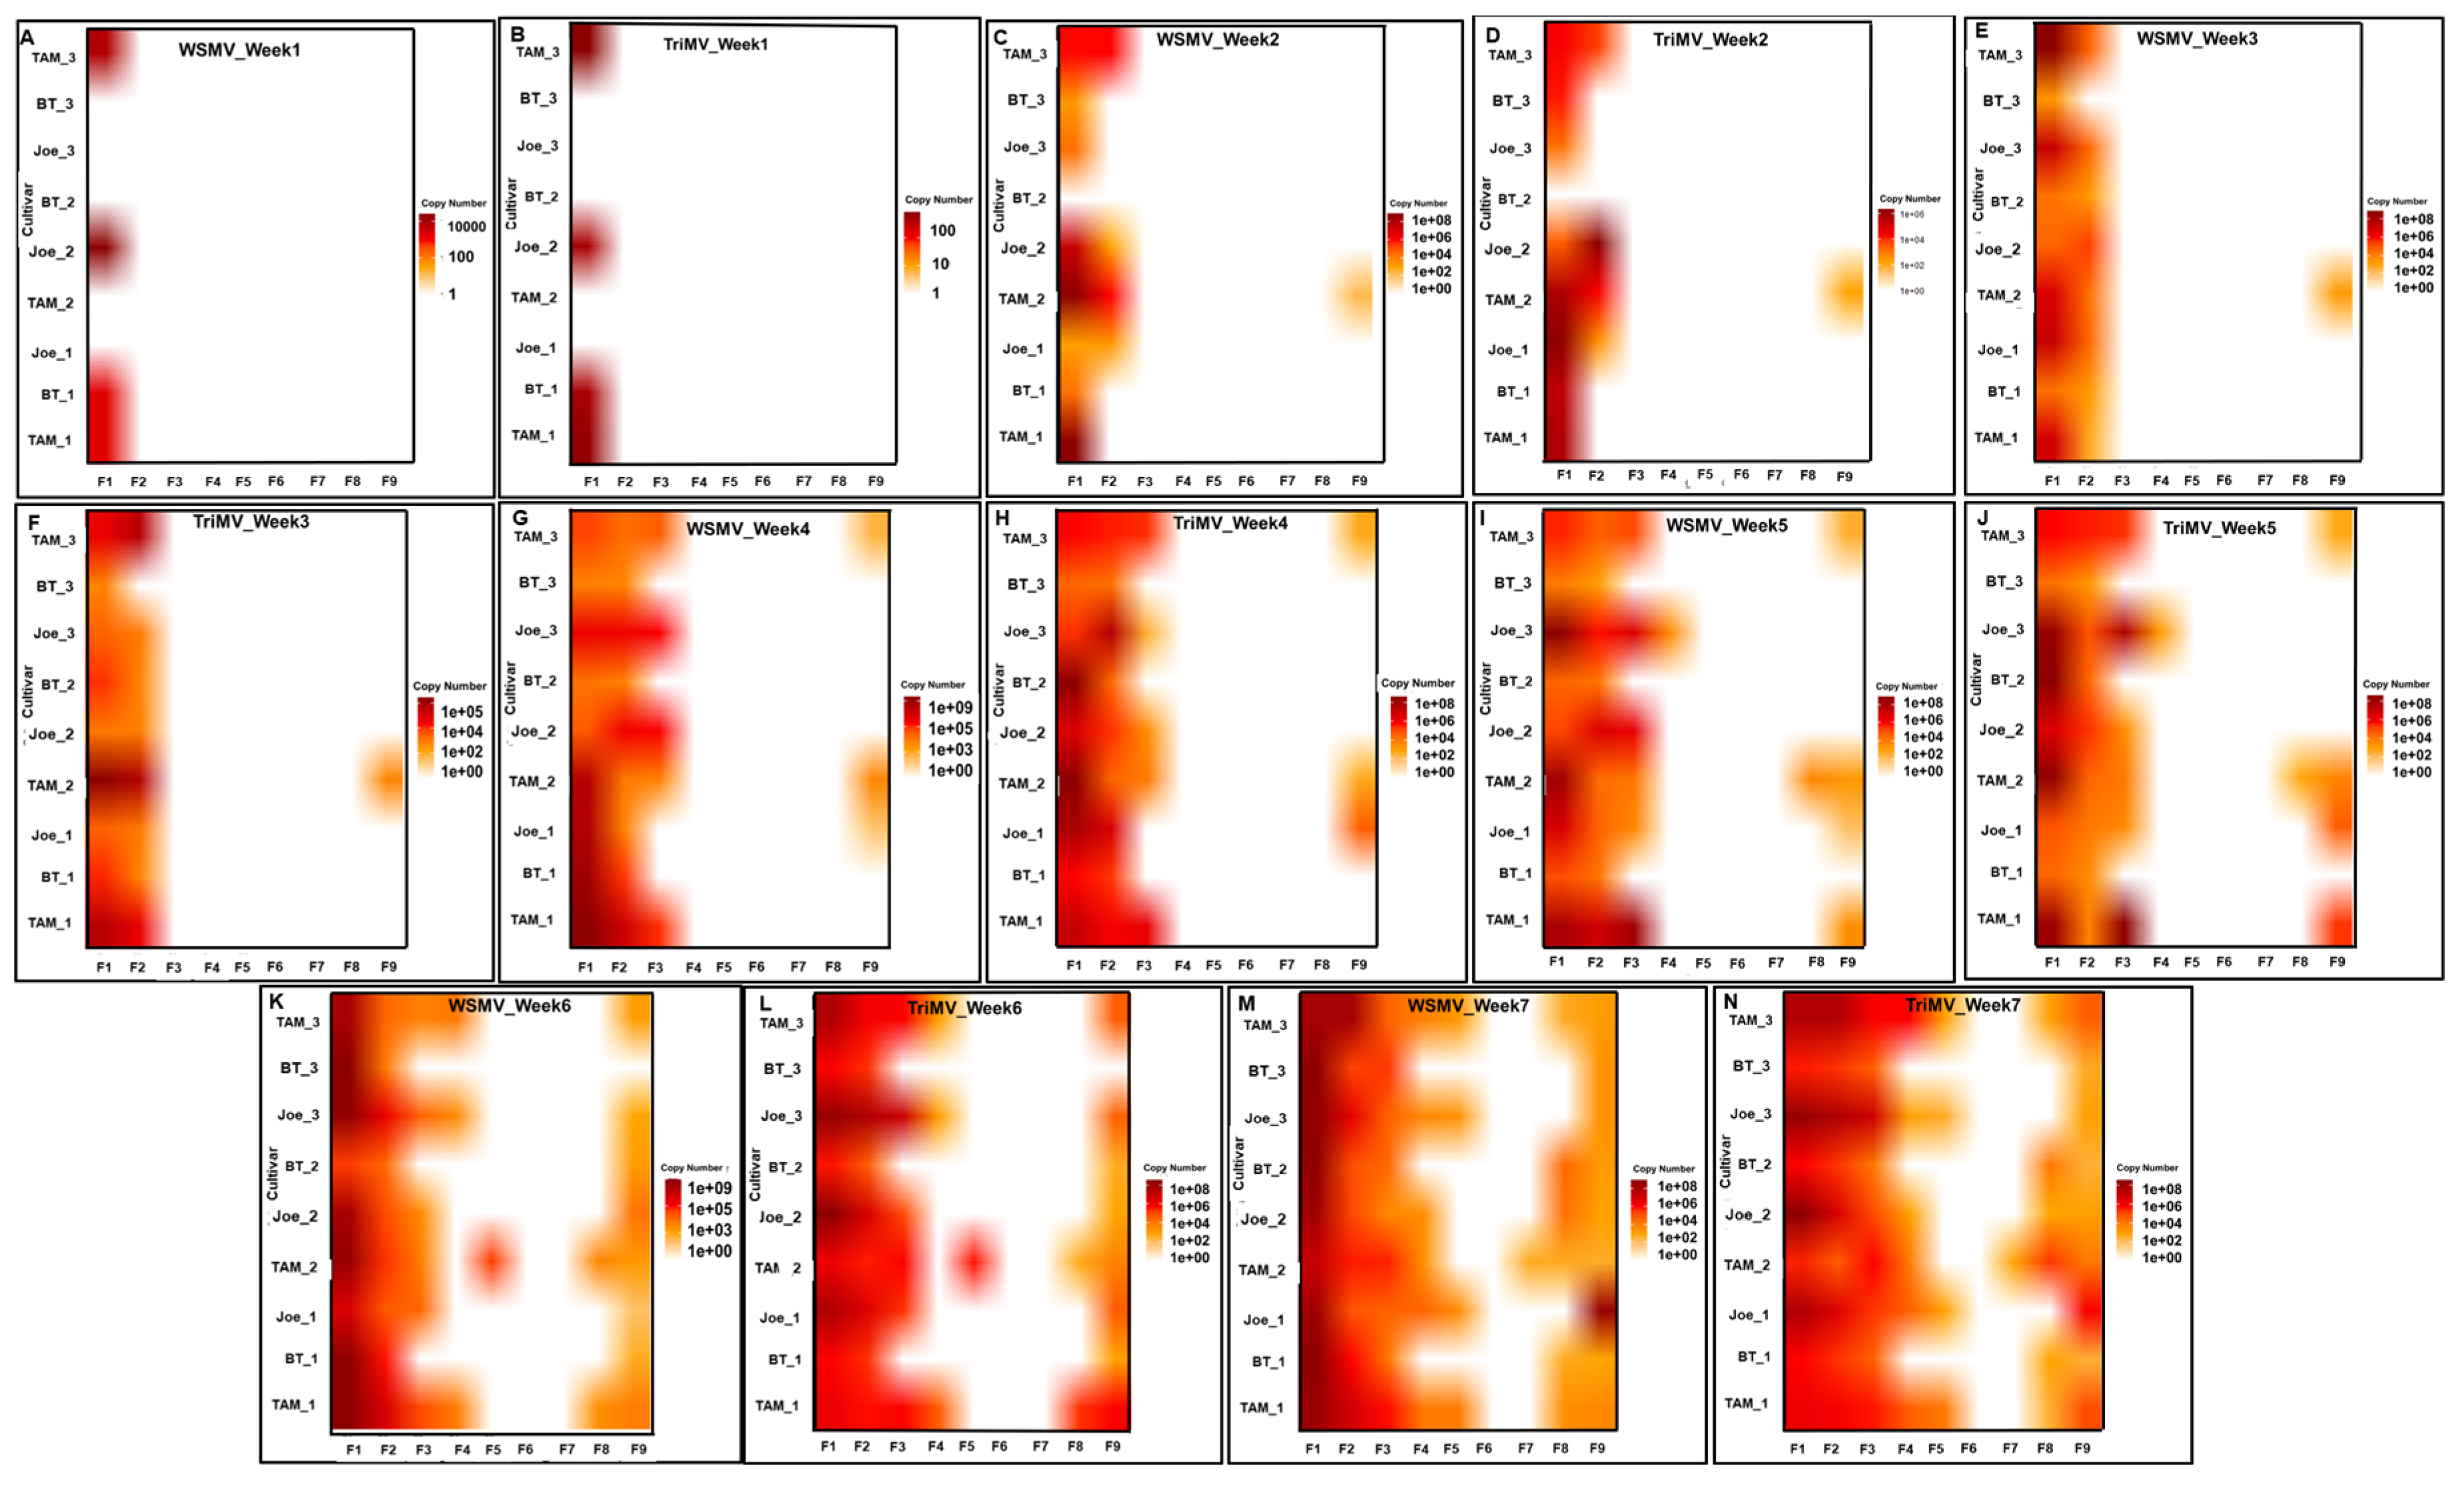
Figure 3.
Spatiotemporal accumulation and titer ratios of wheat streak mosaic virus (WSMV) and Triticum mosaic virus (TriMV) in wheat cultivars during the 2022–23 growing season. (A–C) WSMV copies per ng of RNA at flagged locations 1 through 3 over a three-week period. (D–F) TriMV copies per ng of RNA at flagged locations 1 through 3. (G–I) The corresponding WSMV-to-TriMV titer ratios at each location. Data points represent the mean values for cultivars Breakthrough (BT), Joe, and TAM 304, with error bars indicating standard error. Data is shown for flag locations F1 through F3, beginning at the field edge near the trap strip; locations F4 through F9 were excluded from the graphs as infection occurred too late for effective visualization. Viral loads were measured using qRT-PCR and absolute quantification of coat protein (CP) gene copies against plasmid standards. On the logarithmic Y-axis, distinct letters indicate statistically significant differences between means (p<0.05).
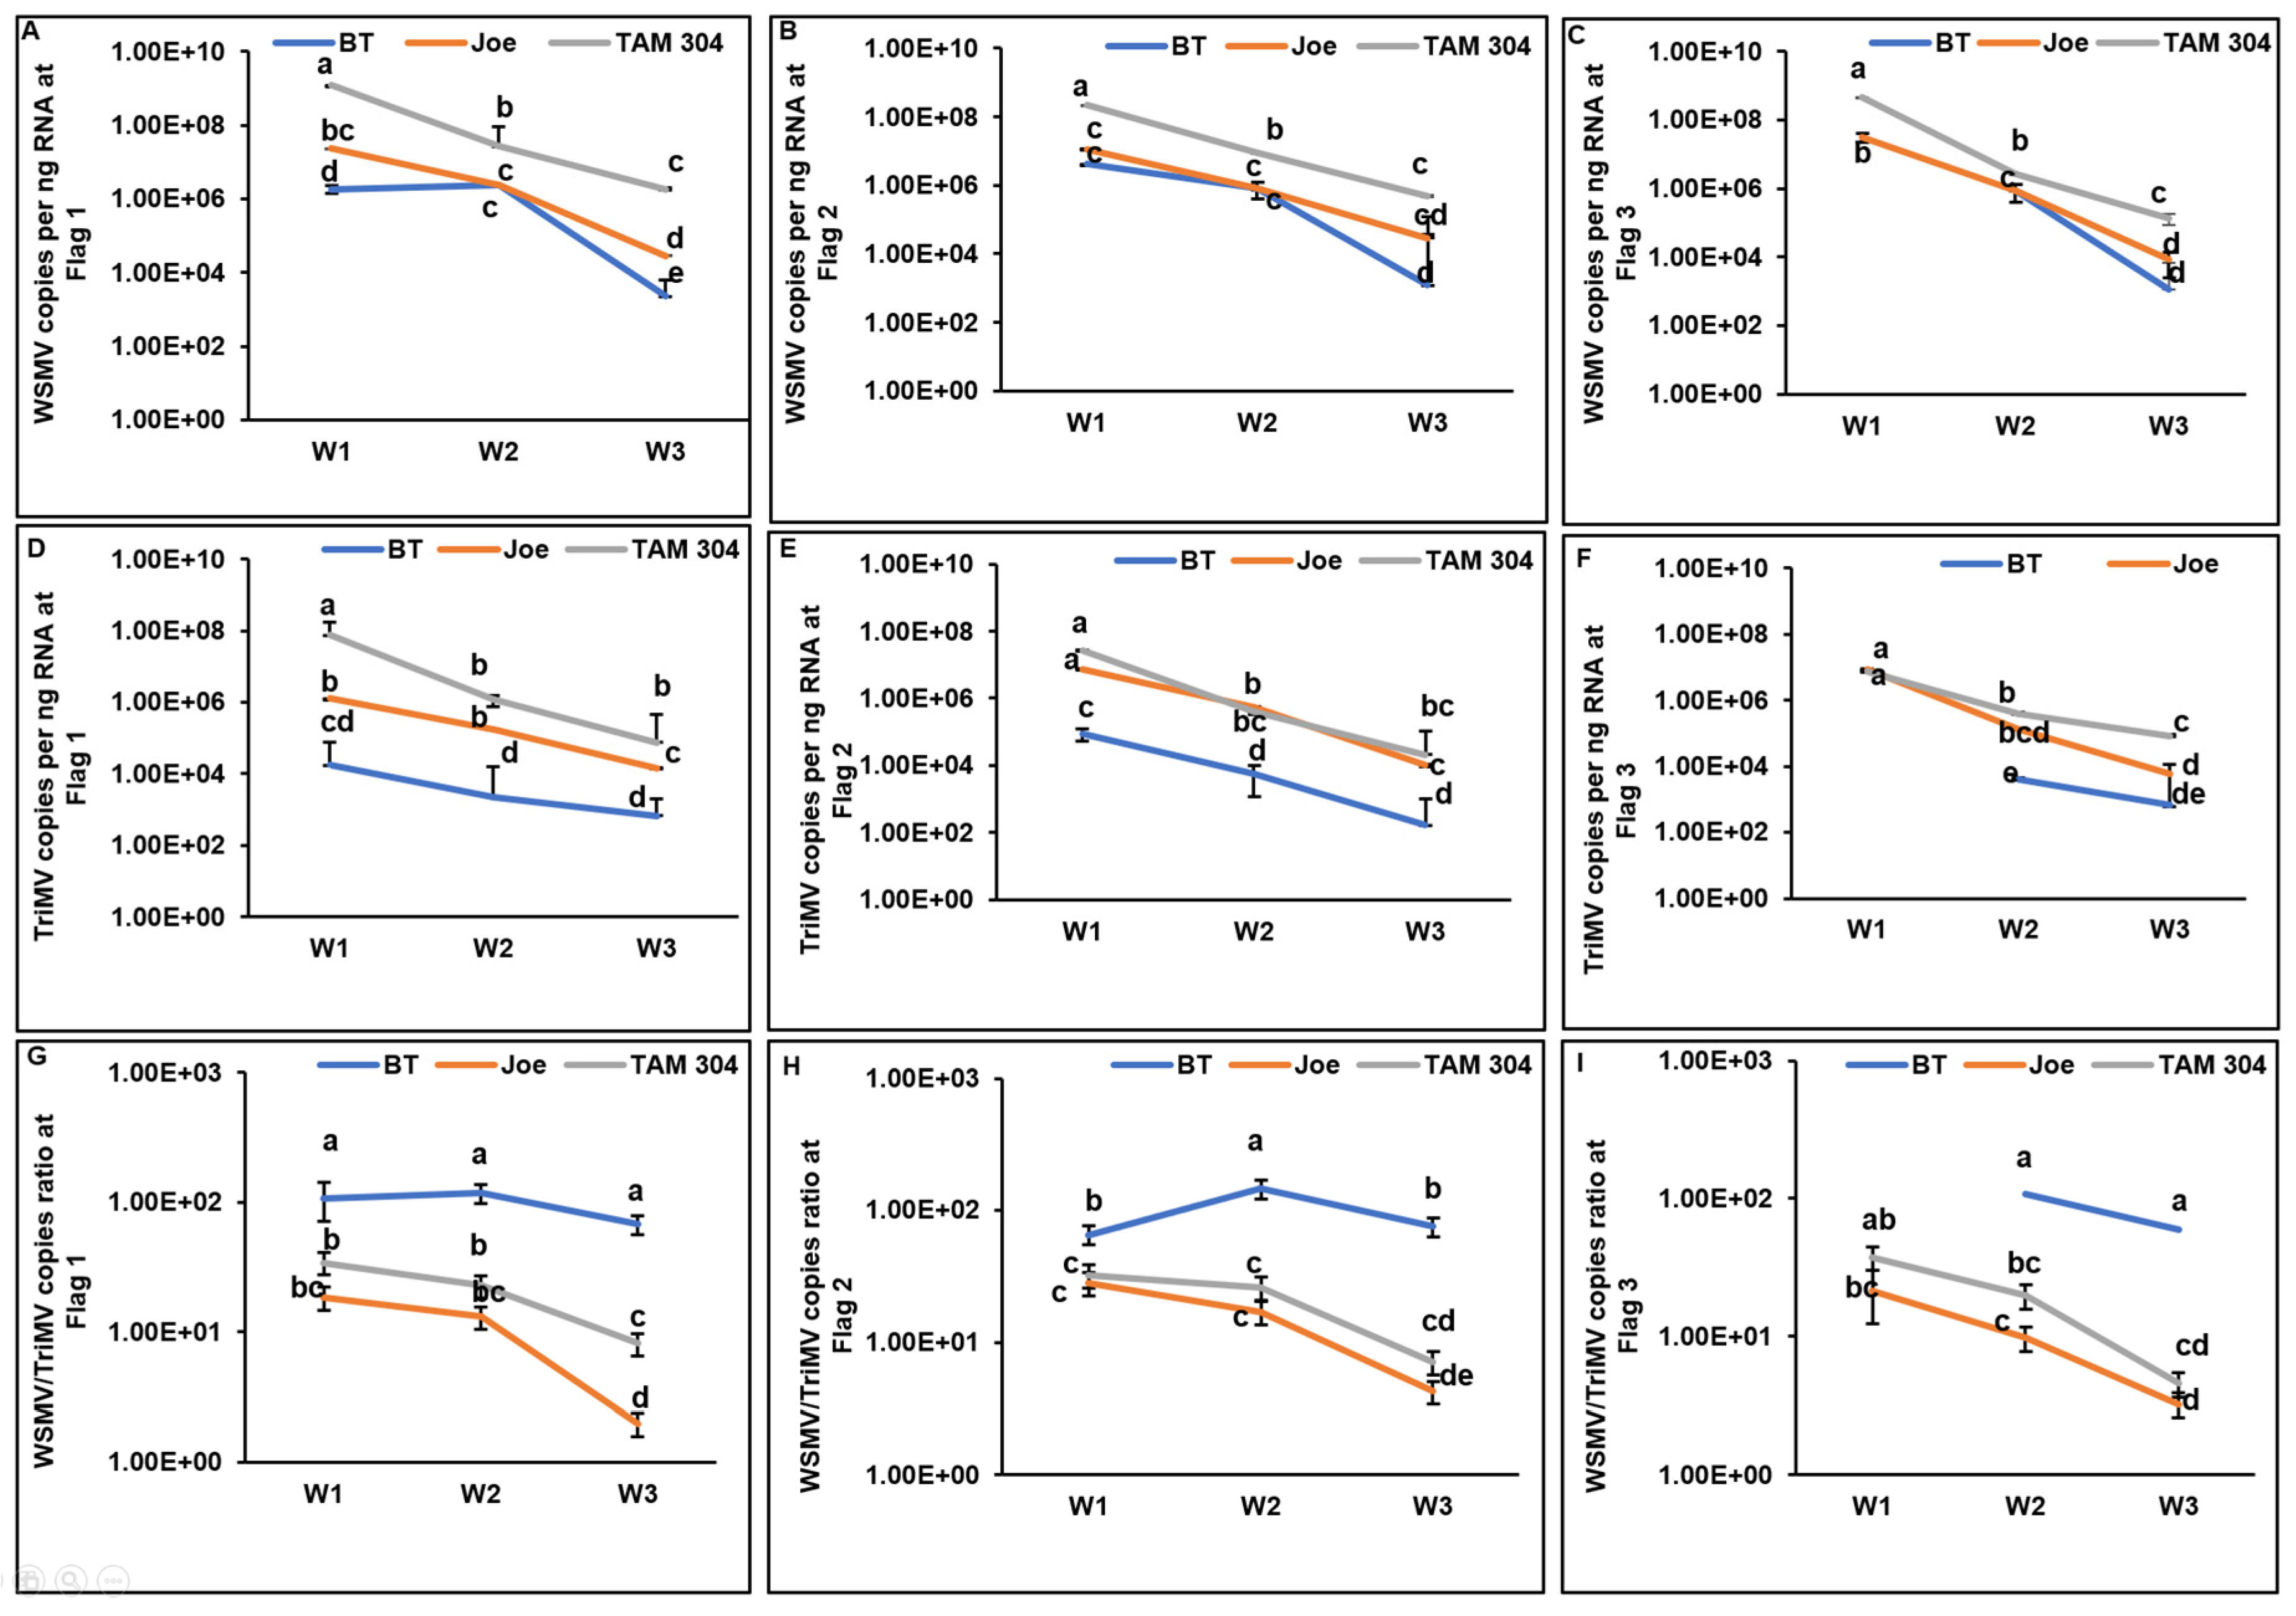
Figure 4.
Heat maps (A–F) illustrating the spatiotemporal accumulation of wheat streak mosaic virus (WSMV) and Triticum mosaic virus (TriMV) over a seven-week period across nine flagged locations (F1–F9) in various wheat cultivars (TAM, BT, and Joe). Panels A, C, and E represent WSMV accumulation, while panels B, D, and F represent TriMV accumulation for weeks 1 through 3, respectively. The color intensity correlates with viral copy number, providing a comparative visualization of viral titer progression over time.
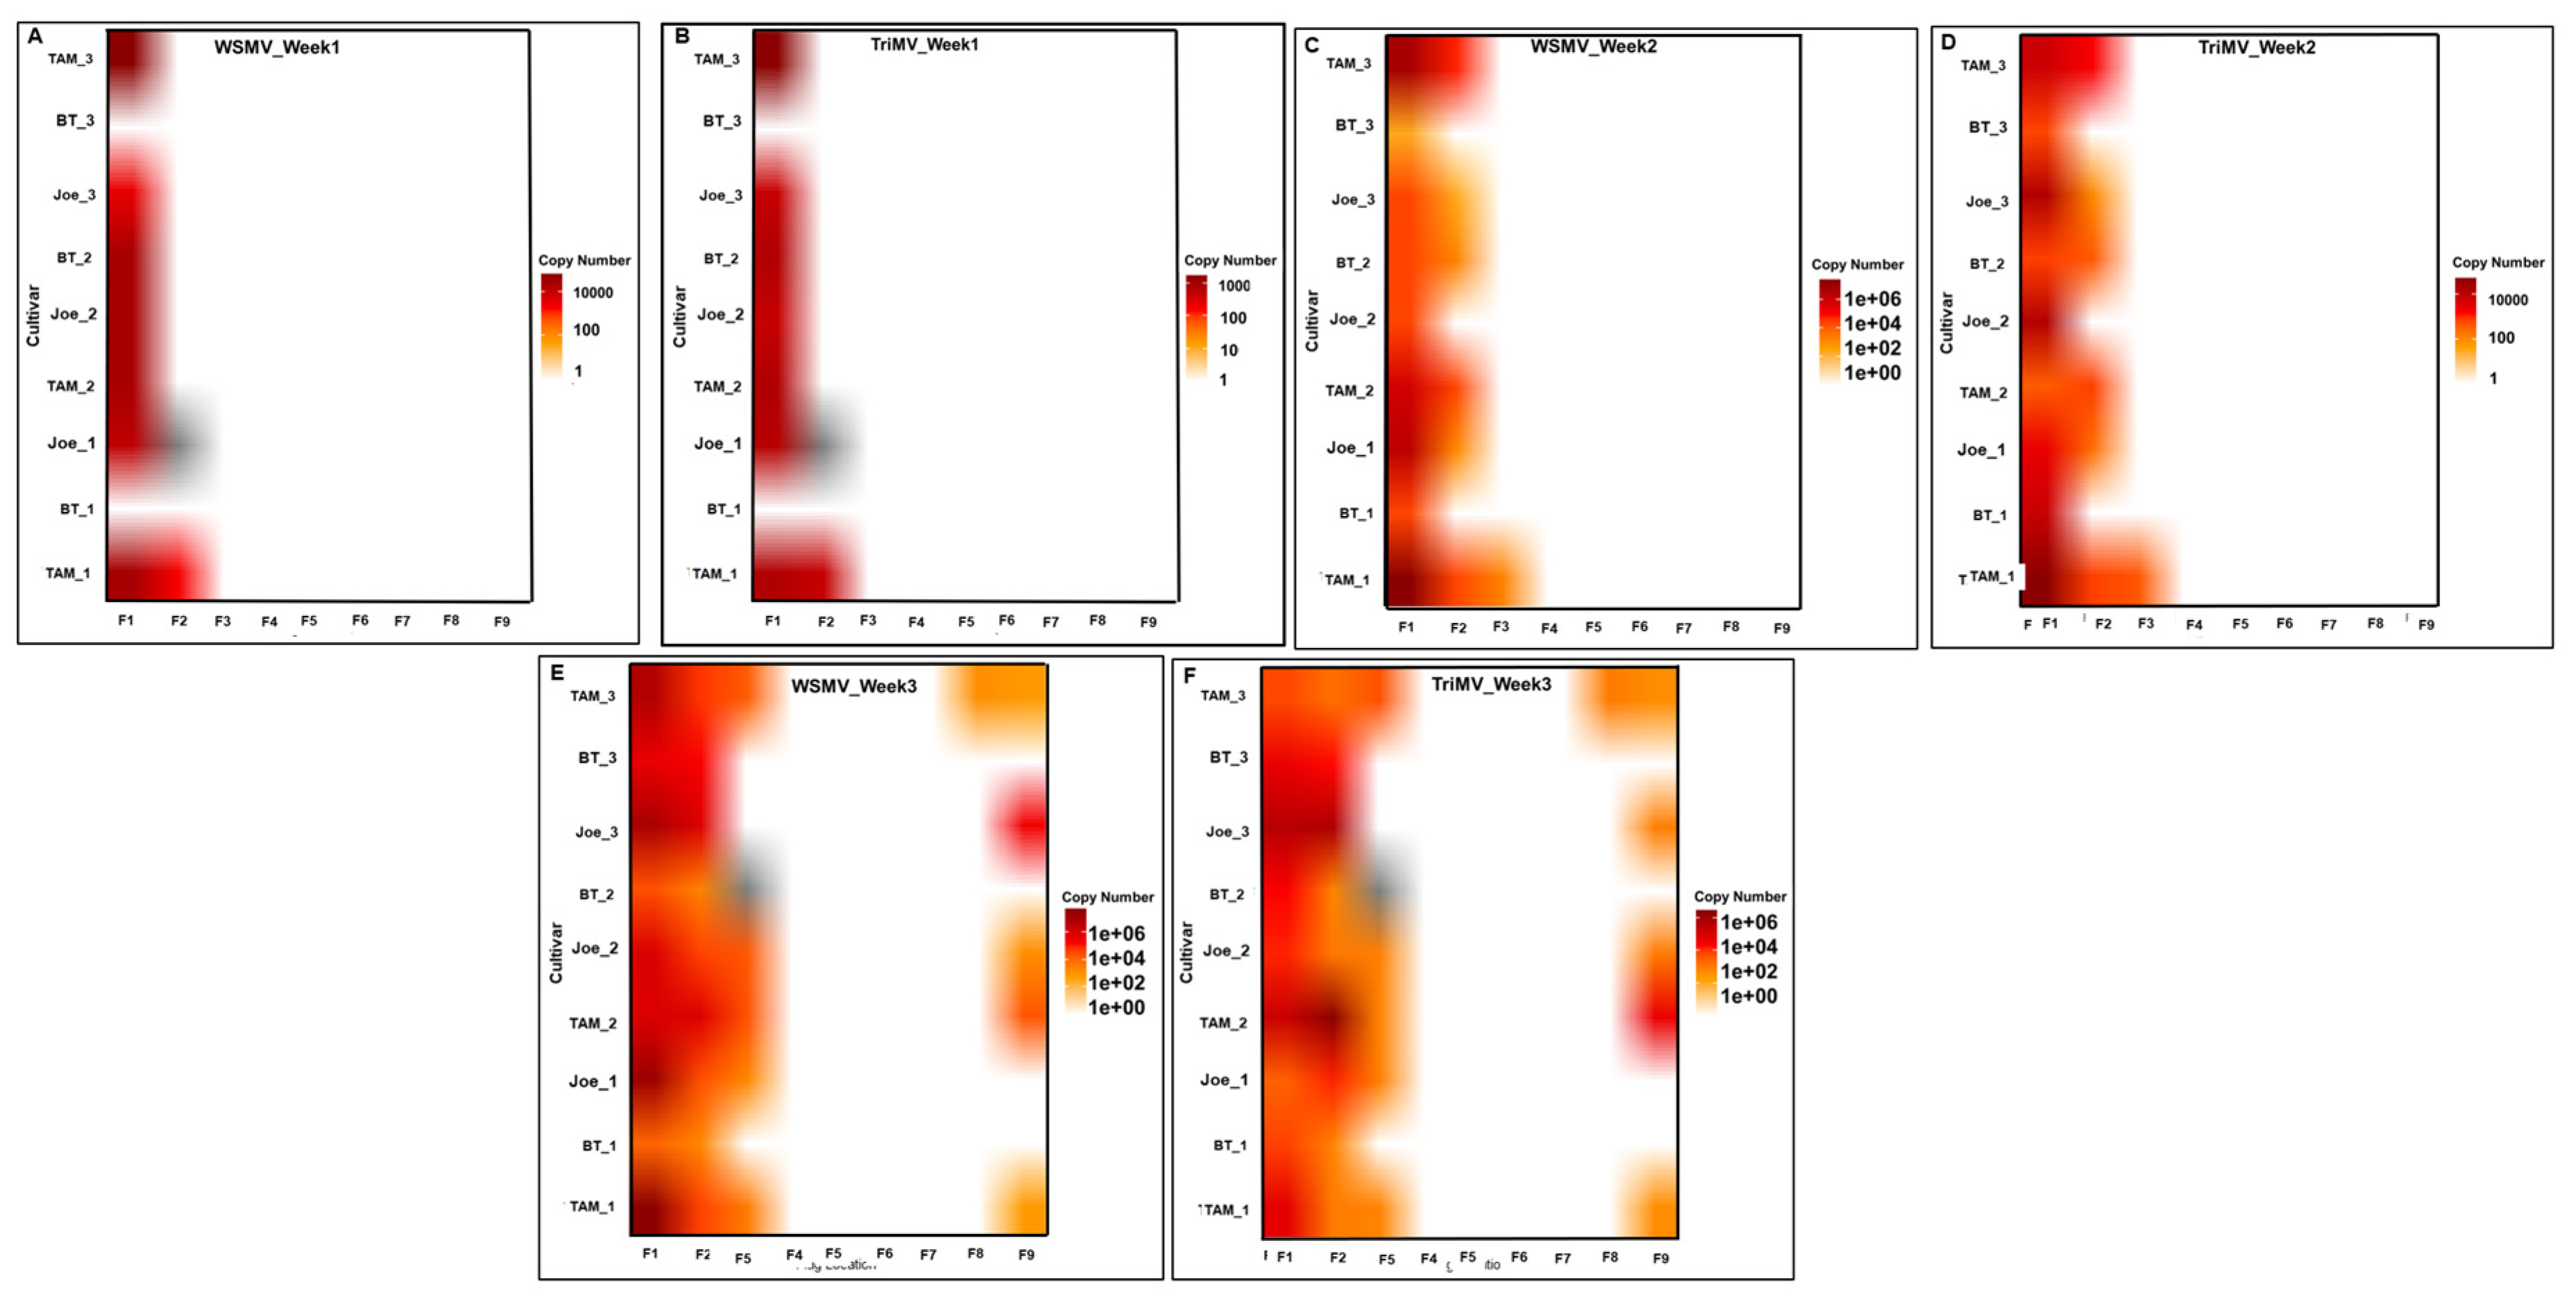
Figure 5.
Bar graphs showing the accumulation and titer ratios of wheat streak mosaic virus (WSMV) and Triticum mosaic virus (TriMV) in both wheat cultivars (i.e., source) and the wheat curl mites (WCM; Aceria tosichella) that fed on each respective cultivar (i.e., sink). Symptomatic wheat plants displaying characteristic WCM feeding injury were collected from the five flagged locations most proximal to the trap strip. In the laboratory, 15–25 mites of mixed developmental stages and their associated feeding tissues were isolated using a fine brush and transferred into separate 1.5 mL microcentrifuge tubes. Virus quantification was performed via qRT-PCR using absolute quantification of coat protein (CP) gene copies against plasmid standards. The accompanying figures present the mean values and standard errors for WSMV titers in plants (A) and mites (B), TriMV titers in plants (C) and mites (D), and the corresponding WSMV-to-TriMV ratio in plants (E) and mites (F). Results are displayed on a logarithmic scale, with distinct letters indicating statistically significant differences (p<0.05).
Disclaimer/Publisher’s Note: The statements, opinions and data contained in all publications are solely those of the individual author(s) and contributor(s) and not of MDPI and/or the editor(s). MDPI and/or the editor(s) disclaim responsibility for any injury to people or property resulting from any ideas, methods, instructions or products referred to in the content. |
© 2026 by the authors. Licensee MDPI, Basel, Switzerland. This article is an open access article distributed under the terms and conditions of the Creative Commons Attribution (CC BY) license (http://creativecommons.org/licenses/by/4.0/).
Copyright: This open access article is published under a Creative Commons CC BY 4.0 license, which permit the free download, distribution, and reuse, provided that the author and preprint are cited in any reuse.


