Submitted:
24 February 2026
Posted:
26 February 2026
You are already at the latest version
Abstract
This study presents a comprehensive multiphysics investigation of flow patterns, heat transfer, and species transport within an oxygen mask during the respiratory cycle. A coupled numerical model incorporating turbulent flow, conjugate heat transfer, and diluted species transport was developed to simulate cyclic breathing through time-varying boundary conditions. The model, validated against experimental measurements of gap flow velocities with a relative discrepancy of only 2.8%, captures the complex interactions between fluid dynamics, thermal response, and gas exchange throughout inspiration and expiration phases. Key findings reveal the formation of counter-rotating recirculation zones during expiration that significantly increase gas residence times and promote mixing between fresh oxygen and exhaled carbon dioxide. The thermal analysis demonstrates that mask walls require approximately 600 seconds (150 breathing cycles) to reach cyclic steady-state, highlighting the importance of material properties for patient comfort. Species transport calculations show incomplete flushing of carbon dioxide during inspiration, with residual CO₂ persisting in recirculation zone cores, leading to rebreathing and reduced oxygen delivery efficiency. Additionally, a reduced-order model based on lumped-element representation enables rapid parametric analysis of mask performance across varying fabric resistances and fit conditions. This model predicts that peripheral leakage ratios reach 85-95% for surgical and N95 masks, yet outward fitted filtration efficiency exceeds 70% for medical-grade masks due to particle inertia effects. The complementary approaches provide quantitative insights for optimizing mask geometry and material selection to improve gas delivery efficiency, minimize CO₂ rebreathing, and enhance patient comfort while maintaining effective filtration.

Keywords:
oxygen mask
; computational fluid dynamics (CFD)
; reduced-order model (ROM)
; multiphysics simulation
; respiratory cycle
; flow patterns
; heat transfer
; filtration efficiency
; aerosol dynamics
1. Introduction
Oxygen masks are critical medical devices used in various healthcare settings to deliver supplemental oxygen to patients with respiratory insufficiencies. The performance of these masks directly impacts patient outcomes, yet the complex fluid dynamics and heat transfer phenomena occurring within the mask during the breathing cycle remain incompletely understood. Factors such as flow patterns, gas composition, and temperature distribution affect both oxygen delivery efficiency and patient comfort.
The twenty cited references encompass the author's own prior work, cutting-edge experimental studies, rigorous materials characterization [12,13,14,15], biomechanical mask-fit modeling [17], gap-flow analysis [16], and clinical evidence [15,18].
The foundational cluster establishes the mathematical framework upon which the manuscript builds [1,2,3]. Bird et al.'s canonical transport phenomena text [1] provides the governing equations for momentum, energy, and mass transport that appear directly in the manuscript's formulation, particularly the compressible Navier–Stokes equations and the convection–diffusion species equation. Wilcox's turbulence modeling text [2] supplies the standard k-ε model constants and justifies the turbulence model choice for the transitional Reynolds numbers characteristic of mask cavity flows. Incropera, DeWitt, Bergman, and Lavine's heat and mass transfer fundamentals [3] underpins the conjugate heat transfer formulation, including the thermal boundary conditions at fluid–solid interfaces and the thin-shell integration for the mask polymer walls. Porous-media methods are also well established in mechanics [4,5,6]. Jamalabadi et al. [4] demonstrated non-Newtonian flow with porous media and radiative transfer, while Jamalabadi [5] investigated local thermal non-equilibrium effects in porous media, directly informing the treatment of fibrous mask materials where solid fibers and flowing air may not reach instantaneous thermal equilibrium during rapid respiratory oscillations. A recent paper by Jamalabadi [6] applies the same porous media transport framework to nuclear reactor safety analysis, demonstrating cross-domain generality and contemporaneous peer validation.
Most modeling interest focuses on applied respiratory aerosol physics [7,8]. Finlay's authoritative text [7] provides the theoretical foundation for Stokes-number-based impaction, sedimentation, and diffusion as competing mechanisms governing aerosol fate. Kleinstreuer and Zhang's comprehensive Annual Review article [8] establishes that transitional turbulence models are necessary at peak inspiratory flow rates, motivating the k-ε choice.
Many research efforts focus on computational mask aerodynamics [9,10,11,12,13,14,15,16,17,18,19,20]. Xi, Si, and Nagarajan's investigation [19] of mask-wearing effects on SARS-CoV-2 aerosol inhalability establishes the inward protection context, serving as the inhalation companion to the current study's focus on exhalation-side source control. A critically important related work by Salati and colleagues simulated airflow, temperature, and species transport in the nasal cavity with an N95 respirator modeled as a boundary condition over multiple breathing cycles, finding excessive CO₂ inhalation and reduced heat transfer. This highlights a key distinction of the current manuscript, which models the mask cavity itself as the primary three-dimensional domain and resolves the internal flow structures responsible for CO₂ entrapment.
The leakage mechanics and reduced-order modeling cluster contains the most directly relevant prior work. Ni, Solano, Shoele, Seo, and Mittal's Physics of Fluids article [10] introduces the lumped-element reduced-order model that forms the analytical core of the manuscript's later sections. Mittal, Breuer, and Seo's Annual Review of Fluid Mechanics article [11] provides the most comprehensive state-of-the-art review and explicitly identifies five open challenges in mask flow physics. Xi, Barari, Si, Jamalabadi, Park, and Rein's study [9], which includes the current lead author as a co-author, quantified inspiratory leakage flow fractions for surgical masks with controlled peripheral gaps, providing the primary validation target for the full CFD model with a measured gap exit velocity against which the manuscript reports only 2.8% discrepancy. Perić and Perić's analytical and CFD study [16] of airflow through face masks provides the gap pressure-drop model adapted for the manuscript's three-dimensional implementation. Solano, Mittal, and Shoele's biomechanical simulation study [17] generated the four representative peripheral gap profiles used directly in the manuscript, revealing the nose bridge as the dominant leakage site.
The filter materials cluster provides the experimental microstructural and filtration data serving as inputs to the reduced-order model. Zangmeister, Radney, Vicenzi, and Weaver's ACS Nano study [12] measured filtration efficiencies for 32 household cloth materials and 7 polypropylene-based mask materials. Johnson, Morawska, Ristovski, and colleagues' characterization [13] of exhaled aerosol size distributions during normal breathing supplies the biologically realistic boundary condition for the outward filtration efficiency integral. Pui, Romay-Novas, and Liu's seminal experimental study [14] of particle deposition in 90° pipe bends provides the empirical basis for the airflow adherence ratio parameterization. Pan, Harb, Leng, and Marr's experimental measurements [15] of inward and outward protection efficiencies for eleven face coverings serve as the primary validation target for the reduced-order model.
The clinical effectiveness cluster grounds the quantitative predictions in real-world outcomes. Clapp, Sickbert-Bennett, Samet, and colleagues' JAMA Internal Medicine clinical evaluation [18] of inward filtration efficiency provides data used to supplement the reduced-order model's outward protection predictions. Cappa, Asadi, Barreda, Wexler, and Ristenpart's Scientific Reports study [20] measured expiratory aerosol particle concentrations in leakage airflows around surgical masks, finding source-control efficiencies consistent with the reduced-order model predictions.
The systematic survey identifies five fundamental gaps in the existing literature. No transient cyclic multiphysics model of mask cavity flows previously existed. The thermal equilibration of mask polymer walls remained entirely undocumented. The specific fluid-dynamic mechanism of CO₂ rebreathing—counter-rotating vortical recirculation zones trapping exhaled CO₂ during inspiration—had never been resolved in a three-dimensional CFD simulation. No combined full-CFD plus reduced-order model validation study existed for the same mask system. Finally, microstructure-resolved mask properties had not been used as simultaneous inputs to both a Darcy-law porous medium CFD model and a filtration efficiency function within a single integrated study.
These gaps translate directly into six substantiated novelty claims. The manuscript presents the first fully coupled, transient, three-physics CFD model of an oxygen mask across the complete respiratory cycle. It provides the first quantification of the approximately 600-second thermal equilibration time constant for oxygen mask polymer shells. The identification and spatial characterization of counter-rotating vortical structures constitutes the first resolved computational demonstration of the fluid-dynamic mechanism underlying face mask dead-space rebreathing. By applying the Ni et al. reduced-order model [10] in tandem with a three-dimensional full-physics CFD simulation, the manuscript provides the first cross-validation between these complementary approaches. The use of experimentally measured fiber parameters as simultaneous inputs to both the Darcy-law porous medium representation and the filtration efficiency function constitutes a microstructure-to-system-performance modeling chain not previously demonstrated. Finally, the manuscript provides a mechanistic explanation for the counter-intuitive finding that higher-resistance fabrics driving larger peripheral leakage simultaneously achieve higher outward filtration efficiency.
Previous studies have examined oxygen mask performance through experimental measurements and simplified analytical models. However, the cyclic nature of breathing, coupled with the complex geometry of the mask and the patient's face, presents significant challenges for comprehensive analysis. Computational fluid dynamics (CFD) offers a powerful tool to investigate these phenomena in detail.
This study aims to develop a comprehensive multiphysics model of an oxygen mask that captures the coupled interactions between fluid flow, heat transfer, and species transport throughout the respiratory cycle. Additionally, a reduced-order model is developed to enable rapid parametric analysis of mask performance across varying conditions. The specific objectives are: (1) to characterize the flow patterns within the mask during inspiration and expiration, (2) to quantify oxygen consumption and carbon dioxide accumulation, (3) to analyze temperature variations in both the air and mask walls, (4) to present the complete mathematical formulation governing these phenomena, and (5) to develop a reduced-order model for rapid assessment of mask performance. The results provide fundamental insights that can guide improved mask designs for enhanced gas delivery and patient comfort.
2. Mathematical Model
2.1. Governing Equations for Fluid Flow
The flow within the oxygen mask is governed by the Navier–Stokes equations for compressible flow, coupled with a turbulence model to account for the transitional and turbulent flow regimes encountered during breathing. The continuity equation (mass conservation) is expressed as:
where ρ is the fluid density and u is the velocity vector. The momentum conservation equation is given by:
where p is the pressure, τ is the viscous stress tensor, and F represents body forces (including buoyancy effects due to temperature and composition variations). For a Newtonian fluid, the viscous stress tensor is:
with μ representing the dynamic viscosity.
∂ρ/∂t + ∇·(ρu) = 0
ρ ∂u/∂t + ρ(u·∇)u = ∇·[−pI + τ] + F
τ = μ[∇u + (∇u)ᵀ] − (2/3)μ(∇·u)I
2.2. Turbulence Modeling
Due to the flow rates and geometry involved, the flow exhibits turbulent characteristics. The k-ε turbulence model is employed to capture these effects. This two-equation model solves for the turbulent kinetic energy k and its dissipation rate ε:
where μT is the turbulent viscosity given by:
and Pk represents the production of turbulent kinetic energy:
ρ ∂k/∂t + ρ(u·∇)k = ∇·[(μ + μT/σk)∇k] + Pk − ρε
ρ ∂ε/∂t + ρ(u·∇)ε = ∇·[(μ + μT/σε)∇ε] + Cε1(ε/k)Pk − Cε2ρ(ε²/k)
μT = ρCμ(k²/ε)
Pk = μT[∇u:(∇u + (∇u)ᵀ) − (2/3)(∇·u)²] − (2/3)ρk∇·u
The model constants adopt the standard values: Cμ = 0.09, Cε1 = 1.44, Cε2 = 1.92, σk = 1.0, and σε = 1.3.
2.3. Heat Transfer Equations
The temperature distribution in both the fluid and solid domains is governed by the energy equation. For the fluid domain, the heat transfer equation including convective and conductive terms is:
where T is temperature, Cp is the specific heat capacity at constant pressure, kf is thermal conductivity of the fluid, Q represents heat sources (including viscous dissipation and metabolic heat), and the last term accounts for viscous heating.
ρCp(∂T/∂t + u·∇T) = ∇·(kf∇T) + Q + τ:∇u
For the solid domains (mask and tubing walls), the heat transfer equation simplifies to conduction only:
where the subscript s denotes solid material properties, ρs is the solid density, Cp,s is the specific heat capacity of the solid, ks is the thermal conductivity of the solid, and Qs represents heat sources in the solid.
ρs Cp,s ∂T/∂t = ∇·(ks∇T) + Qs
The thermal boundary conditions at the fluid–solid interfaces account for conjugate heat transfer:
ensuring continuity of heat flux and temperature across the interface, where n is the unit normal vector at the interface.
−ks ∂T/∂n|s = −kf ∂T/∂n|f
Ts = Tf
For the thin shell domains representing the mask and tubing walls, the Heat Transfer in Shells interface employs a specialized formulation that integrates the temperature across the thickness:
where d is the shell thickness, ∇t denotes the tangential gradient operator, and qtop and qbottom represent heat fluxes from the top and bottom surfaces of the shell.
ρs d Cp,s ∂T/∂t − ∇t·(dks∇tT) = qtop + qbottom
2.4. Species Transport Equations
The transport of oxygen and carbon dioxide in the fluid domain is governed by the convection–diffusion equation for dilute species:
where ci is the concentration of species i (O₂ or CO₂), Di is the diffusion coefficient of species i in air, and Ri represents source terms due to metabolic processes or chemical reactions. For this study, no chemical reactions occur within the mask volume, so Ri = 0.
∂ci/∂t + ∇·(−Di∇ci) + u·∇ci = Ri
The diffusion coefficients are temperature and pressure dependent, typically modeled using the Chapman–Enskog relation:
where Di,ref is the reference diffusion coefficient at reference temperature Tref and pressure Pref.
Di = Di,ref (T/Tref)^1.75 (Pref/P)
2.5. Multiphysics Couplings
2.5.1. Nonisothermal Flow Coupling
The Nonisothermal Flow coupling connects the flow and heat transfer equations through temperature-dependent fluid properties and buoyancy forces. The density is computed using the ideal gas law:
where M is the molar mass of the gas mixture and R is the universal gas constant. Viscosity and thermal conductivity are also temperature-dependent, typically following Sutherland's law or polynomial expressions.
ρ = pM/(RT)
Buoyancy forces are included through the Boussinesq approximation or full density variation:
where g is gravitational acceleration and β is the thermal expansion coefficient.
Fbuoyancy = ρgβ(T − Tref)
2.5.2. Thermal Connection for Nonlayered Shells
This coupling connects the fluid domain temperature field to the shell domain representing the mask walls. The heat flux from the fluid to the shell is computed as:
where h is the local heat transfer coefficient determined from the flow solution.
q = h(Tfluid − Tshell)
2.5.3. Reacting Flow with Dilute Species
The Reacting Flow coupling links the flow field to species transport, ensuring that convective transport of species is computed consistently with the mass-averaged velocity from the flow solution. The species transport equation uses the same velocity field u from the Navier–Stokes equations, and any density variations due to composition changes are fed back into the flow equations through the equation of state.
2.6. Boundary Conditions for Respiratory Cycle
The respiratory cycle is implemented through time-varying boundary conditions that alternate between inspiration and expiration phases. During expiration, the nostrils function as inlets with specified velocity and species composition:
u = uexp(t), cO2 = cO2,expired, cCO2 = cCO2,expired, T = Tbody
During inspiration, the nostrils function as outlets with a pressure condition:
p = pambient, with suppressed backflow
The tubing boundary conditions alternate correspondingly: during inspiration, the tubing serves as an inlet with ambient air composition and temperature; during expiration, it functions as an outlet allowing exhaled air to exit.
Figure 1 illustrates the complete three-dimensional computational domain used in this study. The geometry faithfully represents a clinical oxygen delivery mask worn on a patient's face. The domain is subdivided into three coupled regions: the fluid-filled interior cavity between the mask and the patient's face, the thin polymeric shell of the mask and tubing walls modeled as solid domains, and a portion of the supply tubing. The nostril surfaces are identified as the key boundary condition locations where the respiratory-driven inflow and outflow conditions are alternately applied.
Figure 2 depicts the boundary condition configuration during expiration. The nostrils are prescribed as velocity inlets with a time-varying flow rate following a physiologically realistic exhalation waveform. Exhaled air temperature is set to body temperature (37°C), and species concentrations reflect expired gas composition (approximately 4% CO₂, reduced O₂). The tubing outlet is set as a pressure outlet, allowing exhaled gases to exit freely.
Figure 3 illustrates the boundary condition configuration during the inspiration phase. The nostrils are switched to pressure boundary conditions with suppressed backflow specification. The tubing inlet supplies ambient air at room temperature (approximately 22°C) with standard atmospheric oxygen concentration (approximately 21%). The alternating application of these two boundary condition sets—timed according to the physiological respiratory cycle of approximately 4 seconds per breath—creates the time-dependent cyclic flow field that governs heat and species transport in the mask.
3. Numerical Implementation
Figure 4 presents microscopy images of the three representative face mask categories used in this comparative study. The microstructural differences visible in these images directly explain the performance characteristics in Table 1. The reusable mask exhibits the largest average pore diameter (0.30 µm) and highest fibre volume fraction (0.27), consistent with a loosely woven fabric prioritizing breathability. The surgical mask displays a uniform, fine-pore nonwoven fiber structure contributing to its higher specific surface area (0.60 µm²/µm³) and smallest average pore size (0.20 µm). The N95 mask reveals a dense, electrostatically charged fiber mat with the highest tortuosity (12) and thickest average fibers (45 µm), creating tortuous particle pathways responsible for its superior filtration performance against sub-micron aerosols.
Table 1 presents a comparative analysis of the microstructural and performance characteristics of three distinct face mask types: reusable, surgical, and N95. The data reveal that the reusable mask has the highest volume fraction of fibres (0.27) and permeability (30 µm²), suggesting a denser yet more breathable structure, though its relatively large pore diameter (0.30 µm) may allow more particle penetration. The surgical mask exhibits the highest specific surface area (0.60 µm²/µm³) and smallest average pore diameter (0.20 µm), which enhances filtration efficiency but results in the lowest permeability (20 µm²). In contrast, the N95 mask features the lowest fibre volume fraction (0.10) but the highest tortuosity (12) and average fibre thickness (45 µm), contributing to its superior filtration capability. These microstructural variations directly influence key performance metrics such as permeability, filtration efficiency, and breathability, underscoring the design trade-offs inherent in mask engineering.
3.1. Computational Domain and Discretization
The computational domain encompasses the volume between the mask and the patient's face, as well as a portion of the connecting tubing. The domain is discretized using an unstructured mesh with boundary layer refinement near walls to capture velocity and temperature gradients accurately.
3.2. Study Setup
The simulation employs multiple study steps to handle the switching boundary conditions between expiration and inspiration phases. Several breathing cycles are simulated to reach cyclic steady-state conditions. A particularly innovative aspect of the modeling approach is the use of a Combine Solution study that concatenates the flow field solutions for the expiration and inspiration phases. This solution can be called an arbitrary number of times to efficiently compute the temperature and composition fields until cyclic steady state is achieved.
3.3. Solution Strategy
The solution strategy involves first solving for the flow field during each phase of the respiratory cycle, then using these flow fields to compute species transport and heat transfer over multiple cycles. This approach significantly reduces computational cost while capturing the essential physics of the cyclic process.
4. Model Validation
4.1. Experimental Validation Approach
To ensure the accuracy and reliability of the computational model, validation studies were conducted by comparing numerical predictions with experimental measurements of leakage flow velocities. The validation methodology follows the approach described by Xi et al. (2022) in their study of inspiratory leakage flow fraction for surgical masks with varying gaps and filter materials. The experimental validation employed a life-size head manikin fitted with a surgical mask (Mask 1, TSI-tested resistance of 146.0 Pa). Tapes were applied along the mask–face interface to ensure no leakage except at a precisely controlled gap location. A rectangular duct of 17 × 6.5 mm was inserted between the mask and skin at the left middle cheek, creating a gap of known dimensions and area of approximately 1.105 cm². A Robinair vacuum generated a steady inhalation flow rate of 15 L/min, replicating quiet breathing conditions. A TSI 9565 VelociCalc ventilation meter was used to measure the velocity at the gap exit, with measurements repeated five times to obtain average values and standard deviations.
4.2. Computational Setup for Validation
Complementary CFD predictions were performed using the same geometrical and flow conditions as the experiment. The computational model incorporated the head manikin geometry, the surgical mask with experimentally measured porous media properties, and the precisely defined gap at the left middle cheek. The low Reynolds number k-ω turbulence model was employed with porous media zones representing the mask material, using the experimentally determined resistance values from TSI 8130A mask tester measurements.
4.3. Validation Results
The comparison between experimentally measured and CFD-predicted gap flow velocities demonstrated excellent agreement. The experimental measurements yielded an average gap velocity of 1.42 ± 0.11 m/s, while the CFD predictions calculated a velocity of 1.38 m/s at the same sampling location (indicated by the black cross in Figure 5). The relative difference of approximately 2.8% between measured and predicted values falls well within acceptable limits for computational fluid dynamics validation, confirming that the numerical model adequately captures the complex flow dynamics associated with mask leakage.
Figure 5 presents the quantitative validation of the present computational model against independent experimental data obtained by Xi et al. (2022) [9] using a life-size head manikin with a precisely characterized gap at the left middle cheek. The color contour plot shows the velocity magnitude distribution in and around the mask–face gap, with the jet of leaked air clearly visible at elevated velocity. The close agreement between the CFD prediction (1.38 m/s) and the experimental measurement (1.42 ± 0.11 m/s) validates the numerical approach for modeling porous media resistance, gap flow physics, turbulence in the transitional regime, and the applied boundary conditions, providing confidence for the more complex cyclic simulations in the main results.
This validation exercise confirms several critical aspects of the modeling approach: (1) Porous media representation—the implementation of mask resistance using Darcy's law with experimentally determined coefficients accurately captures the pressure–flow relationship through the filter media; (2) Gap flow physics—the model correctly predicts the magnitude of flow through mask–face gaps; (3) Turbulence modeling—the low Reynolds number k-ω turbulence model adequately resolves the transitional flow regimes; and (4) Boundary condition implementation—the specification of inflow conditions and pressure boundaries appropriately represents the physical experiment.
The validated modeling approach provides confidence in extending the methodology to investigate the more complex oxygen mask configuration with cyclic breathing, heat transfer, and species transport.
5. Reduced-Order Model For Mask Performance Analysis
5.1. Model Framework
Following the approach of Ni et al. (2023), a reduced-order model is developed to enable rapid parametric analysis of mask performance across varying conditions. This model captures the essential physics of mask aerodynamics and particle filtration while significantly reducing computational cost compared to full CFD simulations. The reduced-order model is based on a lumped-element representation of the mask system, as shown schematically in Figure 6. The exhaled flow rate Qe is divided into two components: the flow penetrating the mask fabric Qm and the flow leaking through peripheral gaps Qg. The pressure difference across the mask ΔP is assumed uniform throughout the interior of the mask, leading to a parallel resistor network analogy.
Figure 6 presents the conceptual framework of the reduced-order model (ROM). The left panel (a) illustrates the physical configuration during exhalation: total volumetric flow rate Qe is partitioned into Qm that penetrates the mask fabric (subject to filtration), and Qg that escapes through peripheral gaps without passing through the filter material. The right panel (b) maps this scenario onto an equivalent electrical circuit analogy, where the mask fabric and each of the n = 60 discrete peripheral gap segments are represented as flow resistors in parallel under the same driving pressure difference ΔP.
5.2. Mask Fabric Model
The mask fabric is modeled as a porous medium following Darcy's law. The relationship between pressure drop across the fabric ΔPm and the average through-flow velocity ūm is given by:
where Ck is the fabric air resistance, Qm is the volumetric flow rate through the fabric, and Am is the fabric filtering area. For the current study, Am is taken as 319.35 cm², a typical value for medium-sized face masks. The air resistance Ck for various mask fabrics is derived from experimental measurements (Zangmeister et al., 2020).
ΔPm = Ck ūm = Ck (Qm / Am)
5.3. Peripheral Gap Model
The peripheral gaps are modeled as narrow rectangular channels distributed along the mask periphery. Following the approach of Perić and Perić (2020), the pressure drop through each gap segment combines major losses through the channel and minor losses at the entrance and exit:
where Hg,i is the height of gap segment i, Bg is the segment width, Lg is the gap length (fixed at 1.0 cm), μ is the air dynamic viscosity, ρ is the air density, and ζin = 0.5 and ζout = 1.0 are the loss coefficients for entrance and exit, respectively.
ΔPg = 12μLg Qg,i / (Bg Hg,i³) + (ζin + ζout)(1/2)ρ Qg,i² / (Bg Hg,i)²
5.4. Realistic Peripheral Gap Profiles
A key innovation of the reduced-order model is the incorporation of realistic peripheral gap profiles obtained from a quasi-static mechanical model (Solano et al., 2021). Four representative gap profiles are considered: (1) Nominal fit—average gap size H̄g = 0.65 mm, gap area ratio Rgap = 1.7%; (2) Oversized fit—H̄g = 1.09 mm, representing a loose fit; (3) Nose-leak fit—H̄g = 0.49 mm, with a large gap near the nose; and (4) Min-leak fit—H̄g = 0.36 mm, representing a very good fit.
Figure 7 shows the four spatially varying peripheral gap profiles incorporated into the reduced-order model, derived from a quasi-static biomechanical simulation of mask–face conformity by Solano et al. (2021) [17]. The nominal fit (panel a) with an average gap of 0.65 mm represents a well-fitted mask and serves as the reference case. The oversized fit (panel b) represents a slightly too large mask. The nose-leak profile (panel c) captures the common situation of poor nasal bridge sealing. The min-leak profile (panel d) corresponds to a near-ideal fit with very small, uniform gaps.
The periphery is discretized into 60 narrow segments (n = 60), each with width Bg ≈ 1.23 cm, allowing the spatially varying gap profile to be accurately represented.
5.5. Lumped-Element System of Equations
The complete system of equations for the reduced-order model is:
ΔP = Ck (Qm / Am)
ΔP = 12μLg Qg,i / (Bg Hg,i³) + (ζin + ζout)(1/2)ρ Qg,i² / (Bg Hg,i)², i = 1,…,n
Qe = Qm + Σᵢ Qg,i
Solving this system yields the flow partition between mask penetration and peripheral leakage, from which the leakage ratio η = Qg/Qe can be determined.
5.6. Outward Fitted Filtration Efficiency (oFFE)
The outward fitted filtration efficiency (oFFE) quantifies the fraction of exhaled particles that are filtered by the mask when worn. Following the framework of Mittal et al. (2023), oFFE depends on the fabric filtration efficiency FE(D), the leakage ratio η, and the airflow adherence ratio σ(Stk), which accounts for the fraction of particles that follow the airflow versus those that impact directly on the mask fabric due to inertia.
The airflow adherence ratio σ is a function of the particle Stokes number:
where ρp is the particle density, D is the particle diameter, and U is the exhaled flow velocity. Based on experimental data for particle deposition in a 90° turning flow (Pui et al., 1987), σ(Stk) is modeled as:
where DE₀ = 0.47, Cσ = 2.90, Stkσ = −0.49, and Stk* is the normalized Stokes number.
Stk = ρp D U / (18μ)
σ(Stk) = 1 − DE₀ − DE₀ tanh(Cσ(Stk* − Stkσ))
The probability that a particle of diameter D is filtered by the mask is:
PF(D) = FE(D) [1 − σ(Stk) η]
The overall oFFE for a given particle size distribution PE(D) is then:
oFFE = ∫ FE(D) [1 − σ(Stk) η] PE(D) dD
For normal breathing, the particle size distribution from Johnson et al. (2011) is employed, with D₀ = 0.1 µm and D₁ = 10 µm.
5.7. Construction of Filtration Efficiency Functions
Filtration efficiency FE(D) for various mask fabrics is constructed based on experimental data from Zangmeister et al. (2020). For particles smaller than 553 nm, interpolation of experimental data using rational polynomials is employed. For larger particles up to 10 µm, extrapolation using exponential functions is used, with FE set to 100% at 10 µm based on the pore sizes of typical mask fabrics.
Figure 8 presents the filtration efficiency characterization serving as a critical input to the reduced-order model's oFFE predictions. Panel (a) consolidates experimental data from Zangmeister et al. (2020) [12], who measured filtration efficiency of 32 cloth and 7 polypropylene-based materials against size-selected NaCl aerosol particles. Panel (b) shows size-resolved filtration efficiency functions FE(D) constructed for four representative fabric categories. All curves exhibit the characteristic U-shape of fibrous filter efficiency: a minimum in the 0.1–0.5 µm range where neither diffusion nor inertial impaction is effective, followed by a monotonic increase toward 100% as particle diameter approaches typical pore sizes.
5.8. Validation of the Reduced-Order Model
The reduced-order model predictions are validated against experimental measurements of outward protection efficiency from Pan et al. (2021). Figure 9 compares oFFE values for three general mask categories: medical-grade masks, synthetic fabric masks, and cotton fabric masks. The reduced-order model captures the observed trend that medical-grade masks consistently achieve higher oFFE (70–75%) than synthetic and cotton fabrics (40–90%), due to their higher fabric air resistance and finer fiber structure.
For surgical masks, both the model and experiments yield oFFE values between 70% and 75%. For cotton fabrics, the model predicts oFFE in the range of 40–90%, consistent with the experimental range of 50–90%. This validation demonstrates the capability of the reduced-order model to capture the essential physics of mask filtration.
5.9. Reduced-Order Model Results
5.9.1. Peripheral Leakage Ratio
The leakage ratio η exhibits a strong dependence on fabric air resistance Ck, as shown in Figure 10a. For the nominal gap profile, η increases monotonically with Ck, approaching 100% for Ck > 800 kg/(m²·s). Even for surgical masks with moderate air resistance (Ck ≈ 550 kg/(m²·s)), the leakage ratio reaches approximately 90%.
Figure 10 presents the leakage ratio predictions from the reduced-order model. Panel (a) shows that for the nominal gap profile, the leakage ratio η—the fraction of total exhaled flow escaping through peripheral gaps—increases monotonically with fabric air resistance Ck. For surgical masks with Ck ≈ 550 kg/(m²·s), predicted leakage approaches 90%, meaning only about 10% of exhaled flow passes through the filter material. Panel (b) extends this analysis across all four gap profiles.
For a given fabric, larger gaps (oversized fit) produce higher leakage ratios. Counter-intuitively, higher-quality masks (higher Ck) generate larger peripheral leakage than cloth masks for the same mask–face fit.
Figure 11 provides a supplementary analysis of leakage ratio sensitivity to gap size. The key observation is the plateau effect: beyond a threshold gap height (typically around 1–2 mm, dependent on fabric resistance), the peripheral gap offers negligible flow resistance compared to the mask fabric, and virtually all exhaled flow routes through the gaps regardless of exact size.
Figure 12 illustrates the dependence of leakage ratio on exhaled flow rate. At low flow rates (quiet breathing, ~15 L/min), peripheral gap resistance is dominated by viscous losses. As flow rate increases toward exercise breathing levels (30–80 L/min), inertial minor loss terms become increasingly important, causing gap resistance to increase quadratically. This disproportionate increase in gap resistance at high flow rates tends to redirect a larger fraction of flow back through the filter fabric, causing η to decrease slightly for moderate and high fabric resistances.
5.9.2. Local Leakage Velocity Distribution
The reduced-order model enables quantification of local leakage velocities along the mask periphery, as shown in Figure 13 for a surgical mask. Peak velocities occur at regions with larger gaps: both sides of the nose, the center of the side mask edges, and the corners of the bottom mask edge. For the nominal fit, peak velocities range from 0.5 to 1.5 m/s, corresponding to Reynolds numbers of O(100) based on gap height.
5.9.3. Outward Fitted Filtration Efficiency
Figure 14 presents oFFE results for all investigated mask fabrics. Several key observations emerge: (1) Despite peripheral leakage ratios of 85–95%, all medical-grade masks achieve oFFE greater than 70% for outward protection. (2) Nearly one-third of cloth masks achieve oFFE exceeding 50%, with some reaching approximately 90% despite leakage ratios near 95%. (3) oFFE generally increases with increasing leakage ratio, contrary to intuition, because higher air resistance fabrics also provide better filtration of particles that impact on the fabric. (4) The minimum filtration efficiency FEmin at MPPS significantly underestimates actual outward protection, as it does not account for the larger particles predominant in exhaled breath.
5.9.4. Implications for Transmission Reduction
The reduced-order model enables estimation of community-level transmission reduction through mask wearing. Using the average oFFE for N95 masks (95%), surgical masks (72%), and cloth masks (45%), and considering various mask-type preference scenarios, the reduction in transmission due to outward protection alone ranges from 52% to 70% (Table 2).
When combined with inward data, the total transmission reduction increases by 12–17%, reaching 66–87% depending on the mask preference scenario. These estimates provide quantitative support for policies encouraging widespread mask use.
6. Results and Discussion
6.1. Flow Patterns from Full CFD
The flow field within the oxygen mask reveals complex recirculation patterns that significantly influence gas residence times and mixing. During the expiration phase, two distinct recirculation zones form on each side of the patient's mouth region.
Figure 15 presents the most significant fluid-dynamic finding from the full CFD simulations: the formation of a pair of counter-rotating recirculation zones within the mask cavity during expiration. The streamline visualization shows that expiratory jets from the nostrils travel outward and downward, and upon reaching the anterior mask wall, the flow separates to form two distinct vortices. Peak velocities of approximately 0.5–1.5 m/s occur at the jet cores near the nostrils, while the recirculation zone cores have near-zero velocity. From a mass transfer perspective, these recirculation zones act as traps for expired CO₂: gas entrained into the vortex cores has prolonged residence time within the mask cavity and is not efficiently flushed out during subsequent inspiration.
These recirculation zones have important implications for mask performance. By increasing the residence time of gases within the mask, they promote mixing between fresh oxygen and exhaled air. This mixing affects both oxygen availability during inspiration and carbon dioxide rebreathing. From a fluid dynamics perspective, these recirculation zones can be characterized by their vorticity:
and the recirculation strength can be quantified by the circulation:
ω = ∇ × u
Γ = ∮C u·dl = ∫S ω·n dS
6.2. Temperature Field from Full CFD
The temperature distribution within the oxygen mask shows interesting characteristics throughout the respiratory cycle. Analysis of the temperature field reveals that variations in air temperature at the nostrils' position are relatively small, despite the cyclic nature of breathing.
Figure 16 shows the coupled temperature field in both the fluid domain (mask interior air) and solid domain (mask and tubing walls) during expiration. The warm exhaled air at approximately 37°C enters through the nostrils and convectively heats the inner mask surface through conjugate heat transfer, while the outer surface loses heat to the ambient environment by free convection. A key observation from the transient simulations is that the initial cold mask requires a substantial number of breathing cycles to equilibrate: the polymer walls gradually accumulate thermal energy cycle by cycle, with temperature at any fixed wall location monotonically increasing until periodic steady state is reached after approximately 600 seconds (~150 breathing cycles at 15 breaths/min).
The heat transfer process can be analyzed through the Nusselt number at the walls:
which characterizes the convective heat transfer efficiency, where L is a characteristic length, and Tbulk is the bulk fluid temperature.
Nu = hL/kf = [∂T/∂n / (Twall − Tbulk)]wall · L
Figure 17 quantifies the thermal transient behavior of the oxygen mask system by plotting temperature as a function of time at two representative monitoring locations. The nostril air temperature shows an oscillating pattern synchronized with the breathing cycle. The mask wall temperature shows a slow monotonic rise over 600 seconds as the polymer material is gradually heated by repeated exposure to warm exhaled breath. The exponential-like approach to steady state is characteristic of first-order thermal systems and is described by the thermal time constant τthermal = ρs d Cp,s / h.
6.3. Species Transport from Full CFD
The transport of oxygen and carbon dioxide within the mask reaches cyclic steady state more quickly than the temperature field, typically within a few breathing cycles. However, analysis of the concentration profiles reveals important features of gas exchange dynamics.
Figure 18 presents the species transport results from the full CFD simulation by tracking molar concentrations of both O₂ and CO₂ at the nostril boundary over multiple breathing cycles. The O₂ concentration trace shows a characteristic sawtooth profile. The CO₂ profile is approximately mirror-imaged, rising sharply during expiration and falling during inspiration. The critical observation is that CO₂ concentration does not return to zero at the end of each inspiration phase: a residual concentration persists at the nostrils throughout the cycle, confirming rebreathing of expired gas due to incomplete flushing of the mask dead volume. Both traces converge to periodic steady state within approximately 5–6 breathing cycles.
A critical finding is that carbon dioxide is not completely flushed out of the mask during inspiration. This residual CO₂ leads to rebreathing, which can affect patient comfort and, in severe cases, contribute to carbon dioxide retention. Similarly, oxygen is not completely replenished during inspiration, meaning that the inspired oxygen concentration may be lower than the supplied concentration.
Figure 19 provides spatial context for the incomplete CO₂ flushing documented in Figure 18 by showing the concentration field within the mask at the end of an inspiration phase. The color contours reveal that while the bulk of the mask interior has been refreshed with lower-CO₂ inspired gas, two distinct pockets of elevated CO₂ concentration persist at locations corresponding precisely to the recirculation zone cores identified in Figure 15. This spatial correlation is direct evidence that the vortical flow structures act as mass-transfer barriers, effectively isolating pockets of expired gas from the fresh inspiratory flow.
Figure 20 completes the species transport picture by showing the O₂ concentration field during expiration. Concentration contours reveal a clear spatial gradient: O₂ concentration is highest near the tubing inlet where fresh gas enters and decreases progressively toward the nostril openings. The recirculation zones identified in Figure 15 create locally O₂-depleted pockets poorly mixed with the incoming supply gas, mirroring the CO₂ accumulation observed in Figure 19.
The incomplete flushing of carbon dioxide and incomplete replenishment of oxygen are directly related to the recirculation zones identified in the flow field analysis. The species transport can be characterized by the Peclet number:
which compares convective to diffusive transport. High Peclet numbers indicate convection-dominated transport, while low values indicate diffusion-dominated transport. In the recirculation zones, local Peclet numbers may be significantly lower, allowing diffusive mixing to play a more important role.
Pei = |u|L / Di
6.4. Synthesis of CFD and Reduced-Order Model Results
The combination of full CFD and reduced-order modeling provides complementary insights into mask performance. The CFD simulations capture detailed spatial and temporal variations in flow, temperature, and species fields, revealing mechanisms such as recirculation zones that affect gas residence time and mixing. The reduced-order model enables rapid parametric exploration across a wide range of mask fabrics and fit conditions, quantifying trade-offs between fabric resistance, leakage, and filtration efficiency.
Key synthesized findings include: (1) Recirculation zones identified in CFD increase gas residence time, affecting both oxygen availability and CO₂ rebreathing. These zones are influenced by mask geometry and flow rate, parameters that can be systematically varied in the reduced-order model. (2) Thermal response time of approximately 600 seconds from CFD indicates the importance of material properties, which can be optimized using the reduced-order framework. (3) Incomplete gas exchange observed in CFD is consistent with the high leakage ratios predicted by the reduced-order model for surgical masks (~90%). (4) Particle filtration predictions from the reduced-order model (70–95% oFFE for medical-grade masks) suggest that despite high leakage, most exhaled particles are filtered—a conclusion that could not be reached from flow field analysis alone.
7. Conclusions
This study presents a comprehensive multiphysics model of flow and heat transfer in an oxygen mask throughout the respiratory cycle, augmented by a reduced-order model for rapid parametric analysis of mask performance. The complete mathematical formulation, including the governing equations for fluid flow (Equations 1–7), heat transfer (Equations 8–12), and species transport (Equations 13–14), along with the multiphysics couplings (Equations 15–17), provides a rigorous framework for analyzing the complex interactions in this system. The model was validated against experimental measurements of gap flow velocities, demonstrating excellent agreement with a relative difference of approximately 2.8% between predicted and measured values.
The reduced-order model, based on the framework of Ni et al. (2023), incorporates realistic peripheral gap profiles, fabric-specific filtration efficiencies, and particle inertia effects to predict outward fitted filtration efficiency (oFFE). The model successfully captures several important phenomena: (1) Flow patterns from full CFD—recirculation zones form during expiration on each side of the mouth, increasing gas residence times and affecting mixing within the mask (Equations 27–28). (2) Temperature field from full CFD—mask walls require approximately 600 seconds to reach cyclic thermal steady state, with a thermal time constant given by τthermal = ρsdCp,s/h. (3) Species transport from full CFD—carbon dioxide is not completely flushed during inspiration, and oxygen is not completely replenished, leading to rebreathing and reduced oxygen delivery efficiency (Equation 30). (4) Reduced-order model leakage predictions—peripheral leakage ratio η increases with fabric air resistance, reaching 85–95% for surgical and N95 masks even with good fit. (5) Reduced-order model oFFE predictions—despite high leakage, medical-grade masks achieve oFFE >70%, and many cloth masks exceed 50% oFFE. (6) Transmission reduction estimates—outward protection alone could reduce transmission by 52–70%, while combined inward and outward protection could achieve 66–87% reduction.
These findings have several implications for oxygen mask design and optimization. The presence of recirculation zones suggests that geometric modifications could potentially improve flushing efficiency and reduce CO₂ rebreathing. The thermal response time indicates that materials with lower thermal mass or enhanced heat transfer characteristics might provide more rapid temperature equilibration, improving initial comfort. The reduced-order model results demonstrate that fabric selection involves trade-offs between breathability (lower Ck) and filtration efficiency (higher Ck), with the optimal balance depending on the intended use scenario.
Future work could explore geometric modifications to reduce recirculation and improve flushing efficiency, investigate the effects of different breathing patterns and flow rates, extend the reduced-order model to coughing and sneezing scenarios, incorporate particle breakup and rebound effects, and further validate the model predictions with additional experimental measurements across a wider range of mask types and fit conditions.
Author Contributions
Conceptualization, methodology, software, validation, formal analysis, investigation, resources, data curation, writing—original draft preparation, writing—review and editing, visualization, and funding acquisition: M.Y.A.J. The author has read and agreed to the published version of the manuscript.
Funding
This research received no external funding.
Conflicts of Interest
The author declares no conflict of interest.
Nomenclature
| Symbol | Description | Units |
| ρ | Density | kg/m³ |
| u | Velocity vector | m/s |
| p | Pressure | Pa |
| τ | Stress tensor | Pa |
| F | Body force vector | N/m³ |
| k | Turbulent kinetic energy | m²/s² |
| ε | Turbulent dissipation rate | m²/s³ |
| μ | Dynamic viscosity | Pa·s |
| μT | Turbulent viscosity | Pa·s |
| T | Temperature | K |
| Cp | Specific heat capacity at constant pressure | J/(kg·K) |
| Cp,s | Specific heat capacity of solid | J/(kg·K) |
| kf | Thermal conductivity of fluid | W/(m·K) |
| ks | Thermal conductivity of solid | W/(m·K) |
| q | Heat flux vector | W/m² |
| Q | Heat source | W/m³ |
| Qs | Heat source in solid | W/m³ |
| ci | Concentration of species i | mol/m³ |
| cO2 | Oxygen concentration | mol/m³ |
| cCO2 | Carbon dioxide concentration | mol/m³ |
| Di | Diffusion coefficient of species i | m²/s |
| Di,ref | Reference diffusion coefficient of species i | m²/s |
| Ri | Reaction rate of species i | mol/(m³·s) |
| t | Time | s |
| d | Shell thickness | m |
| g | Gravitational acceleration vector | m/s² |
| β | Thermal expansion coefficient | 1/K |
| h | Heat transfer coefficient | W/(m²·K) |
| M | Molar mass | kg/mol |
| R | Universal gas constant | J/(mol·K) |
| Pk | Production of turbulent kinetic energy | kg/(m·s³) |
| Cμ, Cε1, Cε2 | Turbulence model constants | — |
| σk, σε | Turbulence model Prandtl numbers | — |
| I | Identity tensor | — |
| n | Unit normal vector | — |
| ω | Vorticity vector | 1/s |
| Γ | Circulation | m²/s |
| Nu | Nusselt number | — |
| Pei | Peclet number for species i | — |
| τthermal | Thermal time constant | s |
| Ck | Fabric air resistance | kg/(m²·s) |
| η | Leakage ratio | — |
| σ | Airflow adherence ratio | — |
| Stk | Stokes number | — |
| FE | Filtration efficiency | — |
| oFFE | Outward fitted filtration efficiency | — |
| Qe | Exhaled volume flow rate | m³/s |
| Qm | Mask penetration flow rate | m³/s |
| Qg | Gap leakage flow rate | m³/s |
| Hg | Gap height | m |
| Bg | Gap width | m |
| Lg | Gap length | m |
References
- Bird, R.B.; Stewart, W.E.; Lightfoot, E.N. Transport Phenomena, 2nd ed.; John Wiley & Sons: Hoboken, NJ, USA, 2007; ISBN 978-0-470-11539-8.
- Wilcox, D.C. Turbulence Modeling for CFD, 3rd ed.; DCW Industries: La Cañada, CA, USA, 2006; ISBN 978-1-928729-08-2.
- Incropera, F.P.; DeWitt, D.P.; Bergman, T.L.; Lavine, A.S. Fundamentals of Heat and Mass Transfer, 6th ed.; John Wiley & Sons: Hoboken, NJ, USA, 2007; ISBN 978-0-471-45728-2.
- Jamalabadi, M.A.; Hooshmand, P.; Bagheri, N.; KhakRah, H.; Dousti, M. Numerical Simulation of Williamson Combined Natural and Forced Convective Fluid Flow between Parallel Vertical Walls with Slip Effects and Radiative Heat Transfer in a Porous Medium. Entropy 2016, 18, 147. [CrossRef]
- Jamalabadi, M.Y.A. Effects of Micro- and Macro-Scale Viscous Dissipations with Heat Generation and Local Thermal Non-Equilibrium on Thermal Developing Forced Convection in Saturated Porous Media. J. Porous Media 2015, 18, 843–860. [CrossRef]
- Jamalabadi, M.Y.A. Thermohydraulic safety analysis of a research reactor by transport in porous media technique. Evolutions Mech. Eng. 2025, 6. [CrossRef]
- Finlay, W.H. The Mechanics of Inhaled Pharmaceutical Aerosols: An Introduction; Academic Press: London, UK, 2001; ISBN 978-0-12-256971-5.
- Kleinstreuer, C.; Zhang, Z. Airflow and Particle Transport in the Human Respiratory System. Annu. Rev. Fluid Mech. 2010, 42, 301–334. [CrossRef]
- Xi, J.; Barari, K.; Si, X.A.; Abdollahzadeh Jamalabadi, M.Y.; Park, J.H.; Rein, M. Inspiratory Leakage Flow Fraction for Surgical Masks with Varying Gaps and Filter Materials. Phys. Fluids 2022, 34, 041908. [CrossRef]
- Ni, C.; Solano, T.; Shoele, K.; Seo, J.H.; Mittal, R. Face Masks Provide High Outward Protection Despite Peripheral Leakage: Insights from a Reduced-Order Model of Face Mask Aerodynamics. Phys. Fluids 2023, 35, 061911. [CrossRef]
- Mittal, R.; Breuer, K.; Seo, J.H. The Flow Physics of Face Masks. Annu. Rev. Fluid Mech. 2023, 55, 193–211. [CrossRef]
- Zangmeister, C.D.; Radney, J.G.; Vicenzi, E.P.; Weaver, J.L. Filtration Efficiencies of Nanoscale Aerosol by Cloth Mask Materials Used to Slow the Spread of SARS-CoV-2. ACS Nano 2020, 14, 9188–9200. [CrossRef]
- Johnson, G.R.; Morawska, L.; Ristovski, Z.D.; Hargreaves, M.; Mengersen, K.; Chao, C.Y.H.; Wan, M.P.; Li, Y.; Xie, X.; Katoshevski, D.; et al. Modality of human expired aerosol size distributions. J. Aerosol Sci. 2011, 42, 839–851. [CrossRef]
- Pui, D.Y.H.; Romay-Novas, F.; Liu, B.Y.H. Experimental study of particle deposition in bends of circular cross section. Aerosol Sci. Technol. 1987, 7, 301–315. [CrossRef]
- Pan, J.; Harb, C.; Leng, W.; Marr, L.C. Inward and outward effectiveness of cloth masks, a surgical mask, and a face shield. Aerosol Sci. Technol. 2021, 55, 718–733. [CrossRef]
- Peric, R.; Peric, M. Analytical and Numerical Investigation of the Airflow in Face Masks used for Protection against COVID-19 Virus—Implications for Mask Design and Usage. J. Appl. Fluid Mech. 2020, 13, 1911–1923. [CrossRef]
- Solano, T.; Mittal, R.; Shoele, K. One size fits all: A simulation framework for face-mask fit on population-based faces. PLOS ONE 2021, 16, e0252143. [CrossRef]
- Clapp, P.W.; Sickbert-Bennett, E.E.; Samet, J.M.; Berntsen, J.; Zeman, K.L.; Anderson, D.J.; Weber, D.J.; Bennett, W.D. Evaluation of Cloth Masks and Modified Procedure Masks as Personal Protective Equipment for the Public During the COVID-19 Pandemic. JAMA Intern. Med. 2021, 181, 463–469. [CrossRef]
- Xi, J.; Si, X.A.; Nagarajan, R. Effects of mask-wearing on the inhalability and deposition of airborne SARS-CoV-2 aerosols in human upper airway. Phys. Fluids 2020, 32, 123312. [CrossRef]
- Cappa, C.D.; Asadi, S.; Barreda, S.; Wexler, A.S.; Ristenpart, W.D. Expiratory aerosol particle escape from surgical masks due to imperfect sealing. Sci. Rep. 2021, 11, 12110. [CrossRef]
Figure 1.
Computational domain and model geometry of the oxygen mask system. The mesh encompasses the mask interior volume, the patient's facial region, and the connecting oxygen supply tubing. Nostril boundaries serve as the primary inlet/outlet locations where time-varying boundary conditions are imposed to simulate the respiratory cycle.
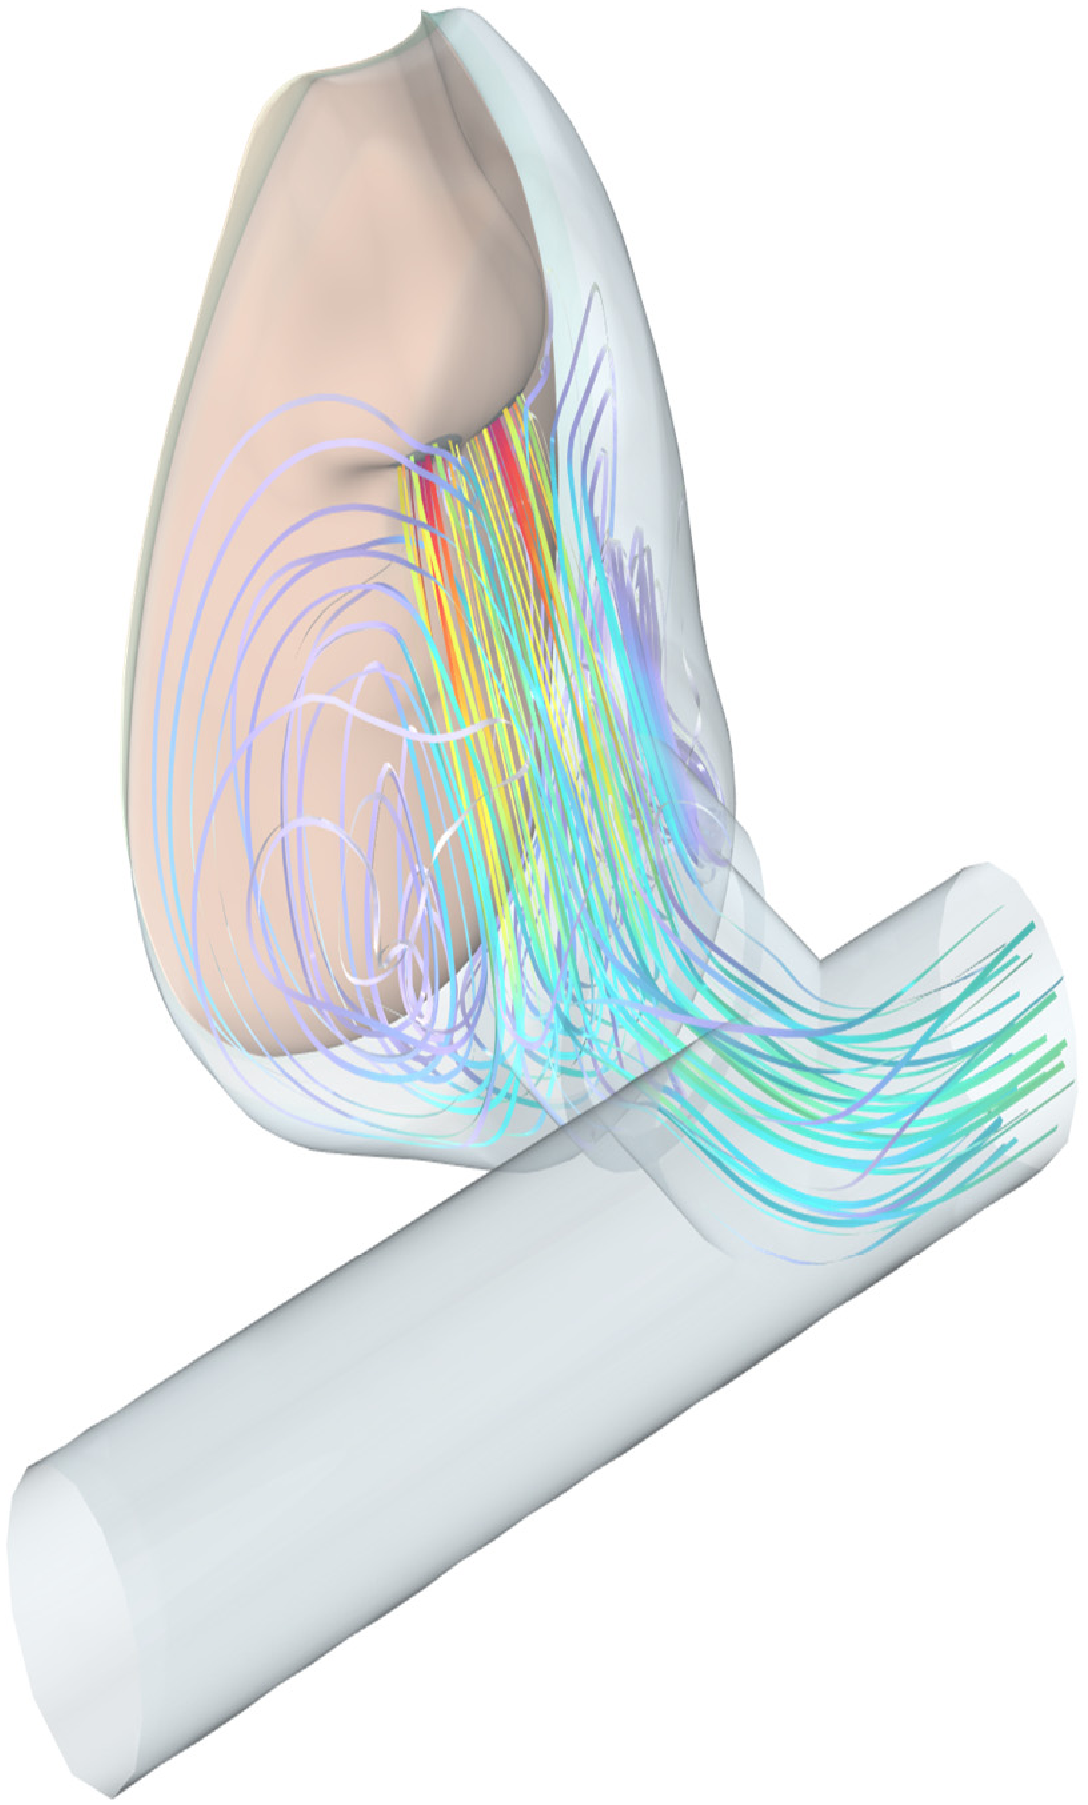
Figure 2.
Boundary condition setup during the expiration phase. The nostril surfaces act as velocity inlets delivering warm, CO₂-rich exhaled air, while the tubing outlet permits exhaled air to exit the system.
Figure 2.
Boundary condition setup during the expiration phase. The nostril surfaces act as velocity inlets delivering warm, CO₂-rich exhaled air, while the tubing outlet permits exhaled air to exit the system.
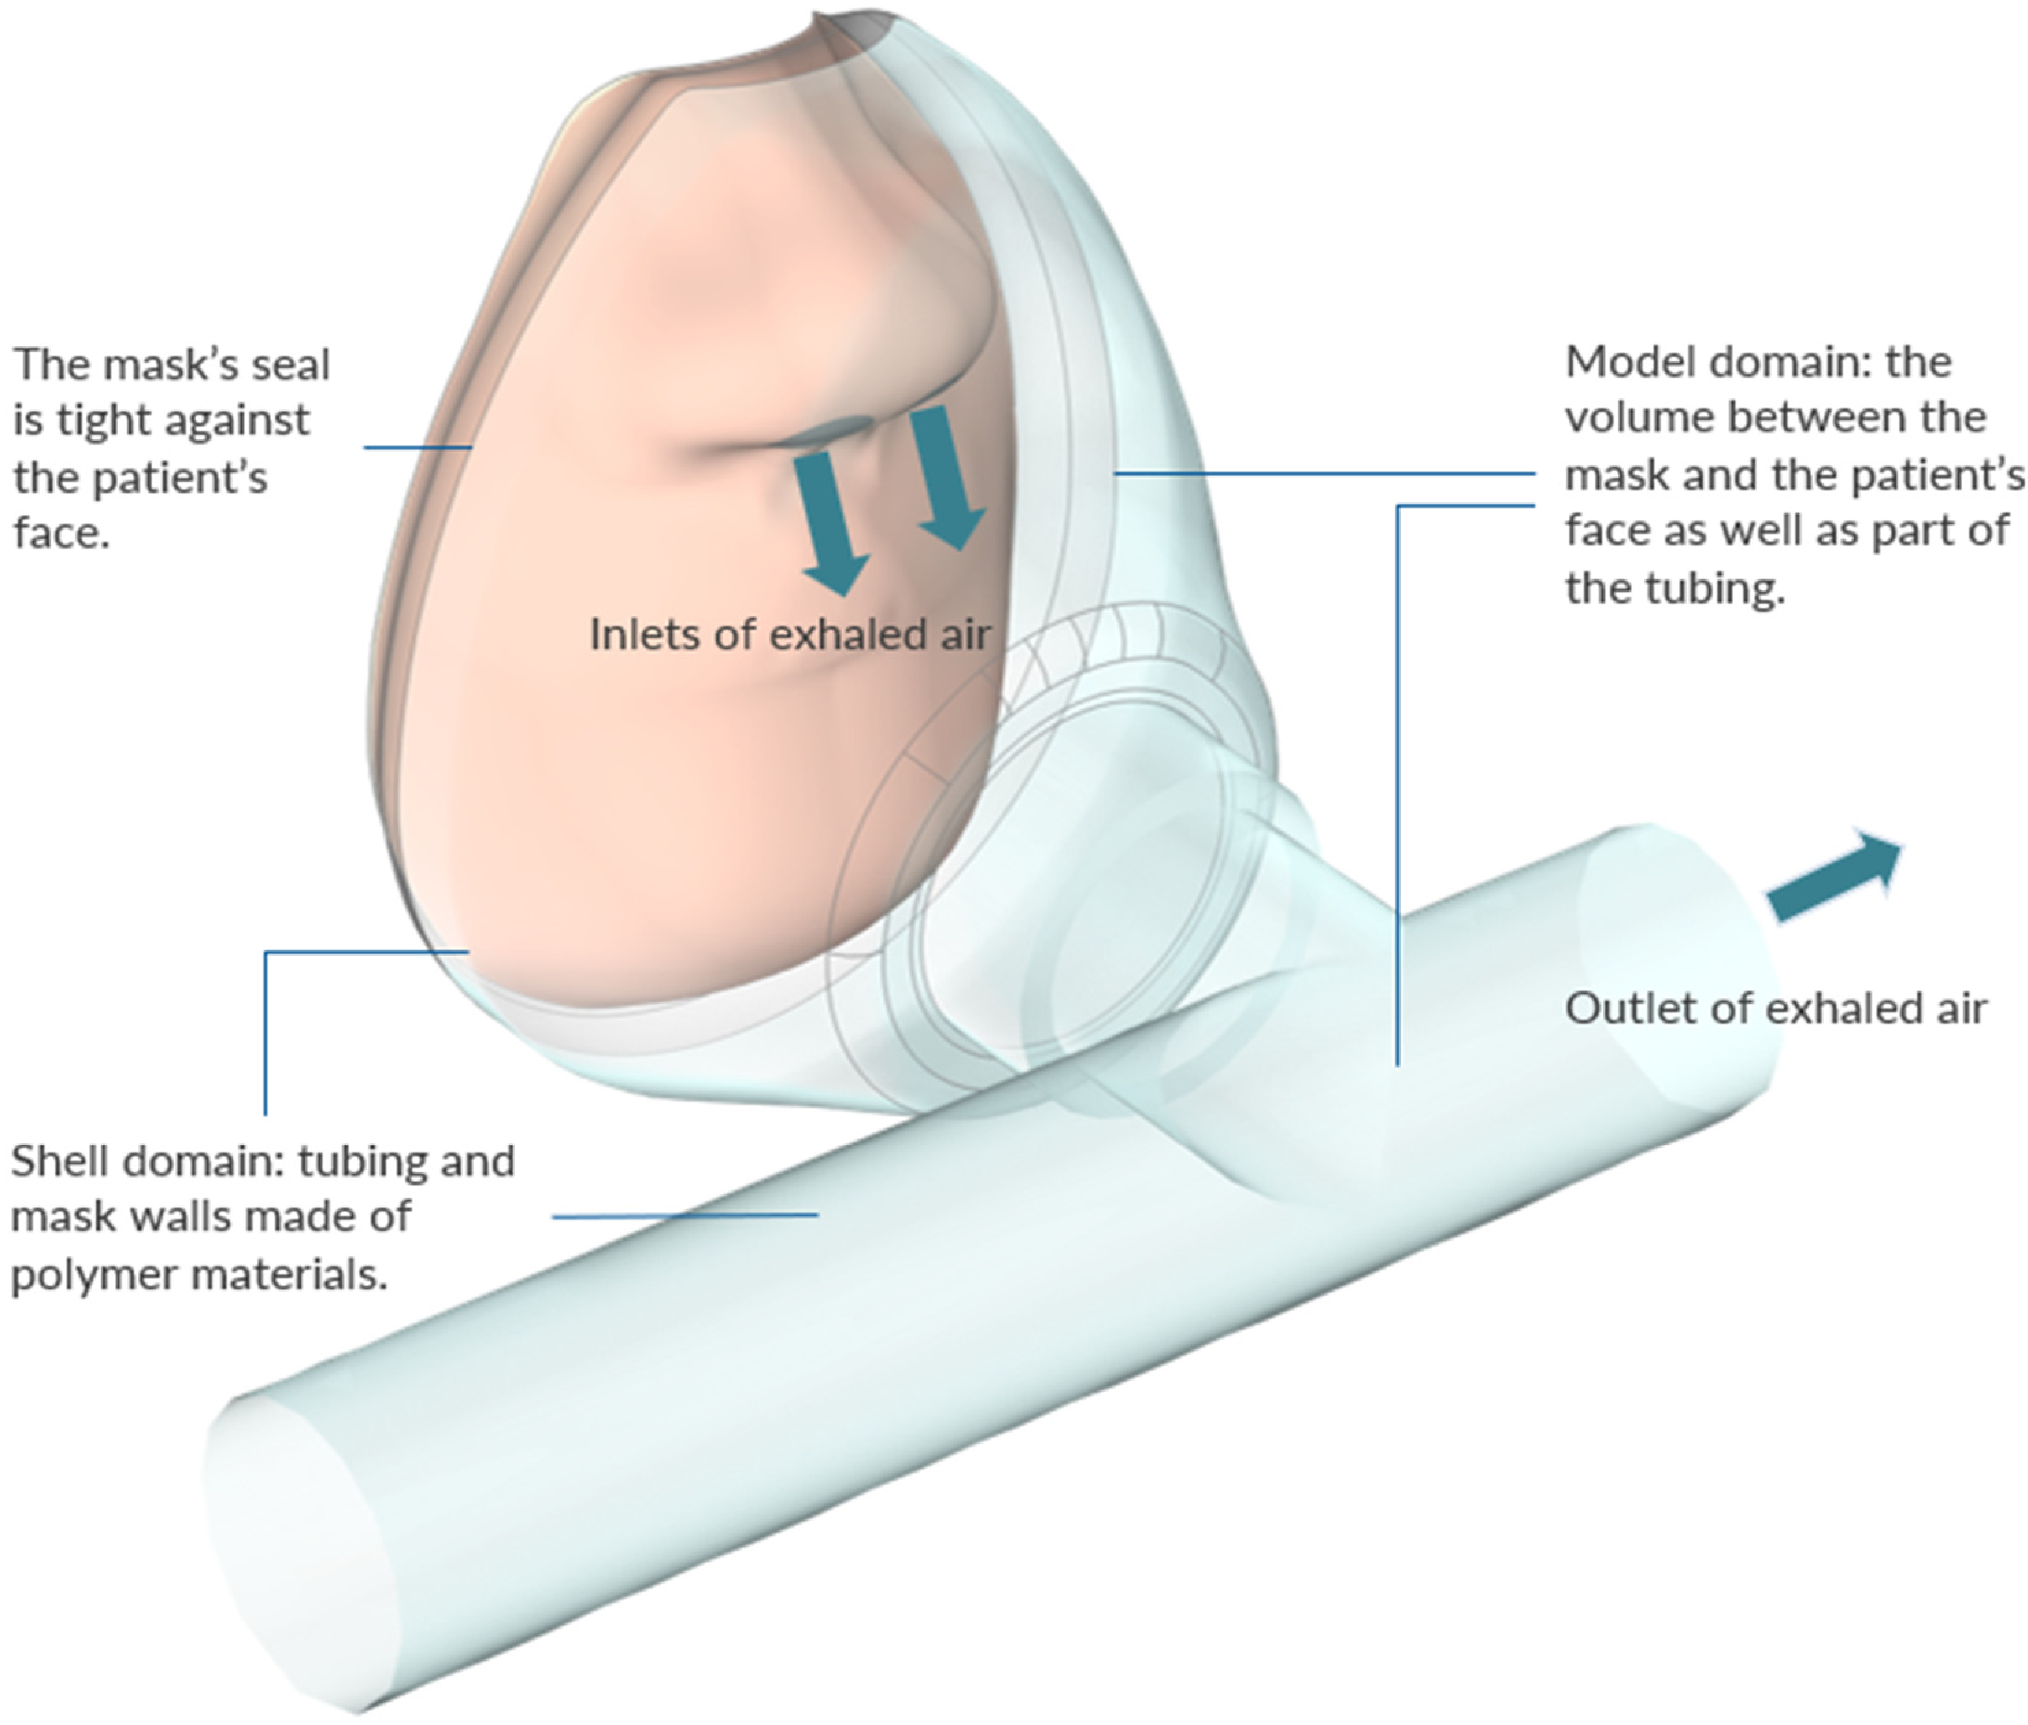
Figure 3.
Boundary condition setup during the inspiration phase. The nostril surfaces switch to pressure outlets allowing inhalation, while the tubing inlet supplies fresh ambient air with prescribed oxygen concentration and temperature.
Figure 3.
Boundary condition setup during the inspiration phase. The nostril surfaces switch to pressure outlets allowing inhalation, while the tubing inlet supplies fresh ambient air with prescribed oxygen concentration and temperature.
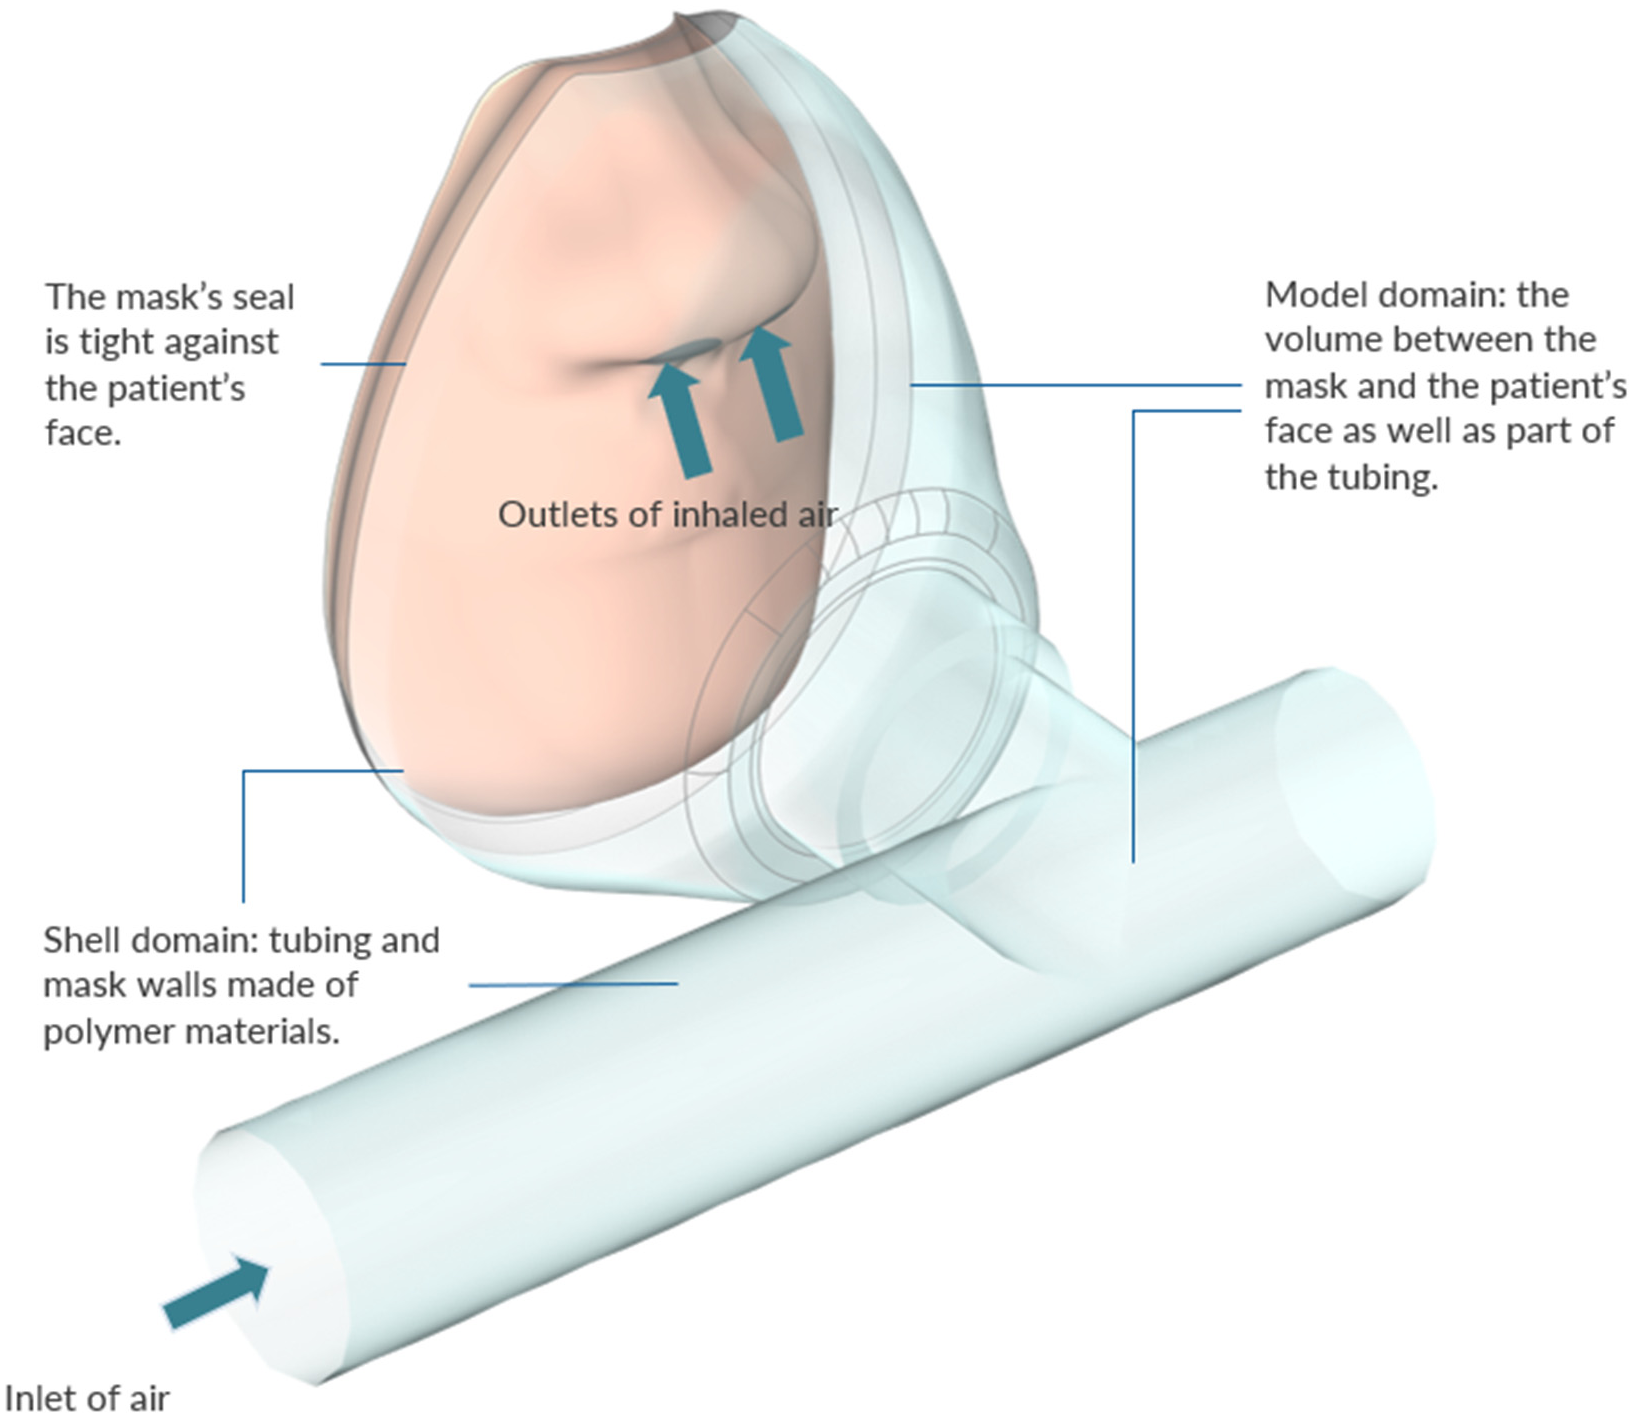
Figure 4.
Microscopic images of the three face mask types: reusable cloth mask (left), surgical mask (center), and N95 respirator (right). The images reveal distinct fiber architectures, pore geometries, and surface morphologies that govern the filtration, permeability, and airflow resistance characteristics of each mask type, as quantified in Table 1.
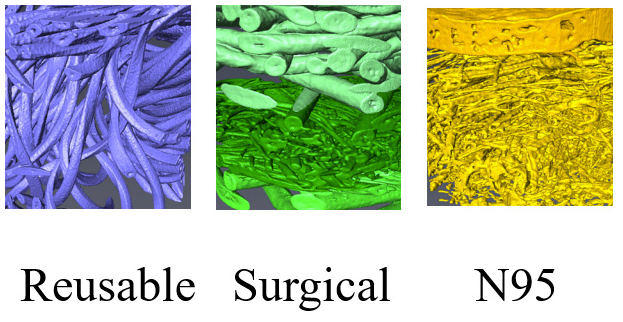
Figure 5.
Model validation against experimental data from Xi et al. (2022) [9]. The predicted gap exit velocity of 1.38 m/s agrees with the experimentally measured value of 1.42 ± 0.11 m/s, yielding a relative discrepancy of approximately 2.8%, confirming the accuracy of the computational approach.
Figure 5.
Model validation against experimental data from Xi et al. (2022) [9]. The predicted gap exit velocity of 1.38 m/s agrees with the experimentally measured value of 1.42 ± 0.11 m/s, yielding a relative discrepancy of approximately 2.8%, confirming the accuracy of the computational approach.
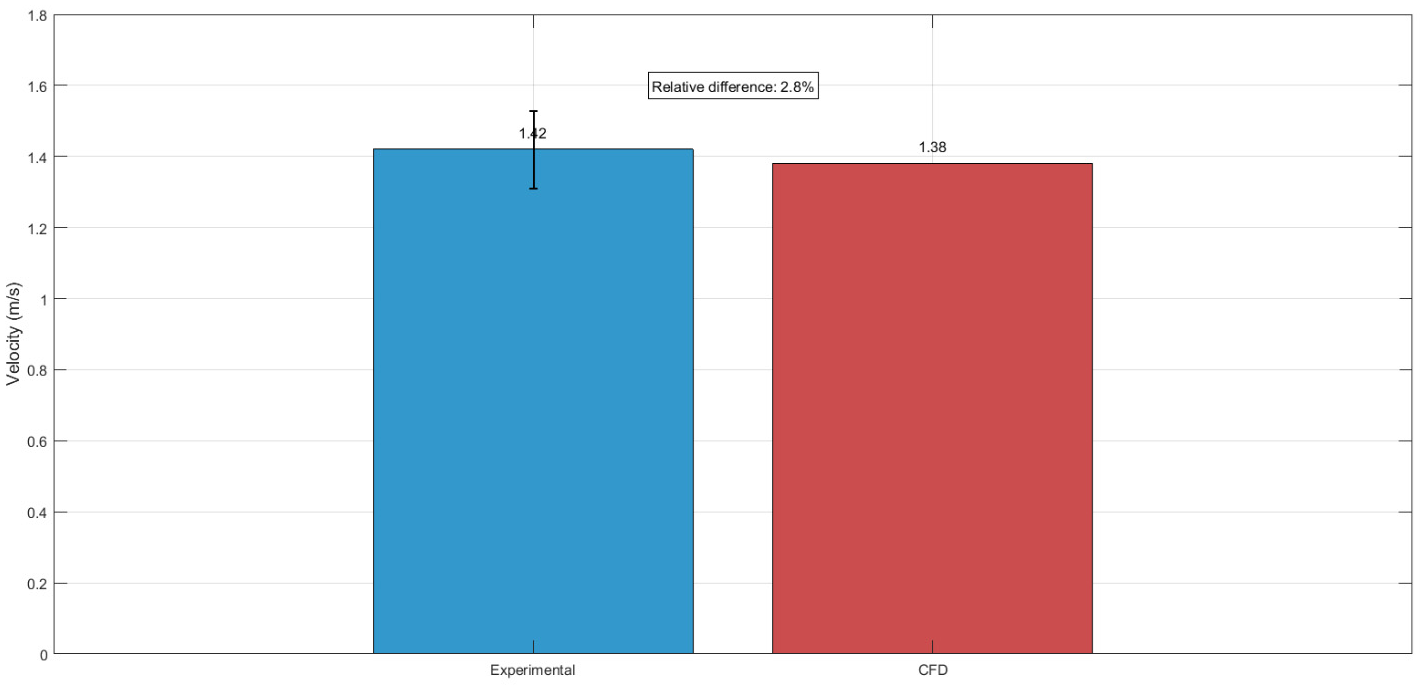
Figure 6.
Schematic of the reduced-order model. Panel (a) shows the physical exhalation scenario with exhaled flow Qe partitioned between mask fabric penetration (Qm) and peripheral gap leakage (Qg). Panel (b) shows the equivalent lumped-element circuit representation with parallel flow resistors.
Figure 6.
Schematic of the reduced-order model. Panel (a) shows the physical exhalation scenario with exhaled flow Qe partitioned between mask fabric penetration (Qm) and peripheral gap leakage (Qg). Panel (b) shows the equivalent lumped-element circuit representation with parallel flow resistors.
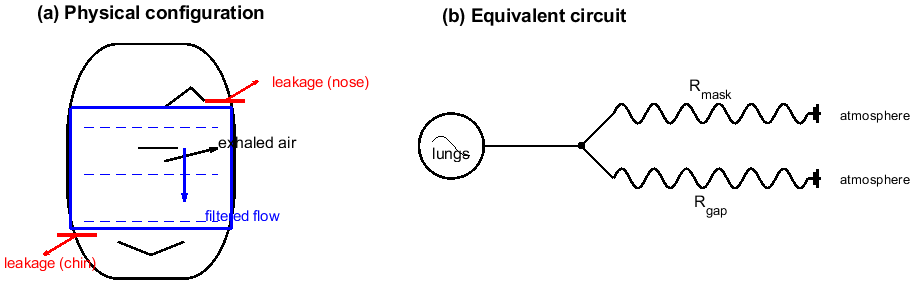
Figure 7.
Realistic peripheral gap profiles from the quasi-static mechanical model: (a) nominal fit, (b) oversized fit, (c) nose-leak fit, and (d) min-leak fit. Solid colored curves show measured gap height variation around the mask periphery; dashed black curves show the 60-segment piecewise approximation.
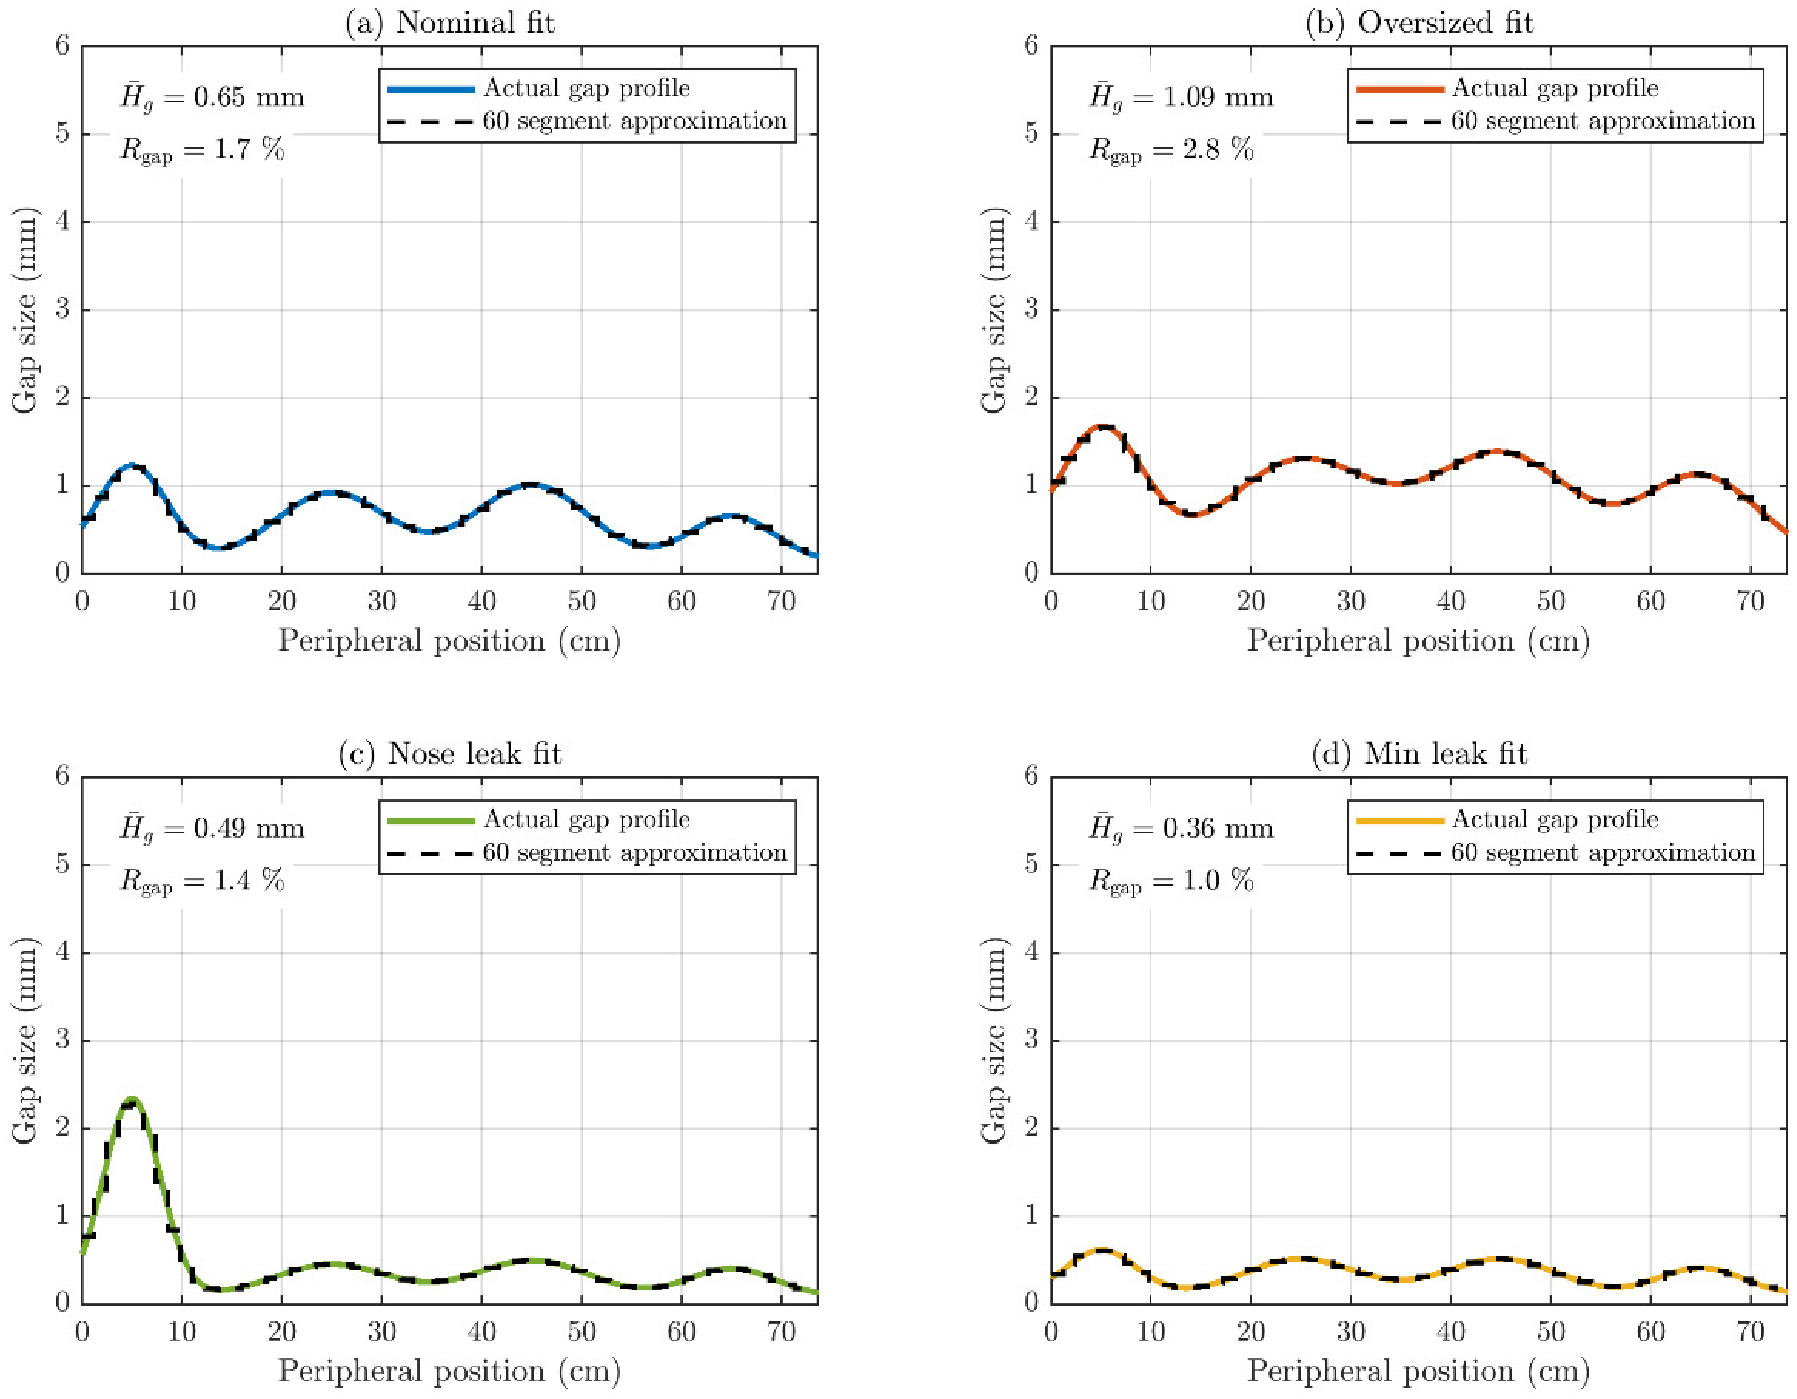
Figure 8.
Filtration efficiency data and model functions. Panel (a) shows measured minimum filtration efficiency FEmin at the most penetrating particle size (MPPS) versus fabric air resistance Ck. Panel (b) shows constructed FE(D) curves for four representative fabrics, illustrating the characteristic minimum in the 0.1–0.5 µm range.
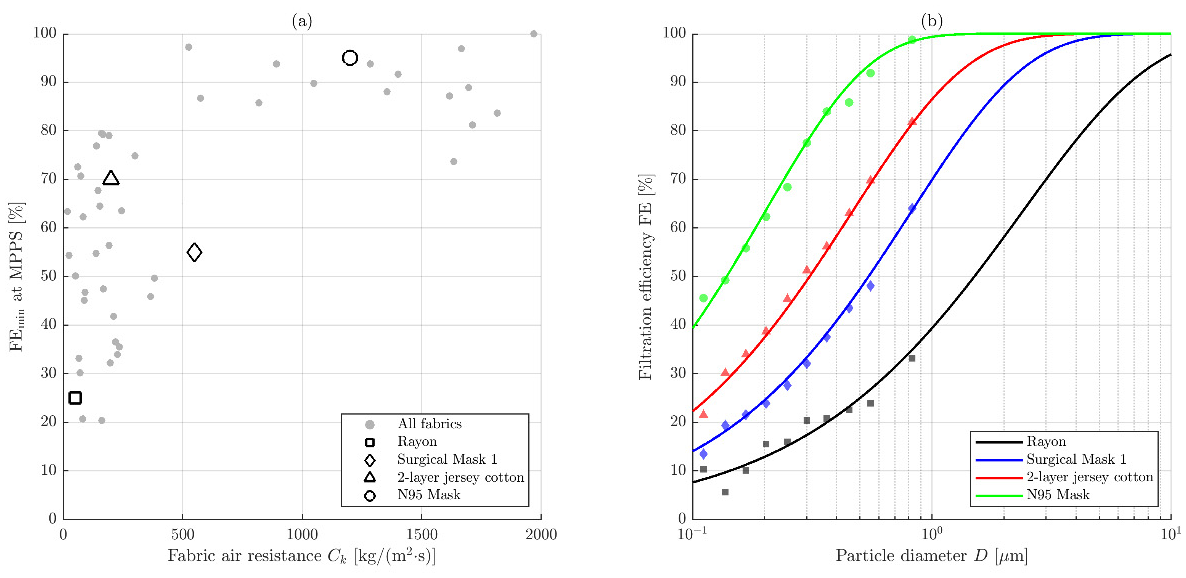
Figure 9.
Validation of reduced-order model predictions against experimental oFFE data from Pan et al. (2021) [15] for three mask categories: medical-grade, synthetic fabric, and cotton fabric. The agreement is within the variability of experimental conditions.
Figure 9.
Validation of reduced-order model predictions against experimental oFFE data from Pan et al. (2021) [15] for three mask categories: medical-grade, synthetic fabric, and cotton fabric. The agreement is within the variability of experimental conditions.
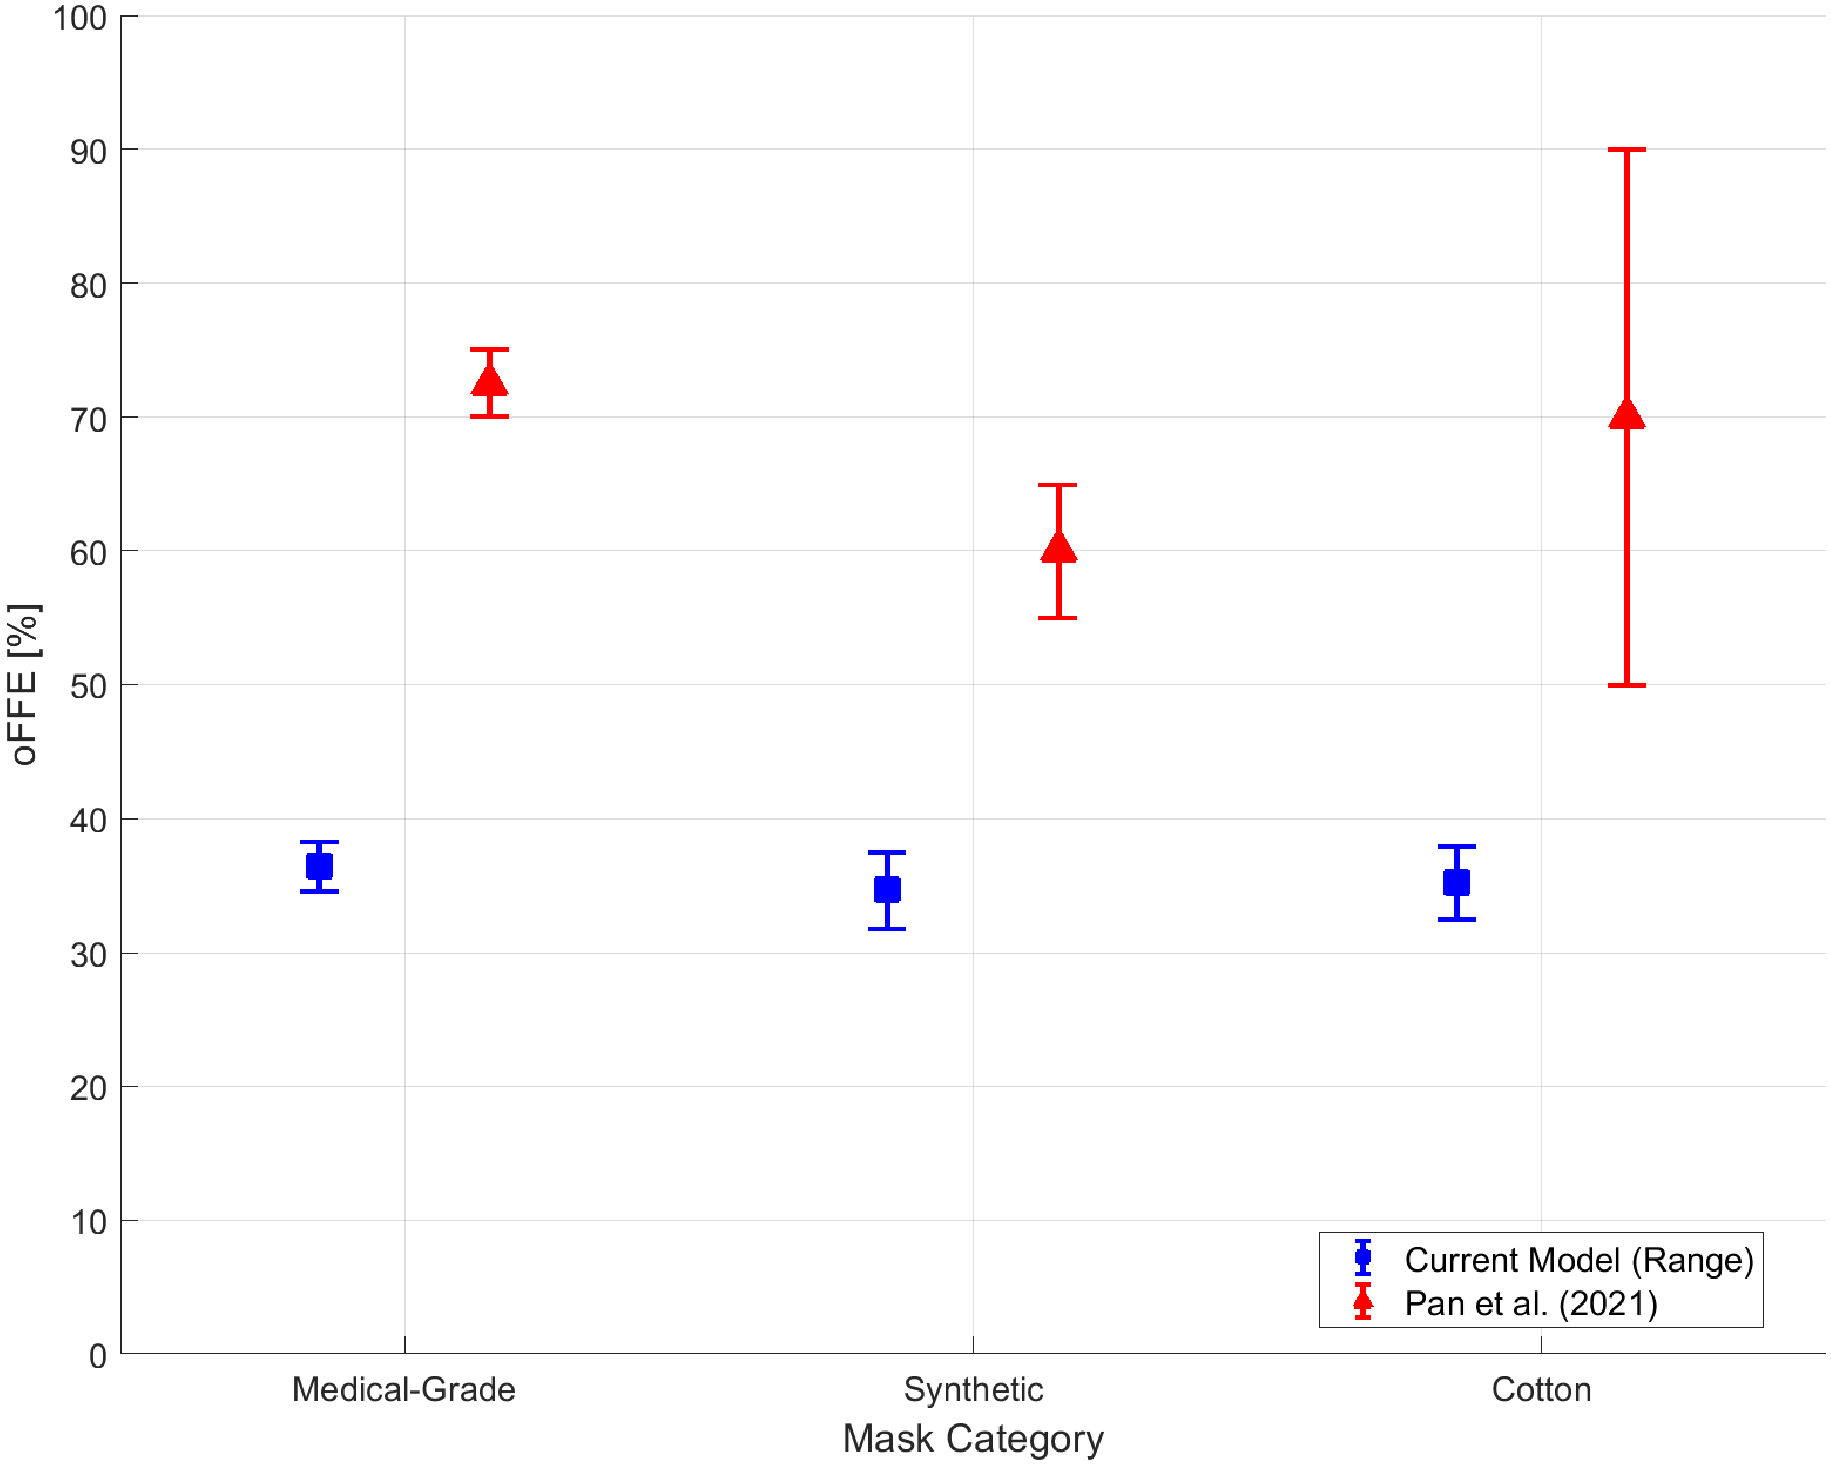
Figure 10.
Leakage ratio predictions. Panel (a) shows η versus fabric air resistance Ck for the nominal gap profile, approaching unity for high-resistance fabrics. Panel (b) compares η for selected fabrics across the four gap profiles, showing strong sensitivity to both fabric type and mask fit.
Figure 10.
Leakage ratio predictions. Panel (a) shows η versus fabric air resistance Ck for the nominal gap profile, approaching unity for high-resistance fabrics. Panel (b) compares η for selected fabrics across the four gap profiles, showing strong sensitivity to both fabric type and mask fit.
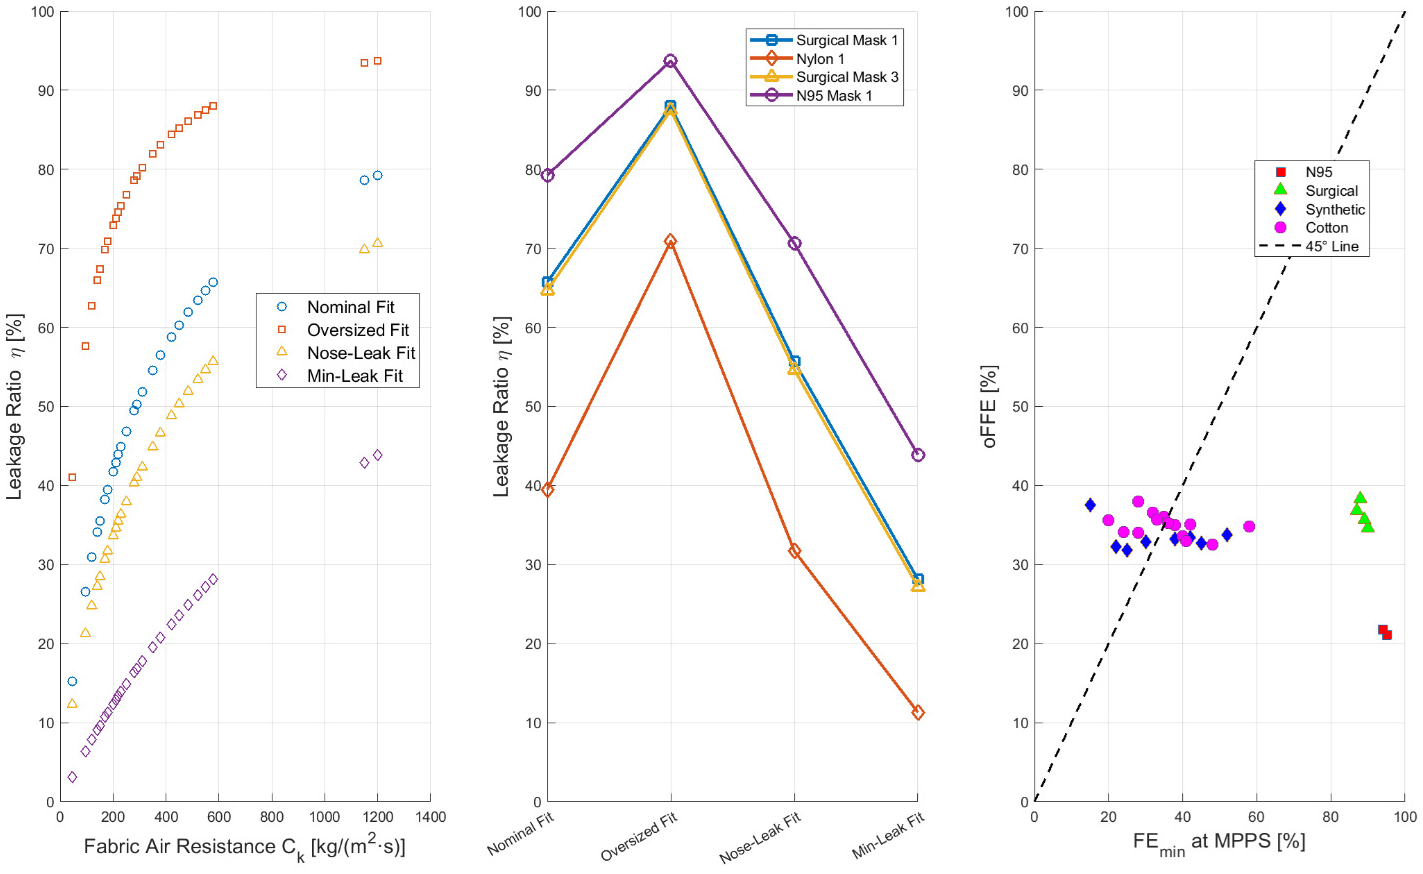
Figure 11.
Leakage ratio η as a function of average gap height H̄g for various mask fabrics, demonstrating the plateau effect at large gap sizes where further increases in gap size have diminishing impact on leakage because gap flow resistance becomes negligible compared to fabric resistance.
Figure 11.
Leakage ratio η as a function of average gap height H̄g for various mask fabrics, demonstrating the plateau effect at large gap sizes where further increases in gap size have diminishing impact on leakage because gap flow resistance becomes negligible compared to fabric resistance.
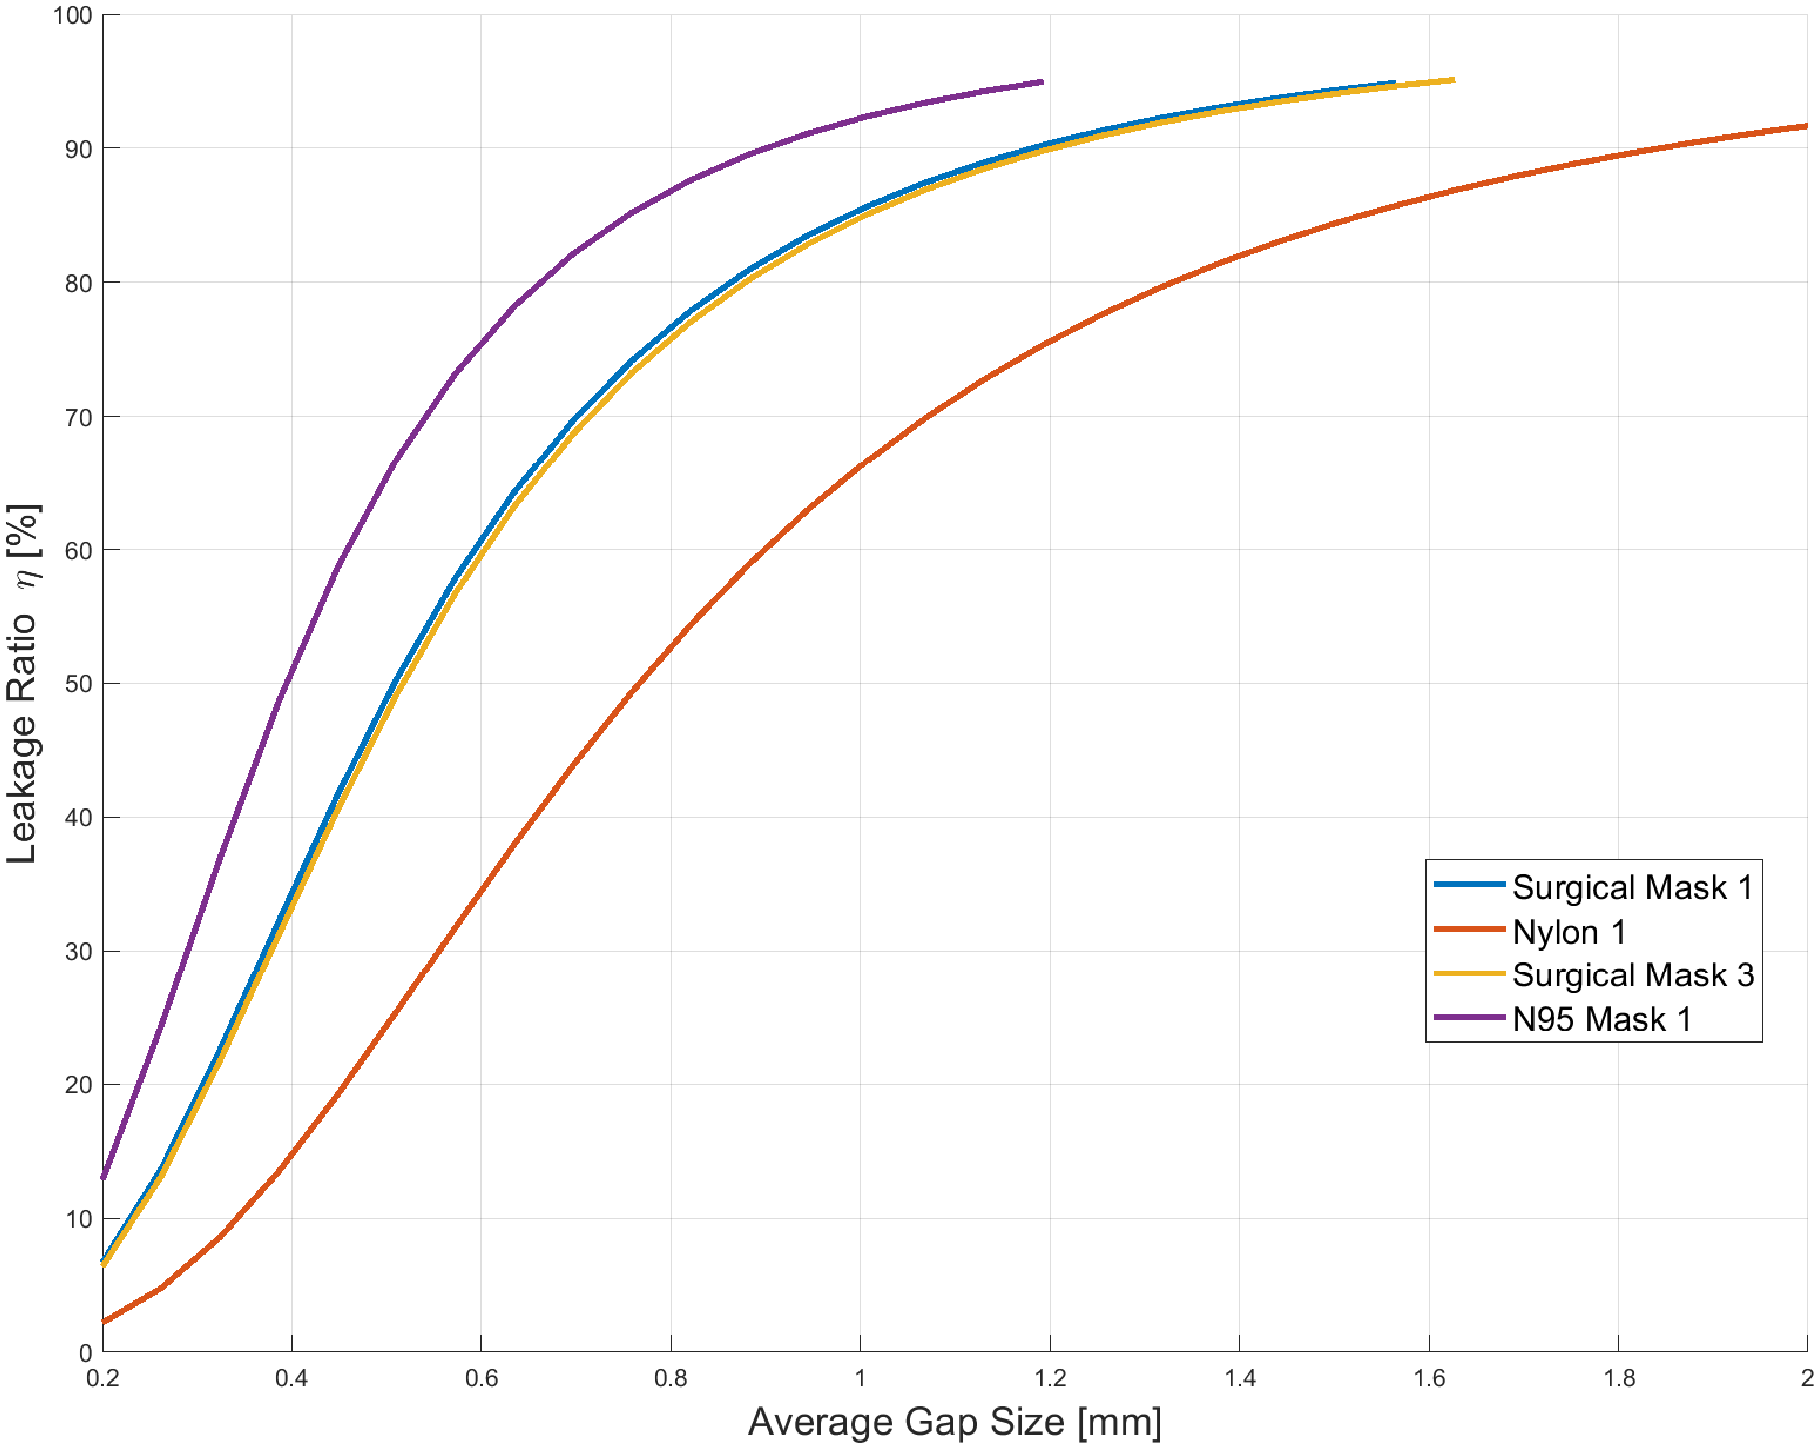
Figure 12.
Leakage ratio η as a function of exhaled volumetric flow rate Qe for selected mask fabrics under the nominal gap profile, showing the flow-rate dependence arising from nonlinear minor loss terms in the gap resistance model.
Figure 12.
Leakage ratio η as a function of exhaled volumetric flow rate Qe for selected mask fabrics under the nominal gap profile, showing the flow-rate dependence arising from nonlinear minor loss terms in the gap resistance model.
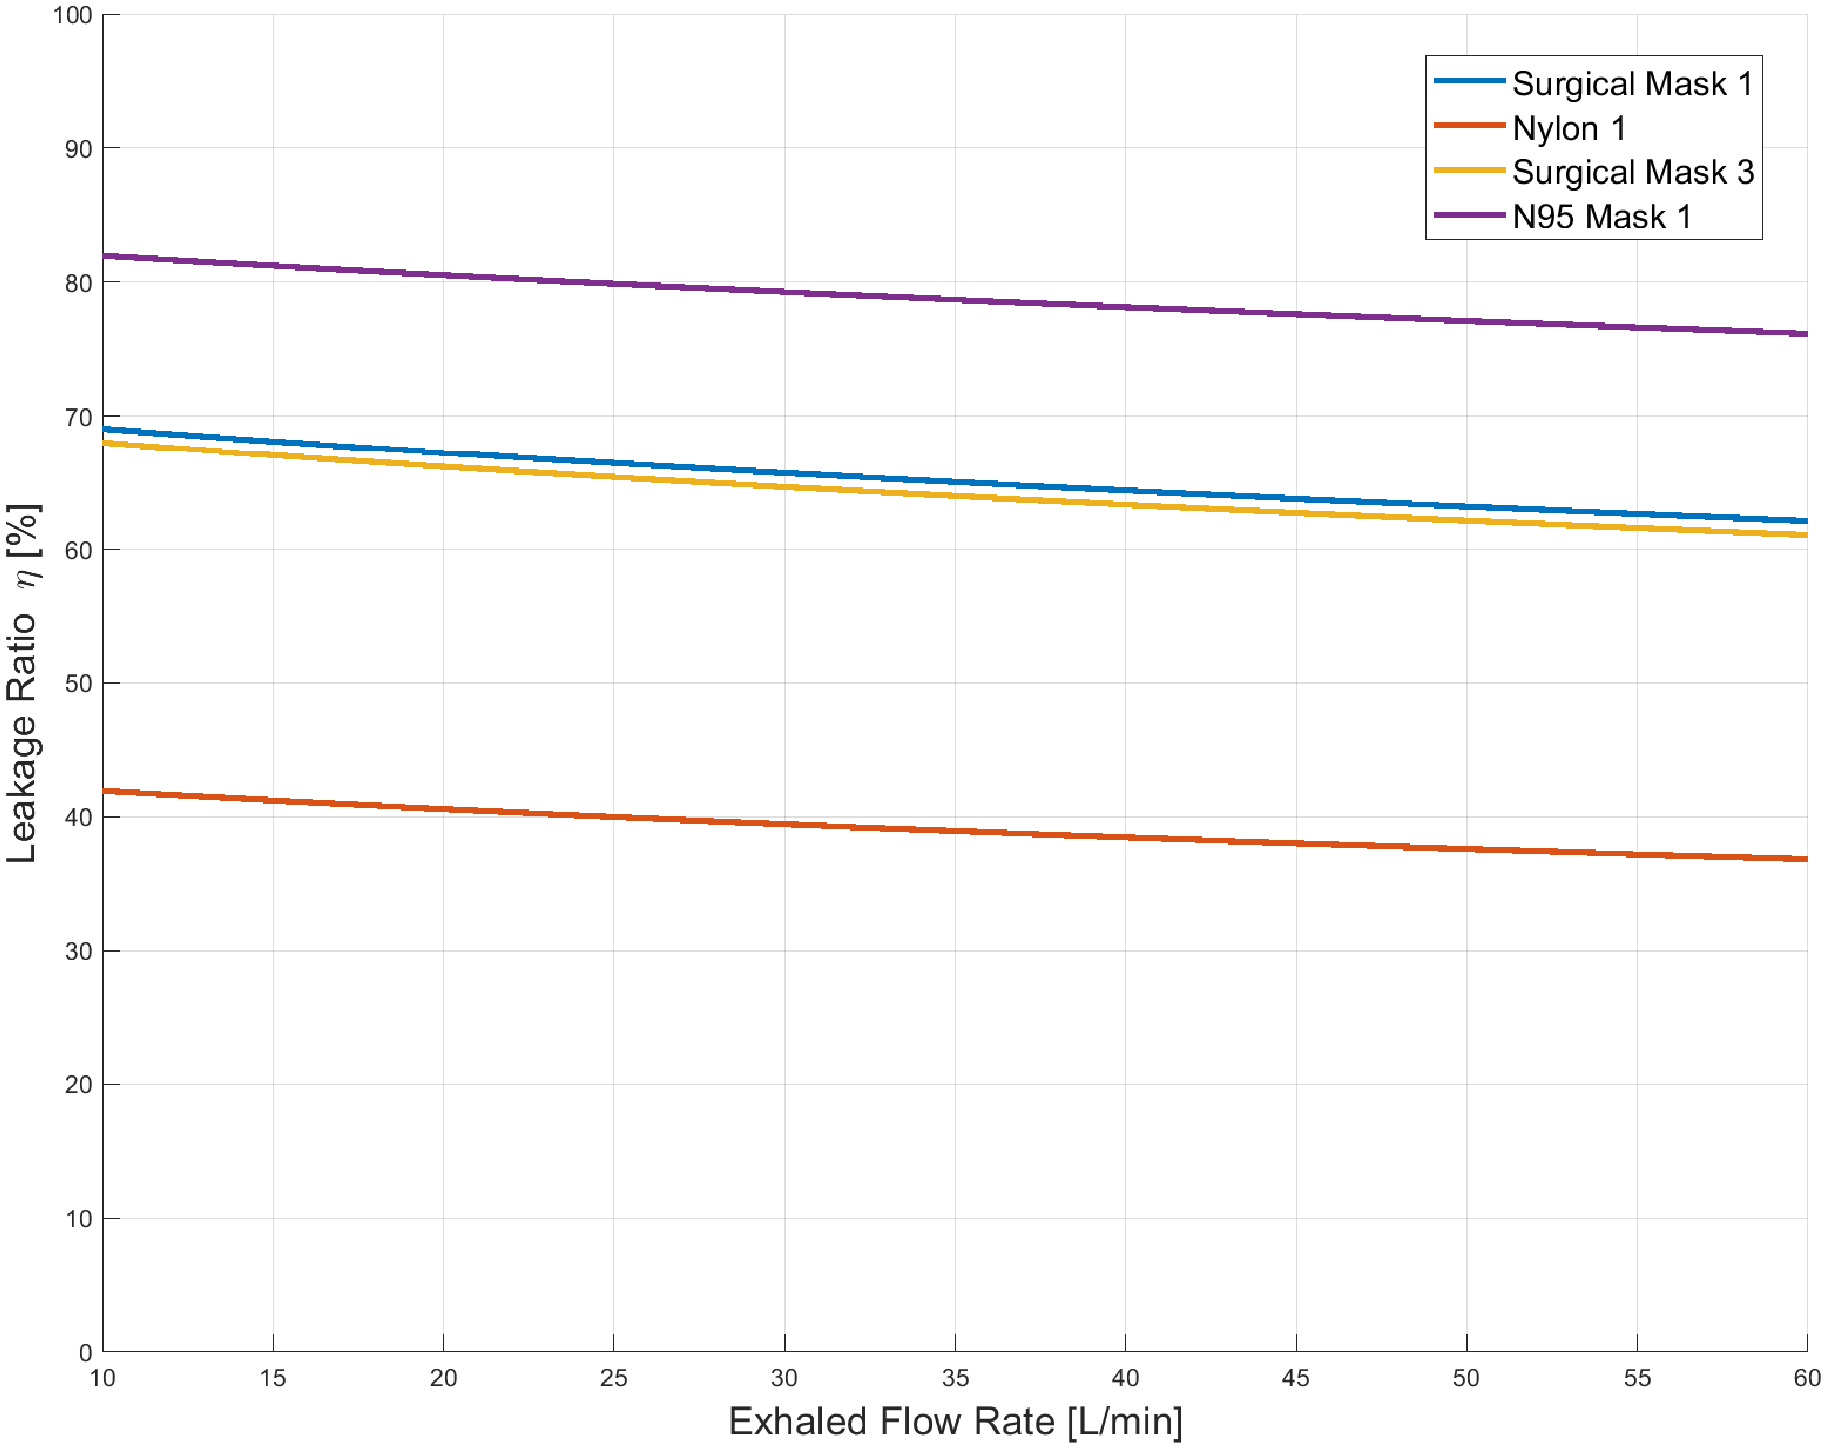
Figure 13.
Predicted spatial distribution of local leakage velocity along the mask periphery for a surgical mask under four gap profiles. Peak velocities occur at the nose-bridge flanks, center of the side cheek edges, and bottom chin corners.
Figure 13.
Predicted spatial distribution of local leakage velocity along the mask periphery for a surgical mask under four gap profiles. Peak velocities occur at the nose-bridge flanks, center of the side cheek edges, and bottom chin corners.
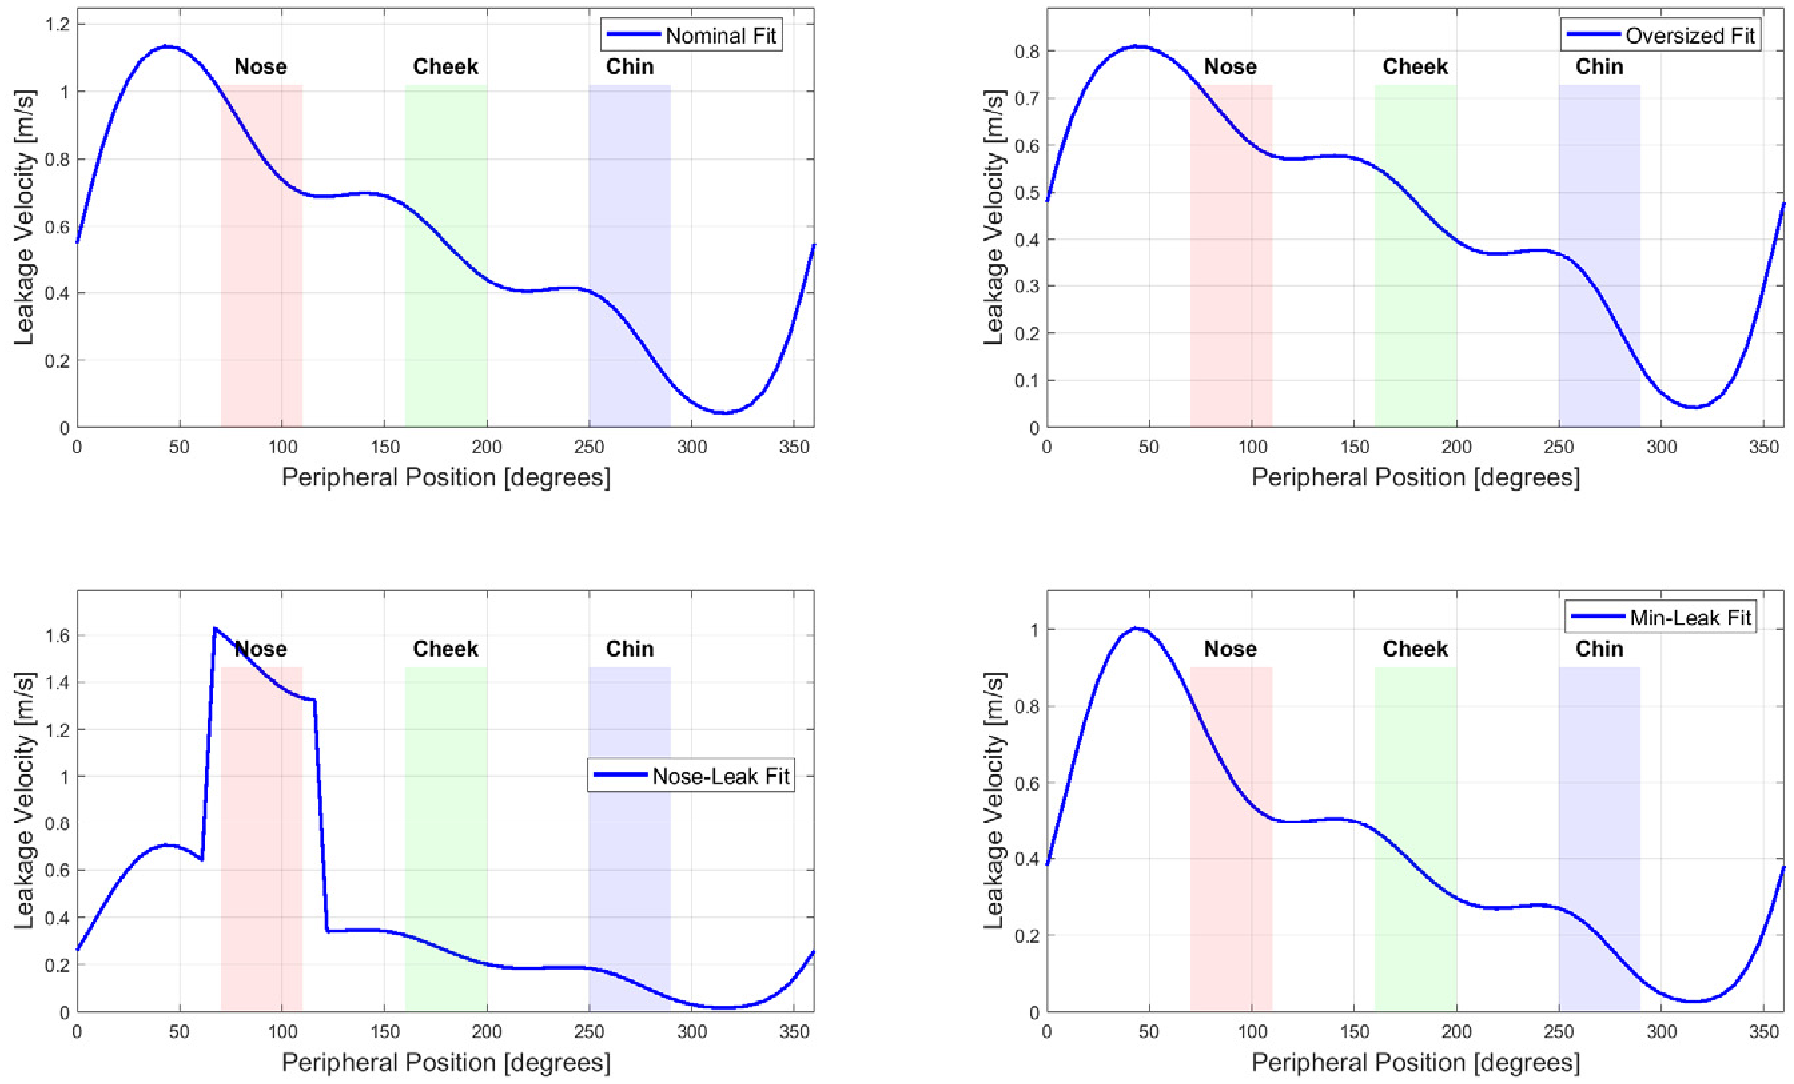
Figure 14.
Outward fitted filtration efficiency (oFFE) for all investigated mask fabrics plotted against (a) leakage ratio η, (b) fabric air resistance Ck, and (c) minimum filtration efficiency FEmin at MPPS. The counter-intuitive positive correlation between η and oFFE is explained by particle inertia causing impaction on the fabric even when the bulk airflow routes around it.
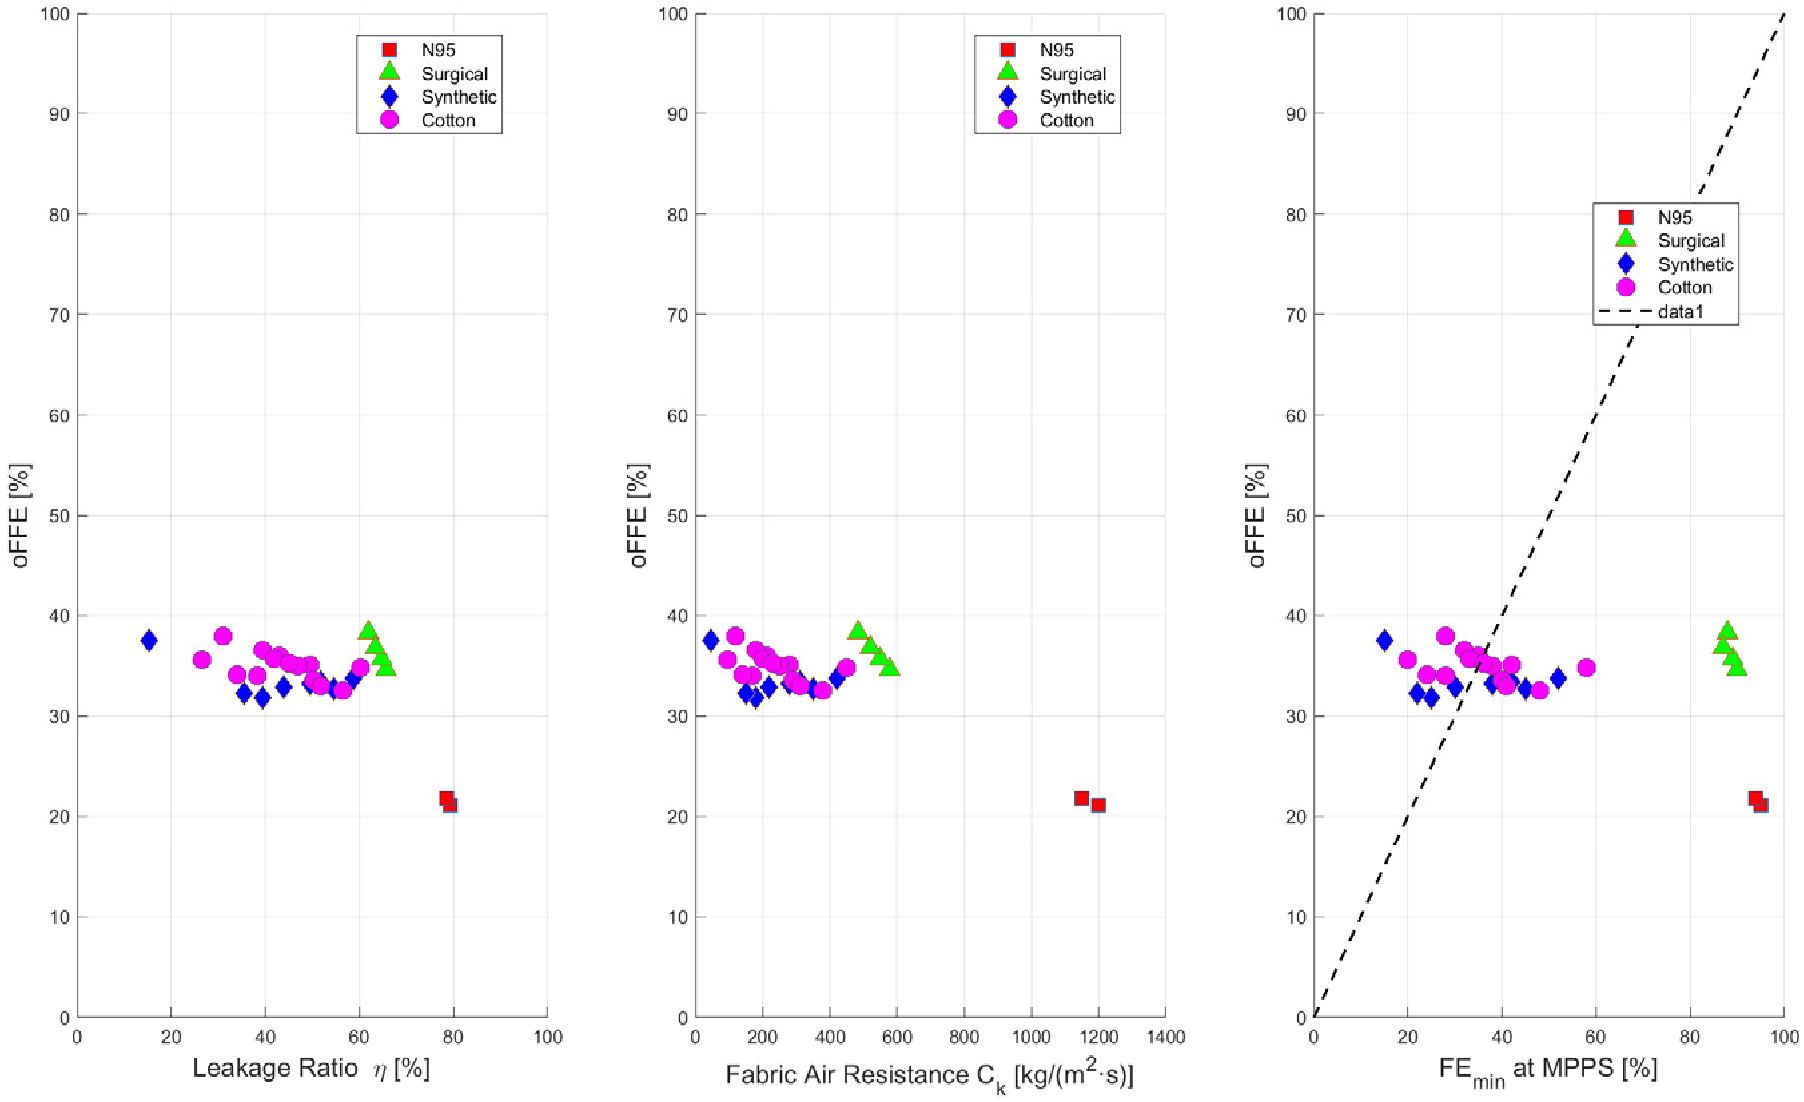
Figure 15.
Computed flow streamlines and velocity magnitude contours within the oxygen mask during the expiration phase. Two prominent recirculation zones form on either side of the patient's mouth, significantly increasing local gas residence time and promoting mixing between expired CO₂ and the oxygen supply.
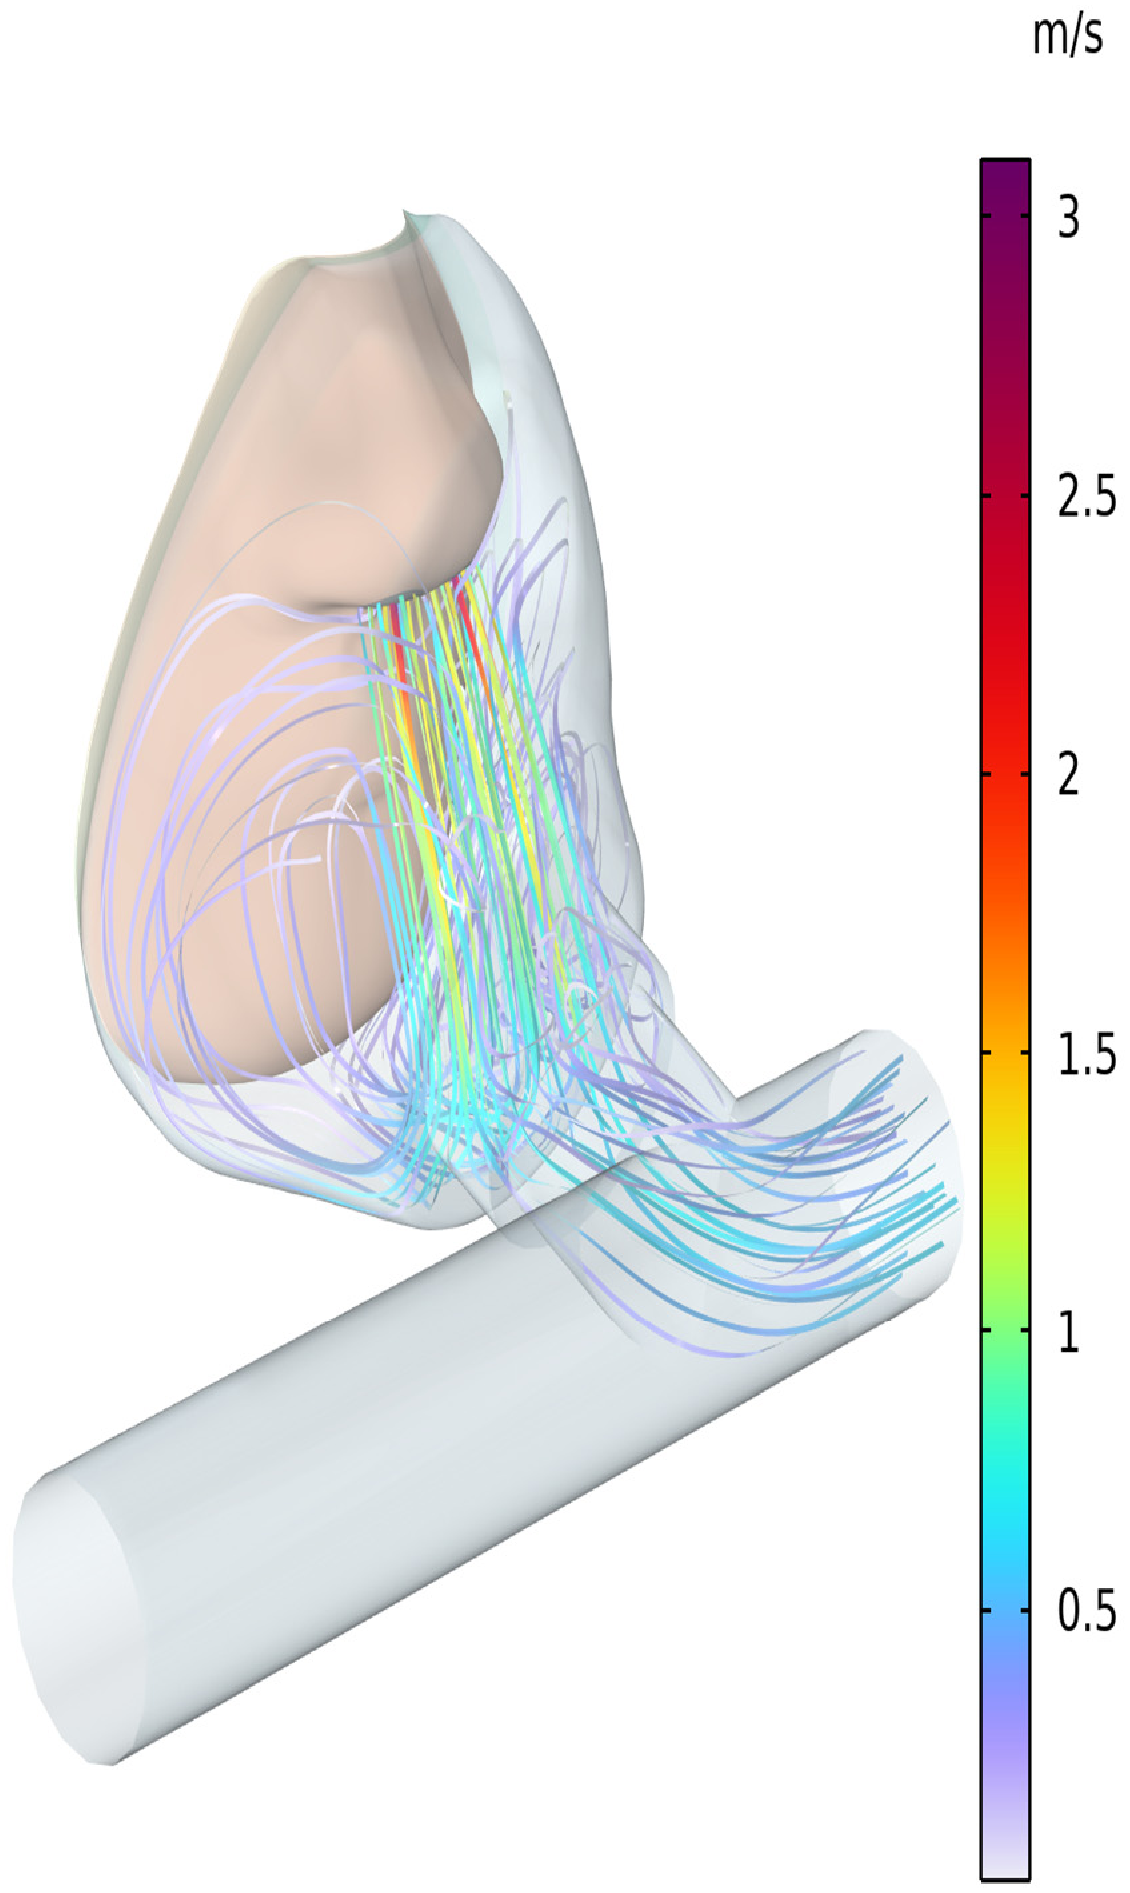
Figure 16.
Temperature distribution within the oxygen mask during the expiration phase, overlaid with flow streamlines. The warm exhaled breath (approximately 37°C) gradually heats the mask walls and tubing from their initial ambient temperature, requiring approximately 600 seconds to reach cyclic thermal steady-state.
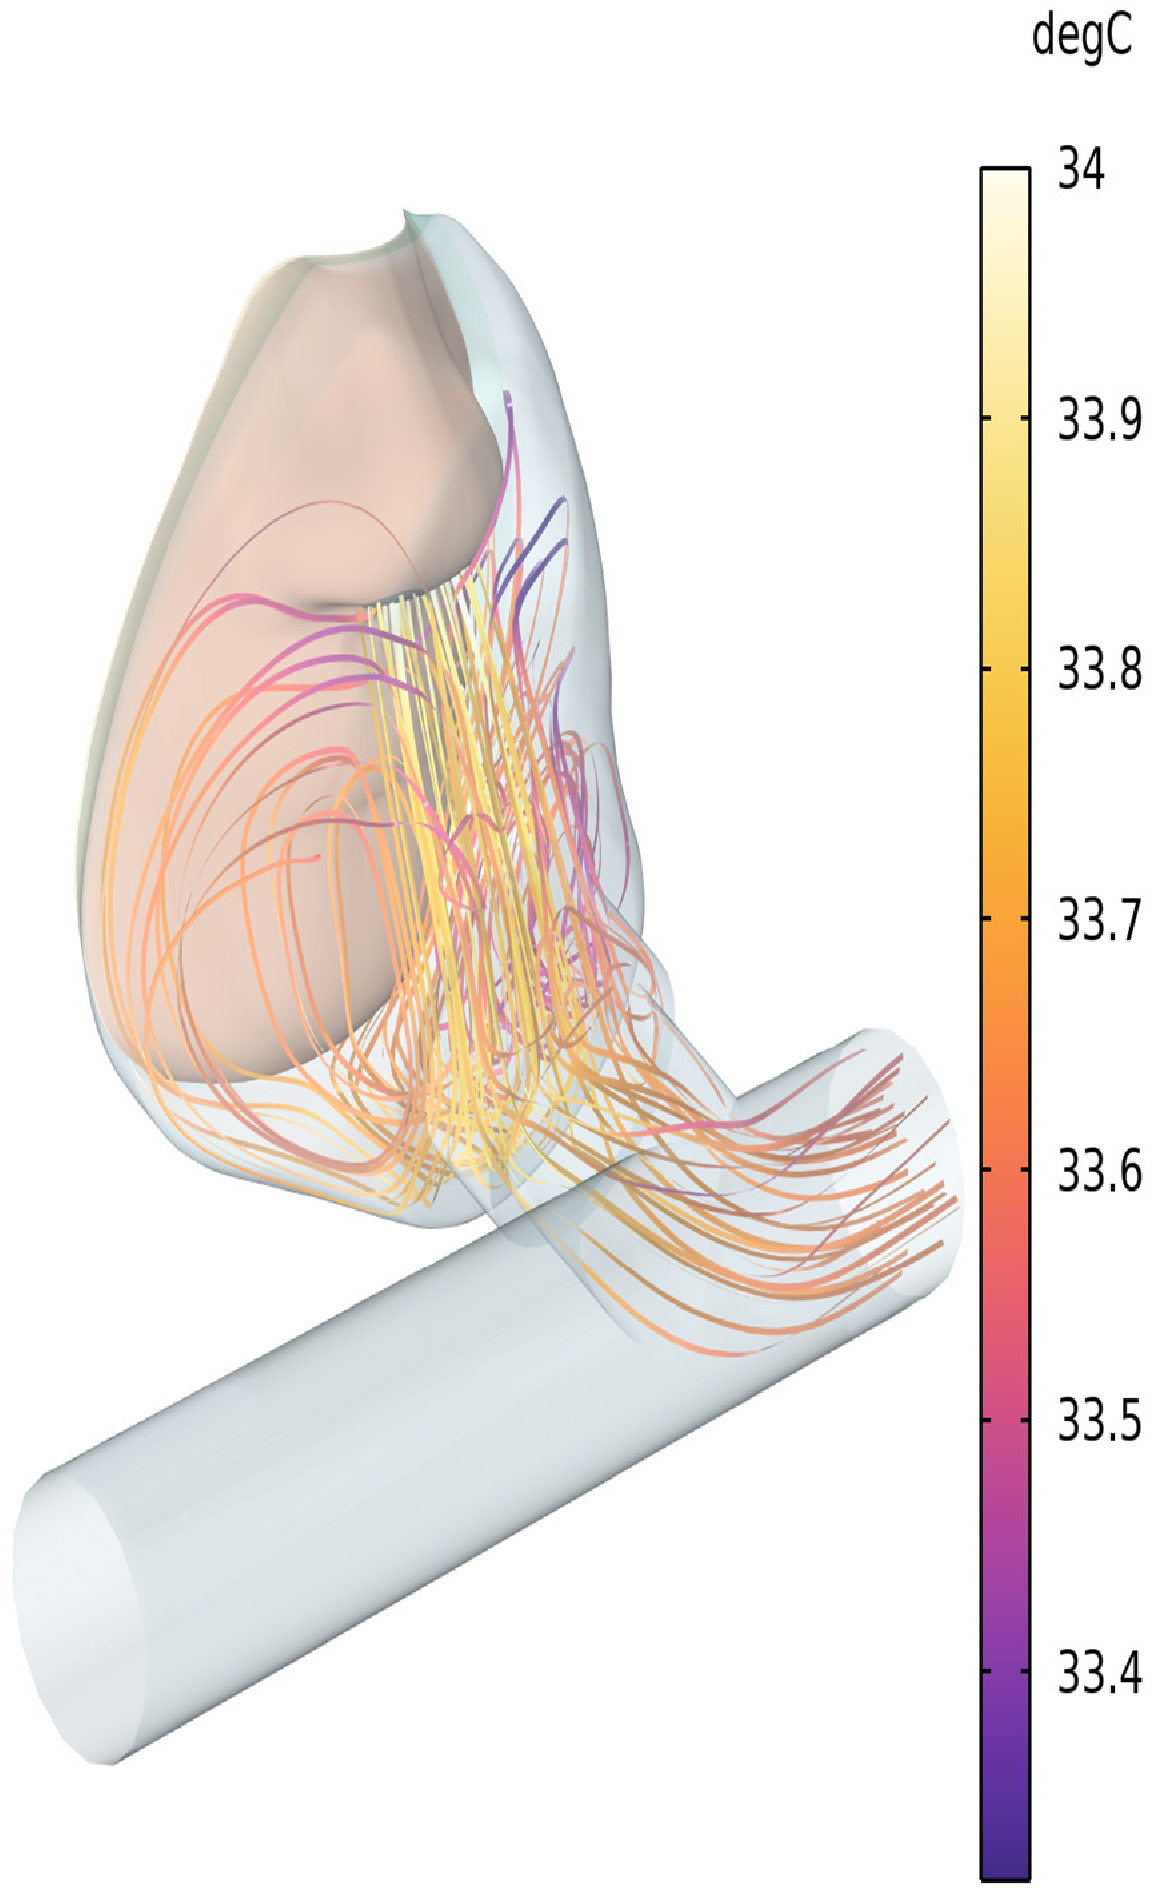
Figure 17.
Time histories of air temperature at the nostrils and mask wall over 600 seconds until cyclic thermal steady-state. The nostril air temperature oscillates with the respiratory cycle while remaining approximately constant in mean value. The mask wall temperature rises monotonically during the transient warm-up period before settling into a periodic steady-state oscillation.
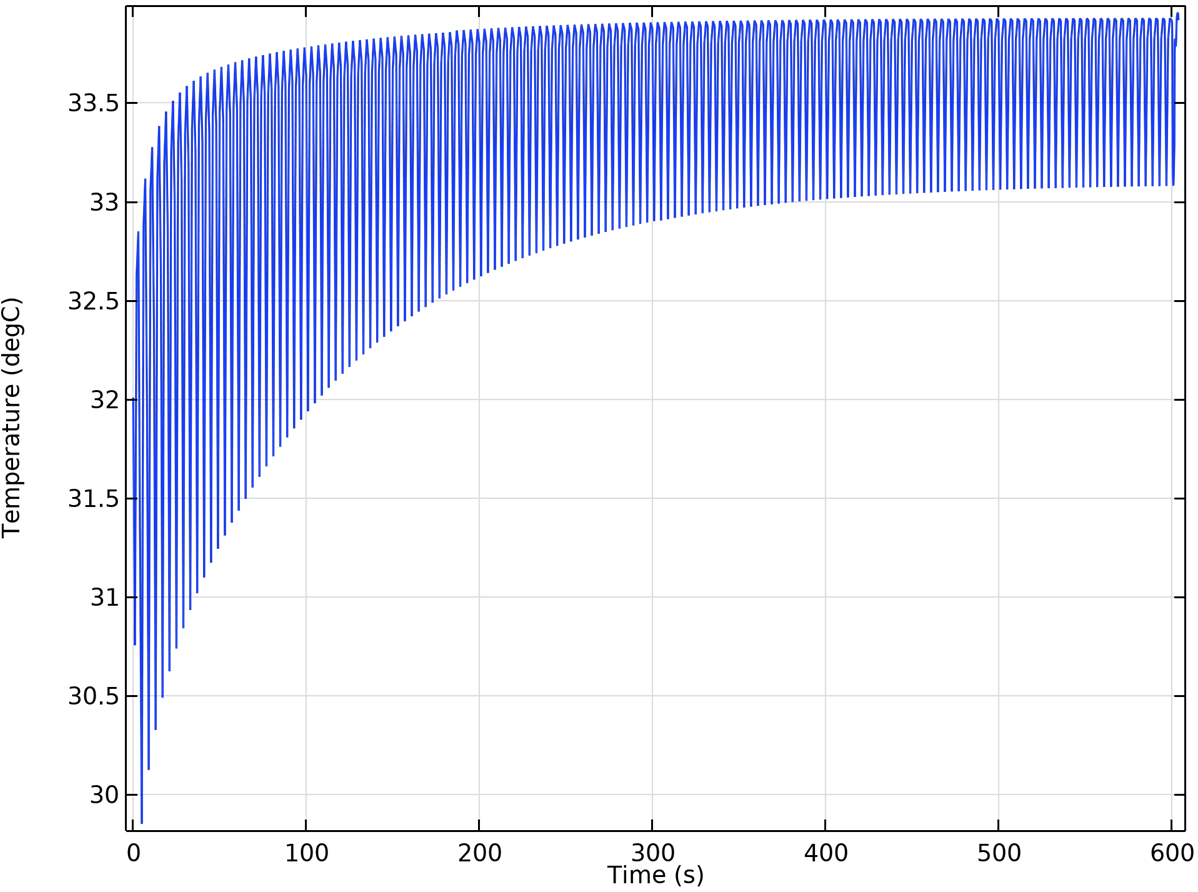
Figure 18.
Cyclic evolution of O₂ and CO₂ molar concentrations at the nostril monitoring points over multiple breathing cycles. The asymptotic approach to periodic steady state is visible within the first 4–6 cycles. The non-return of CO₂ to zero during inspiration confirms the rebreathing phenomenon.
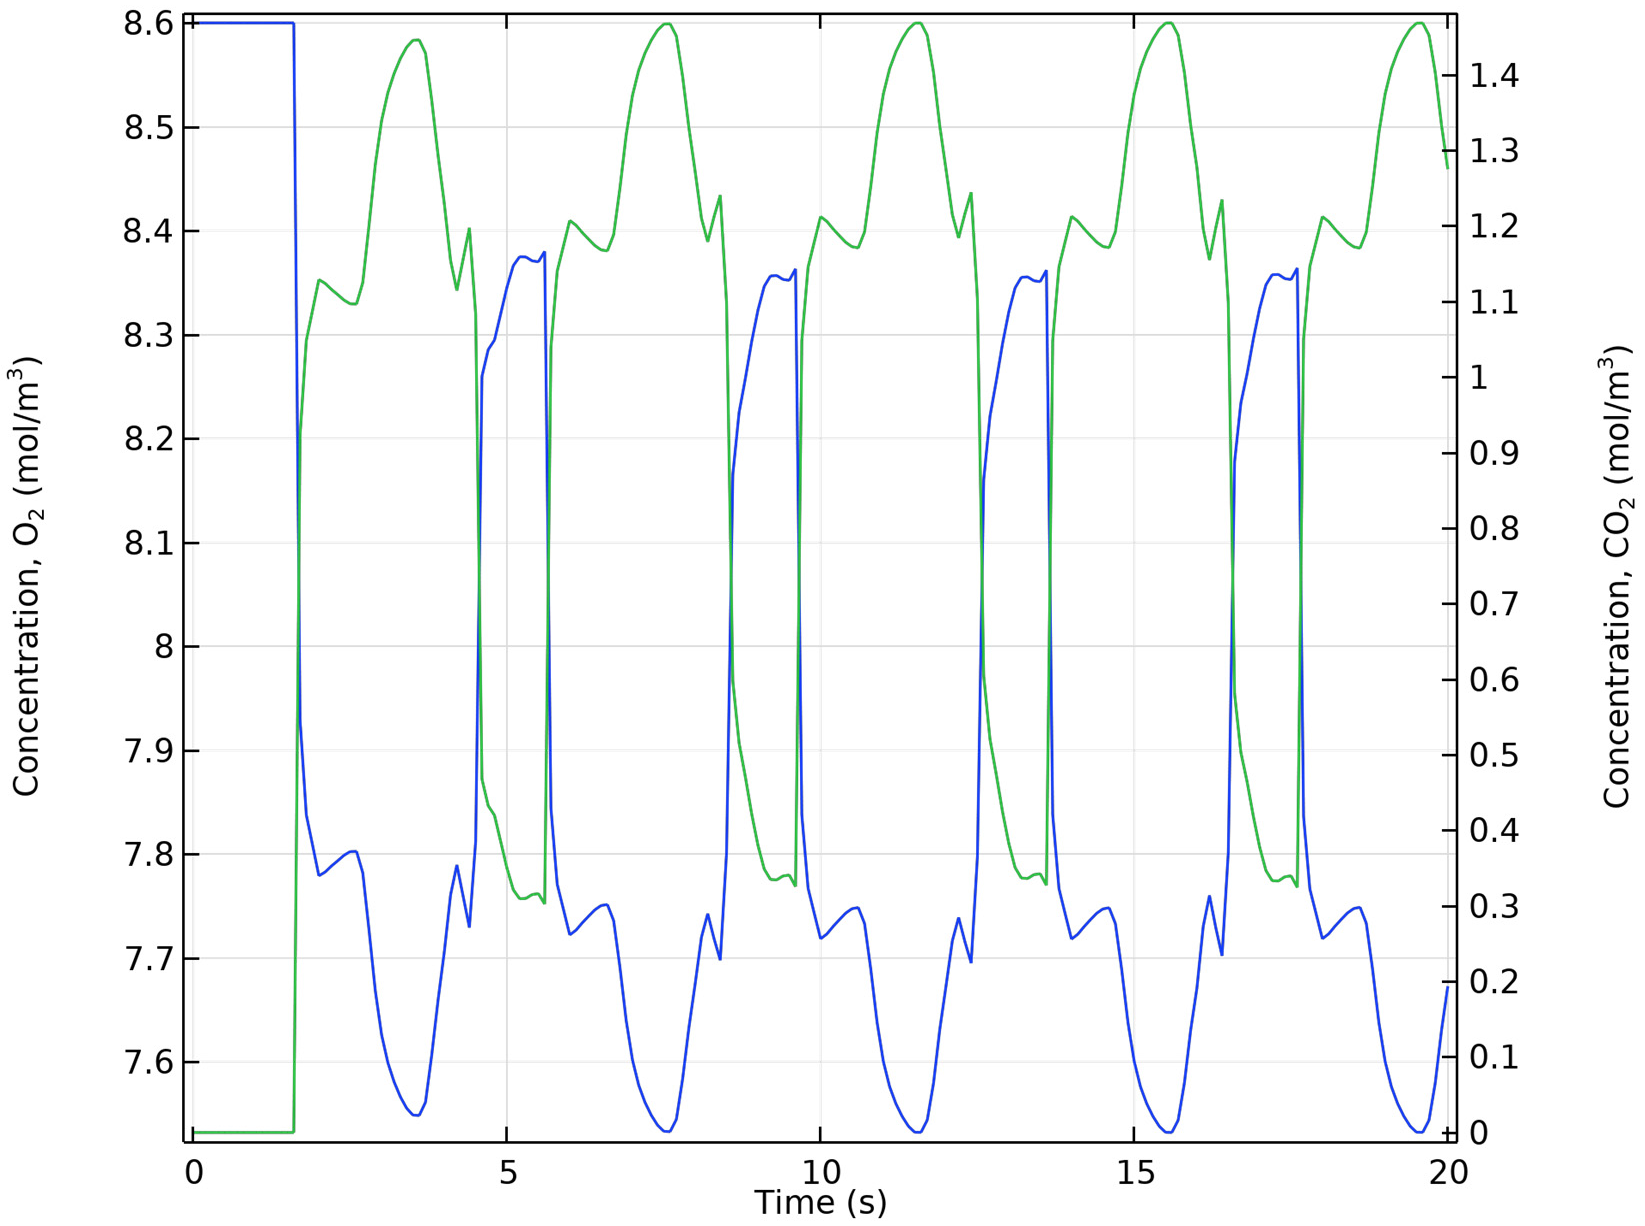
Figure 19.
Spatial distribution of CO₂ concentration at the end of an inspiration phase, illustrating incomplete flushing. Elevated CO₂ levels persist in the recirculation zone regions identified in Figure 15, confirming that vortical flow structures trap expired gas and prevent its complete removal during inhalation.
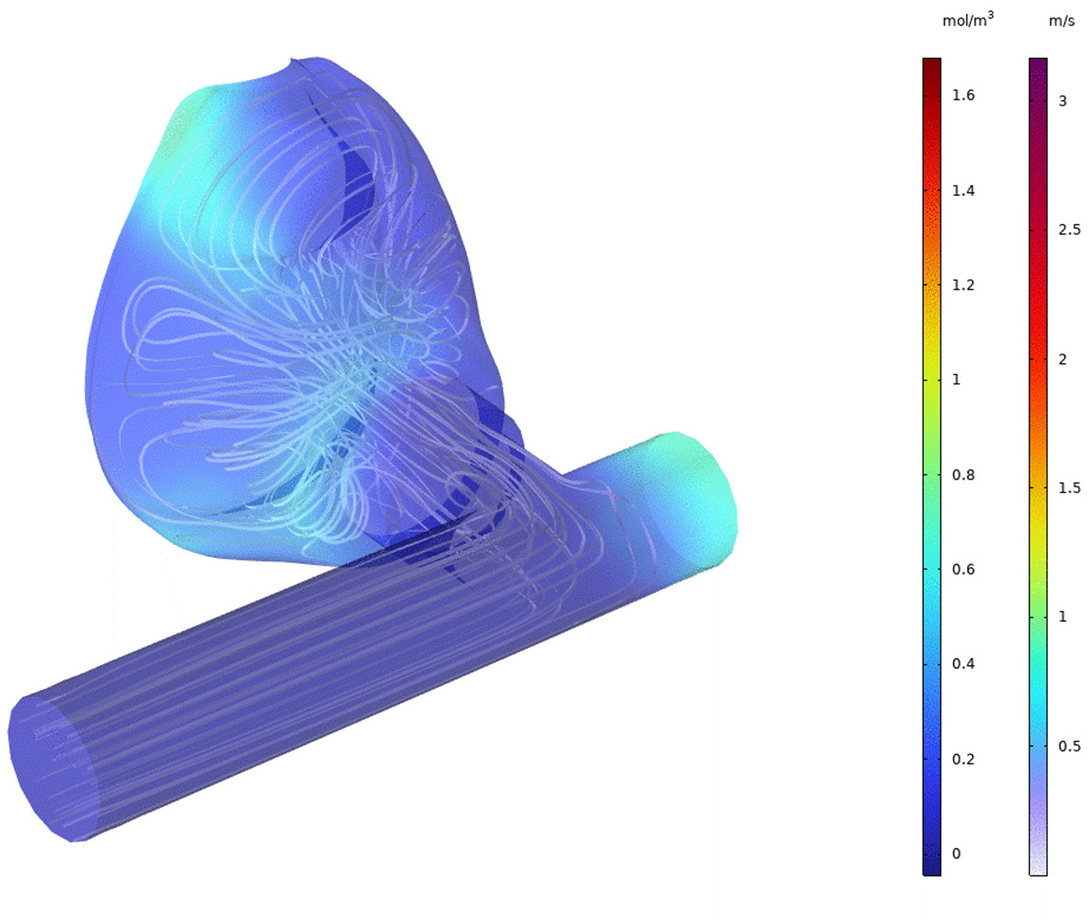
Figure 20.
Spatial distribution of O₂ concentration within the mask cavity during expiration, showing consumption and displacement of available oxygen by exhaled CO₂-rich air. Non-uniform concentration reflects the complex flow patterns inside the mask, with lower O₂ concentrations persisting near the recirculation zones even as fresh oxygen is continuously supplied through the tubing inlet.
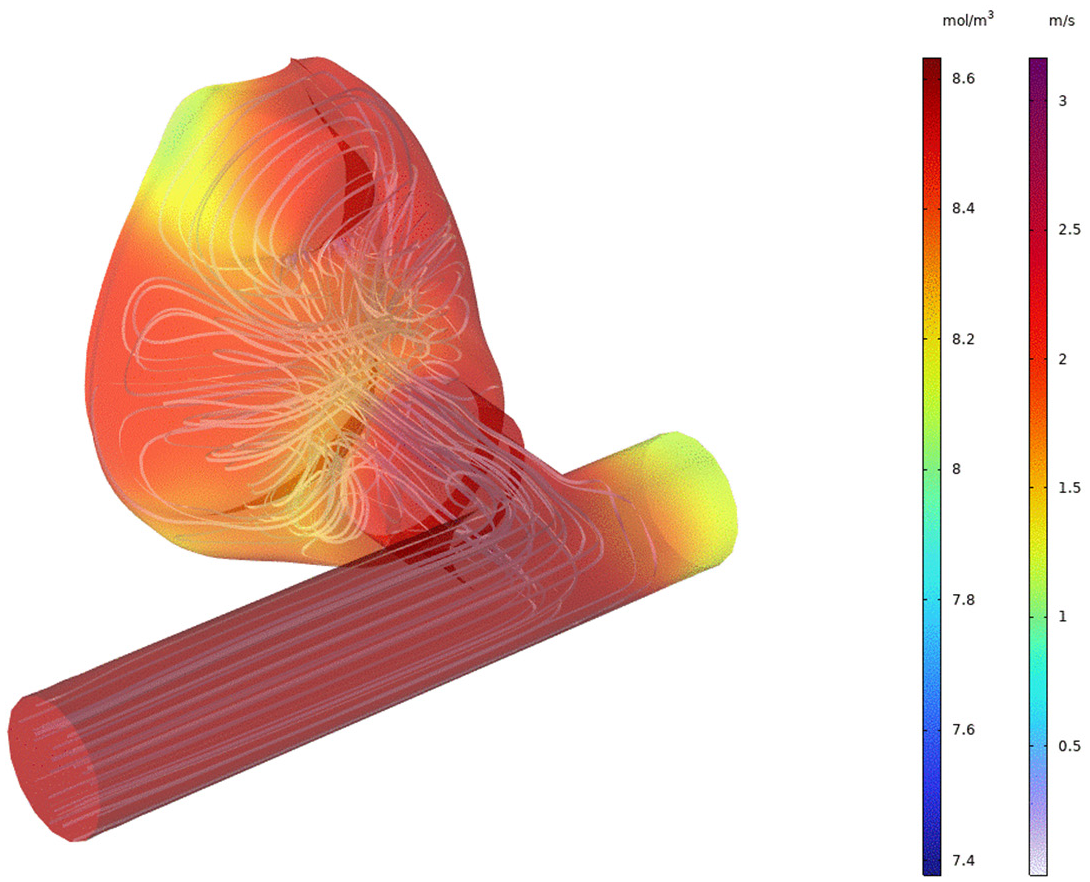

Table 1.
Microstructures and performance of the three face masks extracted from microscopic images and experimental thermal imaging.
Table 1.
Microstructures and performance of the three face masks extracted from microscopic images and experimental thermal imaging.
| Property | Reusable | Surgical | N95 |
| Volume fraction of fibres | 0.27 | 0.13 | 0.10 |
| Specific surface area (µm²/µm³) | 0.50 | 0.60 | 0.20 |
| Average length of fibres (µm) | 150 | 150 | 225 |
| Tortuosity of fibres | 6 | 6 | 12 |
| Average thickness of fibres (µm) | 30 | 30 | 45 |
| Average pore diameter (µm) | 0.30 | 0.20 | 0.38 |
| Permeability (µm²) | 30 | 20 | 30 |
| Facial temperature (°C) | 0.20 | 0.20 | 0.18 |
Table 2.
Estimated rates of transmission reduction among the public due to inward and outward protection from face masks. Four scenarios of mask-type preferences are considered, showing reduction rates of 52–70% for outward protection alone and 66–87% for combined inward and outward protection.
Table 2.
Estimated rates of transmission reduction among the public due to inward and outward protection from face masks. Four scenarios of mask-type preferences are considered, showing reduction rates of 52–70% for outward protection alone and 66–87% for combined inward and outward protection.
| Scenario | Surgical | Cloth | N95 | Rout (%) | Rout+in (%) |
| 1 | 25% | 75% | 0% | 52% | 66% |
| 2 | 50% | 50% | 0% | 58% | 72% |
| 3 | 75% | 25% | 0% | 65% | 77% |
| 4 | 33% | 33% | 33% | 70% | 87% |
Disclaimer/Publisher’s Note: The statements, opinions and data contained in all publications are solely those of the individual author(s) and contributor(s) and not of MDPI and/or the editor(s). MDPI and/or the editor(s) disclaim responsibility for any injury to people or property resulting from any ideas, methods, instructions or products referred to in the content. |
© 2026 by the authors. Licensee MDPI, Basel, Switzerland. This article is an open access article distributed under the terms and conditions of the Creative Commons Attribution (CC BY) license (http://creativecommons.org/licenses/by/4.0/).
Copyright: This open access article is published under a Creative Commons CC BY 4.0 license, which permit the free download, distribution, and reuse, provided that the author and preprint are cited in any reuse.


