Submitted:
15 February 2026
Posted:
27 February 2026
You are already at the latest version
Abstract
Background: The gut microbiota and plasma metabolites have been shown to contribute to the etiology of Post-Traumatic Stress Disorder (PTSD). The relationship between the gut microbiome and plasma metabolome in PTSD is poorly understood. This study aims To integrate the gut microbiome data and plasma metabolome data to elucidate microbial–metabolite associations specific for PTSD in a mouse model. Methods: A PTSD mouse model was induced by Single Prolonged Stress and Electric Foot Shock (SPS&S). We sequenced gut microbiota composition by 16S rRNA gene sequencing and used Ultra-high-performance liquid chromatography–tandem mass spectrometry (UHPLC-MS/MS) for plasma metabolomic profiling, to explore the association Between gut microbiota and plasma metabolites in mice with PTSD. Results: UHPLC-MS/MS analysis showed significant differences in the abundance of multiple plasma metabolites, including L-arginine, palmitic acid, oleic acid, uridine, in mice with PTSD versus control mice. Pathway enrichment analysis further revealed that these differentially abundant metabolites were all enriched in pathways such as arginine biosynthesis, unsaturated fatty acid biosynthesis, pyrimidine metabolism and glycerophospholipid metabolism. Meanwhile, 16S rRNA sequencing revealed differences in the composition and diversity of the gut microbes in PTSD mice and control mice. For example, the relative abundance of the Muribaculaceae and Akkermansia genera decreased significantly in the PTSD group, while relative abundance of Lachnospiraceae NK4A136_group increased significantly in the PTSD group. Further correlation analysis showed strong correlation between the plasma metabolome and gut microbiome. Conclusions: These findings confirm the association between the gut microbiome and the plasma metabolome in PTSD and point to these specific taxa and their connected metabolites as potential biomarkers and treatment targets in PTSD.
Keywords:
Post-Traumatic Stress Disorder
; gut microbiome
; plasma metabolome
; 16S rRNA sequencing
; UHPLC-MS/M
1. Introduction
Post-Traumatic Stress Disorder (PTSD) is a psychiatric disorder characterized by delayed emergence and chronic course following exposure to traumatic events. Its core clinical manifestation is involuntary, sensory-intense re-experiencing of the traumatic event [1,2]. PTSD frequently co-occurs with other psychiatric disorders and is associated with elevated risk for multiple physical conditions, including gastrointestinal disorders [3,4,5], immune dysregulation, and metabolic syndrome [6,7]. Notably, during the 2019 COVID-19 pandemic, a multinational epidemiological study encompassing populations from 24 countries reported a PTSD prevalence of 17.52% [8]. Therefore, identifying early diagnostic biomarkers for PTSD is clinically imperative for timely detection and targeted intervention.
Metabolomics evaluates overall metabolic status by systematically analyzing dynamic changes in small-molecule metabolites within biological systems [9,10]. As direct products of cellular physiological activities, these metabolites are highly abundant and structurally diverse; moreover, their abundance is jointly influenced by endogenous physiological processes and exogenous environmental factors [11,12]. Therefore, in-depth characterization of metabolite alterations and the metabolic pathways they engage in represents a critical approach to uncovering the intrinsic mechanisms underlying disease onset and progression [13]. In the field of PTSD research, multiple metabolomic studies have identified potential associations between specific metabolites and the disorder. Karabatsiakis et al. performed serum metabolomic profiling in 20 individuals with PTSD and 18 healthy controls, identifying palmitoylethanolamide and PE(17:1(9Z)/18:0) as the top candidate differentially expressed metabolites most strongly associated with PTSD [14]. Wei Y et al., through deep mining of blood metabolite data from 7,824 adults, found that higher circulating levels of palmitoyl sphingomyelin were associated with reduced risk of developing PTSD [15,16]. Moreover, the Global Arginine Bioavailability Ratio (GABR) has been validated as a clinically relevant biomarker for PTSD. Plasma GABR was significantly reduced in 56 individuals with PTSD and exhibited significant negative correlations with inflammatory marker concentrations, PTSD symptom severity, negative affect, and adverse childhood experiences [17]. Tomoko Inoue et al. further focused on fatty acid profiles, analyzing 24 plasma fatty acid species at one and three months post-trauma in 39 trauma-exposed individuals; they found significant differences in plasma levels of arachidonic acid, palmitic acid, stearic acid, oleic acid, linoleic acid, α-linolenic acid, dihomo-γ-linolenic acid, and docosahexaenoic acid between those who developed PTSD and those who did not [18]. Collectively, these findings indicate that certain specific metabolites may be closely linked to the pathophysiological mechanisms of PTSD.
The Microbiota–Gut–Brain Axis (MGBA), a bidirectional communication network linking the gut microbiota, the gastrointestinal tract, and the central nervous system, has become a key focus in neuropsychiatric disease research. A growing body of evidence confirms that dysbiosis of the gut microbiota is closely associated with the onset and progression of multiple psychiatric disorders, including Alzheimer’s disease [19], Parkinson’s disease [20], major depressive disorder [21,22], schizophrenia [23], and PTSD [24]. With regard to PTSD specifically, numerous population-based and animal-model studies have uncovered potential associations between alterations in gut microbial composition and abnormalities in brain function and behavior [25,26,27,28,29]. For example, Ruth Feldman et al. conducted a longitudinal cohort study of 148 individuals with long-term exposure to war-related environments and found that, during early childhood and adolescence, the relative abundance of the genus Dialister in the gut microbiota was significantly negatively correlated with PTSD symptom severity, whereas that of the genus Veillonella showed a significant positive correlation. More direct experimental evidence comes from Fecal Microbiota Transplantation (FMT) studies: when fecal microbiota from adolescents diagnosed with PTSD were transplanted into germ-free mice, the recipient mice exhibited a marked increase in intestinal Clostridium ramosum abundance and concurrently displayed clear anxiety-like behaviors [30]. In another study using a rat model of PTSD, 16S rRNA gene sequencing of gut microbiota revealed that the abundances of the phyla Firmicutes, Bacteroidetes, Cyanobacteria, and Proteobacteria were all significantly negatively correlated with serotonin levels in the brain [31]. Although it is widely acknowledged that the gut microbiota plays an important role in the pathophysiology of PTSD, the precise biological processes and underlying mechanisms remain poorly defined and require further in-depth investigation.
In this study, a murine PTSD model was induced using the SPS&S paradigm to examine gut microbiota–plasma metabolite associations. Gut microbial and plasma metabolite profiles in PTSD mice were characterized via 16S rRNA gene sequencing and UHPLC–MS/MS. Furthermore, pathway enrichment analysis and correlation analysis were performed to explore potential links between the altered microbial taxa and metabolites.
2. Methods
2.1. Animals
C57BL/6 mice (aged 8 weeks, male, with body weights ranging from 20 to 25 g) were sourced from the Experimental Animal Center of Army Medical University (Chongqing, China). The mice were housed in polypropylene cages under standardized environmental conditions: a 12-hour light/12-hour dark cycle, ambient temperature maintained at 20–22°C, with ad libitum access to standard laboratory chow and water. Prior to experimentation, all mice underwent a 7-day acclimation period in the experimental facility. All animal experiments involved in this study was approved by the Ethics Committee of Army Medical University (AMUWEC20225045), and all animal treatments were under the National Institutes of Health guidelines.
2.2. PTSD Model Establishment
Following the acclimation period, mice were randomly allocated to a control group and a PTSD model group (n = 5/group). The PTSD model was subsequently established in the model group using the Single Prolonged Stress and Electric Foot Shock (SPS&S) paradigm (Figure 1). This protocol comprised four sequential stressors: restraint stress, forced swimming, general anesthesia, and an unconditioned foot shock stimulus. The detailed procedure was executed as follows: PTSD model group mice were confined in restraint devices for 4 hours, then transferred to standard housing cages (50 × 40 × 30 cm) for 30 minutes of unrestricted movement. Subsequently, mice were subjected to forced swimming in polypropylene containers (diameter 20 cm, height 30 cm) containing water (25 °C; depth 20 cm) for 20 minutes. Post-swimming, mice were returned to housing cages for 30 minutes of recovery. Mice were then anesthetized via ether vapor inhalation until achieving surgical-plane anesthesia, as evidenced by absence of toe pinch reflex and depressed respiratory rate. After 30 minutes, PTSD model mice were placed in an electrified grid chamber (27 × 20 × 30 cm) and administered a single unconditioned foot shock (0.8 mA, 5 seconds). Control group mice underwent identical chamber exposure for 5 seconds without electrical stimulation. All mice were finally returned to housing cages under undisturbed conditions.
2.3. Behavioral Test
All behavioral tests were conducted by experienced experimenters blinded to group allocation. Testing occurred during the light phase of the diurnal cycle. At least 30 minutes prior to each test, mice with their home cages were transferred to the testing environment. Post-testing, all apparatus surfaces were sanitized with 75% ethanol solution and air-dried before subsequent utilization.
2.4. Elevated Plus Maze Test
Mouse anxiety levels were assessed using the Elevated Plus Maze Test (EPMT). The maze comprised two open arms and two enclosed arms (arm dimensions: 28 cm length × 5.8 cm width), with identical arm types positioned opposite each other. Enclosed arms were bounded by gray walls (height: 15.5 cm). The entire platform was elevated 55 cm above the floor, with arms converging at a central square (5 × 5 cm). During formal testing, mice were placed on the central platform facing an enclosed arm. Behavioral trajectories were continuously recorded for 5 minutes via a video tracking system. An arm entry was scored when the mouse's trunk (including all limbs) completely crossed the arm entrance threshold. Parameters analyzed included open arm duration and open arm entry frequency.
2.5. Open Field Test
The Open Field Test (OFT) was employed to quantify anxiety-like behavior in mice. Testing was conducted under low-illumination conditions in a sound-attenuated environment. The apparatus, constructed of black metal, measured 72 cm (L) × 72 cm (W) × 60 cm (H). The floor area was partitioned into 16 equidistant squares. During testing, each mouse was positioned in the central quadrant and permitted unrestricted exploration for 5 minutes. Behavioral parameters including ambulatory crossings and rearing events were digitally recorded via a video tracking system throughout the 5-min session.he 5-min session.
2.6. Sample Collection and Preparation
Following anesthesia via intraperitoneal pentobarbital sodium administration, murine blood was collected through transcardial puncture. Anticoagulated whole blood was transferred to heparinized tubes, gently inverted for homogenization, and incubated at room temperature for 30 minutes. Centrifugation protocols were implemented as follows: Primary centrifugation at 3000 × g for 10 minutes with supernatant harvest, Secondary centrifugation of supernatant at 5000 × g for 3 minutes, Resultant supernatant was aliquoted and cryopreserved at -80°C. Concurrently, aseptic surgical dissection was performed to excise intestinal tracts. Fresh fecal specimens were collected per mouse into 2 mL sterile microcentrifuge tubes and similarly cryopreserved at -80°C for subsequent microbiomic DNA extraction and 16S rRNA gene sequencing.
2.7. Cytokine Analysis
Retrieve plasma samples cryopreserved at -80°C and equilibrate to ambient temperature. Subject the plasma to 1:10 (v/v) dilution with assay-specific diluent, prepared in strict accordance with manufacturer's specifications. Process the diluted samples for quantitative ELISA analysis.
2.8. Metabolomics Analysis
Following thawing on ice at 4°C, plasma aliquots (100 μL) were immediately combined with 400 μL of pre-chilled methanol/acetonitrile (1:1, v/v). The mixture was vortex-mixed (30 sec) and subjected to ice-water bath sonication (5 min). Protein precipitation was achieved by incubation at -20°C (1 h), followed by centrifugation (13,000 × g, 15 min, 4°C). The supernatant was lyophilized in a vacuum concentrator. For UHPLC-MS/MS analysis, the lyophilizate was reconstituted in 100 μL reconstitution solvent [acetonitrile/water (1:1, v/v)], re-centrifuged (13,000 × g, 15 min, 4°C), and the resultant supernatant injected for analysis. Quality control (QC) samples were generated by pooling equal volumes (15 μL) of individual supernatants, with interleaved QC injections monitoring instrumental signal stability throughout the sequence.
LC-30A UHPLC system (Shimadzu, Kyoto, Japan) was operated in tandem with a TripleTOF 4600 system (SCIEX, Framingham, MA, USA). Separation steps were conducted by hydrophilic interaction liquid chromatography (HILIC) separation and reversed-phase liquid chromatography (RPLC) separation. A Kinetex C18 column (2.1 mm×100 mm, 2.6 μm, 100 Å, Phenomenex) was used for binary gradient elution. Solvent A consisted of 0.1% formic acid in water (v/v), solvent B comprised 0.1% formic acid in acetonitrile (v/v). The flow rate was 0.35 mL/min with an injection volume of 2 μL. Gradual increase program: gradient from 15% B (0 min) to 85% B (10 min), a total of 15 min run time. TSKgel NH2-100 column (2.1 mm × 100 mm, 3.0 μm, Tosoh) was used, with binary elution gradient programme. Solvent A was a 5 mM solution of ammonium acetate and solvent B was acetonitrile. Column flow rate With a flow rate of 0.25 mL/min and injection volume of 2 μL. The gradient was started from 100% B in 2 min, then switched to 15% B at 15 min, followed by 100% B at 20 min, with a total run time of 25 min.
2.9. Metabolomic Data Processing and Analysis
The preprocessed data were loaded into the R software environment. First, unsupervised Principal Component Analysis (PCA) was performed to detect and exclude potential outlier data points. Subsequently, Partial Least Squares Discriminant Analysis (PLS-DA) and Orthogonal Partial Least Squares Discriminant Analysis (OPLS-DA) were carried out. To evaluate the reliability and stability of the model, 200 permutation tests were conducted on each discriminant analysis model, and overfitting was assessed by comparing the intercept values of R² and Q² in the permutation test results. Concurrently, univariate statistical analysis was performed to screen metabolites that met both conditions of p<0.05 and VIP ≥ 1, which were designated as significantly different metabolites. The screened differential metabolites were annotated utilizing the Human Metabolome Database (HMDB) (http://www.hmdb.ca/). Finally, the identified significantly differentially expressed metabolites were imported into the Kyoto Encyclopedia of Genes and Genomes (KEGG) (http://www.genome.jp/kegg/), and pathway enrichment analysis was executed on the database to construct metabolic pathways associated with these differential metabolites.
2.10. 16S rRNA Sequencing of Gut Microbiota
Total genomic DNA was extracted from fecal samples using the OMEGA Soil DNA Kit (Omega Bio-Tek, USA). The concentration and purity of extracted DNA were assessed through 1% agarose gel electrophoresis and ultraviolet spectrophotometry (measuring the A260/A280 ratio). Based on concentration measurements, an appropriate volume of DNA was aliquoted for subsequent analysis. PCR amplification of the V3-V4 hypervariable region of the bacterial 16S rRNA gene was conducted with primers 515F (5′-GTGYCAGCMGCCGCGGTAA-3′) and 806R (5′-GGACTACNVGGGTWTCTAAT-3′). The thermocycling protocol comprised: initial denaturation at 94°C for 1 min (1 cycle); followed by 30 cycles of denaturation at 94°C for 20 s, annealing at 54°C for 30 s, and extension at 72°C for 30 s; concluding with a final extension at 72°C for 5 min (1 cycle); and storage at 4°C. The target amplicon (~400-450 bp) was purified using the QIAquick Gel Extraction Kit (Qiagen, Germany). Purified products were subjected to quantification via the QuantiFluor™ ST Fluorescence System (Promega, USA). Qualified libraries were ultimately sequenced using paired-end 250 bp (PE250) chemistry on the Illumina NovaSeq platform (Illumina, USA).
2.11. Bioinformatic and Statistical Analysis of 16S rRNA Data
Original FASTQ file was processed with the QIIME 2 package software (v2020.2; https://qiime2.org) for data quality control and filtering operational taxonomic units (OTU) table was generated based on the filtered sequence data. After that, alpha diversity indicators, including the Chao1, Shannon and Simpson indices, were calculated to indicate the level of species richness and diversity of the microbial community. For comparison of the difference of bacterial community structure in the control group and PTSD group (n = 5 for each group), β diversity indexes were determined and visualized by Principal Coordinates Analysis (PCoA) to identify overall differences and similarities of bacterial communities across sample groups. We also used Linear Discriminant Analysis Effect Size (LEfSe) method to screen microbial communities with significant intersample differences, which could be candidate biomarkers.
2.12. Statistical Analysis
All statistical analyses were performed using SPSS 20.0 software (SPSS Inc., USA). Normality was confirmed for all variables through empirical testing. One-way Analysis of Variance (ANOVA) was employed to identify significantly dysregulated molecules. Independent-samples Student’s t-tests were applied to compare intergroup differences and screen differentially expressed metabolites and microorganisms. Statistical significance thresholds were designated as follows: p < 0.05 indicated statistical significance, and p < 0.01 denoted high statistical significance.
3. Results
3.1. Elevated Plus Maze Test
The elevated cross maze test was employed to assess the anxiety levels of mice subjected to SPS&S. Significant differences were observed between the control and PTSD groups regarding total arm entry frequency (Figure 2A) and total arm dwell time (Figure 2B). SPS&S induction markedly decreased the percentage of open arm access times, with values of 42.3% for the control group and 32.4% for the PTSD group (Figure 2C). SPS&S induction also significantly reduced the percentage of open arm entry time, with 29.4% for the control group and 2.2% for the PTSD group (Figure 2D). The observed dwell time in the open arm was 365 seconds for the control group and 38 seconds for the PTSD group (Figure 2E). The number of open arm entries was 62 for the control group and 14 for the PTSD group (Figure 2F).
3.2. Open Field Test
The anxiety levels of mice induced by SPS&S were evaluated utilizing open field experiments. SPS&S induction significantly reduced total locomotion distance, with values of 1458.0 cm in the control group versus 943.5 cm in the PTSD group (Figure 3A). Furthermore, SPS&S induction markedly decreased central zone duration and rearing frequency. The central zone duration measured 47.8 seconds for controls and 25.5 seconds for the PTSD group (Figure 3B). Standing frequency was recorded at 19.2 episodes in controls and 13.8 episodes in the PTSD group (Figure 3C).
3.3. Cytokines
Following behavioral testing, plasma inflammatory factor levels were quantified in the PTSD murine model. Plasma concentrations of Interleukin-1β (IL-1β, p < 0.01) and Tumor Necrosis Factor-α (TNF-α, p < 0.01) were significantly elevated in PTSD model mice compared with controls (Figure 4A,4B).
3.4. Metabolomics Analysis
UHPLC-MS/MS was used to determine plasma metabolic profiles in control mice and PTSD mice models. The QC data had excellent experimental stability, reproducibility and reliability of data (Supplementary Figure S1). The PCA model was identified in all the metabolites of the two clusters, separating the controls and the PTSD participants, confirming the difference of the metabolic features (Supplementary Figure S2). Furthermore, OPLS-DA made a clear grouping difference between groups in positive ion mode (R2X=0.951, R2Y=1.0, Q2=0.996; Figure 5A), negative ion mode (R2X=0.766, R2Y=0.994, Q2=0.711; Figure 5B) thus confirming the substantial changes of PTSD plasma metabolomes. We performed two-hundred permutation tests for positive ion mode (R2 = 0.985, Q2 = -0.158; Figure 5C) and negative ion mode (R2 = 0.975, Q2 = -0.159; Figure 5D) did not overfit, which verifies the reliability and predictability of OPLS-DA model.
3.5. Differential Metabolites
Utilizing non-targeted metabolomics, 1,177 plasma metabolites were profiled in control and PTSD murine cohorts. Based on screening criteria (VIP > 1, p < 0.05), 24 significantly differential plasma metabolites were identified (Figure 6A,6B, Table 1). Cluster analysis demonstrated distinct separation patterns between groups (Figure 6D). KEGG pathway enrichment analysis revealed predominant involvement in: arginine biosynthesis, pyrimidine metabolism, unsaturated fatty acid biosynthesis, glycerophospholipid metabolism, arginine and proline metabolism, nicotinate and nicotinamide metabolism, and lysine degradation(Figure 6C).
3.6. Gut Microbial Community Diversity Analysis
The gut microbiota was detected by 16S rRNA sequencing, with an average of 44,000 high-quality clean reads per sample. Cluster analysis identified 1,048 OTUs. Among them, there were 259 OTUs exclusive to the control group and 437 OTUs unique to the PTSD group (Figure 7A). Richness and diversity of microbial communities in the two groups were analyzed by alpha diversity. The CHAO1 index, Shannon index and Simpson index all showed significantly higher indices in the PTSD group than the control group (p <0.05), it has been suggested that PTSD may alter the richness and diversity of the gut microbiota (Figure 7B). By analyzing the beta diversity through PCoA, PCoA showed that there was significant separation of the control group and the PTSD group (Figure 7C). Meanwhile, the OTUs were annotated and then the microorganisms were analysed at different taxonomic levels. At the level of phylum and class, the most dominant phylum and class was the phylum Bacteroidota and class Bacteroidia, respectively and represented >60% (Figure 8A, 8B). At the order level, Bacteroidales, Lachnospirales, Verrucomicrobiales dominated over 75% of the orders that were detected in the gut (Figure 8C). At the family level, the dominant taxa were Muribaculaceae, Lachnospiraceae, and Akkermansiaceae (Figure 8D). At the genus level, the highest abundance of the gut microbiota was found in Muribaculaceae (Figure 8E). There was a significant difference in the relative abundance of gut microbiota at the genus level between the control and PTSD groups.
3.7. LEfSe Analysis
LEfSe method was used to compare the characteristics of gut bacteria between the control group and the PTSD group. The differences were ascertained with an LDA score >2.0, p < 0.05. As shown in Figure 9A,9B, specific bacterial groups of the control group at the genus level were Zixibacterium and Streptococcus, respectively. The signature groups of PTSD group at the genus level were Reyranella, Terracidiphilus, Muribaculaceae and Vibrioimonas.
3.8. Correlation of Gut Microbiota with Plasma Metabolites
For insights into the functional link between gut microbiota and the levels of plasma metabolites in the mouse PTSD model, Spearman’s correlation analysis was performed at the genus level (Figure 10). Significant associations were observed: correlations of members of Muribaculaceae with L-Glutamine (P < 0.001), 2-oxohexanoate (P < 0.05) and Thymidine (P < 0.05) were positive, but negative associations with Palmitic acid (P < 0.001), Oleic acid (P < 0.001), L-Arginine (P < 0.01) and Palmitoyl-sphingomyelin (P < 0.01), and L-Ornithine (P < 0.05); Akkermansia was negatively correlated with Hydroquinone (P < 0.01) and L-Tryptophan (P < 0.05). Lachnospiraceae_NK4A136_group had a positive correlation with N-Acetylornithine (P < 0.05). These observations indicate functional interplay between intestinal microbiota and circulating metabolites.
4. Discussion
Post-Traumatic Stress Disorder exhibits complex etiological mechanisms and is frequently comorbid with emotional dysregulation such as anxiety. Clinical translation of biomarkers and therapeutic targets remains limited, with molecular pathogenesis yet to be fully elucidated. This study employed SPS&S combined with plantar electrical stimulation to simulate traumatic conditions [32], successfully establishing a PTSD murine model validated through behavioral assessments including the EPMT and OFT. Results demonstrated that compared to controls, PTSD model mice exhibited significant reductions in open-arm entry percentage (p < 0.05) and time spent in open arms during EPMT (p < 0.05), alongside decreased total locomotion distance (p < 0.05) and grid crossings in OFT (p < 0.05), indicating hypoactivity and diminished exploratory behavior. Furthermore, plasma levels of pro-inflammatory cytokines TNF-α (p < 0.01) and IL-1β (p < 0.05) were significantly elevated in the PTSD group, aligning with established literature [33,34,35]. Metabolomic profiling revealed disruptions in plasma metabolites including L-arginine, ornithine, palmitic acid, oleic acid, uridine, creatinine, histidine, L-tryptophan, L-lysine, and uracil. Differential metabolites were significantly enriched in arginine biosynthesis, pyrimidine metabolism, unsaturated fatty acid biosynthesis, glycerophospholipid metabolism, arginine and proline metabolism, niacin/nicotinamide metabolism, and lysine degradation pathways. Concurrently, gut microbiota dysbiosis was observed in the PTSD group, characterized by significantly reduced abundance of beneficial taxa including Muribaculaceae and Akkermansia.
Arginine, a semi-essential amino acid, undergoes primary metabolism via arginase and Nitric Oxide Synthase (NOS), yielding urea and L-ornithine, as well as Nitric Oxide (NO) and citrulline, respectively [36,37]. In the GABR study, PTSD subjects exhibited significantly elevated serum ornithine levels (p < 0.05) and reduced arginine concentrations compared to controls [17]. Notably, serum arginine levels in Bipolar Disorder (BD) patients were significantly higher than in healthy subjects (p < 0.01) [38], whereas cerebrospinal fluid arginine levels showed no significant intergroup difference [39]. A marked increase in serum ornithine was also documented in severe depression (p < 0.05) [40], which facilitates ornithine conversion to polyamines—a process critical for tissue repair during late-stage inflammatory responses [41]. In this investigation, plasma L-arginine levels in PTSD model mice were significantly elevated versus controls (p < 0.01). Following arginase-mediated metabolism, resulting in significantly higher plasma ornithine concentrations (p < 0.05). These collective findings implicate the L-arginine-ornithine metabolic axis in PTSD pathogenesis.
Saturated Fatty Acids (SFAs) upregulate pro-inflammatory cytokine expression [42] and traverse the blood-brain barrier via phospholipid-bound transport [43]. Palmitic Acid (PA), the predominant SFA in human plasma, demonstrates significant positive correlations between serum TNF-α/IL-6 levels and plasma PA concentrations in PTSD patients (p < 0.01) [44]. In vitro studies using the human microglial HMC3 cell line confirm that PA and Lipopolysaccharide (LPS) induce concentration-dependent ceramide accumulation, resulting in sustained IL-6 upregulation [45]. Ceramides trigger endoplasmic reticulum stress, inhibit mitochondrial β-oxidation, and activate NOD-like receptor containing a pyrin domain 3 (NLRP3) inflammasome-mediated IL-1β release [46]. Murine models further indicate that PA excess reduces spontaneous locomotion, induces anxiety-like behaviors, and elevates amygdala 5-Hydroxyindoleacetic Acid (5-HIAA) metabolism [47,48]. This investigation reveals significant upregulation of plasma PA and palmitoyl-sphingomyelin in murine PTSD models, with PA concentrations positively correlating with TNF-α and IL-1β, implicating PA as a key pathophysiological regulator in PTSD.
Hepatic studies demonstrate that excessive palmitic acid induces endoplasmic reticulum stress and inflammatory cascades, whereas Oleic Acid (OA) effectively attenuates palmitic acid-mediated inflammation. Mechanistically, OA persistently activates AMP-activated protein kinase (AMPK) through elevated adiponectin levels, thereby inhibiting palmitic acid-induced ceramide synthesis and ultimately suppressing NLRP3 inflammasome-mediated IL-1β elevation [49,50]. This investigation documented significantly elevated plasma OA levels in PTSD-model mice. Critically, the trauma-induced OA surge suggests acute inflammatory phase activation in model subjects.
Uridine, a key metabolite with neuroprotective effects, enhances neurophysiological functions [51]. Prior studies demonstrate significantly reduced urinary uridine levels in murine PTSD models, accompanied by pyrimidine metabolism disruption [52]. This investigation further documents decreased plasma uridine and uracil concentrations in the PTSD model group. Notably, plasma uridine exhibits circadian fluctuations and is transported via the circulatory system to cerebrospinal fluid and brain extracellular spaces [53], exerting significant anti-anxiety and anticonvulsant effects [54]. Based on combined plasma and urine analyses, systemic uridine downregulation in the PTSD model group suggests its potential role as a pathogenic regulator in PTSD.
Metabolic pathway enrichment analysis results indicated that the intergroup differential metabolites mainly enriched metabolic pathways of arginine biosynthesis, pyrimidine metabolism, and unsaturated fatty acids biosynthesis. Metabolomics data also suggested that traumatic stress caused activation of hepatic metabolite flux of palmitic acid, L-arginine and ornithine due to perturbation of some metabolic pathways such as arginine synthesis, pyrimidine metabolism, unsaturated fatty acids biosynthesis and glycerophospholipid metabolism are perturbed, promoting plasma inflammatory cytokine release. Concurrently, palmitic acid passes through the blood–brain barrier and induces neuroinflammation, while the uridine deficit impairs neuroprotection, accounting for anxiety-like PTSD symptoms.
The phyla Firmicutes and Bacteroidetes serve as core components of the human gut microbiota, playing a crucial role in maintaining normal gastrointestinal function [55]. Based on 16S rRNA sequencing analysis at the phylum level, we observed that Firmicutes and Bacteroidetes exhibited the highest abundance. Furthermore, the Bacteroidetes/Firmicutes ratio showed a significant difference between the two groups. At the family level, the PTSD model group displayed characteristic dysbiosis: significantly decreased abundance of Muribaculaceae, Akkermansiaceae, Prevotellaceae, and Lactobacillaceae; while Lachnospiraceae and Desulfovibrionaceae showed significantly increased abundance. These results indicate PTSD induces profound dysregulation of murine gut microbiota.
To further explore the mechanism of action of gut microbiota in PTSD model mice, the analysis at the genus level revealed a significant decrease in the abundances of the Muribaculaceae and Akkermansia, while the abundance of the Lachnospiraceae NK4A136_group increased significantly. Among them, Muribaculaceae is the dominant anaerobic taxon in the mouse intestine [56], possessing antioxidant properties and stress resilience [57]. An increase in its abundance improves the intestinal microenvironment homeostasis, promotes the synthesis of beneficial metabolites, and ameliorates anxiety-like behaviors [58]; the decrease in Akkermansia abundance represents a hallmark feature of low-grade inflammatory conditions in both humans and mice [59,60]; the increase in the abundance of Lachnospiraceae NK4A136_group demonstrates established associations with anxiety, depression, cognitive impairment [61], and vestibular dysfunction accompanied by neuropathic pain [62]. It is noteworthy that the LEfSe analysis suggests Muribaculaceae may serve as a potential PTSD biomarker, or participate in pathological processes through synergistic effects of microbiota.
In PTSD model mice, gut microbiota dysbiosis induced by traumatic stress (such as imbalance of commensal taxa including Muribaculaceae, Akkermansia, and Lachnospiraceae NK4A136_group) may increase intestinal permeability, subsequently promoting pro-inflammatory cytokine release from intestinal epithelial cells [63,64]. Spearman correlation analysis revealed Muribaculaceae significant negative correlations with PA and OA. Among them, PA exacerbates pathological processes by promoting systemic inflammatory factor release, while compensatory elevation in OA concentrations exerts protective effects by inhibiting PA-mediated inflammatory responses. Collectively, integrated gut microbiota-metabolomic analysis confirms significant interactions among inflammatory responses, gut microbiota disruption, and plasma metabolite imbalance.
Although in our study, we found differences in gut microbiota and plasma metabolites in PTSD model mice, some limitations still exist. Our study induced PTSD model mice with systemic inflammation, but we haven't experimentally studied the expression of inflammatory factors in the brain tissue and neuronal cells. To a certain extent, we have corroborated several associations among gut microbiota, plasma metabolism, inflammation, and anxiety-like behaviour, but we need further experiments to link phenotype to mechanism.
5. Conclusions
This study examined the interplay between gut microbiota and plasma metabolites in mice modeling PTSD, using 16S rRNA gene sequencing coupled with UHPLC-MS/MS. The gut microbiome data showed that PTSD caused highly disordered gut microbiota in mice, and the Muribaculaceae strain screened may be a potential biomarker for PTSD model mice. Plasma metabolomic profiling identified arginine biosynthesis, unsaturated fatty acid biosynthesis, and pyrimidine metabolism as the top pathways enriched among differentially abundant metabolites between PTSD and control mice. Spearman correlation analysis uncovered robust associations between specific microbial taxa and plasma metabolite abundances. These results suggested that gut microbiota and plasma metabolites also contribute to the pathophysiology of PTSD and provided a basis for future mechanistic investigation.
Supplementary Materials
The following supporting information can be downloaded at the website of this paper posted on Preprints.org, Figure S1: The Pearson’s correlation coefficient among QC samples; Figure S2: PCA Results.
Author Contributions
Conceptualization: H.Y. and Z.D.; Methodology: H.Y. and L.F.; Validation: L.Q.; Formal analysis: C.J.; Investigation: W.Q.; Data curation: Z.D. and L.Z.; Writing—original draftpreparation: Z.D. and W.X.; Writing—review and editing: H.Y., L.Z. and Z.D.;Visualization: L.F. and C.J.; Supervision: W.Q. and L.Q.; Funding acquisition: H.Y. All authors have read and agreed to the published version of the manuscript.
Funding
This research was funded by the Natural Science Foundation of Chongqing (General Program) (CSTB2022NSCQ-MSX0163).
Institutional Review Board Statement
This study was approved by the Ethics Committee of Army Medical University in 17 March 2022 (AMUWE20225045).
Informed Consent Statement
Not applicable.
Data Availability Statement
The raw 16S rRNA gene sequencing data generated in this study have been deposited in NCBI Sequence Read Archive (SRA) under the BioProject accession number PRJNA1418332.
Acknowledgments
We gratefully acknowledge the financial support from the Natural Science Foundation of Chongqing (General Program) (Grant Nos. CSTB2022NSCQ-MSX0163).
Conflicts of Interest
The authors declare that they have no competing interests.
Abbreviations
The following abbreviations are used in this manuscript:
| PTSD | Post-traumatic stress disorder |
| SPS&S | Single prolonged stress and electric foot shock |
| UHPLC-MS/MS | Ultra-high-performance liquid chromatography–tandem mass spectrometry |
| GABR | global arginine bioavailability ratio |
| MGBA | microbiota–gut–brain axis |
| FMT | fecal microbiota transplantation |
| EPMT | Elevated plus maze test |
| OFT | Open field test |
| PCA | Principal component analysis |
| PLS-DA | Partial least squares discriminant analysis |
| OPLS-DA | Orthogonal partial least squares discriminant analysis |
| HMDB | Human metabolome database |
| KEGG | Kyoto encyclopedia of genes and genomes |
| OUT | Operational taxonomic units |
| PCoA | Principal coordinates analysis |
| LEfSe | Linear discriminant analysis effect size |
| ANOVA | Analysis of variance |
| IL-1β | Interleukin-1β |
| TNF-α | Tumor necrosis factor-α |
| NOS | Nitric oxide synthase |
| NO | Nitric oxide |
| BD | Bipolar disorder |
| SFAs | Saturated fatty acids |
| PA | Palmitic acid |
| LPS | Lipopolysaccharides |
| NLRP3 | NOD-like receptor containing a pyrin domain 3 |
| 5-HIAA | 5-hydroxyindoleacetic acid |
| OA | Oleic acid |
| AMPK | AMP-activated protein kinase |
References
- Wilker, S.; Schneider, A.; Conrad, D.; Pfeiffer, A.; Boeck, C.; Lingenfelder, B.; Freytag, V.; Vukojevic, V.; Vogler, C.; Milnik, A.; et al. Genetic variation is associated with PTSD risk and aversive memory: Evidence from two trauma-Exposed African samples and one healthy European sample. Transl Psychiatry 2018, 8, 251. [Google Scholar] [CrossRef]
- Wingo, T.S.; Gerasimov, E.S.; Liu, Y.; Duong, D.M.; Vattathil, S.M.; Lori, A.; Gockley, J.; Breen, M.S.; Maihofer, A.X.; Nievergelt, C.M.; et al. Integrating human brain proteomes with genome-wide association data implicates novel proteins in post-traumatic stress disorder. Mol Psychiatry 2022, 27, 3075–3084. [Google Scholar] [CrossRef]
- Franzosa, E.A.; Sirota-Madi, A.; Avila-Pacheco, J.; Fornelos, N.; Haiser, H.J.; Reinker, S.; Vatanen, T.; Hall, A.B.; Mallick, H.; McIver, L.J.; et al. Gut microbiome structure and metabolic activity in inflammatory bowel disease. Nat Microbiol 2018, 4, 293–305. [Google Scholar] [CrossRef]
- Hendrix, J.; Ranginani, D.; Montero, A.M.; Lockett, C.; Xu, H.; James-Stevenson, T.; Shin, A. Early adverse life events and post-traumatic stress disorder in patients with constipation and suspected disordered defecation. Neurogastroenterol Motil 2021, 34, e14195. [Google Scholar] [CrossRef] [PubMed]
- Malhotra, D.; Boyle, S.H.; Gifford, E.J.; Sullivan, B.A.; Nguyen Wenker, T.H.; Abs, N.-D.; Ahmed, S.T.; Upchurch, J.; Vahey, J.; Stafford, C.; et al. Self-reported gastrointestinal disorders among veterans with gulf war illness with and without posttraumatic stress disorder. Neurogastroenterol Motil 2023, 35, e14548. [Google Scholar] [CrossRef] [PubMed]
- Mellon, S.H.; Gautam, A.; Hammamieh, R.; Jett, M.; Wolkowitz, O.M. Metabolism, Metabolomics, and Inflammation in Posttraumatic Stress Disorder. Biol Psychiatry 2018, 83, 866–875. [Google Scholar] [CrossRef] [PubMed]
- Wolf, E.J.; Bovin, M.J.; Green, J.D.; Mitchell, K.S.; Stoop, T.B.; Barretto, K.M.; Jackson, C.E.; Lee, L.O.; Fang, S.C.; Trachtenberg, F.; et al. Longitudinal associations between post-traumatic stress disorder and metabolic syndrome severity. Psychol Med 2016, 46, 2215–2226. [Google Scholar] [CrossRef]
- Yunitri, N.; Chu, H.; Kang, X.L.; Jen, H.-J.; Pien, L.-C.; Tsai, H.-T.; Kamil, A.R.; Chou, K.-R. Global prevalence and associated risk factors of posttraumatic stress disorder during COVID-19 pandemic: A meta-analysis. Int J Nurs Stud 2021, 126, 104136. [Google Scholar] [CrossRef]
- Mastrangelo, A.; Panadero, M.I.; Pérez, L.M.; Gálvez, B.G.; García, A.; Barbas, C.; Rupérez, F.J. New insight on obesity and adipose-derived stem cells using comprehensive metabolomics. Biochem J 2016, 473, 2187–2203. [Google Scholar] [CrossRef]
- Quinones, M.P.; Kaddurah-Daouk, R. Metabolomics tools for identifying biomarkers for neuropsychiatric diseases. Neurobiol Dis 2009, 35, 165–176. [Google Scholar] [CrossRef]
- Pontes, J.G.M.; Brasil, A.J.M.; Cruz, G.C.F.; de Souza, R.N.; Tasic, L. NMR-based metabolomics strategies: plants, animals and humans. ANALYTICAL METHODS 2017, 9, 1078–1096. [Google Scholar] [CrossRef]
- Nedic Erjavec, G.; Konjevod, M.; Nikolac Perkovic, M.; Svob Strac, D.; Tudor, L.; Barbas, C.; Grune, T.; Zarkovic, N.; Pivac, N. Short overview on metabolomic approach and redox changes in psychiatric disorders. Redox Biol 2017, 14, 178–186. [Google Scholar] [CrossRef]
- Johnson, C.H.; Ivanisevic, J.; Siuzdak, G. Metabolomics: beyond biomarkers and towards mechanisms. Nat Rev Mol Cell Biol 2016, 17, 451–459. [Google Scholar] [CrossRef] [PubMed]
- Karabatsiakis, A.; Hamuni, G.; Wilker, S.; Kolassa, S.; Renu, D.; Kadereit, S.; Schauer, M.; Hennessy, T.; Kolassa, I.-T. Metabolite profiling in posttraumatic stress disorder. J Mol Psychiatry 2015, 3, 2. [Google Scholar] [CrossRef]
- Shin, S.-Y.; Fauman, E.B.; Petersen, A.-K.; Krumsiek, J.; Santos, R.; Huang, J.; Arnold, M.; Erte, I.; Forgetta, V.; Yang, T.-P.; et al. An atlas of genetic influences on human blood metabolites. Nat Genet 2014, 46, 543–550. [Google Scholar] [CrossRef] [PubMed]
- Wei, Y.; Huang, L.; Sui, J.; Liu, C.; Qi, M. Human blood metabolites and risk of post-traumatic stress disorder: A Mendelian randomization study. J Affect Disord 2024, 372, 227–233. [Google Scholar] [CrossRef]
- Bersani, F.S.; Wolkowitz, O.M.; Lindqvist, D.; Yehuda, R.; Flory, J.; Bierer, L.M.; Makotine, I.; Abu-Amara, D.; Coy, M.; Reus, V.I.; et al. Global arginine bioavailability, a marker of nitric oxide synthetic capacity, is decreased in PTSD and correlated with symptom severity and markers of inflammation. Brain Behav Immun 2015, 52, 153–160. [Google Scholar] [CrossRef]
- Inoue, T.; Ogawa, S.; Narita, Z.; Sekiguchi, M.; Asari, Y.; Kataoka, Y.; Hattori, J.; Hori, H.; Kim, Y.; Inada, K. A Longitudinal Study of the Association of Blood Unsaturated Fatty Acids With Posttraumatic Stress Disorder (PTSD). Neuropsychopharmacol Rep 2025, 45, e12522. [Google Scholar] [CrossRef]
- Chen, C.; Liao, J.; Xia, Y.; Liu, X.; Jones, R.; Haran, J.; McCormick, B.; Sampson, T.R.; Alam, A.; Ye, K. Gut microbiota regulate Alzheimer's disease pathologies and cognitive disorders via PUFA-associated neuroinflammation. Gut 2022, 71, 2233–2252. [Google Scholar] [CrossRef]
- Tan, A.H.; Lim, S.Y.; Lang, A.E. The microbiome-gut-brain axis in Parkinson disease - from basic research to the clinic. Nat Rev Neurol 2022, 18, 476–495. [Google Scholar] [CrossRef]
- Zhao, Q.; Baranova, A.; Cao, H.; Zhang, F. Gut microbiome and major depressive disorder: insights from two-sample Mendelian randomization. BMC Psychiatry 2024, 24, 493. [Google Scholar] [CrossRef] [PubMed]
- Foster, J.A.; Baker, G.B.; Dursun, S.M. The Relationship Between the Gut Microbiome-Immune System-Brain Axis and Major Depressive Disorder. Front Neurol 2021, 12, 721126. [Google Scholar] [CrossRef] [PubMed]
- Ioannou, M.; Borkent, J.; Andreu-Sánchez, S.; Wu, J.; Fu, J.; Sommer, I.E.C.; Haarman, B.C.M. Reproducible gut microbial signatures in bipolar and schizophrenia spectrum disorders: A metagenome-wide study. Brain Behav Immun 2024, 121, 165–175. [Google Scholar] [CrossRef] [PubMed]
- He, Q.; Wang, W.; Xu, D.; Xiong, Y.; Tao, C.; You, C.; Ma, L.; Ma, J. Potential causal association between gut microbiome and posttraumatic stress disorder. Transl Psychiatry 2024, 14, 67. [Google Scholar] [CrossRef]
- Gorecki, A.M.; Preskey, L.; Bakeberg, M.C.; Kenna, J.E.; Gildenhuys, C.; MacDougall, G.; Dunlop, S.A.; Mastaglia, F.L.; Akkari, P.A.; Koengten, F.; et al. Altered Gut Microbiome in Parkinson's Disease and the Influence of Lipopolysaccharide in a Human α-Synuclein Over-Expressing Mouse Model. Front Neurosci 2019, 13, 839. [Google Scholar] [CrossRef]
- Qi, Z.; Lyu, M.; Yang, L.; Yuan, H.; Cao, Y.; Zhai, L.; Dang, W.; Liu, J.; Yang, F.; Li, Y. A Novel and Reliable Rat Model of Autism. Front Psychiatry 2021, 12, 549810. [Google Scholar] [CrossRef]
- Ait-Belgnaoui, A.; Payard, I.; Rolland, C.; Harkat, C.; Braniste, V.; Théodorou, V.; Tompkins, T.A. Bifidobacterium longum and Lactobacillus helveticus Synergistically Suppress Stress-related Visceral Hypersensitivity Through Hypothalamic-Pituitary-Adrenal Axis Modulation. J Neurogastroenterol Motil 2018, 24, 138–146. [Google Scholar] [CrossRef]
- Schretter, C.E.; Vielmetter, J.; Bartos, I.; Marka, Z.; Marka, S.; Argade, S.; Mazmanian, S.K. A gut microbial factor modulates locomotor behaviour in Drosophila. Nature 2018, 563, 402–406. [Google Scholar] [CrossRef] [PubMed]
- Cowan, C.S.M.; Hoban, A.E.; Ventura-Silva, A.P.; Dinan, T.G.; Clarke, G.; Cryan, J.F. Gutsy Moves: The Amygdala as a Critical Node in Microbiota to Brain Signaling. Bioessays 2017, 40. [Google Scholar] [CrossRef]
- Ruth, F.; Karen, Y.; Sondra, T.; Oshrit, S.; Orna, Z.-S.; Lelyan, M.; Yoram, L.; Omry, K. Microbiome Mediates Development of PTSD and Resilience. Research Square 2022, Preprint (version 1). [Google Scholar] [CrossRef]
- Zhou, Q.; Sun, T.; Wu, F.; Li, F.; Liu, Y.; Li, W.; Dai, N.; Tan, L.; Li, T.; Song, Y. Correlation of gut microbiota and neurotransmitters in a rat model of post-traumatic stress disorder. Journal of Traditional Chinese Medical Sciences 2020, 7, 375–385. [Google Scholar] [CrossRef]
- Xi, K.; Xiao, H.; Huang, X.; Yuan, Z.; Liu, M.; Mao, H.; Liu, H.; Ma, G.; Cheng, Z.; Xie, Y.; et al. Reversal of hyperactive higher-order thalamus attenuates defensiveness in a mouse model of PTSD. Sci Adv 2023, 9, eade5987. [Google Scholar] [CrossRef]
- Lindqvist, D.; Wolkowitz, O.M.; Mellon, S.; Yehuda, R.; Flory, J.D.; Henn-Haase, C.; Bierer, L.M.; Abu-Amara, D.; Coy, M.; Neylan, T.C.; et al. Proinflammatory milieu in combat-related PTSD is independent of depression and early life stress. Brain Behav Immun 2014, 42, 81–88. [Google Scholar] [CrossRef]
- Guo, M.; Liu, T.; Guo, J.-C.; Jiang, X.-L.; Chen, F.; Gao, Y.-S. Study on serum cytokine levels in posttraumatic stress disorder patients. Asian Pac J Trop Med 2012, 5, 323–325. [Google Scholar] [CrossRef]
- Spitzer, C.; Barnow, S.; Völzke, H.; Wallaschofski, H.; John, U.; Freyberger, H.J.; Löwe, B.; Grabe, H.J. Association of posttraumatic stress disorder with low-grade elevation of C-reactive protein: evidence from the general population. J Psychiatr Res 2009, 44, 15–21. [Google Scholar] [CrossRef]
- Bronte, V.; Zanovello, P. Regulation of immune responses by L-arginine metabolism. Nat Rev Immunol 2005, 5, 641–654. [Google Scholar] [CrossRef]
- Morris, S.M. Arginine metabolism: boundaries of our knowledge. J Nutr 2007, 137, 1602S–1609S. [Google Scholar] [CrossRef]
- Yoshimi, N.; Futamura, T.; Kakumoto, K.; Salehi, A.M.; Sellgren, C.M.; Holmén-Larsson, J.; Jakobsson, J.; Pålsson, E.; Landén, M.; Hashimoto, K. Blood metabolomics analysis identifies abnormalities in the citric acid cycle, urea cycle, and amino acid metabolism in bipolar disorder. BBA Clin 2016, 5, 151–158. [Google Scholar] [CrossRef]
- Yoshimi, N.; Futamura, T.; Bergen, S.E.; Iwayama, Y.; Ishima, T.; Sellgren, C.; Ekman, C.J.; Jakobsson, J.; Pålsson, E.; Kakumoto, K.; et al. Cerebrospinal fluid metabolomics identifies a key role of isocitrate dehydrogenase in bipolar disorder: evidence in support of mitochondrial dysfunction hypothesis. Mol Psychiatry 2016, 21, 1504–1510. [Google Scholar] [CrossRef]
- Ozden, A.; Angelos, H.; Feyza, A.; Elizabeth, W.; John, P. Altered plasma levels of arginine metabolites in depression. J Psychiatr Res 2019, 120, 21–28. [Google Scholar] [CrossRef]
- Watts, D.; Pfaffenseller, B.; Wollenhaupt-Aguiar, B.; Paul Géa, L.; Cardoso, T.D.A.; Kapczinski, F. Agmatine as a potential therapeutic intervention in bipolar depression: the preclinical landscape. Expert Opin Ther Targets 2019, 23, 327–339. [Google Scholar] [CrossRef]
- Ralston, J.C.; Metherel, A.H.; Stark, K.D.; Mutch, D.M. SCD1 mediates the influence of exogenous saturated and monounsaturated fatty acids in adipocytes: Effects on cellular stress, inflammatory markers and fatty acid elongation. J Nutr Biochem 2015, 27, 241–248. [Google Scholar] [CrossRef]
- Pifferi, F.; Laurent, B.; Plourde, M. Lipid Transport and Metabolism at the Blood-Brain Interface: Implications in Health and Disease. Front Physiol 2021, 12, 645646. [Google Scholar] [CrossRef]
- Ogawa, S.; Hori, H.; Niwa, M.; Itoh, M.; Lin, M.; Yoshida, F.; Ino, K.; Kawanishi, H.; Narita, M.; Nakano, W.; et al. Serum lipid and plasma fatty acid profiles in PTSD patients and healthy individuals: Associations with symptoms, cognitive function, and inflammatory markers. Prog Neuropsychopharmacol Biol Psychiatry 2025, 138, 111298. [Google Scholar] [CrossRef]
- Lu, Z.; Liu, S.; Lopes-Virella, M.F.; Wang, Z. LPS and palmitic acid Co-upregulate microglia activation and neuroinflammatory response. Compr Psychoneuroendocrinol 2021, 6, 100048. [Google Scholar] [CrossRef]
- Chaurasia, B.; Summers, S.A. Ceramides - Lipotoxic Inducers of Metabolic Disorders. Trends Endocrinol Metab 2015, 26, 538–550. [Google Scholar] [CrossRef]
- Moon, M.L.; Joesting, J.J.; Lawson, M.A.; Chiu, G.S.; Blevins, N.A.; Kwakwa, K.A.; Freund, G.G. The saturated fatty acid, palmitic acid, induces anxiety-like behavior in mice. Metabolism 2014, 63, 1131–1140. [Google Scholar] [CrossRef]
- Neufeld-Cohen, A.; Evans, A.K.; Getselter, D.; Spyroglou, A.; Hill, A.; Gil, S.; Tsoory, M.; Beuschlein, F.; Lowry, C.A.; Vale, W.; et al. Urocortin-1 and -2 double-deficient mice show robust anxiolytic phenotype and modified serotonergic activity in anxiety circuits. Mol Psychiatry 2009, 15. [Google Scholar] [CrossRef]
- Finucane, O.M.; Lyons, C.L.; Murphy, A.M.; Reynolds, C.M.; Klinger, R.; Healy, N.P.; Cooke, A.A.; Coll, R.C.; McAllan, L.; Nilaweera, K.N.; et al. Monounsaturated fatty acid-enriched high-fat diets impede adipose NLRP3 inflammasome-mediated IL-1β secretion and insulin resistance despite obesity. Diabetes 2015, 64, 2116–2128. [Google Scholar] [CrossRef]
- Holland, W.L.; Miller, R.A.; Wang, Z.V.; Sun, K.; Barth, B.M.; Bui, H.H.; Davis, K.E.; Bikman, B.T.; Halberg, N.; Rutkowski, J.M.; et al. Receptor-mediated activation of ceramidase activity initiates the pleiotropic actions of adiponectin. Nat Med 2010, 17, 55–63. [Google Scholar] [CrossRef]
- Mironova, G.D.; Khrenov, M.O.; Talanov, E.Y.; Glushkova, O.V.; Parfenyuk, S.B.; Novoselova, T.V.; Lunin, S.M.; Belosludtseva, N.V.; Novoselova, E.G.; Lemasters, J.J. The role of mitochondrial KATP channel in anti-inflammatory effects of uridine in endotoxemic mice. Arch Biochem Biophys 2018, 654, 70–76. [Google Scholar] [CrossRef]
- Zhou, D.; Long, C.; Shao, Y.; Li, F.; Sun, W.; Zheng, Z.; Wang, X.; Huang, Y.; Pan, F.; Chen, G.; et al. Integrated Metabolomics and Proteomics Analysis of Urine in a Mouse Model of Posttraumatic Stress Disorder. Front Neurosci 2022, 16, 828382. [Google Scholar] [CrossRef]
- Traut, T.W. Physiological concentrations of purines and pyrimidines. Mol Cell Biochem 1994, 140. [Google Scholar] [CrossRef]
- Connolly, G.P.; Duley, J.A. Uridine and its nucleotides: biological actions, therapeutic potentials. Trends Pharmacol Sci 1999, 20, 218–225. [Google Scholar] [CrossRef]
- Ley, R.E.; Peterson, D.A.; Gordon, J.I. Ecological and evolutionary forces shaping microbial diversity in the human intestine. Cell 2006, 124, 837–848. [Google Scholar] [CrossRef]
- Smith, B.J.; Miller, R.A.; Ericsson, A.C.; Harrison, D.C.; Strong, R.; Schmidt, T.M. Changes in the gut microbiome and fermentation products concurrent with enhanced longevity in acarbose-treated mice. BMC Microbiol 2019, 19, 130. [Google Scholar] [CrossRef]
- Ormerod, K.L.; Wood, D.L.A.; Lachner, N.; Gellatly, S.L.; Daly, J.N.; Parsons, J.D.; Dal'Molin, C.G.O.; Palfreyman, R.W.; Nielsen, L.K.; Cooper, M.A.; et al. Genomic characterization of the uncultured Bacteroidales family S24-7 inhabiting the guts of homeothermic animals. Microbiome 2016, 4, 36. [Google Scholar] [CrossRef]
- Zhang, F.; Zhou, Y.; Chen, H.; Jiang, H.; Zhou, F.; Lv, B.; Xu, M. Curcumin Alleviates DSS-Induced Anxiety-Like Behaviors via the Microbial-Brain-Gut Axis. Oxid Med Cell Longev 2022, 2022, 6244757. [Google Scholar] [CrossRef]
- Cani, P.D.; Depommier, C.; Derrien, M.; Everard, A.; de Vos, W.M. Akkermansia muciniphila: paradigm for next-generation beneficial microorganisms. Nat Rev Gastroenterol Hepatol 2022, 19, 625–637. [Google Scholar] [CrossRef]
- Cani, P.D.; de Vos, W.M. Next-Generation Beneficial Microbes: The Case of Akkermansia muciniphila. Front Microbiol 2017, 8, 1765. [Google Scholar] [CrossRef]
- Xia, T.; Duan, W.; Zhang, Z.; Li, S.; Zhao, Y.; Geng, B.; Zheng, Y.; Yu, J.; Wang, M. Polyphenol-rich vinegar extract regulates intestinal microbiota and immunity and prevents alcohol-induced inflammation in mice. Food Res Int 2021, 140, 110064. [Google Scholar] [CrossRef] [PubMed]
- Shen, C.-L.; Wang, R.; Ji, G.; Elmassry, M.M.; Zabet-Moghaddam, M.; Vellers, H.; Hamood, A.N.; Gong, X.; Mirzaei, P.; Sang, S.; et al. Dietary supplementation of gingerols- and shogaols-enriched ginger root extract attenuate pain-associated behaviors while modulating gut microbiota and metabolites in rats with spinal nerve ligation. J Nutr Biochem 2021, 100, 108904. [Google Scholar] [CrossRef]
- Wu, H.-J.; Wu, E. The role of gut microbiota in immune homeostasis and autoimmunity. Gut Microbes 2012, 3. [Google Scholar] [CrossRef] [PubMed]
- Doney, E.; Cadoret, A.; Dion-Albert, L.; Lebel, M.; Menard, C. Inflammation-driven brain and gut barrier dysfunction in stress and mood disorders. Eur J Neurosci 2021, 55, 2851–2894. [Google Scholar] [CrossRef] [PubMed]
Figure 1.
The experimental procedure for PTSD. EPMT, Elevated Plus Maze Test; OFT, Open Field Test.
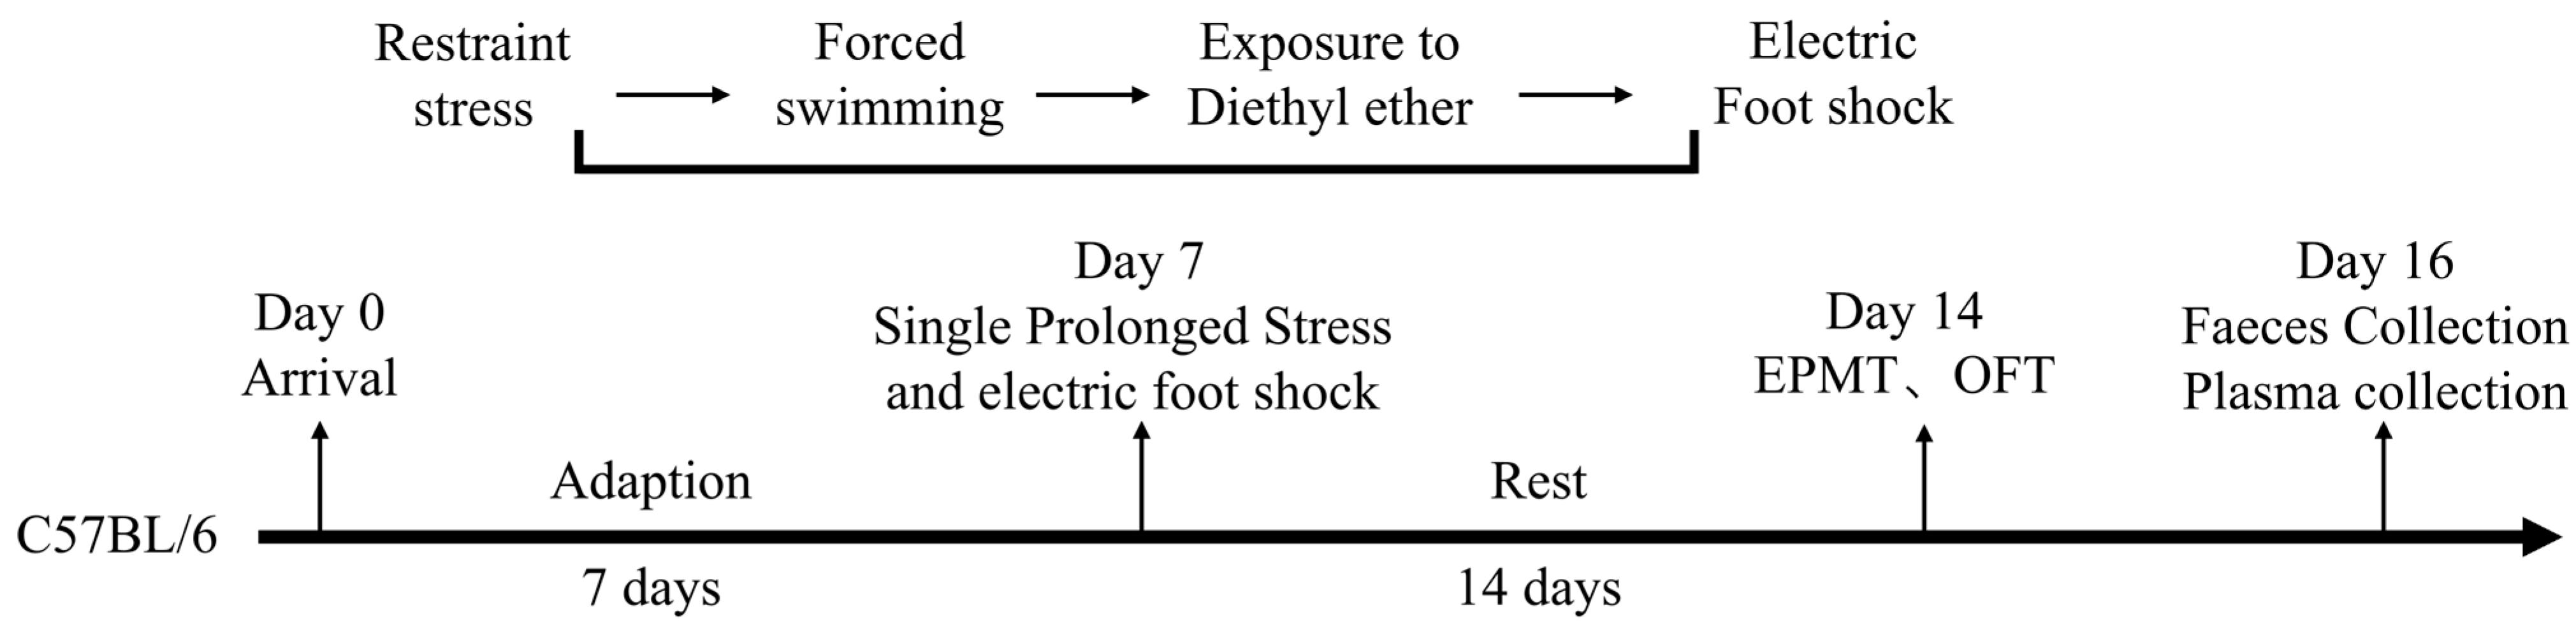
Figure 2.
Evaluation of anxiety levels in mice induced by SPS&S using elevated plus maze test (n=5). (A) Total arm entries; (B) Total arm dwell time; (C) Percentage of open arm entries; (D) Percentage of open arm entry time; (E) Open arm dwell time; (F) Open arm average entries. Data presented as mean ± standard deviation (mean ± SD). *p<0.05, **p<0.01.
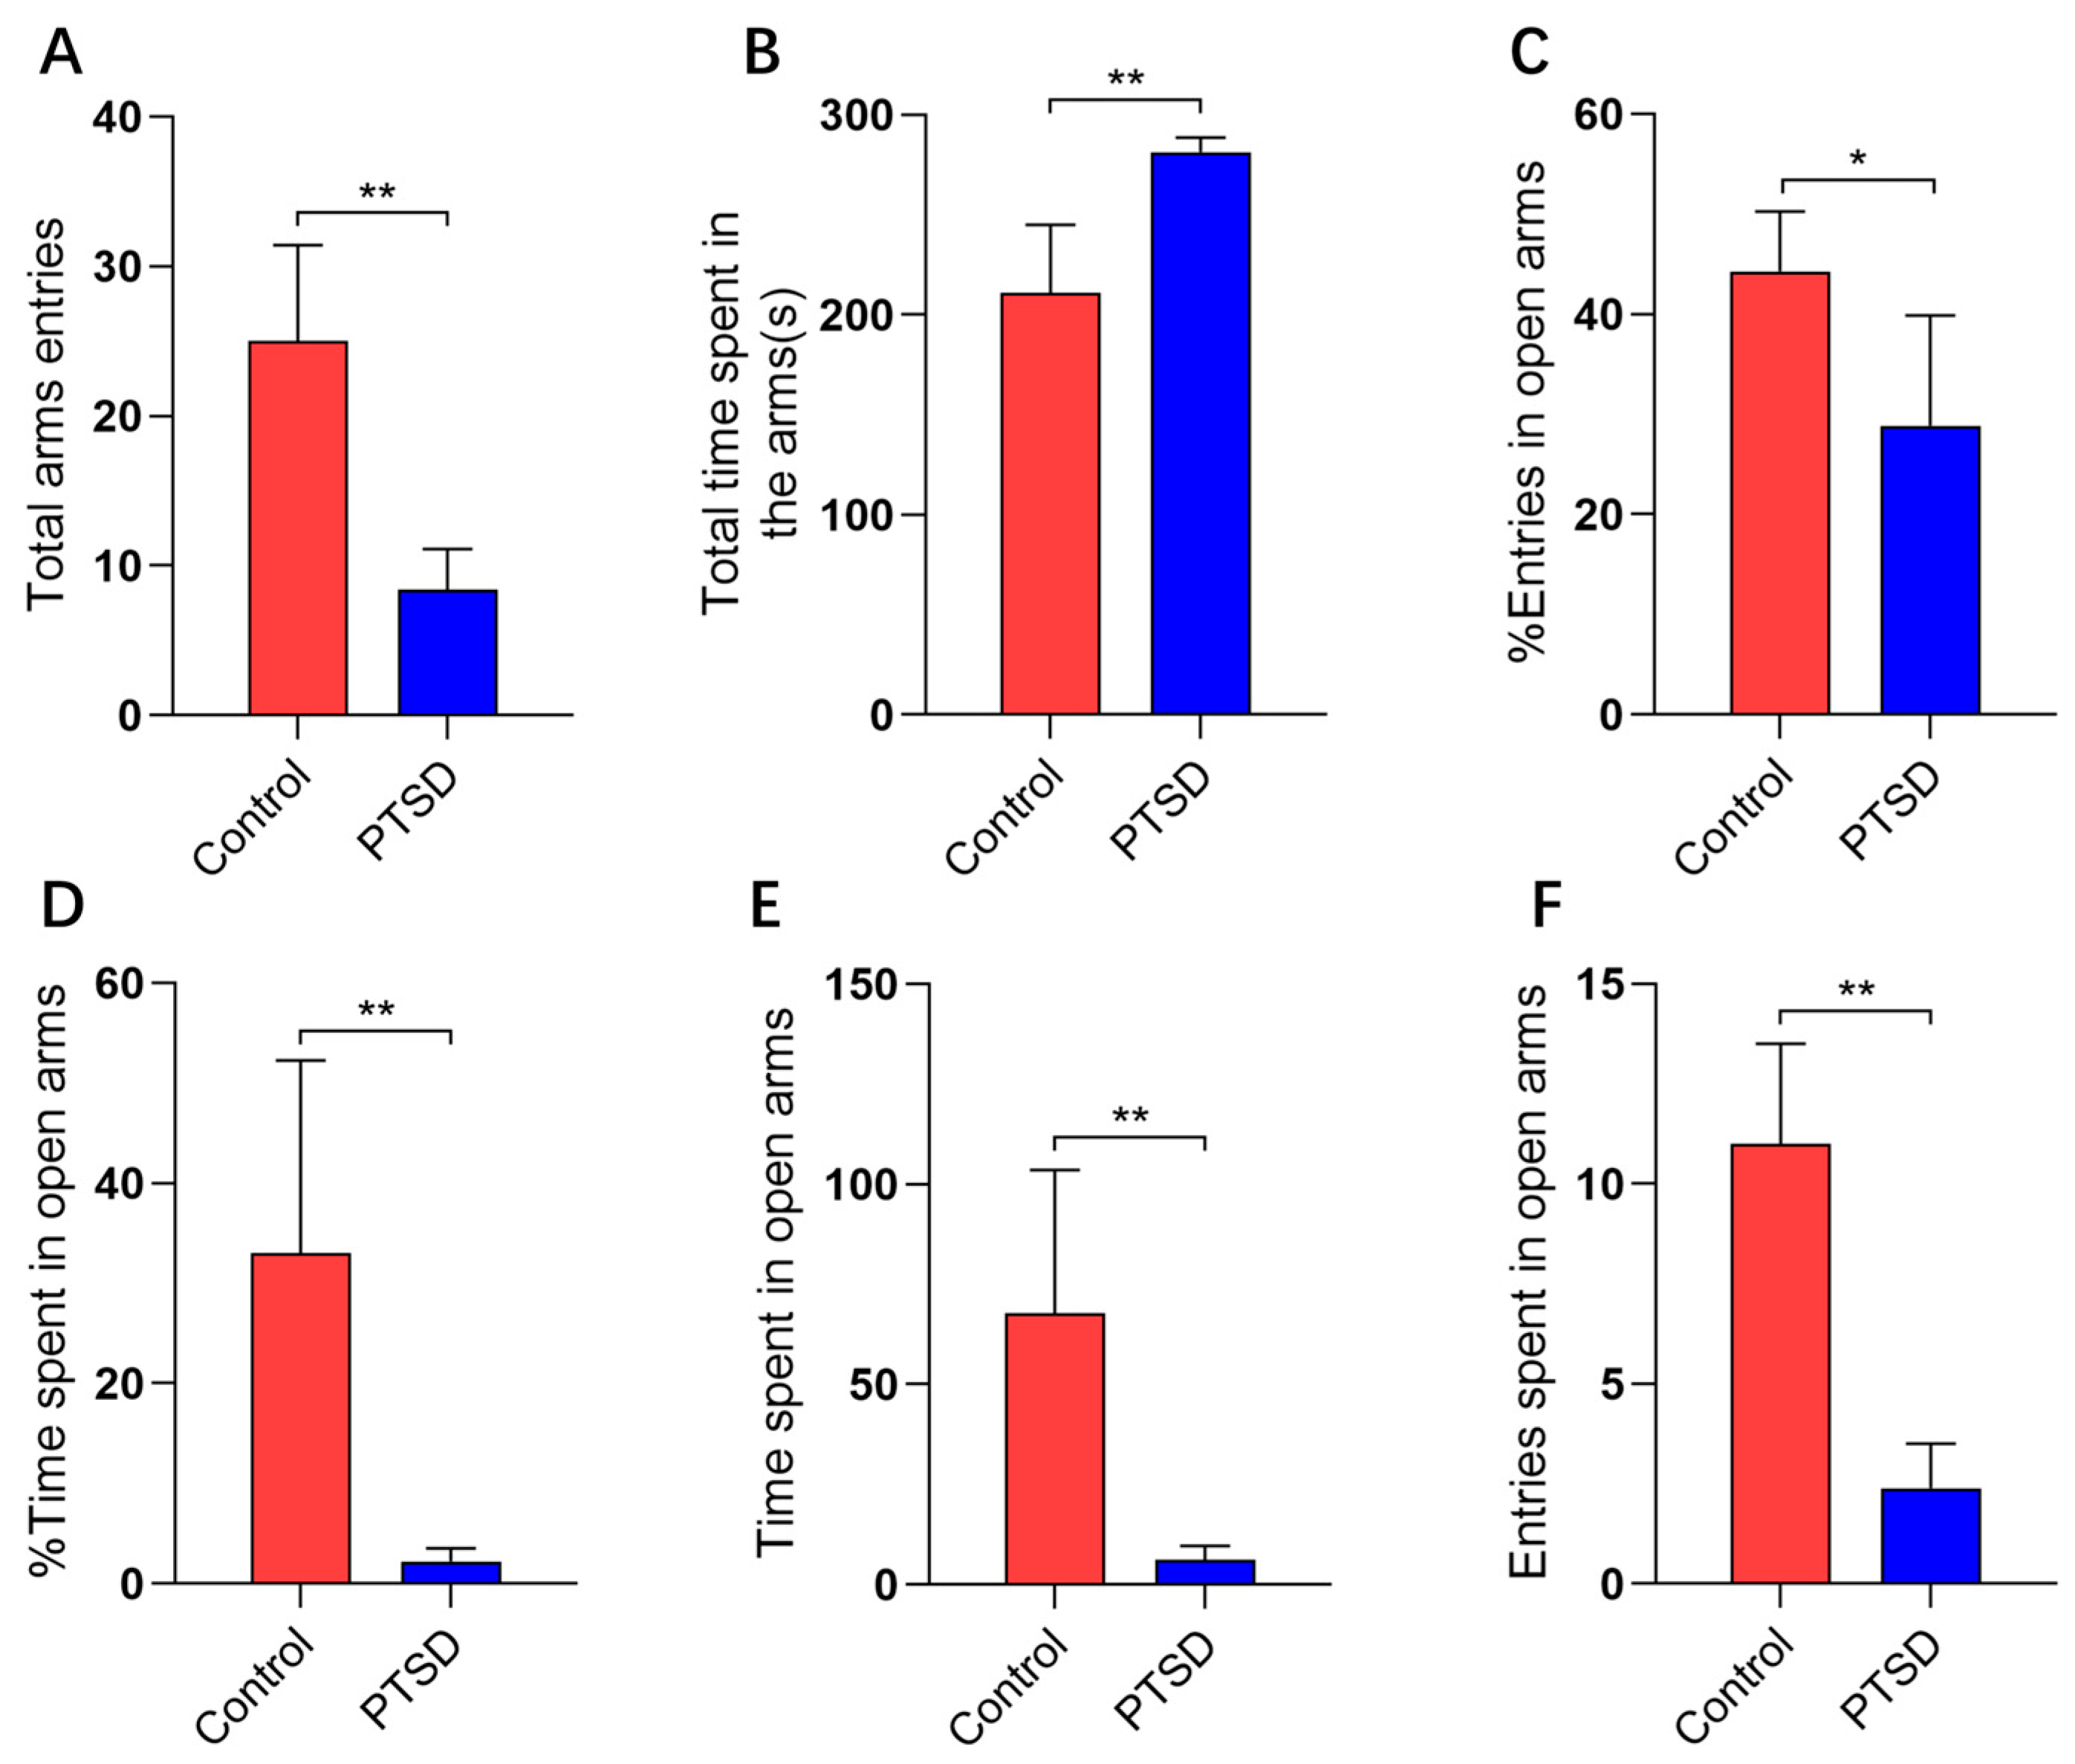
Figure 3.
The open field test assessed anxiety levels in mice subjected to SPS&S (n=5). (A) Total distance traveled; (B) Central area time; (C) Standing frequency. Data presented as mean ± standard deviation (mean ± SD). *p<0.05, **p<0.01.
Figure 3.
The open field test assessed anxiety levels in mice subjected to SPS&S (n=5). (A) Total distance traveled; (B) Central area time; (C) Standing frequency. Data presented as mean ± standard deviation (mean ± SD). *p<0.05, **p<0.01.
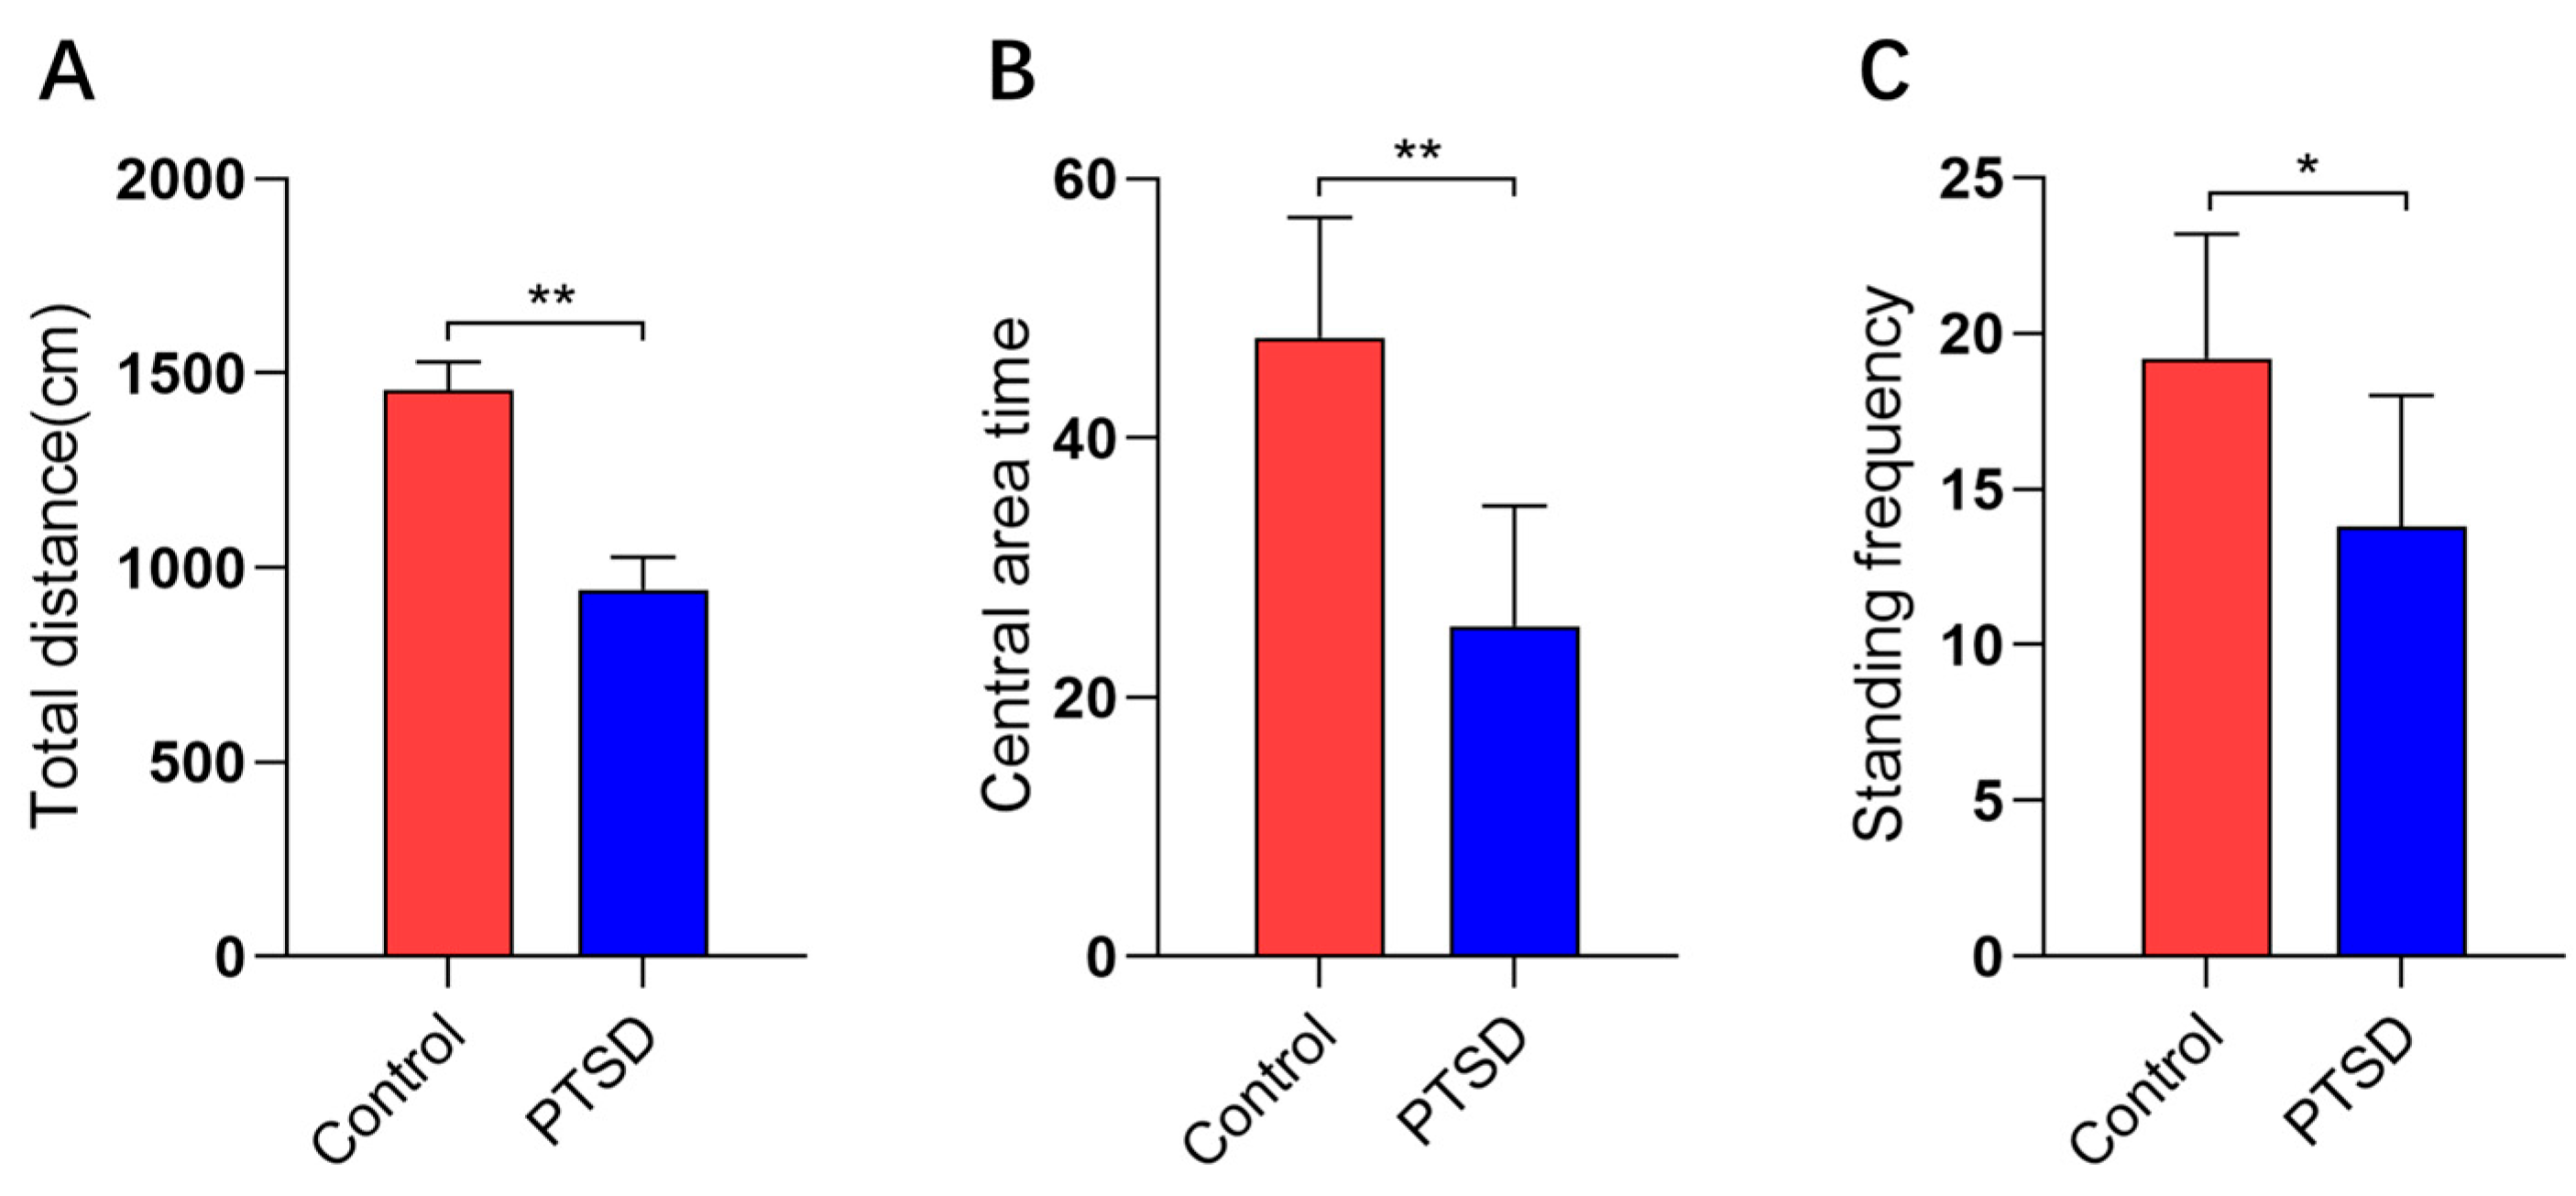
Figure 4.
Plasma cytokine concentrations in control and PTSD mice (n=5). (A) ELISA was used to quantify IL-1β; (B) ELISA was used to quantify TNF-α. Data presented as mean ± standard deviation (mean ± SD). **p<0.01.
Figure 4.
Plasma cytokine concentrations in control and PTSD mice (n=5). (A) ELISA was used to quantify IL-1β; (B) ELISA was used to quantify TNF-α. Data presented as mean ± standard deviation (mean ± SD). **p<0.01.
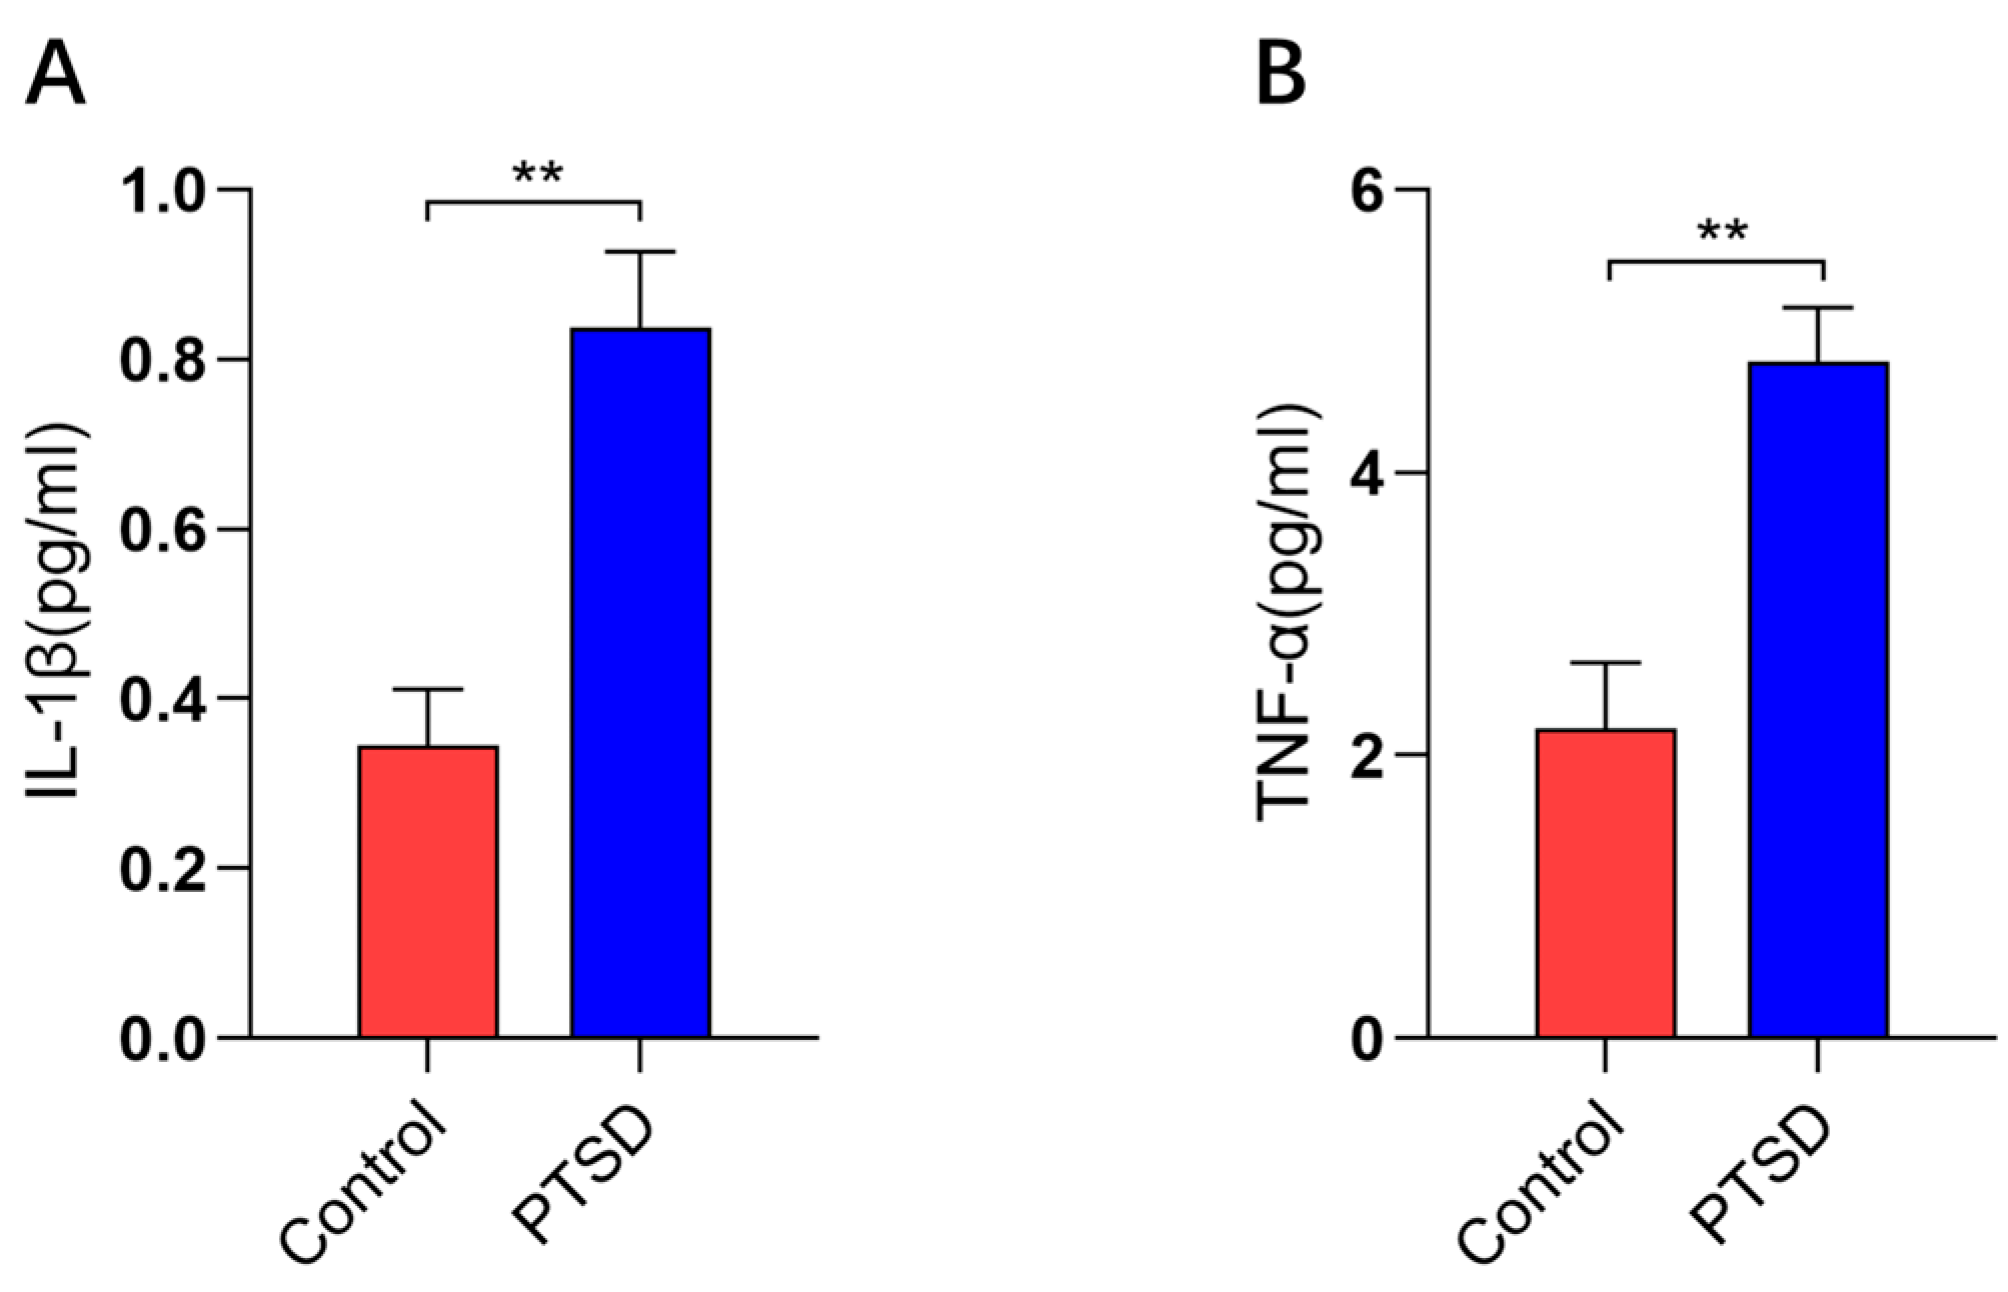
Figure 5.
OPLS-DA score plots and OPLS-DA quality control chart of mouse plasma samples. (A) OPLS-DA score plot for positive ion mode; (B) Negative ion mode OPLS-DA score plot; (C) Positive ion mode OPLS-DA replacement test; (D) Negative ion mode OPLS-DA replacement test; Intercept: R2 and Q2 denote the y-axis intercepts of the regression lines for R2 and Q2.
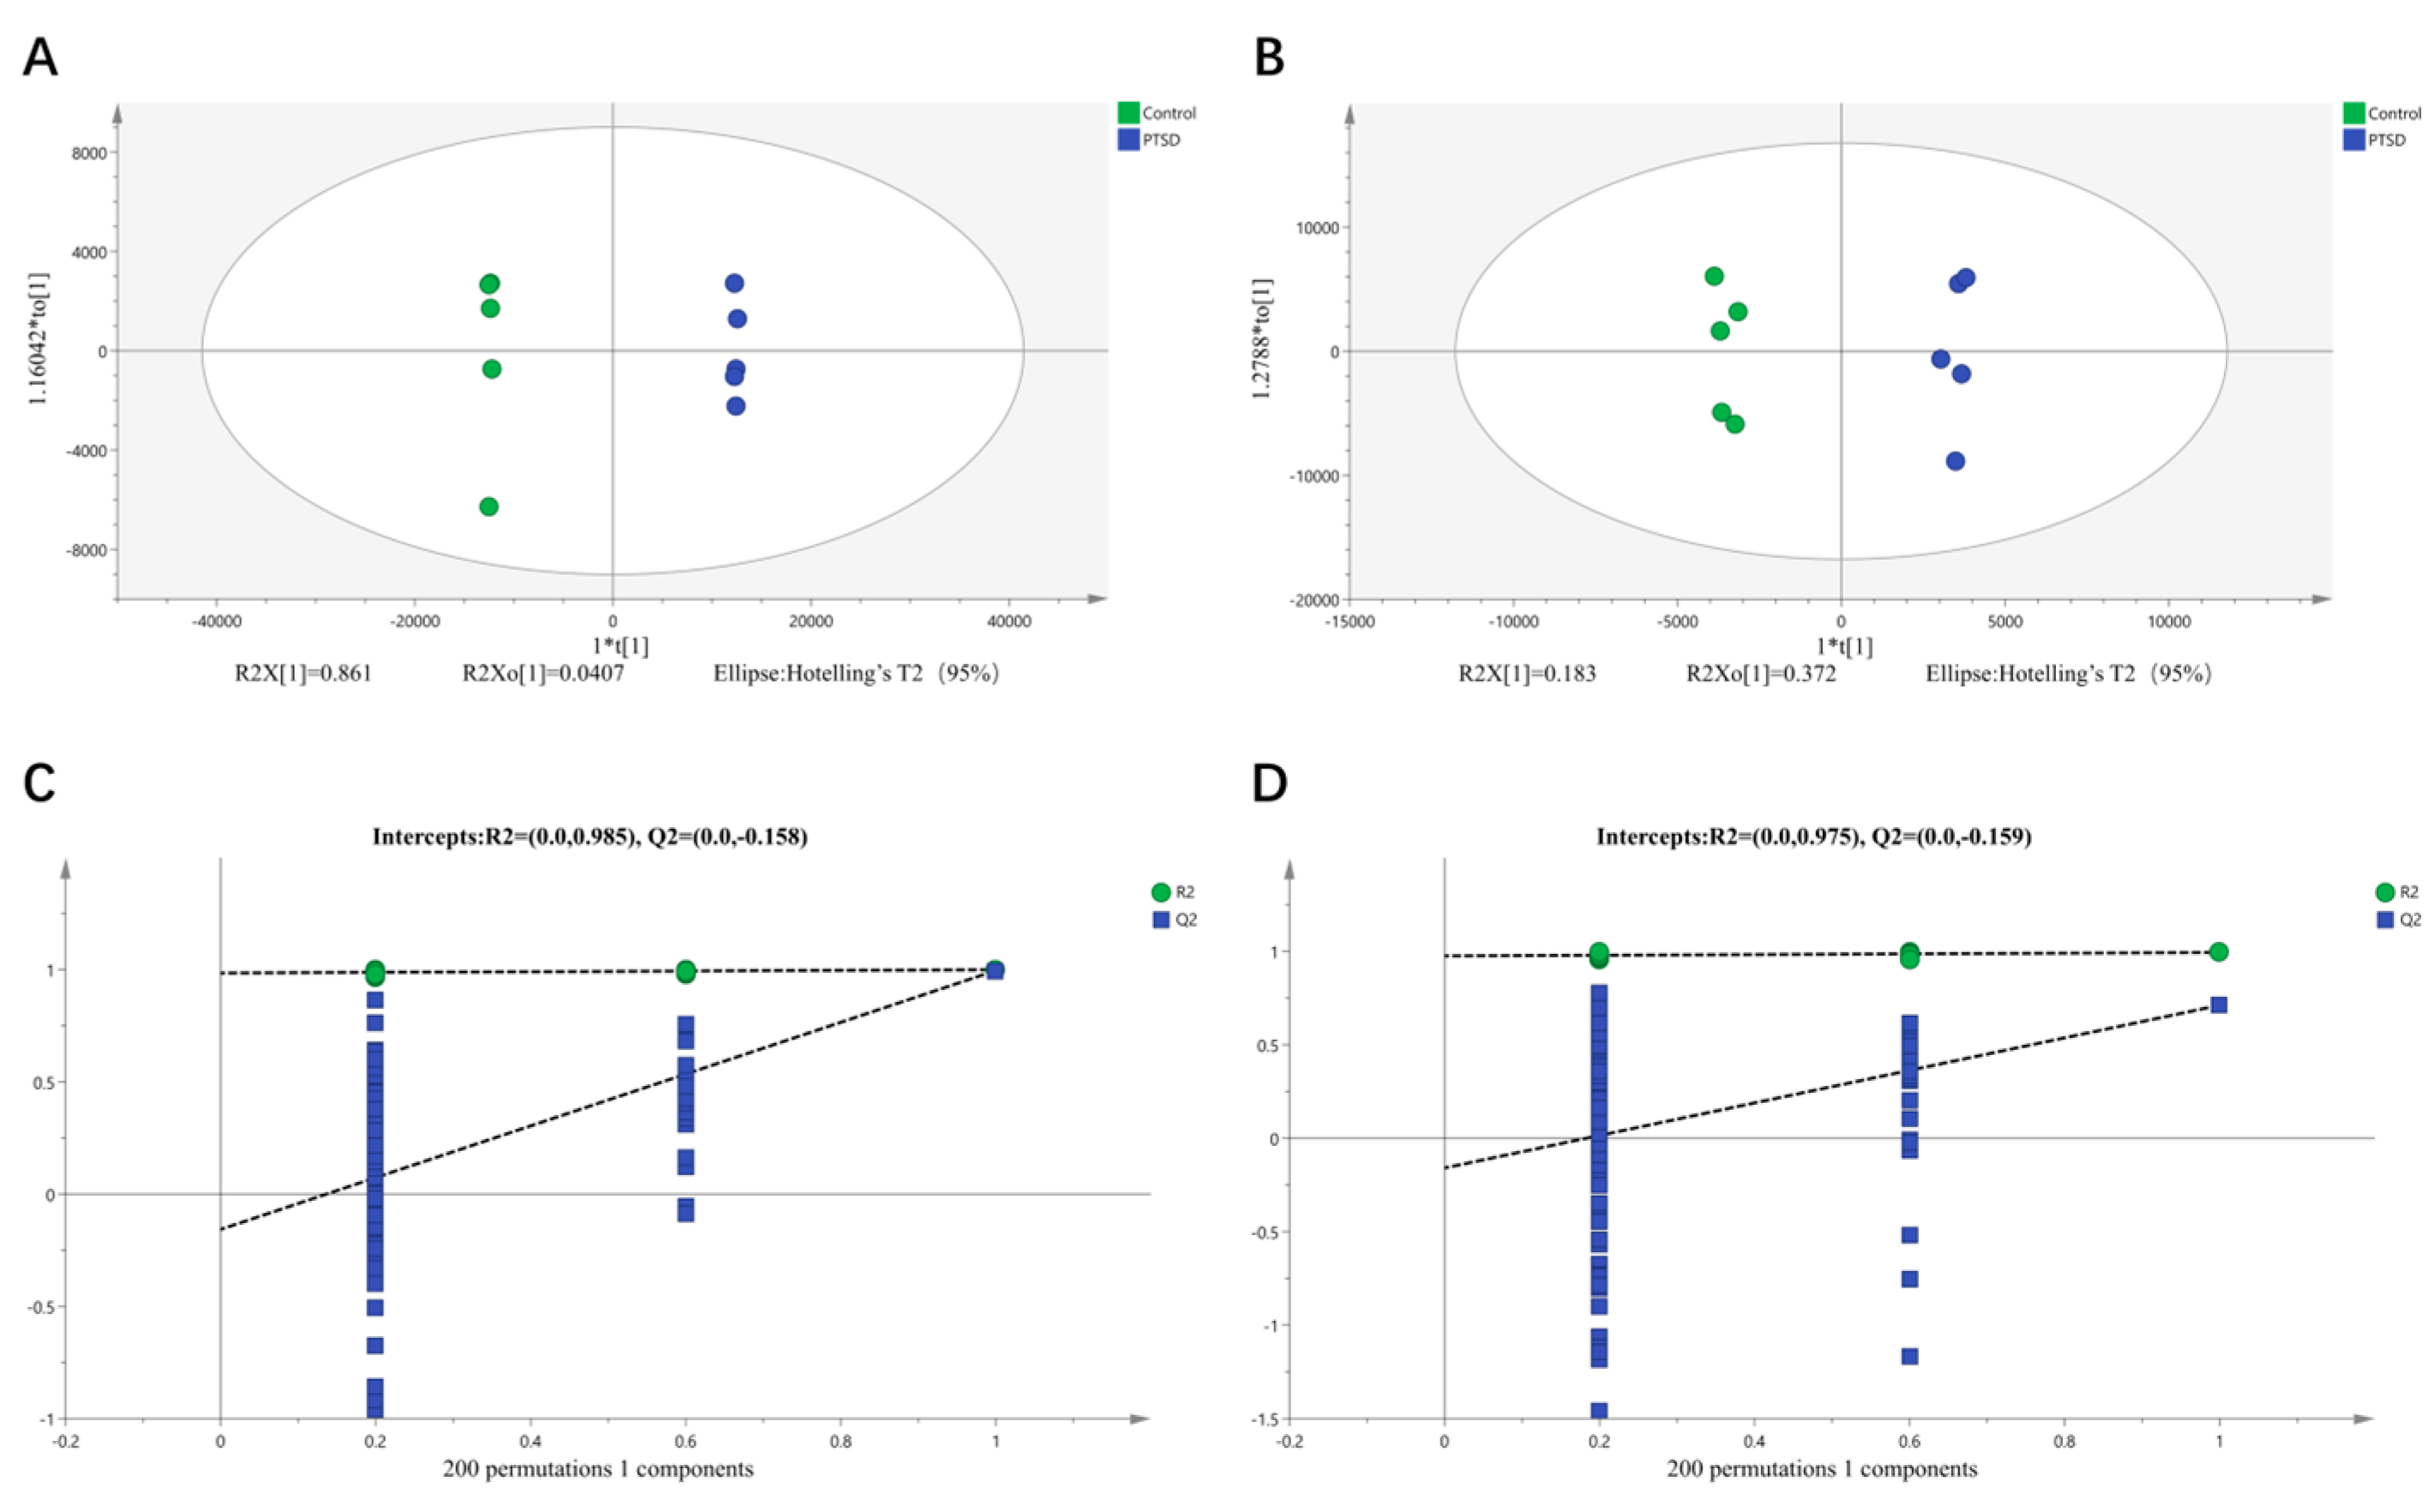
Figure 6.
Plasma metabolite profile alterations in control and PTSD model mice. (A) Volcano plot depicting differential metabolites in positive ion mode; (B) Volcano plot depicting differential metabolites in negative ion mode; (C) KEGG pathway enrichment analysis of differentially expressed metabolites; (D) Heatmap of differentially expressed metabolites.
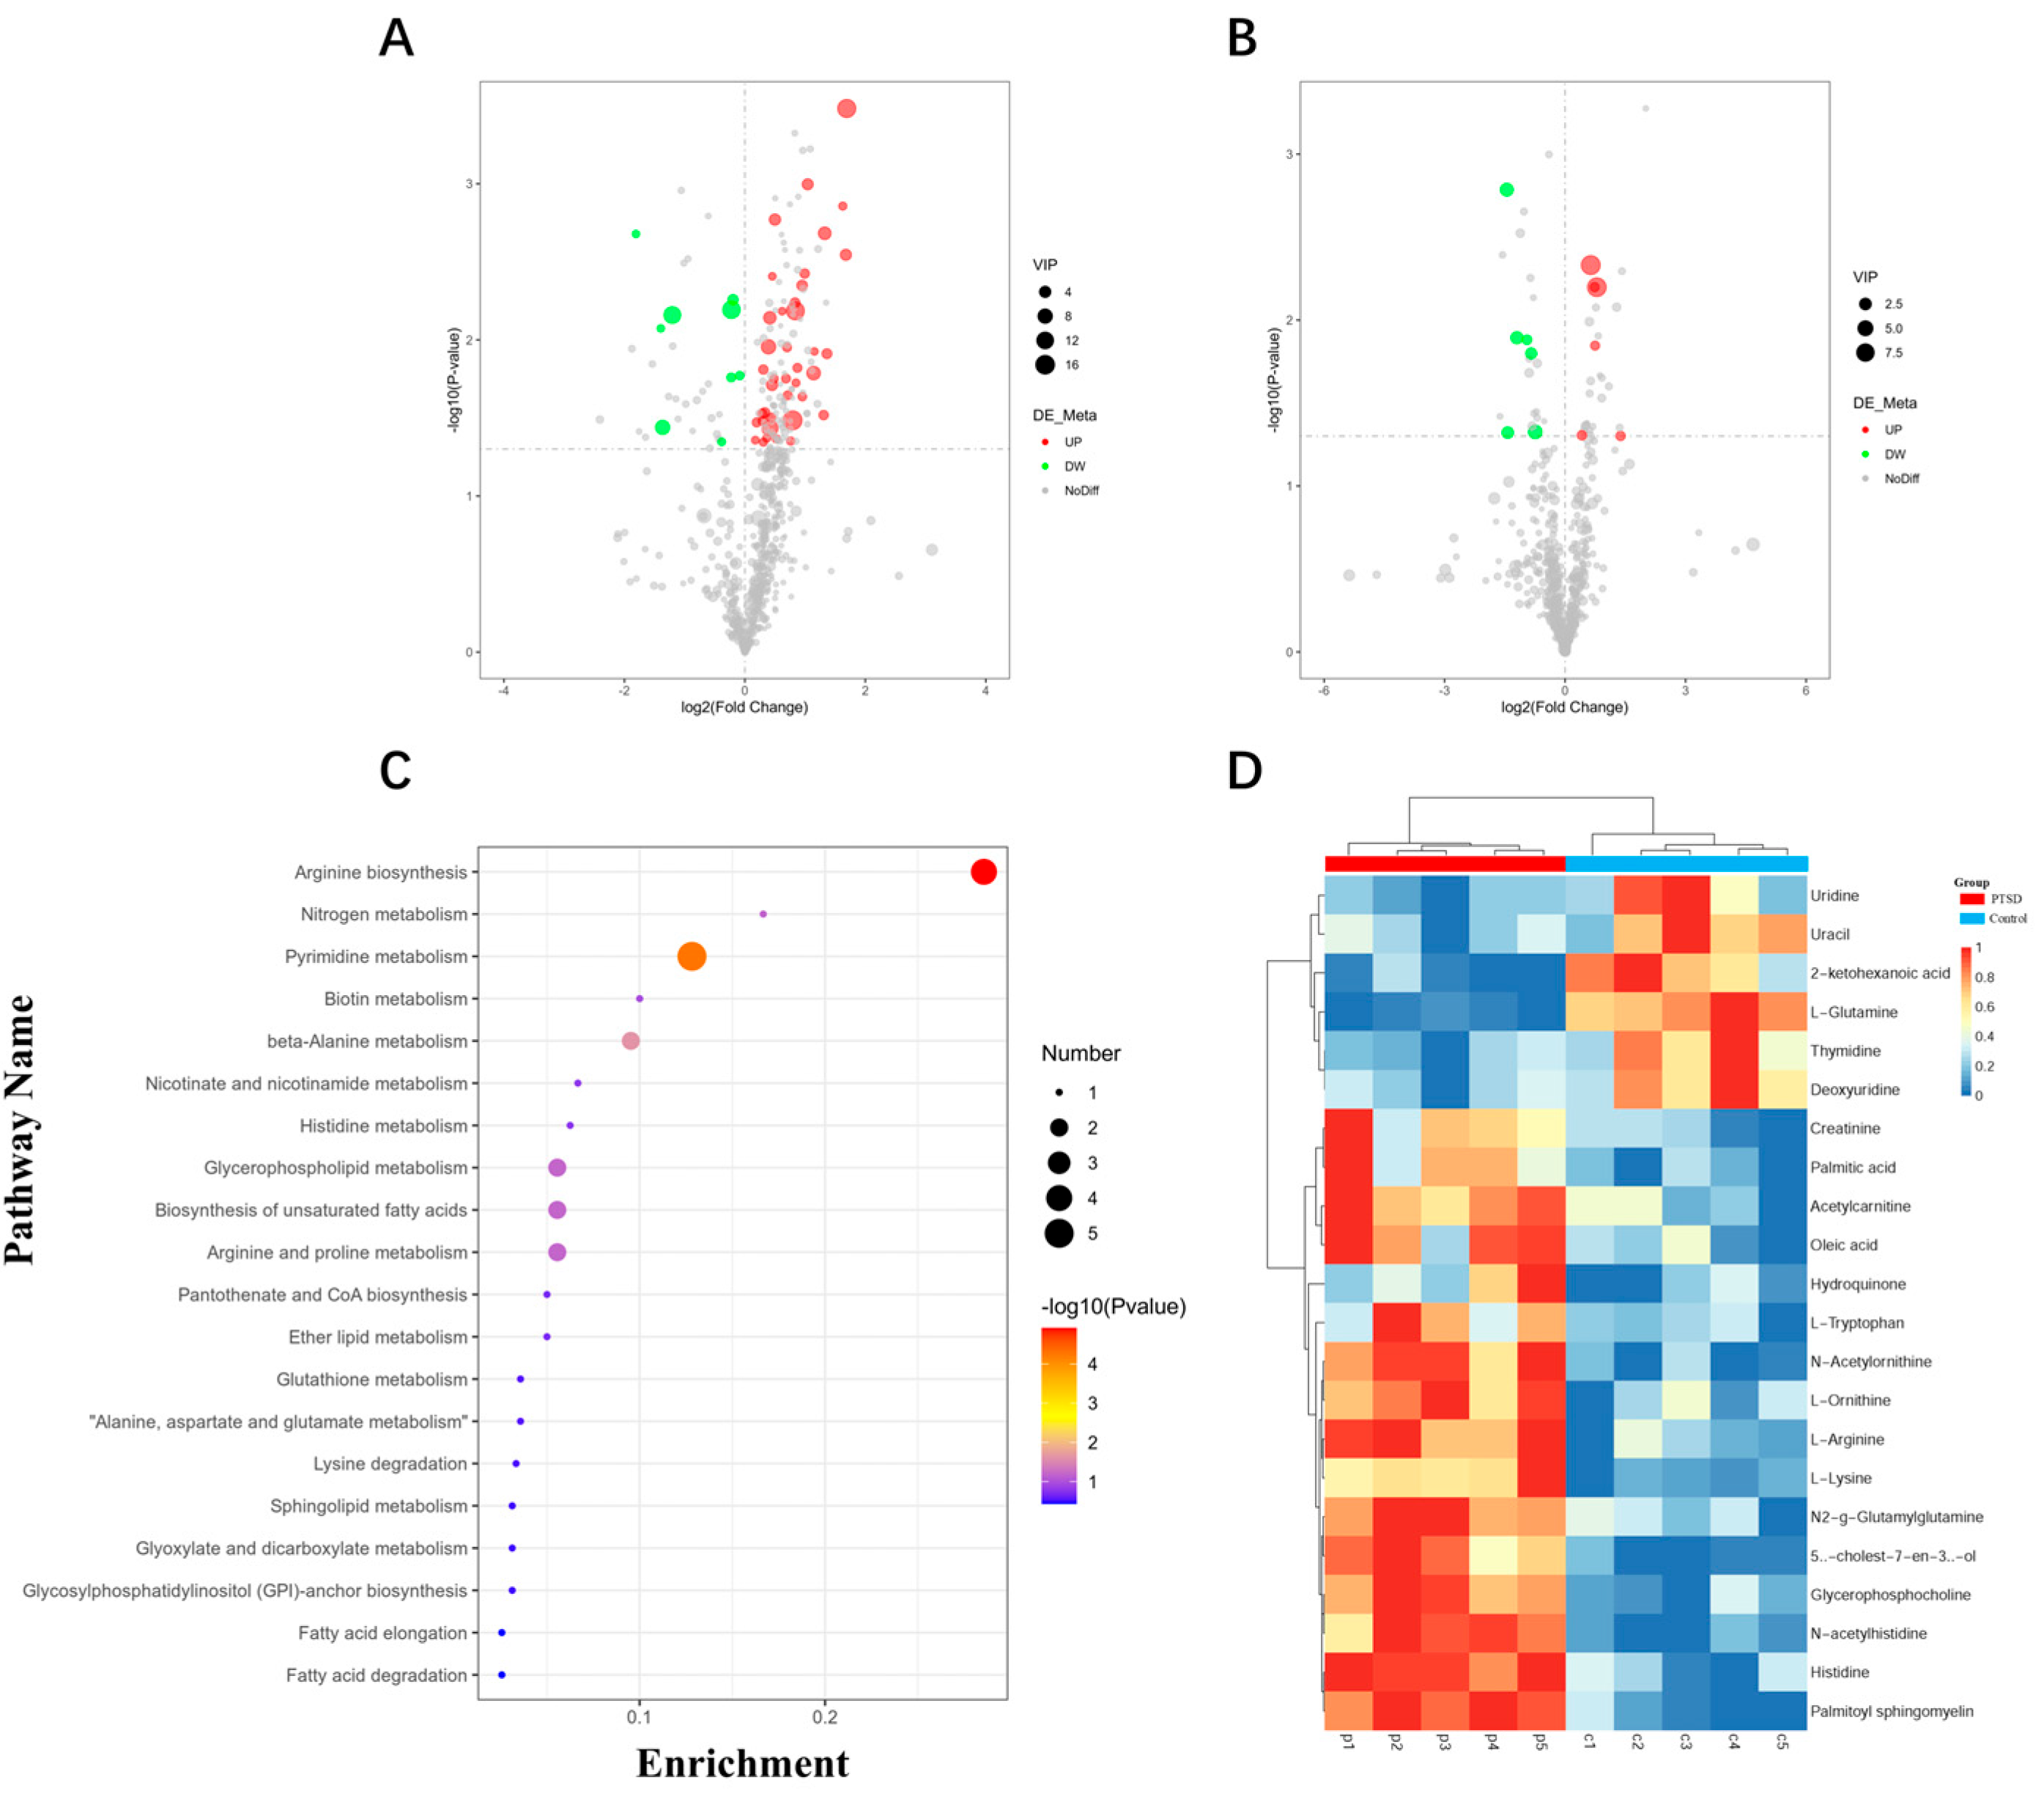
Figure 7.
Gut microbiota characteristics of the control group and the PTSD group. (A) Venn diagram of OTU distribution between control and PTSD group samples; (B) At the OTU level, PCoA demonstrated a significant difference (n=5) in gut microbiota composition between the control group and the PTSD group; (C) Chao1, Shannon, and Simpson diversity indices of gut microbiota in the control group and PTSD group.
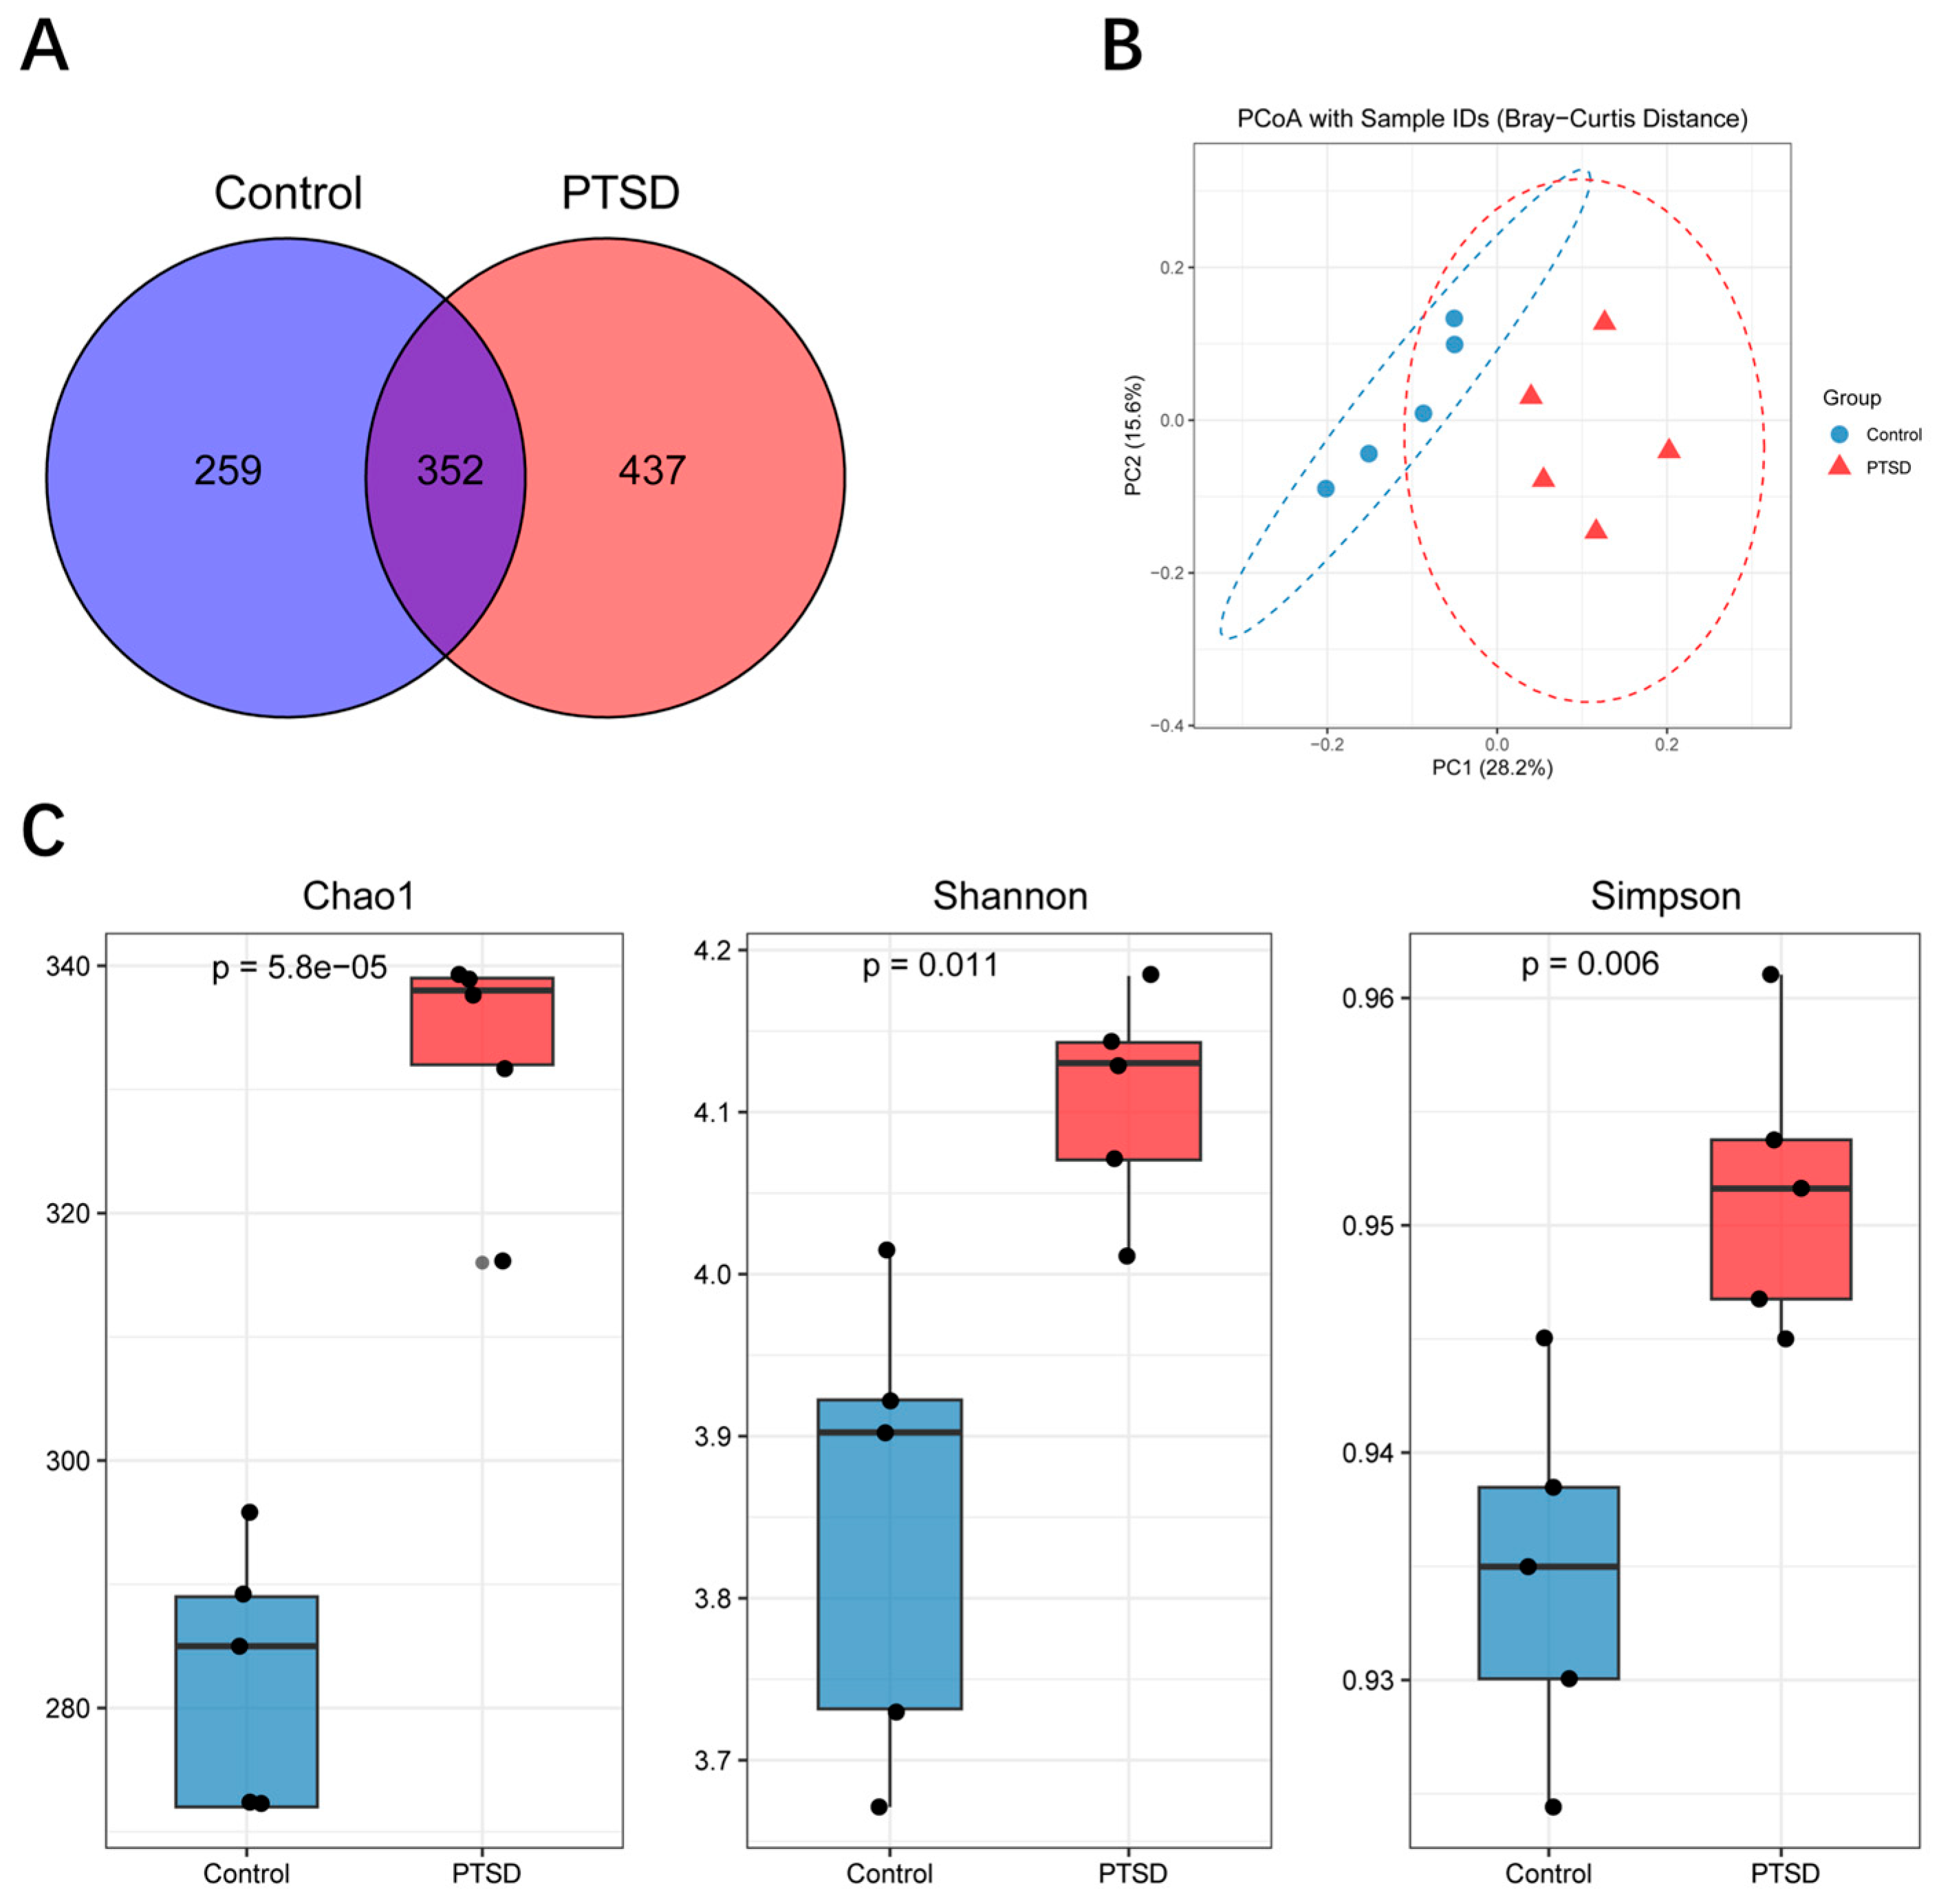
Figure 8.
The abundance of gut microbiota at the phylum to genus level in the control group and PTSD group. (A) The abundance of gut microbiota at the phylum level; (B) The abundance of gut microbiota at the class level; (C) The abundance of gut microbiota at the order level; (D) The abundance of gut microbiota at the family level; (E) The abundance of gut microbiota at the genus level.
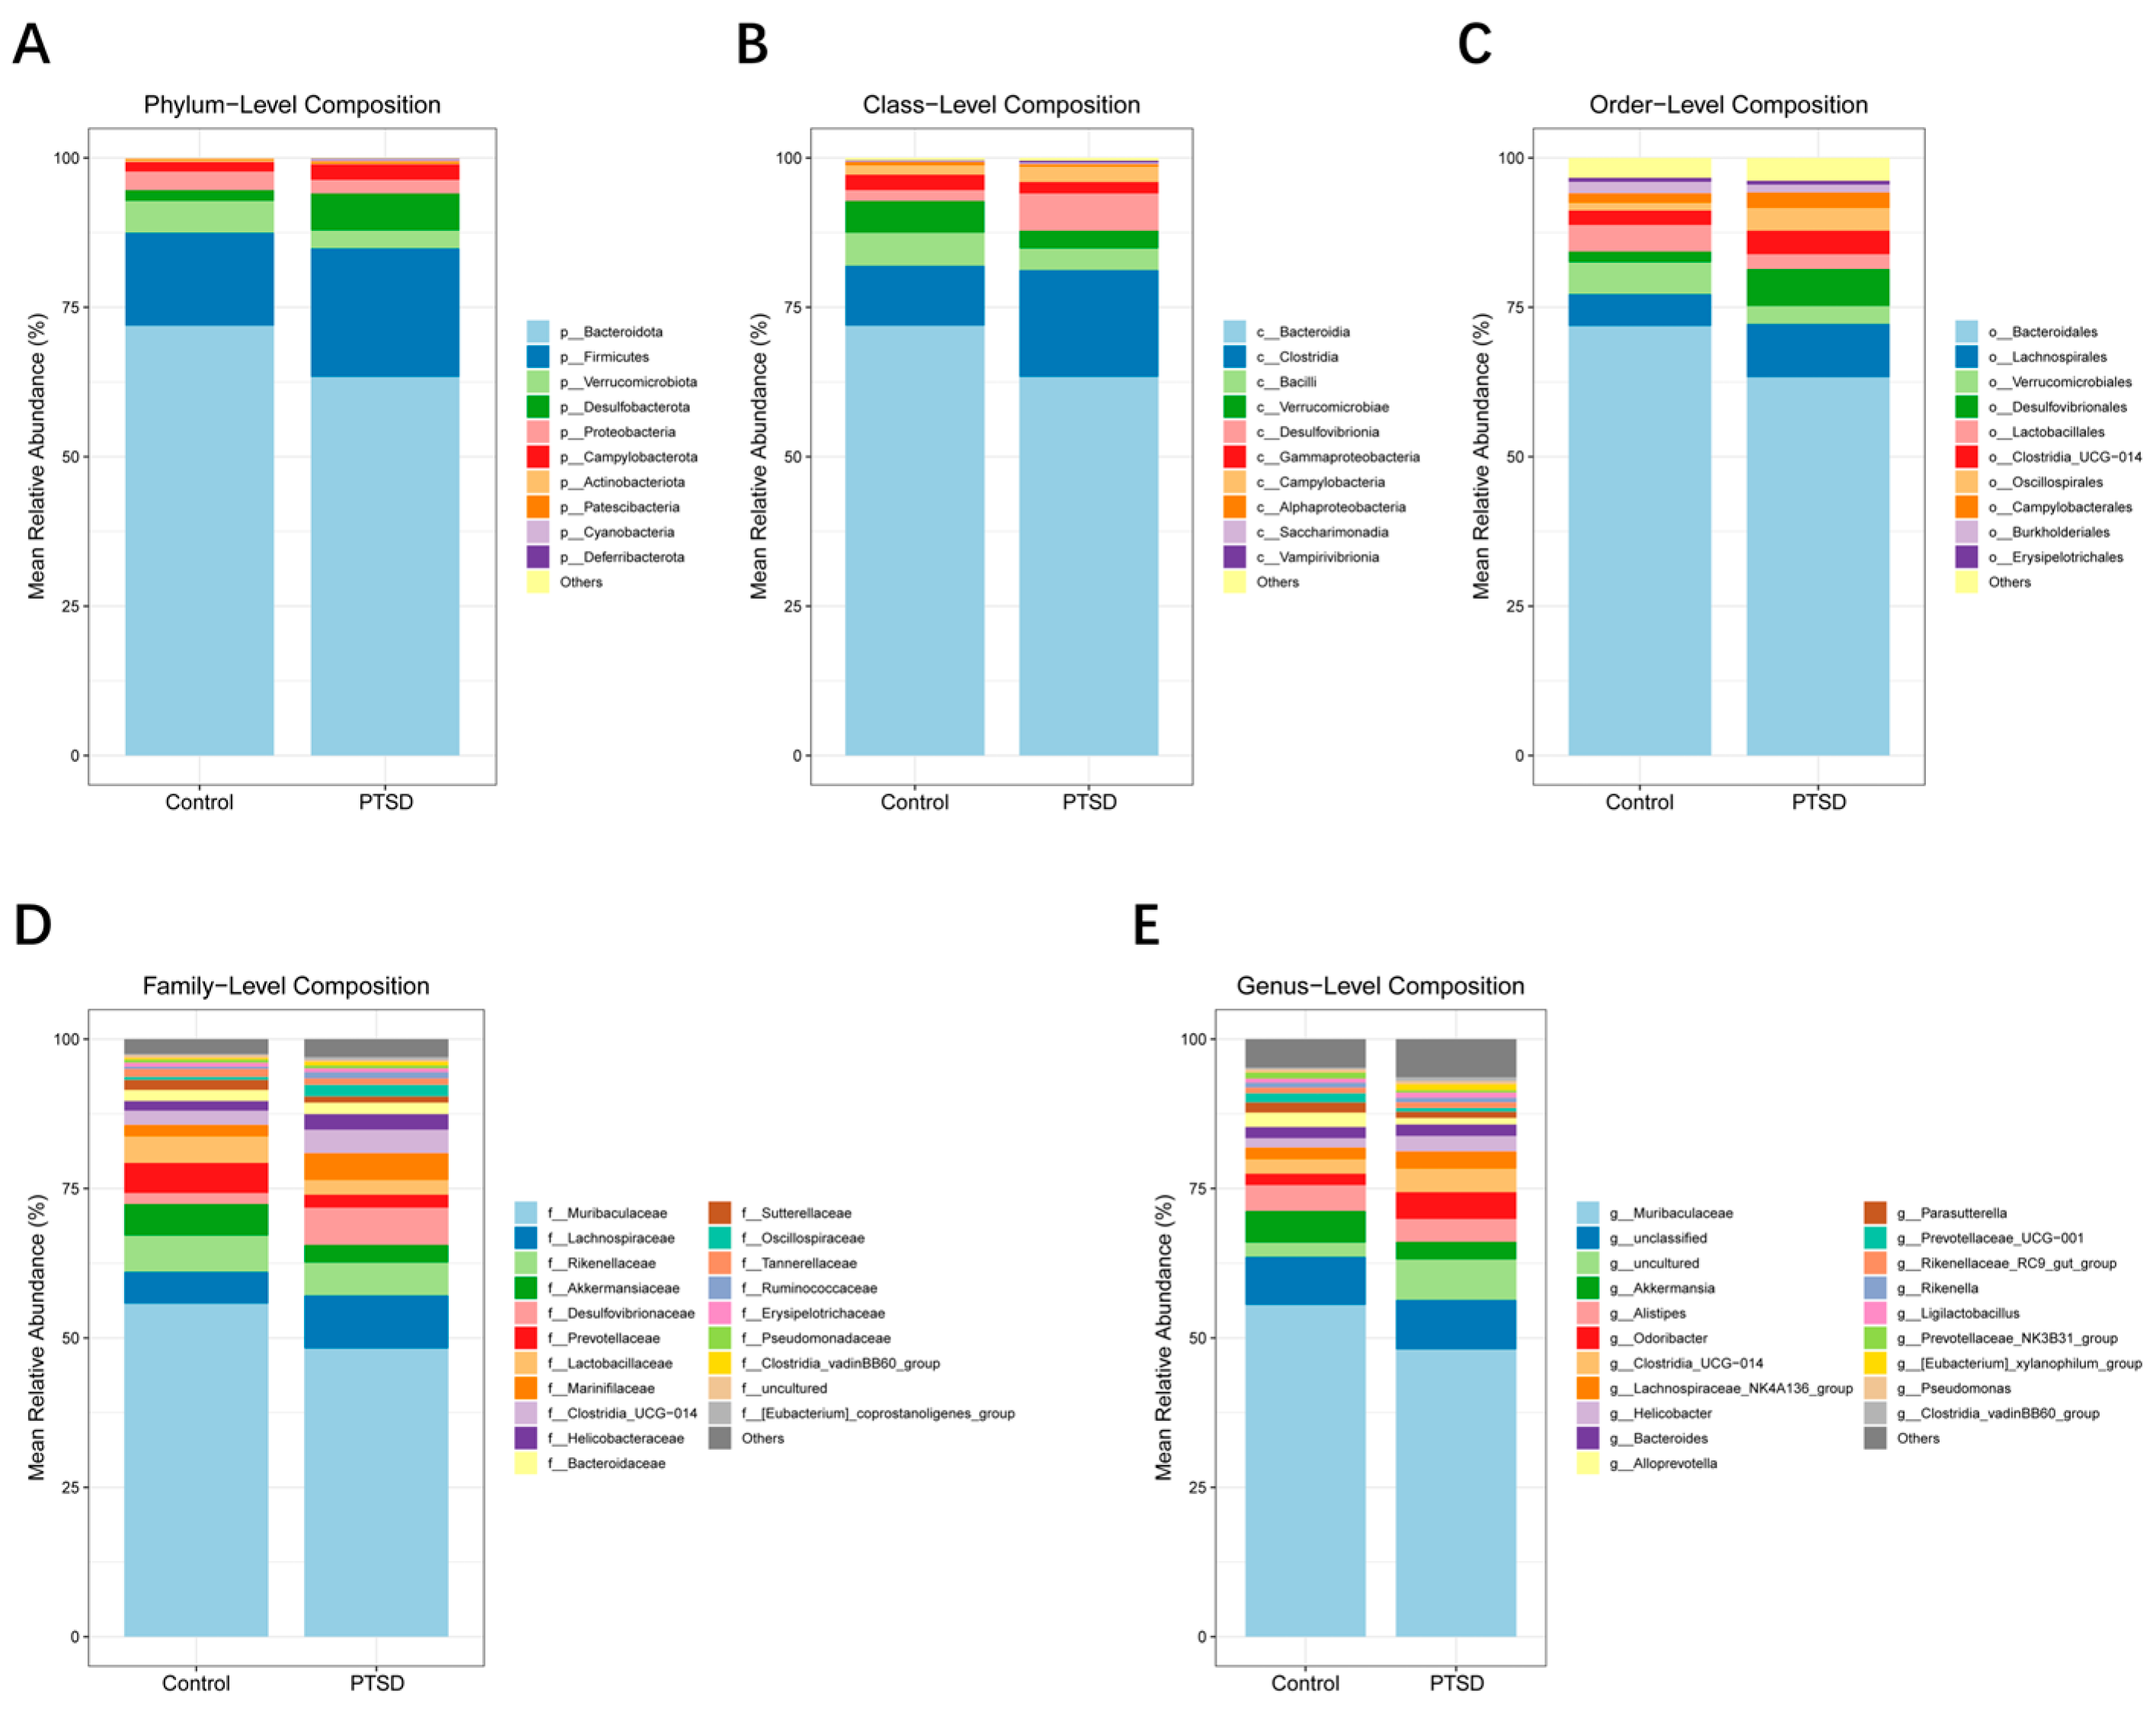
Figure 9.
Relative abundance of gut microorganisms in the control group and the PTSD group. (A) A cladogram of differential abundance bacteria of the two groups. (B) A histogram of LDA score for differential abundance of bacteria between the two groups. (LDA score > 2.0, P < 0.05).
Figure 9.
Relative abundance of gut microorganisms in the control group and the PTSD group. (A) A cladogram of differential abundance bacteria of the two groups. (B) A histogram of LDA score for differential abundance of bacteria between the two groups. (LDA score > 2.0, P < 0.05).
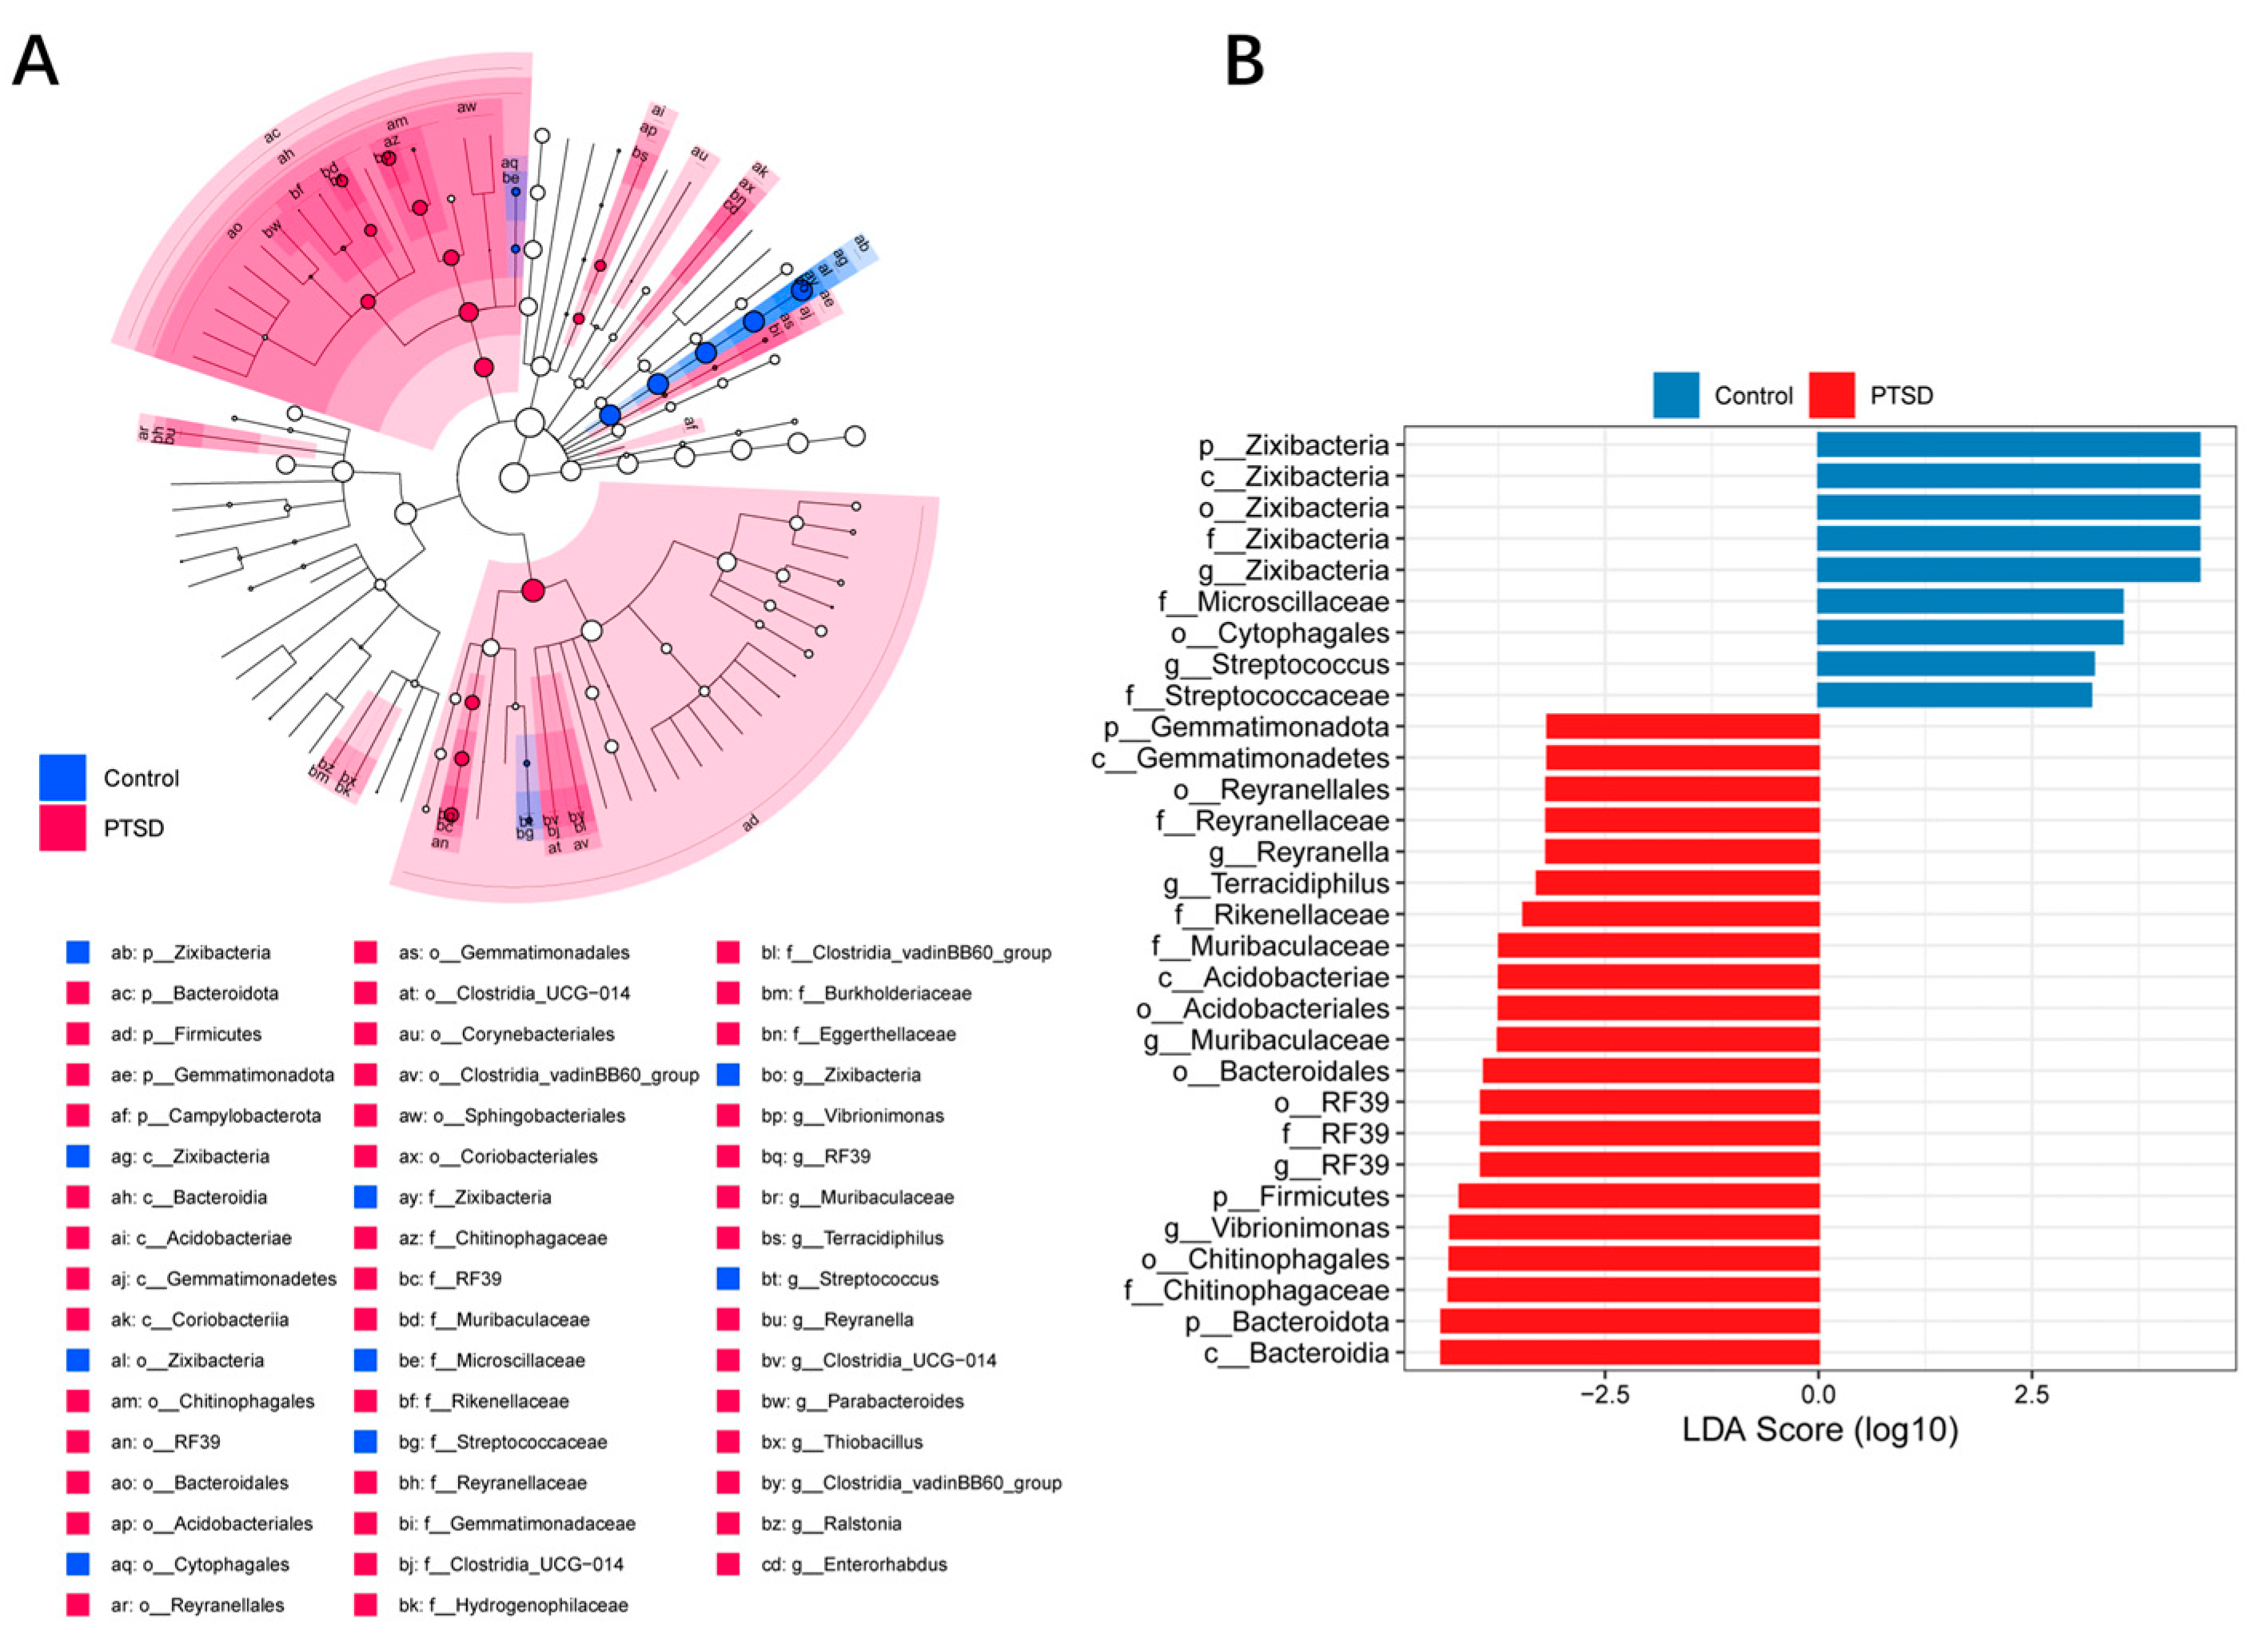
Figure 10.
Pearson correlation heatmap of metabolites and gut microbiota at the genus level. *p<0.05, **p<0.01, ***p<0.001.
Figure 10.
Pearson correlation heatmap of metabolites and gut microbiota at the genus level. *p<0.05, **p<0.01, ***p<0.001.
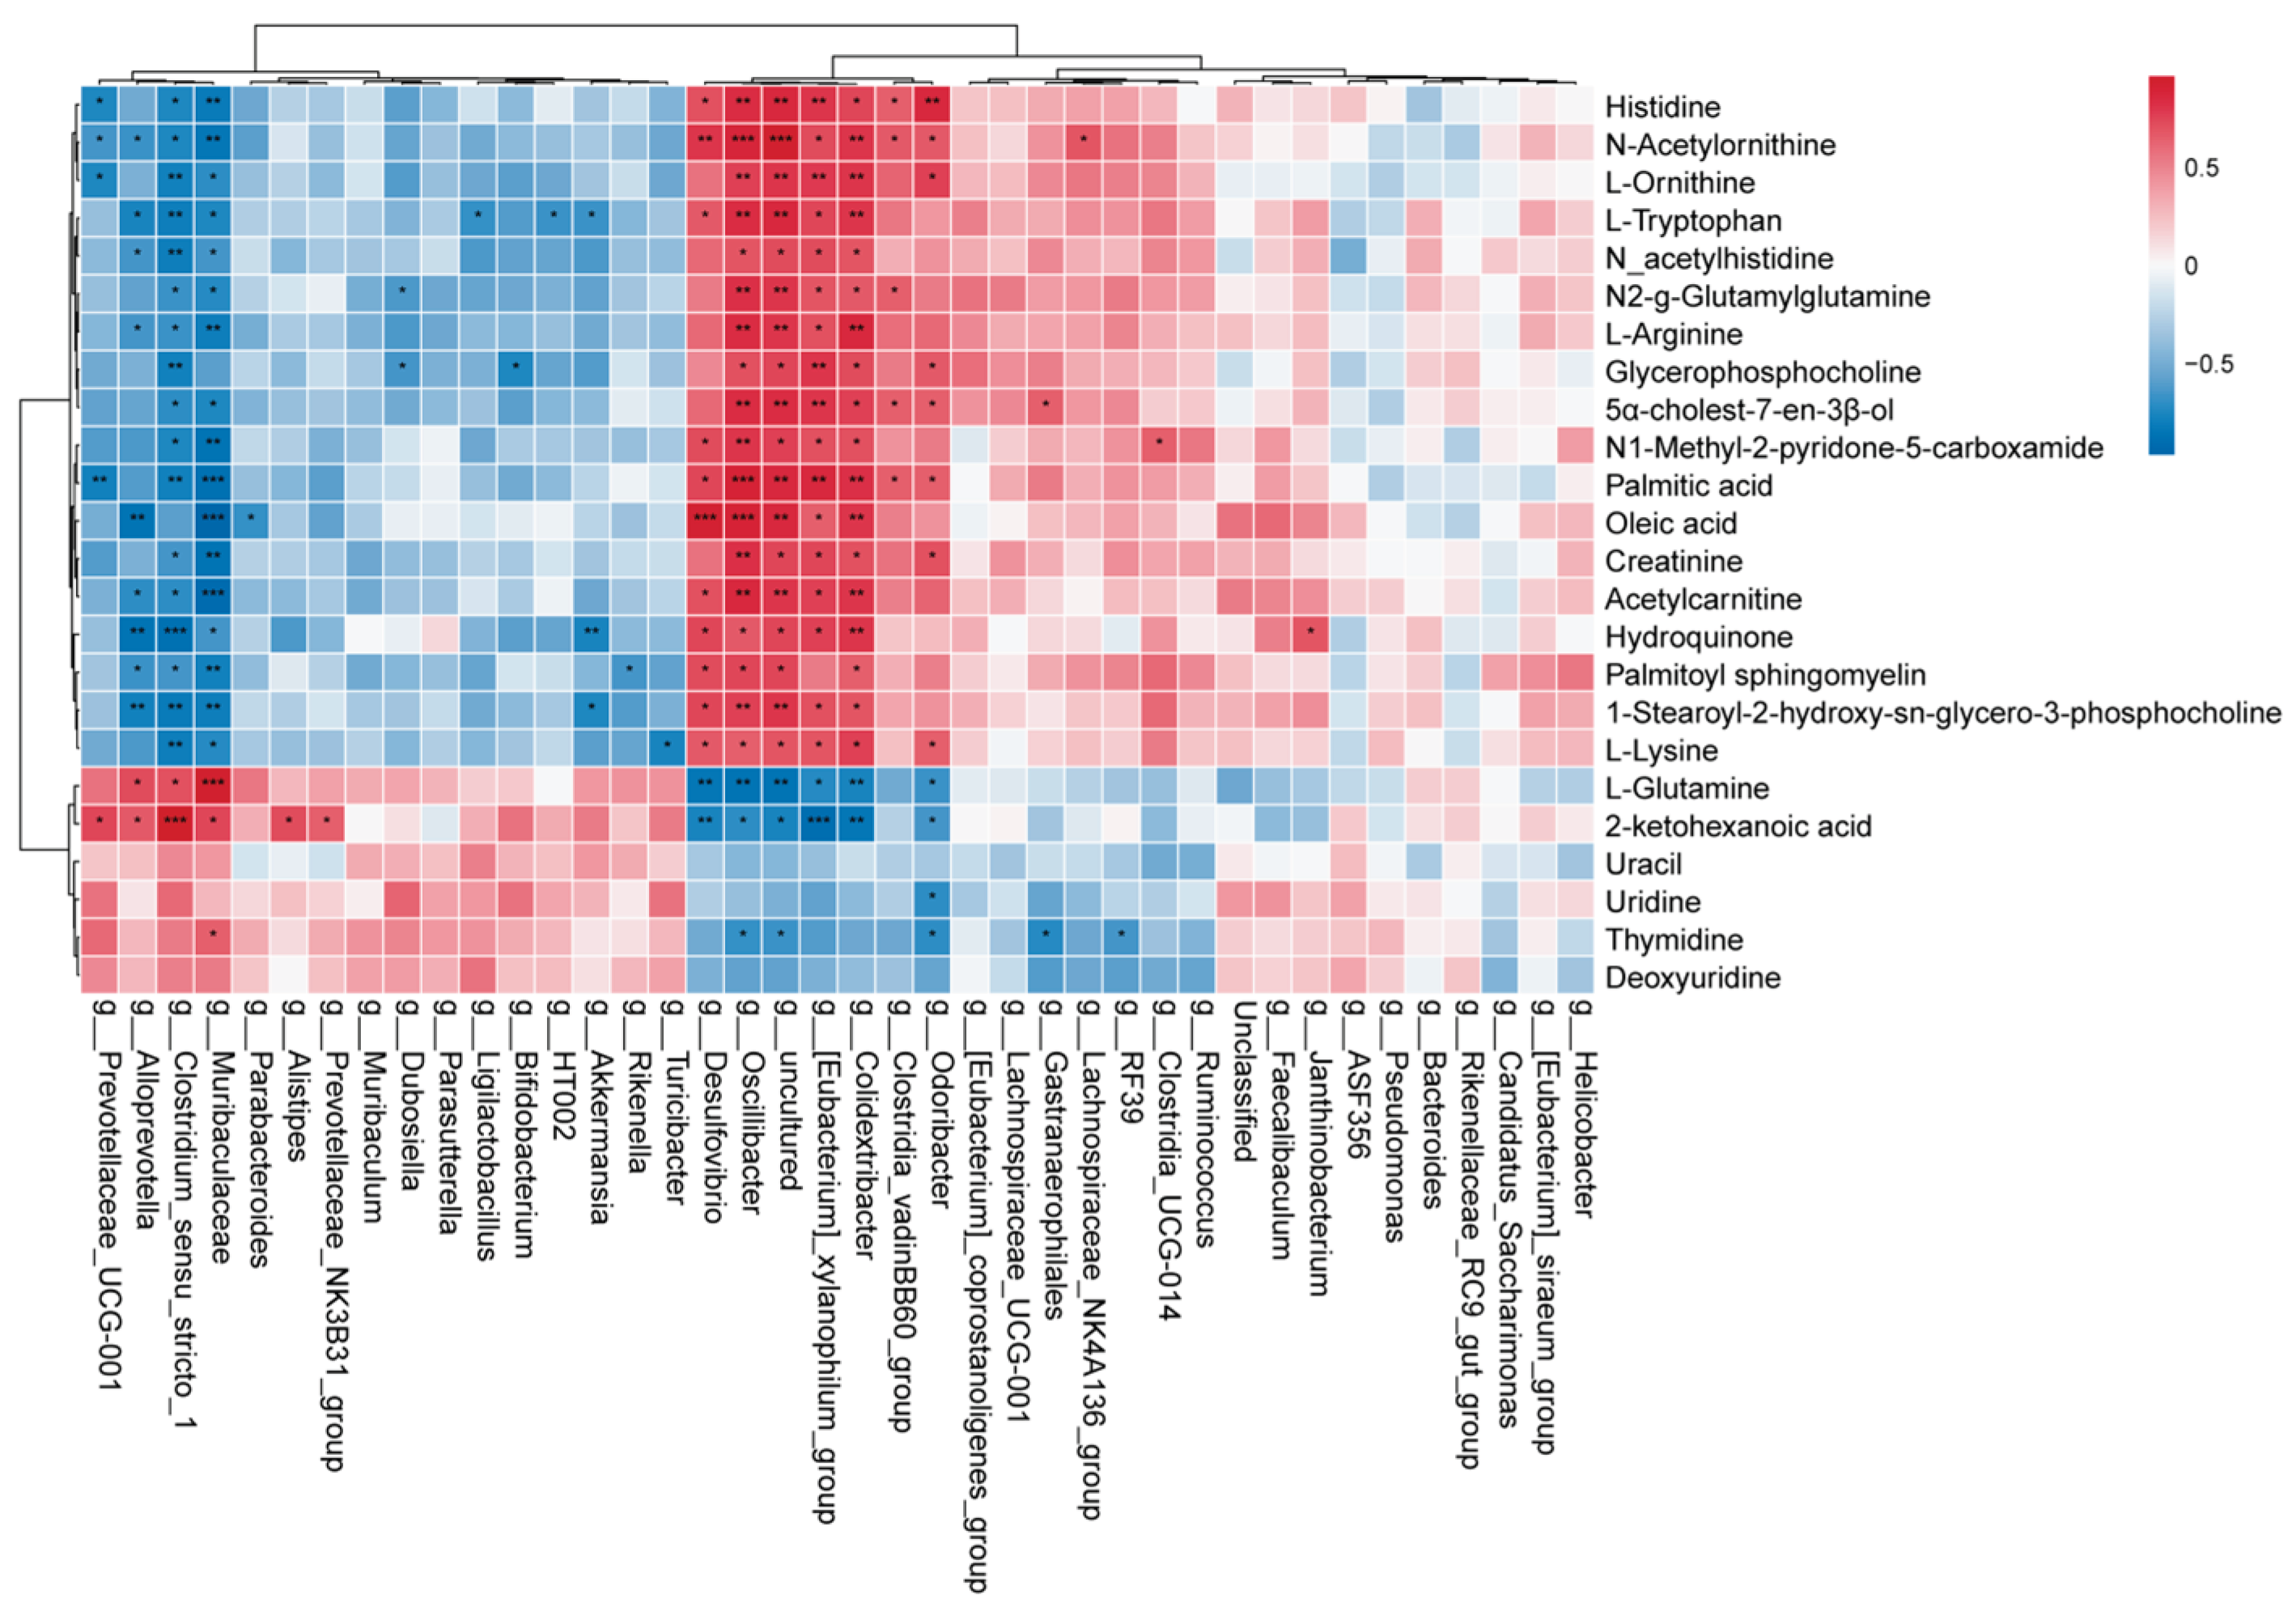

Table 1.
The significantly differentiated metabolites in Control group and PTSD group.
| No | Metabolites | FC | P-value | VIP | Trend |
|---|---|---|---|---|---|
| 1 | 1-Stearoyl-2-hydroxy-sn-glycero-3-phosphocholine | 5.18128 | 1.31926E-08 | 7.04406 | ↑ |
| 2 | L-Glutamine | 0.14185 | 6.57121E-07 | 2.32125 | ↓ |
| 3 | Palmitoyl sphingomyelin | 1.86521 | 1.88291E-06 | 5.016 | ↑ |
| 4 | N-acetylhistidine | 2.45764 | 1.29928E-05 | 1.22055 | ↑ |
| 5 | Histidine | 4.01037 | 1.35614E-05 | 2.5638 | ↑ |
| 6 | N-Acetylornithine | 2.49663 | 2.26593E-05 | 1.90844 | ↑ |
| 7 | Glycerophosphocholine | 2.09156 | 2.48749E-05 | 7.36942 | ↑ |
| 8 | 5α-cholest-7-en-3β-ol | 4.03121 | 6.21691E-05 | 1.71005 | ↑ |
| 9 | N2-g-Glutamylglutamine | 3.52854 | 7.68233E-05 | 1.83453 | ↑ |
| 10 | L-Lysine | 2.14282 | 9.18155E-05 | 2.14269 | ↑ |
| 11 | L-Arginine | 1.82076 | 0.00011 | 2.41993 | ↑ |
| 12 | L-Ornithine | 1.93682 | 0.00041 | 1.0943 | ↑ |
| 13 | N1-Methyl-2-pyridone-5-carboxamide | 2.29938 | 0.00053 | 1.45207 | ↑ |
| 14 | Acetylcarnitine | 2.04835 | 0.00078 | 2.17828 | ↑ |
| 15 | 2-ketohexanoic acid | 0.36609 | 0.00164 | 3.56613 | ↓ |
| 16 | Palmitic acid | 1.55761 | 0.00466 | 9.30956 | ↑ |
| 17 | Creatinine | 1.56381 | 0.00618 | 1.09553 | ↑ |
| 18 | Oleic acid | 1.73006 | 0.00634 | 9.0672 | ↑ |
| 19 | Thymidine | 0.43574 | 0.01278 | 2.98816 | ↓ |
| 20 | Deoxyuridine | 0.51843 | 0.01316 | 1.45515 | ↓ |
| 21 | L-Tryptophan | 2.15465 | 0.01503 | 1.18498 | ↑ |
| 22 | Uracil | 0.53818 | 0.02080 | 0.98912 | ↓ |
| 23 | Uridine | 0.37175 | 0.04768 | 2.57269 | ↓ |
| 24 | Hydroquinone | 2.60759 | 0.04993 | 1.2828 | ↑ |
Disclaimer/Publisher’s Note: The statements, opinions and data contained in all publications are solely those of the individual author(s) and contributor(s) and not of MDPI and/or the editor(s). MDPI and/or the editor(s) disclaim responsibility for any injury to people or property resulting from any ideas, methods, instructions or products referred to in the content. |
© 2026 by the authors. Licensee MDPI, Basel, Switzerland. This article is an open access article distributed under the terms and conditions of the Creative Commons Attribution (CC BY) license.
Copyright: This open access article is published under a Creative Commons CC BY 4.0 license, which permit the free download, distribution, and reuse, provided that the author and preprint are cited in any reuse.


