Submitted:
24 February 2026
Posted:
25 February 2026
You are already at the latest version
Abstract
Calcium silicate boards are widely used in passive fire protection systems due to their high structural stability and excellent thermal insulation performance under extreme temperatures. The fireproofing efficiency of such materials strongly depends on their thermophysical properties and structural configuration. In this study, the effects of density, thickness, and thermal conductivity on the fire insulation performance of three commercially available calcium silicate boards were systematically investigated by fire testing. Temperature evolution on the unexposed surface was monitored and validated through numerical simulations to predict how the fireboards behave under various heating conditions. In addition, the microstructural and physical properties of the boards were characterized and correlated with their fire performance. The simulation results show good agreement with experimental data, revealing that density, thickness, and thermal conductivity play a critical role in determining the fireproofing efficiency of calcium silicate boards.
Keywords:
fireproof
; calcium silicate
; thermal conductivity
; FEM
; fire curve
1. Introduction
In recent years, the rapid expansion of the underground transportation network has raised the safety concern of the tunnels due to accidental fires that not only damage the structural integrity but also eventually cause them to collapse, triggering a major disaster. Under high temperatures in the fire, the performance of building components of the tunnel will be significantly weakened [1,2]. Moreover, the confined geometry of tunnels makes fire suppression and evacuation particularly challenging, often resulting in severe casualties during fire incidents. Fire safety is therefore a fundamental requirement for tunnel infrastructure, ensuring safe evacuation routes for occupants and limiting fire propagation within the structure [3]. To mitigate damage during tunnel fire events, the application of fireproofing materials has become a widely adopted and effective solution. Passive fire protection (PFP) is a core strategy in modern fire safety design for buildings and infrastructure, providing thermal insulation and structural protection without active intervention[4]. Fireproofing materials represent a well-established approach for PFP of both equipment and load-bearing structures, playing a critical role in maintaining structural stability and integrity under extreme fire exposure[5].
A wide range of commercially available inorganic materials, both synthetic (e.g., Mineral wool, Cellular glass, Foamed glass, Calcium silicate foam, Ceramic fibres and foams, Aerogel, Gypsum foam, Geopolymers) and natural (e.g., Expanded perlite, Exfoliated vermiculite, Expanded clay, Insulating clay bricks) have been used for passive fire protection applications[6,7,8,9]. Among these materials, calcium silicate-based fire protective boards are considered particularly suitable for tunnel fire protection due to their superior thermophysical properties, including low thermal conductivity, excellent thermal shock resistance, high temperature stability, and durability under harsh environmental conditions[10].
Calcium silicate-based boards are typically manufactured from a mixture of calcium sources (Ca²⁺ or Ca(OH)₂) and silica, together with mineral fillers and 3-6 wt% cellulose as an additive. The ingredients are mixed with water to form a slurry, in which calcium silicate hydrate (C-S-H, CaH2SiO4) is generated and serves as the primary strength-giving phase. The slurry is then cast into moulds and subjected to autoclaving, resulting in a porous, open-cell rigid foam structure. The advantage of C-S-H foam boards as fire protective material includes their asbestos-free composition, non-combustible classification (Class A1, GB8624-2006), relatively low density and thermal conductivity, environmental friendliness, high mechanical strength, weather resistant, water and moisture resistance, and resistance to biological degradation due to their high alkalinity[11].
Accurate prediction of the temperature evolution in fireproof panels during fire exposure is essential for the effective design of fire protection systems. Finite element methods (FEM) provide a powerful tool for predicting temperature profiles under various heating conditions and represent an important first step toward understanding the thermal damage evolution of materials and structures during fire development[12].
In the present study, three commercially available calcium silicate–based fireproof boards with different thicknesses, densities, and thermal conductivities were selected for investigation. Their microstructural and physical properties were characterized, and fire tests were conducted. The experimental results were compared with FEM simulations to evaluate the fire performance of the boards under different heating conditions.
2. Materials and Methods
2.1. Materials Selection
After a comprehensive survey of commercially available inorganic fireproof materials, three calcium silicate–based fireproof boards from independent manufacturers were selected for this study. Among the samples, Skamopro 300 is the lightest (300 kg/m3) followed by Promatect-T (900 kg/m3) and Naper S (1200 kg/m3). Much lower density of Skamopro 300 sample indicates high porosity, which is reflected in the low thermal conductivity (0.072 W/mK) compared to Promatect-T (0.21 W/mK) and Naper S (0.25 W/mK).
The selected boards, along with their product codes and thermophysical properties as provided in the manufacturers’ technical data sheets, are summarized in Table 1.
2.2. Characterizations
The compositional analysis of the fire protective boards was performed with a Bruker M4 Tornado (Bruker, Germany) X-Ray Fluorescence spectrophotometer (XRF) operating at 50 KV and 600 μA (30 W). The measurements were performed by scanning in area mode (1 cm2 area) to avoid inhomogeneous distribution of the compounds/elements. The microstructure of the fireproof boards was observed with a field emission scanning electron microscope (FE-SEM Ziess, Germany). XRD analyses were performed with a Rigaku Ultima X-ray diffractometer operating at 40kV and 30 mA with a scanning step of 0.02°. Thermogravimetric analysis (TGA) was carried out to evaluate the presence of organic content and observe the thermal decomposition behavior of the fireboards. TGA of the as-received fireboards was performed with a Mettler thermoanalyzer (Mettler Toledo, Star system) at a heating rate of 10 °C/min in an air atmosphere from 25° to 1200 °C temperature range. To investigate the thermal stability and refractoriness of as-received fireproof boards, the samples were cut into dimensions of 15cm × 1cm × 2cm and thermally treated at 1200 °C and then at 1300 °C in an air oven for 1h. The linear shrinkage and weight loss after heat treatment were calculated by measuring the initial and final length/weight of the respective samples.
2.3. Time -Temperature Fire Test
The fire resistance property of the selected fireproof boards was tested in laboratory conditions by assessing their performance against the time-temperature curve. To perform the test, the received boards were cut into 28 cm by 28 cm square panels to fit the furnace window. Four thermocouples were inserted at different points on the external surface of the board, and data acquisition was carried out using a Picolog TC-08 data logger connected to a PC (Figure 1). To record the internal temperature of the furnace, another thermocouple was inserted at the backside of the furnace. The furnace was programmed to heat at a rate of 8 °C/min to reach 1300 °C, with a dwell time of 2 hours.
3. Results and Discussion
3.1. Physicochemical Characteristics
The compositional analysis of the fire protective boards quantified by XRF spectrometry is summarized in Table 2 and reported as wt% of the corresponding oxides. Naper S and Skamopro 300 show Ca/Si ratio of 0.852 and 1.151, whereas Promatect-T shows a comparatively high Ca/Si ratio of 1.474. It is also interesting to observe the presence of a significant amount of alumina (Al2O3, 30.63 wt%) in Promatect-T sample compared to other calcium silicate boards (Naper S contains 4.39 wt%, Skamopro 300 contains 1.03 wt%). The oxide compositions of the selected fireboards after calcination at 1200 °C for 60 min are also presented in Table 2. The elemental compositions before and after calcination remain largely unchanged, with only minor variations, which may be attributed to sample inhomogeneity or elemental redistribution during thermal treatment.
Thermogravimetric analyses (TGA) of the selected fireboards are shown in Figure 2 (a-c All samples exhibit an initial weight loss below 200 °C, corresponding to the evaporation of pore and capillary water and the dehydration of calcium silicate hydrate (C–S–H) phases[13,14]. A second weight-loss step observed in the range of 300–400 °C is attributed to the thermal decomposition of the cellulose binder. Weight loss occurring between 400 and 450 °C can be associated with the dehydration of portlandite [13]. An additional weight-loss region between 500 and 700 °C is attributed to CO₂ release from calcium carbonate formed through surface carbonation during thermal exposure. Weight loss above approximately 770 °C is assigned to dehydroxylation, corresponding to the removal of structural OH groups, primarily from silanol (Si–OH) species in the silicate network. The TGA curves indicate that Promatect-T and Naper-S exhibit similar thermal decomposition behavior, whereas Skamopro-300 shows a slightly different trend, likely due to variations in component stoichiometry.
Figure 3 shows the XRD pattern of the selected fireboards before and after heat treatment at 1200 °C. The as-received samples exhibit different degrees of crystallinity; while Promatect-T shows less crystallinity, Skamopro-300 and Naper-S show relatively higher crystallinity. All the patterns show several diffraction peaks in the 10-60° 2θ region. In the case of Promatect-T, there is a notable difference in the appearance of a sharp peak around 18° (2θ) for as received sample, which corresponds to the portlandite (Ca(OH)2) that disappeared after calcination at 1200 °C, indicating its decomposition [15,16]. This feature is not observed for Naper-S and Skamopro-300 boards. The peaks at 11.7°, 23.58°, 29.65°, and 32.7° of 2θ could be assigned to the presence of hydrated calcium silicate phases (C-S-H), which is common in fire-resistant calcium silicate boards [13,17,18,19]. After calcination at 1200 °C, all these phases disappear and transform into the more thermally stable Wollastonite (CaSiO3) crystalline phase [16]. Some additional peaks are also visible that can be assigned to the formation of calcium silicate polymorphs, such as dicalcium silicate (Ca2SiO4) and calcium aluminate (CaAl2O4). These transformations are associated with solid-state reactions between CaO and SiO₂ during the sintering process. Similar crystalline transformation was also observed for Skamopro-300 and Naper-s, with the appearance of a stronger SiO2 peak due to the presence of quartz. The appearance of relatively stronger quartz peaks in Skamopro-300 and Naper-S suggests either incomplete reaction during heat treatment or the presence of excess silica-containing filler, which is supported by the XRF compositional analyses (Table 2). It is also worth mentioning that the presence of Al2O3 can be identified in Promatect-T due to the appearance of corundum diffraction peaks at 2θ of 25.6° and 35.14°. This is consistent with the compositional analysis of XRF, where a higher amount of Al2O3 is observed for the Promatect-T sample. This higher amount of Al2O3 presence in Promatect-T board enhances its structural integrity during high temperature operation, which could make it superior to the other firboards.
FT-IR spectra of the as-received and 1200 °C calcined fireboards are shown in Figure 4 (a-f), where several structural and compositional changes related to dehydration, decarbonation, and silicate phase transformation are observed. Distinct vibrational peaks of the respective samples, before and after heat treatment, are marked in the figure. The appearance of a broad vibration band at the higher wavenumber centered at 3645 cm⁻¹ can be assigned to the O-H stretching vibration of Ca(OH)₂ [18], and a broad peak centered around 3400 cm⁻¹ is due to O-H stretching vibrations of surface hydroxyl groups in the C-S-H structure. Another weak absorption at 1645 cm⁻¹ could be attributed to adsorbed water molecules. The broad and relatively strong band in the range of 1400-1500 cm⁻¹ is caused by CO₂, which may arise from either adsorbed CO₂ or the presence of amorphous carbonates [20,21]. A group of intense bands between 900-1200 cm⁻¹ originates from the asymmetric and symmetric stretching vibrations of Si-O-Si bonds, confirming silica presence in all fireboards. The relatively strong and sharp Si-O-Si bonds in Naper-S and Skamopro-300 fireboards, compared to Promatect-T, indicate a higher amount of silica, as observed in XRF analyses (Table 2) and XRD diffractogram. Notably, for as-received Naper-S and Promatect-T, a strong peak around 964 cm⁻¹ and a weaker band at 873 cm⁻¹ are observed, which disappear after calcination at 1200 °C; these can be attributed to cellulose binder (C-O and C-C stretching vibrations). This feature is less prominent in Promatect-T, possibly due to a lower cellulose content or masking by Si-O-Si bands. Additionally, peaks between 900-950 cm⁻¹ emerge after calcination, likely due to the formation of α-Wollastonite, as indicated by the XRD spectrum [22].
The microstructures of as-received and heat treated at 1200 °C fireproof boards are shown in Figure 5. Low-magnification images clearly reveal fibers embedded within a porous calcium silicate matrix (Figure 5 a- c). Significant open porosity and inter-fiber voids are visible, contributing to the low bulk density and thermal insulation properties. At higher magnification (d–f), the matrix shows poorly crystallized calcium silicate hydrates with irregular morphology. Needle-like and flaky structures are observed, indicating the presence of hydrated phases. The presence of elongated reinforcing fibers and plate-like phases suggests a typical autoclaved calcium silicate hydrate structure. The microstructure appears loosely packed, with limited interparticle bonding. After exposure to 1200 °C (g–i), the microstructure becomes more homogeneous and compact indicating significant microstructural densification due to thermal exposure. High-magnification images (j–l) show a clear transformation toward a denser and more cohesive microstructure. The needle-like hydrates appear coarsened and grain-like agglomerates are formed. This suggests dehydration-induced densification and partial phase transformation (discussed in XRD). The reduction in visible microporosity indicates shrinkage and microstructural consolidation. Among the samples, differences in fiber distribution and matrix compactness suggest that boards with a more uniform fiber dispersion and controlled porosity exhibit improved thermal stability and reduced cracking after heating.
3.2. Time -Temperature Fire Test
Figure 6 presents the time–temperature profiles recorded on the unexposed face of the calcium silicate fireboards during the fire resistance test, together with the applied furnace temperature. The furnace temperature follows a rapid heating regime, reaching approximately 1300 °C within the first 3 h and remaining nearly constant thereafter, simulating a severe fire exposure. Despite this extreme thermal load, all tested fireboards effectively limited heat transmission to the unexposed surface, demonstrating their suitability for passive fire protection applications.
A clear distinction in thermal insulation performance is observed among the boards. Skamopro-300 consistently exhibits the lowest backside temperature over the entire exposure period, remaining below ~180 °C after 5 h, indicating superior thermal resistance. Promatect-T shows moderate insulation performance, with the unexposed face temperature stabilizing around ~260 °C. In contrast, Naper-S records the highest temperature rise, reaching approximately ~420 °C, suggesting comparatively higher heat transfer.
The differences in temperature evolution can be attributed to variations in material thickness, density, and thermal conductivity. Boards with lower thermal conductivity and optimized microstructural features, such as higher porosity and finer pore distribution, effectively impede heat flow and delay temperature rise on the cold face. These results highlight the critical role of thermophysical properties in determining fireproofing efficiency and emphasize the importance of material selection and design for tunnel fire protection systems.
Photos of surfaces exposed to fire test for all samples are shown in Figure 7. In case of Naper-S and Skampro-300, many cracks appear compared to Promatect-T. This shows the reliability of the Promatect-T board during fire.
3.3. Finite Element Modelling (FEM) for Simulating Heat Exchange During Fire
The Temperature/time fire curve test was analyzed by means of finite elements methods (FEM) using the FlexPDE software. A 1-D heat exchange model was implemented into the software, which allowed for the solution of the classical II Fourier law:
Where and are the material density, specific heat and thermal conductivity, T is the temperature, t is time, and x the direction of heat transfer. The heat transfer equation was coupled with proper boundary conditions (BC). Referring to the scheme of Figure 8 the material thermal properties used in the heat transfer problem are reported in Table 4, and were taken from the material technical data sheet.
The boundary conditions used on the internal oven surface (B1) is:
Whereas for the outer surface of the board, in contact with the air at room temperature:
In both eq. 2) and eq. 3) the thermal flux at the interface is made of two different contributions, the first one due to convection, and the second one to radiation; in both equations, hconv represent the convective heat transfer coefficients, whereas the radiative heat transfer coefficient, , was calculated as:
In which εf ed εs are the emissivity of the fire and the exposed surface respectively, and σ= 5.67*10-8 W/(m2K4) is the Stefan-Boltzman constant. In the simulations, εf =1 and , εs=0.8 were taken[23].
The convective coefficient of eq. 2) and eq. 3) were calculated according to the definition of the Nusselt number:
In which is the air thermal conductivity and L is the characteristic length of convection, which, for vertical plates, is the wall length.
The Nusselt number for a free convection on a vertical plate was obtained by the Churchill and Chu correlation[24].
Where Gr is the Grashof number:
And Pr is the Prandtl number:
In which β is the thermal expansion coefficient, μ viscosity, T the interface temperature, Tfluid the fluid temperature. For air, β=3.7*10-3 K-1, μ=1.7*10-5 Pa*s ρ=1.2 Kg/m3 and k= 0.024 W/mK were taken.
The typical evolution of the convective coefficients on both sides of the Skampopro fireproof panel is reported in Figure 9.
The convective and radiative heat fluxes at the two boundaries of the domain are reported in Figure 10. On the oven side, initially, convective and radiative terms are comparable in magnitude. However, as the temperature of the panel on the oven side increases, the radiative term increases; the decrease in the temperature difference causes a decrease in the convective term. On the other hand, on the room side, the two heat fluxes are comparable in magnitude over the whole time interval. In facts, in this case the term continuously increases, which causes the convective term to be significant over the whole time range of the simulation. However, all the heat flux terms reach an asymptotic value after a reasonable time interval (about 10000 s in Figure 11), which roughly coincides with the time necessary for the oven to attain the isothermal step. After this transient, the heat transfer problem becomes substantially stationary. The total positive heat flux (heating from the oven to the panel) becomes equivalent to the total negative heat flux (cooling from the panel to the external air).
A comparison between experimental and simulation data, reported in Figure 11 shows a reasonable good agreement, as highlighted by the results reported in Tabella II, which highlight the more relevant results of experimental data and simulation, in terms of heating rate (calculated in the 3000-6000 s range) and maximum temperature.
The FEM predictions match the experimentally measured temperature trends for all samples, demonstrating the reliability of the numerical model in capturing the heat transfer mechanisms during fire exposure. Deviations between experimental and simulated data can be attributed to simplifications in the model, such as the assumption of temperature-independent thermophysical properties and idealized boundary conditions. Among the tested boards, Skamopro-300 exhibits the lowest unexposed face temperature both experimentally and numerically, remaining below ~180 °C after 5 h, indicating superior insulation performance. Promatect-T shows intermediate behavior with a stabilized backside temperature of ~260 °C, while Naper-S reaches the highest temperature (~420 °C), reflecting comparatively higher thermal conductivity and/or lower effective insulation thickness. The FEM results confirm that these differences arise primarily from variations in density, thickness, and thermal conductivity, which govern conductive heat transfer through the boards. Overall, the good agreement between experimental fire tests and FEM simulations validates the predictive capability of the numerical approach and demonstrates its usefulness for optimizing fireboard design and predicting thermal performance under different fire scenarios without extensive experimental trials.

Table 5.
deviations in heating rate and maximum temperature from FEM.
| Heating rate (K/s) (3000- 6000 s) | Maximum temperature (K) | |||||
| experimental | Simulation | Error (%) | experimental | Simulation | Errror (%) | |
| Skampro-300 | 0.019 | 0.014 | 26 | 480 | 420 | 12 |
| Promatect T | 0.025 | 0.029 | 16 | 550 | 590 | 7 |
| Naper-S | 0.039 | 0.035 | 10 | 680 | 650 | 4 |
4. Conclusions
In this study, three different commercially available calcium silicate-based fireproof boards were characterized. Higher refractoriness in case of Promatect-T sample was attributed to a comparatively higher Ca/Si ratio of 1.474 compared to Skampro and naper-S (<1.2) and a significant amount of alumina (30 wt%) present in Promatect-T (Naper S; 4.4 wt%, Skamopro 300; 1 wt%). Thermogravimetric analysis showed varying weight loss trends between each sample; that could arise from different stoichiometry of the components. XRD analysis showed that, in the case of only Promatect-T, there is a peak corresponding to the portlandite (Ca(OH)2) appeared depict presence of unreacted calcium hydroxide. A relatively strong vibrational peaks of Si-O-Si bonds appears in Naper-S and Skamopro-300 fireboards compared to Promatect-T support the presence of higher amount of silica in these two fireboards. The microstructural observations demonstrate that a homogeneous fiber distribution coupled with a controlled pore architecture enhances the thermal stability of calcium silicate boards and effectively suppresses crack initiation and propagation during thermal exposure. The unexposed surface temperatures were recorded by fire resistance tests, and the results were correlated with values obtained by the finite element method. The experimental fire tests and FEM simulations show strong agreement, confirming that calcium silicate boards effectively limit heat transfer under severe fire exposure and that the numerical model reliably predicts their thermal response. Variations in unexposed face temperature are primarily governed by board thickness, density, and thermal conductivity, highlighting their critical role in optimizing fireproofing performance.
References
- V. Kodur, Properties of Concrete at Elevated Temperatures, ISRN Civil Engineering 2014 (2014) e468510. [CrossRef]
- K. Sakr, E. EL-Hakim, Effect of high temperature or fire on heavy weight concrete properties, Cement and Concrete Research 35 (2005) 590–596. [CrossRef]
- M.C. Yew, M.K. Yew, R.K.K. Yuen, Experimental Analysis of Lightweight Fire-Rated Board on Fire Resistance, Mechanical, and Acoustic Properties, Fire 6 (2023). [CrossRef]
- K. Mróz, I. Hager, K. Korniejenko, Material Solutions for Passive Fire Protection of Buildings and Structures and Their Performances Testing, Procedia Engineering 151 (2016) 284–291. [CrossRef]
- A. Di Padova, A. Tugnoli, V. Cozzani, T. Barbaresi, F. Tallone, Identification of fireproofing zones in Oil&Gas facilities by a risk-based procedure, Journal of Hazardous Materials 191 (2011) 83–93. [CrossRef]
- R. Gellert, 8 - Inorganic mineral materials for insulation in buildings **This chapter is dedicated to Dr Walter F. Cammerer on the occasion of his 90th birthday., in: M.R. Hall (Ed.), Materials for Energy Efficiency and Thermal Comfort in Buildings, Woodhead Publishing, 2010: pp. 193–228. [CrossRef]
- I.H. Aziz, M.M. Al Bakri Abdullah, H.C. Yong, L.Y. Ming, K. Hussin, A. Surleva, E.A. Azimi, Manufacturing parameters influencing fire resistance of geopolymers: A review, Proceedings of the Institution of Mechanical Engineers, Part L: Journal of Materials: Design and Applications 233 (2019) 721–733. [CrossRef]
- D.I. Kolaitis, E.K. Asimakopoulou, M.A. Founti, Fire behaviour of gypsum plasterboard wall assemblies: CFD simulation of a full-scale residential building, Case Studies in Fire Safety 7 (2017) 23–35. [CrossRef]
- Y. Wang, Y.-J. Chuang, C.-Y. Lin, The Performance of Calcium Silicate Board Partition Fireproof Drywall Assembly with Junction Box under Fire, Advances in Materials Science and Engineering 2015 (2015) 642061. [CrossRef]
- L. Kristanto, H. Sugiharto, S.W.D. Agus, S.A. Pratama, Calcium Silicate Board as Wall-facade, Procedia Engineering 171 (2017) 679–688. [CrossRef]
- M. Gravit, E. Golub, The fire resistant ceiling construction in a hydrocarbon fire, MATEC Web Conf. 245 (2018) 03004. [CrossRef]
- R. Prieler, H. Gerhardter, M. Landfahrer, C. Gaber, C. Schluckner, M. Eichhorn-Gruber, G. Schwabegger, C. Hochenauer, Development of a numerically efficient approach based on coupled CFD/FEM analysis for virtual fire resistance tests—Part B: Deformation process of a steel structure, Fire and Materials 44 (2020) 704–723. [CrossRef]
- 13. Cell Dimensions and Composition of Nanocrystalline Calcium Silicate Hydrate Solid Solutions. Part 2: X-Ray and Thermogravimetry Study - Garbev - 2008 - Journal of the American Ceramic Society - Wiley Online Library, (n.d.). (accessed December 13, 2018). [CrossRef]
- R. Maddalena, C. Hall, A. Hamilton, Effect of silica particle size on the formation of calcium silicate hydrate using thermal analysis, Thermochimica Acta (2018). [CrossRef]
- G. Taglieri, C. Mondelli, V. Daniele, E. Pusceddu, A. Trapananti, Synthesis and X-Ray Diffraction Analyses of Calcium Hydroxide Nanoparticles in Aqueous Suspension, Advances in Materials Physics and Chemistry 03 (2013) 108. [CrossRef]
- E. Tajuelo Rodriguez, K. Garbev, D. Merz, L. Black, I.G. Richardson, Thermal stability of C-S-H phases and applicability of Richardson and Groves’ and Richardson C-(A)-S-H(I) models to synthetic C-S-H, Cement and Concrete Research 93 (2017) 45–56. [CrossRef]
- S. Grangeon, F. Claret, C. Lerouge, F. Warmont, T. Sato, S. Anraku, C. Numako, Y. Linard, B. Lanson, On the nature of structural disorder in calcium silicate hydrates with a calcium/silicon ratio similar to tobermorite, Cement and Concrete Research 52 (2013) 31–37. [CrossRef]
- M.A. Trezza, Hydration study of ordinary portland cement in the presence of zinc ions, Materials Research 10 (2007) 331–334. [CrossRef]
- V. Jokanović, B. Čolović, M. Mitrić, D. Marković, B. Ćetenović, Synthesis and Properties of a New Dental Material Based on Nano-Structured Highly Active Calcium Silicates and Calcium Carbonates, International Journal of Applied Ceramic Technology 11 (2014) 57–64. [CrossRef]
- R. Puntharod, C. Sankram, N. Chantaramee, P. Pookmanee, K.J. Haller, Ceramic Processing Research, (n.d.) 4.
- P. Yu, R.J. Kirkpatrick, B. Poe, P.F. McMillan, X. Cong, Structure of Calcium Silicate Hydrate (C-S-H): Near-, Mid-, and Far-Infrared Spectroscopy, Journal of the American Ceramic Society 82 (1999) 742–748. [CrossRef]
- Wollastonite R040131 - RRUFF Database: Raman, X-ray, Infrared, and Chemistry, (n.d.). http://rruff.info/wollastonite/display=default/R040131 (accessed December 19, 2018).
- C. Zhang, A. Usmani, Heat transfer principles in thermal calculation of structures in fire, Fire Safety Journal 78 (2015) 85–95. [CrossRef]
- S.W. Churchill, R.U. Churchill, A comprehensive correlating equation for heat and component transfer by free convection, AIChE Journal 21 (1975) 604–606. [CrossRef]
Figure 1.
Set up for the temperature/ time fire curve test.
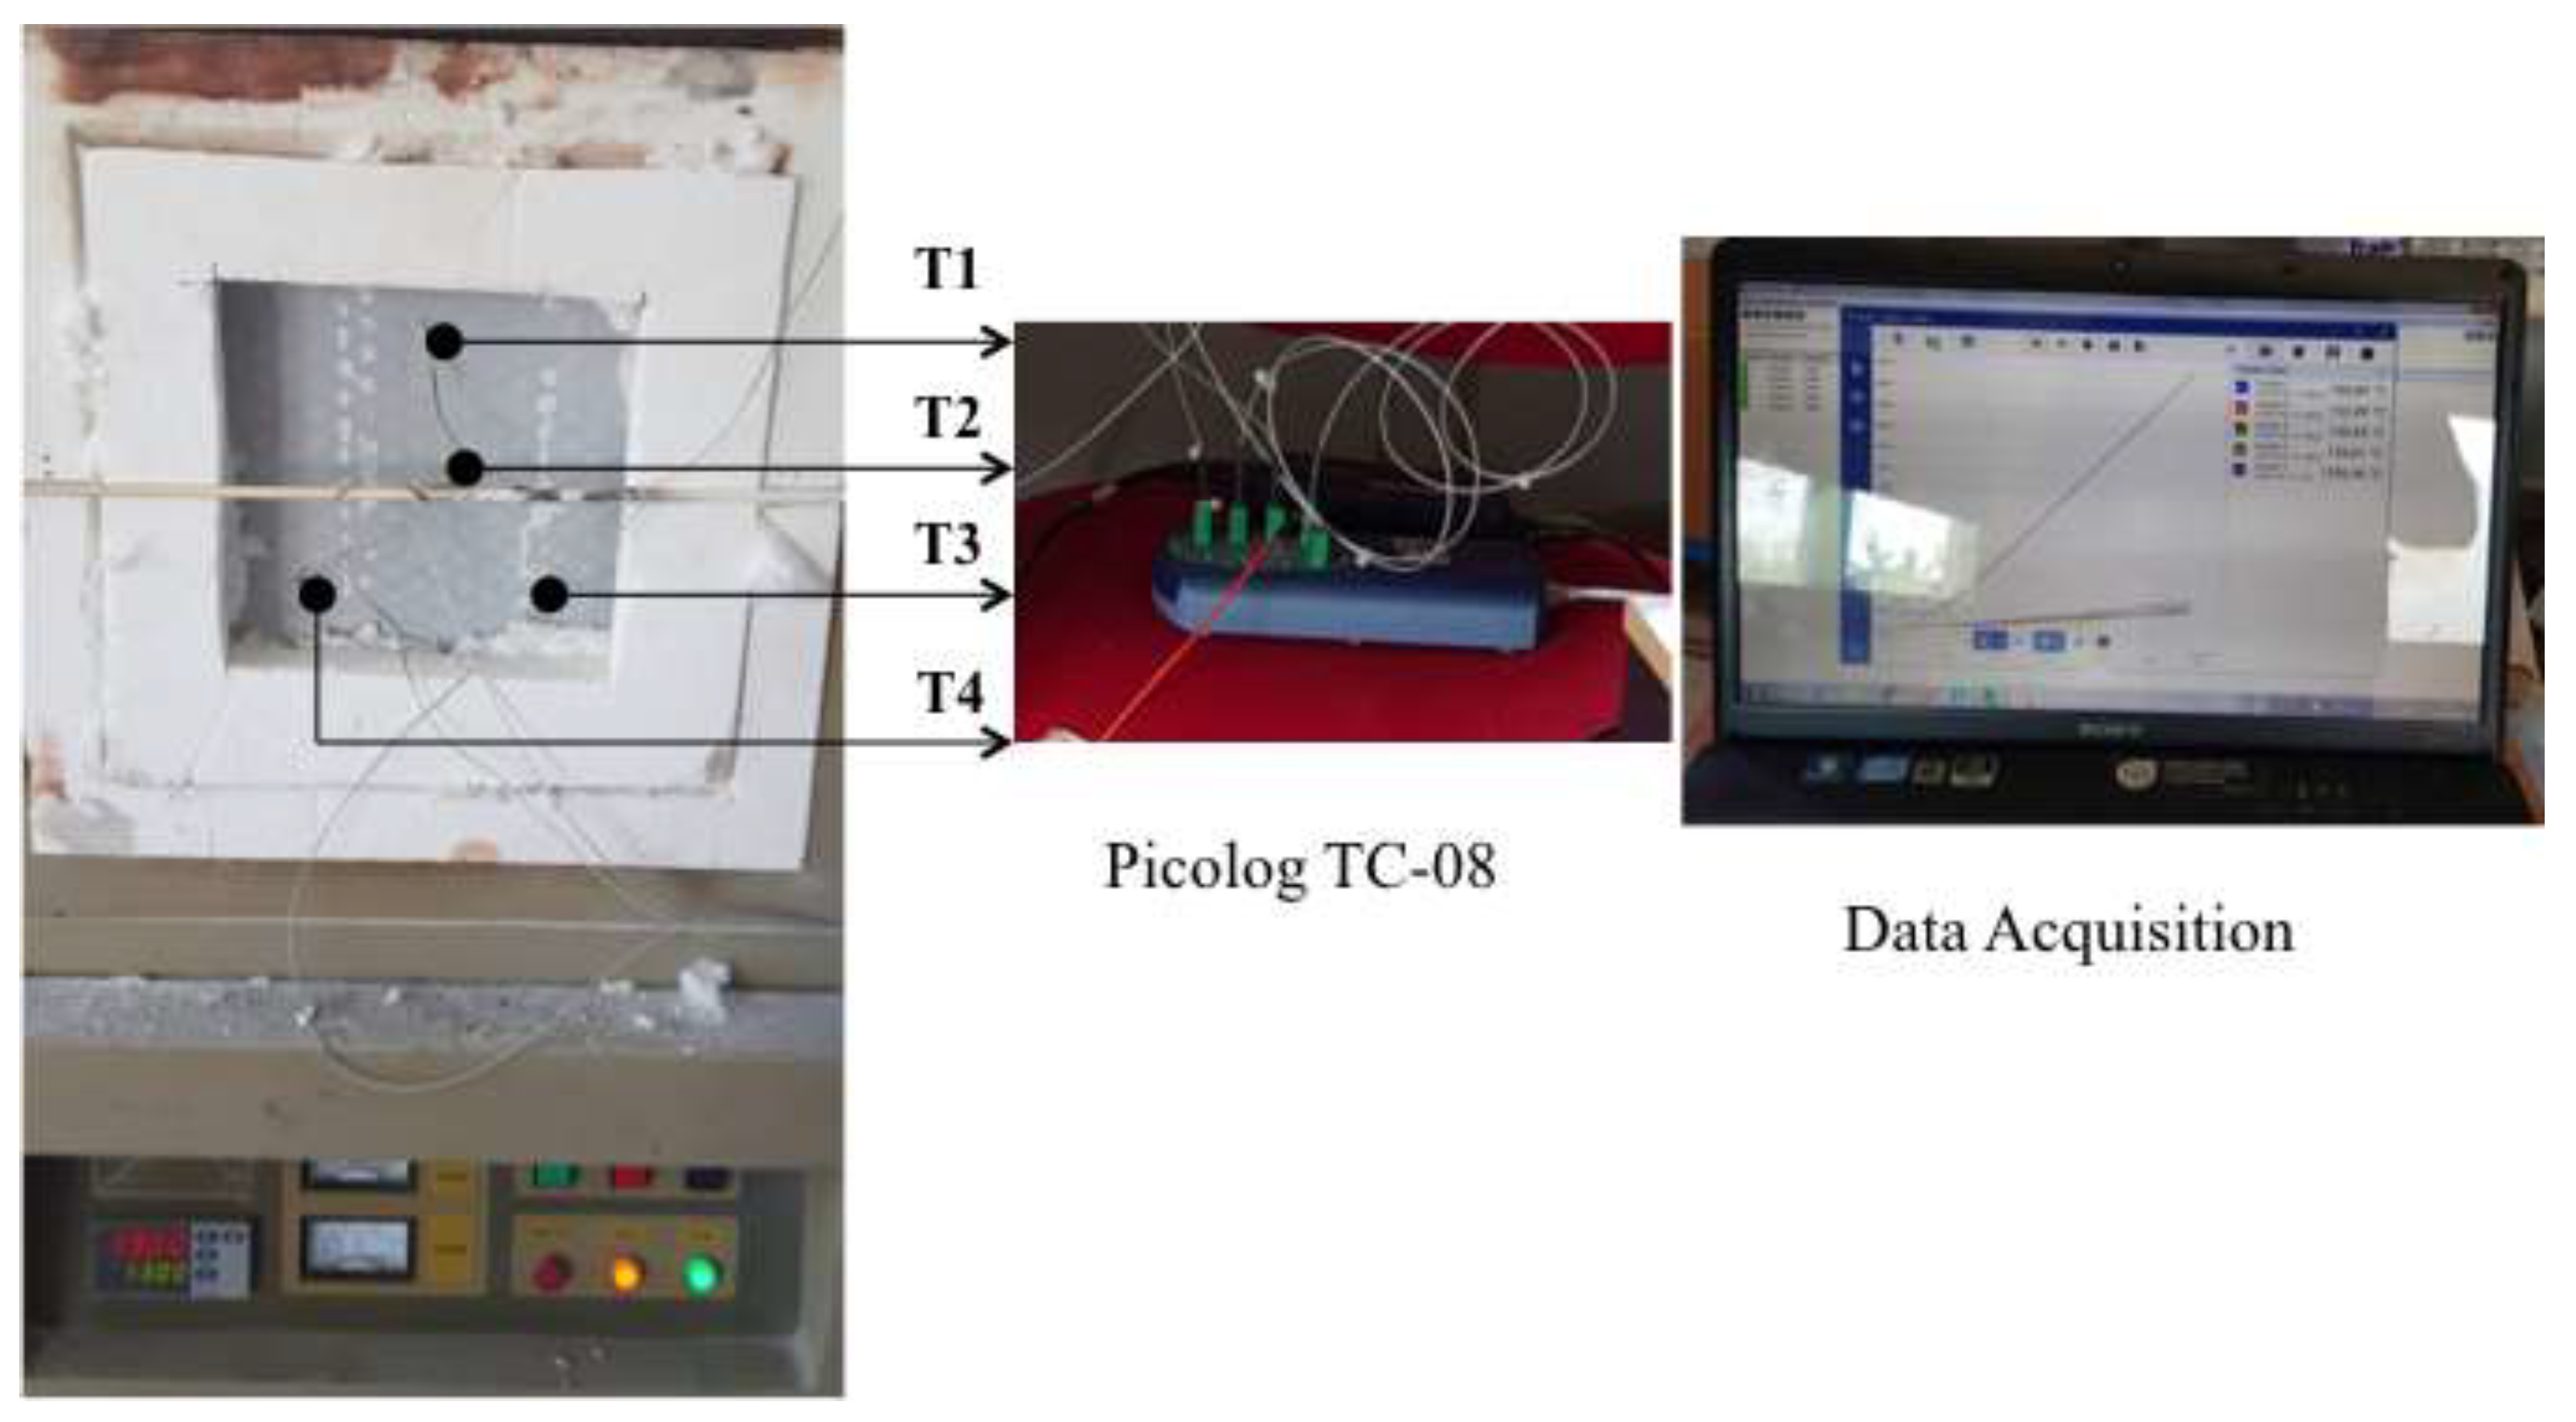
Figure 2.
TGA analyses of the selected fireboards at the temperature range of 25-1200 °C.
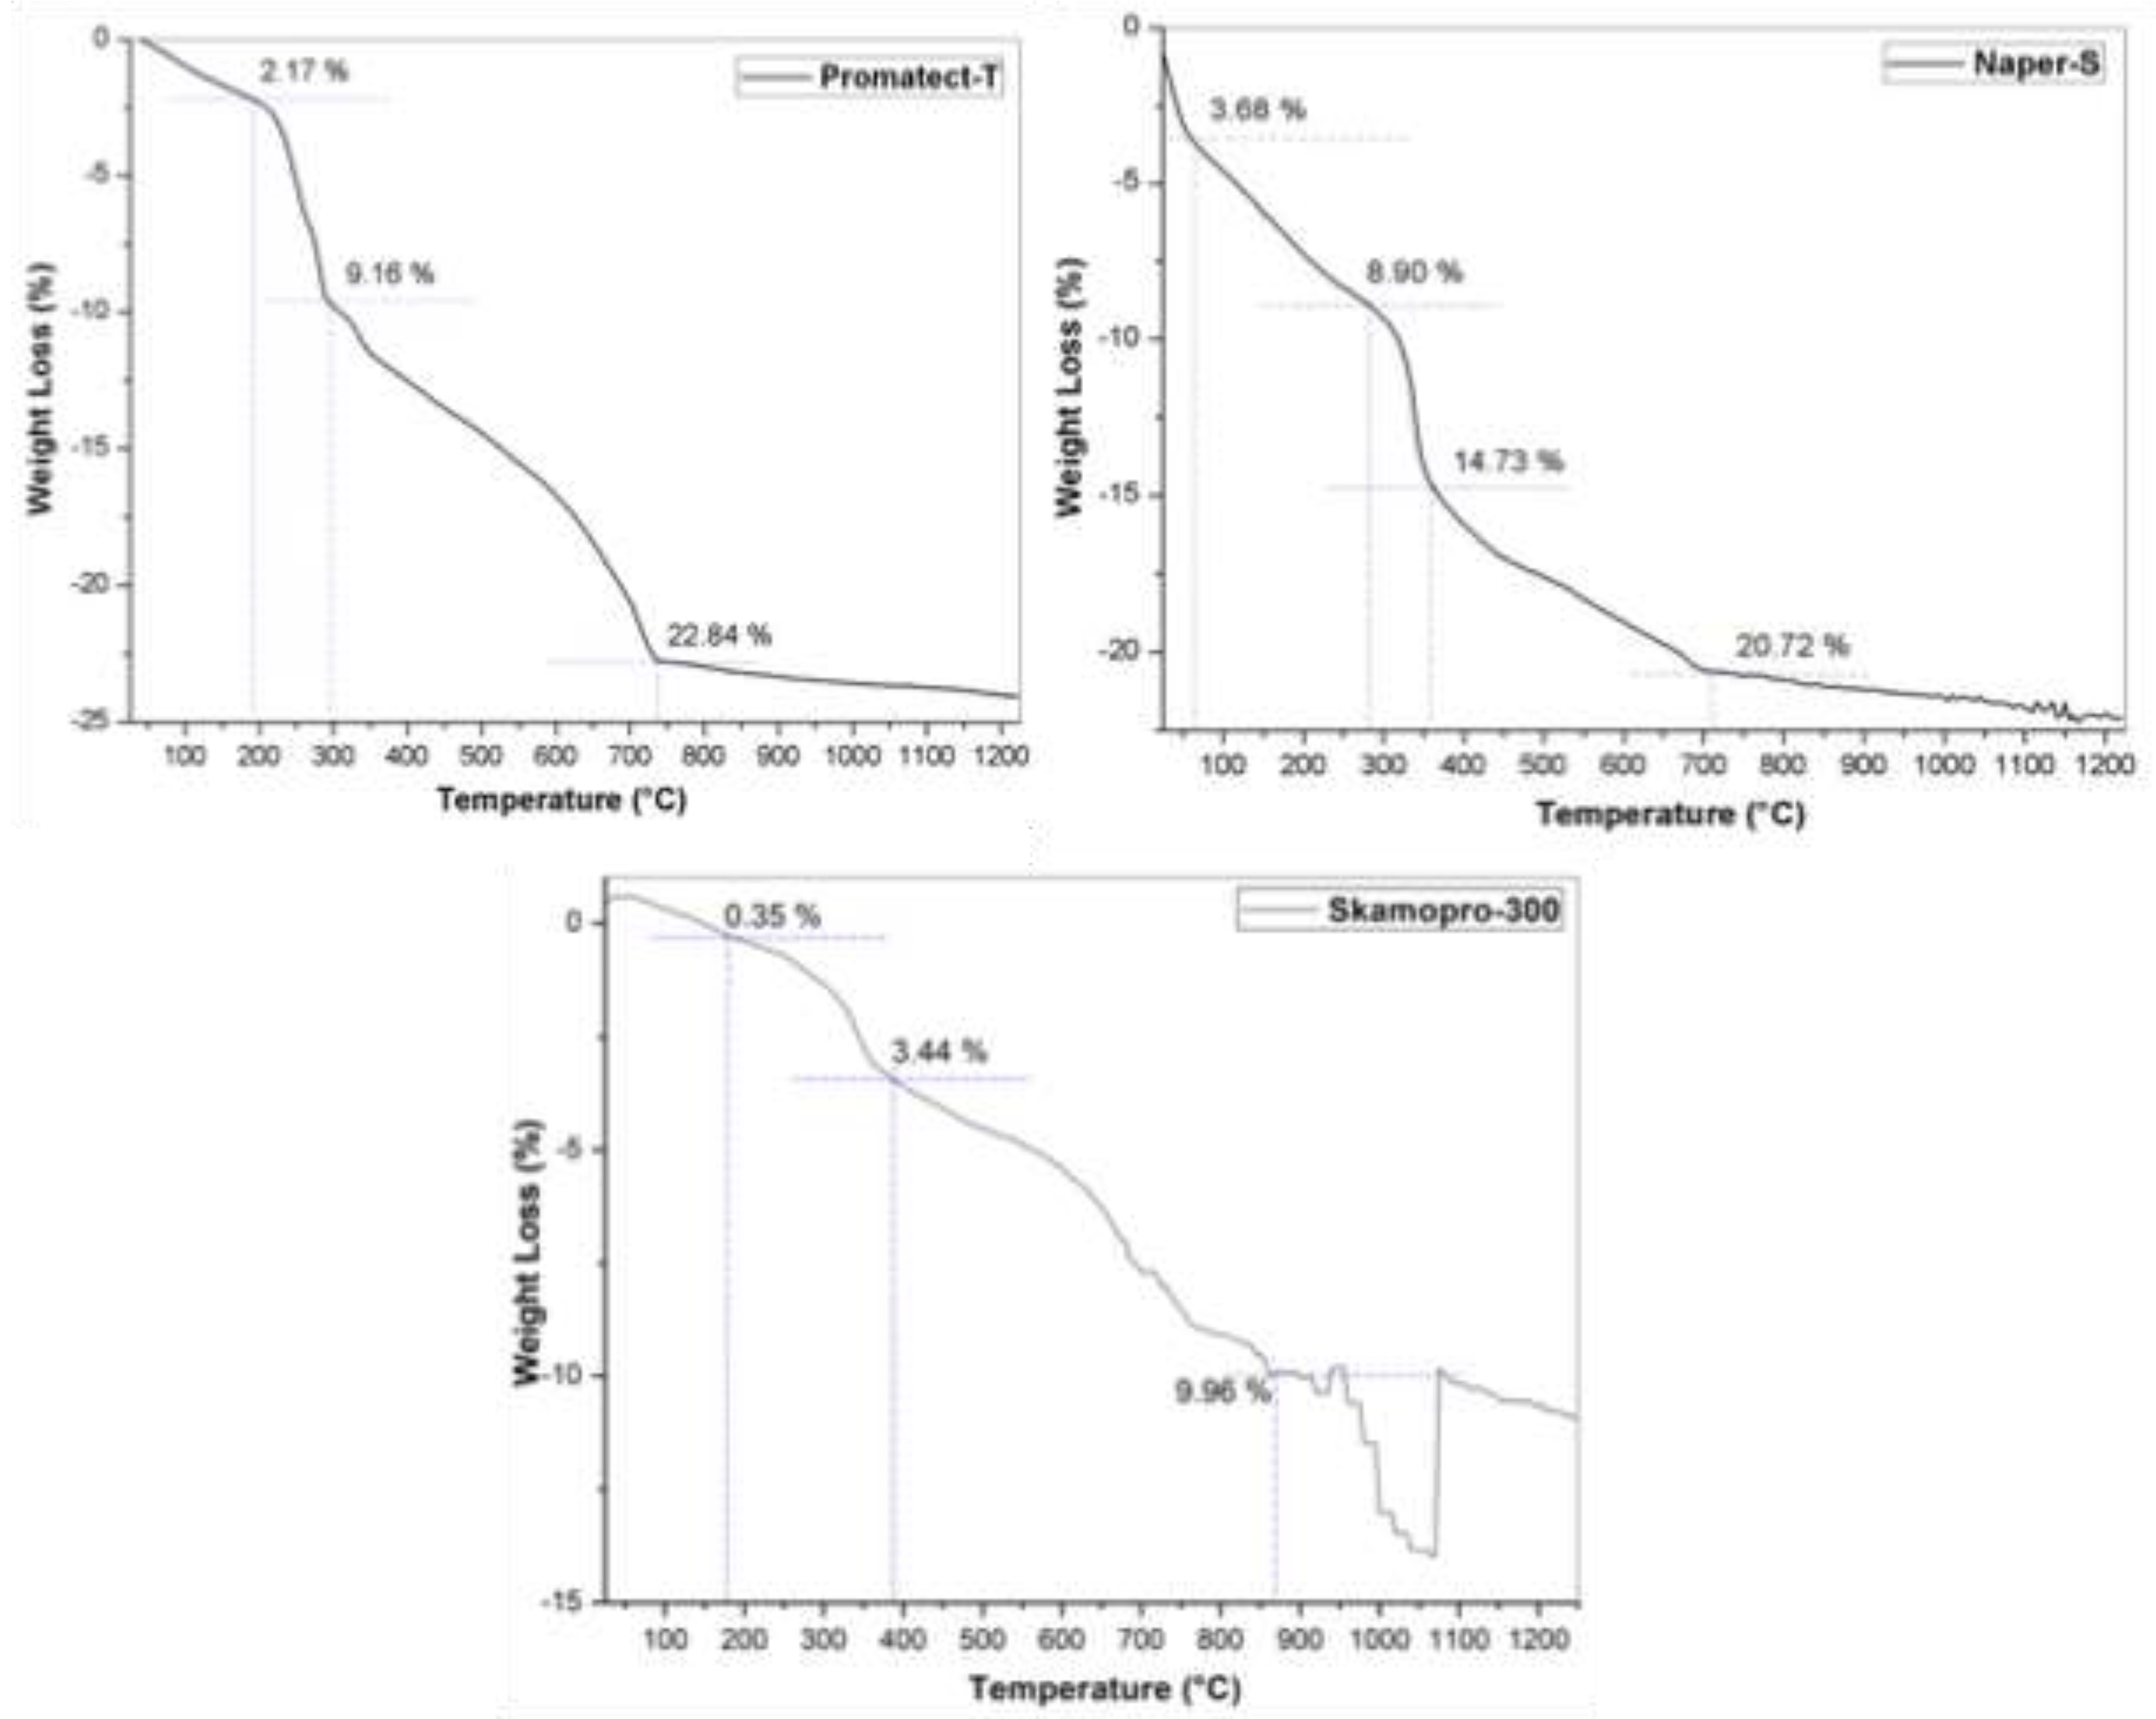
Figure 3.
XRD pattern of the as-received and after at 1200 °C for 60 min.
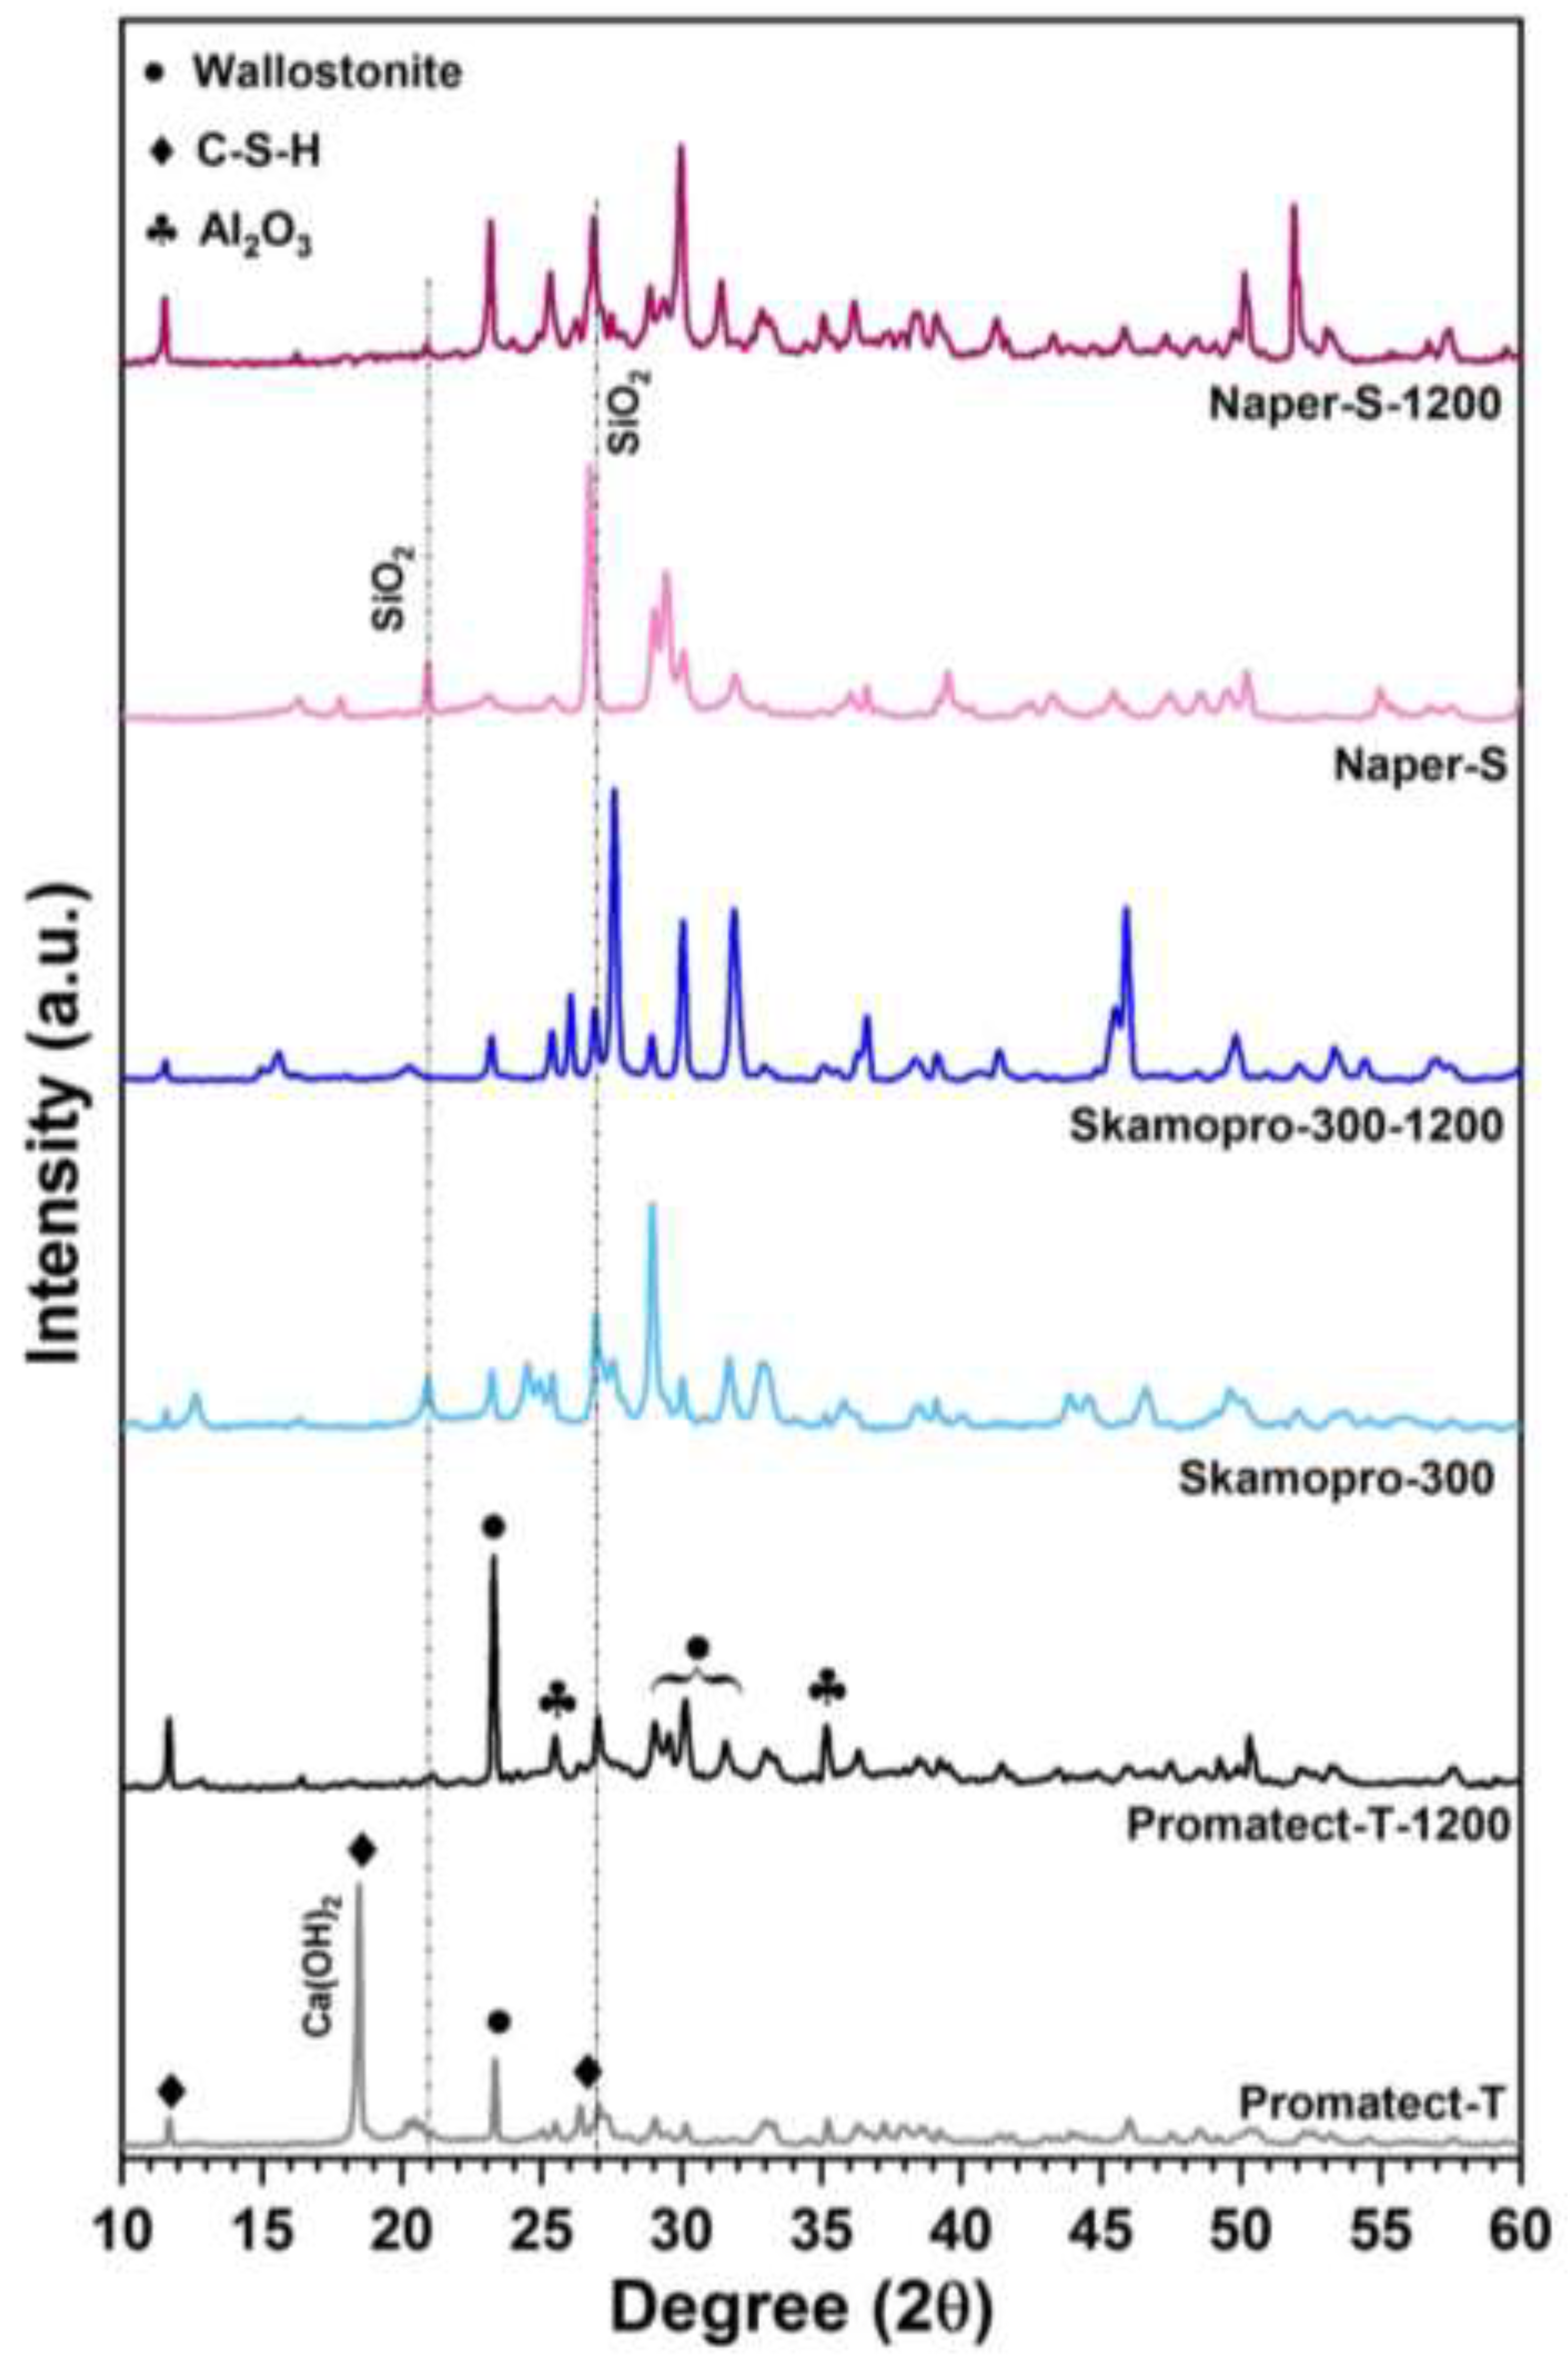
Figure 4.
FTIR spectra of the as-received and heat-treated @1200 °C for 60 min.
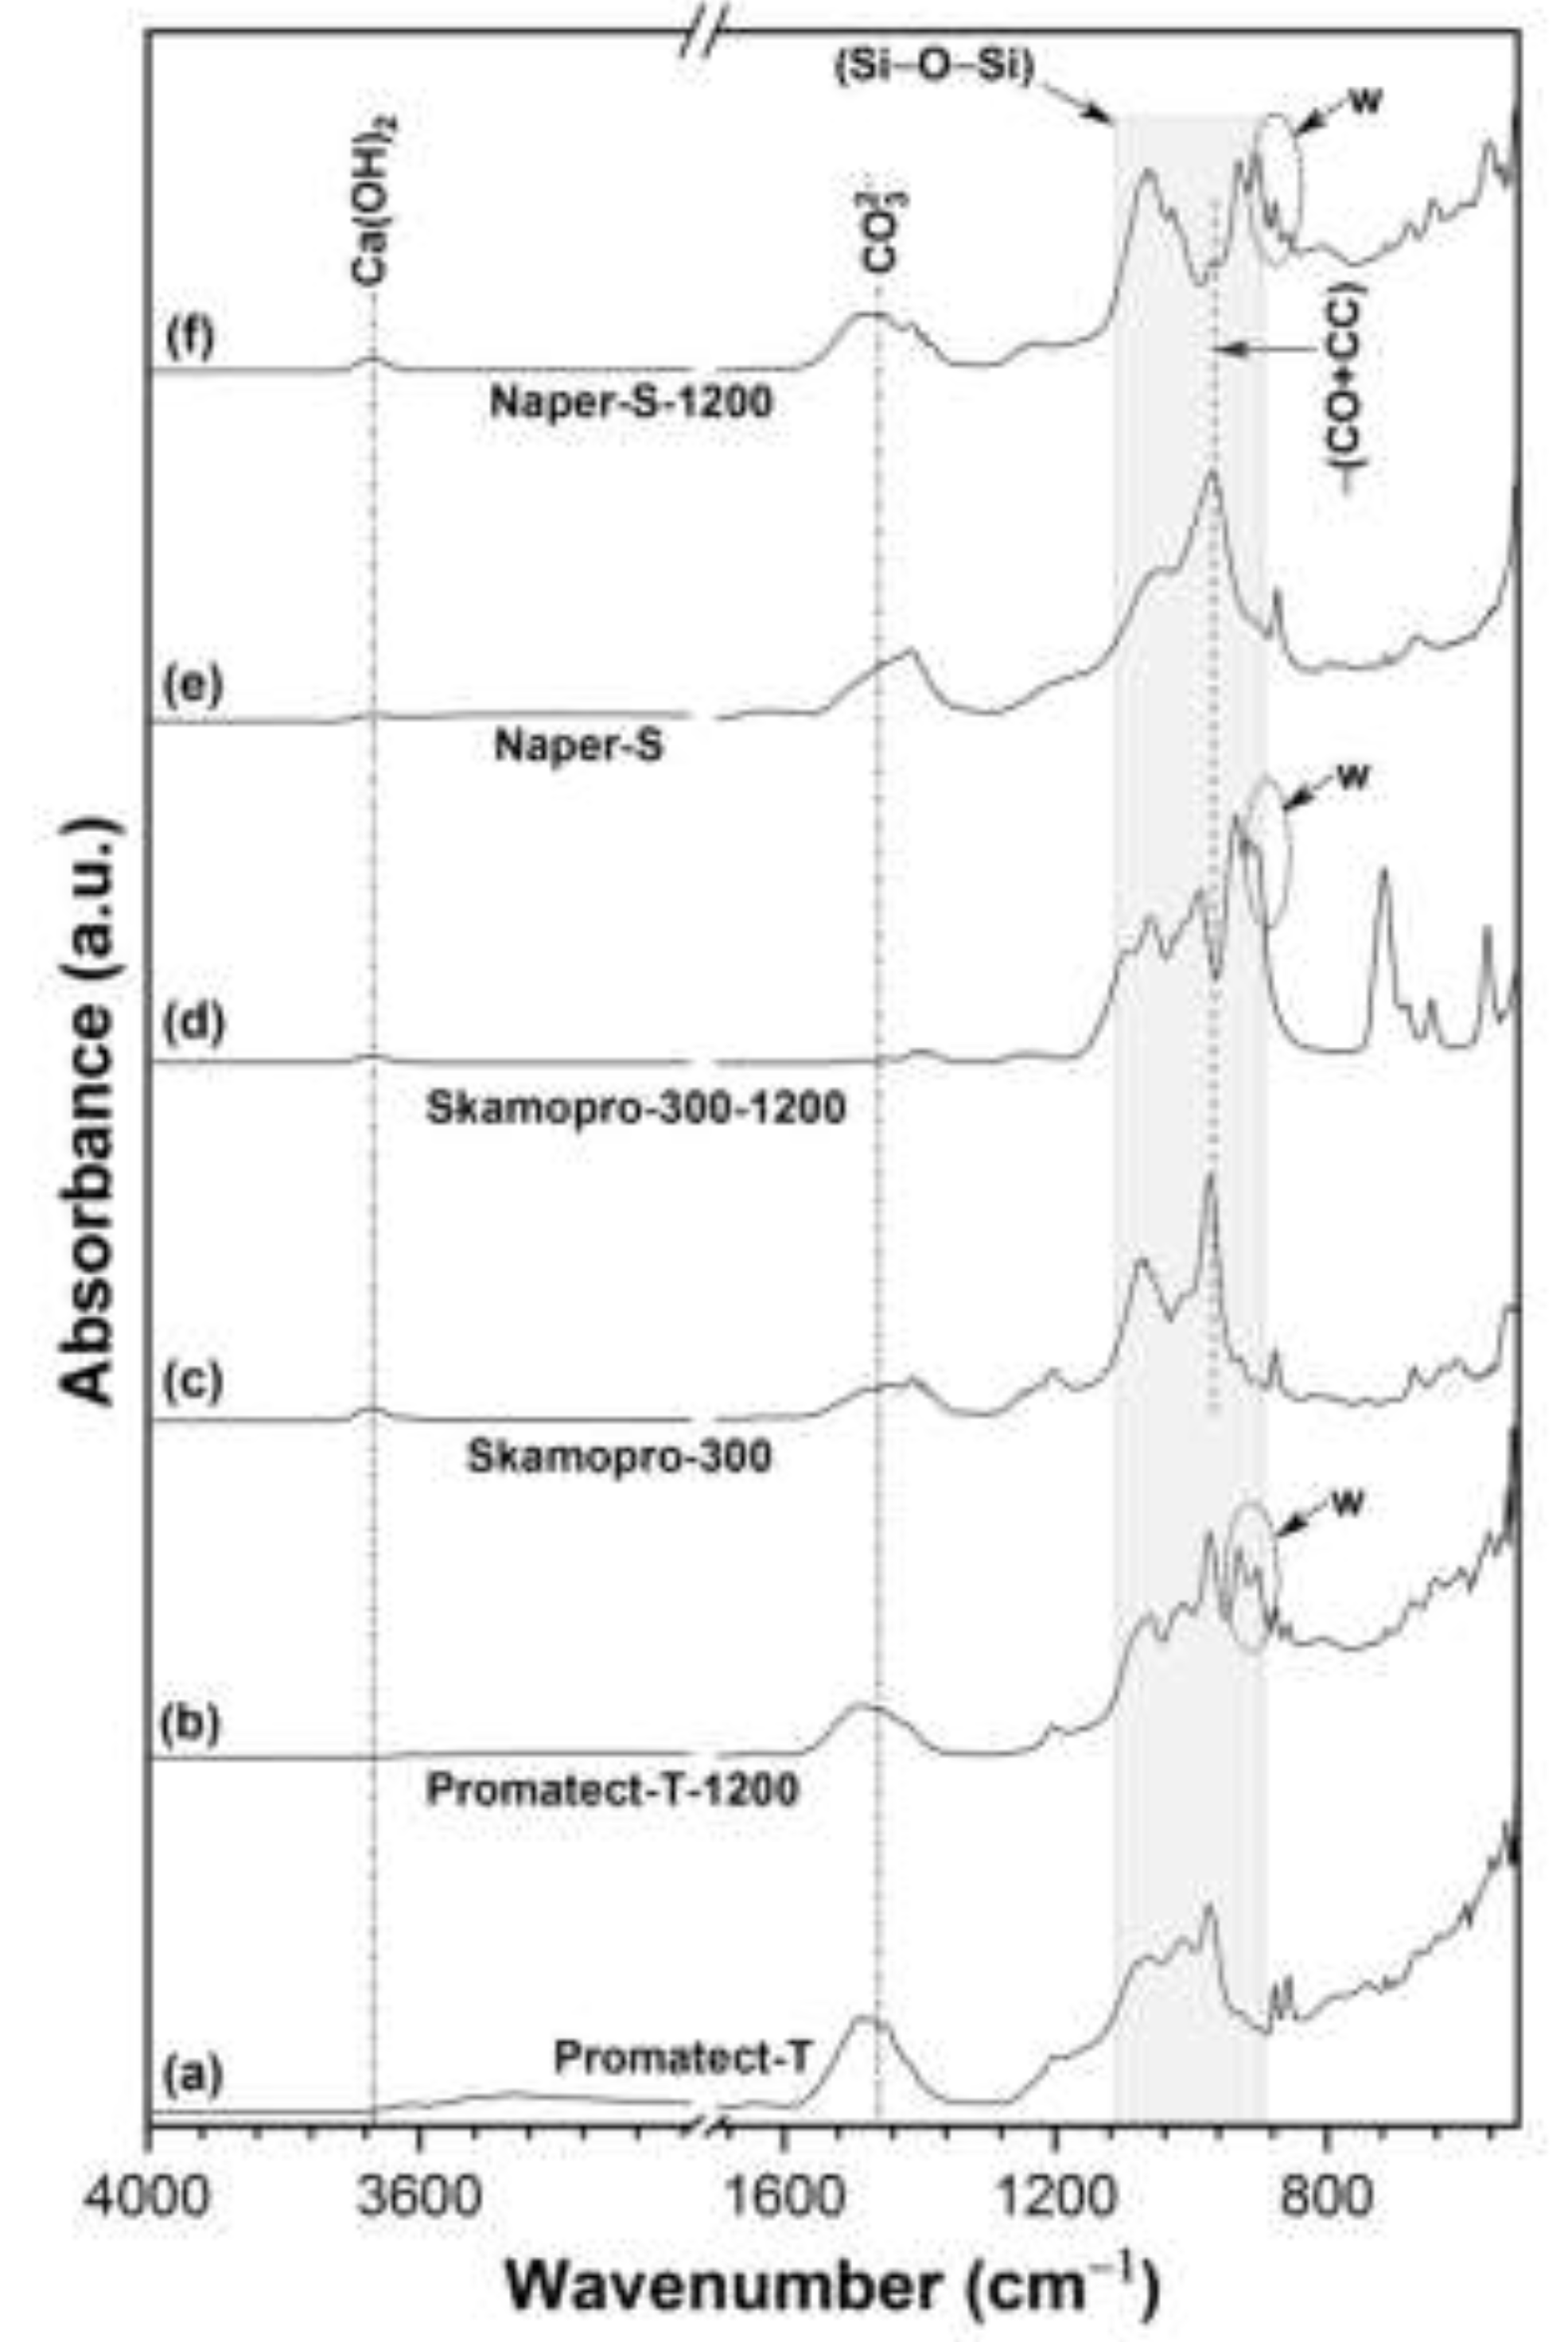
Figure 5.
SEM images of the fireboards as -received and heat treated at 1200 °C.
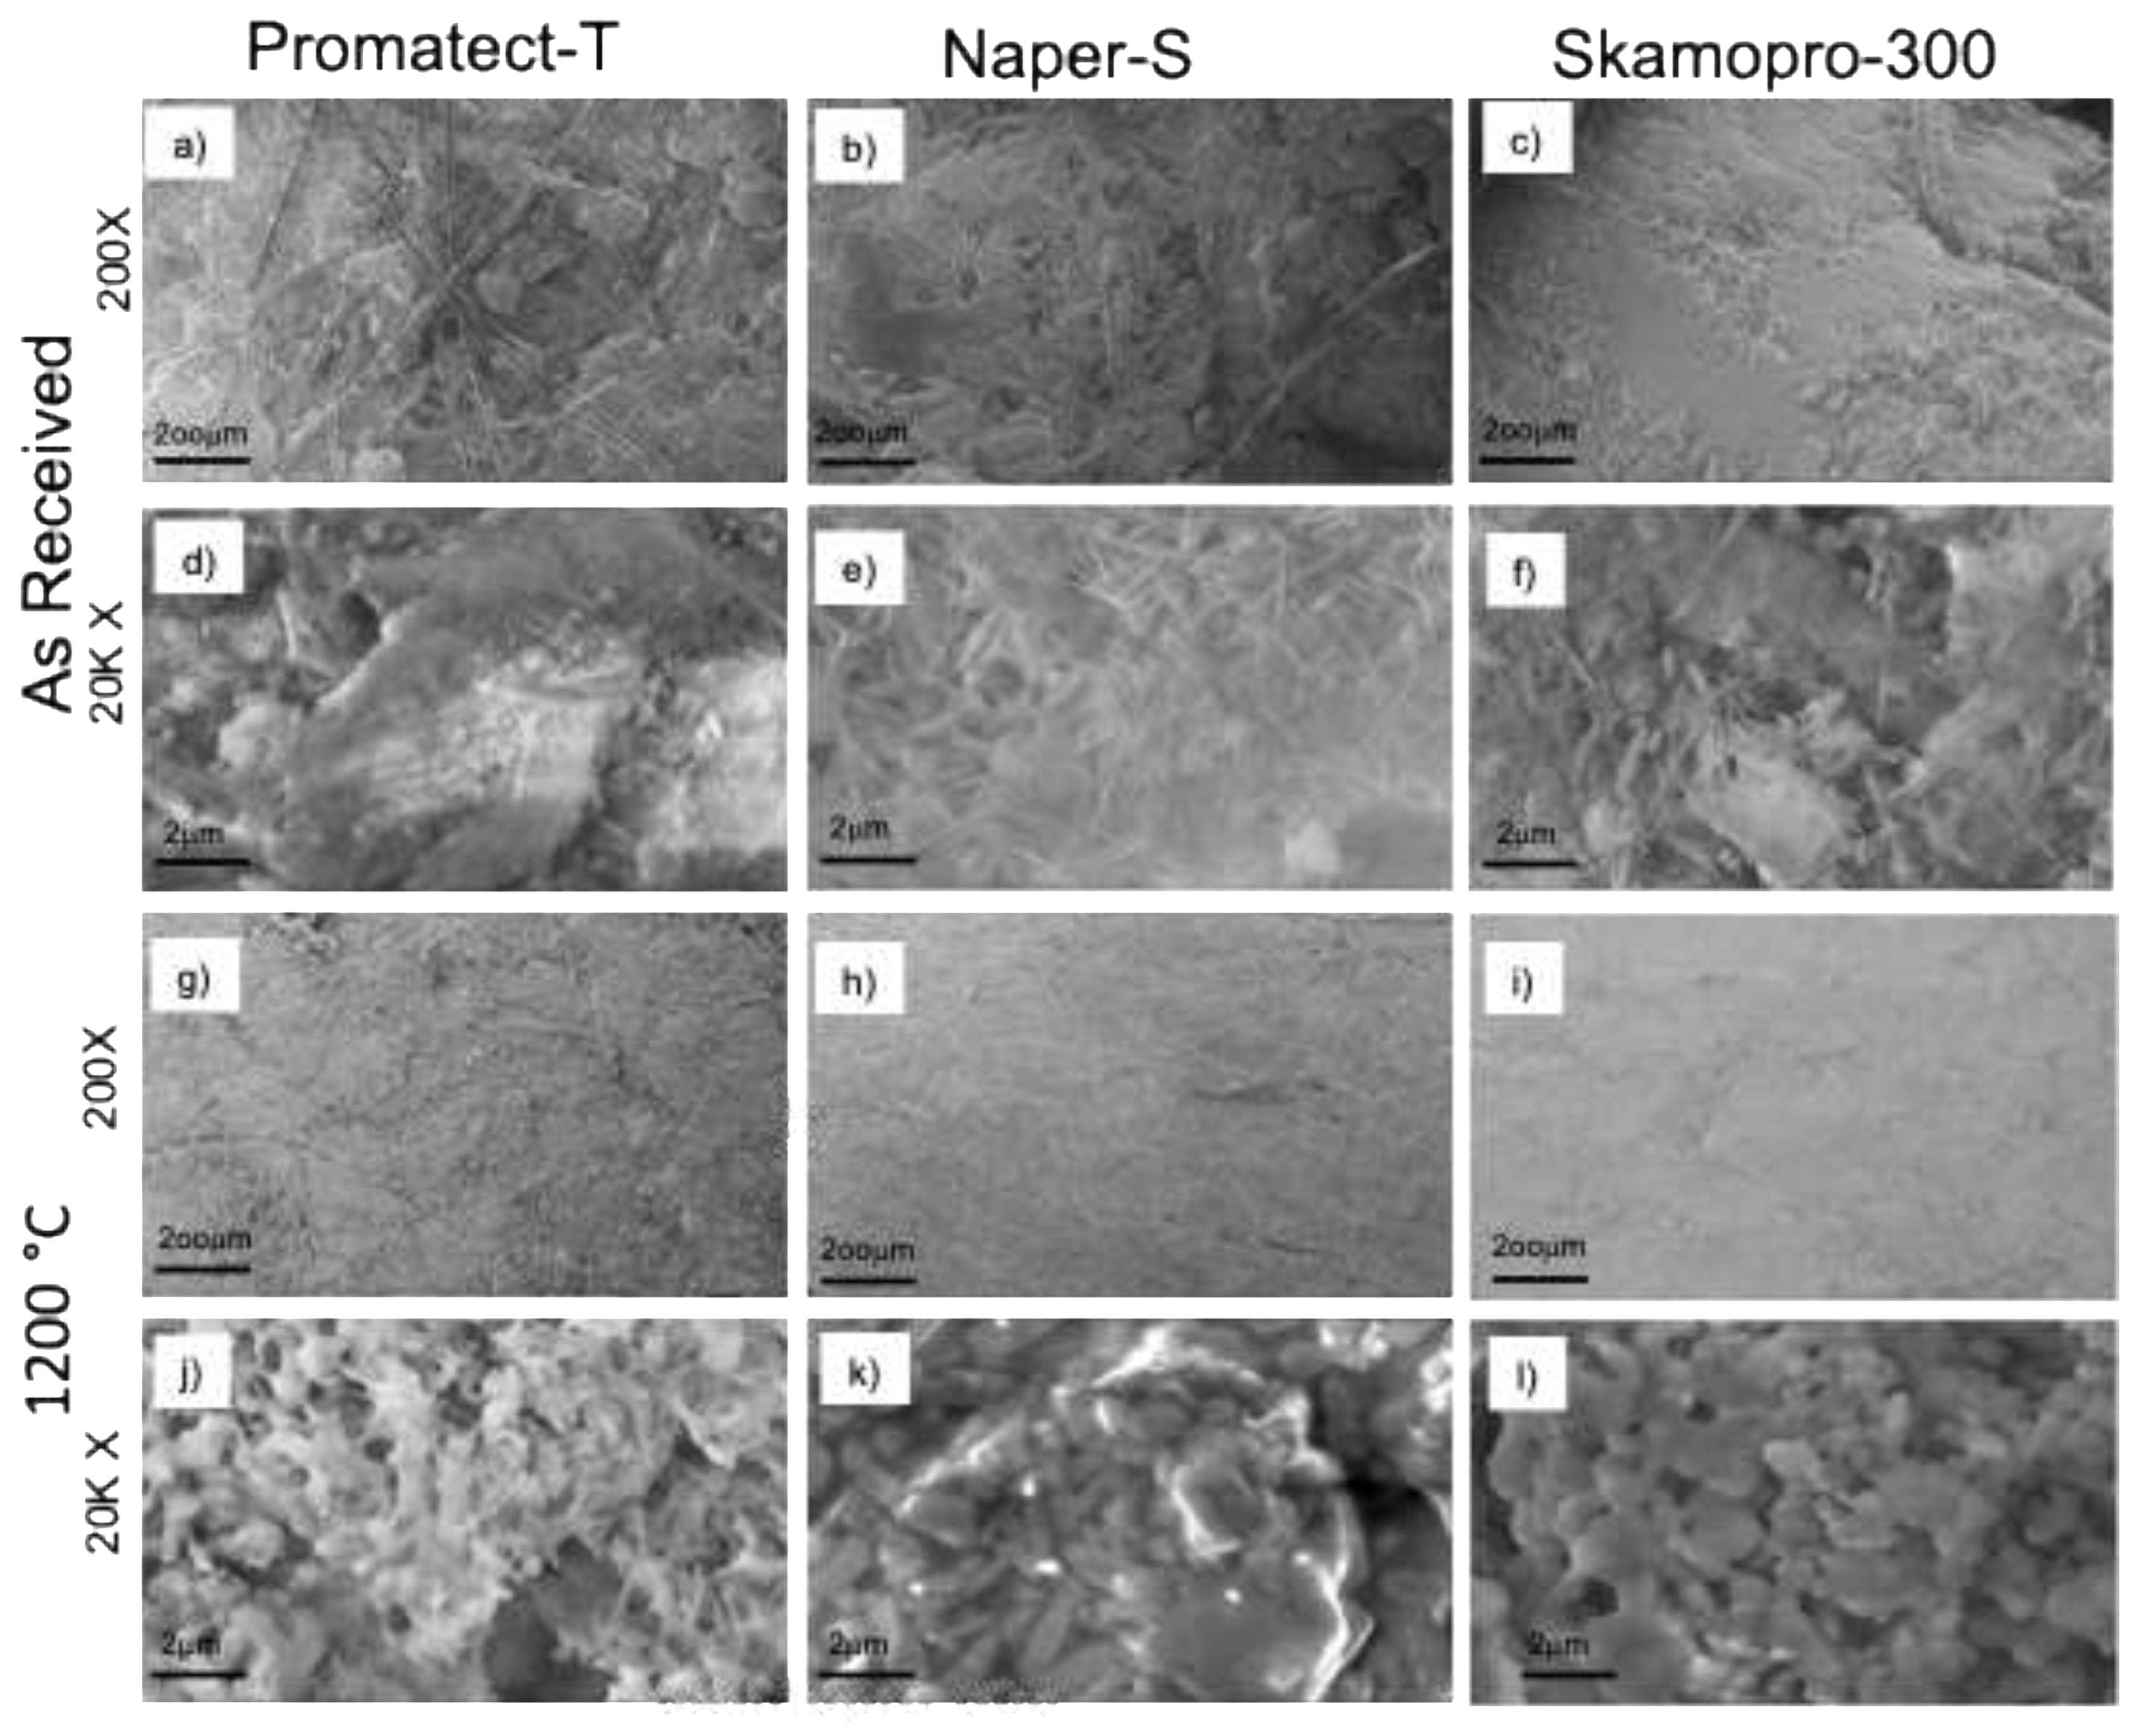
Figure 6.
Plot of the time-temperature curve of all three samples,.
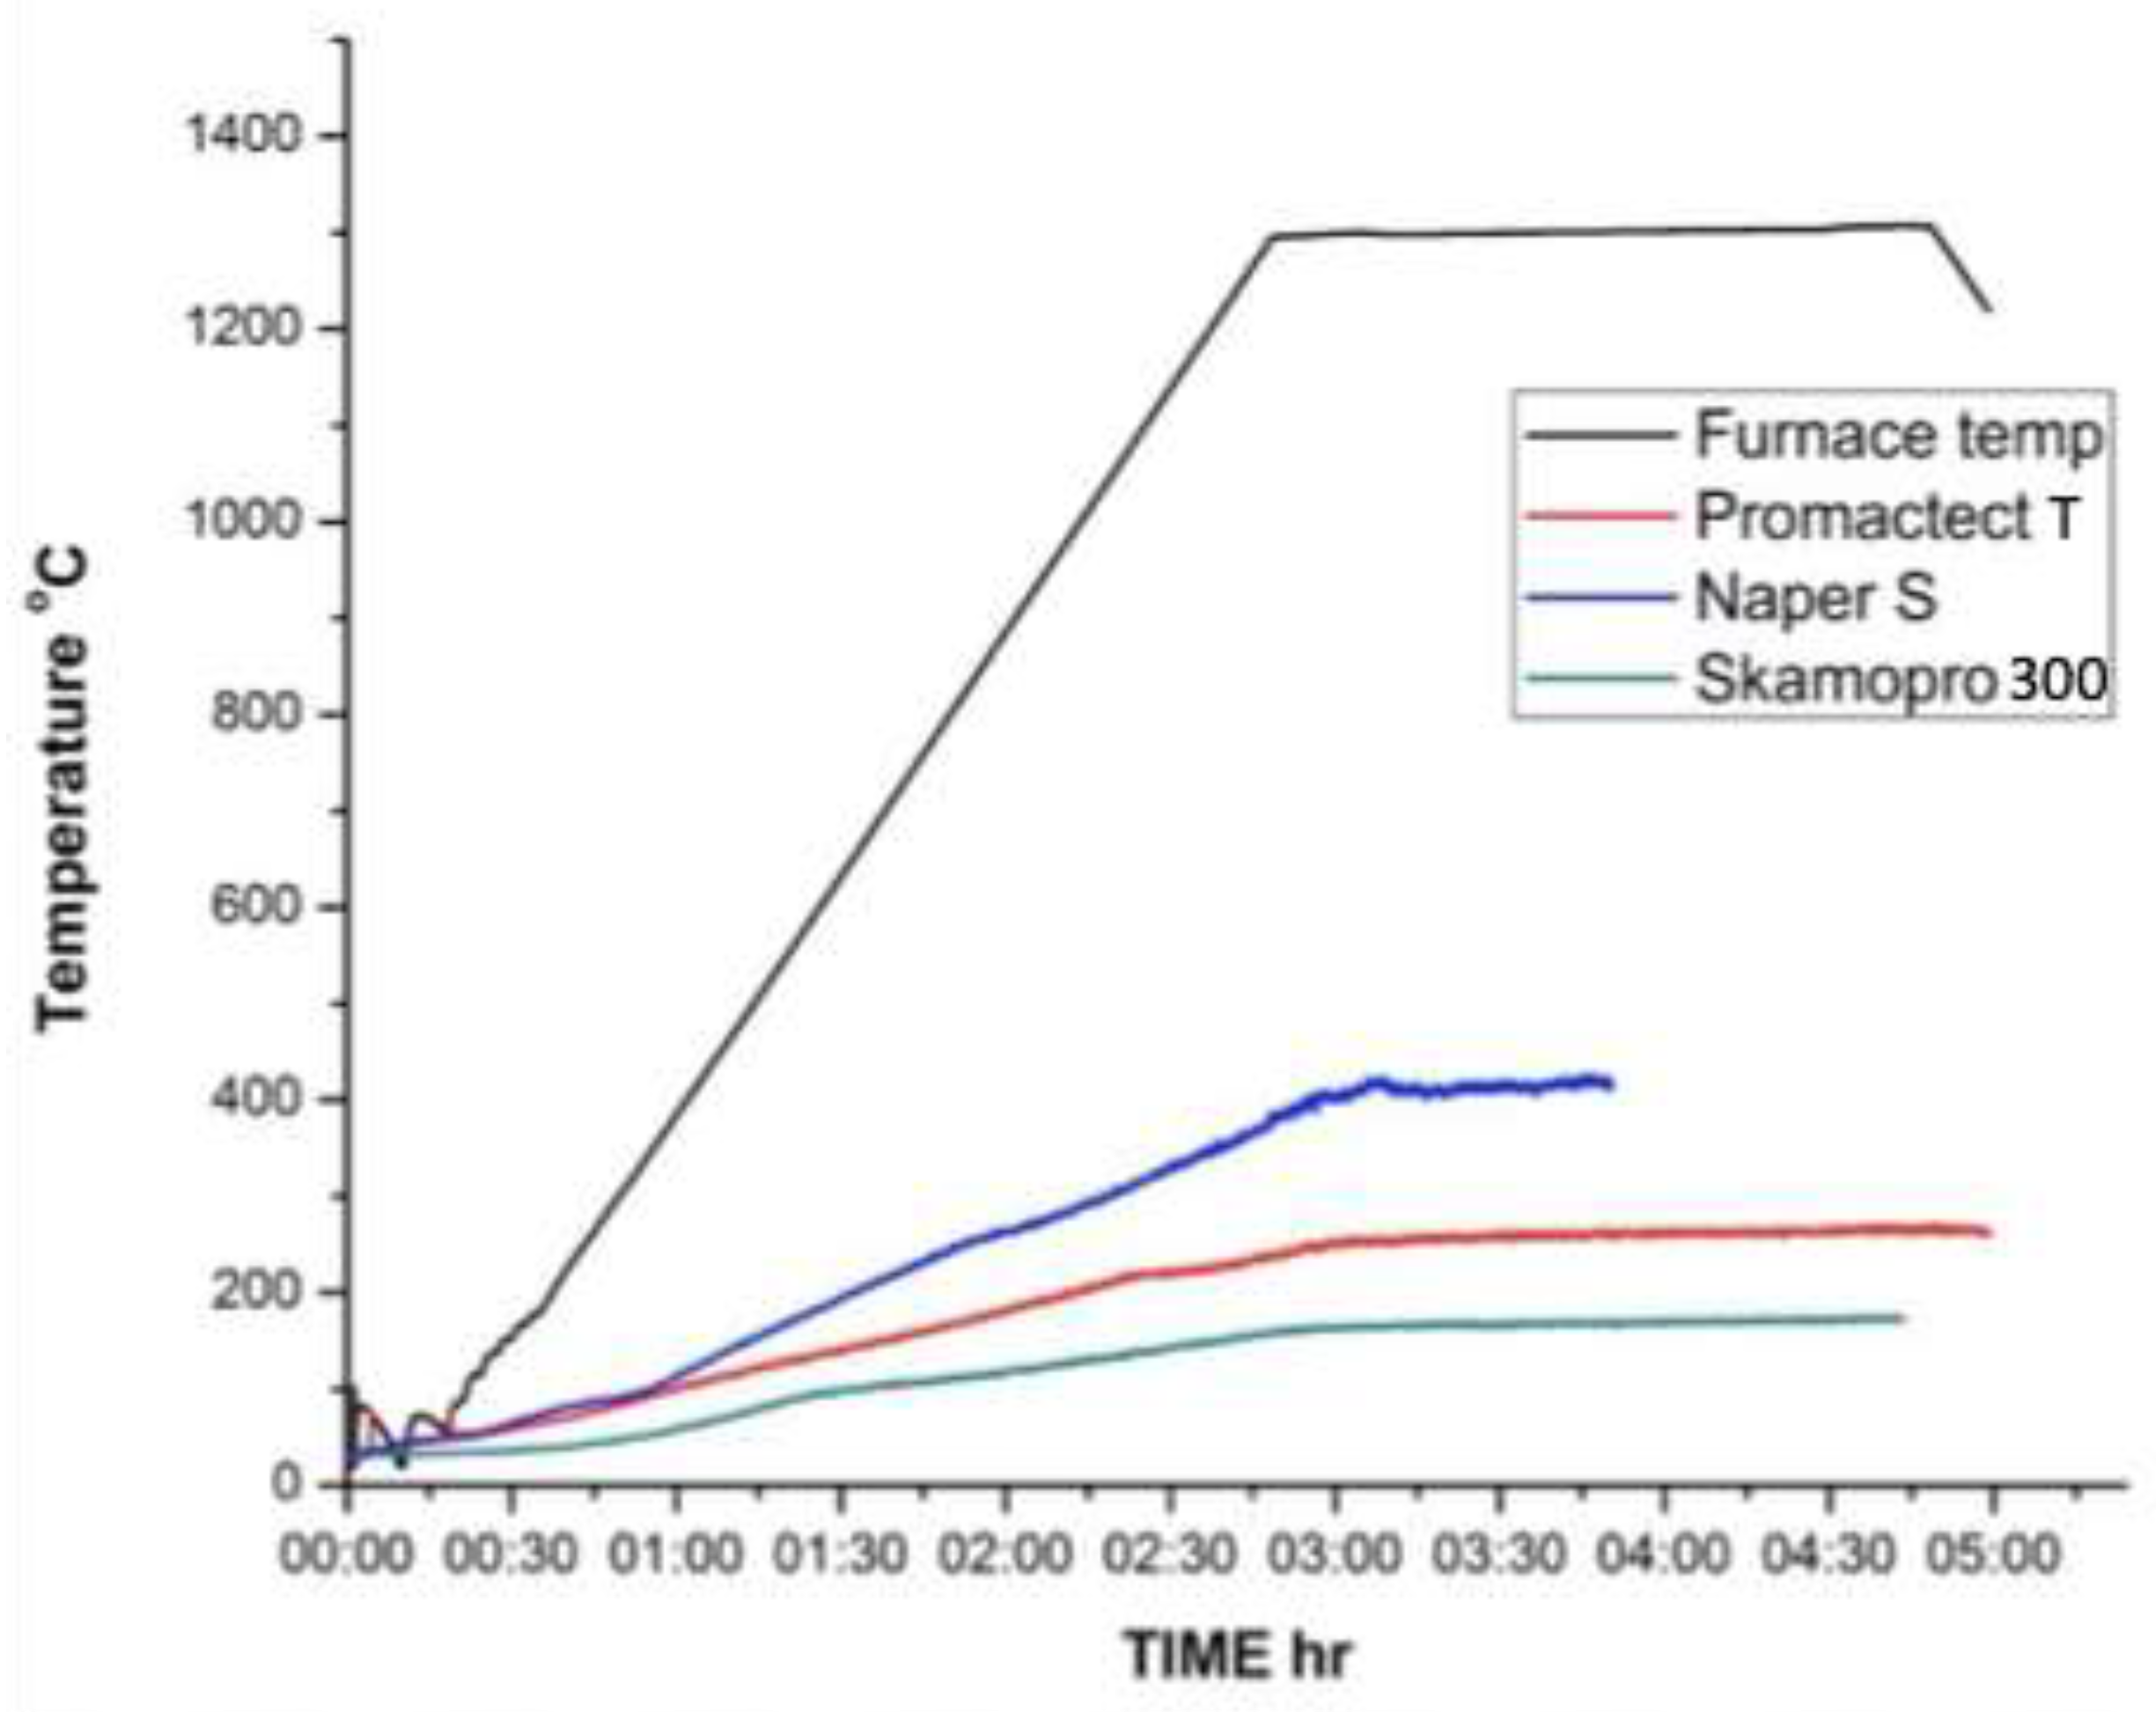
Figure 7.
Photographs of the exposed surface of the fireproof board before and after the fire test.
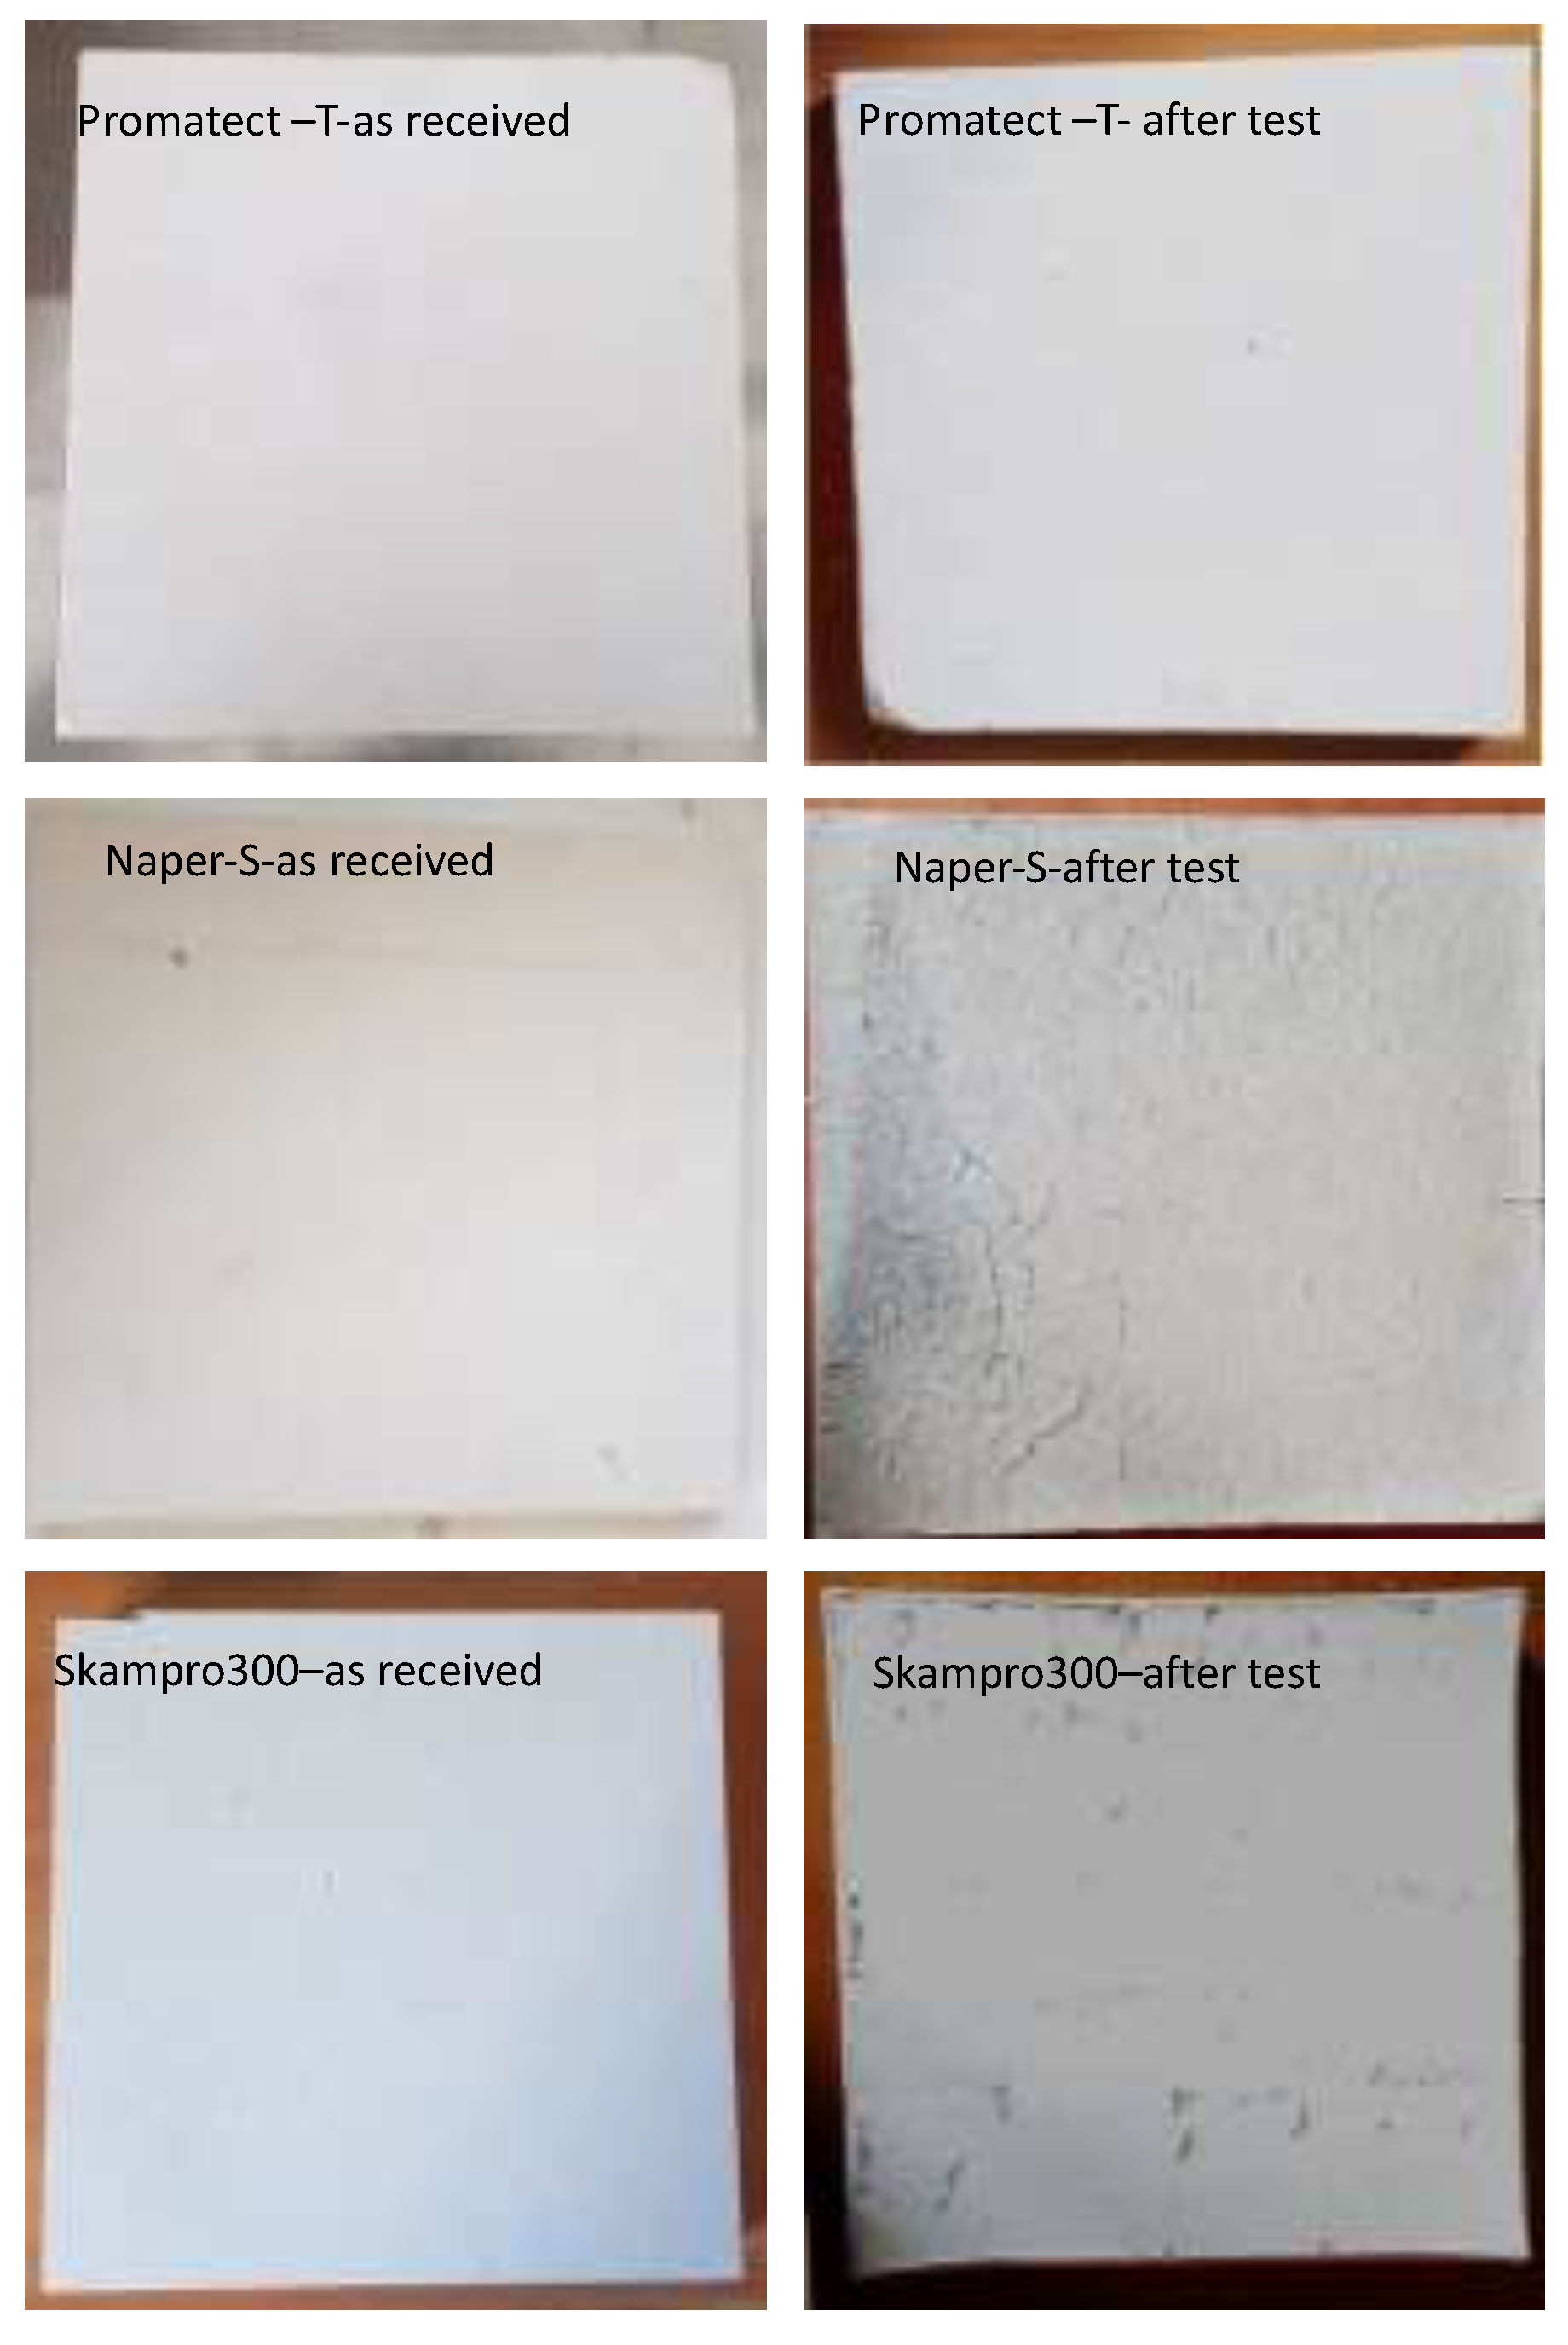
Figure 8.
Scheme for the heat exchange model calculation.
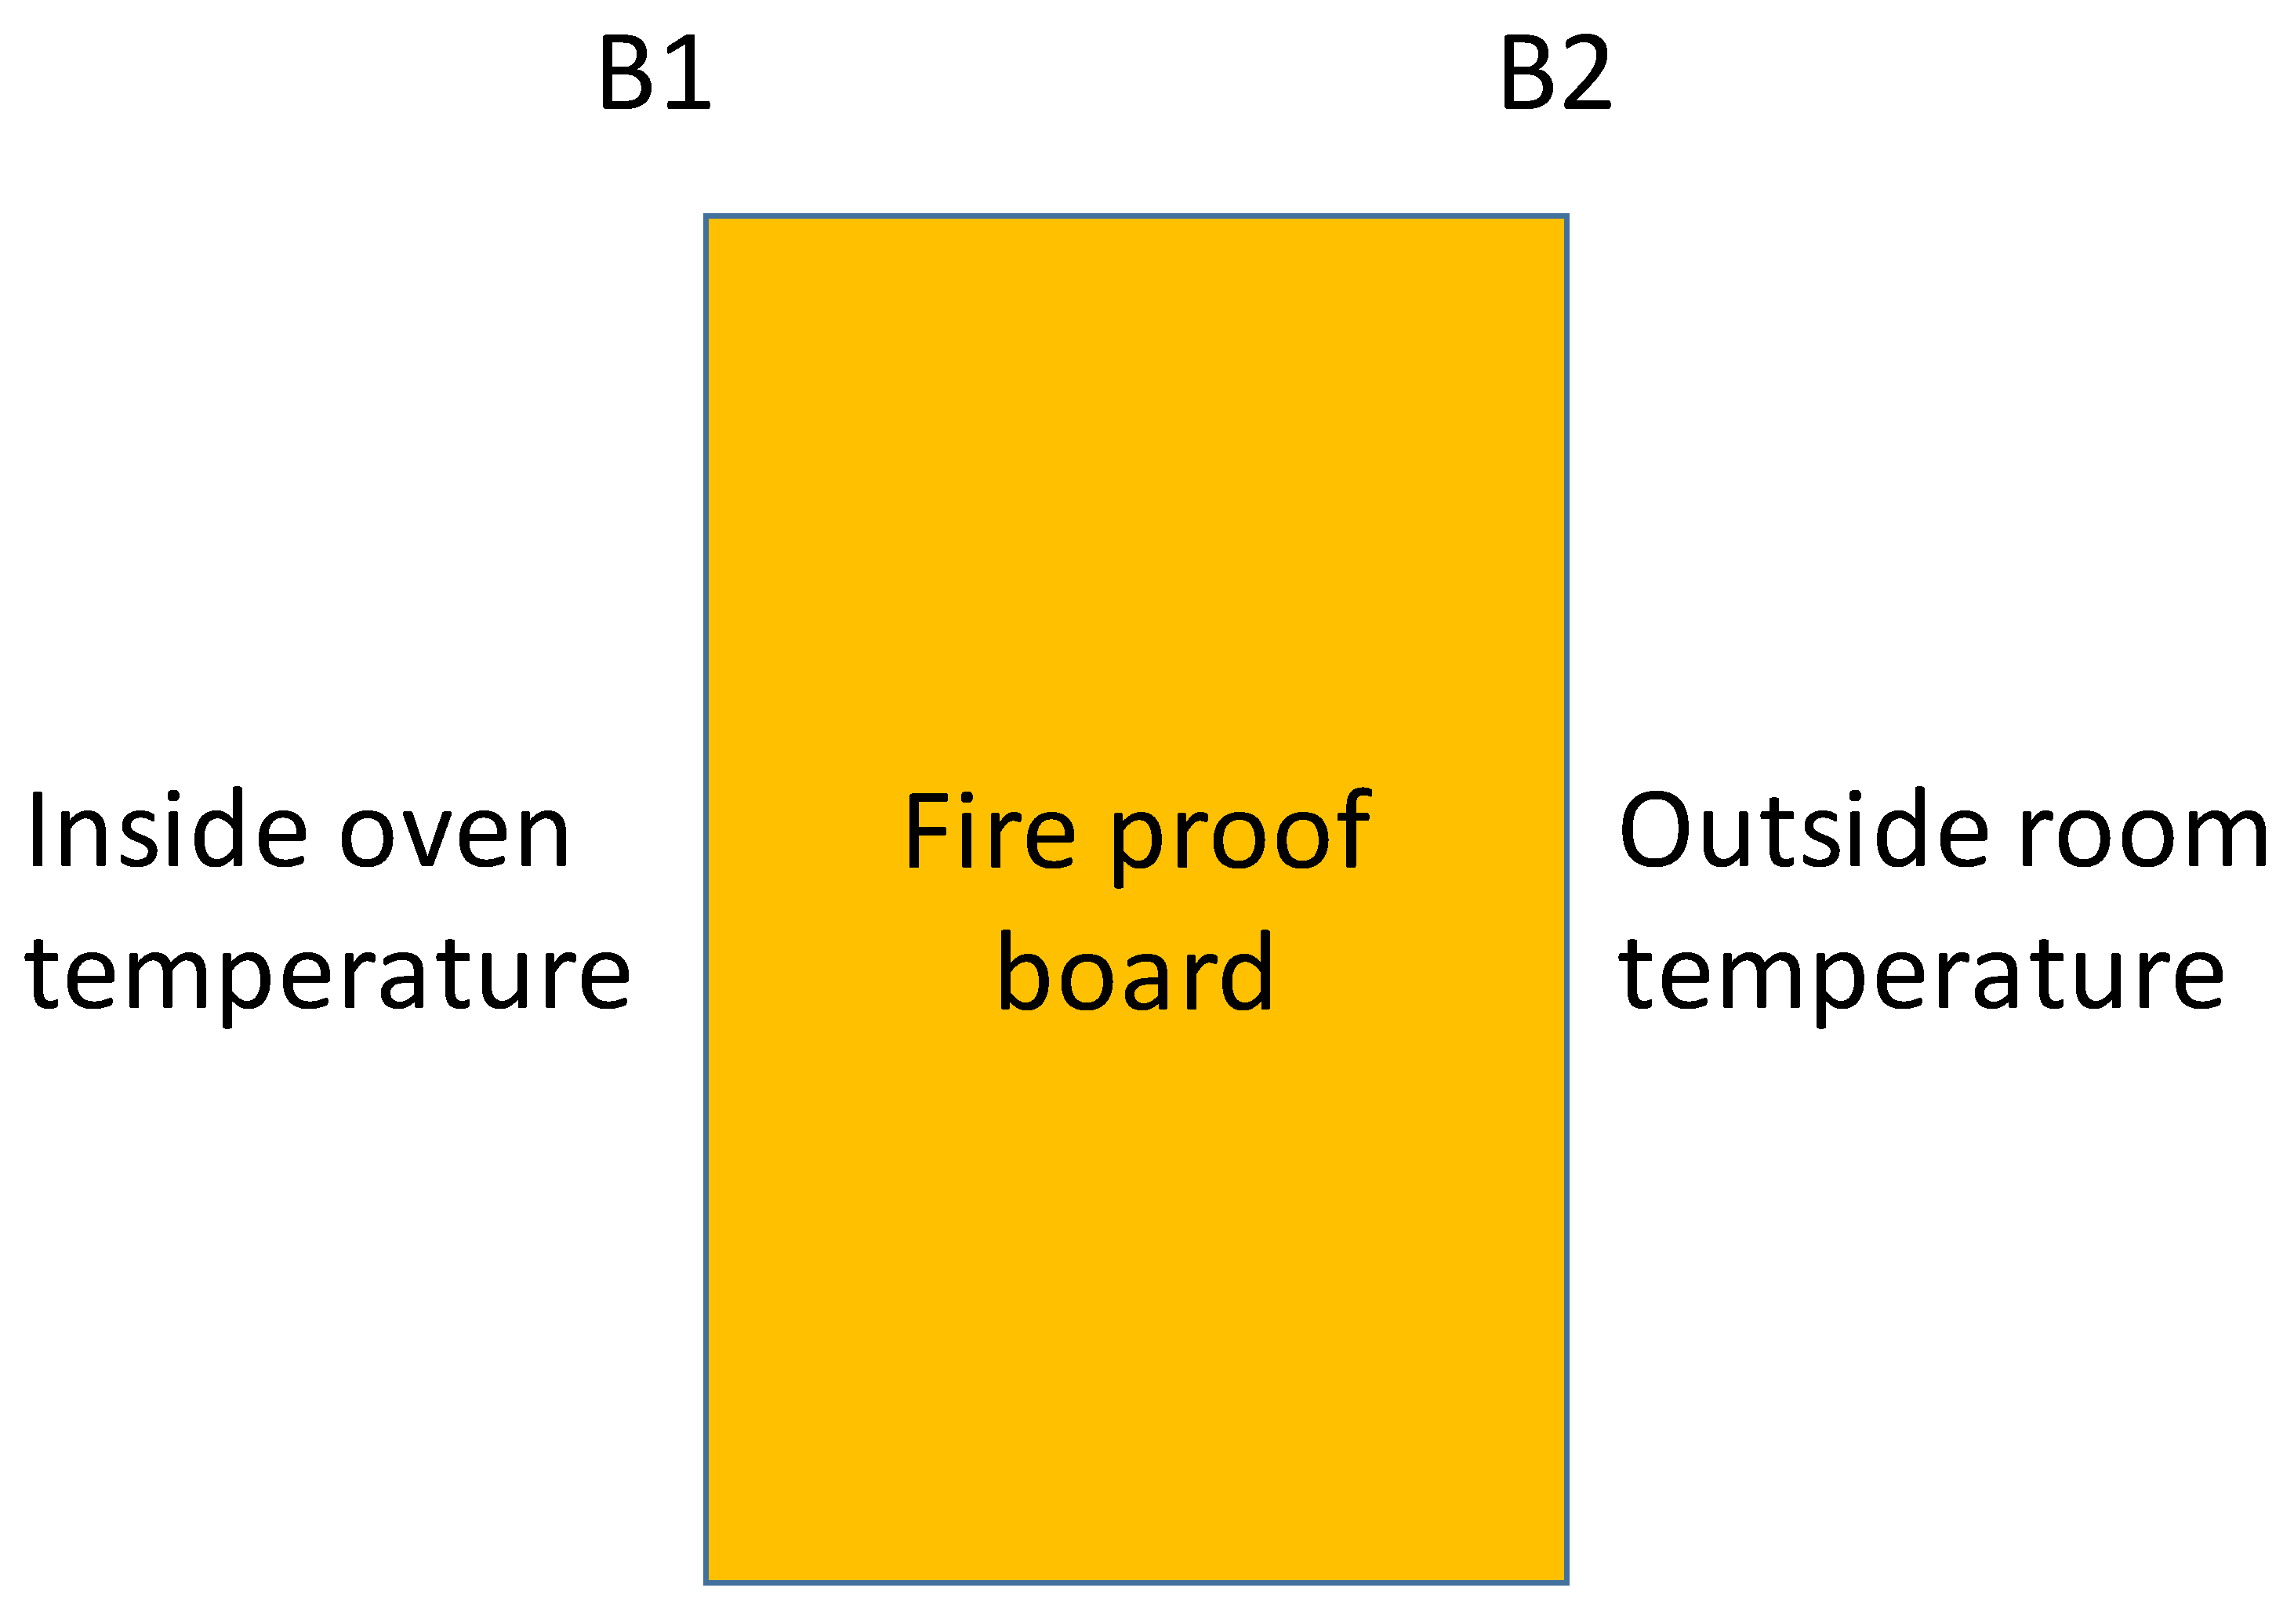
Figure 9.
evolution of convective heat transfer coefficients as a function of temperature.
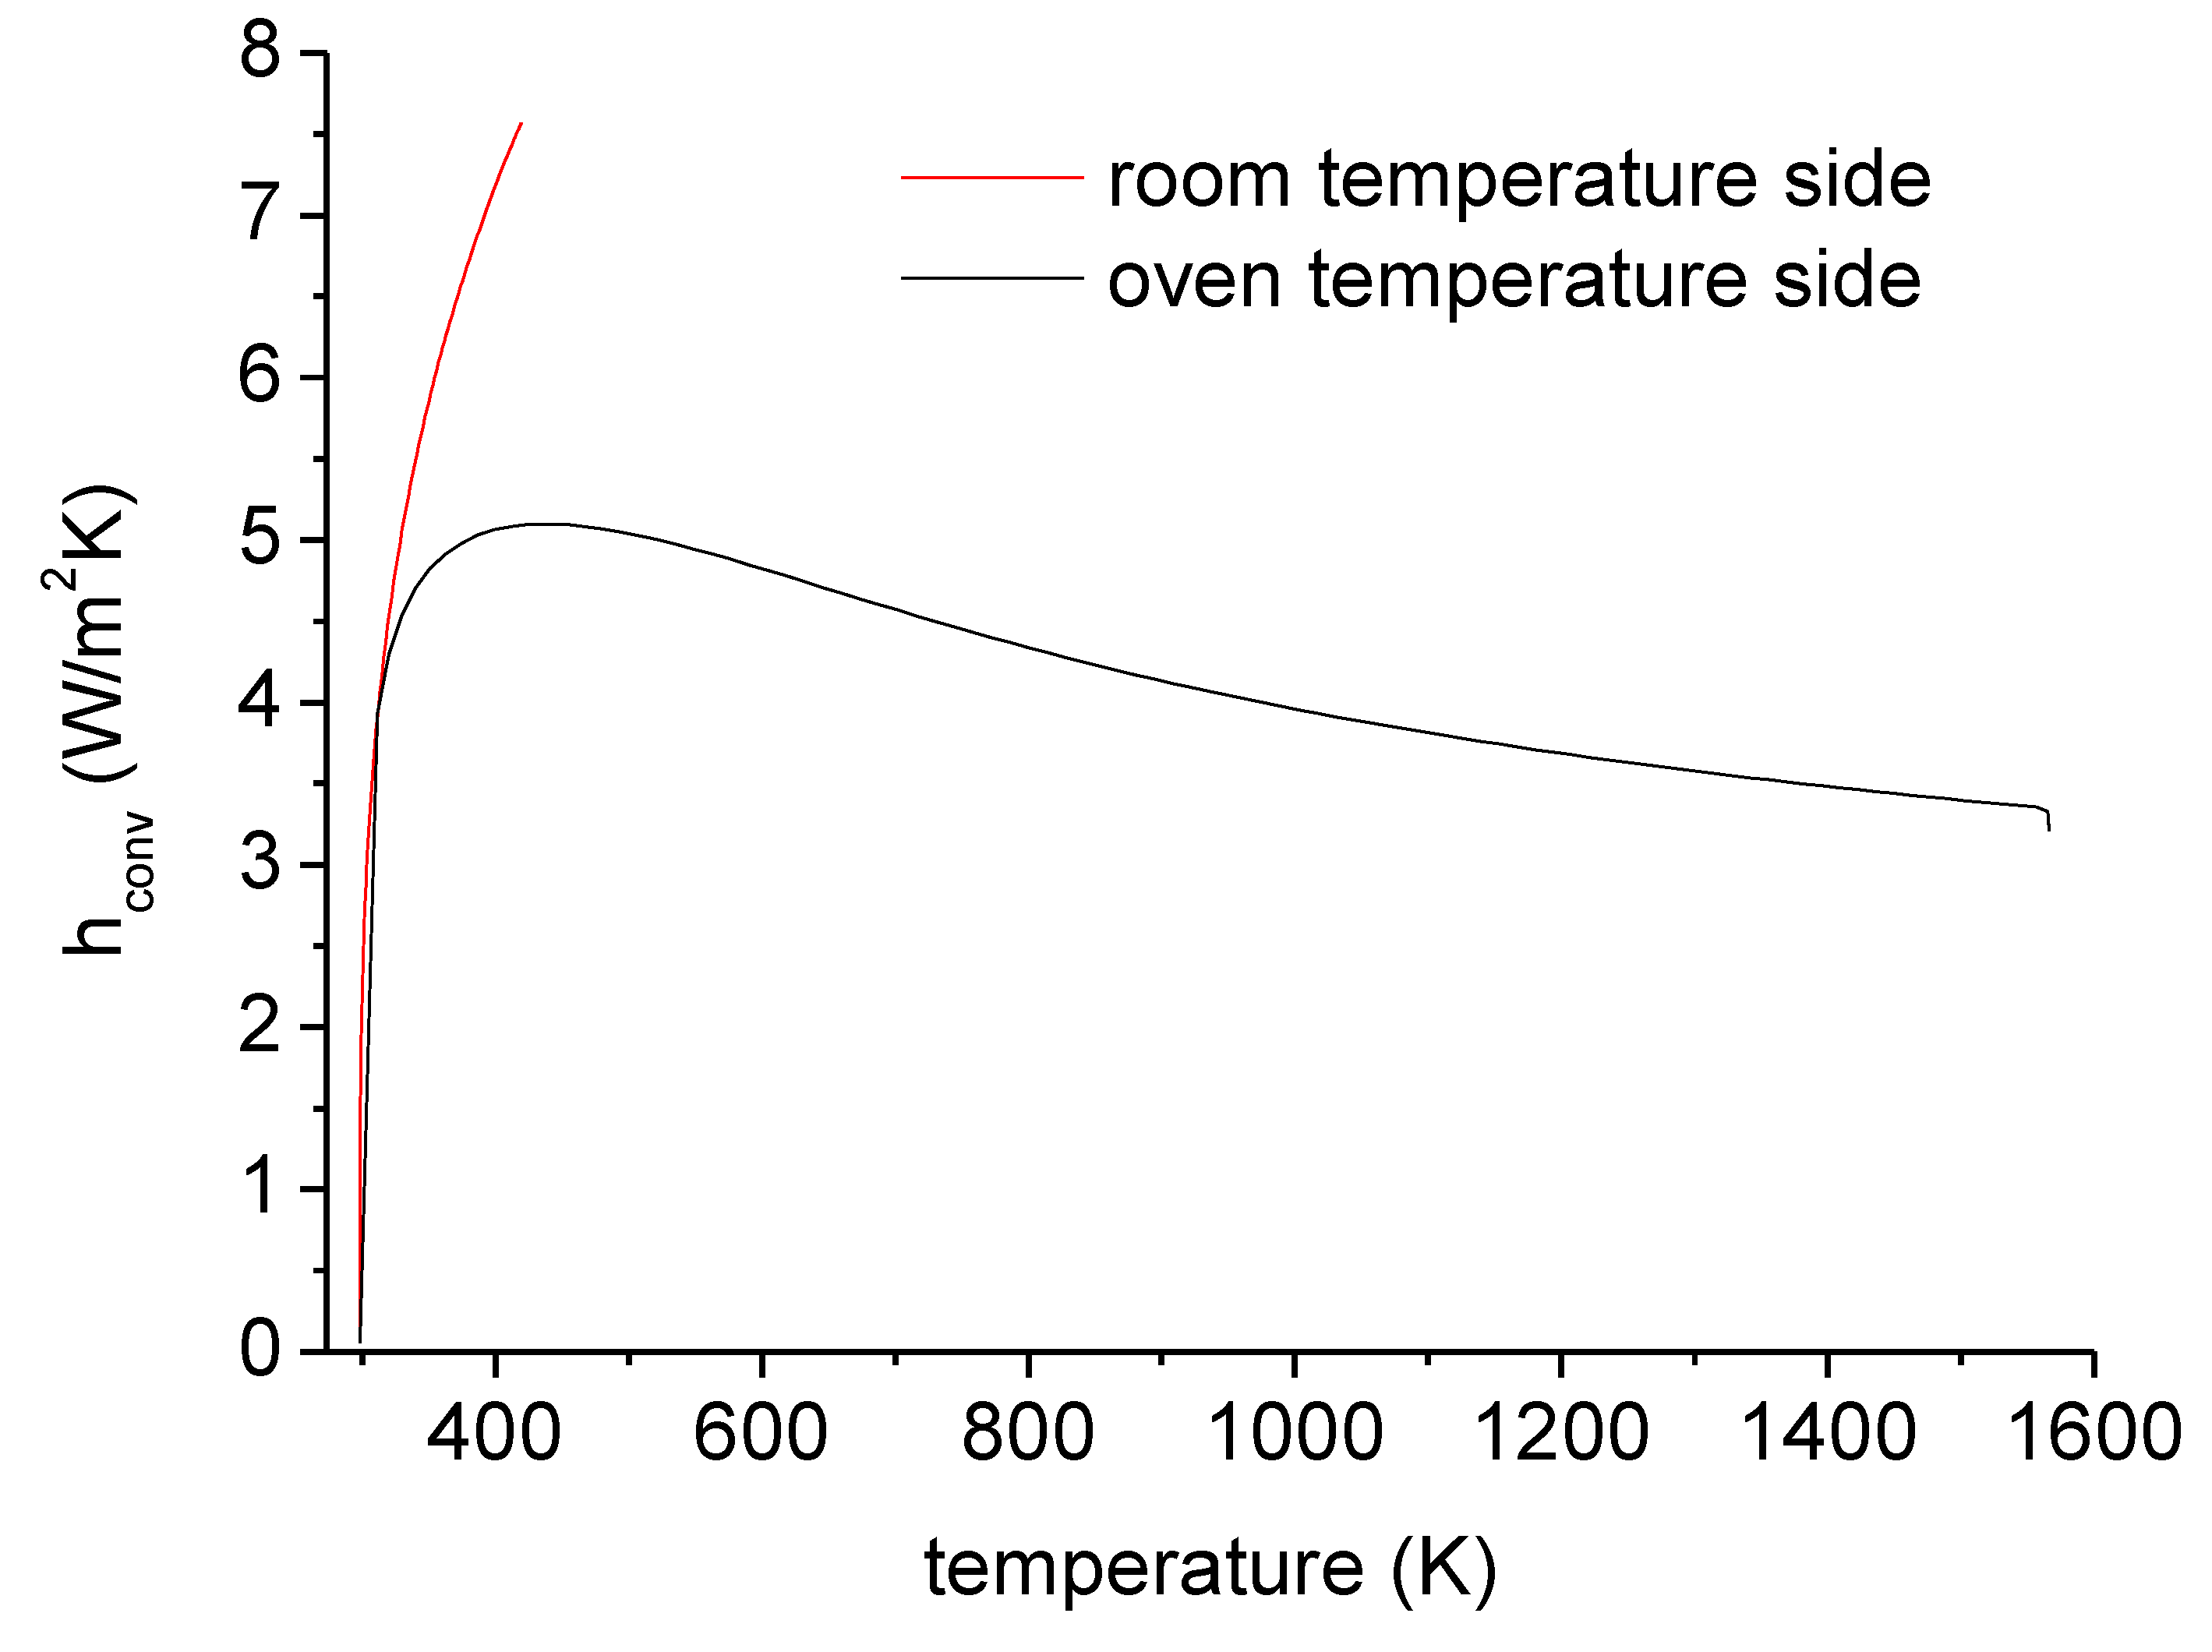
Figure 10.
Evolution of convective and radiative heat flux as a function of time.
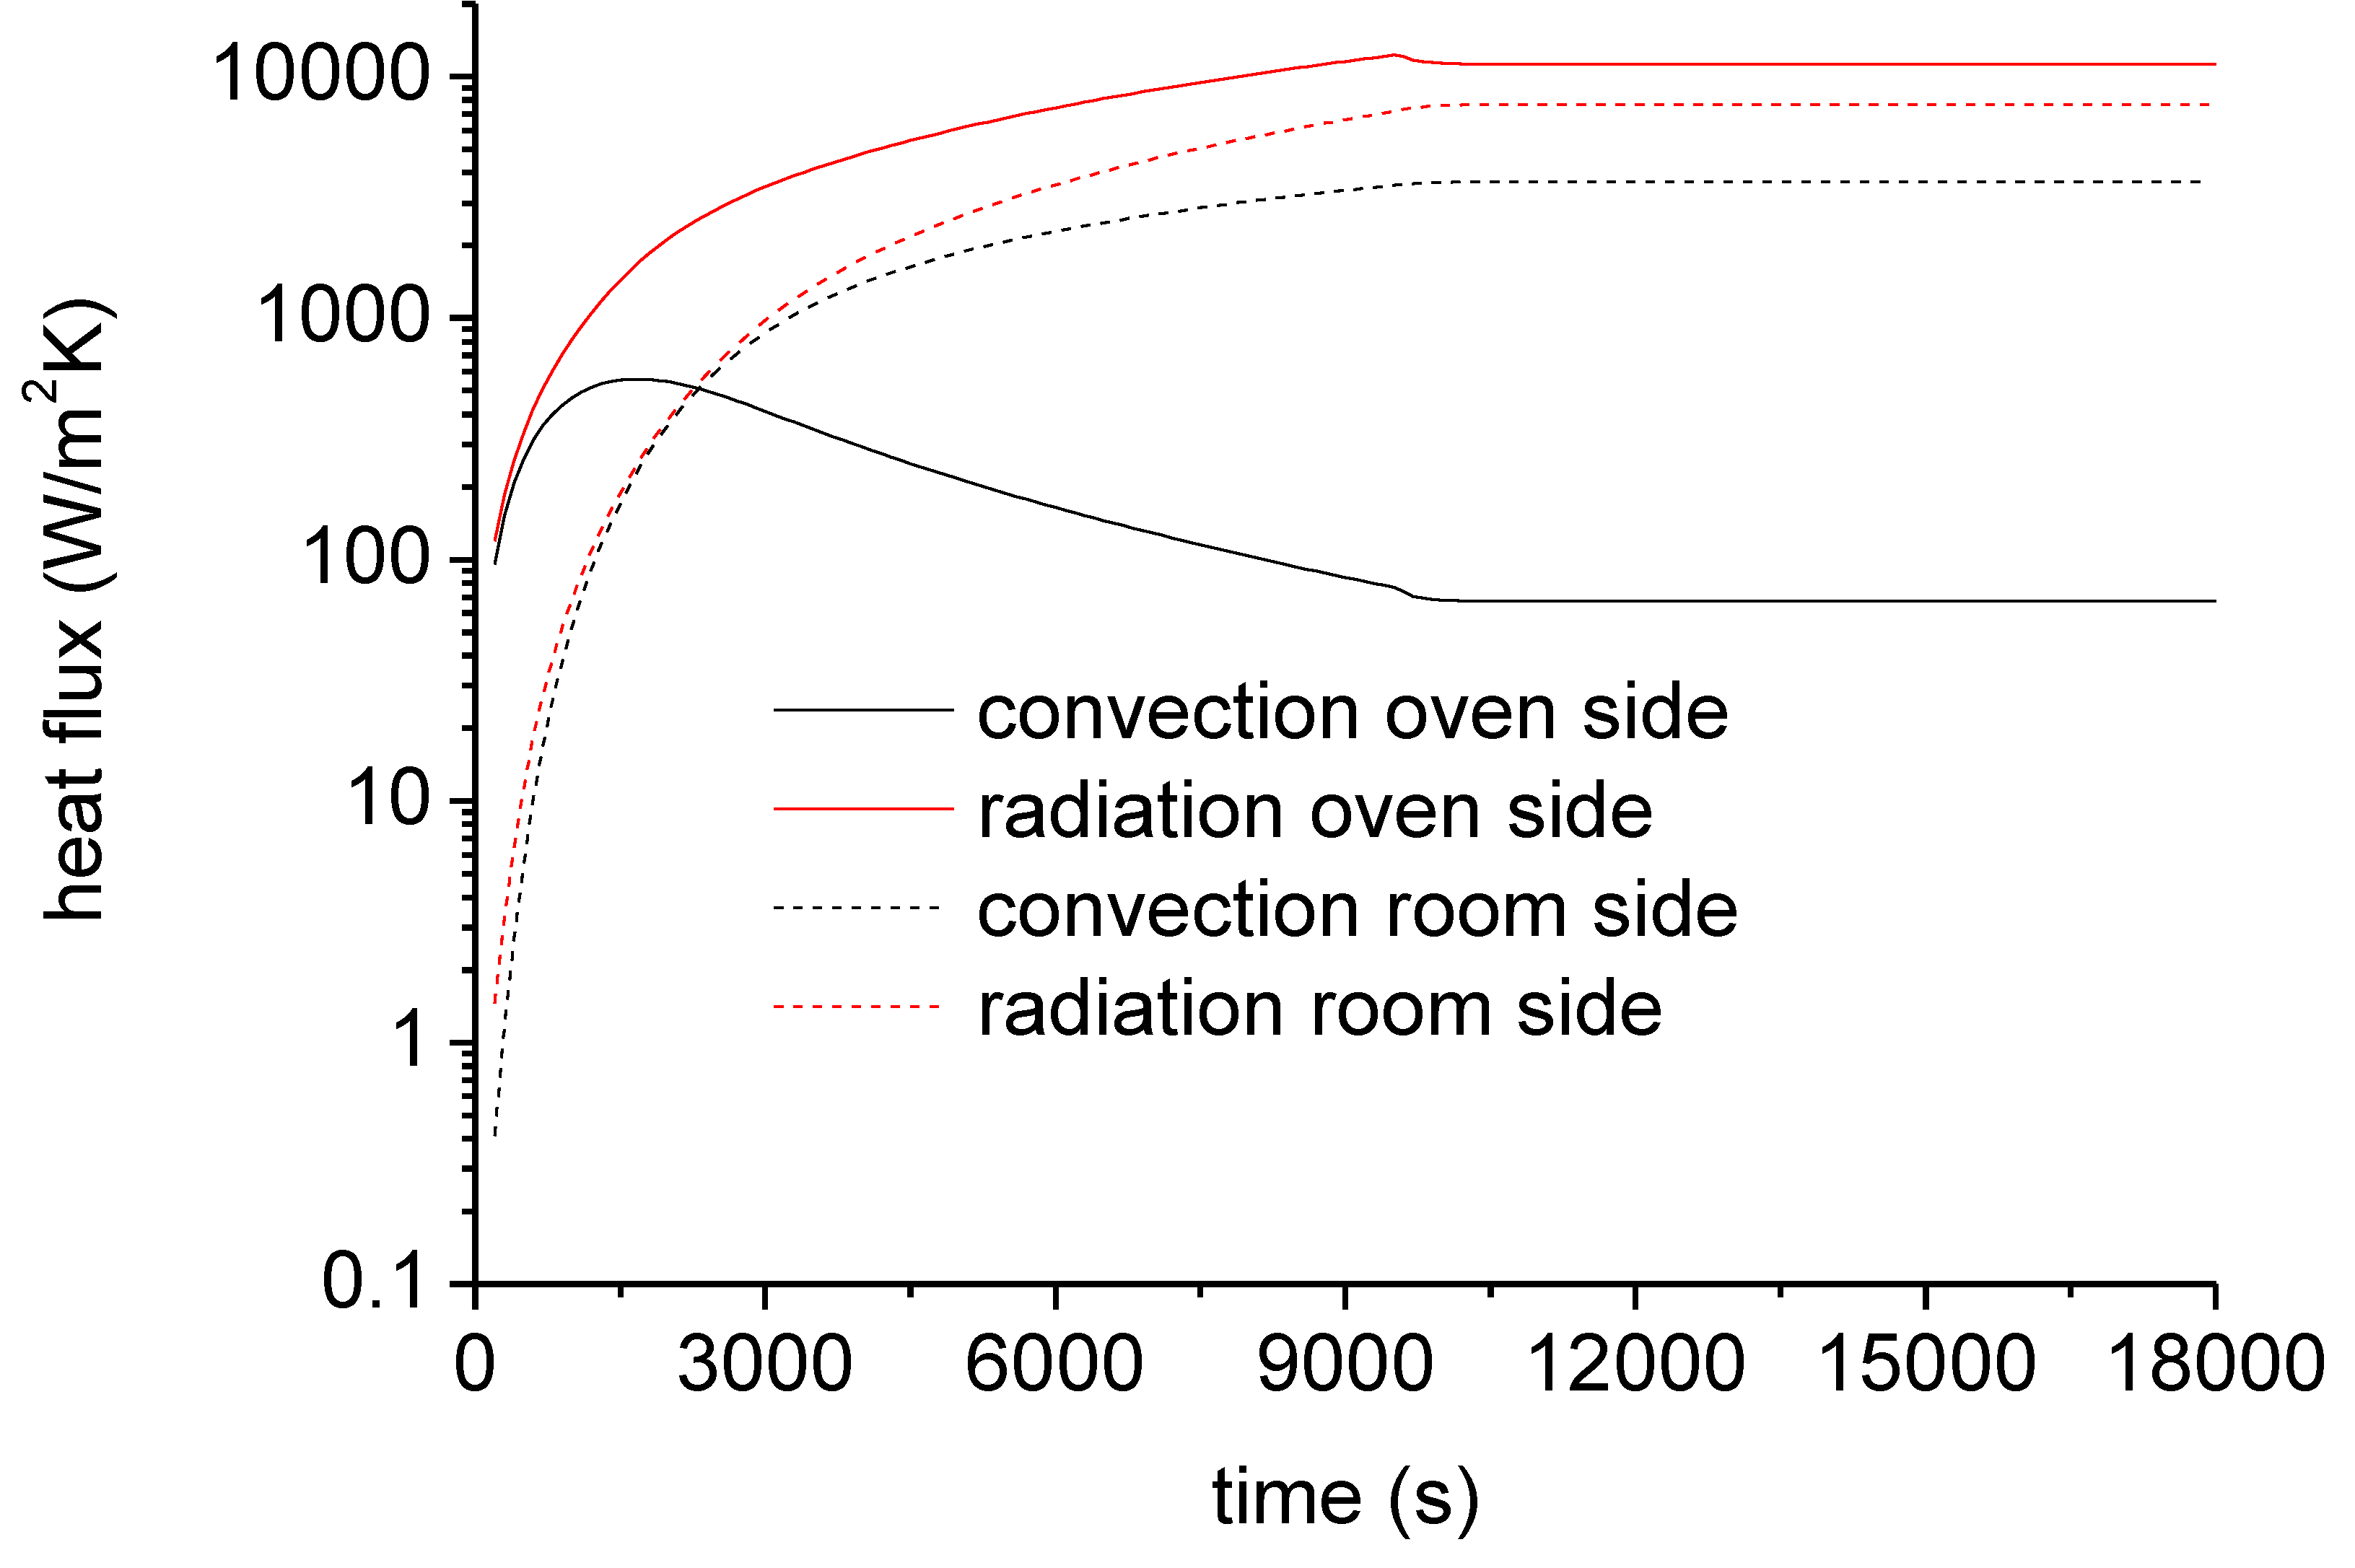
Figure 11.
comparison between experimental and FEM simulation.
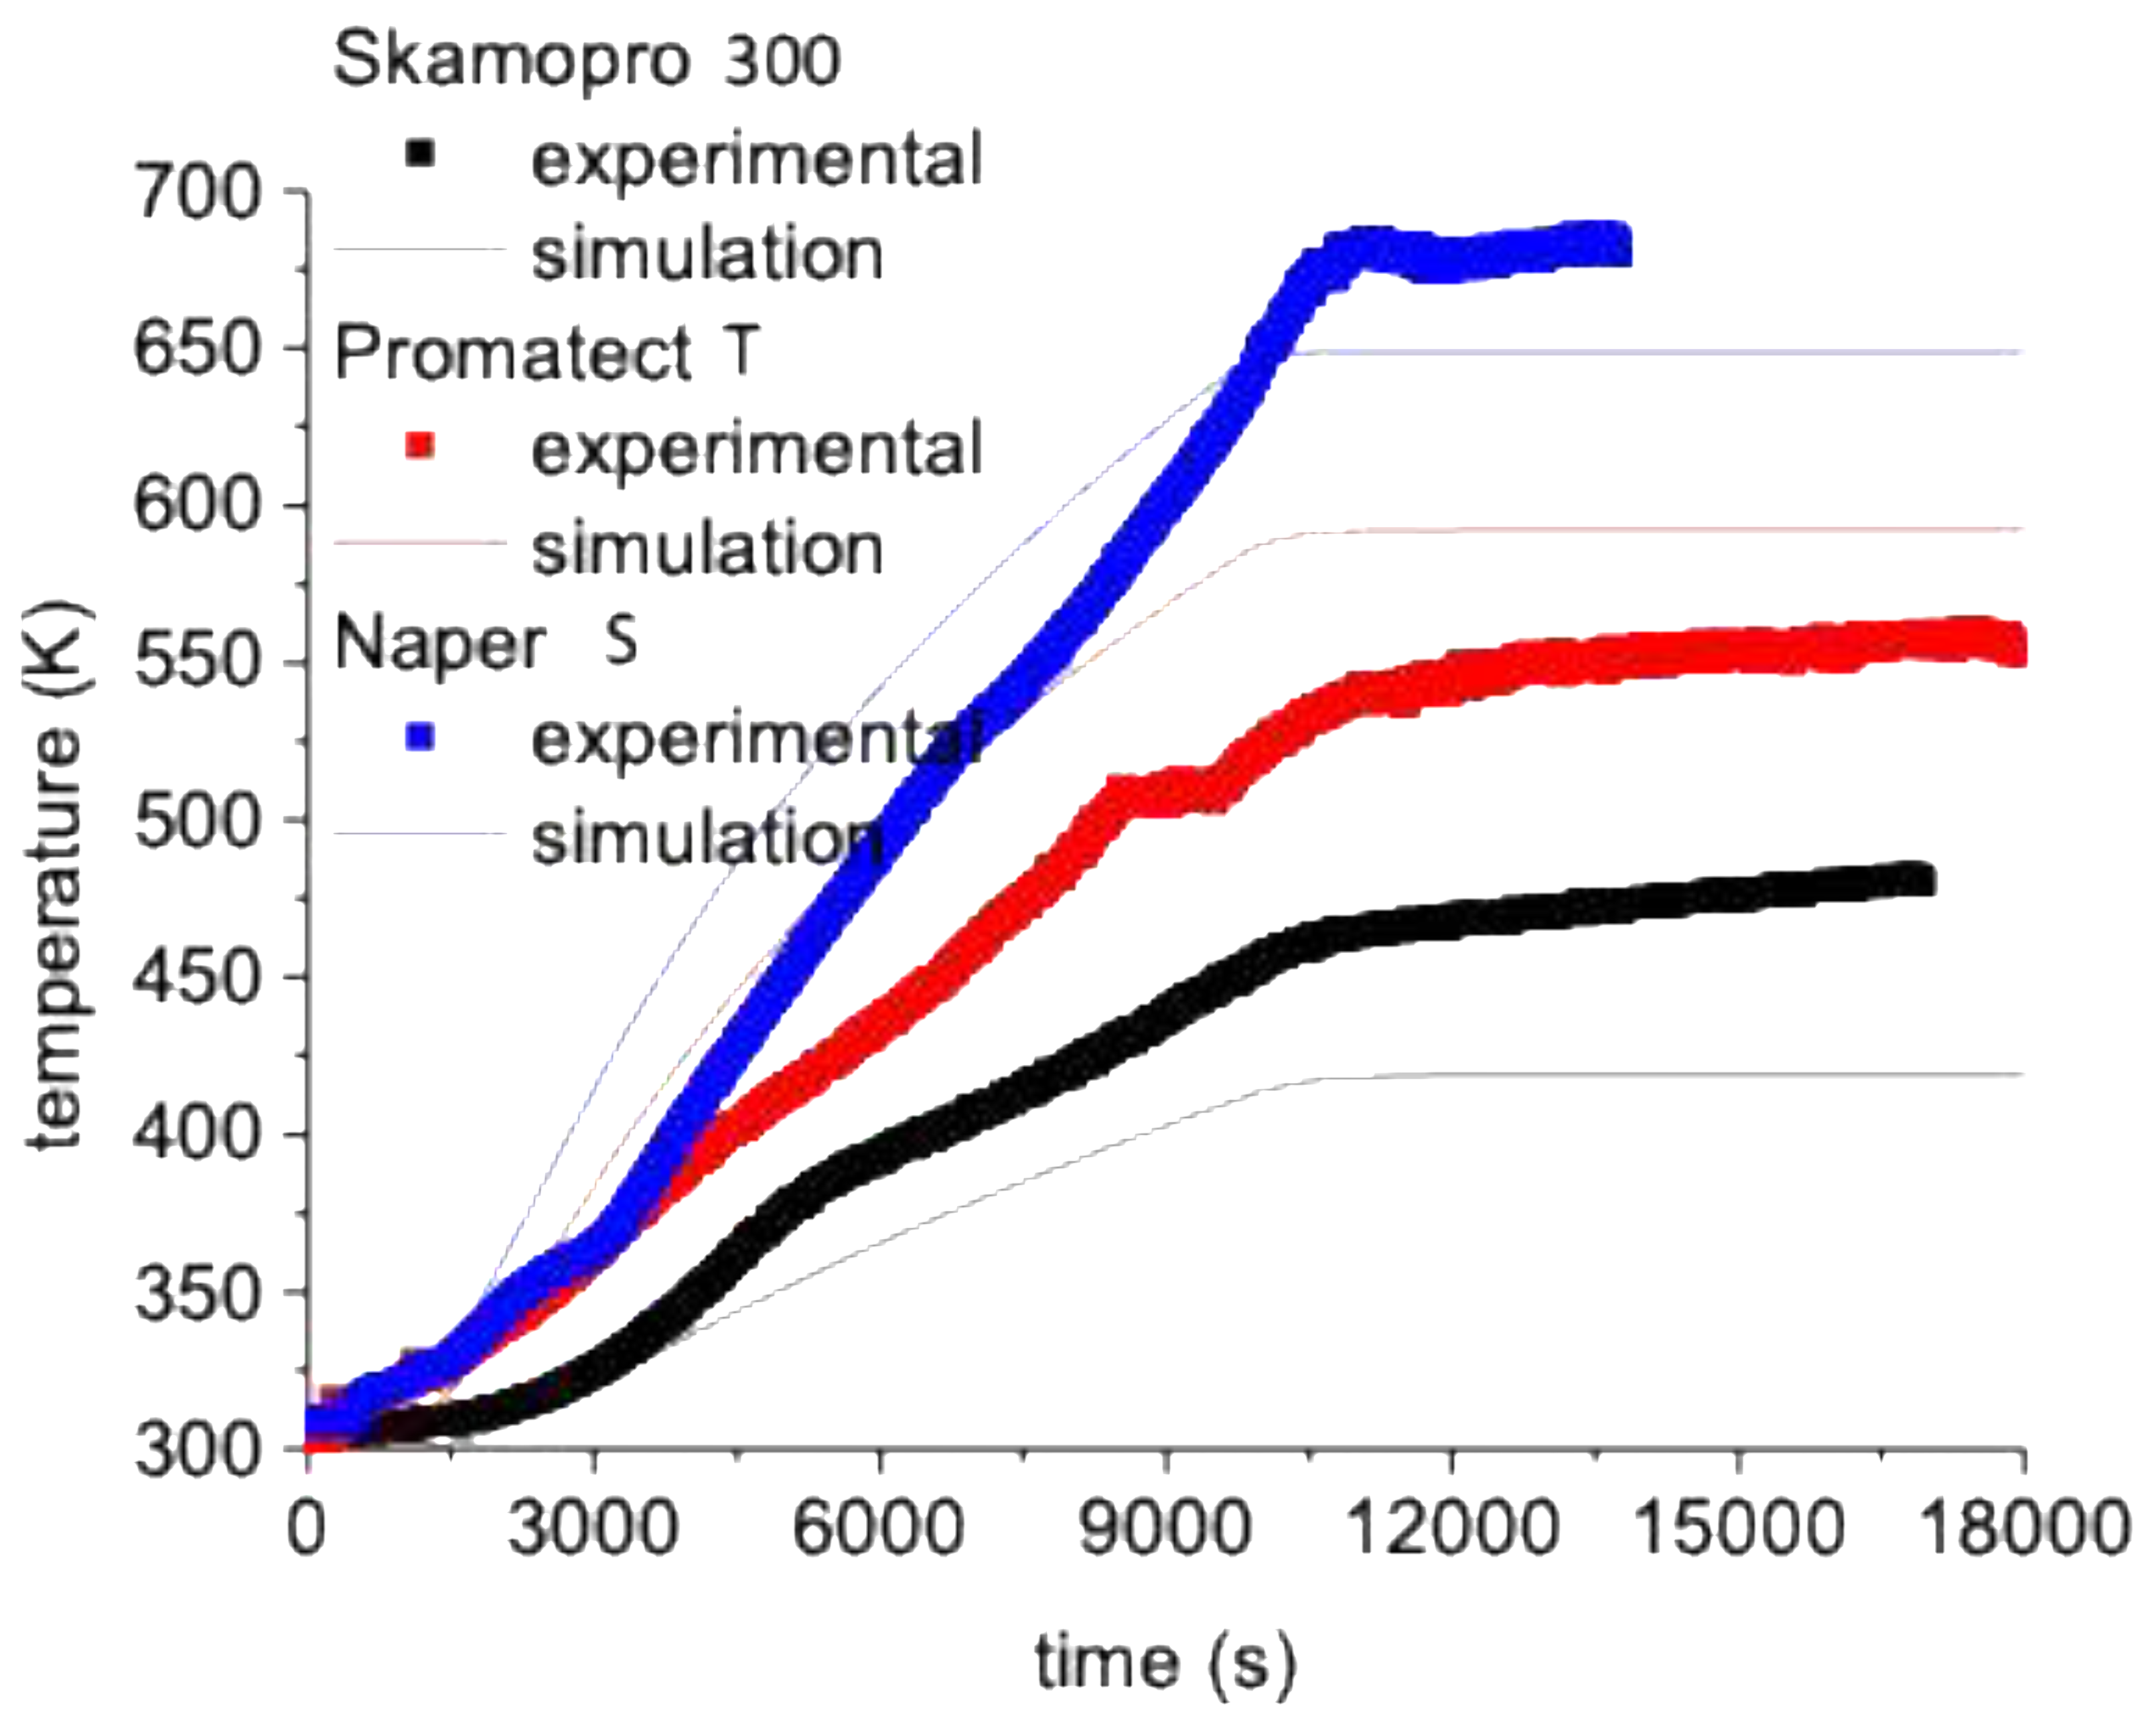
Table 1.
Thermophysical characteristics of the selected fireboards according to the technical data sheet available from the manufacturers.
Table 1.
Thermophysical characteristics of the selected fireboards according to the technical data sheet available from the manufacturers.
| Products Name | Composition |
Board Thickness (mm) |
Thermal Conductibvity (W/mK) |
Density (Kg/m3) |
Thermal Conductibvity (W/mK) |
Fire Performance Classification |
|
Promatect-T Promat International, Brussels, Belgium |
Calcium Silicate- aluminate | 25 | 0.21 at 20 °C | 900 | 0.21 at 20 °C | Class 1 (BS 476: part 7, EN 13051-1:A1) |
|
Naper S Global Building, Treviso, Italy |
Cement matrix based calcium silicate board | 20 | 0.25 at 20 °C | 1200 | 0.25 at 20 °C | A1 (EN 12467) |
|
Skamopro-300 Skamol- Østergade, Denmark |
Calcium silicate board | 50 | 0.072 at 10 °C | 300 | 0.072 at 10 °C | A1 (EN 13501-1:2007 + A1:2009) |
Table 2.
Compositional analyses (wt%) of the as-received and 1200 °C-treated fireboards quantified with XRF spectrometry.
Table 2.
Compositional analyses (wt%) of the as-received and 1200 °C-treated fireboards quantified with XRF spectrometry.
Sample
|
Promatect-T | Naper-S | Skamopro-300 | |||
wt%
|
As received | 1200 °C | As received | 1200 °C | As received | 1200 °C |
| SiO2 | 27.04 | 28.91 | 49.21 | 52.78 | 45.40 | 46.74 |
| CaO | 39.86 | 35.04 | 41.96 | 38.51 | 52.27 | 51.00 |
| Al2O3 | 30.63 | 34.01 | 4.39 | 4.43 | 1.03 | 1.21 |
| Fe2O3 | 0.94 | 0.72 | 2.35 | 2.41 | 0.28 | 0.22 |
| Cr2O3 | 0.01 | 0.02 | 0.05 | 0.06 | 0.06 | 0.07 |
| K2O | 0.32 | 0.15 | 0.78 | 0.92 | 0.42 | 0.16 |
| TiO2 | 0.09 | 0.07 | 0.16 | 0.17 | 0.01 | 0.01 |
| MgO | 0.65 | 0.72 | 0.63 | 0.72 | 0.52 | 0.58 |
| SO3 | 0.25 | 0.12 | 0.30 | -- | -- | -- |
| P2O5 | 0.10 | 0.17 | 0.14 | -- | -- | -- |
Table 4.
Thermal properties of the selected fireboards.
| Promatect-T | Naper S | Skamopro-300 | |
| keff (W/mK) | 0.21 | 0.25 | 0.072 |
| ρ(Kg/m3) | 900 | 1200 | 300 |
| cp (J/Kgk) | 1050 | 850 | 1050 |
| Thickness (m) | 25*10-3 | 20*10-3 | 50*10-3 |
Disclaimer/Publisher’s Note: The statements, opinions and data contained in all publications are solely those of the individual author(s) and contributor(s) and not of MDPI and/or the editor(s). MDPI and/or the editor(s) disclaim responsibility for any injury to people or property resulting from any ideas, methods, instructions or products referred to in the content. |
© 2026 by the authors. Licensee MDPI, Basel, Switzerland. This article is an open access article distributed under the terms and conditions of the Creative Commons Attribution (CC BY) license (http://creativecommons.org/licenses/by/4.0/).
Copyright: This open access article is published under a Creative Commons CC BY 4.0 license, which permit the free download, distribution, and reuse, provided that the author and preprint are cited in any reuse.


