
Submitted:
23 February 2026
Posted:
25 February 2026
You are already at the latest version
Abstract
Background/Objectives: While adequate mineral intake is essential for brain health and cognitive function across the lifespan, the potential impact of excessive consumption remains underexplored. This study analyzed the association between dietary mineral intake and cognitive performance, with particular interest in how different intake levels may influence specific cognitive domains. Methods: A cross-sectional study was conducted in 239 Spanish adults (18–65 years) from the Tech4Diet-Person project. Sociodemographic, dietary, and cognitive data were collected between 2021 and 2024. Cognitive function was assessed using the validated computerized CogniFit battery, and mineral intake was estimated through a food frequency questionnaire (93 items). Individuals with neurological, metabolic, or psychiatric disorders, as well as pregnant or lactating women, were excluded. Results: Participants had a mean age of 45.85 (± 10.14) years, and 16% showed low cognitive performance, which was associated with older age and lower educational level. Higher iron intake was observed in individuals with lower global performance (p = 0.037), reasoning (p = 0.037), and cognitive flexibility (p = 0.037), while higher zinc intake was associated with impairments in working memory (p = 0.026). Iron intake was associated with greater odds of low cognitive performance (OR = 1.136; p = 0.011), independent of sociodemographic variables. Conclusions: Excessive intake of iron and zinc is associated with poorer cognitive performance, highlighting the importance of a balanced nutritional intake to preserve brain function throughout the lifespan.
Keywords:
cognitive performance
; executive function
; iron
; mineral intake
; micronutrients
; nutri-tion
; zinc
1. Introduction
Nutrition plays a fundamental role in the development and maintenance of brain function, with profound implications for cognitive well-being across the lifespan [1,2]. An adequate intake of nutrients is essential for optimal brain performance, as it influences neurotransmitter synthesis, neuronal activity, and the structural integrity of cell membranes [2]. Within this context, minerals stand out for their critical role in neurological health. Essential minerals such as iron (Fe), zinc (Zn), magnesium (Mg), copper (Cu), and selenium (Se) serve as cofactors in numerous biochemical processes vital to brain function. For instance, iron is indispensable for normal neurocognitive development and myelin production [3]; zinc is associated with attention, learning, and memory [4]; and magnesium is crucial for nervous system function and processes such as memory and attention, partly because magnesium deficiency has been linked to chronic low-grade brain inflammation [5].
Several studies have documented associations between specific mineral levels and cognitive performance at different stages of the life course. For example, lower magnesium intake has been associated with an increased risk of cognitive decline in older adults, due to its role in oxidative stress and neuroinflammation [5,6]. In this regard, data from a large cohort of 2,508 adults in the NHANES study revealed that individuals with high daily magnesium intake exhibited better global cognitive test scores, particularly among women and individuals with adequate vitamin D levels [7]. Similarly, among older adults, adequate copper intake (around 1.3 mg/day) has been associated with reduced cognitive decline over time, suggesting a potential neuroprotective role for this mineral [8]. These findings highlight the brain's sensitivity to variations in mineral availability and support the notion that even subtle imbalances can have significant consequences for cognitive function.
Historically, much of the research in nutritional science has focused on the detrimental effects of mineral deficiencies, consistently documenting their negative impact on brain development, neuronal plasticity, and cognitive performance [9,10]. This perspective has informed the design of nutritional interventions and public health policies aimed at preventing deficiency states, especially during critical periods such as childhood and old age. However, the consequences of nutritional excess, particularly the accumulation of certain minerals, have received considerably less attention [10]. Emerging evidence indicates that elevated concentrations of minerals such as iron, copper, or manganese may foster a pro-oxidative environment, triggering oxidative stress and neuroinflammation, as well as disruptions in cellular signaling pathways [11,12]. These processes can alter neuronal homeostasis and potentially compromise the structure and function of the nervous system, with deleterious effects on cognition.
This gap in the literature is particularly relevant in light of the globalization of dietary patterns, the widespread use of fortified foods, and increasing reliance on dietary supplements, all of which contribute to more frequent exposure to supraphysiological levels of certain minerals. Therefore, the primary objective of this article is to explore the influence of mineral intake on cognitive function.
2. Materials and Methods
This cross-sectional study was conducted with a sample of 239 Spanish adults, within the framework of the research project Personalized Obesity Treatment by Learning and Analysing a Multimodal Space of the Disease with an Integral Approach (Tech4Diet-Person). The overarching aim of Tech4Diet-Person is to improve obesity treatment through personalized interventions based on deep multimodal learning and continuous patient monitoring, by developing digital tools that support tailored nutrition and motivation for long-term lifestyle changes. This project represents the continuation of a research line initiated in two previous studies: 4D Modelling and Visualization of the Human Body for the Improvement of Adherence to Dietary-Nutritional Treatment of Obesity through Low-Cost Technologies (TIN2017-89069-R, Tech4Diet, 2017) and Predictive Models of the Morphological Evolution of the Human Body to Improve Adherence (PID2020-119144RB-100, Tech4Diet-Predict, 2020).
The study protocol was reviewed and approved by the Ethical Committee of the University of Alicante (File Nos. UA-2016-06-30 and UA-2021-11-18). Participants were recruited following strict ethical standards and current data protection regulations, ensuring respect for privacy, confidentiality, and the voluntary nature of participation. All individuals were fully informed about the study’s objectives, procedures, and conditions, and were reminded of their right to withdraw at any time without consequence. Written informed consent was obtained from all participants before enrolment. The signed consent forms were securely stored by the research team in accordance with institutional and ethical guidelines. No minors were included in the study. All recruitment procedures and assessments were carried out at the Faculty of Health Sciences of the University of Alicante between January 10, 2022, and February 20, 2024. Data collection included a semi-structured interview for sociodemographic information, dietary-nutritional questionnaires, and neuropsychological tests to assess current nutritional status and cognitive function. The sample size was estimated a priori using G*Power 3.1. A power analysis for a non-parametric comparison between two independent groups, assuming a medium effect size (d = 0.25), an alpha level of 0.05, and a power of 0.90, indicated that a minimum of 130 individuals.
Inclusion criteria were being an adult between 18 and 65 years of age and having Spanish as a native language. Exclusion criteria included: (i) the presence of a professionally monitored endocrine-metabolic disorder; (ii) a history of neurological disease or acquired brain injury (e.g., stroke, traumatic brain injury, or neurodegenerative conditions such as Parkinson’s disease); (iii) a history of severe psychopathology according to DSM-5 criteria; (iv) current psychiatric treatment; and (v) pregnancy and/or lactation in women.
Sociodemographic and Lifestyle Variables
Sociodemographic variables were collected through a specific semi-structured interview, which included questions regarding the following aspects: sex (female, male), age (years), body mass index (BMI), marital status (single, married, divorced, widowed), educational level (primary, secondary, university), and employment status (employed, unemployed, retired, homemaker).
Cognitive Assessment
The General Cognitive Assessment Battery (CAB) from CogniFit was used, a scientifically validated computerized neuropsychological tool that evaluates multiple cognitive domains through standardized tasks [13]. The CogniFit battery has been widely applied in both clinical and research contexts, as its component tests have been validated against various standardized neuropsychological assessments [14]. Moreover, numerous studies have employed CogniFit’s cognitive activities with healthy populations (including children, adults, and older adults) with the aim of assessing or enhancing cognitive functioning. These studies are characterized by high methodological rigor, granting CogniFit a robust level of empirical evidence in the field of cognitive interventions [15,16]
The CAB is administered individually via a digital device (computer, mobile phone, or tablet) and takes approximately 40 minutes to complete. The system generates a comprehensive report consisting of three sections: well-being indicators (physical, psychological, and social well-being), cognitive profile, and conclusions (including a description of different indices, specific recommendations, and a personalized action plan).
The cognitive profile is presented in a circular diagram for each evaluated domain (Figure 1), providing normalized quantitative scores based on a large population database, adjusted for the participant's age and sex [14]. Although CogniFit scores are calculated in percentiles, they are presented on a unified scale ranging from 0 to 800. In this scale, higher scores reflect better cognitive performance. Scores between 0 and 200 (red zone) indicate performance significantly below the expected average, interpreted as a cognitive weakness in the assessed domain. Scores between 200 and 400 (yellow zone) reflect performance below the average, suggesting optimizable cognitive abilities. Scores between 400 and 600 (first green zone) correspond to adequate cognitive performance, indicating that the assessed ability is within the normative range. Finally, scores above 600 (second green zone) are considered cognitive strengths, as they reflect above-average functioning.
The total cognitive profile score was calculated as the mean of five core cognitive domains: reasoning, memory, attention, coordination, and perception. Each of these domains is composed of the average performance across several basic cognitive functions. For the purposes of this study, only selected functions were analyzed, as defined in the report generated by the CogniFit platform:
- Reasoning: Defined as the ability to efficiently process acquired information. It evaluates executive function and is composed of the following sub-functions:
- Planning: The ability to mentally anticipate the correct way to execute a task.
- Processing speed: The amount of time it takes an individual to complete a mental task.
- Cognitive flexibility: The brain’s capacity to adapt behavior and thinking to novel, changing, or unexpected situations.
Working memory: This function refers to the ability to temporarily store and manipulate the necessary information for performing complex cognitive tasks. Although the CogniFit platform categorizes it under the domain of memory, the scientific literature widely recognizes it as an executive function due to its anatomical localization in the prefrontal cortex [17] and its involvement in cognitive control and decision-making processes [18]. For this reason, and to encompass a comprehensive analysis of executive functions, working memory was included in this study as part of the executive function category.
Dietary Intake Assessment
To evaluate dietary intake, a semi-quantitative Food Frequency Questionnaire (FFQ) comprising 93 items was used. This instrument was specifically developed for the Nutrition and Health Survey of the Valencian Community (ENCV) and has been validated and employed in several epidemiological studies involving Spanish adult populations [19].
The questionnaire gathered detailed information on the frequency and usual quantity of consumption of various food groups, including bread, fats, meats, dairy products, and beverages. Consumption frequency was recorded based on the participants' intake over the year preceding the assessment. Response options ranged from "once a day" to "more than six times a day" for daily intake; "once a week", "2–4 times per week", or "5–6 times per week" for weekly intake; and "1–3 times per month" or "occasional/none" for monthly intake. For seasonal foods, such as fruits and vegetables, the questionnaire specified the frequency during their natural season.
Statistical Analysis
Frequencies and percentages were calculated for categorical variables, both overall and stratified by groups. Categorical variables were compared across groups using the Chi-square test (Χ²), and effect sizes were assessed using Cramér’s V (with > 0.1 considered small, > 0.3 moderate, and > 0.5 large) [20]. Quantitative variables were described using means and standard deviations (SD), both globally and disaggregated by groups. Group differences were analysed using the non-parametric Mann–Whitney U test, and effect sizes were assessed using Rosenthal’s r (with > 0.1 considered small, > 0.3 moderate, and > 0.5 large) [21].
To quantify dietary intake, the frequencies reported in the FFQ were converted into daily frequencies. This conversion involved assigning an average numerical value to each response category: for example, "never or rarely" was translated to 0.0; "1–3 times per month" to 0.07 (2/30); "once a week" to 0.14 (1/7); "2–4 times per week" to 0.42 (3/7); "5–6 times per week" to 0.78 (5.5/7); and "once a day" to 1.0 (1/1). These values, representing daily consumption frequency, were multiplied by the corresponding portion size (in grams) for each food item to calculate the estimated daily intake of each food.
Once the daily intake of each food was calculated, the energy and nutrient content per portion was estimated using the Spanish Food Composition Database (Red BEDCA) [22], considering only the edible portion. Subsequently, total individual intake of energy and nutrients was obtained by summing the values for all food items.
To compare intake between groups, z-scores were calculated for each cognitive function, interpreted according to standard normal distribution tables. The segmentation criterion was defined as a z-score below -1.5, indicating low cognitive performance [23]. Two groups were thus established for each cognitive function analysed: global cognitive function, reasoning, cognitive flexibility, processing speed, planning, and working memory. For the variable "global cognitive function," the low performance group included individuals with a z-score below -1.5 in at least one of the five core cognitive domains assessed by CogniFit: memory, attention, reasoning, coordination, and/or perception. Following group segmentation, the Mann–Whitney U test was applied to compare differences in mineral intake between groups. The significance level was set at α = 0.05, and effect size was calculated using the r statistic, where 0.10 indicates a small effect, 0.30 medium, and 0.50 large [20].
To explore the relationship between sociodemographic variables and iron intake in relation to cognitive performance, a binary logistic regression analysis was conducted. Cognitive performance was used as the dependent variable (coded as 0 = normal, 1 = low). The independent variables included in the model were iron intake (Fe), marital status, employment status, educational level, and age. The enter method was used to simultaneously evaluate the combined effect of all predictors on the likelihood of low cognitive performance. The model reported B coefficients, standard errors, Wald statistics, degrees of freedom, p-values, and odds ratios (Exp(B)) for each predictor.
All statistical analyses were performed using IBM SPSS Statistics for Windows, version 21.0 (IBM Corp., Armonk, NY; 2012). Values of p < 0.05 were considered statistically significant.
3. Results
The sample consisted of 239 Spanish adults, with a mean age of 45.85 years (SD = 10.136), including 91 men (37.2%) and 152 women (62.8%). Most participants were married or in a stable partnership (64.0 %), had higher education degrees (51.5 %), and were employed (83.7%).
As shown in Table 1, out of the total participants, 200 exhibited normal cognitive performance, while 39 showed low performance (defined as a z-score below -1.5 in at least one of the five cognitive domains assessed by CogniFit: memory, attention, reasoning, coordination, and/or perception). The low cognitive performance group had a significantly higher mean age than the normal performance group (M = 50.67, SD = 10.27 vs. M = 44.91, SD = 9.86; p < 0.001), with a moderate effect size (r = 0.279). Likewise, the low cognitive performance group had a significantly higher mean BMI than the normal performance group (M = 34.89, SD = 6.85 vs. M = 31.20, SD = 6.23; p = 0.002), with a moderate effect size (r = 0.28). No significant differences were found in sex distribution (p = 0.202).
Regarding marital status, significant differences were observed between groups (p = 0.039), with a lower proportion of single individuals and a higher proportion of divorced individuals in the low performance group; the effect size was small (V = 0.188). Significant differences were also found in educational level (p < 0.001), with the low performance group having a higher percentage of participants with primary education and fewer with higher education; the effect size was moderate (V = 0.337). Additionally, significant differences in employment status were identified (p = 0.005), with a higher proportion of retired and unemployed individuals in the low performance group; the effect size was moderate (V = 0.208).
Table 2A and Table 2B present the differences in mineral intake according to cognitive performance across various domains. Specifically, iron intake was significantly higher in the low performance group compared to the normal group for global cognitive function (23.07 ± 7.41 mg vs. 20.38 ± 5.84 mg; p = 0.037; r = 0.135), reasoning (23.38 ± 5.79 mg vs. 20.65 ± 6.19 mg; p = 0.037; r = 0.135), and cognitive flexibility (22.98 ± 6.28 mg vs. 20.58 ± 6.15 mg; p = 0.037; r = 0.135). This pattern was partially replicated in the domain of working memory, where the difference did not reach statistical significance (p = 0.072) but followed a similar trend (24.14 ± 8.68 mg vs. 20.52 ± 5.85 mg).
Additionally, a significant difference was observed in zinc intake related to working memory, with the low performance group reporting significantly higher intake compared to the normal group (14.75 ± 5.00 mg vs. 12.52 ± 3.39 mg; p = 0.026; r = 0.144). Despite achieving statistical significance, all effect sizes were small (r < 0.20).

| Table 2B. Daily mineral intake (mg/day) by cognitive performance in processing speed, planning, and working memory | |||||||||
| Mineral | Processing speed | Planning | Working memory | ||||||
| Normal (n=226) | Low (n=13) | p / r | Normal (n=215) | Low (n=24) | p / r | Normal (n=219) | Low (n=20) | p / r | |
| Calcium | 1130.47 (405.56) | 1239.00 (782.53) | 0.779 | 1145.93 (441.99) | 1058.09 (341.04) | 0.333 | 1128.94 (408.29) | 1217.78 (649.56) | 0.978 |
| Iron | 20.72 (6.03) | 22.55 (8.63) | 0.353 | 20.75 (6.08) | 21.40 (7.10) | 0.652 | 20.52 (5.85) | 24.14 (8.68) | 0.072 |
| Potassium | 3951.01 (1079.04) | 4137.25 (1468.80) | 0.763 | 3964.97 (1111.28) | 3929.72 (1028.70) | 0.885 | 3933.81 (1079.47) | 4260.34 (1304.03) | 0.395 |
| Magnesium | 427.35 (112.01) | 476.06 (161.15) | 0.190 | 429.83 (115.90) | 431.36 (112.46) | 0.768 | 427.32 (112.57) | 459.31 (141.89) | 0.314 |
| Sodium | 9245.30 (4267.92) | 10209.25 (3442.14) | 0.400 | 9222.91 (4246.72) | 9910.70 (4087.52) | 0.417 | 9305.44 (4254.43) | 9213.36 (4013.20) | 0.903 |
| Phosphorus | 1917.80 (531.29) | 2005.22 (806.02) | 0.980 | 1927.81 (536.72) | 1879.52 (641.08) | 0.390 | 1902.67 (515.20) | 2140.30 (811.10) | 0.259 |
| Iodine | 265.54 (85.60) | 274.06 (74.12) | 0.674 | 264.54 (86.45) | 277.99 (71.19) | 0.235 | 266.32 (85.54) | 262.49 (79.48) | 0.808 |
| Selenium | 127.45 (46.75) | 127.38 (52.17) | 0.987 | 128.02 (44.61) | 122.73 (63.80) | 0.185 | 125.97 (43.26) | 143.60 (76.30) | 0.627 |
| Zinc | 12.64 (3.47) | 13.96 (5.32) | 0.400 | 12.72 (3.58) | 12.60 (3.80) | 0.851 | 12.52 (3.39) | 14.75 (5.00) | 0.026 / 0.144 |
Note: Values are expressed as mean (SD) in mg/day. p values were obtained using the Mann–Whitney U test. r refers to Rosenthal’s effect size (small ≥ 0.10, moderate ≥ 0.30, large ≥ 0.50). Bolded p values indicate statistical significance (p < 0.05). “Low” performance was defined as a z-score < -1.5 in each specific cognitive domain.
Table 3 displays the impact of sociodemographic variables and iron intake on predicting low cognitive performance through binary logistic regression analysis. Although some sociodemographic variables, such as education level, showed significant effects (χ² = 10.147; df = 2; p = 0.006), iron intake remained significantly associated with low cognitive performance even after adjusting for the other variables. Specifically, higher iron intake was associated with an increased likelihood of low cognitive performance (B = 0.128; p = 0.011; odds ratio = 1.13), even when simultaneously considering BMI, daily calorie intake (kcal), marital status, employment status, and educational level. Other variables such as BMI (p=0.074), kcal (p=0.222), age (p = 0.151), marital status (p = 0.764), and employment status (p = 0.419) were not significant predictors in the model.
4. Discussion
The aim of this study was to explore the influence of mineral intake on cognitive function. The findings revealed a significant association between higher intake of iron and zinc and low cognitive performance in a sample of Spanish adults, even after adjusting for sociodemographic variables such as age, education level, marital status, and employment status. This is particularly noteworthy as it challenges the common notion that only mineral deficiencies are detrimental to cognitive function, suggesting instead a potential nonlinear and dose-dependent relationship.
Evidence from the present study indicates that individuals with low cognitive performance had on average, a higher intake of iron—both in global cognition and in specific domains such as reasoning and cognitive flexibility. This pattern may play a role in cognitive performance and aligns with previous research documenting how iron overload can contribute to cognitive decline [24]. Several neurophysiological mechanisms may explain this relationship, with oxidative stress being one of the most prominent. Excess iron acts as a catalyst in the Fenton reaction, promoting the formation of highly reactive hydroxyl radicals. These radicals cause oxidative damage to essential cellular components such as lipids, proteins, and DNA, particularly affecting vulnerable brain regions like the hippocampus and prefrontal cortex, which are key for higher-order functions such as memory and reasoning [25]. Other implicated mechanisms include neuroinflammation—since iron activates microglia and fosters a pro-inflammatory environment via the overexpression of cytokines such as IL-6 and TNF-α [26]; disruption of synaptogenesis and plasticity—given that iron excess disturbs calcium homeostasis and neurotransmitter release (e.g., glutamate and dopamine), thereby impairing synaptic plasticity crucial for learning and memory [27] and structural brain degeneration—as iron accumulation has been associated with grey matter atrophy and altered functional connectivity [28].
Moreover, excessive brain iron accumulation has been widely reported in several neurodegenerative diseases. In conditions such as Alzheimer's and Parkinson’s disease, elevated iron levels have been detected in specific brain regions, supporting its potential neurotoxic role [29]. In Alzheimer's disease, iron contributes to oxidative damage to the tau protein, promoting its hyperphosphorylation via the activation of related kinases. In this way, iron not only directly affects tau but also enhances its pathological modification through enzymatic phosphorylation pathways [30]. In Parkinson's disease, iron binds directly to the presynaptic protein alpha-synuclein, which is involved in neurotransmitter release regulation. This interaction promotes the aggregation of alpha-synuclein into insoluble fibrillar forms, increasing its expression and reducing its degradation. Consequently, numerous studies have reported marked iron accumulation in the substantia nigra of patients with Parkinson’s disease—a region critical for motor control and highly susceptible to oxidative stress [31].
A significant association was also found between zinc intake and working memory performance. Although the effect size was small, this finding aligns with existing literature recognizing zinc as a neuroactive nutrient with dual effects. Zinc plays a role in glutamatergic neurotransmission, modulating NMDA and AMPA receptors and supporting synaptic plasticity in key regions such as the hippocampus and prefrontal cortex [32]. However, zinc can also be neurotoxic when accumulated excessively. High extracellular concentrations disrupt calcium homeostasis, inhibit NMDA channels, and lead to mitochondrial dysfunction, resulting in oxidative stress and neuronal apoptosis [33]. This neurotoxic imbalance can impair synaptic dynamics essential for maintaining complex cognitive functions such as attention and working memory [34].
Despite the relevance of these findings, several methodological and analytical limitations should be considered when interpreting the results. First, the cross-sectional design precludes causal inferences regarding the relationship between mineral intake and cognitive performance. Second, dietary intake was assessed via a self-reported food frequency questionnaire (FFQ), which may be subject to recall bias or social desirability bias. Lastly, although the sample size was adequate for regression and group comparison analyses, the subsamples with low cognitive performance were considerably smaller, potentially affecting the stability of estimates and limiting the generalizability of the results. Future studies should address these limitations by employing longitudinal designs, using biomedical assessments of micronutrient levels, and comparing more homogeneous cognitive performance groups.
5. Conclusions
Overall, the findings highlight that excessive intake of iron and zinc may be linked to poorer cognitive performance, likely as a result of adverse neurophysiological processes. Excess levels of these minerals can induce oxidative stress, impair synaptic plasticity, disrupt neurotransmitter homeostasis, and activate neuroinflammatory pathways, affecting critical structures such as the hippocampus and prefrontal cortex. These results suggest that both micronutrient deficiency and excess may exert harmful effects on brain function. Rather than acting as neutral agents, iron and zinc appear to serve as active modulators of cognitive health. Thus, these findings underscore the importance of a balanced and carefully regulated nutritional intake as a key factor in preserving cognitive functioning across the lifespan.
Author Contributions
Conceptualization, M.T.-F., L.M.-M., M.S.-S., J.A.H.-S. and A.Z.-M.; methodology, M.T.-F. and L.M.-M.; formal analysis, M.T.-F. and L.M.-M.; investigation, M.T.-F. and L.M.-M.; data curation, M.T.-F. and L.M.-M.; writing—original draft preparation, M.T.-F. and L.M.-M.; writing—review and editing, M.T.-F., L.M.-M., M.S.-S., J.A.H.-S. and A.Z.-M.; supervision, M.S.-S., J.A.H.-S. and A.Z.-M.; project administration, M.S.-S.; funding acquisition, M.S.-S. All authors have read and agreed to the published version of the manuscript.
Funding
This research was funded by the Ministry of Science, Innovation and Universities, Spain (Grant PID2023-149562OB-I00 funded by MICIU/AEI/10.13039/501100011033 and by ERDF/EU).
Institutional Review Board Statement
All procedures performed in this study involving human participants were conducted in accordance with the ethical standards of the institutional and/or national research committees and with the 1964 Declaration of Helsinki and its later amendments. The study was approved by the Ethics Committee of the University of Alicante as part of the project Personalized Obesity Treatment by Learning and Analysing a Multimodal Space of the Disease with an Integral Approach (Tech4D-Person) (protocol code UA-2021-11-18; date of approval: 18 November 2021).
Informed Consent Statement
Prior to participation, all individuals were fully informed about the purpose of the study, the procedures involved, the voluntary nature of their participation, and their right to withdraw at any time without consequences. Written informed consent was obtained from all participants before their inclusion in the study, in accordance with ethical and legal standards. No personal or identifying data are included in this manuscript, ensuring full compliance with data protection regulations and confidentiality requirements.
Data Availability Statement
The data supporting the findings of this study are available from the corresponding author upon reasonable request. Data are not publicly available due to privacy and ethical restrictions related to the protection of participants’ personal information and compliance with institutional data protection regulations.
Acknowledgments
The authors would like to acknowledge the Tech4Diet-Person project for providing the research framework and infrastructure that made this study possible. We also thank the University of Alicante for its institutional and logistical support. The authors are grateful for the collaboration and commitment of all members of the research team involved in data collection and project coordination. Finally, we sincerely thank all participants for their time, involvement, and willingness to contribute to this research.
Conflicts of Interest
The authors declare no conflicts of interest. The funders had no role in the design of the study; in the collection, analyses, or interpretation of data; in the writing of the manuscript; or in the decision to publish the results.
Abbreviations
The following abbreviations are used in this manuscript:
| BMI – | Body Mass Index |
| CAB – | Cognitive Assessment Battery |
| CRP – | C-reactive Protein |
| DSM-5 – | Diagnostic and Statistical Manual of Mental Disorders, Fifth Edition |
| ENCV – | Nutrition and Health Survey of the Valencian Community |
| FFQ – | Food Frequency Questionnaire |
| NHANES – | National Health and Nutrition Examination Survey |
| OR – | Odds Ratio |
| SD – | Standard Deviation |
References
- Tengeler, AC; Kozicz, T; Kiliaan, AJ. Relationship between diet, the gut microbiota, and brain function. Nutr Rev. 2018, 76, 603–17. [Google Scholar] [CrossRef]
- Jensen, DEA; Leoni, V; Klein-Flügge, MC; Ebmeier, KP; Suri, S. Associations of dietary markers with brain volume and connectivity: A systematic review of MRI studies. Ageing Res Rev. 2021, 70, 101360. [Google Scholar] [CrossRef]
- Quezada-Pinedo, HG; Cassel, F; Duijts, L; Muckenthaler, MU; Gassmann, M; Jaddoe, VWV; et al. Maternal Iron Status in Pregnancy and Child Health Outcomes after Birth: A Systematic Review and Meta-Analysis. Nutrients 2021, 13, 2221. [Google Scholar] [CrossRef] [PubMed]
- Sun, R; Wang, J; Feng, J; Cao, B. Zinc in Cognitive Impairment and Aging. Biomolecules 2022, 12, 1000. [Google Scholar] [CrossRef] [PubMed]
- Maier, JAM; Locatelli, L; Fedele, G; Cazzaniga, A; Mazur, A. Magnesium and the Brain: A Focus on Neuroinflammation and Neurodegeneration. Int J Mol Sci. 2022, 24, 223. [Google Scholar] [CrossRef]
- Cepeda, V; Ródenas-Munar, M; García, S; Bouzas, C; Tur, JA. Unlocking the Power of Magnesium: A Systematic Review and Meta-Analysis Regarding Its Role in Oxidative Stress and Inflammation. Antioxidants 2025, 14, 740. [Google Scholar] [CrossRef]
- Tao, M; Liu, J; Cervantes, D. Association between magnesium intake and cognition in US older adults: National Health and Nutrition Examination Survey (NHANES) 2011 to 2014. Alzheimers Dement Transl Res Clin Interv [Internet] 2022 Jan [cited 2025 Jul 10], 8(1). Available online: https://alz-journals.onlinelibrary.wiley.com/doi/10.1002/trc2.12250. [CrossRef]
- Meng, Q; Liu, C; Zu, C; Wei, Y; Su, X; Gan, X; et al. Association Between Dietary Copper Intake and Cognitive Decline: A Perspective Cohort Study in Chinese Elderly. Am J Geriatr Psychiatry 2023, 31, 753–63. [Google Scholar] [CrossRef]
- Ridgway, E; Baker, P; Woods, J; Lawrence, M. Historical Developments and Paradigm Shifts in Public Health Nutrition Science, Guidance and Policy Actions: A Narrative Review. Nutrients 2019, 11, 531. [Google Scholar] [CrossRef]
- Muth, AK; Park, SQ. The impact of dietary macronutrient intake on cognitive function and the brain. Clin Nutr. 2021, 40, 3999–4010. [Google Scholar] [CrossRef] [PubMed]
- Bekdash, RA. Epigenetics, Nutrition, and the Brain: Improving Mental Health through Diet. Int J Mol Sci. 2024, 25, 4036. [Google Scholar] [CrossRef] [PubMed]
- Huat, TJ; Camats-Perna, J; Newcombe, EA; Valmas, N; Kitazawa, M; Medeiros, R. Metal Toxicity Links to Alzheimer’s Disease and Neuroinflammation. J Mol Biol. 2019, 431, 1843–68. [Google Scholar] [CrossRef]
- Shah, TM; Weinborn, M; Verdile, G; Sohrabi, HR; Martins, RN. Enhancing Cognitive Functioning in Healthly Older Adults: a Systematic Review of the Clinical Significance of Commercially Available Computerized Cognitive Training in Preventing Cognitive Decline. Neuropsychol Rev. 2017, 27, 62–80. [Google Scholar] [CrossRef] [PubMed]
- Kraus, TH; Breznitz, Z. Can the Error Detection Mechanism Benefit from Training the Working Memory? A Comparison between Dyslexics and Controls — An ERP Study. In PLoS ONE; Rogers, N, Ed.; 2009; Volume 4. [Google Scholar] [CrossRef]
- Conesa, PJ; Duñabeitia, JA. Effects of computer-based training on children’s executive functions and academic achievement. J Educ Res. 2021, 114, 562–71. [Google Scholar] [CrossRef]
- Tapia, JL; Rocabado, F; Duñabeitia, JA. Cognitive estimation of speed, movement and time across the lifespan. J Integr Neurosci. 2022, 21, 10. [Google Scholar] [CrossRef]
- Kiyonaga, A; Miller, JA; D’Esposito, M. Lateral prefrontal cortex controls interplay between working memory and actions [Internet]. Neuroscience. 2024. Available online: http://biorxiv.org/lookup/doi/10.1101/2024.09.17.613601.
- Carpenter, P. Working memory and executive function: evidence from neuroimaging. Curr Opin Neurobiol. 2000, 10, 195–9. [Google Scholar] [CrossRef]
- Vioque, J. Validez de la evaluación de la ingesta dietética. In Vol. Nutrición y Salud Pública: Métodos, bases científicas y aplicaciones, 2nd ed.; Masson-Elsevier: Barcelona, 2006; pp. 199–210 p. [Google Scholar]
- Cohen, J. A power primer. Psychol Bull. 1992, 112, 155–9. [Google Scholar] [CrossRef]
- Rosenthal, R. Meta-Analytic Procedures for Social Research. In Rev. Sage; 1991. [Google Scholar]
- AESAN/BEDCA. Base de Datos Española de Composición de Alimentos [Internet]. 2010. Available online: https://www.bedca.net.
- Feldberg, C; Tartaglini, MF; Barreyro, JP; Hermida, PD; Bennetti, L; Moya García, L. El rol de las actividades del tiempo libre en la reserva cognitiva en adultos mayores. Av En Psicol Latinoam. 2022, 40, 1–6. [Google Scholar] [CrossRef]
- Shi, Z; Li, M; Wang, Y; Liu, J; El-Obeid, T. High iron intake is associated with poor cognition among Chinese old adults and varied by weight status—a 15-y longitudinal study in 4852 adults. Am J Clin Nutr. 2019, 109, 109–16. [Google Scholar] [CrossRef]
- Dusek, P; Hofer, T; Alexander, J; Roos, PM; Aaseth, JO. Cerebral Iron Deposition in Neurodegeneration. Biomolecules 2022, 12, 714. [Google Scholar] [CrossRef] [PubMed]
- Porras, CA; Rouault, TA. Iron Homeostasis in the CNS: An Overview of the Pathological Consequences of Iron Metabolism Disruption. Int J Mol Sci. 2022, 23, 4490. [Google Scholar] [CrossRef]
- Sripetchwandee, J; Pipatpiboon, N; Chattipakorn, N; Chattipakorn, S. Combined Therapy of Iron Chelator and Antioxidant Completely Restores Brain Dysfunction Induced by Iron Toxicity. In PLoS ONE; Skoulakis, EMC, Ed.; 2014; Volume 9. [Google Scholar] [CrossRef]
- Agrawal, S; Berggren, KL; Marks, E; Fox, JH. Impact of high iron intake on cognition and neurodegeneration in humans and in animal models: a systematic review. Nutr Rev. 2017, 75, 456–70. [Google Scholar] [CrossRef] [PubMed]
- Spence, H; McNeil, CJ; Waiter, GD. The impact of brain iron accumulation on cognition: A systematic review. In PLOS ONE; Skoulakis, EMC, Ed.; 2020; Volume 15. [Google Scholar] [CrossRef]
- Levi, S; Ripamonti, M; Moro, AS; Cozzi, A. Iron imbalance in neurodegeneration. Mol Psychiatry 2024, 29, 1139–52. [Google Scholar] [CrossRef] [PubMed]
- Agostini, F; Sgalletta, B; Bisaglia, M. Iron Dyshomeostasis in Neurodegeneration with Brain Iron Accumulation (NBIA): Is It the Cause or the Effect? Cells 2024, 13, 1376. [Google Scholar] [CrossRef]
- Choi, S; Hong, DK; Choi, BY; Suh, SW. Zinc in the Brain: Friend or Foe? Int J Mol Sci. 2020, 21, 8941. [Google Scholar] [CrossRef]
- Li, Z; Liu, Y; Wei, R; Yong, VW; Xue, M. The Important Role of Zinc in Neurological Diseases. Biomolecules 2022, 13, 28. [Google Scholar] [CrossRef] [PubMed]
- Takeda, A; Tamano, H. Significance of the degree of synaptic Zn2+ signaling in cognition. BioMetals 2016, 29, 177–85. [Google Scholar] [CrossRef]
Figure 1.
Cognitive profile circular diagram (CAB - CogniFit).
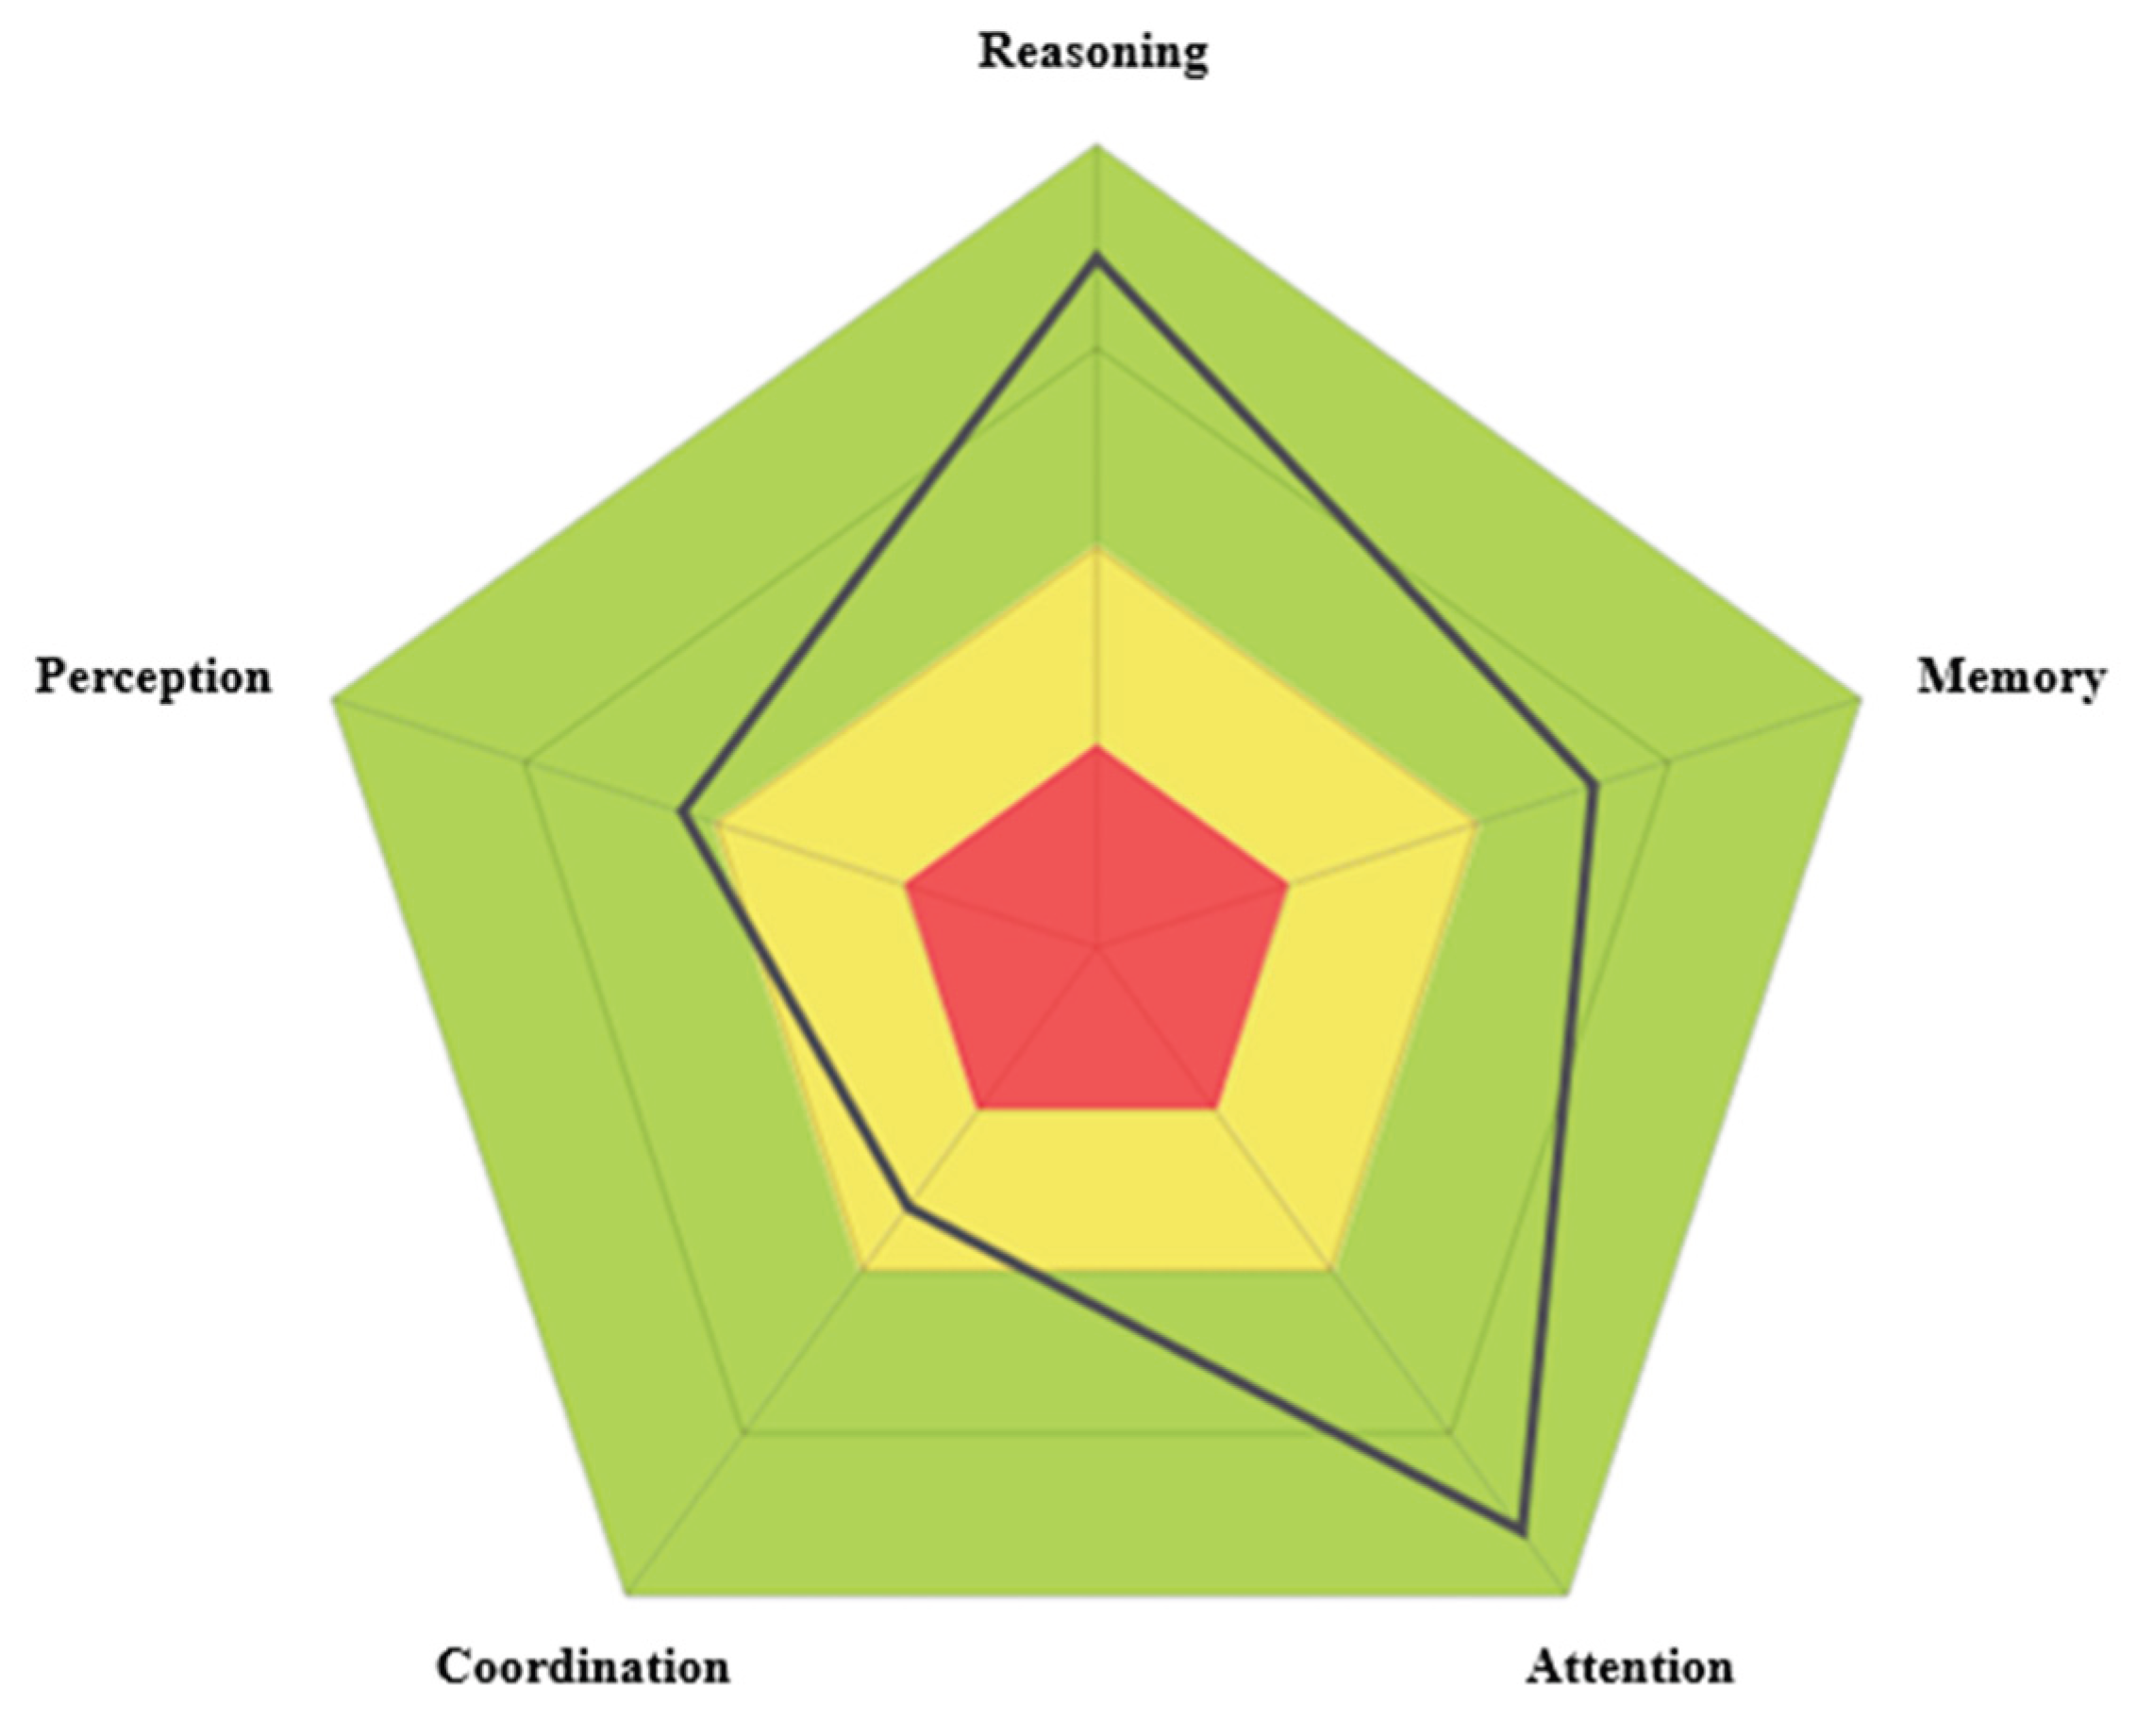
Table 1.
Sociodemographic characteristics of the sample (N = 239).
| Variables | Total (n = 239) | Normal performance (n = 200) | Low performance (n = 39) | p | ES |
| Age, mean (SD) | 45.85 (10.136) | 44.91 (9.864) | 50.67 (10.268) | 0.000 | 0.279 |
| BMI | 31.81 (6.467) | 31.20 (6.230) | 34.89 (6.845) | 0.002 | 0.280 |
| Sex, % (n) | |||||
| Male | 37.2 (89) | 39 (78) | 28.2 (11) | 0.202 | 0.082 |
| Female | 62.8 (150) | 61 (122) | 71.8 (28) | ||
| Marital Status, % (n) | |||||
| Single | 22.6 (54) | 25 (50) | 10.3 (4) | 0.039 | 0.337 |
| Married/In a relationship | 64.0 (153) | 64 (128) | 64.1 (25) | ||
| Divorced | 12.1 (29) | 10 (20) | 23.1 (9) | ||
| Widowed | 1.3 (3) | 1 (2) | 2.6 (1) | ||
| Education level, % (n) | |||||
| Primary | 9.2 (22) | 5.5 (11) | 28.2 (11) | 0.000 | 0.337 |
| Secondary | 39.3 (94) | 38 (76) | 46.2 (18) | ||
| University | 51.5 (123) | 56.5 (113) | 25.6 (10) | ||
| Employment status, % (n) | |||||
| Unemployed | 10.9 (26) | 10 (20) | 15.4 (6) | 0.005 | 0.208 |
| Employed | 83.7 (200) | 86 (172) | 71.8 (28) | ||
| Retired | 2.5 (6) | 1 (2) | 10.3 (4) | ||
| Homemaker | 2.9 (7) | 3 (6) | 2.6 (1) | ||
Note. p values correspond to chi-square tests for categorical variables and Mann–Whitney U tests for continuous variables. ES = Effect size; SD: standard deviation; BMI: body mass index; for continuous variables, Rosenthal’s r is reported; for categorical variables, Cramér’s V is used. Bolded p values indicate statistical significance (p < .05).
Table 2.
Daily mineral intake (mg/day) by cognitive performance in global cognition, reasoning, and cognitive flexibility.
Table 2.
Daily mineral intake (mg/day) by cognitive performance in global cognition, reasoning, and cognitive flexibility.
| A. | |||||||||
| Mineral | Global cognition | Reasoning | Cognitive flexibility | ||||||
| Normal (n=200) | Low (n=39) | p / r | Normal (n=224) | Low (n=15) | p / r | Normal (n=215) | Low (n=24) | p / r | |
| Calcium | 1123.84 (408.96) | 1200.65 (538.65) | 0.641 | 1141.82 (438.25) | 1055.04 (334.30) | 0.517 | 1131.17 (437.16) | 1183.01 (392.63) | 0.480 |
| Iron | 20.38 (5.84) | 23.07 (7.41) | 0.037 / 0.135 | 20.65 (6.19) | 23.38 (5.79) | 0.037 / 0.135 | 20.58 (6.15) | 22.98 (6.28) | 0.037 / 0.135 |
| Potassium | 3906.07 (1055.84) | 4243.53 (1284.79) | 0.185 | 3949.20 (1112.94) | 4139.41 (909.01) | 0.299 | 3932.35 (1087.34) | 4219.02 (1206.88) | 0.175 |
| Magnesium | 423.67 (107.47) | 462.41 (146.57) | 0.163 | 427.93 (116.50) | 460.86 (93.27) | 0.075 | 426.95 (113.15) | 457.28 (132.56) | 0.142 |
| Sodium | 9337.47 (4296.72) | 9093.92 (3893.84) | 0.913 | 9322.47 (4264.32) | 8928.27 (3729.06) | 0.853 | 9319.87 (4244.26) | 9099.42 (4149.49) | 0.862 |
| Phosphorus | 1895.22 (512.60) | 2062.70 (691.92) | 0.205 | 1922.16 (553.29) | 1928.43 (472.96) | 0.680 | 1910.85 (545.93) | 2027.46 (564.31) | 0.189 |
| Iodine | 265.05 (85.06) | 270.84 (84.96) | 0.698 | 267.47 (85.83) | 244.11 (68.00) | 0.287 | 267.13 (83.51) | 255.88 (97.85) | 0.511 |
| Selenium | 126.19 (44.27) | 133.84 (59.02) | 0.606 | 127.58 (47.46) | 125.39 (39.63) | 0.761 | 125.88 (46.19) | 141.43 (52.13) | 0.107 |
| Zinc | 12.50 (3.43) | 13.73 (4.21) | 0.078 | 12.67 (3.63) | 13.27 (3.09) | 0.227 | 12.60 (3.57) | 13.65 (3.73) | 0.083 |
Note: Values are expressed as mean (SD) in mg/day. p values were obtained using the Mann–Whitney U test. r refers to Rosenthal’s effect size (small ≥ 0.10, moderate ≥ 0.30, large ≥ 0.50). Bolded p values indicate statistical significance (p < 0.05). "Low" performance was defined as a z-score < -1.5 in each specific cognitive domain.
Table 3.
Binary logistic regression model for low cognitive performance (Global cognition).
| Variable | B | Standard Error | Wald | df | p | Exp(B) |
| Iron | 0.128 | 0.050 | 6.530 | 1 | 0.011 | 1.136 |
| BMI | 0.063 | 0.035 | 3.189 | 1 | 0.074 | 1.136 |
| Kcal | 0.000 | 0.000 | 1.492 | 1 | 0.222 | 1.000 |
| Age | 0.039 | 0.027 | 2.066 | 1 | 0.151 | 1.040 |
| Marital status (Single) | 1.156 | 3 | 0.764 | |||
| – Married | 0.133 | 0.718 | 0.034 | 1 | 0.853 | 1.142 |
| – Divorced | 0.692 | 0.821 | 0.710 | 1 | 0.399 | 1.997 |
| – Widowed | 0.182 | 1.520 | 0.014 | 1 | 0.905 | 1.199 |
| Employment status (Employed) | 2.828 | 3 | 0.419 | |||
| – Unemployed | -0.143 | 0.615 | 0.054 | 1 | 0.816 | 0.867 |
| – Retired | 1.524 | 1.164 | 1.713 | 1 | 0.191 | 4.589 |
| – Homemaker | -0.584 | 1.308 | 0.199 | 1 | 0.655 | 0.558 |
| Education level (Primary) | 10.147 | 2 | 0.006 | |||
| – Secondary | -1.329 | 0.565 | 5.523 | 1 | 0.019 | 0.265 |
| – Higher | -1.915 | 0.604 | 10.058 | 1 | 0.002 | 0.147 |
| Constant | -5.787 | 2.099 | 7.605 | 1 | 0.006 | 0.003 |
Note: The model evaluates the probability of having low cognitive performance in the global cognitive domain (z-score < -1.5). p values < 0.05 are considered statistically significant and are bolded. Reference categories: marital status = single, employment status = employed, education level = primary. Exp(B) indicates the odds ratio.
Disclaimer/Publisher’s Note: The statements, opinions and data contained in all publications are solely those of the individual author(s) and contributor(s) and not of MDPI and/or the editor(s). MDPI and/or the editor(s) disclaim responsibility for any injury to people or property resulting from any ideas, methods, instructions or products referred to in the content. |
© 2026 by the authors. Licensee MDPI, Basel, Switzerland. This article is an open access article distributed under the terms and conditions of the Creative Commons Attribution (CC BY) license (http://creativecommons.org/licenses/by/4.0/).
Copyright: This open access article is published under a Creative Commons CC BY 4.0 license, which permit the free download, distribution, and reuse, provided that the author and preprint are cited in any reuse.


