Submitted:
18 February 2026
Posted:
24 February 2026
You are already at the latest version
Abstract
Various sight-threatening diseases are caused by an elevated permeability of the layer of retinal microvascular endothelial cells (REC), induced by high intravitreal levels of vascular endothelial growth factor-A165 (VEGF-A165). Barrier impairment is accompanied by an altered expression of proteins restricting para- and transcellular flow, counteracted by inhibition of VEGF-A-signaling. Here we investigated whether chloroquine, an inhibitor of lysosome acidification and autophagy, can prevent VEGF-A165-induced impairment of the REC barrier. Cells were treated with 1-10 µM chloroquine ± 1.3 nM VEGF-A165 for up to four days. Barrier function was assessed by continuous cell index measurements revealing that 10 µM chloroquine partly counteracted the VEGF-A165-induced low cell index. Higher protein expression of the regulator of transcellular flow, plasmalemma vesicle-associated protein was also prevented, but not loss of tight junction protein claudin-1. Chloroquine in combination with VEGF-A165 also lowered the protein expression of differentiation markers von Willebrand factor and caveolin-1, while the abundance of a cleavage product derived from adherens junction protein vascular endothelial cadherin increased. Importantly, the prominent localization of tight junction protein claudin-5 at the plasma membrane dramatically weakened, as shown by immunofluorescence staining. Taken together, despite apparently stabilizing the barrier formed by REC, chloroquine profoundly alters the endothelial phenotype.
Keywords:
VEGF A
; chloroquine
; retinal endothelial cells
; barrier function
; tight junction
; change of phenotype
1. Introduction
Various ocular diseases of high socio-economic relevance, e.g., macular edema secondary to diabetic retinopathy or retinal vein occlusion, are associated with the breakdown of the inner blood-retina barrier (BRB) [1,2]. Elevated permeability of the layer of retinal endothelial cells (REC) of the inner BRB is caused by deregulated expression of growth factors in the vitreous, among which vascular endothelial growth factor (VEGF)-A plays the dominant role [3,4]. In vitro, exposure to the splice variant VEGF-A165 increases the permeability of cell layers of primary or immortalized REC isolated from various species, including human. Barrier impairment persists over several days, accompanied by adversatively altered expression of tight junction (TJ) proteins: Claudin-1 is downregulated whereas claudin-5 is upregulated [5,6,7,8,9,10,11]. Amounts of the regulator of transcellular flow, plasmalemma vesicle-associated protein (PLVAP), only barely expressed by unchallenged REC, are also strongly increased [8,12,13]. These changes, mediated through binding and activation of VEGF receptor (VEGFR) 2, are efficiently counteracted and reverted by blocking VEGF-dependent signal transduction [7,8,14,15,16]. Enhanced protein degradation might be involved in the VEGF-A-induced loss of TJ-protein claudin-1, and, interestingly, chloroquine counteracts the downregulation of this TJ-protein by hypertonic stress in renal tubular epithelial cells [17]. The anti-malaria agent raises the lysosomal pH, thereby inactivating proteases, and, by preventing autophagosome formation, it inhibits autophagy [18,19,20]. Defined as lysosomal proteolytic degradation of cytosolic components for cellular recycling, autophagy, takes place under physiological and pathological conditions [21,22]. In microvascular REC, hypoxia and VEGF-A165 increase autophagic flux and, consequently, angiogenic processes can be prevented by inhibiting autophagy [23,24].
In view of these observations, we investigated if chloroquine prevented VEGF-A165-induced changes of the REC barrier using the well-established model of immortalized bovine retinal microvascular endothelial cells (iBREC), focusing on extended exposures to the effectors over several days, to better mimic the vivo situation [25]. To assess barrier function, we combined two complementary approaches. First, we measured the cell-index (CI) by recording the electrical impedance of the cell-substrate interface and the cell-cell contacts, providing real-time analyses of barrier integrity [14,26]. Second, we evaluated the expression and/or subcellular localization of proteins typical of (microvascular) endothelial cells, including claudin-5, caveolin-1, and von Willebrand factor (vWF), as well as proteins that regulate para- and transcellular flow, such as claudin-1, PLVAP, respectively, and the adherens junction protein vascular endothelial cadherin (VEcadherin) [7,8,12,13,27,28,29,30,31]. We also investigated whether the inhibitor itself was harmful to REC, because systemic exposure to chloroquine, also used to treat immune-mediated inflammatory diseases, could lead to irreversible retinopathy, which is primarily associated with dysfunction of the retinal pigment epithelium and, consequently, of the outer BRB [32,33].
2. Results
2.1. General Information
All experiments to evaluate changes induced by inhibitors of lysosomal proteases, autophagy as well as by VEGF-A165 were performed with confluent monolayers of iBREC which were propagated in cell culture medium adapted for the special needs of this cell type. Although of non-human origin, immortalized and primary microvascular endothelial cells of the bovine retina provide highly reliable in vitro models of the inner BRB, as they establish a tight barrier: High values of the cell index and the transendothelial electrical resistance are accompanied by a strong expression of claudin-5 whereas PLVAP is barely detectable [7,8,10,12,13,16,25]. In addition, human and bovine homologues not only of investigated proteins are highly conserved.
Cells were treated with the inhibitors with or without VEGF-A165 for up to four days. Depending on the cell type, chloroquine prevents autophagy and inhibits lysosomal proteases between 0.1 µM and 20 µM [17,33,34]. To inhibit cysteine-dependent (non)-lysosomal proteases, MG-101 was used at final concentrations of 20 nM or 500 nM, at which it blocks the activity of lysosomal cathepsins L and B or of non-lysosomal calpains I and II, respectively [35,36]. VEGF-A165-mediated signal transduction was counteracted by 10 nM tivozanib, which specifically inhibits VEGFR2 [14,37].
2.2. Chloroquine but not MG-101 Counteracted the VEGF-A165-Induced Low Cell Index Values
To evaluate possible toxic changes induced by the inhibitor of autophagy, we counted the number of iBREC per field after exposure of the cells’ confluent monolayers to chloroquine ± VEGF-A165 for four days: Compared to lower concentrations, treatment with 10 µM chloroquine (± VEGF-A165) led to a slight, but significant reduction of cells (Figure 1a).
Possible cytotoxicity during extended treatment of confluent monolayers of iBREC with chloroquine was also assessed by sensitive cell index (CI) measurements. Indeed, CI values remained high over four days despite a subtle transient decline around day two (Figure 1b), reflecting a confluent monolayer of cells. To investigate if the persistent barrier dysfunction induced by the growth factor VEGF-A165 – reflected by lower CI values – could be prevented by inhibition of lysosomal proteases or autophagy, iBREC were exposed to combinations of the growth factor plus chloroquine. Whereas ≤5 µM chloroquine did not noticeably alter the VEGF-A165-induced low CI, it was at least in part counteracted by 10 µM chloroquine (Figure 1c), although the protective effect was delayed. In contrast, specific inhibition of lysosomal cathepsins or non-lysosomal calpains with MG-101 did not prevent the VEGF-A165-induced decline of CI values (Figure 1d). By comparison, this effect was completely abolished by the VEGFR2 inhibitor tivozanib (Figure 1e). Notably, neither inhibitor affected CI values when applied alone [14,38].
2.3. VEGF-A165-lowered expression of claudin-1 was not prevented by chloroquine
VEGF-A-induced dysfunction of the REC barrier is accompanied by altered expression of proteins restricting para- and transcellular flow, e.g., loss of TJ-protein claudin-1. Therefore, we investigated if inhibition of lysosomal proteases also prevented their VEGF-A165-induced changes, assessed by Western-blotting of cell extracts obtained from effector-treated iBREC. For normalization of antigen-specific signals, β-actin was always used as loading control. Its amounts were not altered over time by chloroquine and/or VEGF-A165 (Table 1) or by MG-101 ± VEGF-A165 (normalized values were: 1 ± 0 for 0 nM MG-101, 0.97 ±0 .23 for 20 nM MG-101, 0.87 ± 0.20 for 500 nM MG-101, 1.09 ± 0.29 for 1.3 nM VEGF-A165, 1.09 ± 0.33 for 1.3 nM VEGF-A165 + 20 nM MG-101, 1.02 ± 0.38 for 1.3 nM VEGF-A165 + 500 nM MG-101, p>0.05 for all comparisons, N≥5).
Confluent iBREC were exposed to effectors before cells were harvested at indicated time points. Amounts of β-actin were determined by Western blotting, and specific signals were normalized to those obtained from cells exposed to 0 µM chloroquine (= vehicle-treated cells). Data from multiple independent Western blot analyses were pooled and analyzed as described in section “4.6 Statistical analyses”; mean ± standard deviations are shown. Expression of β-actin remained stable throughout; p>0.05 for all comparisons within each time point.
To confirm that the used polyclonal antibodies bind specifically to claudin-1 (see Table 2), we precipitated the TJ-protein from whole cell extracts. Far-Western analyses revealed that the precipitate indeed contained claudin-1 but not the related and highly expressed TJ-protein claudin-5 (Figure 2a). In accordance with the CI measurements, claudin-1 was low after exposure to VEGF-A165, not prevented by MG-101 (Figure 2b). Interestingly, expression of the TJ-protein was also significantly lower after extended treatment with 10 µM chloroquine, partly correlating with the observed low CI values (Figure 2c, d). In spite of a partial stabilization of the CI values, chloroquine failed to counteract the VEGF-A165-induced loss of claudin-1 even late after its addition (Figure 2c, e).
2.4. VEGF-A165-Induced Upregulation of PLVAP was Counteracted by Chloroquine
As anticipated, plasmalemma vesicle-associated protein (PLVAP), a regulator of transcellular transport, was only expressed at low amounts in unchallenged iBREC, and was strongly upregulated on days two and four following VEGF-A165 stimulation (Figure 3). This alteration was efficiently prevented by chloroquine in a nearly concentration-dependent manner correlating with the observed partial stabilization of the CI values. The inhibitor itself did not alter the low basal expression of PLVAP.
2.4. Chloroquine Lowered Expression and/or Changed Subcellular Localization of Proteins Typical of Endothelial Cells
Similar to other microvascular endothelial cells, unchallenged iBREC express high amounts of TJ-protein claudin-5, which remained unchanged following prolonged exposure to chloroquine (Figure 4a). VEGF-A165 treatment significantly increased claudin-5 levels (Figure 4b), an effect that was lowered by 5 µM chloroquine, and even more pronounced by 10 µM upon extended incubation (Figure 4b). In accordance with our previous findings, claudin-5 was strongly localized at the plasma membrane of unchallenged iBREC (Figure 5, yellow arrowhead) [8]. After exposure to 10 µM chloroquine for four days, the membrane-associated staining was noticeably reduced and a pronounced perinuclear accumulation was observed (Figure 5, yellow arrow). This perinuclear staining was even stronger when cells had been additionally exposed to VEGF-A165. Interestingly, expression of total claudin-5 – assessed by Western blot analyses – was then significantly lower: Normalized expression of claudin-5 was 1.16 ± 0.12 for 10 µM chloroquine compared to 0.41 ± 0.19 for 10 µM chloroquine + 1.3 nM VEGF-A165, p=0.0021; N=6). Cells exposed to 10 µM chloroquine ± VEGF-A165 did no longer express the cobble-stone morphology, typical of microvascular endothelial cells, but appeared to be larger with spike-like extensions connecting the cells, which stained positive for claudin-5 (Figure5, white arrow).
Observed alterations of expression and/or subcellular localization of claudin-5 might point to a loss of the endothelial phenotype. Accordingly, the strong granular staining with vWF-specific antibodies, which is characteristic of endothelial cells (EC) and was also observed in unchallenged iBREC (Figure 6a), was significantly reduced after extended exposure to 10 µM chloroquine ± VEGF-A165 (Figure 6a). In addition, caveolin-1 expression showed a tendency to decrease after four days of chloroquine treatment (Figure 6b), particularly in the presence of VEGF-A165 (Figure 6c), whereas VEGF-A165 alone did not alter caveolin-1 levels.
Expression of the full-length variant of VEcadherin (~ 130 kDa), a major component of adherens junctions, remained stable during extended exposure to chloroquine, also not changed by VEGF-A165 (Figure 7a, b). Interestingly, during treatment of iBREC with chloroquine ± VEGF-A165, an additional band at ~ 35 kDa became significantly more pronounced using antibodies raised against the C-terminus of the protein (Figure 7a, c).
3. Discussion
Using iBREC, our well-established in vitro model of the tight inner blood-retina barrier, we investigated if chloroquine, an inhibitor of lysosomal degradation and autophagy, counteracts the VEGF-A165-induced barrier impairment. We observed that even during extended exposure over several days cell numbers are only slightly reduced and cell index values remain high, confirming that, similar to other cells types, ≤ 10 µM chloroquine is not cytotoxic to microvascular REC [39]. Continuous and non-invasive determination of the cell index is a reliable method to assess cell vitality, not only because even subtle and transient changes of vital characteristics of the investigated cells can easily be monitored over an extended time span; detachment of cells or cell death is characterized by very low values of the cell index. [14,26,40,41,42]
During exposure of iBREC to VEGF-A165 in the presence of 10 µM chloroquine, cell index values approach near-normal levels, and the observed low amounts of PLVAP indeed suggest efficient restriction of transcellular flow. Similar to macrovascular endothelial cells of the umbilical cord (HUVEC), chloroquine, at least in part, counteracts activation of VEGFR2 responsible for barrier impairment induced by the growth factor in microvascular iBREC [15,43]. However, barrier stabilization is not complete and also delayed, probably because degradation of claudin-1 is not ameliorated by chloroquine. Since inhibition of lysosomal cysteine-dependent proteases with MG-101 also fails to prevent loss of claudin-1, we conclude that lysosomal degradation of this TJ-protein plays a minor, if any, role in VEGF-A165-induced signal transduction in microvascular iBREC [35,36]. However, chloroquine-mediated stabilization of claudin-1 would not have surprised, because the inhibitor prevents loss of the TJ-protein induced by hypotonic stress in renal tubular epithelial cells [17]. Interestingly, loss of claudin-1 induced by hypotonic stress but not by VEGF-A is prevented by inhibiting c-jun-N-terminal kinases or p38 MAPK [14,17]. Therefore, regulation of degradation of a specific protein, although supposedly highly conserved, seems to depend on cell type and/or nature of interference. It is an important observation, that variations of even high cell index values obtained from unchallenged compared to effector-treated cell layers might point to a leaky barrier characterized by altered expression and/or subcellular localization of proteins restricting para- and transcellular flow.
Extended treatment with ≥ 5 µM chloroquine induces drastic responses of iBREC, especially in the presence of VEGF-A165: (1) Claudin-5, typically expressed by microvascular endothelial cells, is significantly reduced and – most importantly – its subcellular localization is dramatically changed, (2) levels of vWF and caveolin-1 are decreased, and (3) the amount of a C-terminal fragment of VEcadherin strongly increases. As a consequence of apoptotic processes in epithelial and endothelial cells, cleavage of the full-length cadherins by caspases or metalloproteinases results in formation of a C-terminal fragment, efficiently prevented in HUVEC by specific inhibition of A disintegrin and metalloproteinase (ADAM) 10 [44,45]. This sheddase is also expressed by iBREC, therefore, one might speculate that chloroquine (in)directly raises the activity of ADAM10, subsequently increasing the amount of the C-terminal fragment of VEcadherin [46]. Shedding of other membrane-bound proteins, i.e., VEGFR2, is induced in HUVEC by chloroquine, a process also mediated by ADAMs [43,47]. Whereas reduced expressions of other investigated proteins might point to a generally increased proteolytic activity in chloroquine-exposed REC, amounts of the cytoskeletal protein β-actin remain unchanged. Therefore, a more specific process seems to lead to the low levels of proteins involved in regulation of barrier integrity. In this context it is also of interest, that low expression of caveolin-1 is associated with induction of endothelial-to-mesenchymal transition, a process induced by hypoxia in human cardiac microvascular endothelial cells, further enhanced by chloroquine [29,48]. Taken together, altered morphology as well as low expression of proteins typical of (microvascular) endothelial cells indicate a phenotypic change in retinal endothelial cells following prolonged exposure to chloroquine with or without VEGF-A165.
Treatment of retinal endothelial cells over several days with chloroquine at concentrations reached by systemic exposure, i.e., ~ 1 µM after a single dose, results in subtle changes only [49]. However, higher concentrations of chloroquine are observed in melanin-containing cells of the retinal pigment epithelium, where the inhibitor accumulates, leading to a dysfunction of the barrier formed by retinal pigment epithelial cells, and consequently to the break-down of the outer blood-retina barrier [32,33,49]. During repetitive and long-term treatment of inflammatory diseases, high concentrations of chloroquine could arise in the retina, and consequently in the retinal vessels, thereby possibly leading to phenotypic changes and loss of function of the retinal endothelial cell layer [50]. Although the observed phenotypic changes induced by chloroquine might not solely derive from prevention of autophagy, interference with this vital and tightly regulated process could be harmful in an organ as sensitive as the eye.
4. Materials and Methods
4.1. Antibodies and Reagents
All relevant information on the antibodies used in this study can be found in Table 2; their specific reactivity has been confirmed in previous studies [8,14,15,38,51].

Table 2.
Antibodies used for Western-blotting and immunofluorescence staining.
| Target | Host, Type and Conjugate | Sourcea) | Working concentration |
|---|---|---|---|
| β-actin | mouse, monoclonal | clone BA3R, Invitrogen, #MA5-15739 | 100 ng/ml (WB) |
| caveolin-1 | rabbit, polyclonal | abcam, #ab2910 | 20 ng/ml (WB) |
| claudin-1, (C-terminus) | rabbit, polyclonal | Invitrogen, #51-9000 | 250 ng/ml (WB) |
| claudin-5, (C-terminus) | rabbit, polyclonal | Invitrogen, #34-1600 | 100 ng/ml (WB) 2.5 µg/ml (IF) |
| PLVAPb) | rabbit, polyclonal | Invitrogen, #PA5-110183 | 2 µg/ml(WB) |
| VEcadherin, (C-terminus) | rabbit, polyclonal | Cell Signaling Technology B.V., #2158 | 1:2000 (WB) |
| vWF | rabbit, polyclonal | Novus Biologicals, #NB600-586 | 1:1000 (IF) |
| whole rabbit IgG | goat, polyclonal, coupled to HRP |
Biorad, #170-5046 | 1:15000 (WB) |
| whole mouse IgG | goat, polyclonal, coupled to HRP |
Biorad, #170-5047 | 1:30000 (WB) |
| IgG, H + L chains, rabbit | goat, F(ab’)2 fragment, coupled to AlexaFluor594 |
Invitrogen, #A11072 | 1:500 (IF) |
a) abcam, Cambrigde, United Kingdom; Biorad, Munich, Germany; Cell Signaling Technology B.V., Frankfurt, Germany; Invitrogen via Thermo Fisher Scientific, Schwerte, Germany; Novus Biologicals via bio-techne, Wiesbaden, Germany. b) HRP, horseradish peroxidase; IF, immunofluorescence staining, PLVAP, plasmalemma vesical-associated protein; VEcadherin, vascular endothelial cadherin; vWF, von Willebrand Factor; WB, Western blot analyses.
Chloroquine (#S6999), MG-101 (#S7386) and tivozanib (#S1207) were bought from Selleckchem (Absource Diagnostics GmbH, Munich, Germany) and dissolved in dimethyl sulfoxide (Merck, Darmstadt, Germany) to achieve final solvent concentrations below 0.05% in the cell culture medium, which do not affect morphology or behavior of iBREC [14]. Recombinant human Sf21-expressed VEGF-A165 (#293VE) was purchased from bio-techne (Wiesbaden, Germany), dissolved in phosphate-buffered saline without Ca2+ and Mg2+ (PBSd; Thermo Fisher Scientific, Schwerte, Germany) at a final concentration of 100 µg/ml, and stored at -80°C for no longer than three months [8].
4.2. Cultivation of iBREC
Telomerase-immortalized microvascular endothelial cells from the bovine retina (iBREC) were established in our laboratory and were cultivated on surfaces coated with fibronectin (Corning, Amsterdam, The Netherlands) in supplemented Endothelial Cell Growth Medium MV (ECGM-1; #C-22120, Promocell, Heidelberg, Germany; containing 1 g/l glucose, 0.4% Endothelial Cell Growth Supplement/H, 90 µg/ml heparin, 10 ng/ml human epidermal growth factor (hEGF), 100 nM hydrocortisone, 5% fetal bovine serum (all supplements purchased from Promocell) and 300 µg/ml geneticin (Thermo Fisher Scientific) as described in detail elsewhere [15,25,51]. Cells were used from passages 25 to 60, counting from the stage of primary culture, for which stable expression of proteins specific to microvascular EC, e.g., claudin-5, vWF, as well as other proteins investigated in this study were confirmed [8,14,25]. Absence of mycoplasma contamination was regularly verified by staining fixed cells with 4’,6-diamidino-2-phenylindole (DAPI; λex/λem=359 nm/461 nm) and subsequent examination with a fluorescence microscope. To ensure the authenticity of the cells, their characteristic proliferation profile was routinely recorded by continuously measuring the cell index via electrical cell-substrate impedance with the microelectronic biosensor system xCELLigence RTCA DP (Agilent, OLS, Bremen, Germany) for cell-based assays [14].
4.3. Cell Index Measurements
As a measure of stability of the barrier formed by a monolayer of iBREC, we continuously monitored the cell index (CI) as previously described [8,14,16]. In each individual well of an E-Plate 16 PET (Agilent), impedance is measured between gold electrodes at the beginning of an experiment (Z0) and at individual time points (Zi) thereafter, and expressed as the unit-free parameter CI=(Zi-Z0)/15 Ω (RTCA Software Pro Version 2.6.1, Agilent) [26]. Briefly, ~104 cells per fibronectin-coated well were cultured in ECGM-2 (ECGM-1 lacking hEGF but containing 10 µg/ml fibronectin) until a confluent cell monolayer was reached three days later, indicated by a constant and high cell index (CI ~ 20). Then, the cell culture medium was replaced with ECGM-2. One day later, chloroquine (final concentrations of 1 µM, 5 µM or 10 µM), MG-101 (final concentrations of 20 nM or 500 nM), tivozanib (final concentrations of 10 nM) with or without VEGF-A165 (final concentration of 50 ng/ml~1.3 nM) were added, and the CI was determined every five minutes until the end of the experiments. At the end of each experiment, cells were harvested for preparation of cell extracts (see 4.4). The recorded CI values (n≥6 for each condition and time point) were normalized in relation to those measured immediately prior to the addition of the effectors.
4.4. Preparation of Protein Extracts, Immunoprecipitation and Subsequent Western Blot Analyses
Confluent cells, cultured either on E-plates or in fibronectin-coated T25-cell culture flasks (Sarstedt, Nuembrecht, Germany), were exposed to effectors as described above for one, two or four days before they were harvested. After washing of the cells in ice-cold phosphate-buffered saline (PBS; Thermo Fisher Scientific) supplemented with 0.5x EDTA-free Halt Protease Inhibitor Cocktail (#78437, Thermo Fisher Scientific), they were suspended in lysis buffer (Lysis buffer 17 (#895943, bio-techne)), supplemented with 1x EDTA-free HALT Protease Inhibitor Cocktail and 0.2% Phosphatase Inhibitor Cocktail 2 (#P5726-1ML, Merck), in 10 µl per well of an E-Plate or 100 µl per T25-cell culture flask. After incubation on ice under gentle shaking for 30 minutes and subsequent centrifugation (18000xg, 30 minutes, 4°C), the supernatant was collected and stored at -80°C [8,52].
For immunoprecipitation, cell lysates obtained from 2.5x10⁶ cells were incubated with 1.25 µg antibodies raised against claudin-1 (see Table 2) or with 1.5 µg isotype control (polyclonal rabbit IgG; #27629S, Cell Signaling Technology, Frankfurt, Germany) on ice for two hours. Magnetic beads coupled to Protein A (25 µl of 30 mg/ml Dynabeads-Protein A, #10001D, Thermo Fisher Scientific) were washed with 100 µl TRIS-buffered saline (TBS)/0.1% Triton-X 100 for 10 minutes on ice, followed by 100 µl lysis buffer. Antibody-treated cell lysates were then incubated with the beads for 30 minutes under gentle shaking before the supernatant was collected and stored at -80°C. Beads were washed once with lysis buffer, twice with TBS/0.1% Triton-X 100 (#93443, Merck) before they were incubated with 25 µl elution buffer (40 mM TRIS Cl, 150 mM NaCl, 4% sodium dodecylsulfate, pH 7.4) for 10 minutes at 65°C to elute bound proteins which were stored at -80°C.
Proteins of relevance to be analyzed by Western-blotting were separated under denaturing conditions by gel electrophoresis in 4-20% Mini-PROTEAN TGX Precast Protein Gels (Bio-Rad, Munich, Germany) and transferred to a polyvinylidene fluoride membrane (Immun-Blot PVDF membrane, #1620177, Bio-Rad). After incubation in a solution of 1% blocking reagent (#11096176001, Merck) in PBSd with 0.1% Tween-20 (#P9416, Merck) for 90 minutes at room temperature or overnight at 4°C, membranes were exposed to primary antibodies for 90 minutes, followed by washing in PBSd/0.1% Tween-20 and incubation with corresponding secondary antibodies for 30 minutes at room temperature. All antibodies were diluted in 0.1% blocking reagent in PBSd/0.1% Tween-20. Membranes were washed again and treated with Pierce™ ECL Plus Western Blotting-substrate (#32132X3, Thermo Fisher Scientific). Chemiluminescence signals were subsequently scanned with the imaging system Fusion FX6 Edge V0.7 (Vilber Lourmat, Eberhardzell, Germany) [8,52]. To allow re-exposure to antibodies with other specificity, membranes were stripped by incubation in Restore Plus Western Blot Stripping Buffer (#46430, Thermo Fisher Scientific) for 45 minutes at room temperature. After washing three times for 3 minutes with PBSd/0.1% Tween-20, membranes were incubated with blocking solution and subsequently with appropriate primary and secondary antibodies as described above [51,52].
4.5. Immunofluorescence Staining
Cells were cultured on fibronectin-coated two-chamber slides (x-well PCA Tissue Culture Chambers, #94.6140.202, Sarstedt) until a confluent monolayer was reached. Then the cell culture medium was replaced by 1.5 ml ECGM-2 per well and one day later effectors were added. After further incubation for four days, cells were fixed in methanol for 7.5 minutes at -20°C. Cells were permeabilized for 10 minutes in PBSd/0.1% Triton-X 100, followed by incubation of the slides in blocking solution (10% ImmunoBlock; #T144.1, Roth, Karlsruhe, Germany) for 60 minutes in a humidity chamber at room temperature. Slides were incubated with antibodies against claudin-5 or vWF (see Table 2), and subsequently for 30 minutes with AlexaFluor594-conjugated goat anti-rabbit secondary F(ab´)2 fragments (λex/λem=596 nm/620 nm); antibodies were always diluted in 1% ImmunoBlock/ PBSd. Slides were embedded in ProLong Gold Antifade Mountant with DAPI (#P36935; Thermo Fisher Scientific) for examination with a fluorescence microscope (BZ-8100E, Keyence Deutschland GmbH, Neu-Isenburg, Germany). DAPI-stained nuclei were counted in randomly chosen microscopic fields for assessment of a potential effect of chloroquine on cell numbers. Cells with granular staining specific to vWF were counted in randomly chosen microscopic fields containing ~65 cells/field. The claudin-5-specific staining was evaluated with an Olympus FV10i (Hamburg, Germany) confocal microscope equipped with argon and HeNe lasers. High-resolution images were taken with an UPlanSApo x60/1.35 (Olympus) oil immersion objective at 1024 x 1024 pixels [53]. Images taken at the different wave lengths were merged with BZ-Analyzer BZ-H1M3E or OLYMPUS FLUOVIEW Version 4.1a, respectively; Figure 5 and Figure 6 contain original, non-cropped images which have not been not further processed.
4.6. Statistical Analyses
All experiments were performed at least three times. In control experiments, cells were always processed in cell culture medium only lacking the effector(s) investigated.
The recorded CI values (n≥6 for each condition and time point) were either analyzed directly or normalized in relation to those measured immediately prior to the addition of the effectors (RTCA Software Pro Version 2.6.1). Absolute or normalized CI values were converted to graphs showing means (thick line) and standard deviations (thin lines), and were analyzed with two-way analyses of variance (ANOVA) followed by Šídák’s multiple comparison test [8,52].
To quantify the specific signals obtained by Western-blotting, peak volumes of the protein-specific bands determined with EvolutionCapt Edge software (Version 18.12; Vilber Lourmat) were first set in relation to those of β-actin in the very same sample. Depending on the type of experiment, signals were then normalized to those obtained from similarly processed control cells (analyses of claudin-1, claudin-5, VEcadherin, caveolin-1), or, in order to quantify PLVAP, to those obtained from cells exposed only to VEGF-A165 [8,16,52]. Data from multiple Western blots, performed with at least three independently prepared cell extracts, were pooled (N≥5 per condition and time point), and presented along with means and standard deviations as numbers, scatter plots or graphs. To compare the antigen-specific Western blot signals from effector-treated cells to the hypothetical value of 1.00 of normalized signals from control cells, we used the one-sample t-test, which considers the variation of the standard deviation although it appears to be zero in the calculations or graphs. The one-way ANOVA followed by Tukey’s test was applied to compare several groups of antigen-specific Western blot signals or number of cells per field from differently treated cells.
All statistical analyses were performed with Graph Pad Prism 9.4.1 (Graph Pad Software, San Diego, USA); means and standard deviations are provided as numbers, graphs or in scatter plots; only statistically significant differences are indicated. Differences resulting in p-values below 0.05 were considered significant. *) p<0.05, **) p<0.01, ***) p<0.001, ****) p<0.0001.
5. Conclusions
The phenotype of microvascular retinal endothelial cells is altered by chloroquine, thereby overruling its apparent stabilization of a VEGF-A165-challenged barrier.
Supplementary Materials
The following supporting information can be downloaded at the website of this paper posted on Preprints.org, Figures S1-S5: Original images of Western blot data shown in Figures 2-4,6,7.
Author Contributions
Conceptualization, I.F. and H.L.D.; methodology, I.F. and H.L.D.; validation, H.L.D.; formal analysis, I.F., E.J.H. and H.L.D.; investigation, I.F. and E.J.H.; writing—original draft preparation, I.F., E.J.H. and H.L.D..; writing—review and editing, I.F., E.J.H., L.L. and H.L.D..; supervision, L.L. and H.L.D.; funding acquisition, H.L.D. All authors have read and agreed to the published version of the manuscript.
Funding
This research was supported by the Deutsche Forschungsgemeinschaft, Bonn, Germany (DE 2085/9-1, project no. 532772298, to H.L.D.) and by Giessener Lichtblicke e.V., Giessen, Germany. The funding sources did not have any influence on study design, data analyses and interpretation, writing of the manuscript and decision on publishing.
Institutional Review Board Statement
Not applicable; this study does not involve humans or animals.
Data Availability Statement
The original data used to support the findings of this study are either included in the article or are available from the corresponding author upon request.
Acknowledgments
The authors thank Dr. Brigitte Müller, Department of Ophthalmology, Justus Liebig University Giessen, Giessen, Germany, for help with laser-scanning microscopy.
Conflicts of Interest
The authors declare no conflicts of interest.
Abbreviations
The following abbreviations are used in this manuscript:
| ADAM | A desintegrin and metalloproteinase |
| BRB | blood-retina barrier |
| CI | cell index |
| CQ | chloroquine |
| CTF | C-terminal fragment |
| DAPI | 4’,6-diamidino-2-phenylindole |
| EC | endothelial cells |
| FL | full length |
| hEGF | human epidermal growth factor |
| HRP | horseradish peroxidase |
| HUVEC | human endothelial cells of the umbilical cord |
| iBREC | immortalized bovine retinal endothelial cells |
| IF | immunofluorescence staining |
| PBS | phosphate-buffered saline |
| PBSd | PBS without Ca2+ and without Mg2+ ions |
| PLVAP | plasmalemma vesicle-associated protein |
| REC | retinal endothelial cells |
| TJ | tight junction |
| TBS | TRIS-buffered saline |
| TRIS | Tris(hydroxymethyl)aminomethane |
| VEcadherin | vascular endothelial cadherin |
| VEGF-A | vascular endothelial growth factor-A |
| VEGFR | vascular endothelial growth factor receptor |
| vWF | von Willebrand factor |
| WB | Western blot analyses |
References
- Campochiaro, P.A. Retinal and choroidal neovascularization. J. Cell Physiol. 2000, 184, 301–310. [Google Scholar] [CrossRef]
- Campochiaro, P.A. Ocular neovascularization. J. Mol. Med. 2013, 91, 311–321. [Google Scholar] [CrossRef]
- Aiello, L.P.; Avery, R.L.; Arrigg, P.G.; Keyt, B.A.; Jampel, H.D.; Shah, S.T.; Pasquale, L.R.; Thieme, H.; Iwamoto, M.A.; Park, J.E.; Nguyen, H.V.; Aiello, L.M.; Ferrara, N.; King, G.L. Vascular endothelial growth factor in ocular fluid of patients with diabetic retinopathy and other retinal disorders. N. Engl. J. Med. 1994, 331, 1480–1487. [Google Scholar] [CrossRef] [PubMed]
- Qaum, T.; Xu, Q.; Joussen, A.M.; Clemens, M.W.; Qin, W.; Miyamoto, K.; Hassessian, H.; Wiegand, S.J.; Rudge, J.; Yancopoulos, G.D.; Adamis, A.P. VEGF-initiated blood-retinal barrier breakdown in early diabetes. Invest. Ophthalmol. Vis. Sci. 2001, 42, 2408–2413. [Google Scholar] [PubMed]
- Antonetti, D.A.; Barber, A.J.; Hollinger, L.A.; Wolpert, E.B.; Gardner, T.W. Vascular endothelial growth factor induces rapid phosphorylation of tight junction proteins occludin and zonula occludens 1. J. Biol. Chem. 1999, 274, 23463–23467. [Google Scholar] [CrossRef]
- Klaassen, I.; Hughes, J.M.; Vogels, I.M.C.; Schalkwijk, C.G.; Van Noorden, C.J.F.; Schlingemann, R.O. Altered expression of genes related to blood–retina barrier disruption in streptozotocin-induced diabetes. Exp. Eye Res. 2009, 89, 4–15. [Google Scholar] [CrossRef]
- Deissler, H.; Deissler, H.; Lang, G.E. Inhibition of VEGF is sufficient to completely restore barrier malfunction induced by growth factors in microvascular retinal endothelial cells. Br. J. Ophthalmol. 2011, 95, 1151–1156. [Google Scholar] [CrossRef] [PubMed]
- Deissler, H.L.; Rehak, M.; Busch, C.; Wolf, A. Blocking of VEGF-A is not sufficient to completely revert its long-term effects on the barrier formed by retinal endothelial cells. Exp. Eye Res. 2022, 216, 108945. [Google Scholar] [CrossRef]
- Suarez, S.; McCollum, G.W.; Bretz, C.A.; Yang, R.; Capozzi, M.E.; Penn, J.S. Modulation of VEGF-induced retinal vascular permeability by peroxisome proliferator-activated receptor-β/δ. Invest. Ophthalmol. Vis. Sci. 2014, 55, 8232–8240. [Google Scholar] [CrossRef]
- Wisniewska-Kruk, J.; Hoeben, K.A.; Vogels, I.M.; Gaillard, P.J.; Van Noorden, C.J.; Schlingemann, R.O.; Klaassen, I. A novel co-culture model of the blood-retinal barrier based on primary retinal endothelial cells, pericytes and astrocytes. Exp. Eye Res. 2012, 96, 181–190. [Google Scholar] [CrossRef]
- Díaz-Coránguez, M.; Lin, C.-M.; Liebner, S.; Antonetti, D.A. Norrin restores blood-retinal barrier properties after vascular endothelial growth factor–induced permeability. J. Biol. Chem. 2020, 295, 4647–4660. [Google Scholar] [CrossRef]
- Bosma, E.K.; van Noorden, C.J.F.; Schlingemann, R.O.; Klaassen, I. The role of plasmalemma vesicle-associated protein in pathological breakdown of blood–brain and blood–retinal barriers: Potential novel therapeutic target for cerebral edema and diabetic macular edema. Fluids Barriers CNS 2018, 15, 24. [Google Scholar] [CrossRef]
- Bosma, E.K.; Darwesh, S.; Habani, Y.I.; Cammeraat, M.; Serrano Martinez, P.; van Breest Smallenburg, M.E.; Zheng, J.Y.; Vogels, I.M.C.; van Noorden, C.J.F.; Schlingemann, R.O.; Klaassen, I. Differential roles of eNOS in late effects of VEGF-A on hyperpermeability in different types of endothelial cells. Sci. Rep. 2023, 13, 21436. [Google Scholar] [CrossRef]
- Deissler, H.L.; Lang, G.K.; Lang, G.E. Inhibition of single routes of intracellular signaling is not sufficient to neutralize the biphasic disturbance of a retinal endothelial cell barrier induced by VEGF-A165. Cell. Physiol. Biochem. 2017, 42, 1493–1513. [Google Scholar] [CrossRef] [PubMed]
- Deissler, H.L.; Stutzer, J.-N.; Lang, G.K.; Grisanti, S.; Lang, G.E.; Ranjbar, M. VEGF receptor 2 inhibitor nintedanib completely reverts VEGF-A165-induced disturbances of barriers formed by retinal endothelial cells or long-term cultivated ARPE-19 cells. Exp. Eye Res. 2020, 194, 108004. [Google Scholar] [CrossRef]
- Jung, D.M.; Fuezy, I.; Lytvynchuk, L.; Deissler, H.L. Faricimab reverts VEGF-A165-induced impairment of the barrier formed by retinal endothelial cells. Int. J. Mol. Sci. 2025, 26, 4318. [Google Scholar] [CrossRef]
- Fujii, N.; Matsuo, Y.; Matsunaga, T.; Endo, S.; Sakai, H.; Yamaguchi, M.; Yamazaki, Y.; Suganati, J.; Ikari, A. Hypotonic stress-induced down-regulation of claudin-1 and -2 mediated by dephosphorylation and clathrin-dependent endocytosis in renal tubular epithelial cells. J. Biol. Chem. 2016, 291, 24787–24799. [Google Scholar] [CrossRef] [PubMed]
- Berliner, R.W.; Earle, D.P.; Taggart, J.V.; Zubrod, C.G.; Welch, W.J.; Conan, N.J.; Bauman, E.; Scudder, S.T.; Shannon, J.A. Studies on the chemotherapy of the human malarias. VI. The physiological disposition, antimalarial activity, and toxicity of several derivates of 4-aminoquinoline. J. Clin. Invest. 1948, 27, 98–107. [Google Scholar] [CrossRef]
- Homewood, C.A.; Warhurst, D.C.; Peters, W.; Baggaley, V.C. Lysosomes, pH and the anti-malarial action of chloroquine. Nature 1972, 235, 50–52. [Google Scholar] [CrossRef] [PubMed]
- Mauthe, M.; Orhon, I.; Rocchi, C.; Zhou, X.; Luhr, M.; Hijlkema, K-J.; Coppes, R.P.; Engedal, N.; Mari, M.; Reggiori, F. Chloroquine inhibits autophagic flux by decreasing autophagosome-lysosome fusion. Autophagy 2018, 14, 1435–1455. [Google Scholar] [CrossRef]
- Glick, D.; Barth, S.; Macleod, K.F. Autophagy: cellular and molecular mechanisms. J. Pathol. 2010, 221, 3–12. [Google Scholar] [CrossRef]
- Frost, L.S.; Mitchell, C.H.; Boesze-Battaglia, K. Autophagy in the eye: Implications for ocular health. Exp. Eye Res. 2014, 124, 56–66. [Google Scholar] [CrossRef] [PubMed]
- Li, R.; Wang, L.Z.; Du, J.H.; Zhao, L.; Yao, Y. Autophagy activation and the mechanism of retinal microvascular endothelial cells in hypoxia. Int. J. Ophthalmol. 2018, 11, 567–574. [Google Scholar] [CrossRef] [PubMed]
- Li, R.; Tian, J.; Du, J.; Zhao, L.; Yao, Y.; Yu, Z.; Chang, W.; Shi, R.; Jing, L. Manipulation of autophagy: a novelly potential therapeutic strategy for retinal neovascularization. BMC Ophthalmol. 2018, 18, 110. [Google Scholar] [CrossRef] [PubMed]
- Deissler, H.; Deissler, H.; Lang, G.K.; Lang, G.E. Generation and characterization of iBREC: Novel hTERT-immortalized bovine retinal endothelial cells. Int. J. Mol. Med. 2005, 15, 65–70. [Google Scholar] [CrossRef]
- Sun, M.; Fu, H.; Cheng, H.; Cao, Q.; Zhao, Y.; Mou, X.; Zhang, X.; Liu, X.; Ke, Y. A dynamic real-time method for monitoring epithelial barrier function in vitro. Anal. Biochem. 2012, 425, 96–103. [Google Scholar] [CrossRef]
- Kluger, M.S.; Clark, P.R.; Tellides, G.; Gerke, V.; Pober, J.S. Claudin-5 controls intercellular barriers of human dermal microvascular but not human umbilical vein endothelial cells. Arterioscler. Thromb. Vasc. Biol. 2014, 33, 489–500. [Google Scholar] [CrossRef]
- Fridolfsson, H.N.; Roth, D.M.; Insel, P.A.; Patel, H.H. Regulation of intracellular signaling and function by caveolin. FASEB J. 2014, 28, 3823–3831. [Google Scholar] [CrossRef]
- Li, Z.; Wermuth, P.J.; Benn, B.S.; Lisanti, M.P.; Jimenez, S.A. Caveolin-1 deficiency induces spontaneous endothelial-to-mesenchymal transition in murine pulmonary endothelial cells in vitro. Am. J. Pathol. 2012, 182, 325–331. [Google Scholar] [CrossRef]
- Jaffe, E.A. Endothelial cells and the biology of factor VIII. N. Engl. J. Med. 1977, 296, 477–483. [Google Scholar] [CrossRef]
- Dejana, E.; Tournier-Lasserve, E.; Weinstein, B.M. The control of vascular integrity by endothelial cell junctions: molecular basis and pathological implications. Dev. Cell. 2009, 16, 209–221. [Google Scholar] [CrossRef]
- Raines, M.F.; Bhargava, S.K.; Rosen, E.S. The blood-retinal barrier in chloroquine retinopathy. Invest. Ophthalmol. Vis. Sci. 1989, 30, 1726–1731. [Google Scholar]
- Korthagen, N.M.; Bastiaans, J.; van Meurs, J.C.; van Bilsen, K.; van Hagen, P.M.; Dik, W.A. Chloroquine and hydroxychloroquine increase retinal pigment epithelial layer permeability. J. Biochem. Mol. Toxicol. 2015, 29, 299–304. [Google Scholar] [CrossRef] [PubMed]
- Zeng, F.; Xu, J.; Harris, R.C. Nedd4 mediates ErbB4 JM-a/CYT-1 ICD ubiquitination and degradation in MDCK II cells. FASEB J. 2009, 23, 1935–1945. [Google Scholar] [CrossRef] [PubMed]
- Hiwasa, T.; Sawada, T.; Sakiyama, S. Cysteine proteinase inhibitors and ras gene products share the same biological activities including transforming activity toward NIH3T3 mouse fibroblasts and the differentiation-inducing activity toward PC12 rat pheochromocytoma cells. Carcinogenesis 1990, 11, 75–80. [Google Scholar] [CrossRef] [PubMed]
- Inoue, S.; Bar-Nun, S.; Roitelman, J.; Simoni, R.D. Inhibition of degradation of 3-hydroxy-3-methylglutaryl-coenzyme A reductase in vivo by cysteine protease inhibitors. J. Biol. Chem. 1991, 266, 13311–13317. [Google Scholar] [CrossRef]
- Nakamura, K.; Taguchi, E.; Miura, T.; Yamamoto, A.; Takahashi, K.; Bichat, F.; Guilbaud, N.; Hasegawa, K.; Kubo, K.; Fujiwara, Y.; Suzuki, R.; Kubo, K.; Shibuya, M.; Isae, T. KRN951, a highly potent inhibitor of vascular endothelial growth factor receptor tyrosine kinases, has antitumor activities and affects functional vascular properties. Cancer Res. 2006, 66, 9134–9142. [Google Scholar] [CrossRef]
- Deissler, H.L.; Lang, G.K.; Lang, G.E. Fate of the Fc fusion protein aflibercept in retinal endothelial cells: competition of recycling and degradation. Graefes Arch. Clin. Exp. Ophthalmol. 2019, 257, 83–94. [Google Scholar] [CrossRef]
- Yang, J.; Guo, Z.; Liu, X.; Liu, Q.; Wu, M.; Yao, X.; Liu, Y.; Cui, C.; Li, H.; Song, C.; Liu, D.; Xue, L. Cytotoxicity evaluation of chloroquine and hydroxychloroquine in multiple cell lines and tissues by dynamic imaging system and physiologically based pharmacokinetic model. Front. Pharmacol. 2020, 11, 574720. [Google Scholar] [CrossRef]
- Xing, J.Z.; Zhu, L.; Jackson, J.A.; Gabos, S.; Sun, X.-J.; Wang, X.-B.; Xu, X. Dynamic monitoring of cytotoxicity on microelectronic sensors. Chem. Res. Toxicol. 2005, 18, 154–161. [Google Scholar] [CrossRef]
- Atienza, J.M.; Zhu, J.; Wang, X.; Xu, X.; Abassi, Y. Dynamic monitoring of cell adhesion and spreading on microelectronic sensor arrays. J. Biomol. Screen. 2005, 10, 795–805. [Google Scholar] [CrossRef]
- Bischoff, I.; Hornburger, M.C.; Mayer, B.A.; Beyerle, A.; Wegener, J.; Fürst, R. Pitfalls in assessing microvascular endothelial barrier function: impedance-based devices versus the classic macromolecular tracer assay. Sci. Rep. 2016, 6, 23671. [Google Scholar] [CrossRef]
- Schaaf, M.B.; Houbaert, D.; Meçe, O.; To, S.K.; Ganne, M.; Maes, H.; Agostinis, P. Lysosomal pathways and autophagy distinctively control endothelial cell behavior to affect tumor vasculature. Front. Oncol. 2019, 9, 171. [Google Scholar] [CrossRef]
- Steinhusen, U.; Weiske, J.; Badock, V.; Tauber, R.; Bommert, K.; Huber, O. Cleavage and shedding of E-cadherin after induction of apoptosis. J. Biochem. 2001, 276, 4972–4980. [Google Scholar] [CrossRef]
- Schulz, B.; Pruessmeyer, J.; Maretzky, T.; Ludwig, A.; Blobel, C.P.; Saftig, P.; Reiss, K. ADAM10 regulates endothelial permeability and T-cell transmigration by proteolysis of vascular endothelial cadherin. Circ. Res. 2008, 102, 1192–1201. [Google Scholar] [CrossRef]
- Kuhn, E.M. Characterization of protein complexes of tetraspanin CD9 and their role in migration of microvascular endothelial cells. (Original title: Charakterisierung von Proteinkomplexes des Tetraspanins CD9 mit Bedeutung für die Migration mikrovaskulärer retinaler Endothelzellen). Doctoral thesis, University of Ulm, Ulm, Germany, 2009. [Google Scholar]
- Swendeman, S.; Mendelson, K.; Weskamp, G.; Horiuchi, K.; Deutsch, U.; Scherle, P.; Hooper, A.; Rafii, S.; Blobel, C.P. VEGF-A stimulates ADAM17-dependent shedding of VEGFR2 and crosstalk between VEGFR2 and ERK signaling. Circ. Res. 2008, 103, 916–918. [Google Scholar] [CrossRef]
- Zou, J.; Liu, Y.; Li, B.; Zheng, Z.; Ke, X.; Hao, Y.; Li, X.; Li, X.; Liu, F.; Zhang, Z. Autophagy attenuates endothelial-to-mesenchymal transition by promoting Snail degradation in human cardiac microvascular endothelial cells. Biosci. Rep. 2017, 37, BSR20171049. [Google Scholar] [CrossRef] [PubMed]
- Ducharme, J.; Farinotti, R. Clinical pharmacokinetics and metabolism of chloroquine. Clin. Pharmacokinet. 1996, 31, 257–274. [Google Scholar] [CrossRef]
- Huang, T.; Liang, R.-B.; Zhang, L.-J.; Shu, H.-Y.; Ge, Q.-M.; Liao, X.-L.; Wu, J.-L.; Su, T.; Pan, Y.-C.; Zhou, Q.; Shao, Y. Retinal microvasculature alteration in patients with systemic sclerosis and chloroquine treatment. Quant. Imaging. Med. Surg. 2022, 12, 4885–4899. [Google Scholar] [CrossRef]
- Busch, C.; Rehak, M.; Hollborn, M.; Wiedemann, P.; Lang, G.K.; Lang, G.E.; Wolf, A.; Deissler, H.L. Type of culture medium determines properties of cultivated retinal endothelial cells: Induction of substantial phenotypic conversion by standard DMEM. Heliyon 2021, 7, e06037. [Google Scholar] [CrossRef]
- Deissler, H.L.; Lang, G.K.; Lang, G.E. Fate of the Fc fusion protein aflibercept in retinal endothelial cells: competition of recycling and degradation. Graefes Arch. Clin. Exp. Ophthalmol. 2019, 257, 83–94. [Google Scholar] [CrossRef] [PubMed]
- Müller, B.; Wagner, F.; Lorenz, B.; Stieger, K. Organotypic cultures of adult mouse retina: Morphologic changes and gene Expression. Invest. Ophthalmol. Vis. Sci. 2017, 58, 1930–1940. [Google Scholar] [CrossRef] [PubMed]
Figure 1.
Chloroquine partly counteracts VEGF-A165-induced reduction of the cell index. Confluent monolayers of iBREC were exposed to (a-c) chloroquine, (d) MG-101 or (e) tivozanib, with or without VEGF-A165. (a) The number of cells per field were counted or (b-e) the cell index (CI) was measured continuously. (a) Only 10 µM chloroquine decreased cell numbers in the presence or absence of VEGF-A165. (b-e) CI values were obtained from at least six wells per condition and time point, and (b) are either shown as absolute values or (c-e) were normalized in relation to those measured just before the addition of the effectors. For details, refer to section “4.6 Statistical analyses”; means ± standard deviations are depicted. (b) Chloroquine transiently lowered CI values. The strong and persistent VEGF-A165-induced decline of the CI, was (c) partly prevented by higher concentrations of chloroquine, (d) but not by MG-101. (e) Inhibition of VEGFR2 by tivozanib completely blocked the VEGF-A165-induced decline of the CI. CQ: chloroquine.
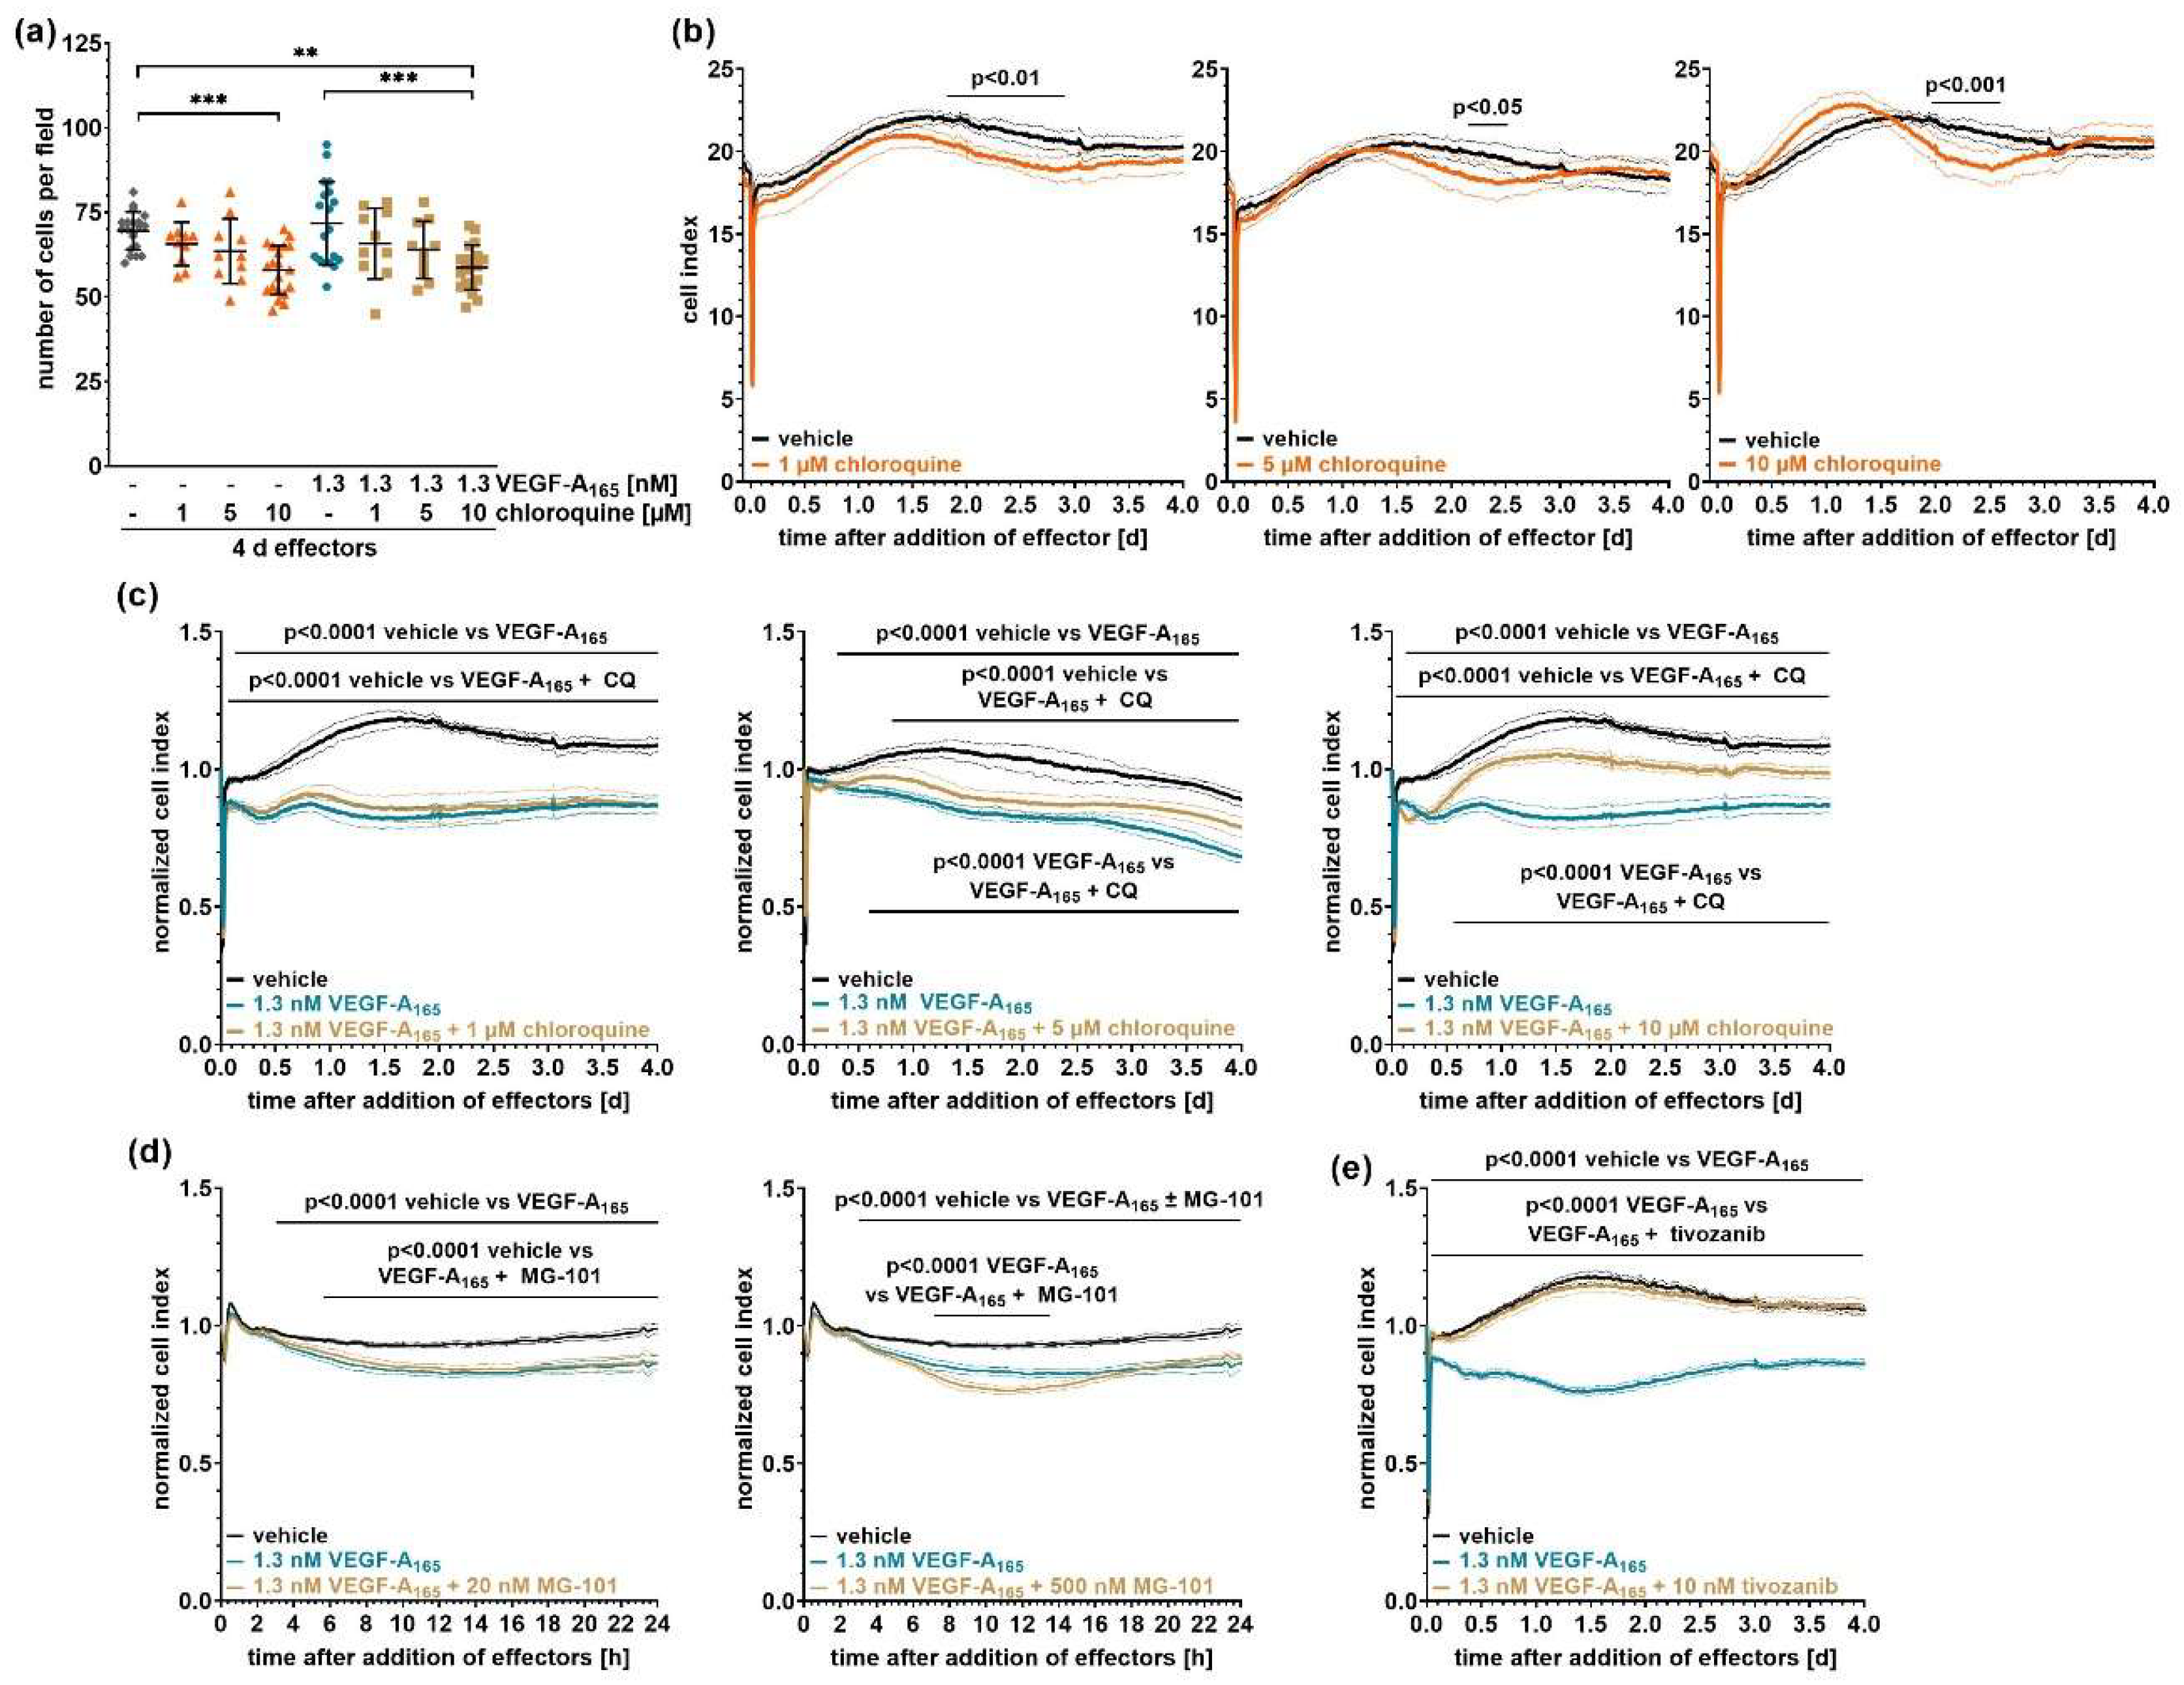
Figure 2.
Chloroquine did not prevent VEGF-A165-induced downregulation of claudin-1. (a) Claudin-1 was immuno-precipitated from cell extracts obtained from confluent iBREC, and precipitates or their supernatants were analyzed for the presence of claudin-1 or claudin-5. Strong claudin-1-specific signals were detected in the precipitate of the claudin-1 IgG, but not of the control IgG. Only the cell lysate and the supernatants of the immuno-precipitations contained relevant amounts of claudin-5, indicating a high specificity of the claudin-1 antibody. (b-e) iBREC exposed to (b) MG-101, (c-e) chloroquine and/or VEGF-A165 were harvested for preparation of cell extracts and subsequent Western blot analyses at indicated time points. The specific signals were normalized to those obtained from vehicle-treated cells. Data of multiple independent Western blot analyses were pooled (N≥5 per condition and time point) and are shown (b) as scatter plot where one dot represents the analyte-specific signal from one of multiple independent Western blot analyses or (d, e) as graphs; means ± standard deviations are depicted. For details, refer to section “4.6 Statistical analyses”. (b) MG-101 neither altered amounts of claudin-1 expressed by unchallenged iBREC nor prevented its VEGF-A165-induced loss. (c) Typical images of Western blot analyses of which original images are presented in supplementary Figure S1. (d) Extended incubation only with 10 µM chloroquine significantly lowered amounts of claudin-1. (e) Less claudin-1 was detected during extended treatment with VEGF-A165, not prevented by chloroquine. CQ: chloroquine.
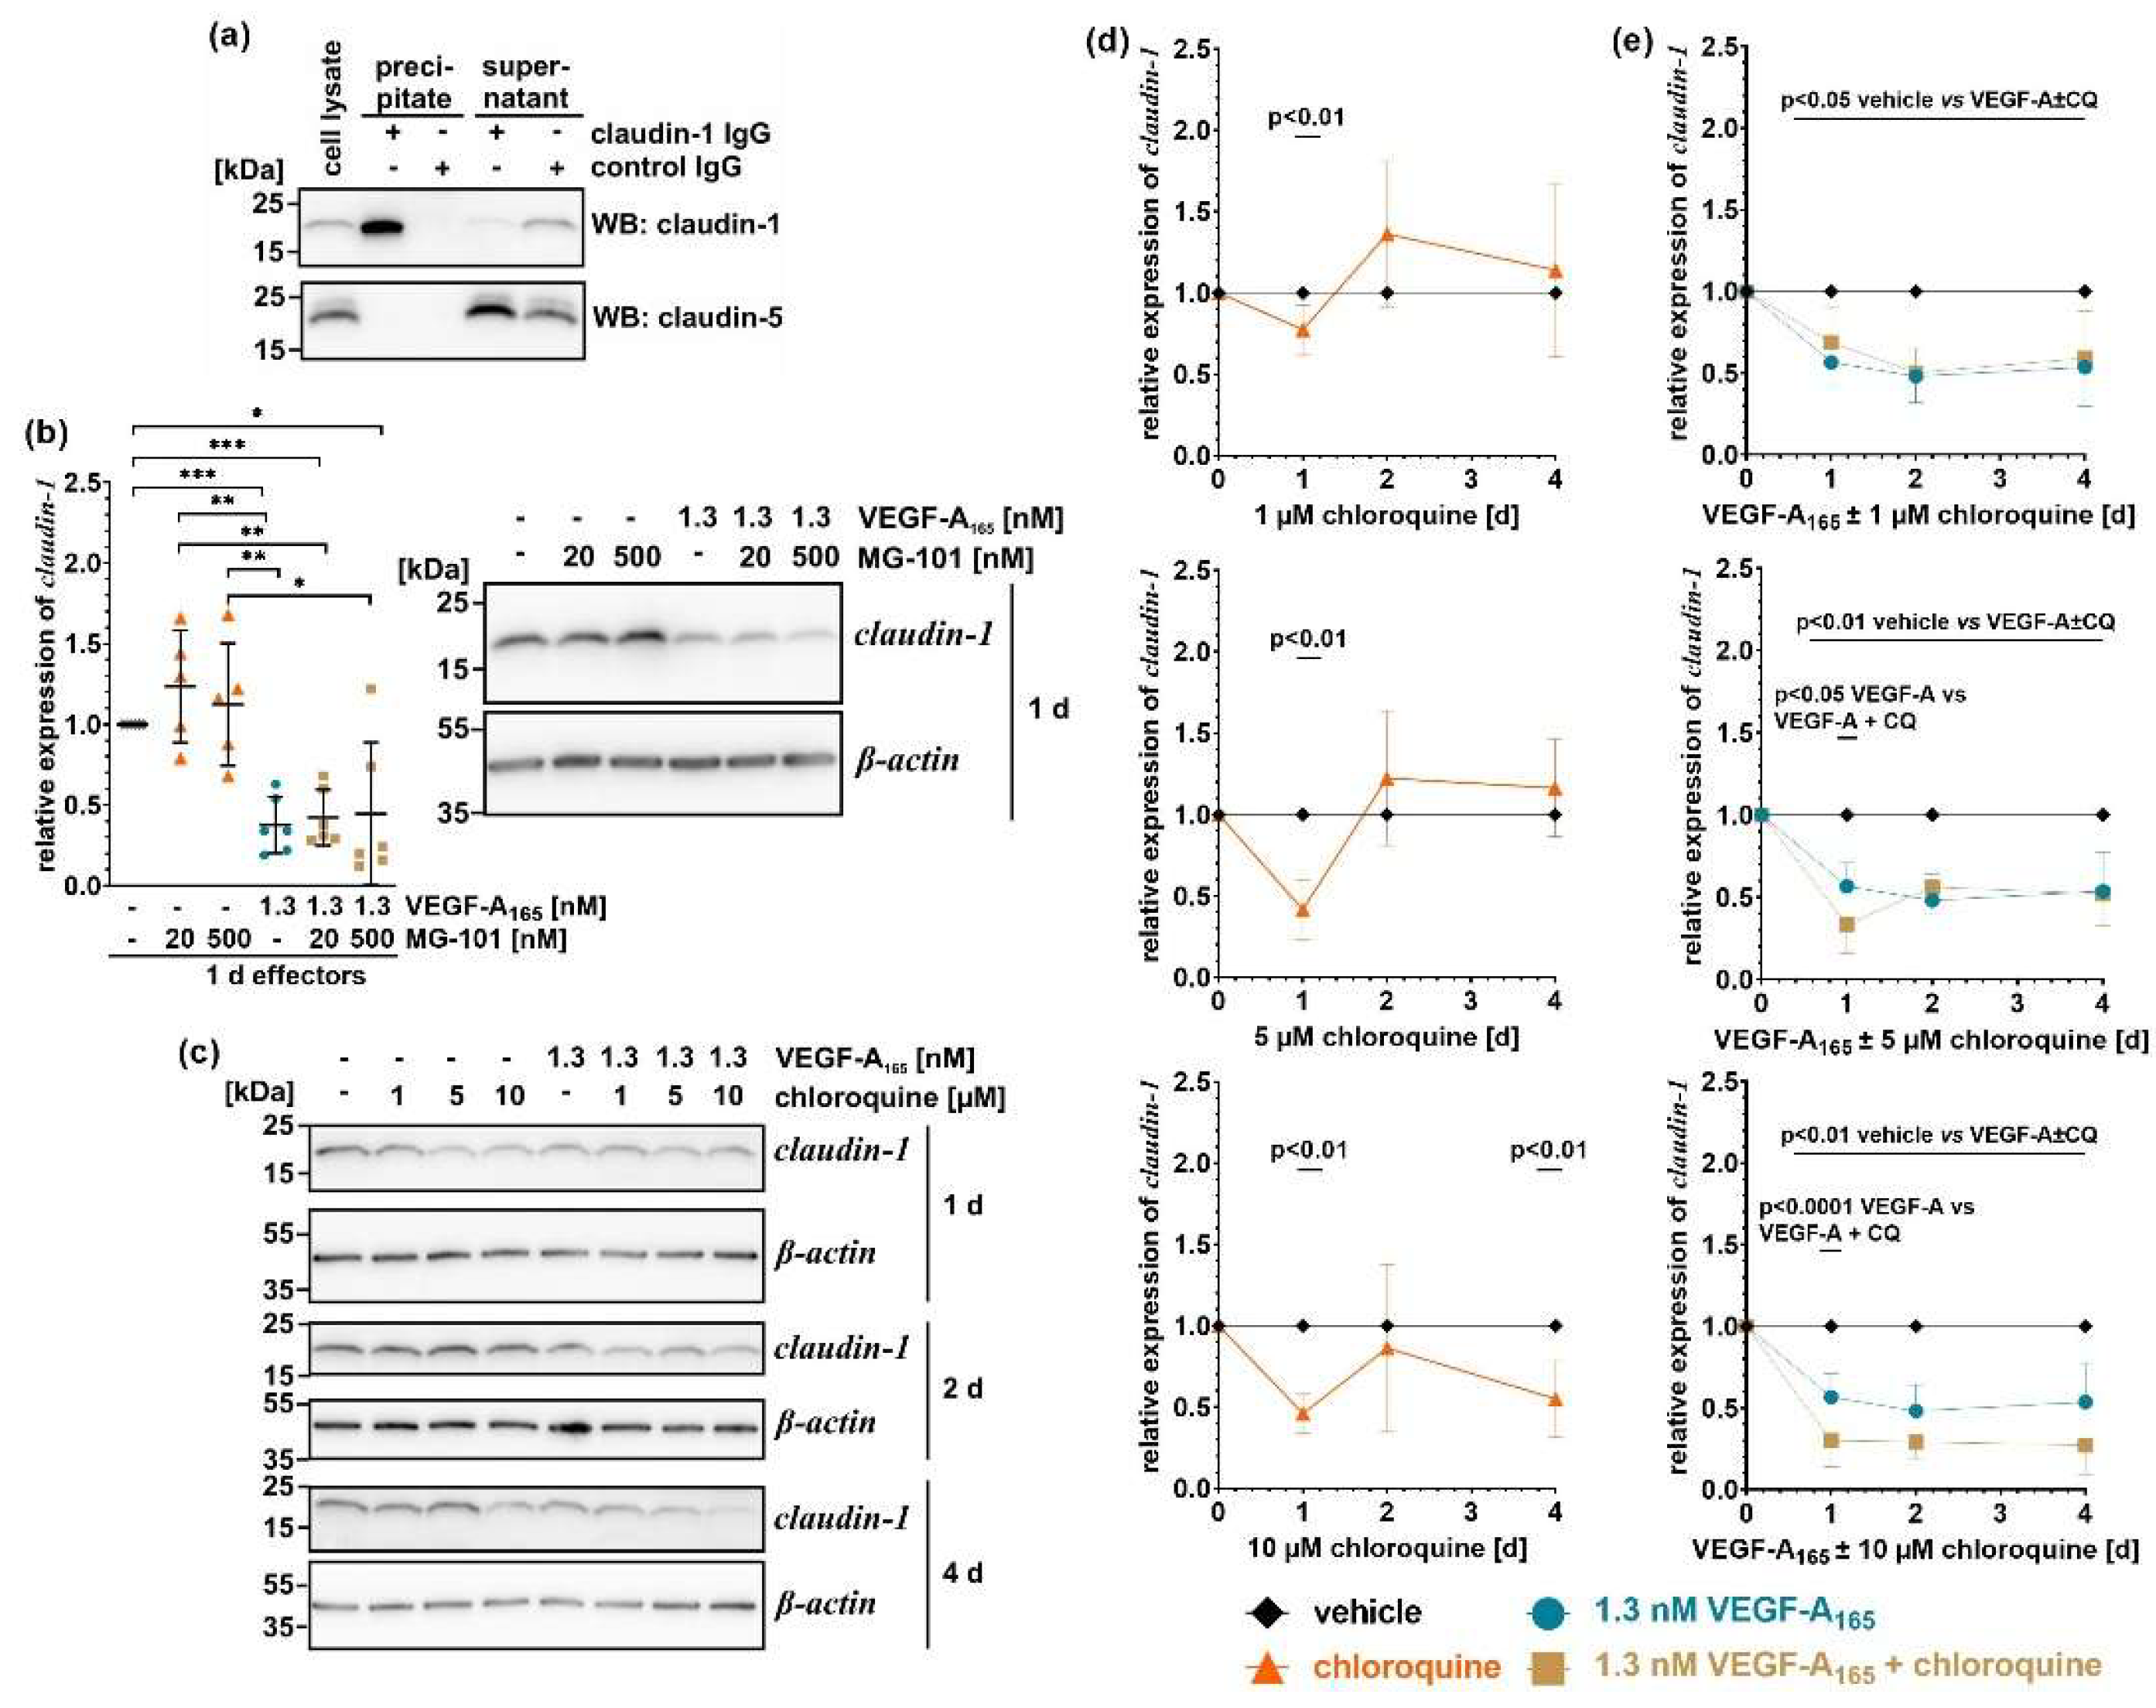
Figure 3.
Chloroquine prevented upregulation of PLVAP by VEGF-A165. After incubation of confluent iBREC with 1-10 µM chloroquine with or without 1.3 nM VEGF-A165 for (a) two or (b) four days, cells were harvested for preparation of cell extracts and subsequent Western blot analyses. Specific signals of Western blot analyses were normalized to those obtained from VEGF-A165-treated cells; one dot represents the analyte-specific signal from one of multiple independent Western blot analyses. For details, refer to section “4.6 Statistical analyses”; means ± standard deviations are depicted. Chloroquine prevented upregulation of PLVAP in a concentration-dependent manner induced by the growth factor on day (a) two and (b) four. Original images are shown in supplementary Fig. S2.
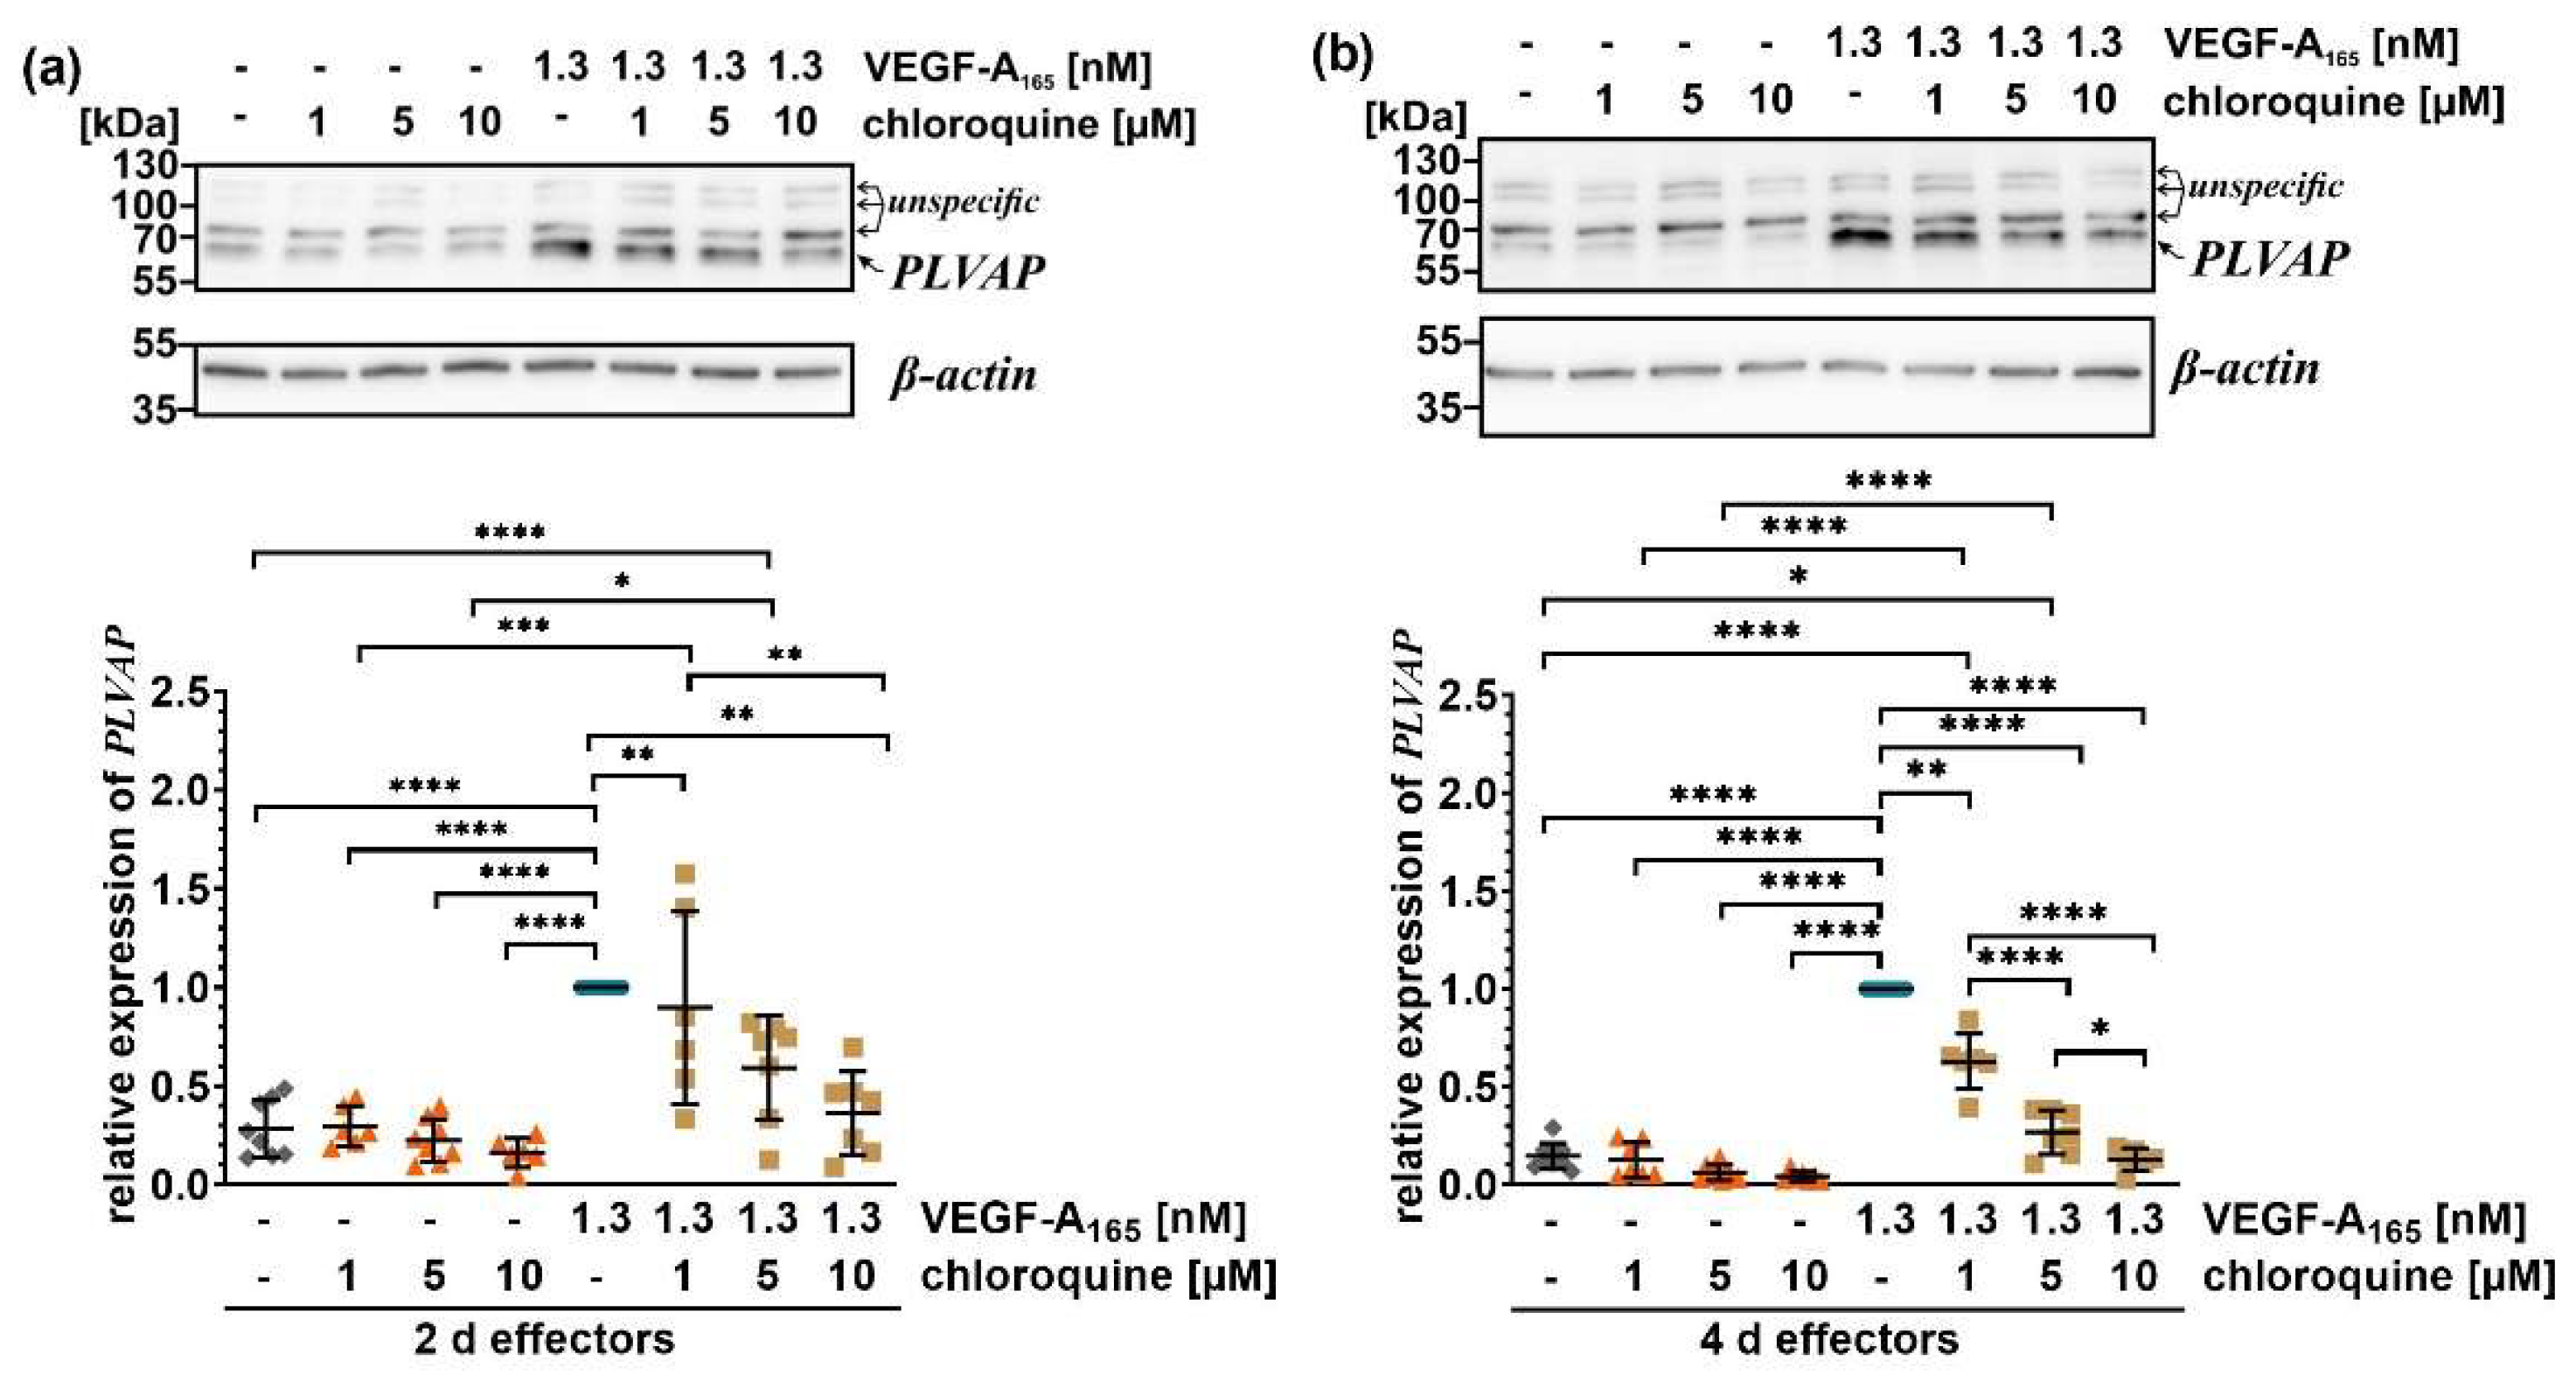
Figure 4.
Chloroquine reduced expression of claudin-5 in VEGF-A165-challenged iBREC. Confluent monolayers of iBREC were treated with chloroquine with or without VEGF-A165, and were harvested for Western blot analyses at indicated time points. Specific signals were normalized and pooled as described above. Original Western blot images are shown in supplementary Figure S3. (a) Extended incubation with chloroquine alone only slightly affected claudin-5 protein levels, which (b) were significantly higher upon VEGF-A165 treatment. Additional incubation with ≥ 5 µM chloroquine strongly decreased the amount of claudin-5 starting on day two. CQ: chloroquine.
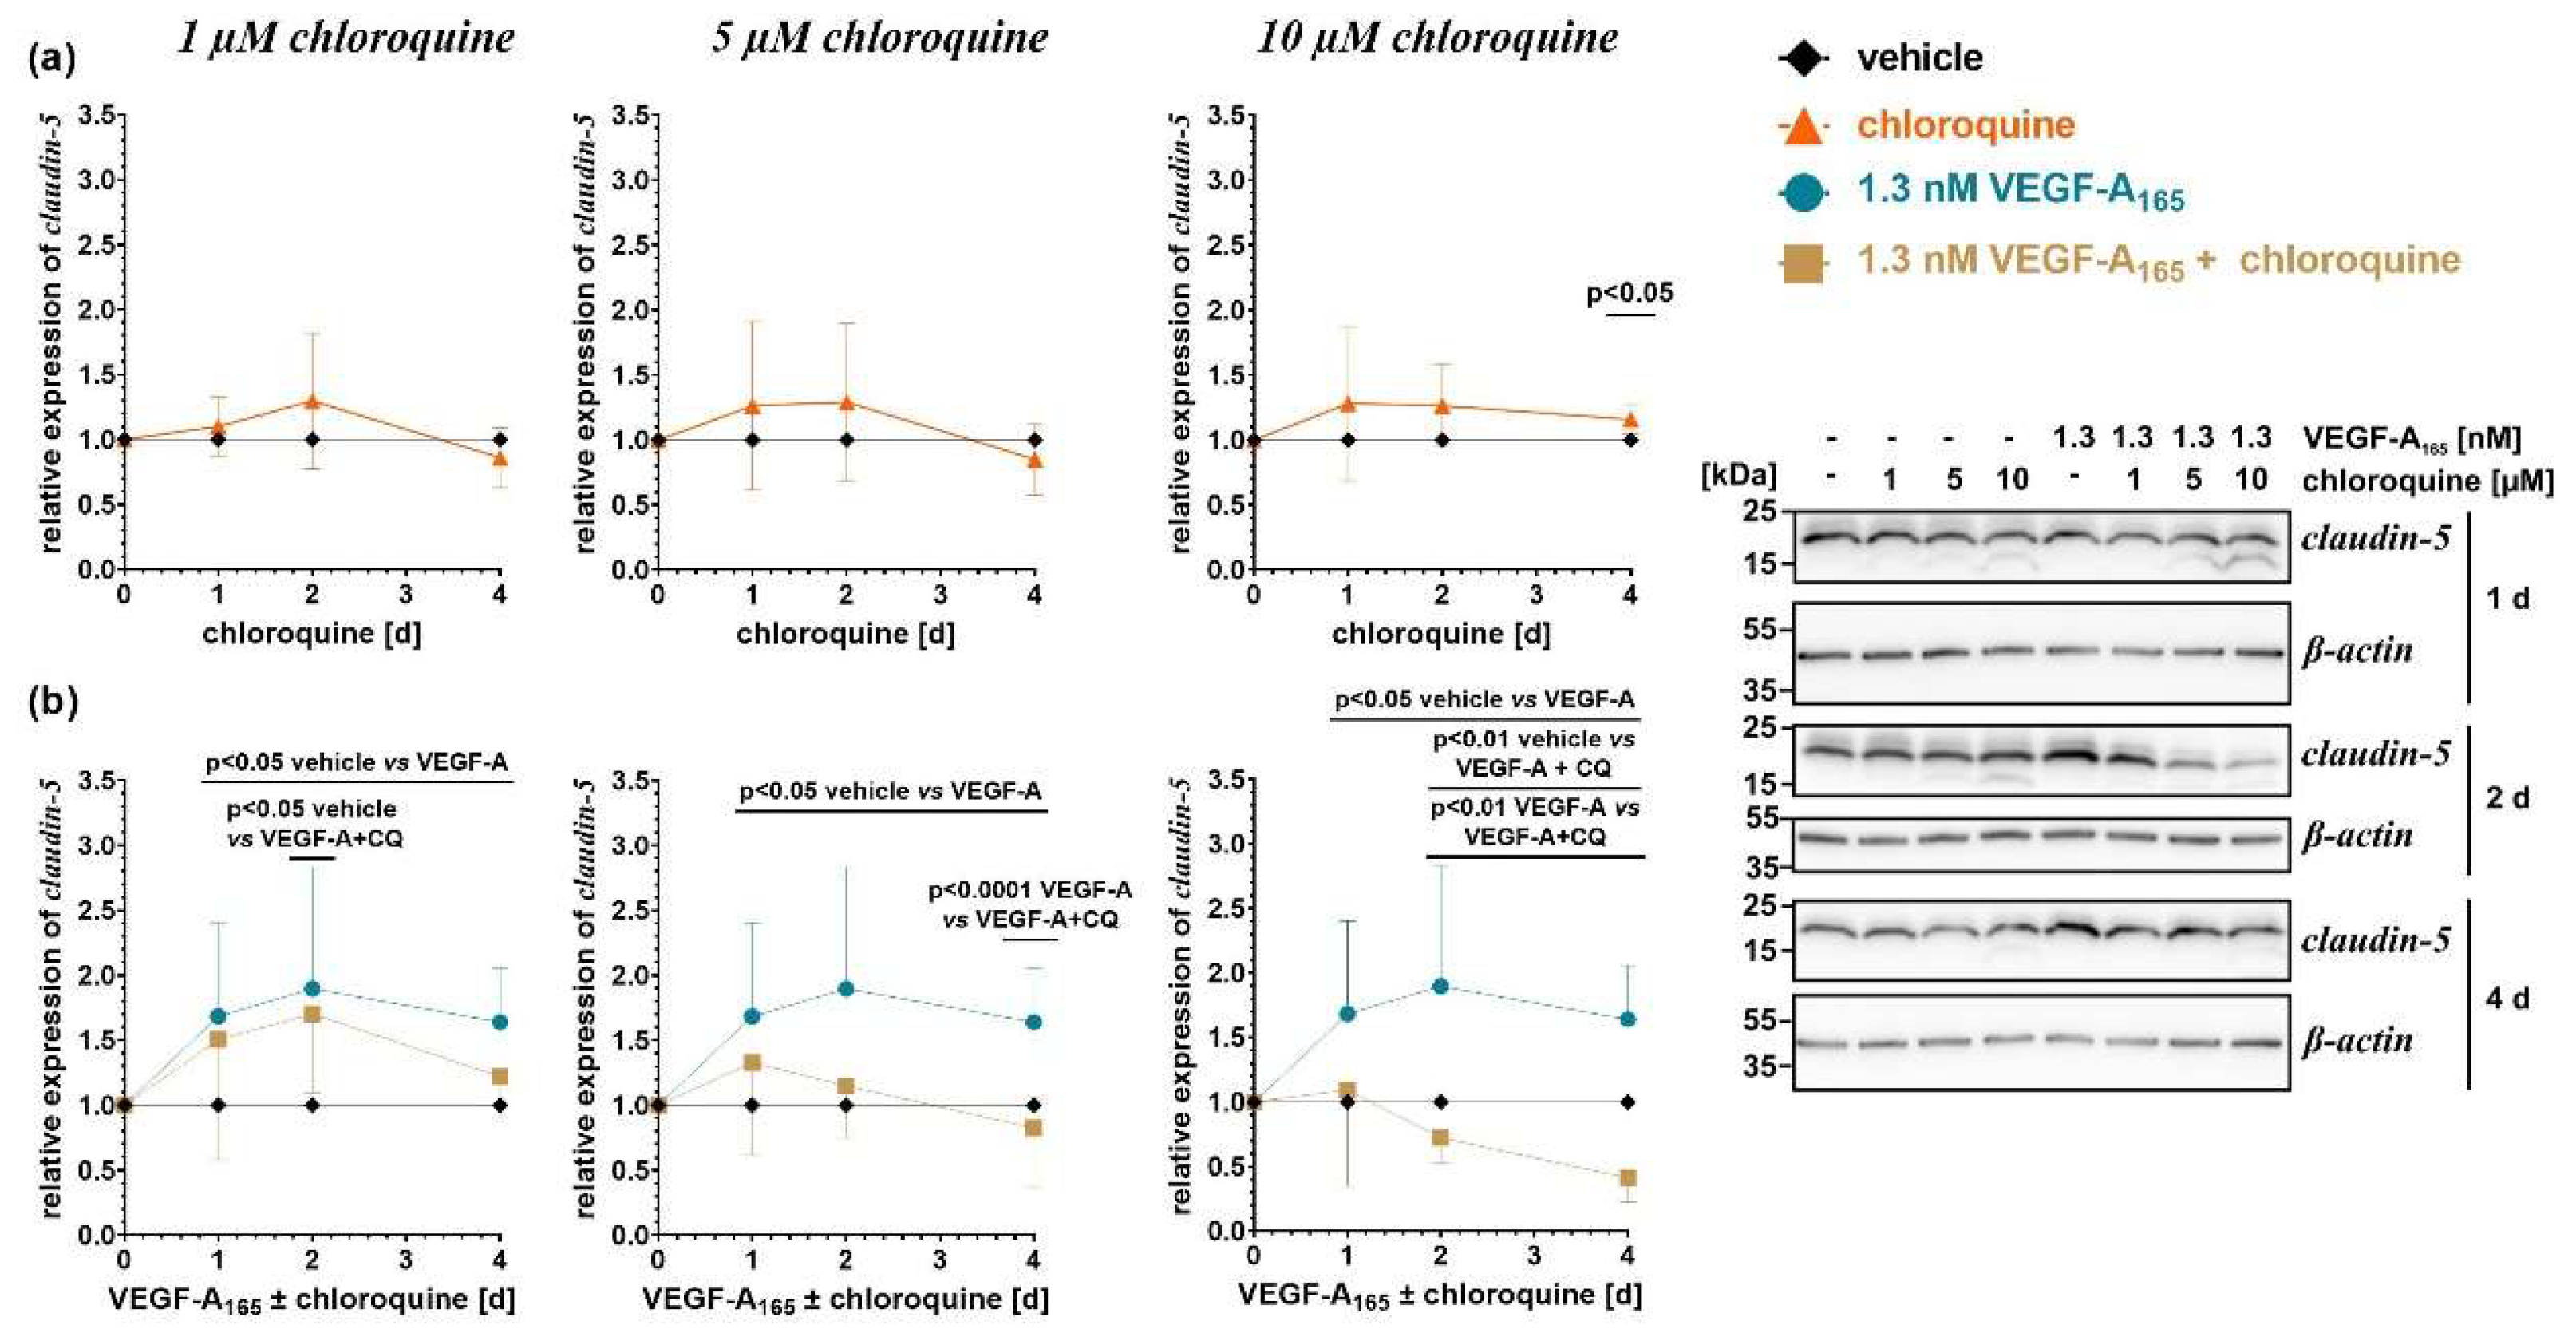
Figure 5.
Subcellular localization of claudin-5 was changed by chloroquine. iBREC treated with chloroquine and VEGF-A165 were fixed for immunofluorescence staining on day four to assess subcellular localization of claudin-5 using specific antibodies (red). Nuclei were counterstained with DAPI (blue). The homogenous plasma membrane staining observed in vehicle-treated iBREC (yellow arrowhead) was diminished by 10 µM chloroquine, accompanied by pronounced perinuclear staining (yellow arrow), further enhanced by co-treatment with VEGF-A165. Claudin-5 was then also localized in spike-like extensions (white arrow). Scale bar: 10 µm.
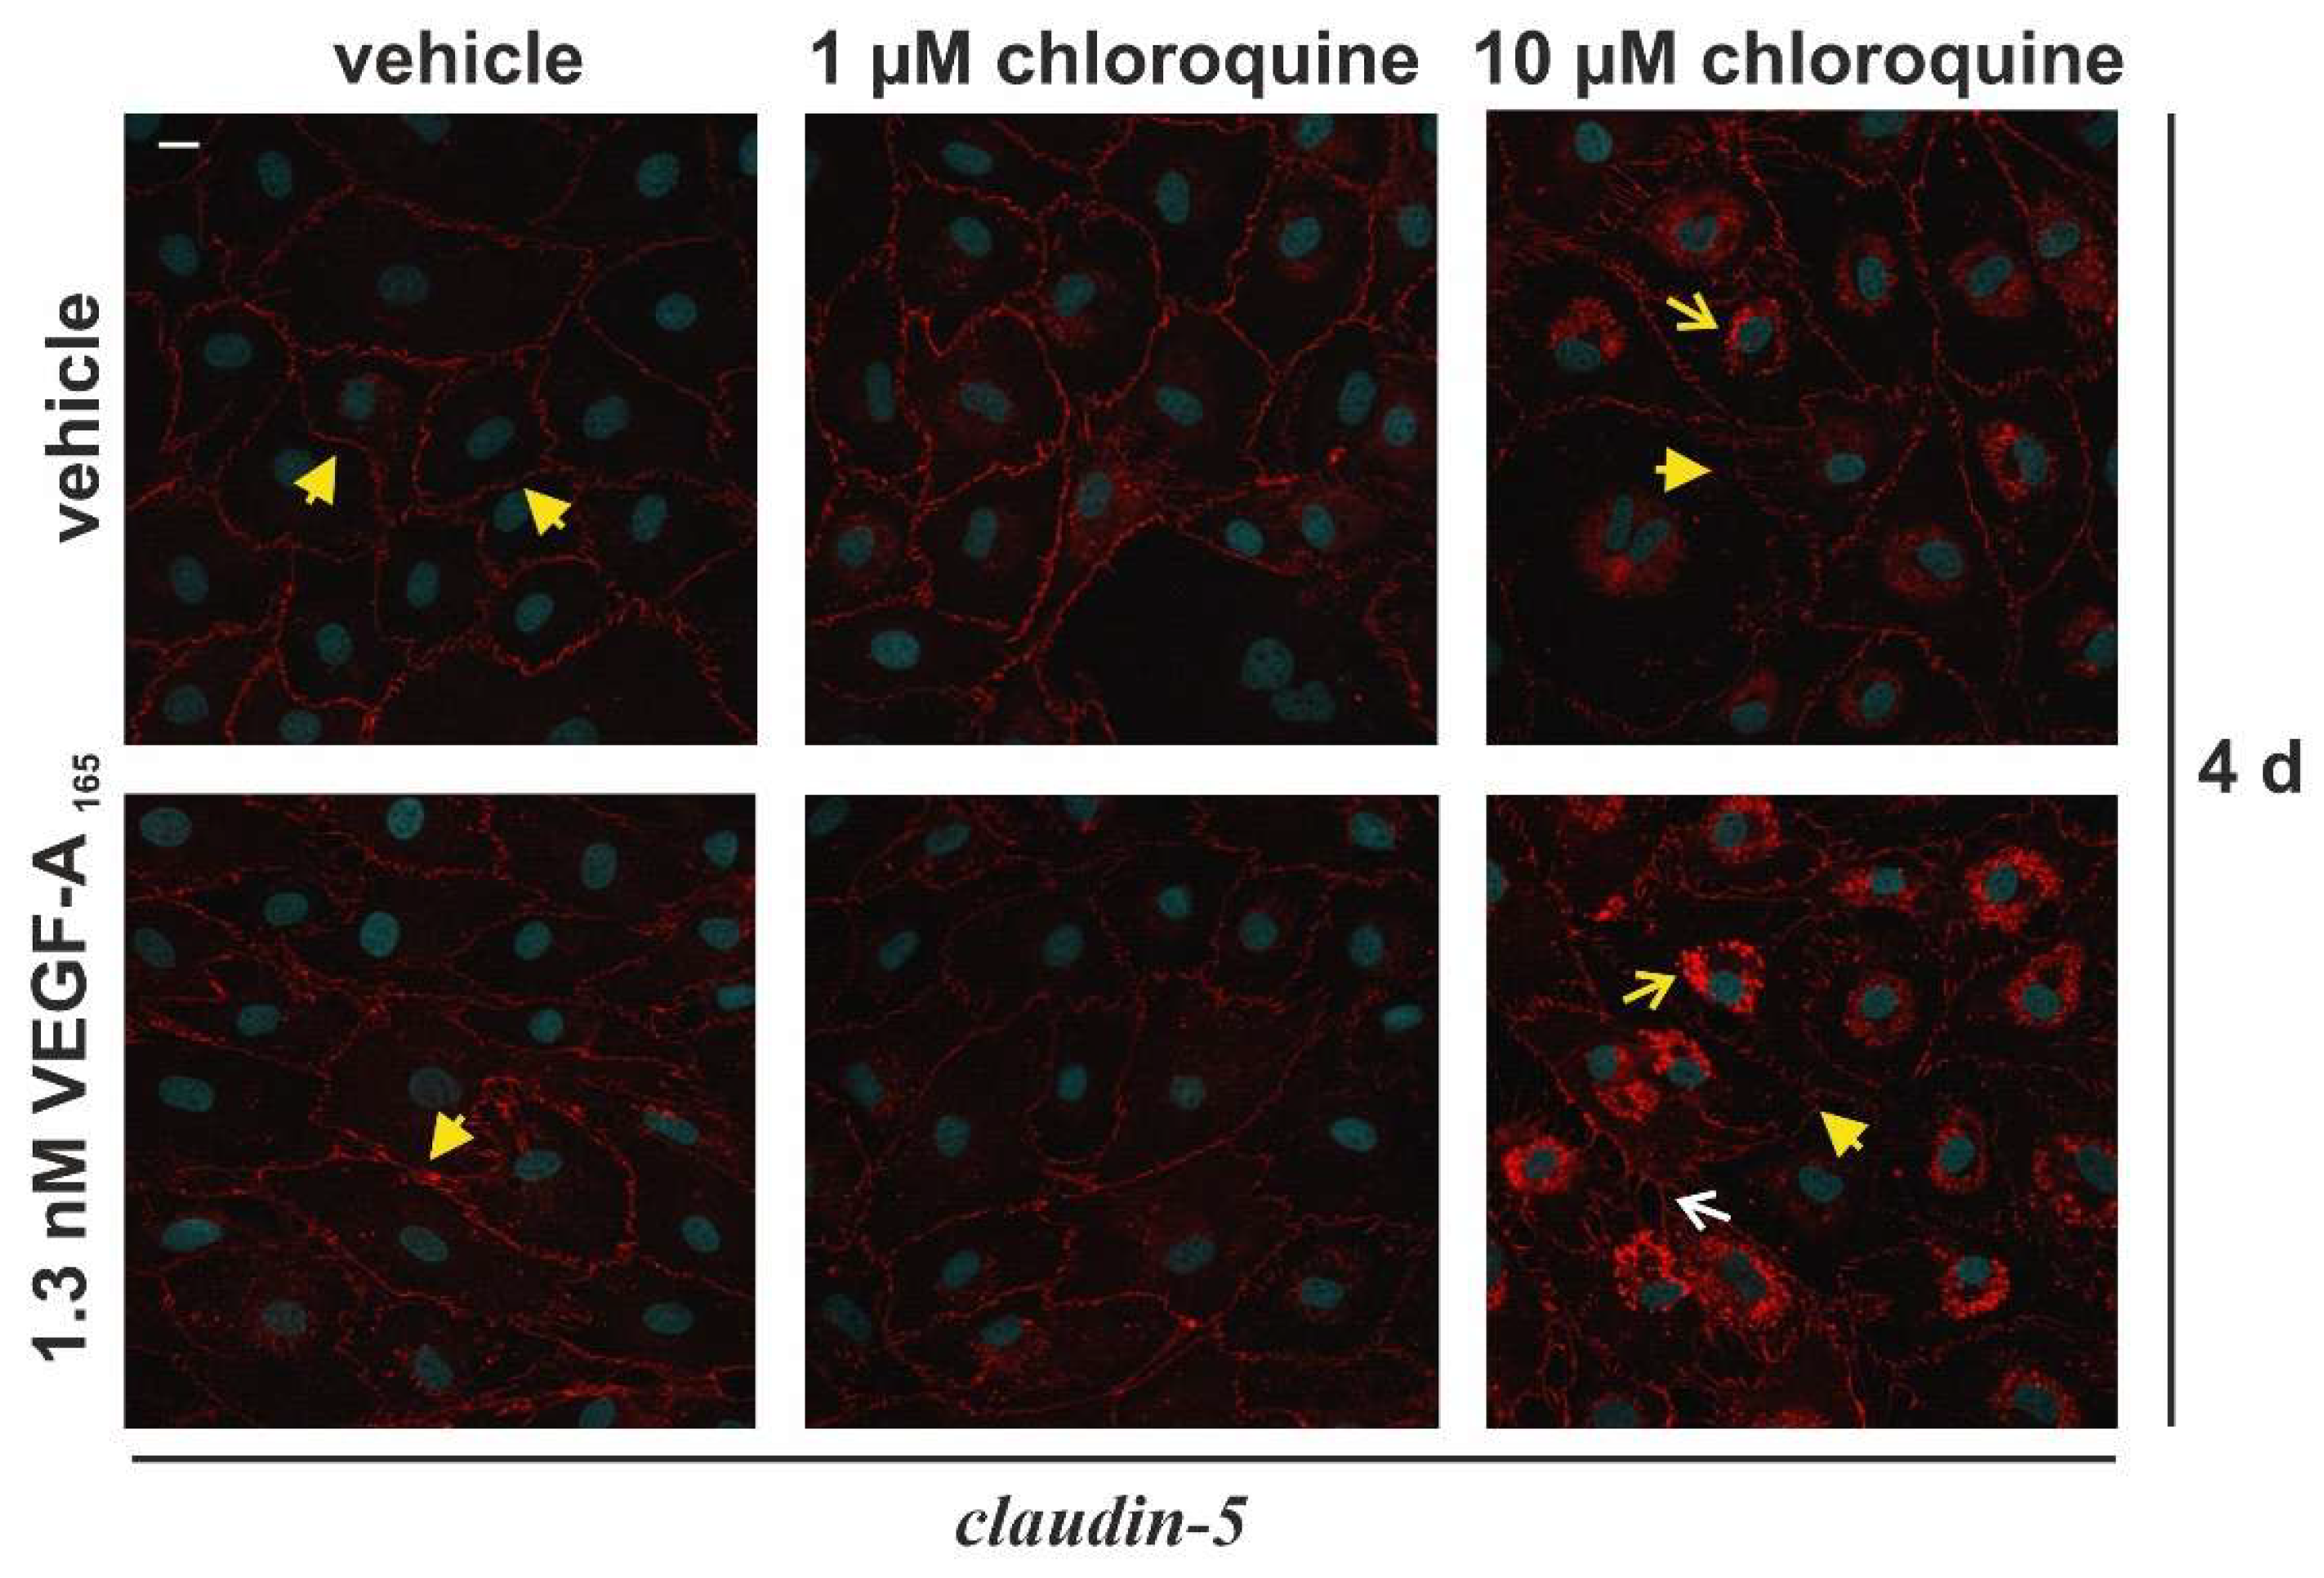
Figure 6.
Expressions of vWF and caveolin-1 were downregulated by chloroquine. Confluent iBREC exposed to chloroquine and VEGF-A165 were either (a) fixed for immunofluorescence staining on day four or (b, c) harvested for Western blot analyses at indicated time points. (a) The characteristic granular staining observed upon visualization of vWF localization with specific antibodies (red; nuclei counterstained with DAPI in blue) was significantly lower after treatment with 10 µM chloroquine ± VEGF-A165. (b, c) Specific Western blot signals were normalized and pooled as described above. Original Western blot images are shown in supplementary Figure S4. Extended incubation with ≥ 5 µM chloroquine significantly lowered amounts of caveolin-1, especially observed when cells were exposed to 10 µM chloroquine + VEGF-A165. CQ: chloroquine. Scale bar: 50 µm.

Figure 7.
High concentrations of chloroquine induced degradation of VEcadherin. Confluent iBREC treated with chloroquine ± VEGF-A165 were harvested for Western blot analyses at indicated time points, and specific signals were normalized to those obtained from vehicle-treated cells; data of multiple independent Western blot analyses were pooled. (a) Typical images of Western blot analyses, the original images of which can be found in supplementary Figure S5. (b) Even incubation for four days with chloroquine in the absence or presence of VEGF-A165 did not change the amounts of full length (FL) VEcadherin (see upper images in panel (a) at each time point). (c) Extended exposure of the chemiluminescence signals revealed an additional band ~35 kDa, corresponding to a C-terminal fragment (CTF) of VEcadherin (see middle images in panel (a) at each time point), which was pre-dominantly detected in cells treated with chloroquine, either in the presence or absence of VEGF-A165. CQ: chloroquine.

Table 1.
Expression of β-actin by iBREC exposed to chloroquine ± VEGF-A165.
| Day | chloroquine | 1.3 nM VEGF-A165 + chloroquine | ||||||
|---|---|---|---|---|---|---|---|---|
| 0 µM | 1 µM | 5 µM | 10 µM | 0 µM | 1 µM | 5 µM | 10 µM | |
| 1 | 1±0 | 1.05±0.37 | 0.95±0.31 | 1.05±0.37 | 0.85±0.42 | 0.86±0.43 | 0.96±0.48 | 1.16±0.54 |
| (N=6) | (N=6) | (N=6) | (N=6) | (N=6) | (N=6) | (N=6) | (N=6) | |
| 2 | 1±0 | 0.91±0.19 | 0.89±0.25 | 0.98±0.21 | 0.94±0.35 | 0.83±0.25 | 0.79±0.22 | 0.93±0.42 |
| (N=10) | (N=6) | (N=8) | (N=6) | (N=10) | (N=6) | (N=8) | (N=8) | |
| 4 | 1±0 | 1.12±0.3 | 1.09±0.29 | 0.98±0.24 | 1.07±0.1 | 1.16±0.51 | 1.24±0.46 | 1.37±0.54 |
| (N=8) | (N=6) | (N=8) | (N=6) | (N=8) | (N=6) | (N=8) | (N=6) | |
Disclaimer/Publisher’s Note: The statements, opinions and data contained in all publications are solely those of the individual author(s) and contributor(s) and not of MDPI and/or the editor(s). MDPI and/or the editor(s) disclaim responsibility for any injury to people or property resulting from any ideas, methods, instructions or products referred to in the content. |
© 2026 by the authors. Licensee MDPI, Basel, Switzerland. This article is an open access article distributed under the terms and conditions of the Creative Commons Attribution (CC BY) license (http://creativecommons.org/licenses/by/4.0/).
Copyright: This open access article is published under a Creative Commons CC BY 4.0 license, which permit the free download, distribution, and reuse, provided that the author and preprint are cited in any reuse.


