
Submitted:
24 February 2026
Posted:
28 February 2026
You are already at the latest version
Abstract
Microglia are brain immune cells that phagocytose cell debris and beta-amyloid plaques in Alzheimer´s disease. Microglia develop from round amoeboid cells into ramified microglia or large macrophages, which can be studied in three-dimensional organotypic mouse brain slices. In a recent publication, we have shown for the first time that we can track GFAP+ astrocytes and laminin+ vessels in organotypic brain slices using live-cell imaging [1]. The aim of the present study was to use microcontact printing on organotypic brain slices to label microglia with the Iba1 and CD11b antibodies and visualize them via live-cell imaging. We will show that microglia can be labelled with both antibodies and tracked with live-cell imaging for up to 20 days. Incubation in lipopolysaccharide (LPS) or granulocyte–macrophage colony-stimulating factor (GM-CSF) stimulated the migration of round amoeboid microglia, whereas interleukin-10 induced their differentiation into ramified forms. The present study shows for the first time that microglia can be easily labelled using antibodies in brain slices via microcontact printing and tracked using live-cell fluorescence microscopy for up to 20 days.
Keywords:
microglia
; organotypic brain slice
; live-cell imaging
; microcontact print
1. Introduction
Microglia are brain immune cells that originate from the mesoderm and play an important role in the central nervous system [2,3,4]. Their main immune function is to phagocytose toxic cellular debris and other pathogens [4,5]. Microglia release chemokines and cytokines like tumour necrosis factor alpha (TNF-α), interleukin-1β (IL-1β), and interleukin-10 (IL-10) and have either a pro-inflammatory role or anti-inflammatory activity [6,7,8]. There are three distinctive forms of microglia visible in the brain, and they are dependent on developmental, activation, or pathological processes, producing round amoeboid microglia, ramified-activated or non-activated resting microglia, and large macrophages, respectively [9,10].
Alzheimer’s disease (AD) is a progressive neurodegenerative disorder characterized by cognitive decline, memory loss, and behavioural changes. It is the most common form of dementia, affecting millions of individuals worldwide [11]. The main pathologies of sporadic AD are the accumulation of extracellular β-amyloid plaques (Aβ) and intraneuronal Tau neurofibrillary tangles [12]. It is well known that neuroinflammation is a pronounced pathology in AD [13], and microglia are activated in AD and phagocytose plaques but are dysfunctional in severe AD stages [14,15,16,17].
Organotypic brain slices are three-dimensional, 150 μm thick sections derived from postnatal day 8-10 mice that can be cultured for several weeks in vitro (see detailed reviews [18,19]). Thirty years ago, microglia were first found to survive in organotypic brain slices [21,22,23]. Additionally, several papers also showed this trait, allowing them to studied [24,25]. In a previous study, we demonstrated that microglia migrate along microcontact-printed lanes loaded with monocyte chemoattractant protein-1 (MCP-1) [27], and recently, we showed for the first time that microglia migrate along microcontact prints loaded with human plasma, which helped identify novel human AD biomarkers [28].
However, it is challenging to follow living brain cells in organotypic brain slices ex vivo. In a recent publication, we have shown for the first time that we can track GFAP+ astrocytes and laminin+ vessels in organotypic brain slices using live-cell imaging [1]. To visualize these cells, we developed a novel and innovative technique in our lab, the microcontact printing (µCP) technique. This method has been described in detail [29], and using this technique, we recently showed that we are able to label brain cells directly in organotypic slices [1]. Briefly, we load an antibody into a collagen solution and print this antibody with a stamp (made from a master) directly onto the slice as 400 µm spots. The antibody is then labelled with a fluorescent secondary antibody, and the slices are incubated for several weeks, allowing the labelled cells to be stimulated and visualized under an inverse fluorescence microscope.
The aim of the present study was to use µCP to label microglia in organotypic brain slices with the Iba1 antibody and visualize them via live-cell imaging. We will show that microglia can be labelled with the Iba1 and CD11b antibodies and followed with live-cell imaging for up to 20 days. Incubation in LPS or GM-CSF stimulated the migration of round microglia, while IL-10 promoted their differentiation into ramified forms.
2. Methods
2.1. Organotypic Brain Slices
The preparation of organotypic brain slices has been extensively documented in prior reviews [18,19]. Briefly, 150 µm thick brain slices are prepared from postnatal day 8–10 C57BL6 mice using a vibratome (Leica, VT1000S) (Figure 1) under cooled conditions (~5 °C, Julabo F250 cooling system). For this study, hippocampal half-brain slices were obtained (Figure 1B) and placed approximately 2 mm apart on Biopore membranes (10FT roll, BGCM0010, Merck-Millipore), and they were subsequently mounted onto 0.4 µm membrane inserts (Merck Millipore, PICM03050). The slices were then cultured (Figure 1B) in 6-well plates (Sarstedt, 83.3920) containing a slice medium comprising the Minimal Essential Medium (16.1 g/L; MEM, Gibco, 11012044) supplemented with NaHCO₃ (0.43 g/L), glucose (6.25 g/L; Merck, 8342), glutamine (116 mg/L; Merck, 1.00289.0100), 10% horse serum (Gibco, 16050-122, Lot: 2320064), 25% Hanks’ Balanced Salt Solution (HBSS, Gibco, 24020091), and a 1× antibiotic-antimycotic solution (Gibco, 15240-062), which was adjusted to a pH of 7.2. They were cultured in a CO2 incubator at 37 °C (5%) for up to 20 days, and the medium was replaced weekly. All experiments were approved by the Austrian Ministry of Science and Research, complied with Austrian animal welfare guidelines, and adhered to the principles of the 3Rs (replace, reduce, and refine).
2.2. Microcontact Printing of Iba1 onto Brain Slices
Live-cell labelling in brain slices has recently been described in detail [1]. Briefly, polydimethylsiloxane (PDMS) stamps were prepared using silicon wafer templates (“master” moulds). Each master mould (3x3 with 400 µm diameter dots) was purchased from GESIM (Ges. für Silizium-Mikrosysteme, Großerkmannsdorf, Germany), enabling the production of 38 stamps (Figure 1C). The stamps were sterilized under UV light for 10 minutes. A collagen mix was prepared by adding 66.7 µl of a type I bovine collagen solution (3 mg/ml, Sigma, 804592), 10 µl of 10x phosphate-buffered saline (PBS), 0.8 µl of 1N NaOH, and 10 µl of the Iba1 antibody (WAKO Code 019-19741, Fujifilm, Germany) in PBS. Then, 0.5 µl of this collagen solution was carefully applied onto 4 of the 400 µm dots and incubated at 37 °C in a sterile chamber. Meanwhile, a fresh PEG stock solution (2.5 mg 4arm-PEG succinimidyl succinate in 200 µl PBS, Sigma-Aldrich, JKA7006) was prepared. Under sterile laminar flow conditions, the Biopore membrane containing the half-brain slices was taken from the insert and placed in a Petri dish with the slices facing upward. After orienting the slice, 100 µl of the PEG solution was added beneath the Biopore membrane containing the slices. The collagen-loaded PDMS stamp was laid over the slices, ensuring each half-brain slice is covered with four dots (upper left and right; lower left and right). Next, a 4 g weight was placed on top of the stamp, which was then incubated at 37 °C for 15 min in a sterile chamber (Figure 1D). The weight was carefully removed and detached from the slices, and the Biopore membrane with the slices was transferred back to its original membrane insert in the 6-well plate and incubated with an anti-rabbit Alexa-488 antibody (1:400) in 1 ml of its medium overnight. The next day, the slices were washed by replacing the medium, allowing them to be used for further treatments and microscopy (see Figure 1F for the experimental set-up). As a control, 3x3 spots of a green fluorescent Alexa-488 control antibody were printed on a semipermeable membrane (Figure 1E). As a negative control, the Iba1 antibody was preabsorbed with unconjugated (2 mg/ml) anti-rabbit (SAB3700932, Sigma) overnight and then µCP. In comparison, microglia were also labeled after µCP with an anti-rabbit CD11b antibody (abcam ab128797). As an additional control experiment, microglia were also co-µCP with both antibodies, the Iba1 and a rat CD11b antibody (abcam ab8878-1013). Briefly, both antibodies were added to the collagen solution, µCP onto the slices and the Iba1 labelled with an anti-rabbit Alexa-488 antibody, and after washing the CD11b labelled with an anti-rat Alexa 555 antibody.
2.3. Live-Cell Imaging
Under laminar flow conditions, the Biopore membrane was transferred with the slices to a 6-well plate containing 100 µl of sterile PBS while ensuring the slices faced downward. An inverse fluorescence microscope was used to locate the fluorescently labelled dots at the space border of the 2 slices. Images were captured at 2x, 4x, or 10x magnification using a Bresser MicroCam pro HDMI camera with an exposure time of 120 msec and a gain of 30. After imaging, the slices were transferred back to the original membrane insert for continued incubation, enabling long-term imaging for up to 20 days.
2.4. Stimulation of Slices
One day after microcontact printing and labelling (2 weeks in culture), the slices were stimulated with 0.1-1 µg/mL lipopolysaccharide (LPS), 10-100 ng/mL granulocyte–macrophage colony-stimulating factor (GM-CSF), or interleukin-10 (IL-10). Negative controls were treated with PBS under identical conditions.
2.5. Propidium Iodide (PI) and DAPI Staining
PI is a red fluorescent dye that specifically and easily penetrates dying cells and stains nuclei. To analyze cell viability, slices were incubated in 2 µg/ml PI while they were alive. The slices were then fixed with 4% paraformaldehyde for 60 minutes, washed, and counterstained with blue fluorescent nuclear DAPI for an additional 60 minutes. Subsequently, the slices were washed according to the staining protocol and analyzed under fluorescence microscopy to assess cell death.
2.6. Data Analysis and Quantitative Analysis
Microscopic analysis was performed using a Leica DM IRB inverse fluorescence microscope with long-working-distance objectives. Green fluorescence (Alexa-488) was visualized using the L5 filter (excitation 480/40; cutoff 505; emission 527/30), while red fluorescence (Alexa-546) was visualized using the Y3 filter (excitation 535/50; cutoff 565; emission 610/75). Differentiation was defined as a morphological transformation involving at least 1 process. Statistical analysis was performed using One-Way ANOVA followed by a Fisher LSD post hoc test, where p≤0.05 represents significance.
3. Results
Iba1 was microcontact-printed directly onto a half brain slice and showed a strong round immunoreactive spot (Figure 2A) located on healthy brain tissue visualized with blue fluorescent DAPI+ nuclei (Figure 2B). No staining is seen in the red channel displaying positive staining of Iba1 (Figure 2C). In order to show specificity slices were labelled without preabsorded unconjugated rabbit antibody and showed only background staining (Figure 2D). As an addditional control, slices were µCP without Iba and displayed only background staining (Figure 2E). After µCP of Iba, three different Iba1+ microglial forms were found: The majority were round amoeboid (Figure 2F). Ramified forms were very rare (Figure 2G), and large macrophages were very rarely observed (Figure 2H).
When slices were incubated without any exogenous substance in the medium, nearly no Iba1+ microglia migrated out of the spots into the space (Figure 3A). Treatment with LPS markedly enhanced the migration of round amoeboid Iba1+ microglia (Figure 3B). Treatment with IL-10 (Figure 3C) and GM-CSF (Figure 3D) significantly enhanced the differentiation and migration of ramified Iba1+ microglia. A close-up view shows migrated Iba1+ microglia in the space between the two brain slices (Figure 3E).
Quantitative analysis of migrated Iba1+ microglia over 20 days shows that nearly no round amoeboid and ramified Iba1+ microglia were seen in the space (Figure 4). When slices were incubated with LPS, the round amoeboid microglia started to migrate from day 1; this migration was most prominent after 5 and 10 days but decreased after 20 days (Figure 4). IL-10- or GM-CSF-treated slices did not enhance the migration of round amoeboid microglia (Figure 4). When slices were treated with GM-CSF, a high number of ramified microglia was seen in the space after 5 and 10 days (Figure 4). Incubation with IL-10 similarly increased the migration of ramified microglia but less potently (Figure 4). Interestingly, the number of ramified microglia further decreased after 20 days; however, it was still higher than at the beginning (Figure 4). Regarding large macrophages in the space, their numbers were very low (0.25±0.2 per field, n=8) after 20 days of incubation and did not change with LPS treatment (1.4±0.4, n=7), IL-10 (0.25±0.25, n=4), or GM-CSF (0.5±0.3, n=4).
In order to demonstrate the viability of the brain slices, PI staining was performed, and the density of the Iba1+ spots was measured. PI staining revealed red fluorescent nuclear staining, indicating dying cells (Figure 5C&D). The PI staining in the cultured slices was very low, indicating very low cell death (Figure 5A). As a positive control, slices were incubated with peroxide (Figure 5B). No significant change in viability was seen when slices were incubated with LPS, IL-10, or GM-CSF, although there was a tendency for LPS to slightly enhanced cell death (Figure 5E). When comparing the optical density of the Iba1+ spots, fluorescence activity decreased within 20 days of culture, but it was not different between the treatments (Figure 5F).
In order to proof specificity and as an additional positive control, the microglia were µCP with the microglial marker CD11b (made in rabbit). CD11b markedly labelled microglia, with labelling being more potent and pronounced in a round spot (Figure 6A). This staining was specific as it was not seen in the red channel (Figure 6B). In order to further proof that Iba 1 and CD11b were identically labelled, a double µCP was performed with the Iba1 antibody together with a CD11b antibody (made in rat). Indeed, Iba1 and CD11b co-localized in the majority of the microglial cells (Figure 6C-K).
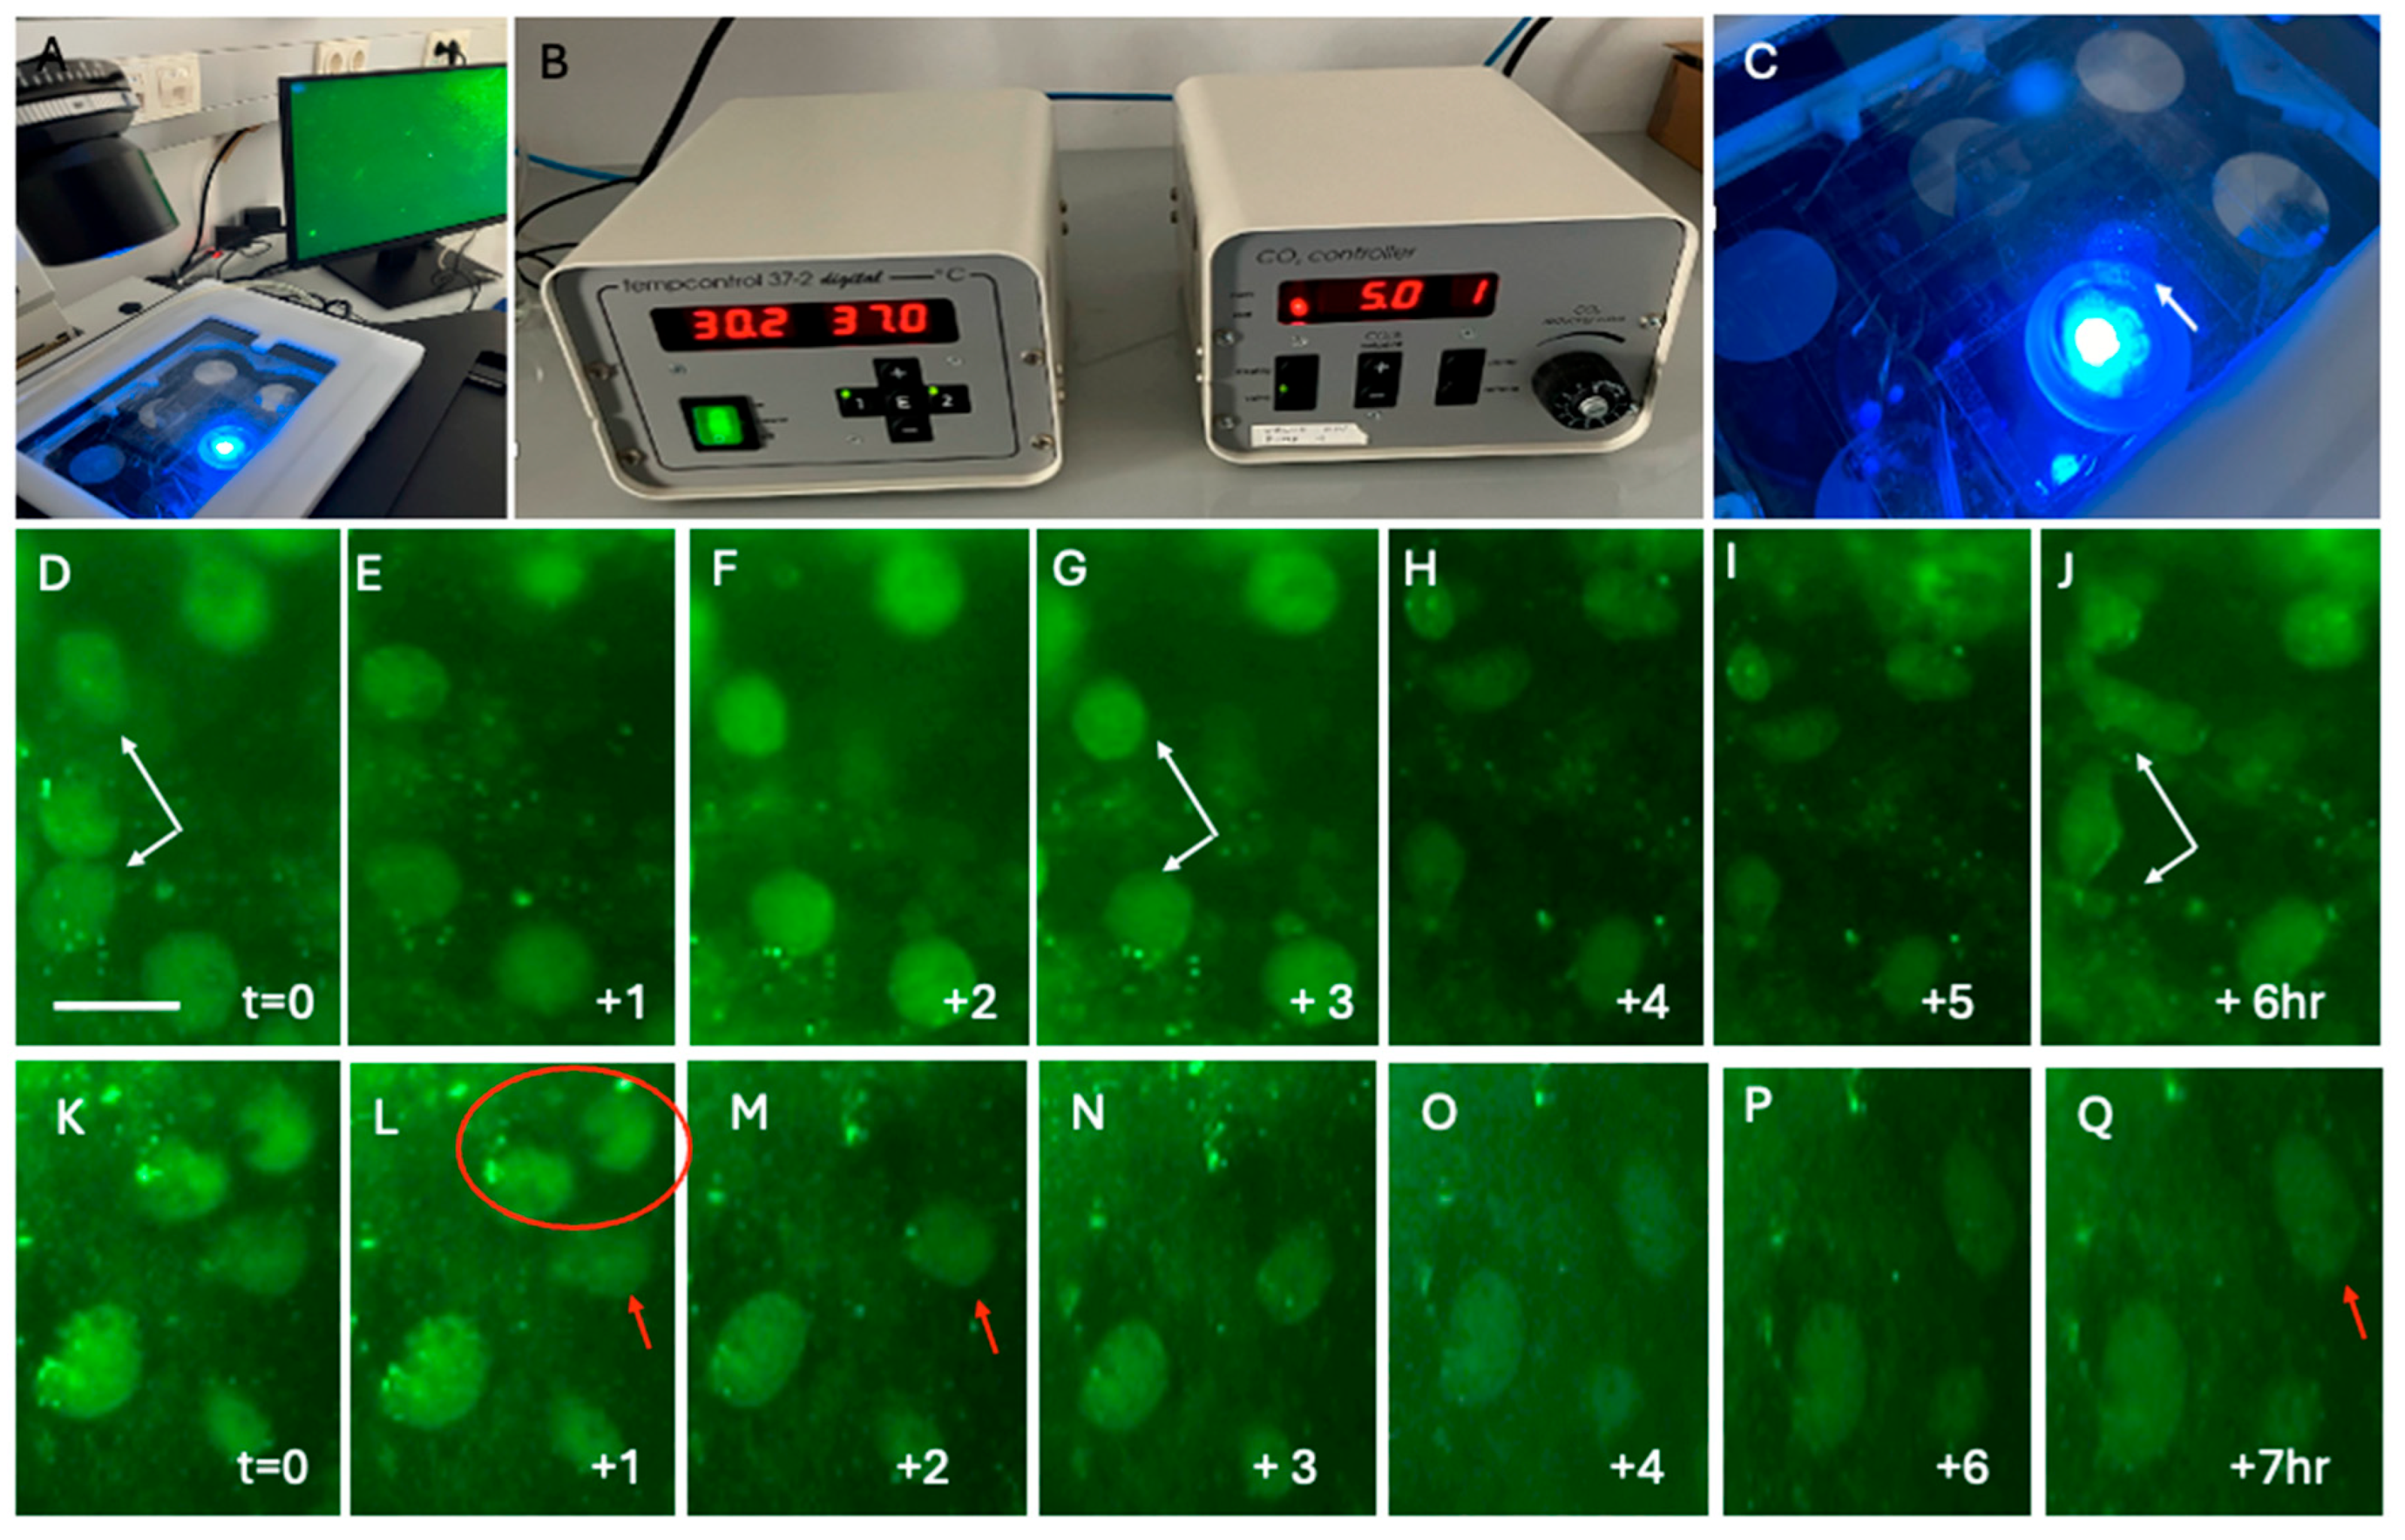
To track microglia for a longer time, we used the culture system connected to the fluorescence microscope (Figure 7A-C). Brain slices were incubated in a chamber (Figure 7C) at 37 °C and 5% CO2 (Figure 7B). Figure 7 shows two examples of Iba1+ microglia followed for 6-7 hours after stimulation with GM-CSF. Figure 7D-J show three Iba1+ microglia, where one cell disappeared after 1 hour, while the other two showed some forms of morphological transformation after 6 hours. Figure 7K-Q show two microglia that disappeared after 2 hours and one cell with a clear morphological transformation after 7 hours. Note that differentiation (a morphological transformation with at least one process) was not observed in such a short time period (7 h).
4. Discussion
In the present study, we can label microglia in organotypic brain slices with the Iba1 and CD11b antibodies using direct microcontact printing. We can follow these fluorescently labelled microglia for up to 20 days and show migration as well as differentiation with live-cell imaging.
4.1. Organotypic Brain Slices and Viability
Organotypic brain slice cultures provide a cytoarchitecturally intact, three-dimensional brain model that allows the study of several brain cell types ex vivo [19,30,31]. Typically, these slices are cultured on semipermeable 0.4 µm pore inserts positioned between a humidified atmosphere and the culture medium, allowing them to attach to the membrane and absorb nutrients through the porous surface [18,19]. Brain slices have been well established and characterized in our research group for more than 20 years. We have studied neurons, astrocytes, microglia, and vessels from different brain areas, such as the hippocampus, striatum, basal nucleus, and mesencephalon [18]. Usually, slices from postnatal mice flatten and become transparent, which is a good sign for healthy slices. In the present study, we used two half-brain slices of postnatal mice and connected them with a 2 mm space in between to study the migration and differentiation of microglia. The rationale for connecting these slices was to study migration and differentiation directly in the space between the two half-brain slices. A razor cut on the slice allows better migration as no glial slice scar inhibits cell migration. No effects were tested in other areas of the slice.
4.2. Microcontact Printing on Slices
We have used collagen-loaded µCP for several applications: to load growth factors or Alzheimer-related molecules of interest, to study the outgrowth of different brain cells along µCP lanes, to develop a brain-on-a-chip technology [29], and to develop a live-cell imaging method [1]. In order to label brain cells, we press a specific antibody directly onto the brain slice using a master stamp. So far, we can label cells with GFAP, laminin, and now Iba1 and CD11b. Since these antibodies also label intracellular antigens, we favour the idea that a collagen-mediated process together with some forms of “trauma” or “stress” cause antibody uptake, along with increased membrane permeability and activation of the cells. This could happen similar as described for lipid-mediated uptake of proteins. However, so far, we have yet discovered the exact mechanism. In our previous original set-up [1], we have optimized the weight-induced pressure (4 g), time (15 min), and temperature (37 °C) and found reproducible spot sizes and labelling densities, but we did not analyze detailed quantitative metrics. While the stamp may damage parts of the brain slice, the procedure did not induce dramatic cell death, as shown by propidium iodide labelling, and the cells were viable even after several weeks of incubation [1]. The quality of this technique is mainly dependent on that of the brain slice, which is the most tricky part of this method. The slice is a multi-layer cell model, and the age of the mice used is essential, as this factor influences the thickness, flattening, and quality of the slices. It must also be mentioned that this technique allows us to easily follow cells at the surface of the slices but not from deeper vertical layers.
4.3. Iba1 and CD11b Microglia in Slices
We and others have extensively studied microglia in organotypic brain slices [22,25,32]. Iba1 (ionized calcium-binding adaptor molecule 1) is a well-established marker for microglia, enabling the detection and characterization of their morphology, including processes with actin bundles and phagocytosis. We used this antibody in the present study and show selective and specific labelling of all three kinds of microglia: round amoeboid, ramified, and large macrophages. We demonstrated that Iba1⁺ microglia cells survive in organotypic brain slices even after long-term incubation periods in vitro. After a 3-week incubation period, microglia showed healthy cytoplasm, processes, and nuclei, making them useful for further testing in our slice model. This is also consistent with other studies from our lab, which showed a preserved cell architecture in slices [1,18,19,27,28].
The results were further supplemented with a second microglial specific antibody, CD11b, and we observed healthy, differentiated microglia, confirming that they were properly stained and remained healthy despite a relatively rough microcontact printing, staining, and culture period. In the present study we started with Iba1, as this is a well-known microglia-specific antibody that has been well characterized in our lab for several years. We confirmed this microglial staining with a rabbit-made CD11b antibody. In order to show specificity and co-staining, a double µCP labelleling with the Iba1 antibody and a second CD11b (made in rat) antibody showed that the majority of labelled cells were identical for both markers. The double-µCP also showed the intracellular staining of Iba1, while CD11b remained more at the cell membranes.
4.4. Effects of LPS, GM-CSF, and IL-10
The endotoxin LPS is a well-established molecule for inducing chronic inflammation in vitro or in vivo [33,34,35]. LPS is a component of the cell wall of Gram-negative bacteria and stimulates the production of different pro-inflammatory cytokines from activated glial cells. The addition of LPS caused a dramatic microglial migration event, which also coincides with other studies [36]. These activated amoeboid-shaped microglia can migrate to the injury site [37]. Furthermore, the microglia migrated in a “cluster-like” pattern; this was probably caused by the inflammatory nature of LPS, which was similar to the aggregation of microglia around beta-amyloid plaques [38].
Granulocyte–macrophage colony-stimulating factor (GM-CSF) is expressed in a wide variety of differentiated and non-differentiated cell types, like T cells, monocytes, macrophages, fibroblasts, and endothelial cells [41,42,43]. In the present study, an increase in round microglial migration was observed, accompanied by increased ramification. However, no large macrophages were observed. This finding is supported by other researchers [42], who showed increased proliferation but fewer ramification events or that GM-CSF increased cell proliferation and microglial activation [45].
Interleukin-10 (IL-10) is a well-known anti-inflammatory cytokine that is secreted by monocytes or TH2 lymphocytes [46]. It has several functions in the immune system and has strong anti-inflammatory effects, protecting the brain against extensive inflammation [47]. In the present study, the addition of IL-10 resulted in increased ramification after migration. This finding concurs with other studies, reporting that the absence of IL-10 caused an increased shift to round microglia or that IL-10 increased ramification and anti-inflammatory responses [48,49,50].
4.5. Migration Capacity
The migration of microglial cells in the brain environment is an essential physiological strategy by which for them to enter brain areas that are damaged [51,52,53]. Round amoeboid microglia have the capacity to quickly migrate into the brain, e.g., to reach areas that are damaged after traumatic injury or to phagocytose beta-amyloid plaques in the AD-affected brain. This feature is a relic of the origin of microglia, as they originated from monocytes [54]. In the present study, we show that Iba1+ round amoeboid microglia can migrate quickly, especially when stimulated with LPS. This model offers a convenient method for investigating the migration capacity of living microglia. Cell migration is essential for the physiological function of the brain, as it coordinates cortical-layer formation and is responsible for tissue homeostasis [55,56]. Migration is a complex system involving well-timed and -spaced chemical signals [57]. The mechanisms of migration involve membrane receptor activation, cytoskeleton remodelling, and environmental cues. Dysregulation of these migration mechanisms can lead to chronic inflammation and subsequent neurodegeneration [58].
4.6. Differentiation Capacity
Microglia have the capacity to differentiate very effectively, have high morphological and functional plasticity, and can differentiate into ramified forms [59]. As microglia are a “double-edged sword”, they have two different, opposite functions: they can be protective or toxic [60]. If microglia detect damaged tissue, they can produce and secrete trophic growth factors or anti-inflammatory factors to induce neuronal repair. If sensory cells in the brain detect cell death or plaque deposition, they produce pro-inflammatory cytokines and differentiate into macrophages to eliminate debris. This is an important feature in the AD-affected brain to eliminate large beta-amyloid plaques. However, microglia lose their phagocytic capacity in the brain with severe AD, and they become dysfunctional [61]. Our model offers a convenient method to study not only migration capacity but also subsequent phagocytosis in a living environment. In this study, differentiation was defined as a morphology transformation involving at least one process. The different phenotypes of differentiation also depend on their environment and external signals [57], as LPS nearly completely shifted all microglia into their round ameboid form, while GM-CSF induced microglial ramification. However, in this study, differentiation could not be observed within a short time period of 7 hr using live-cell imaging.
4.7. Live-Cell Images: A Proof-of-Principle Model
In a recent study [1], we presented an innovative method to label and visualize astrocytes and vessels in living slices. Using microcontact printing, astrocytes were labelled with glial fibrillary acidic protein (GFAP), while vessels were labelled with laminin. This approach offers a cost-effective and detailed visualization technique for astroglia and vessels in living brain slices, enabling investigations to be conducted over several weeks. Using a conventional inverse long-distance fluorescence microscope, the technique offers a straightforward and reliable means of tracking cellular dynamics for up to 100 days. In the present study, we extend our findings and show for the first time that Iba1+ (and CD11b+) microglia can be visualized using live-cell imaging. Live-cell imaging is a potent tool for studying the migration and differentiation of microglia. We demonstrated a proof of principle, and it was possible to reliably locate and observe the same cell within 7 hours. This is consistent with other studies, confirming that a collagen environment is suitable for elucidating cellular dynamics using live-cell imaging [64]. Furthermore, live-cell imaging using a similar methodology has already been used to study collagen in living cells [65]. In the future, we aim to improve the system by using a pump to continuously deliver a medium onto the slices, observe the same cells over a period of 7 days or more, and compile a small movie. Furthermore, a better camera system with live video tracking may increase the number of live-tracked cells and their accuracy. There are definitely also other well-established and potent methods to visualize live microglia. Brain slices can be prepared from transgenic mice containing a microglia-specific fluorescent reporter gene. In such a model, genes can be turned on or off and visualized. The only disadvantage is that, for such experiments, transgenic mice must be bought and bred, which is a strict and costly process, and slices cannot be prepared from adult mice. Alternatively, fluorescent reporter genes could be transferred directly into the brain slice, but this process is very complex and only works with viruses or gene guns. The use of viruses involves strict safety standards, and gene guns are very expensive, especially when using gold particles. Today, using nanoparticles or pan-surface antibodies may be an alternative method; however, selective penetration into the target is difficult and requires extensive optimization.
4.8. Limits of This Study
This novel live-cell imaging technique offers the first proof-of-principle method for detecting microglia over 20 days, but it is not without its limitations. First, the current printing field of 400 µm is relatively large and could benefit from refinement through commercial automated laser-assisted systems. Second, despite being able to label and follow vessels, astroglia, and now microglia, triplicate labelling remains untested. The interaction between these cell types over weeks will be a new aim to follow up on. Third, long-term cell survival (over weeks) was also not systematically evaluated. Next, we will couple brain slices to a microscopic chamber and a pump to deliver the medium so that we can follow brain cells without transferring them back into the incubator. Fourth, applying the stamps directly onto brain slices can exert mechanical stress and potentially damage the slices. To mitigate this, the printing technique must be optimized. Fifth, even though the team at our lab is very skilled at making organotypic brain slices, several slices were discarded because they did not meet our quality standards. This occurred because the microcontact printing process is rather rough on the slices and partly damages them, especially in regions close to the space. Ensuring the correct orientation of the spots directly along the slice’s edges is also not trivial. Sixth, this study only differentiated the cells by phenotype. Finally, the microglia were counted by eye under a microscope, and quantification using machine learning techniques would lead to quicker and more solid results.
5. Conclusions
Taken together, the present study shows for the first time that microglia can be labelled in mouse organotypic brain slices using microcontact printing with microglia-specific antibodies. These fluorescently labelled microglia can be visualized for up to 20 days with live-cell imaging. The method is straightforward, allowing us to effectively label all cell types in the brain, such as astroglia, vessels, and now microglia. We show that microglia migrate out of the brain slice and can differentiate to some extent. Microglia are very flexible in shape and function, and this new method may allow us to investigate novel aspects of microglial activity.
Author Contributions
Writing, figures, experiments, conceptualization, writing, and final approval: (CH). Experiments, evaluations, and writing: (BR).
Ethical Statement
All animal experiments (taking an organ) were approved by the Austrian Bundesministerium Bildung, Wissenschaft und Forschung, under the approval number 2021-0.150.227 (approved on August 26, 2021) and conformed to the Austrian guidelines on animal welfare and experimentation. Our study using animals (mice) follows ethical guidelines for sacrificing animals, and our animal work complies with international and national regulations. All work was performed according to the 3Rs (reduce–refine–replace) rules of animal experiments. All our slice experiments are defined as “organ removal” and are not “animal experiments”.
Data Availability Statement
Data are available upon request.
Acknowledgments
We thank Anna Draxl and Mohadeseh Ragerdikashani for their excellent technical assistance. We thank MDPI Author Service for English language correction.
Conflicts of Interest
The authors declare no conflicts of interest.
References
- Humpel, C. Long-term live-cell imaging of GFAP+ astroglia and laminin+ vessels in organotypic mouse brain slices using microcontact printing. Frontiers Cell Neurosci. 2025, 19, 1540150. [CrossRef]
- Merighi, S.; Nigro, M.; Travagli, A.; Gessi, S. Microglia and Alzheimer’s Disease.Int J Mol Sci. 2022, 23, 12990. [CrossRef]
- Paasila, P.J.; Davies, D.S.; Kril, J.J.; Goldsbury, C.; Sutherland, G.T. The relationship between the morphological subtypes of microglia andAlzheimer’s disease neuropathology. Brain Pathol. 2019, 29, 726-740. [CrossRef]
- Streit, W.J. Microglia and Alzheimer’s disease pathogenesis. Journal Neuroscience Research 2004, 77, 1-8. [CrossRef]
- Luca, M.; Chavez-Ross, A.; Edelstein-Keshet.; L, Mogilner, A. Chemotactic signaling, microglia, and Alzheimer’s disease senile plaques: is there a connection? Bull Math Biol. 2003, 65, 693-730. [CrossRef]
- Cameron, B.; Landreth, G.E. Inflammation, microglia, and Alzheimer’s disease. Neurobiol Dis. 2010, 37, 503-9. [CrossRef]
- Nakaso, K. Roles of Microglia in Neurodegenerative Diseases, Yonago Acta Medica, 2024, Volume 67, Issue 1, Pages 1-8, Released on J-STAGE February 20, 2024, Online ISSN 1346-8049, doi.org/10.33160/yam.2024.02.001,.
- Yang, X.; Wang, J.; Jia, X.; Yang, Y.; Fang, Y.; Ying, X.; Li, H.; Zhang, M.; Wei, J.; Pan, Y. Microglial polarization in Alzheimer’s disease: Mechanisms, implications, and therapeutic opportunities. J Alzheimers Dis. 2025, 13872877241313223. [CrossRef]
- Kalaria, R.N. Microglia and Alzheimer’s disease.Curr Opin Hematol. 1999, 6, 15-24. [CrossRef]
- Nieto-Sampedro, M.; Mora, F. Active microglia, sick astroglia and Alzheimer type dementias. Neuroreport 1994, 5, 375-80. [CrossRef]
- Robinson, M.; Lee, B.Y.; Hane, F.T. Recent Progress in Alzheimer’s Disease Research, Part 2: Genetics andEpidemiology. J Alzheimers Dis. 2017, 57(2), 317-330. [CrossRef]
- Braak, H.; Del Tredici, K. Neuroanatomy and pathology of sporadic Alzheimer’s disease. Adv Anat Embryol Cell Biol. 2015, 215, 1-162. [PMID: 25920101].
- Obulesu, M.; Jhansilakshmi, M. Neuroinflammation in Alzheimer’s disease: an understanding of physiology andpathology. Int J Neurosci. 2014, 124(4), 227-35. [CrossRef]
- Combs, C.K. Inflammation and microglia actions in Alzheimer’s disease. J Neuroimmune Pharmacol. 2009, 4(4), 380-8. [CrossRef]
- Thériault, P.; El Ali, A.; Rivest, S. The dynamics of monocytes and microglia in Alzheimer’s disease. Alzheimers Res Ther. 2015, 7(1), 41. eCollection 2015.PMID: 25878730. [CrossRef]
- Stolero, N.; Frenkel, D. The dialog between neurons and microglia in Alzheimer’s disease: The neurotransmitters view. J Neurochem. 2021, 158(6), 1412-1424. [CrossRef]
- Yan, H.; Wang, W.; Cui, T.; Shao, Y.; Li, M.; Fang, L.; Feng, L. Advances in the Understanding of the Correlation Between Neuroinflammation and Microglia in Alzheimer’s Disease. Immunotargets Ther. 2024, 13, 287-304. [CrossRef]
- Humpel, C. Organotypic brain slice cultures - Review. Neuroscience 2015, 305, 86-98. [CrossRef]
- Humpel, C. Organotypic brain slice cultures. Curr Protoc Immunol. 2018, e59. [CrossRef]
- Coltman, B.W.; Die, C.F. Temporal characterization of microglia, IL-1 beta-like immunoreactivity and astrocytes in the dentate gyrus of hippocampal organotypic slice cultures. Int J Dev Neurosci. 1996, 14(6), 707-19. [CrossRef]
- Czapiga, M.; Colton, C.A. Function of microglia in organotypic slice cultures. J Neurosci Res. 1999, 56(6), 644-51. [CrossRef]
- Skibo, G.G.; Nikonenko, I.R.; Savchenko, V.L.; McKanna, J.A. Microglia in organotypic hippocampal slice culture and effects of hypoxia: ultrastructure and lipocortin-1 immunoreactivity.Neuroscience 2000, 96(2), 427-38. [CrossRef]
- Merlo, S.; Caruso, G.I.; Korde, D.S.; Khodorovska, A.; Humpel, C.; Sortino, M.A. Melatonin Activates Anti-Inflammatory Features in Microglia in a Multicellular Context: Evidence from Organotypic Brain Slices and HMC3 Cells. Biomolecules 2023, 13(2), 373. [CrossRef]
- Delbridge, A.R.D.; Huh, D.; Brickelmaier, M.; Burns.; J.C.; Roberts, C.; Challa, R.; Raymond, N.; Cullen, P.; Carlile, T.M.; Ennis, K.A.; Liu, M.; Sun, C.; Allaire, N.E.; Foos, M.; Tsai, H.H.; Franchimont, N.; Ransohoff, R.M.; Butts, C.; Mingueneau, M. Organotypic Brain Slice Culture Microglia Exhibit Molecular Similarity to Acutely-Isolated Adult Microglia and Provide a Platform to Study Neuroinflammation. Front Cell Neurosci. 2020, 14, 592005. [CrossRef]
- Steiner, K.; Humpel, C. Effects of Ischemia on the Migratory Capacity of Microglia Along Collagen Microcontact Prints on Organotypic Mouse Cortex Brain Slices. Front Cell Neurosci. 2022, 116, 858802. [CrossRef]
- Steiner, K.; Yilmaz, S.N.; Gern, A.; Marksteiner, J.; Faserl, K.; Villunger, M.; Sarg, B.; Humpel, C. From Organotypic Mouse Brain Slices to Human Alzheimer Plasma Biomarkers: A Focus on Microglia. Biomolecules 2024, 14(9), 1109. [CrossRef]
- Steiner, K.; Humpel, C. Long-term organotypic brain slices cultured on collagen-based microcontact prints: A perspective for a brain-on-a-chip. J Neurosci Methods 2023. 399, 109979. [CrossRef]
- Gähwiler, B.H.; Capogna, M.; Debanne, D.; McKinney, R.A.; Thompson, S.M. Organotypic slice cultures: a technique has come of age. Trends Neurosci 1997, 20, 471–477. [CrossRef]
- Stoppini, L.; Buchs, P.A.; Muller, D. A simple method for organotypic cultures of nervous tissue. J Neurosci Methods 1991, 37, 173–182. [CrossRef]
- Masuch, A.; Biber, K. Replenishment of Organotypic Hippocampal Slice Cultures with Neonatal or Adult Microglia. Methods Mol Biol 2019, 2034, 127–147. [CrossRef]
- Hoogland, I.C.M.; Houbolt, C.; van Westerloo, D.J.; van Gool, W.A.; van de Beek, D. Systemic inflammation and microglial activation: systematic review of animal experiments. J Neuroinflammation 2015, 12, 114. [CrossRef]
- Lively, S.; Schlichter, L.C. Microglia Responses to Pro-inflammatory Stimuli (LPS, IFNγ+TNFα) and Reprogramming by Resolving Cytokines (IL-4, IL-10). Front Cell Neurosci. 2018 24; 12:215.
- Skrzypczak-Wiercioch, A.; Sałat, K. Lipopolysaccharide-Induced Model of Neuroinflammation: Mechanisms of Action, Research Application and Future Directions for Its Use. Molecules 2022, 27, 5481. [CrossRef]
- Hoshi, T.; Toyama, T.; Shinozaki, Y.; Koizumi, S.; Lee, J.Y.; Naganuma, A.; Hwangm G.-W. Evaluation of M1-microglial activation by neurotoxic metals using optimized organotypic cerebral slice cultures. The Journal of Toxicological Sciences 2019, 44(7):471–9. [CrossRef]
- Kim S.; Son, Y. Astrocytes Stimulate Microglial Proliferation and M2 Polarization In Vitro through Crosstalk between Astrocytes and Microglia. Int J Mol Sci. 2021 22(16):8800.
- Thygesen, C.; Ilkjær, L.; Kempf, S.J.; Hemdrup, A.L.; von Linstow, C.U.; Babcock, A.A; Darvesh, S.; Larsen, M.R.; Finsen, B. Diverse Protein Profiles in CNS Myeloid Cells and CNS Tissue From Lipopolysaccharide- and Vehicle-Injected APPSWE/PS1ΔE9 Transgenic Mice Implicate Cathepsin Z in Alzheimer’s Disease. Front Cell Neurosci 2018 https://www.frontiersin.org/journals/cellularneuroscience/articles/10.3389/fncel.2018.00397/full.
- Chitu, V.; Biundo, F.; Stanley; E.R. Colony stimulating factors in the nervous system. Semin Immunol 2021, 54, 101511. [CrossRef]
- Dikmen, H.O.; Hemmerich, M.; Lewen, A.; Hollnagel, J.O.; Chausse, B.; Kann; O. GM-CSF induces noninflammatory proliferation of microglia and disturbs electrical neuronal network rhythms in situ. J Neuroinflammation 2020, 17:235.
- Stanley, E.R.; Biundo, F.; Gökhan, Ş.; Chitu, V. Differential regulation of microglial states by colony stimulating factors. Front Cell Neurosci 2023, 17, 1275935. [CrossRef]
- Kloss, C.U.; Kreutzberg, G.W.; Raivich, G., Proliferation of ramified microglia on an astrocyte monolayer: characterization of stimulatory and inhibitory cytokines. J Neurosci Res 1997, 49, 248–254.
- Kubo, M.; Motomura, Y. Transcriptional regulation of the anti-inflammatory cytokine IL-10 in acquired immune cells. Front Immunol 2012, 3, 275. [CrossRef]
- Burmeister, A.R.; Marriott, I. The Interleukin-10 Family of Cytokines and Their Role in the CNS. Front Cell Neurosci 2018, 12, 458. [CrossRef]
- Laffer B.; Bauer D.; Wasmuth, S.; Busch M.; Jalilvand, T.V.; Thanos, S.; zu Höset, G.M.; Loser, K.; Langmann, T.; Heiligenhaus, A.; Kapser, M.Loss of IL-10 Promotes Differentiation of Microglia to a M1 Phenotype. Front Cell Neurosci. 2019, 3:430. [CrossRef]
- Jiang, X.; He, H.; Mo, L.; Liu, Q.; Yang, F.; Zhou, Y.; Li, L.; Su, D.; Yi, S.; Zhang, J. Mapping the Plasticity of Morphology, Molecular Properties and Function in Mouse Primary Microglia. Front Cell Neurosci 2021, 15, 811061. [CrossRef]
- Wirjatijasa, F.; Dehghani, F.; Blaheta, R.A.; Korf, H.-W.; Hailer, N.P. Interleukin-4, interleukin-10, and interleukin-1-receptor antagonist but not transforming growth factor-beta induce ramification and reduce adhesion molecule expression of rat microglial cells. J Neurosci Res 2002, 68, 579–587. [CrossRef]
- Quarta, A.; Berneman, Z.; Ponsaerts, P. Functional consequences of a close encounter between microglia and brain-infiltrating monocytes during CNS pathology and repair. J Leukoc Biol 2021, 110, 89–106. [CrossRef]
- Spiteri, A.G.; Wishart, C.L.; Pamphlett, R.; Locatelli, G.; King, N.J.C., Microglia and monocytes in inflammatory CNS disease: integrating phenotype and function. Acta Neuropathol 2022, 143, 179–224. [CrossRef]
- Wicks, E.E.; Ran, K.R.; Kim, J.E.; Xu, R.; Lee, R.P.; Jackson, C.M. The Translational Potential of Microglia and Monocyte-Derived Macrophages in Ischemic Stroke. Front Immunol 2022, 13, 897022. [CrossRef]
- Hohsfield, L.A.; Humpel, C. Intravenous Infusion of Monocytes Isolated from 2-Week-Old Mice Enhances Clearance of Beta-Amyloid Plaques in an Alzheimer Mouse Model. PLoS One 2015, 10, e0121930. [CrossRef]
- Colonna, M.; Butovsky; O. Microglia Function in the Central Nervous System During Health and Neurodegeneration. Annu Rev Immunol 2021, 35, 441–468. [CrossRef]
- Silva, C.G., Peyre, E., Nguyen, L., 2019. Cell migration promotes dynamic cellular interactions to control cerebral cortex morphogenesis. Nat Rev Neurosci 2019, 20, 318–329. [CrossRef]
- Smolders, S.M.T.; Kessels, S.; Vangansewinkel, T.; Rigo, J.M.; Legendre, P., Brône, B. Microglia: Brain cells on the move. Progress in Neurobiology. 2019 178:101612.
- Franco-Bocanegra, D.K.; McAuley, C.; Nicoll, J.A.R.; Boche, D. Molecular Mechanisms of Microglial Motility: Changes in Ageing and Alzheimer’s Disease. Cells 2019, 8, 639. [CrossRef]
- Morrison, H.; Young, K.; Qureshi, M.; Rowe, R.K.; Lifshitz, J. Quantitative microglia analyses reveal diverse morphologic responses in the rat cortex after diffuse brain injury. Sci Rep 2017, 7, 13211. [CrossRef]
- Loane, D.J.; Kumar, A. Microglia in the TBI brain: The good, the bad, and the dysregulated. Exp Neurol 2016, 275 Pt 3, 316–327. [CrossRef]
- Azmal, M.; Paul, J.K.; Prima, F.S., Haque; A.; Meem, M; Ghosh. Microglial dysfunction in Alzheimer’s disease: Mechanisms, emerging therapies, and future directions. Experimental Neurology 2025, 392, 115374. [CrossRef]
- Ogaki, A.; Araki, T.; Ishikawa, M.; Ikegaya, Y.; Koyama, R. A live imaging-friendly slice culture method using collagen membranes. Neuropsychopharmacology Reports 2020, 40(3):307–13.
- Lu, Y.; Kamel-El Sayed, S.A.; Wang, K.; Tiede-Lewis, L.M.; Grillo, M.A.; Veno, P.A.; Dusevich, V.; Phillips, C.L.; Bonewald, L.F.; Dallas, S.L. Live Imaging of Type I Collagen Assembly Dynamics in Osteoblasts Stably Expressing GFP and mCherry-tagged Collagen Constructs. J Bone Miner Res 2018, 33, 1166–1182. [CrossRef]
Figure 1.
Preparation of mouse organotypic brain slices. Postnatal day 8-10 mice are sectioned (A) with a vibratome (150 µm), and 2 hippocampal half-brain slices are positioned on a semipermeable membrane in a membrane insert containing a 6-well plate and cultured for 2 weeks (B). Stamps are produced from a Master (C) and placed on the brain slice (D). Figure E shows a positive control of a print (3x3 400 µm spots) of a green fluorescent Alexa-488 antibody on a membrane. Figure F shows a scheme of the experimental set-up. Scale bar = 1.1 cm (B) and 600 µm (E).
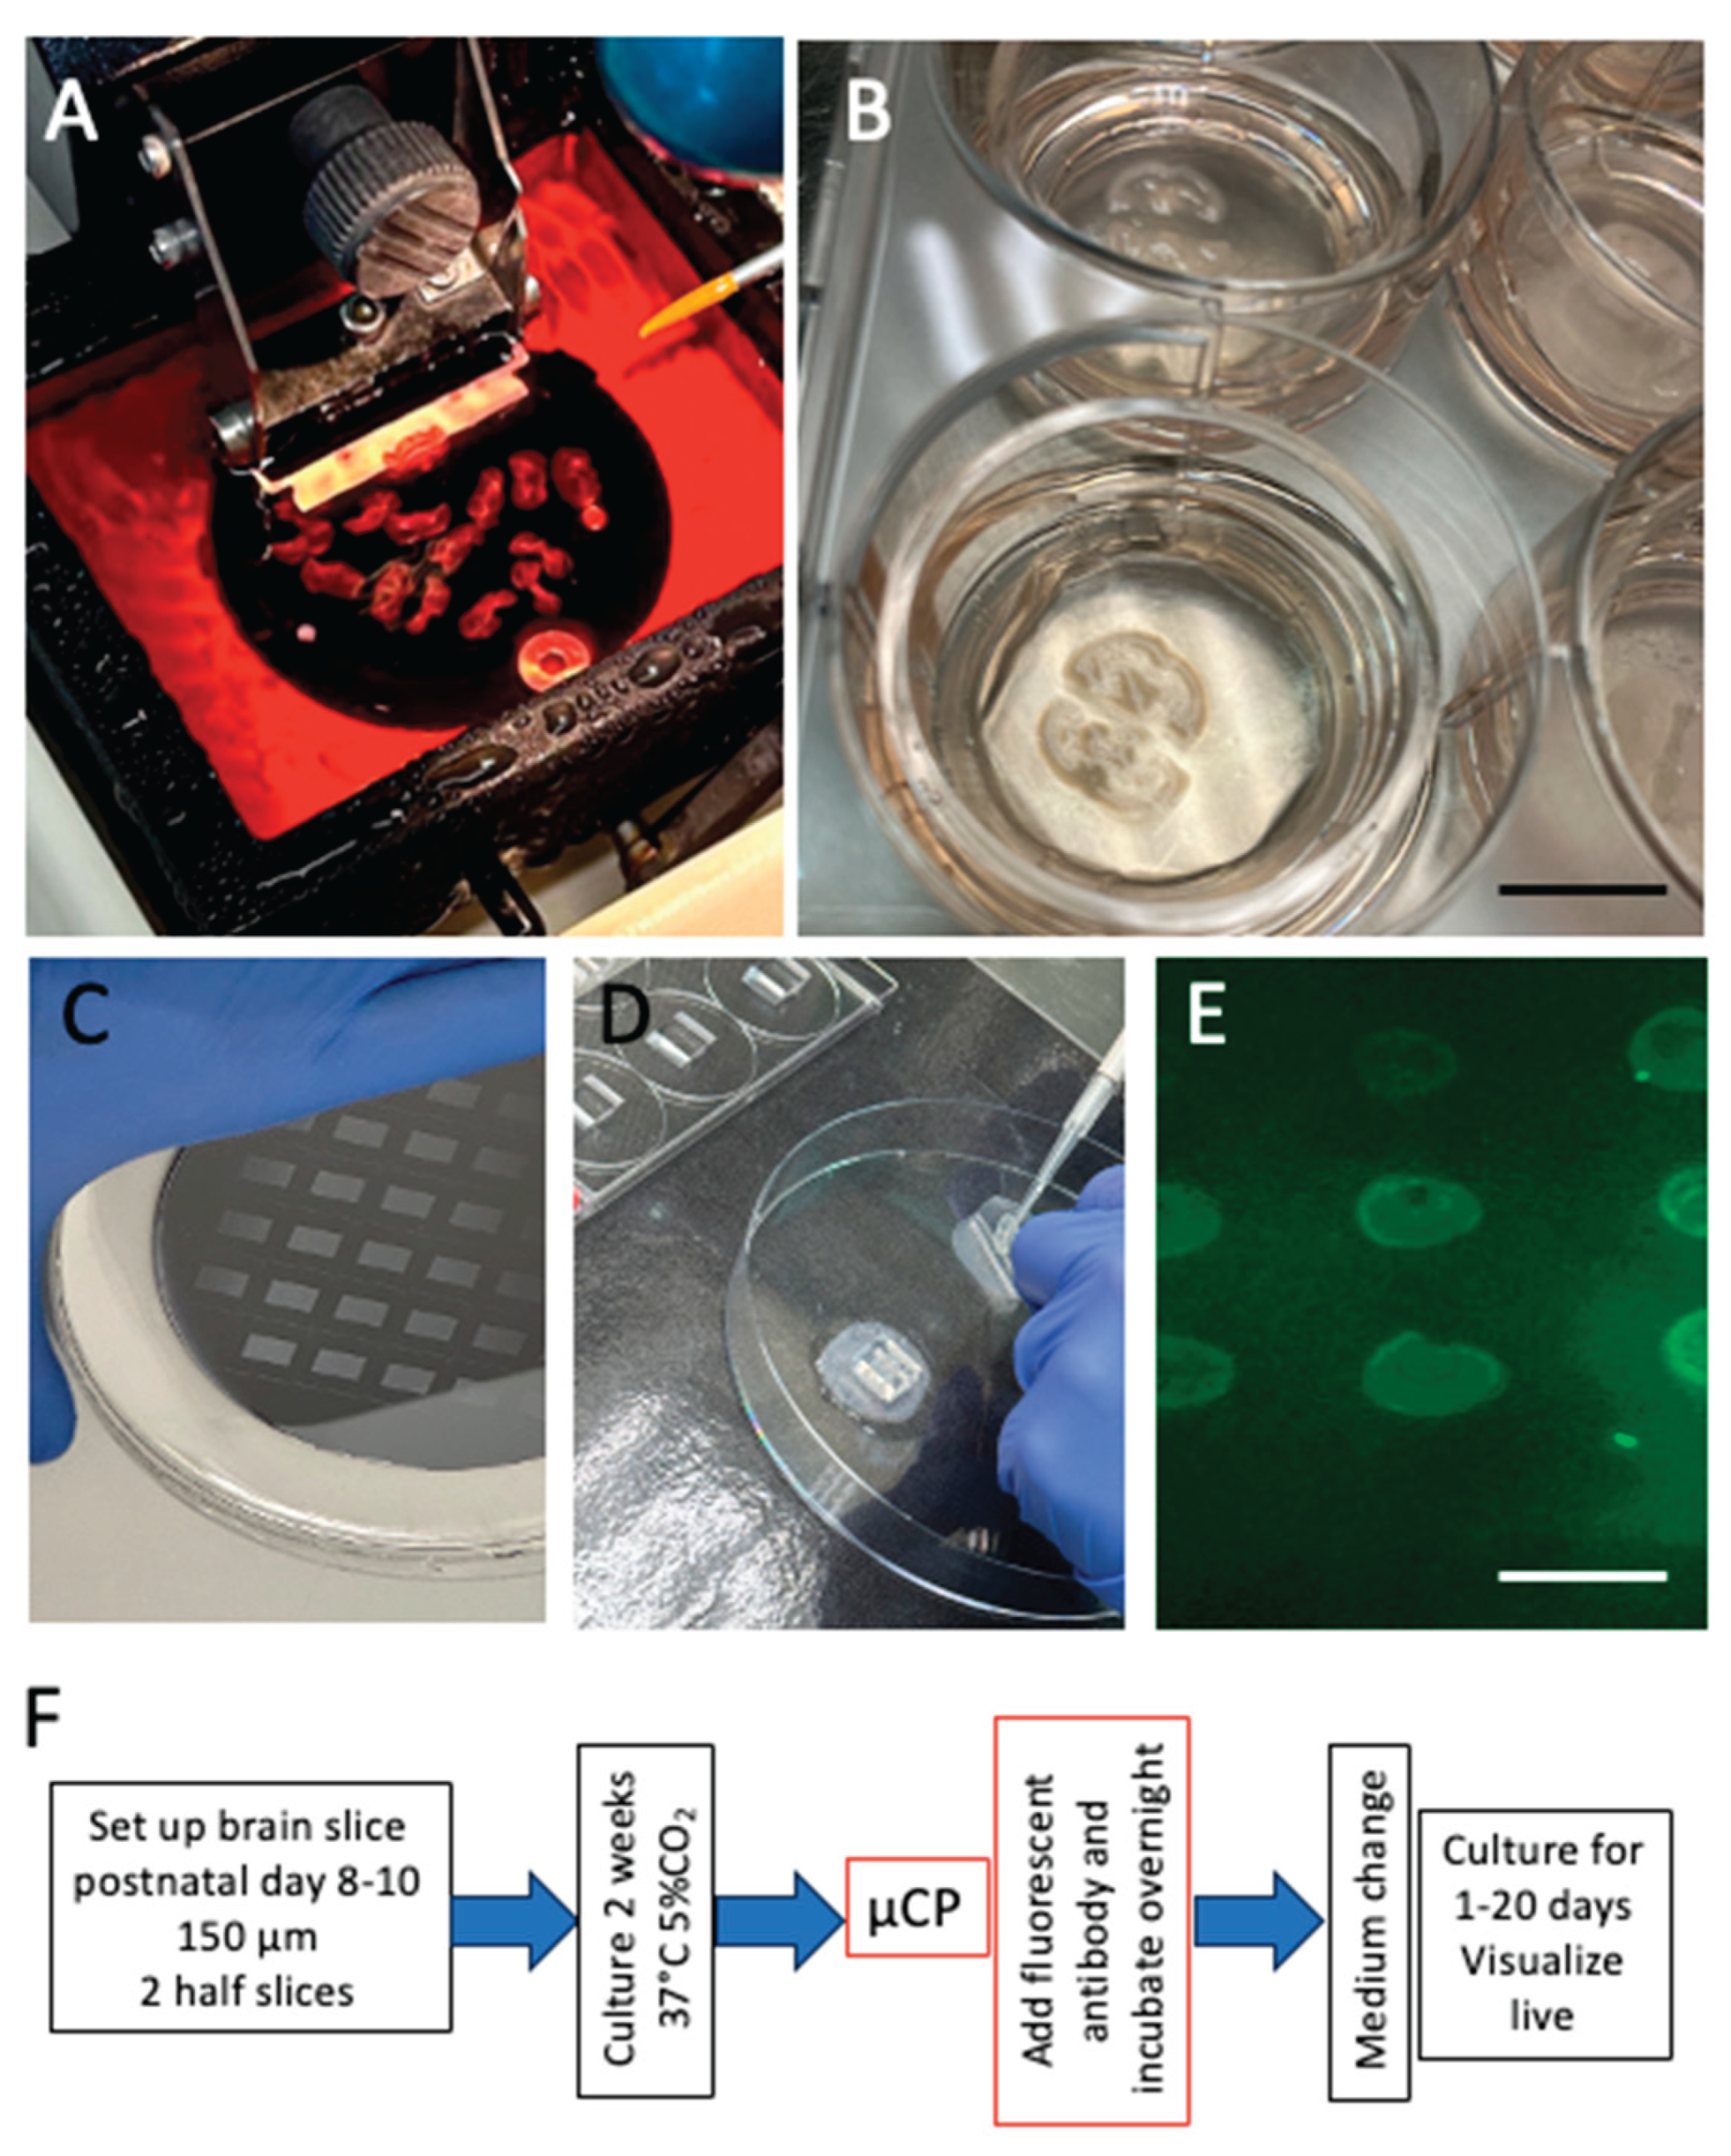
Figure 2.
Microcontact printing (µCP) of Iba1 shows strong green fluorescent Alexa-488 (A-488) microglia in a round spot (A). The spot is localized over brain tissue stained with blue fluorescent nuclear DAPI (B). No staining is seen in the same slice in the red channel showing specificity of Iba1 µCP (C). When a slice was stained without a preabsorbed antibody (preAb) then only background staining is seen (D). As an additional control, slices were µCP without Iba (µCP(-)) and showed only background staining (E). Three types of Iba1+ microglia are mainly seen: round amoeboid (F), ramified forms (G), and large macrophages (H). Scale bar = 400 µm (A-E), 20 µm (F), 30 µm (G), and 70 µm (H).
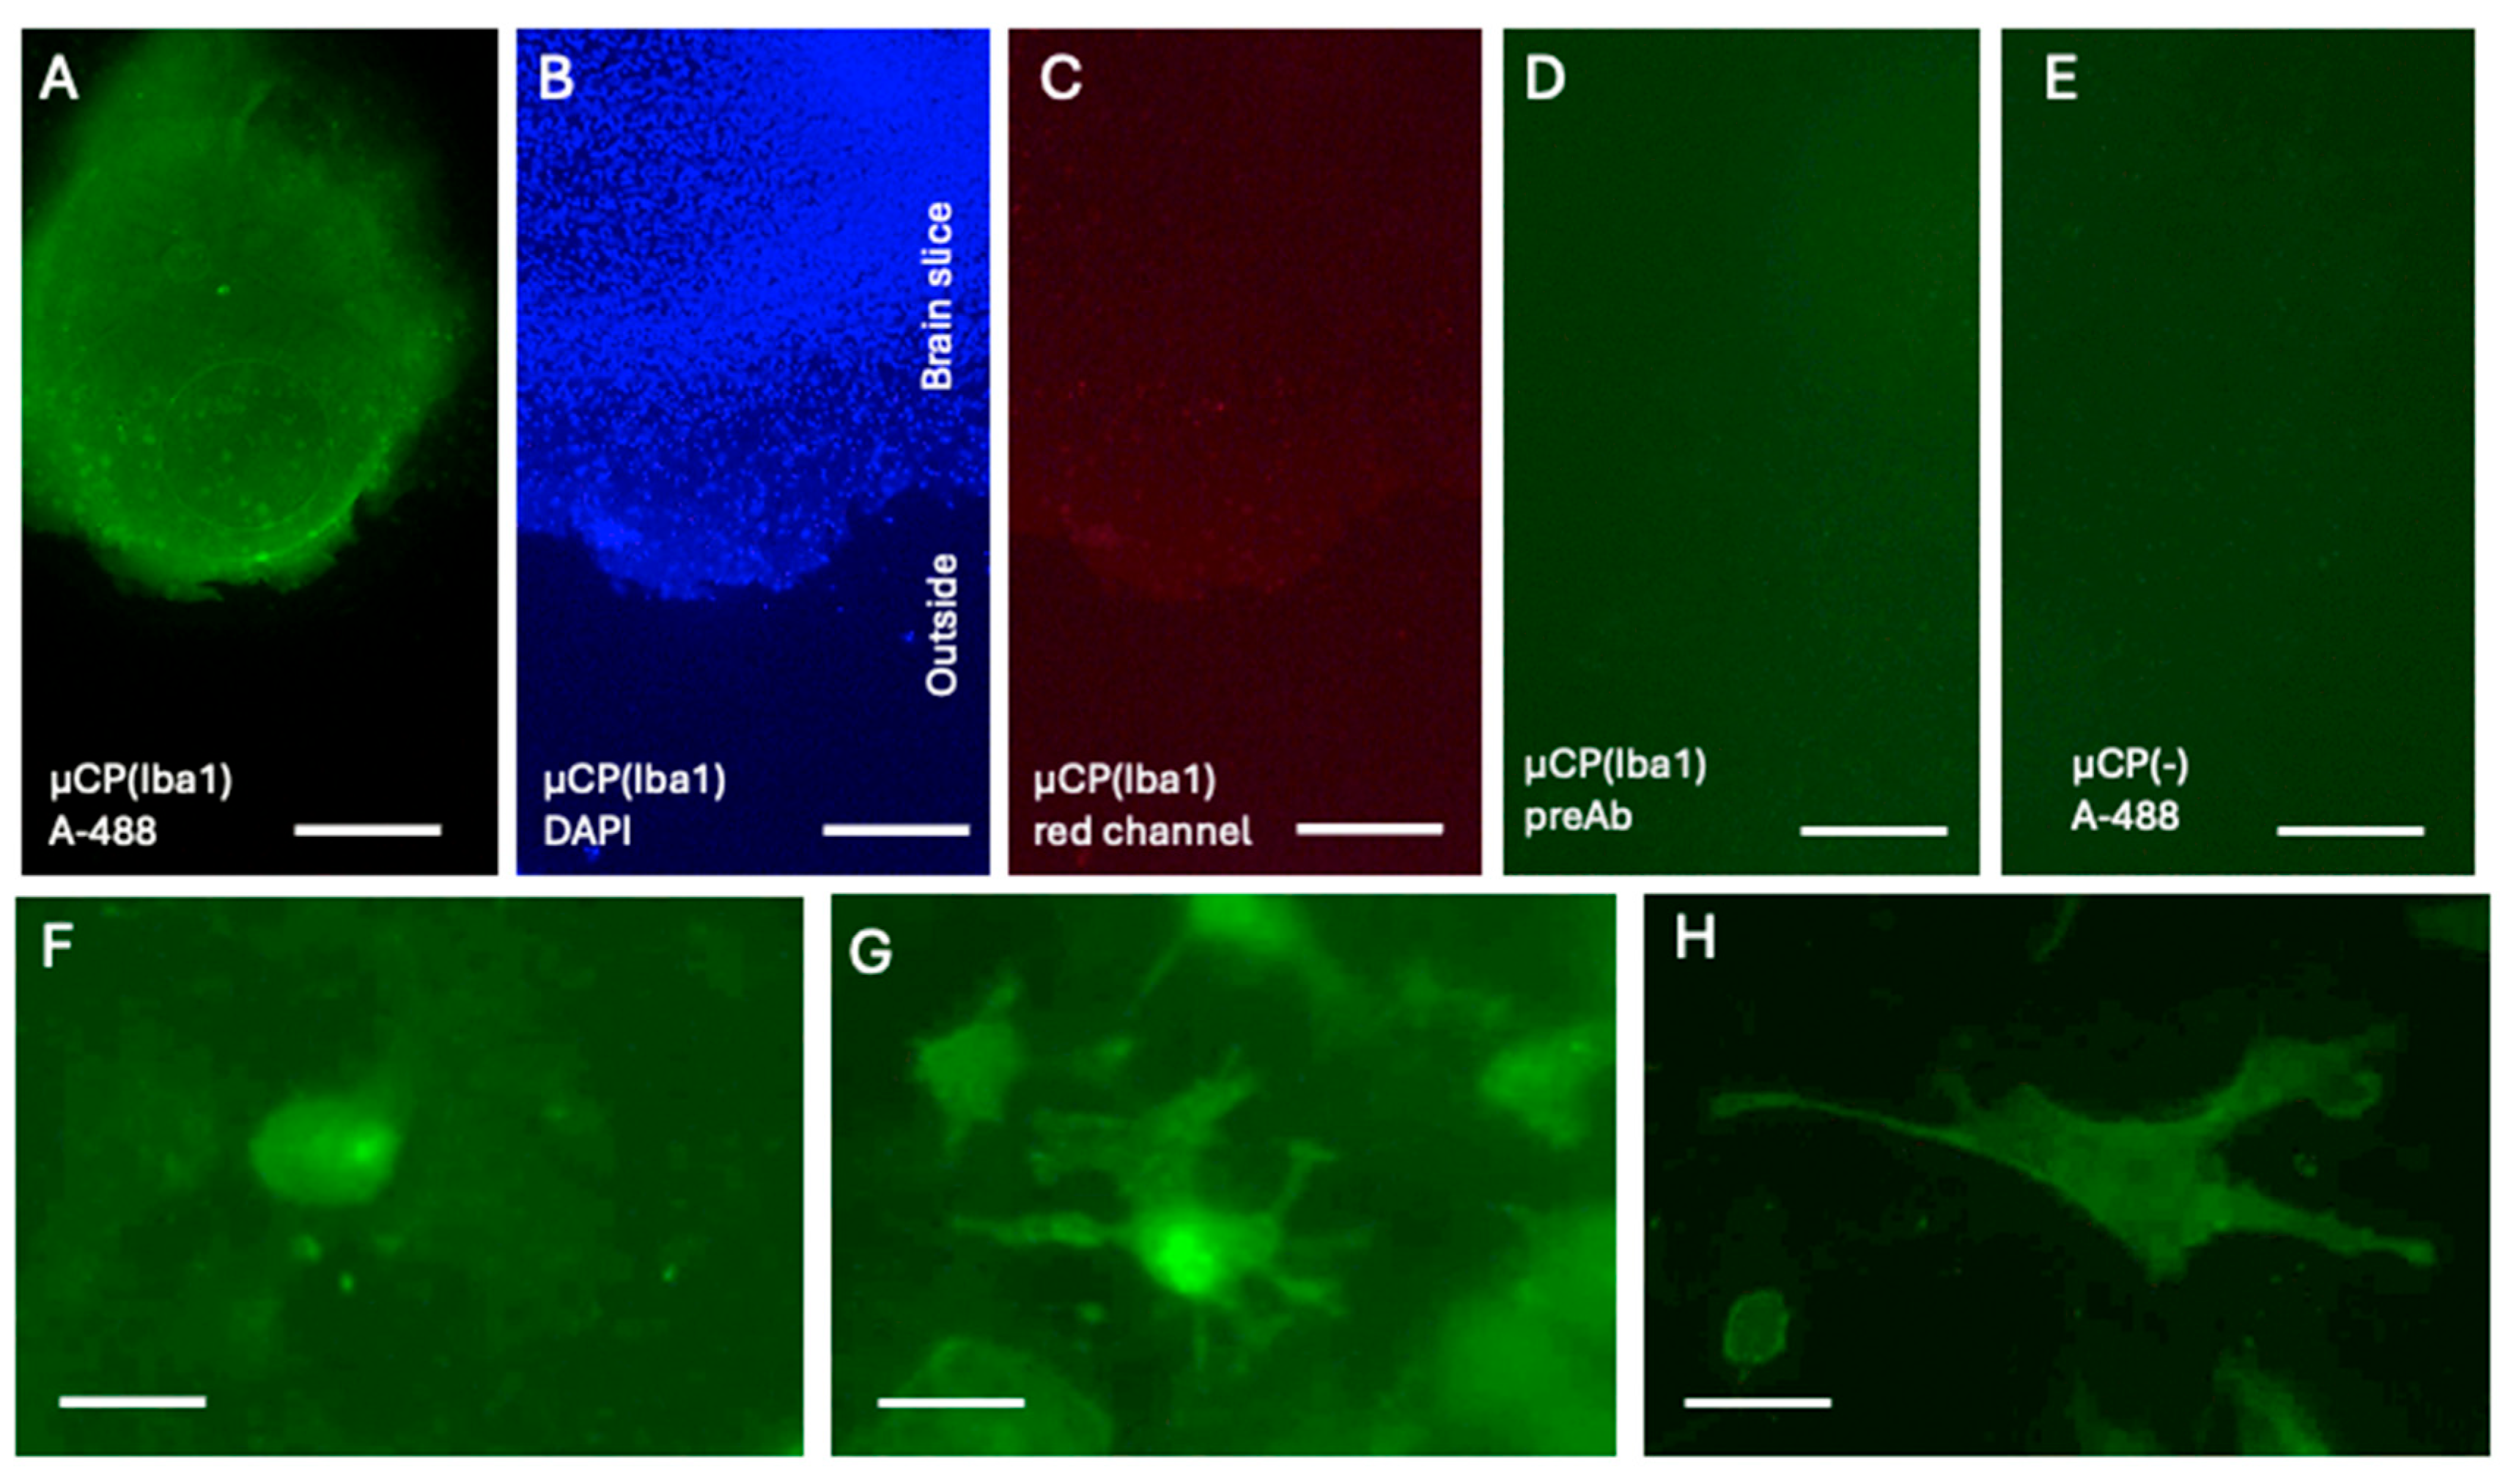
Figure 3.
Migration of Iba1+ microglia into the space after 10 days when incubated without (minus, A) or with 1 µg/mL lipopolysaccharide (B, LPS), 10 ng/mL interleukin-10 (C, IL-10), or 10 ng/mL granulocyte–macrophage colony-stimulating factor (D, GM-CSF). Figure E shows a higher magnification of round (upper arrow) and ramified (lower arrow) microglia. The cells in Figure E were counterstained with blue fluorescent nuclear DAPI. The red dotted line shows the border of the slices. Scale bar = 150 µm (A-D) and 65 µm (E).
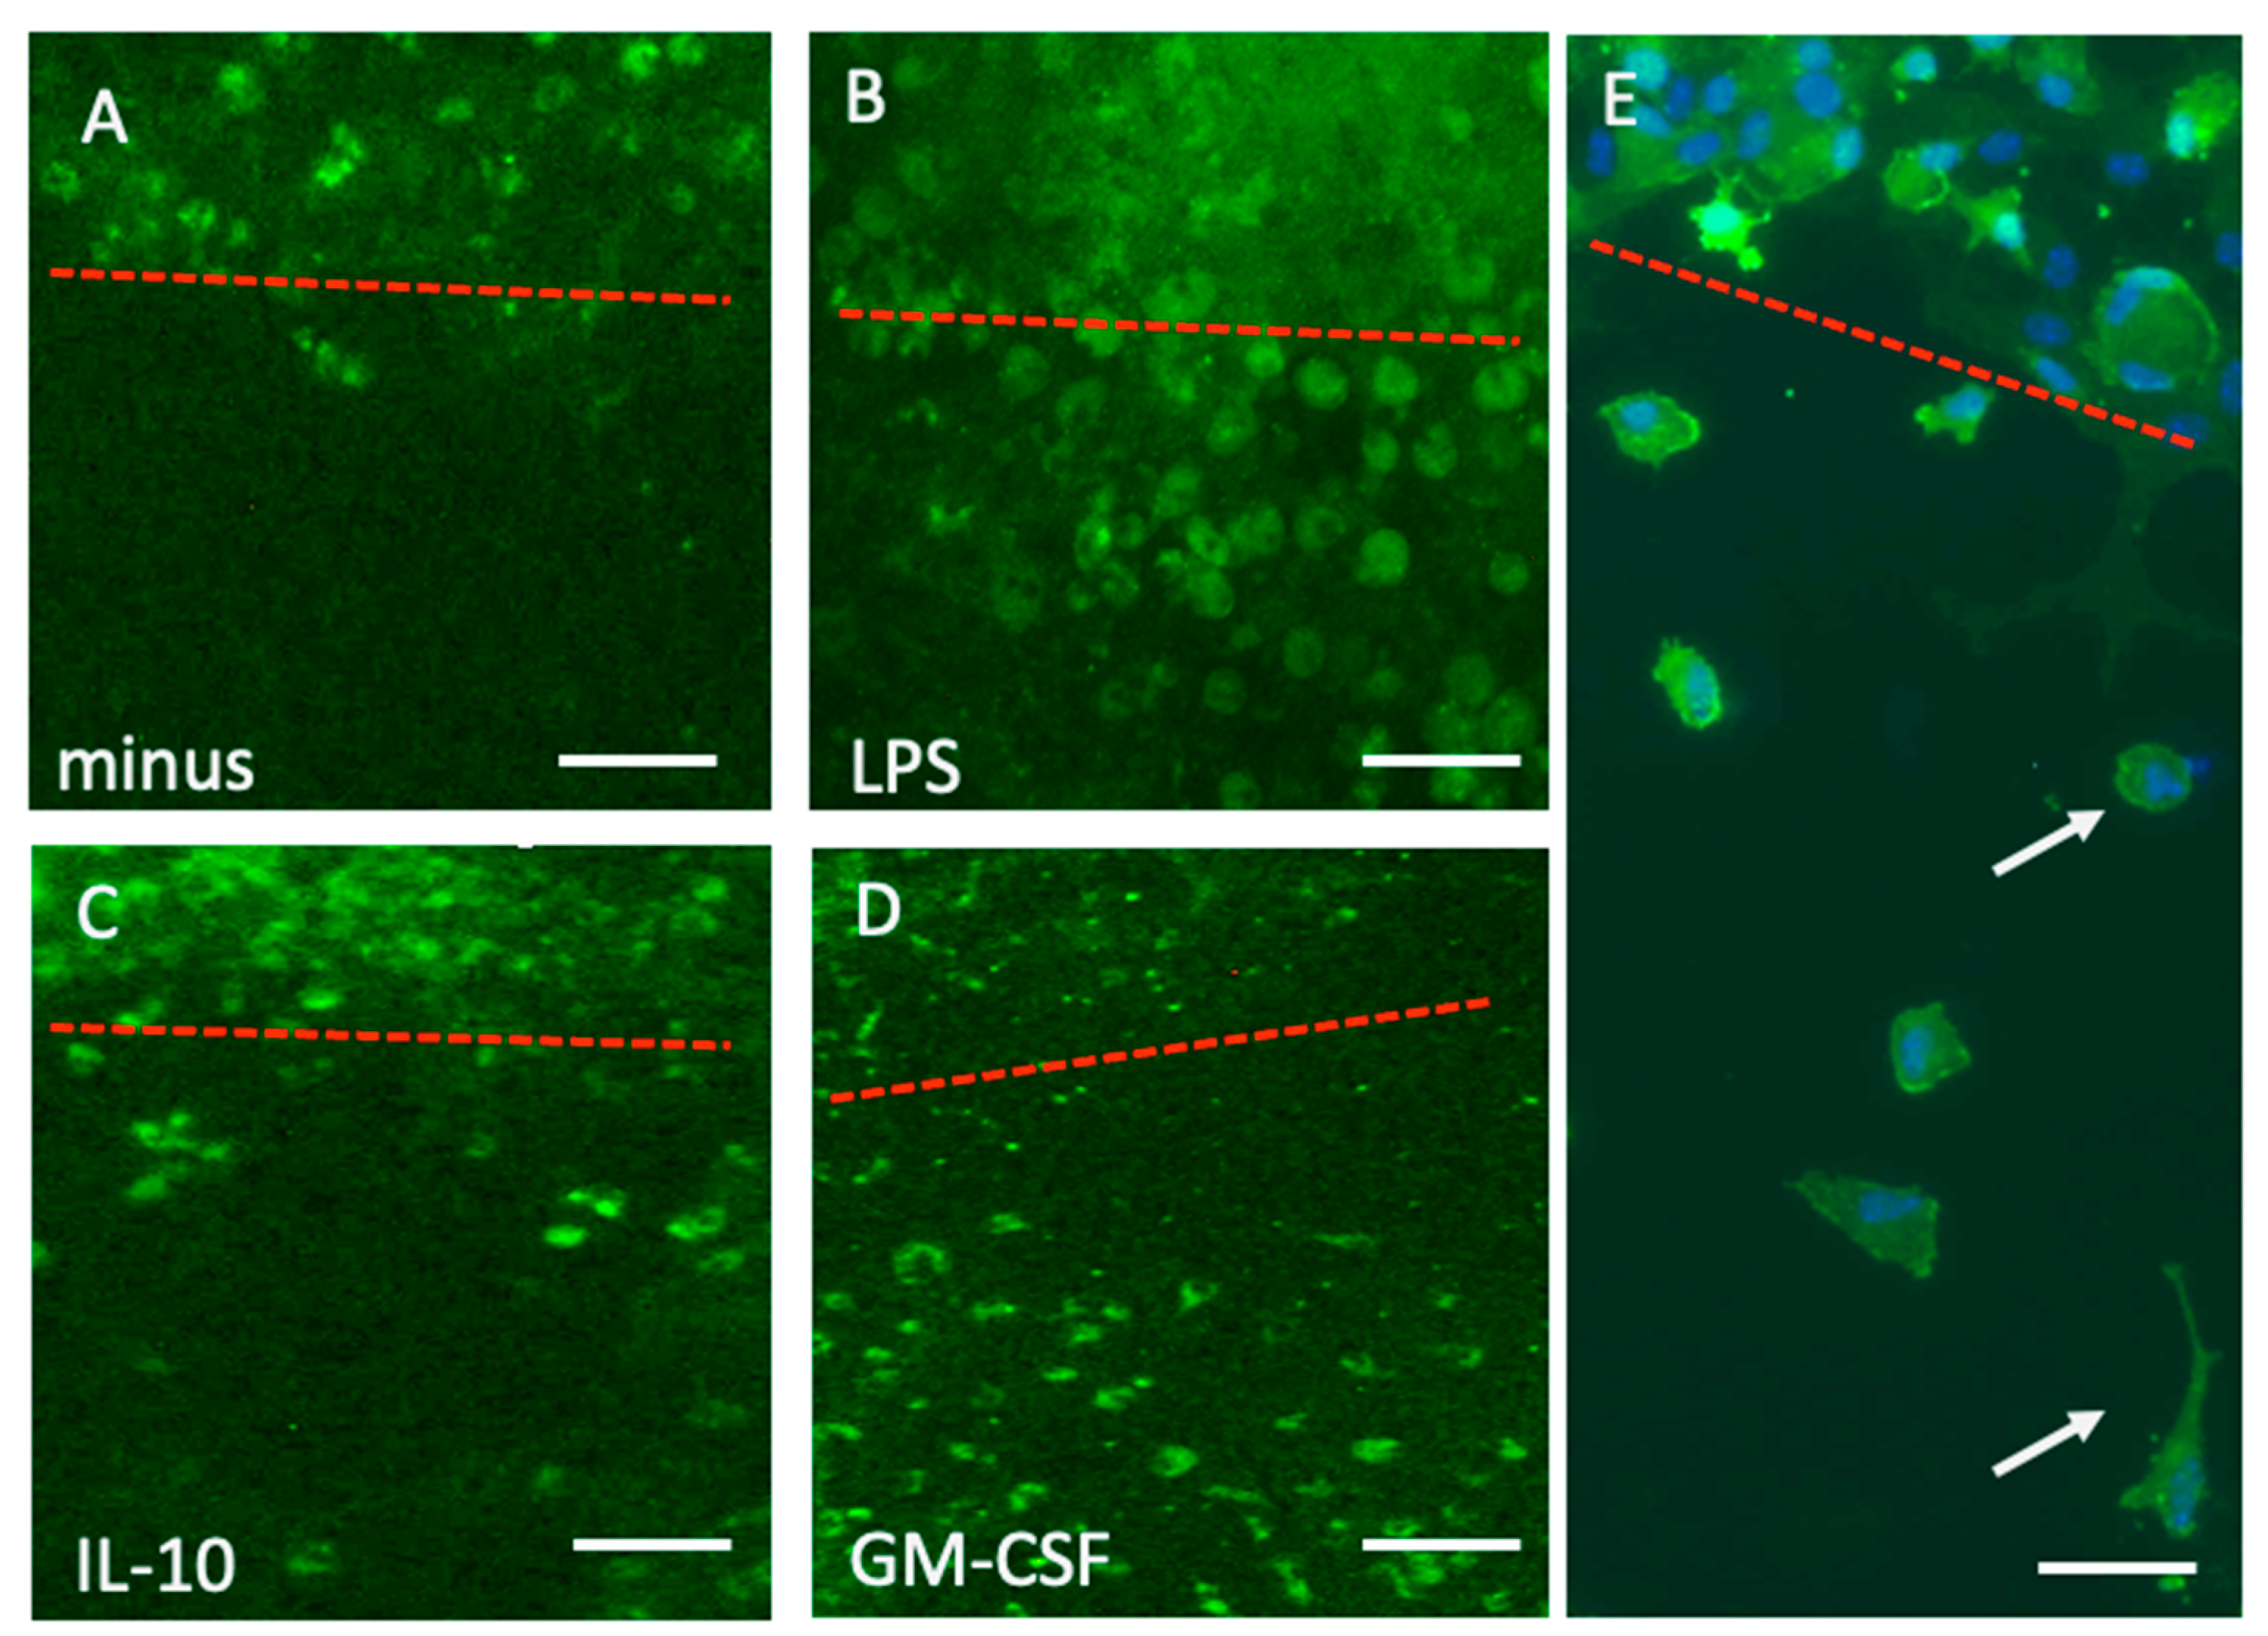
Figure 4.
Quantitative analysis of the migration of Iba1+ microglia into the space. Slices were labelled with the Iba1-Alexa488 antibody and then incubated and visualized after 1-5-10 and 20 days. Slices were incubated without (red circle, control) or with 1 µg/mL lipopolysaccharide (blue triangle, LPS), 10 ng/mL interleukin-10 (green boxes, IL-10) or 10 ng/mL granulocyte–macrophage colony-stimulating factor (black triangles, GM-CSF). Values are given as the mean±SEM of the total migrated cells per field (0.3 mm2); the n number is given in the box. The left panel (A) shows migrated round microglia, while the right panel (B) shows migrated ramified microglia. Statistical analysis was performed using One-Way ANOVA followed by a Fisher LSD post hoc test compared against the results of day 1. ** p<0.01; *** p<0.001.
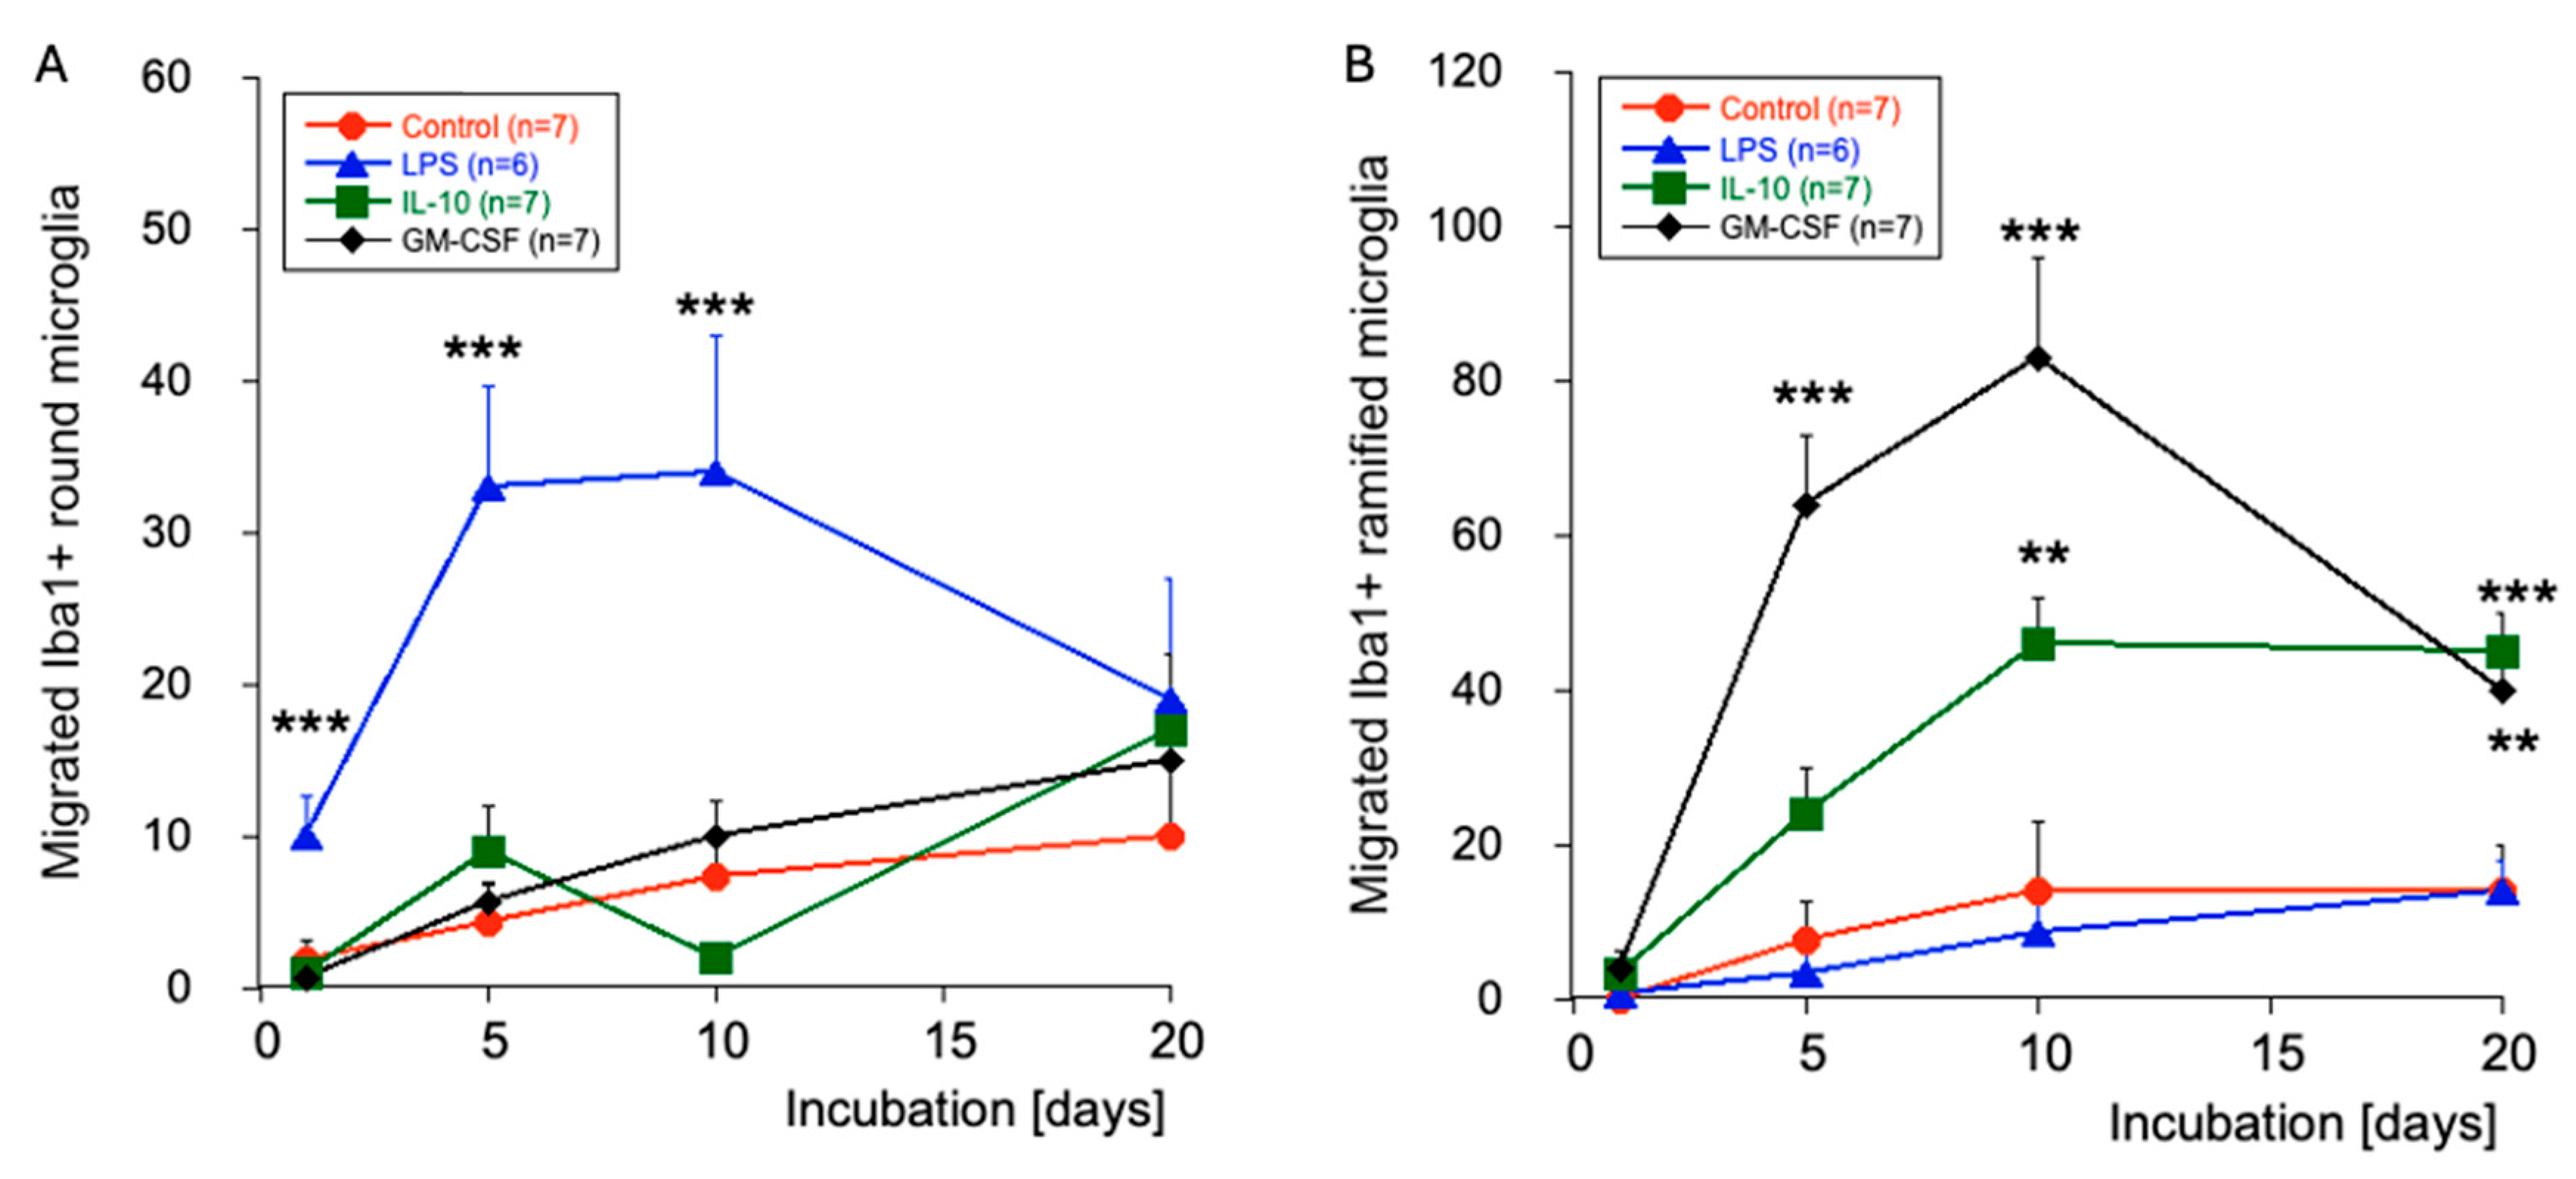
Figure 5.
Cell death analysis with propidium iodide (PI). Two-week-old slices were microcontact-printed, incubated for 20 days, and then stained for viability with 2 µg/mL PI before being analyzed. Panel A shows very few PI+ red fluorescent nuclei. As a positive control, slices were incubated for 2 days with hydrogen peroxide, showing a dramatic increase in cell death (B). Panel C shows a high-magnification image of PI+ nuclei counterstained with blue fluorescent nuclear DAPI. Panel D shows the quantitative analysis of PI+ nuclei per 15,000 µm2 incubated without (CO) or with 1 µg/mL lipopolysaccharide (LPS), 10 ng/mL interleukin-10 (IL-10), or 10 ng/mL granulocyte–macrophage colony-stimulating factor (GM-CSF). Values are given as the mean±SEM; the n number is given in parentheses. Note that there is no statistical difference between the groups. Scale bar = 70 µm (A, B) and 15 µm (C).
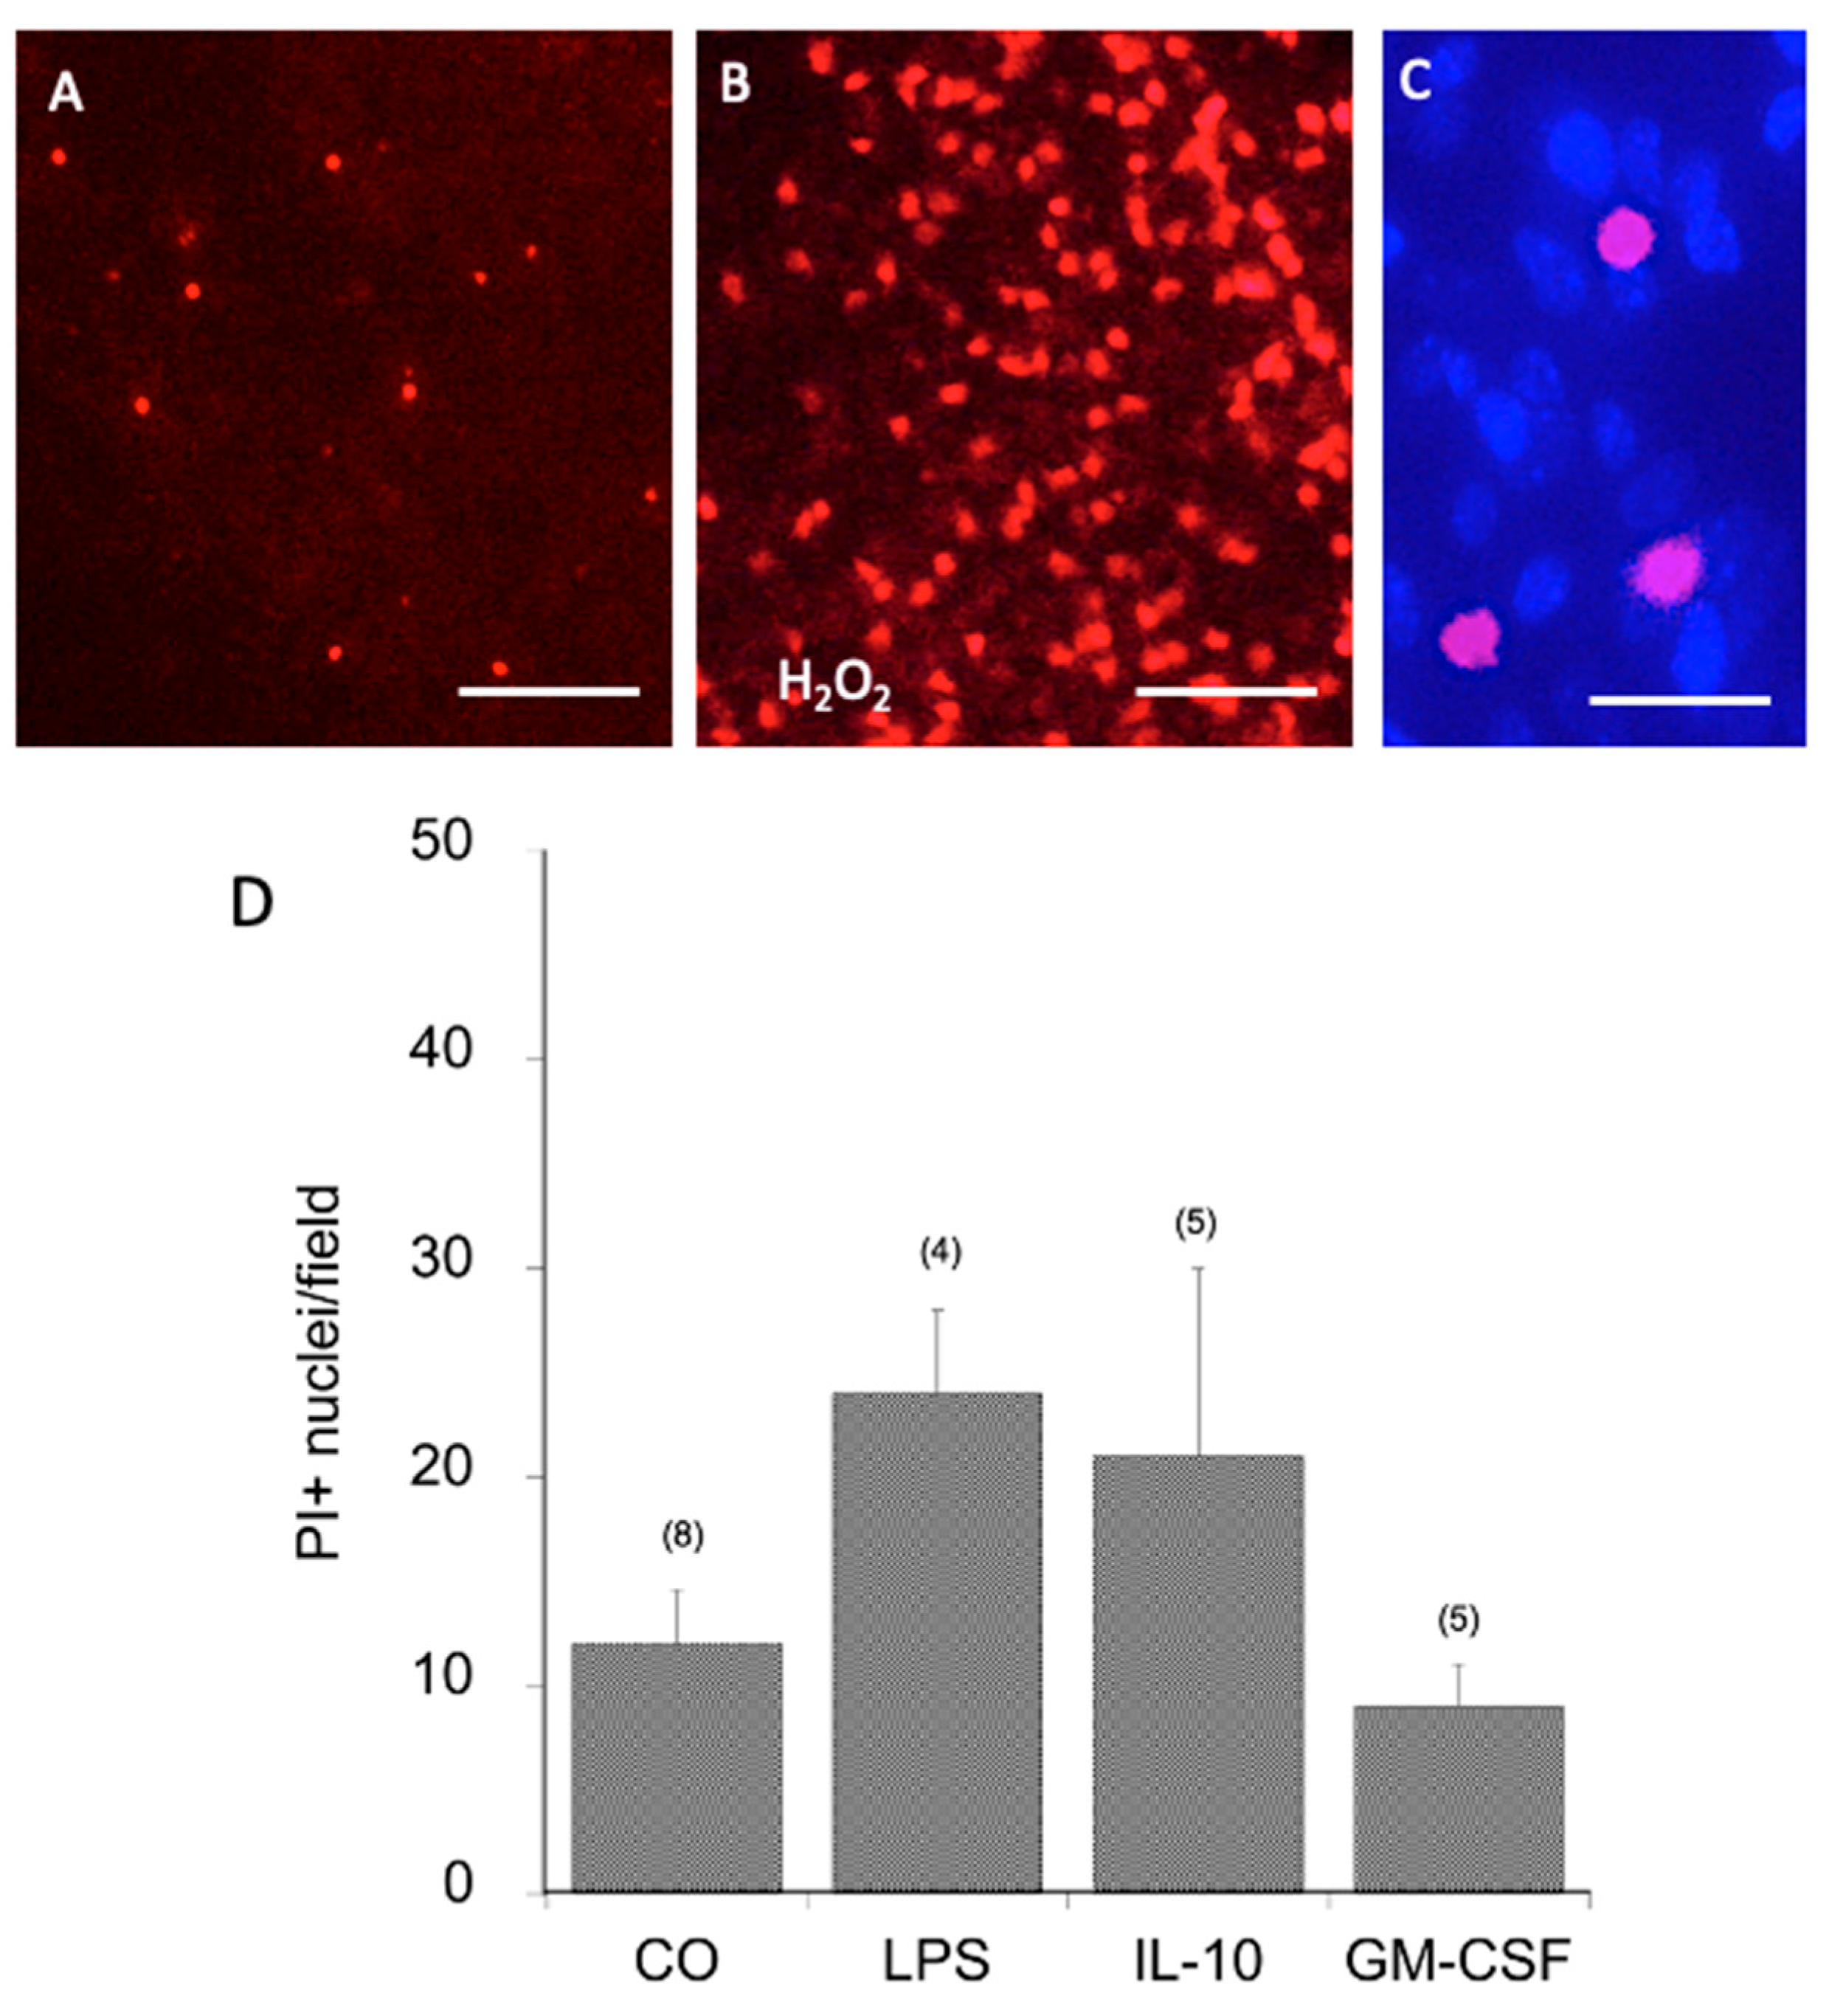
Figure 6.
CD11b+ microglia: Microcontact printing (µCP) shows that Iba1 as well as CD11b were positively labeled in the brain slices. Figure A shows green fluorescent CD11b+ (made in rabbit) microglia in brain slices after microcontact printing in a 400 µm spot (A). No staining was seen in the red channel of the same field, showing specificity (B). In order to proof specificity, Iba 1 and a CD11b (made in rat) antibody were double µCP and stained with green fluorescent Alexa-488 (Iba1, C, F, I) and red fluorescent Alexa-555 (CD11b, D, G, J). The Figures E, H and K show the merged pictures, where Iba1 appears cytoplasmic, while CD11b is expressed extracellularly at the cell membranes. Scale bar = 150 µm (A, B), 90 µm (C-E), 60 µm (F-H) and 30 µm (I-K).
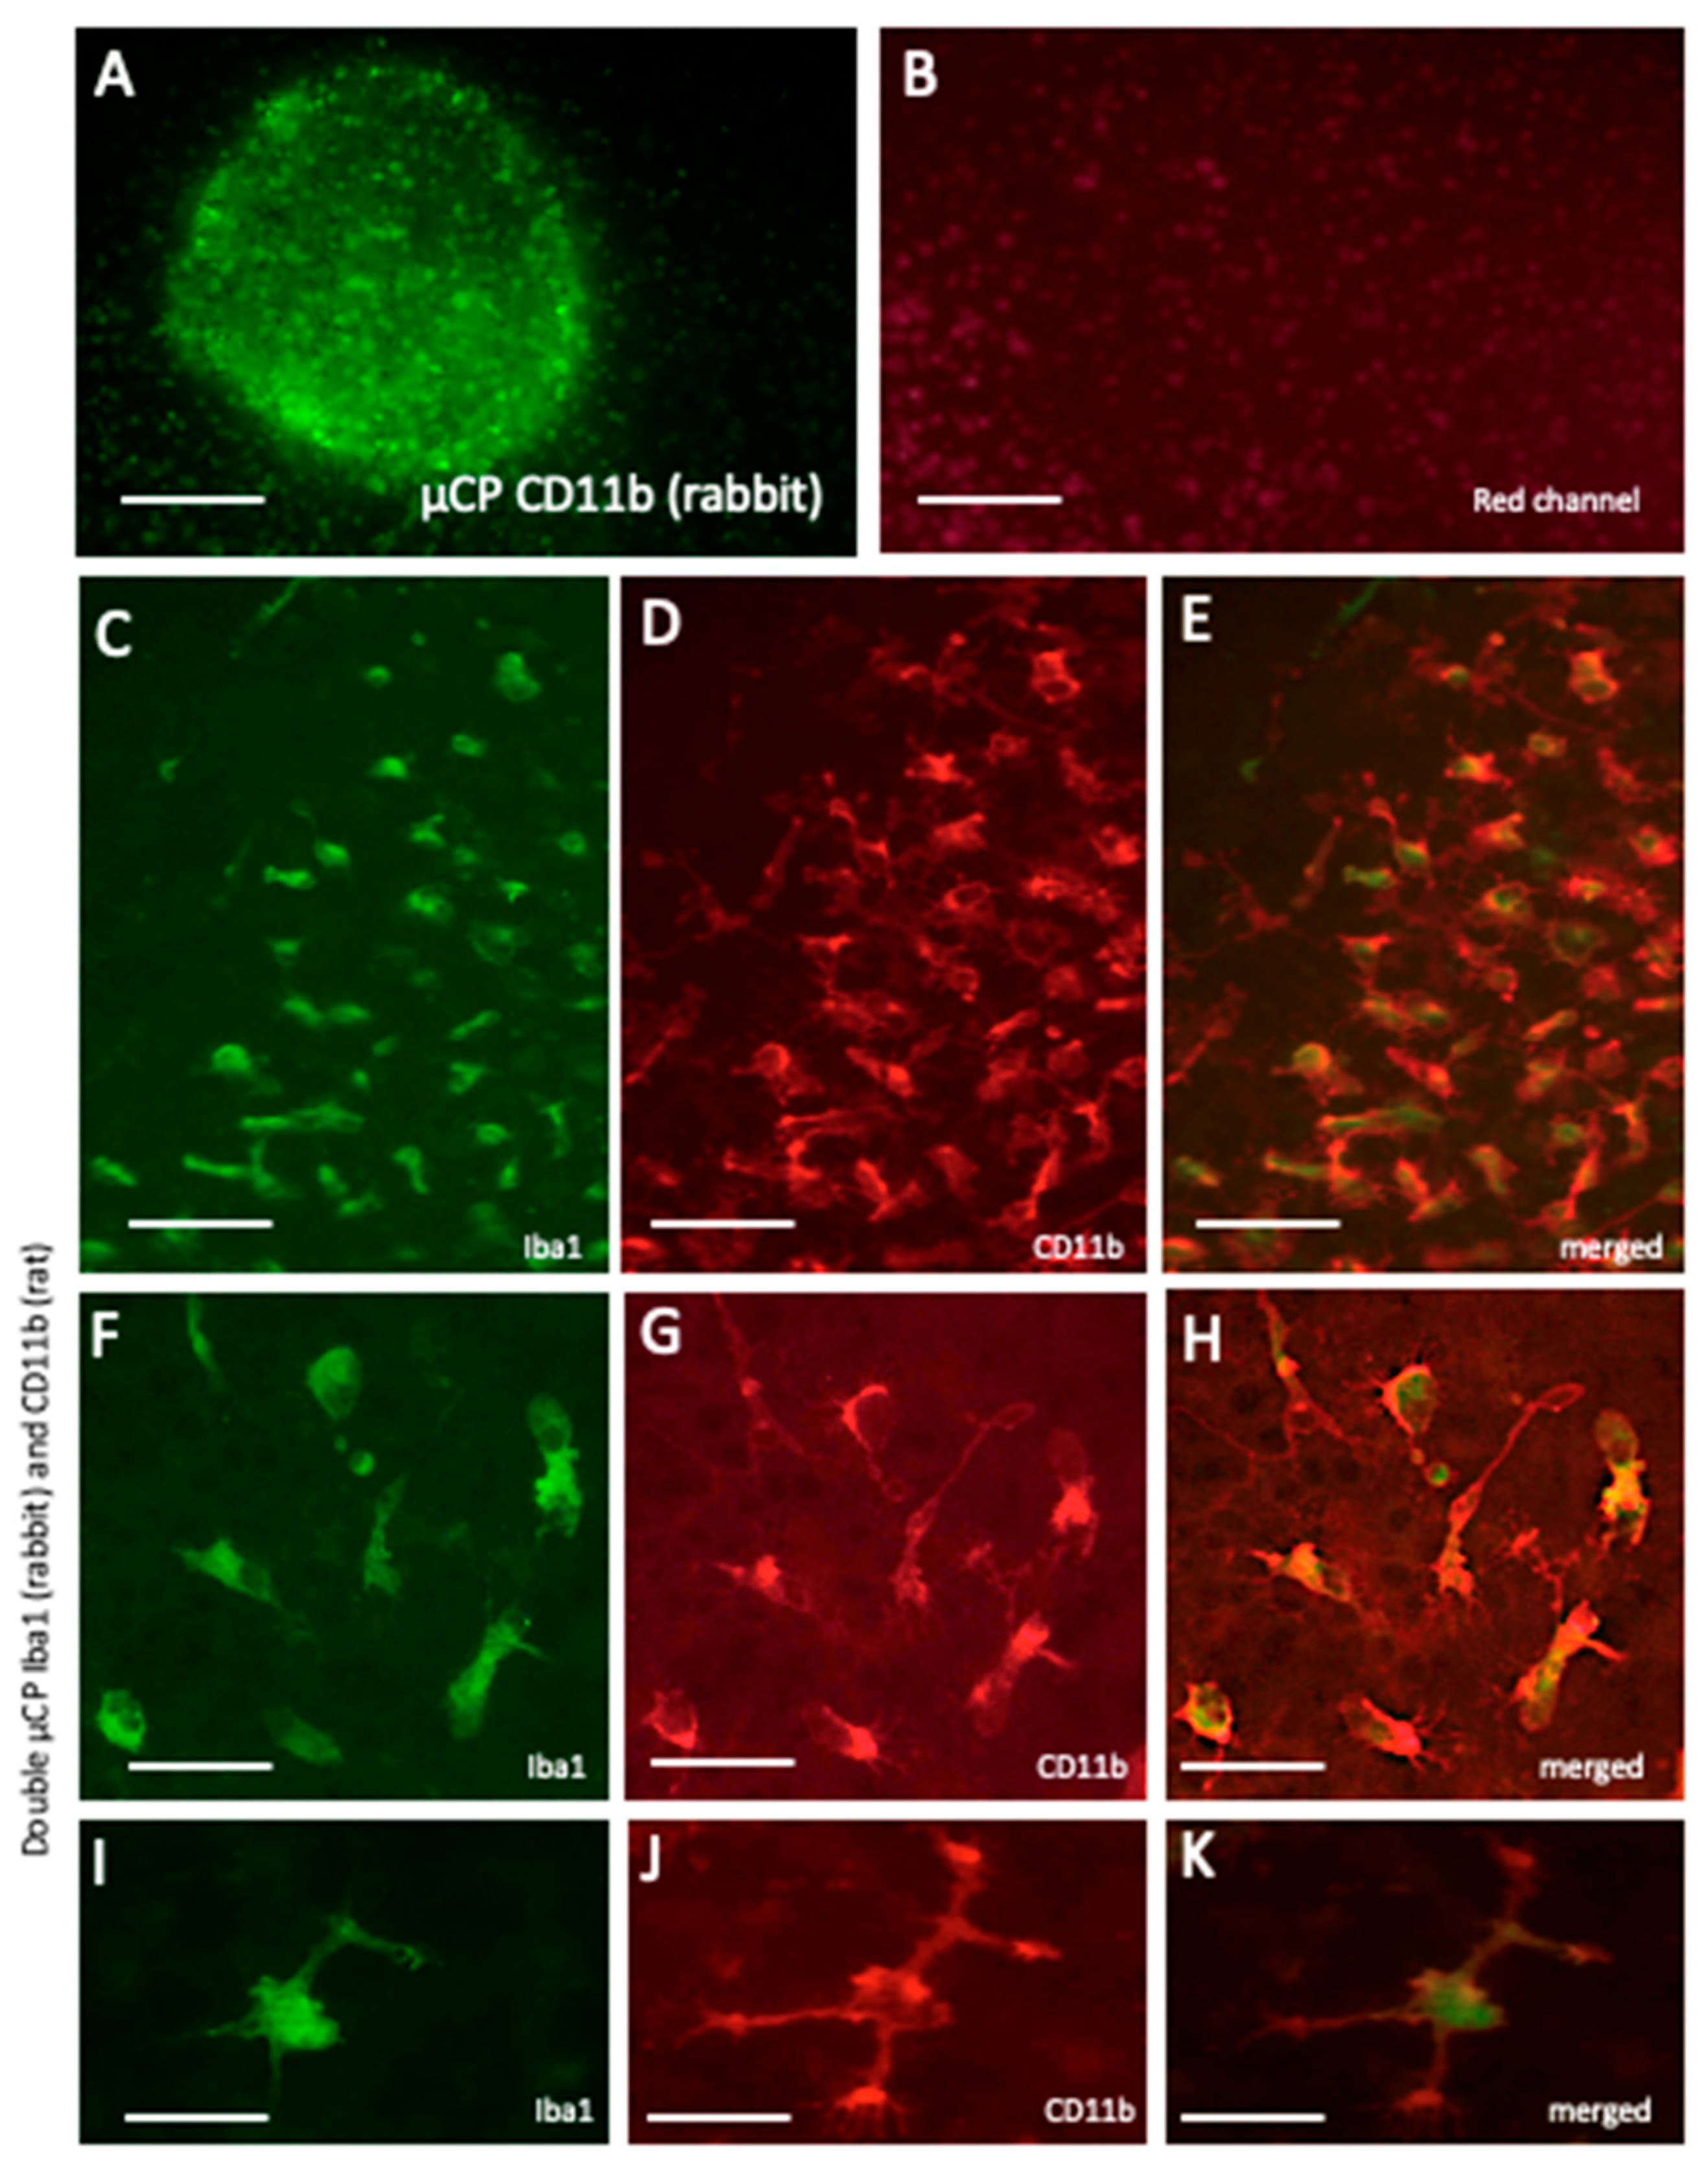
Figure 7.
Live-cell imaging of Iba1+ microglia. Brain slices were cultured in a chamber connected to the inverse fluorescence microscope at 37 °C and 5% CO2 (A-C). The membrane with the slices is placed in a 6-well plate with the slice facing down and visualized under fluorescence light (arrow in C). Panels D-J point to 2 Iba1+ microglia (white arrows in D, G, and J), which show morphological changes after 6 hours (J). One cell between these two microglia disappeared after 1 hour (E-G). Panels K-Q point to 2 Iba1+ microglia (red circle in L) that disappeared within 2 hours, and one cell (red arrow in L, M and Q) undergoes a morphological transformation within 7 hours (red arrow in Q). Note that differentiation (a morphology transformation with at least 1 process) was not seen in such a short time period (7 hr). Scale bar = 45 µm (D-Q). Note that the scale bar in Panel D is the same for all other panels (E-Q).
Disclaimer/Publisher’s Note: The statements, opinions and data contained in all publications are solely those of the individual author(s) and contributor(s) and not of MDPI and/or the editor(s). MDPI and/or the editor(s) disclaim responsibility for any injury to people or property resulting from any ideas, methods, instructions or products referred to in the content. |
© 2026 by the authors. Licensee MDPI, Basel, Switzerland. This article is an open access article distributed under the terms and conditions of the Creative Commons Attribution (CC BY) license (http://creativecommons.org/licenses/by/4.0/).
Copyright: This open access article is published under a Creative Commons CC BY 4.0 license, which permit the free download, distribution, and reuse, provided that the author and preprint are cited in any reuse.


