Submitted:
20 February 2026
Posted:
25 February 2026
You are already at the latest version
Abstract
Background/Objectives: Essential oils (EOs) have multi-target antifungal activity, but their translation is limited by volatility and poor aqueous dispersibility. Randomly methylated β-cyclodextrin inclusion (RAMEB) may enhance effective exposure and thereby alter susceptibility, stress responses, and biofilm outcomes in a species-dependent manner. This study quantified species-specific planktonic and biofilm susceptibility to four EOs and their RAMEB complexes across clinically relevant Candida species.
Methods: Lavender (L), lemon balm (B), peppermint (P), and thyme (T) oils and their RAMEB complexes (RL, RB, RP, RT) were tested against C. albicans, and non-albicans Candida. Susceptibility thresholds were used to derive phase plasticity metrics. Functional inhibition was assessed via planktonic metabolism/viability and established-biofilm metabolism/viability/biomass. Mechanistic signatures were captured by ROS/RNS measurements and qPCR of antioxidant genes (CAT1, GPX1, SOD1). Mixed-effects models and multivariate/unsupervised and interpretable classification approaches (k-means, PCA, CRT) were used to integrate endpoints and stratify response phenotypes.
Results: Susceptibility thresholds were strongly species-structured (lowest MIC90/EC10 for C. albicans; higher thresholds and broader sublethal windows in non-albicans species). RAMEB complexation produced formulation-dependent shifts in efficacy, with RT emerging as the most consistent broad-spectrum inhibitory condition across compartments. Biofilm biomass was comparatively insensitive even when viability was suppressed, indicating decoupling of structural biomass from biocidal activity. Mechanistic signatures were broadly conserved across species and linked to antioxidant-program engagement, with CAT1-related rules contributing to responder/tolerant classification.
Conclusions: Integrating MIC/EC plasticity with functional and mechanistic markers supports rational selection of EO formulations; RAMEB complexation particularly RT prioritizes candidates for further pharmaceutical optimization while highlighting species-specific vulnerabilities.
Keywords:
Candida biofilm
; essential oils
; randomly methylated beta-cyclodextrin
; oxidative stress
; treatment efficacy ranking
; sublethal concentration
; antifungal susceptibility
1. Introduction
Infections caused by Candida spp. remain a major clinical burden across mucosal disease and invasive candidiasis, while therapeutic management is increasingly complicated by interspecies variability in antifungal susceptibility, stress tolerance, and biofilm formation [1,2,3,4]. Although Candida albicans (Ca) remains the most frequently isolated species, non-albicans Candida (NAC) such as Candida dubliniensis (Cd), Candida krusei (Ck), and Candida tropicalis (Ct) are prominent in many settings and can exhibit reduced susceptibility or distinct tolerance-associated phenotypes [4,5,6]. These biological differences have direct implications for antifungal development and therapeutic selection because they shape concentration–effect relationships, increase the likelihood of persistence under marginal exposure, and facilitate transitions into biofilm-associated states that are intrinsically less responsive to treatment [7,8,9].
Essential oils (EOs) and EO-derived constituents are intensively investigated as antifungal candidates due to their multi-target activity, including perturbation of fungal membrane organization, disruption of metabolic processes, interference with signaling, and induction of oxidative/nitrosative stress responses [10,11]. Among commonly studied botanical sources, thyme oil is frequently associated with strong antifungal activity linked to phenolic monoterpenes (e.g., thymol/carvacrol) and membrane-active mechanisms, while peppermint, lavender, and lemon balm oils have also been reported to inhibit Candida growth and biofilm-related phenotypes, albeit with more variable potency and composition-dependent effects [12,13,14,15]. However, translation of EO bioactivity into pharmaceutically standardized products is limited by formulation challenges such as low aqueous solubility, volatility, chemical instability, and batch-to-batch variability in chemical profiles, which together can produce inconsistent effective exposure at the microorganism–medium interface and complicate comparisons across species, strains, and treatment conditions [10,16]. Consequently, pharmaceutics-enabling technologies that improve solubilization and stabilize EO constituents are essential to evaluate antifungal potential in a reproducible manner and to enable rational selection of candidates for further development [17,18].
Cyclodextrin inclusion complexation is a widely used strategy to increase apparent solubility, improve dispersion, and stabilize hydrophobic compounds in aqueous systems [17,18,19]. Randomly methylated β-cyclodextrin (RAMEB) has high complexation capacity for lipophilic molecules and is frequently used to enhance dissolution and delivery in water-based environments [17]. In the context of EO-based antifungal development, RAMEB complexation could increase the effective exposure of volatile and poorly soluble EO constituents and thereby enhance antifungal activity [16,20,21,22]. At the same time, changes in exposure kinetics and stress intensity may also alter cellular response programs. Sublethal stress can activate antioxidant defenses and other protective pathways that may contribute to tolerance-like behavior and persistence under treatment [8,9]. Therefore, it is not sufficient to compare uncomplexed EOs and RAMEB-EO (REO) formulations using a single inhibition endpoint; efficacy should be evaluated together with mechanistic signatures indicating whether exposures yield durable inhibitory phenotypes or preferentially engage stress-adaptation programs [5,9].
A further translational consideration is that antifungal responses are frequently non-linear across concentration ranges, and inhibitory effects can differ markedly from sub-inhibitory responses that still reshape physiology and survival [8,9]. This can be captured by jointly considering inhibitory thresholds (e.g., minimum inhibitory concentration-based metrics) and lower-effect thresholds (e.g., EC10). The separation between these thresholds provides a quantitative descriptor of dose-response “phase plasticity”, reflecting how readily a population shifts between strongly inhibited and partially surviving states across the concentration-effect curve. Various species or treatments with larger minimum inhibitory concentration-effective concentration (MIC-EC) separations may be more prone to persistence under marginal exposure-an issue that is particularly relevant for complex mixtures such as EOs and for formulated systems where dispersion and release kinetics may vary over time [8,20].
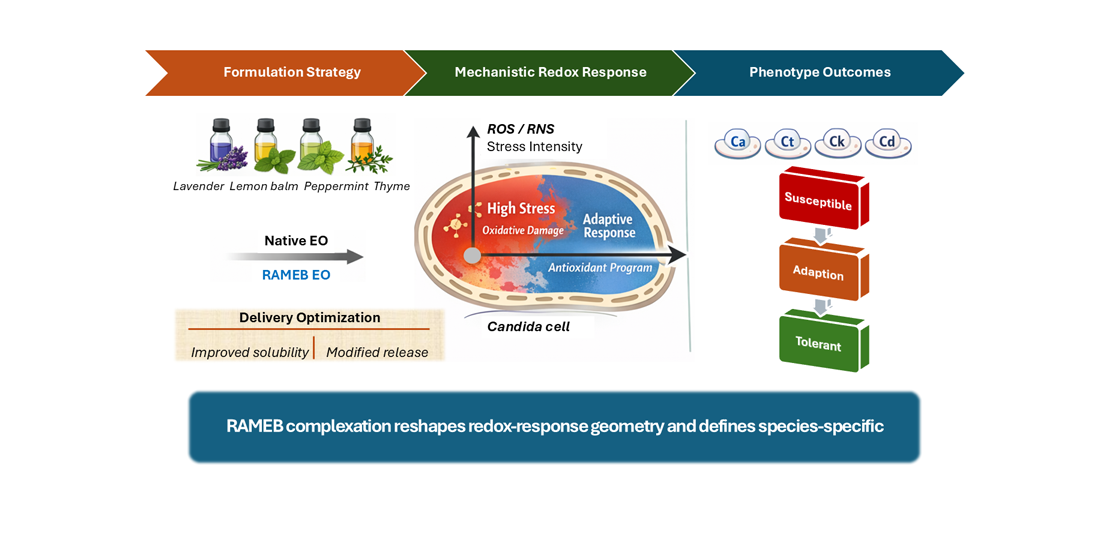
In this study, four essential oils, lavender (L), lemon balm (B), peppermint (P), and thyme (T) and their corresponding RAMEB-complexed formulations (RL, RB, RP, RT) against four clinically relevant Candida species (Ca, Cd, Ck, and Ct) have been investigated. The susceptibility thresholds like minimum inhibitory concentration (MIC90) and effective concentration (EC10) were integrated, and derived phase plasticity metrics were combined with survival and functional inhibition endpoints under planktonic conditions (metabolic activity and viability) and during premature biofilm formation (biomass, metabolism, and viability), together with mechanistic readouts of oxidative/nitrosative stress (ROS/RNS) and antioxidant gene programs (CAT1, GPX1, SOD1) [23,24]. To connect these layers and identify coherent response patterns, multivariate and unsupervised analyses were applied (e.g., clustering and principal component analysis) together with interpretable classification approaches (e.g., decision trees) to define treatment signatures, stratify phenotypes consistent with susceptibility versus tolerance-like behavior, and detect patterns consistent with adaptive stress engagement [25,26].
This work is structured around three testable hypotheses relevant to pharmaceutics-guided antifungal development. First, RAMEB complexation modifies EO exposure and can enhance antifungal efficacy for specific oils, but the magnitude and direction of this effect will be species-dependent and not all RAMEB–EO formulations will outperform their uncomplexed counterparts [16,20]. Second, Candida species differ in susceptibility thresholds and phase plasticity, and these baseline differences contribute to species-enriched tolerance-like response patterns under specific EO or RAMEB–EO exposures [4,5,6,8,24]. Third, combined stress markers (ROS/RNS) and antioxidant gene responses (CAT1, GPX1, SOD1) define mechanistic exposure signatures that can predict inhibitory phenotype classes, distinguishing strong inhibition from weak inhibition/tolerance-like behavior and from response patterns consistent with stress adaptation [8,24,27,28]. Accordingly, our objectives were to quantify species-level susceptibility and phase plasticity, determine treatment and treatment × species effects on planktonic and premature biofilm endpoints, stratify treatments into mechanistic signature classes using multivariate analyses, integrate endpoints into treatment rankings relevant to formulation selection, and identify EO candidates that warrant further pharmaceutical optimization versus those that require caution due to limited efficacy or signatures consistent with stress-adaptation programs [16,17,29,30].
2. Materials and Methods
2.1. Materials
All reagents and consumables used in this study were of analytical or spectroscopic grade unless otherwise specified. Sterile 96-well microtiter plates were employed for antifungal susceptibility testing, metabolic assays, and live/dead staining (SPL Life Sciences, Gyeonggi-do, Korea), while biofilm-related experiments were carried out in specialized flat-bottom plates (Sarstedt AG & Co. KG, Nümbrecht, Germany). Acetic acid, adenine, agar-agar, crystal violet (CV), dextrose, peptone, potassium phosphate monobasic, and yeast extract were all obtained from Reanal Labor (Budapest, Hungary).
Amphotericin B (AM), dimethyl sulfoxide (DMSO), fluconazole (FL), menadione (MN), potassium chloride, propidium iodide (PI), resazurin sodium salt, RPMI 1640 medium, sodium chloride, sodium phosphate dibasic, SYBR Green I nucleic acid gel stain and 3-Morpholinopropane sulfonic acid were all obtained from Merck Kft. (Budapest, Hungary). Intracellular ribonucleic acid (RNA) was purified using the Macherey–Nagel NucleoSpin RNA kit (AKTIVIT Kft., Budapest, Hungary). Nuclease-free molecular-grade water and the High-Capacity cDNA reverse transcription kit (Applied Biosystems; ref. 4368814) were obtained from ThermoFisher Scientific (Budapest, Hungary). Quantitative PCR was performed using BioSyGreen Mix Hi-ROX (2×) (PCR Biosystems, London, UK). All the oligonucleotides were purchased from IDT (Coralville, Iowa, USA).
All the essential oils (EO) namely lavender (L), lemon balm (B), peppermint (P), and thyme (T) essential oils, together with their randomly methylated β-cyclodextrin (RAMEB) inclusion complexes lavender-RAMEB (RL), lemon balm-RAMEB (RB), peppermint-RAMEB (RP), and thyme-RAMEB (RT) were purchased from CycloLab Cyclodextrin Research and Development Laboratory, Ltd. (Budapest, Hungary). Sterile 0.22 µm vacuum filtration units (Merck kft, Budapest, Hungary) were used for sterilization procedures. Ultrapure water with conductivity <1.0 µS was utilized throughout all experimental workflows. Detailed information on the suppliers of the consumables can be found in supplementary section (Table S1).
2.2. Instruments Used in the Experiments
All experimental procedures were performed using standard laboratory instrumentation. Centrifugation was carried out using a Hettich Rotina 420R benchtop centrifuge (Auro-Science Consulting Kft., Budapest, Hungary). Incubations were conducted using a Sanyo microbiological incubator shaker and a Thermo Scientific Heraeus B12 microbiological incubator (Auro-Science Consulting Kft., Budapest, Hungary). Optical measurements were acquired using a PerkinElmer EnSpire multimode plate reader, a Thermo Fisher Scientific NanoDrop 2000 spectrophotometer, and a Thermo MultiSkan MCC Type 355 plate reader (Auro-Science Consulting Ltd., Budapest, Hungary). Molecular biology–based assays were performed using an Applied Biosystems Veriti 9902 96-well thermal cycler and an Applied Biosystems StepOnePlus Real-Time PCR system (Auro-Science Consulting Ltd., Budapest, Hungary) throughout the study.
2.3. Candida albicans and Non-Albicans Candida Strains Selected for Experimental Evaluation
The Candida strains used in this study were obtained from the Szeged Microbiology Collection (SZMC, University of Szeged, Hungary) and were maintained at the Department of General and Environmental Microbiology, Institute of Biology, University of Pécs. The panel included Candida albicans (Ca) SZMC 1372, 1423, 1426 (Ca1372, Ca1423 and Ca1424), Candida dubliniensis (Cd) SZMC 1470, 1471 (Cd1470 and Cd1471), Candida krusei SZMC 779, 1447 (Ck779 and Ck1447) and Candida tropicalis (Ct) SZMC 1368, 1432 (Ct1368 and Ct1432). These isolates were employed for determining the minimum inhibitory concentration (MIC₉₀), the minimum effective concentration (EC₁₀), oxidative stress, and for assessing the inhibition of biofilm eradication by the test compounds.
All strains were cultured on standard yeast extract-peptone-dextrose (YPD) agar composed of 1% (w/v) peptone, 0.5% (w/v) yeast extract, 2% (w/v) dextrose, and 1.5% (w/v) agar in distilled water. Detailed information on the suppliers of the consumables can be found in supplementary section (Table S1).
2.4. Antimicrobial Susceptibility Testing
The minimum inhibitory concentration (MIC₉₀) determination was carried out using a modified broth microdilution method based on a previously established protocol [31,32]. The EO-RAMEB complexes and the corresponding EOs were prepared in a log2 dilution format to yield a final concentration range of 0.03-62.5 µg/mL. The encapsulated EO concentrations were determined based on the pre-calculated average molecular weight and %encapsulation efficiency published previously [33].
For each assay, 100 µL of overnight cultured standardized fungal inoculum (~2-5 x 10³ cells/mL) prepared in modified RPMI 1640 medium was dispensed into sterile 96-well microtiter plates. An equal volume of each test sample (TS) / antifungal reference controls (RC) in a squared dilution format was then added.
The AM and FL served as RC and were tested across 0.0001-3.125 µg/mL and 0.058-30 µg/mL final concentrations respectively. Wells containing inoculated medium without test compounds served as growth controls (GC), whereas uninoculated medium functioned as the sterility control (SC). The DMSO-only with a final solvent concentration to 1% served as the dilution control (DC) throughout the experiments.
The plates were incubated for 48 h at 30 °C, after which fungal growth was assessed spectrophotometrically (Thermo MultiSkan MCC Type 355 plate reader) by measuring optical density at 595 nm. The optical density values were normalized to the untreated growth control (set to 100%). The minimum inhibitory concentration (MIC₉₀) values defined as the concentration resulting in ≥90% growth inhibition was calculated by fitting the data to a non-linear dose response model. Each experiment consisted of three technical replicates and was repeated across six independent biological replicates.
2.5. Quantification of Minimum Effective Concentration (EC₁₀) Using a Survival-Response Assay
The EC₁₀ was determined using an adapted survival-based microdilution method derived from previously established protocols [34,35]. Mid-log-phase Candida cultures (approximately 2-5 × 10⁵ cells/mL), grown overnight under shaking conditions, were harvested, washed with sterile PBS (pH 7.43), and pelleted by centrifugation at 1000 × g for 5 min. Cells were then resuspended in YPD medium and standardized to approximately 2.5 × 10⁷ cells/mL.
Standardized cultures were exposed to a wide concentration range of EO-RAMEB and EO component-RAMEB complexes (final concentration per well: 0.03-62.5 µg/mL). The AM and FL were included as antifungal reference controls (RC) and tested at final concentrations of 0.0001-3.125 µg/mL and 0.058-30 µg/mL, respectively. Exposure to TS and RC was limited to a maximum duration of 60 min, with sampling performed at 0, 0.25, 0.5, and 1 h.
Post-treatment, samples underwent two-step serial dilutions to reach a cumulative dilution factor of 1950. Subsequently, 50 µL aliquots were spread onto YPD agar and incubated at 30 °C for 24 h, after which colony-forming units (CFU/mL) were quantified. The CFU counts were normalized to untreated cultures, which were defined as 100% survival. A nonlinear dose-response model was applied to calculate the EC₁₀, defined as the concentration resulting in 90% survival after 1 h of exposure.
Uninoculated media and aliquoted YPD agar plates served as sterility controls (SC) and growth controls (GC), respectively. All experiments were conducted with three technical replicates and repeated in six independent biological experiments. Kinetic time-course data were summarized as area under the curve (AUC) values to enable multivariable comparisons with endpoint measurements. The resulting AUC-derived metrics were subsequently Z-transformed (within species/strain, as applicable) to harmonize scaling across endpoints for integrated analyses.
2.6. Acute Exposure Based RNS and ROS Generation
Reactive nitrogen species (RNS) and reactive oxygen species (ROS) production were assessed using previously published protocols [34,35,36] with minor modifications. Briefly, mid-log-phase Candida cultures (approximately 2-5 × 10⁷ cells/mL) were exposed to TS at their respective EC₁₀ concentrations (see supplementary Table S4) or to 0.5 mM menadione (MN) as an oxidative stress positive control (OC) for 1 h at 30 °C in modified RPMI 1640 medium. Following centrifugation and resuspension in PBS, cells were incubated with 10 µM dihydrorhodamine 123 (DHR 123) for RNS detection or 15 µM dihydroethidium (DHE) for ROS detection for an additional 1 h at 30 °C in the dark.
Fluorescence was measured using a PerkinElmer EnSpire multimode microplate reader at excitation/emission wavelengths of 495/530 nm for rhodamine generation and 520/600 nm for 2-hydroxyethidium generation. Oxidative stress levels were expressed as the percentage increase relative to untreated controls (UC). The AM and FC at their respective EC₁₀ concentrations were included as antifungal reference controls (RC) throughout the experiments. All assays were performed in triplicate and repeated across six independent experiments.
2.7. Molecular Expression of the Oxidative Genes
The Candida planktonic cells were harvested and treated according to the protocols described in Section 2.5 and Section 2.6. To prepare for quantitative polymerase chain reaction (qPCR) analysis of gene expression, total RNA was extracted and purified from approximately 50 mg (wet weight) of the collected biofilm samples. Before RNA extraction, samples were pelleted by centrifugation at 500 × g for 5 mins in sterile microcentrifuge tubes. The RNA extraction and purification process was rigorously followed according to the manufacturer’s guidelines for the NucleoSpin RNA purification kit. The quality of the isolated RNA was subsequently verified by measuring the absorbance ratio at 260/280 nm using a Thermo Fisher Scientific NanoDrop 2000 spectrophotometer.
The quantitative polymerase chain reaction (qPCR) was performed using oligonucleotide primers specifically designed for the Candida species genes CAT1, GPX1, and SOD1 (serving as target genes), alongside RDN18 (employed as the reference gene). Primer design was carried out using NCBI Nucleotide BLAST, employing Candida albicans reference sequences as models to identify homologous regions in Candida tropicalis, Candida dubliniensis, and Candida krusei. Searches were performed using MEGABLAST or BLASTn, depending on sequence availability. Retrieved sequences were aligned in MEGA v7 to identify conserved regions, and primers were designed using Primer-BLAST and Primer3Plus [37,38,39]. Primer quality was evaluated in silico, and de-generate primers were manually designed when sequence data were limited. Accession IDs of all models and retrieved sequences, together with final primer sequences, are provided in supplementary Table S2.
For quantitative gene expression analysis, total RNA was reverse transcribed into complementary DNA (cDNA) utilizing the High-Capacity cDNA Reverse Transcription kit. A minimum of 2 µg of purified total RNA served as the template for each reaction. The 2X reverse transcription master mix, comprising RT buffer, dNTP mix, MultiScribe reverse transcriptase, and nuclease-free molecular-grade water, was prepared on ice following the manufacturer’s specified proportions. Each 20 µL reverse transcription reaction was meticulously assembled by combining 10 µL of the pre-prepared 2X master mix with 10 µL of the RNA sample, followed by thorough but gentle mixing. Reactions were maintained on ice until loaded into the thermal cycler. The cDNA synthesis was conducted in an Applied Biosystems Verti 9902, 96-well thermal cycler with the following cycling parameters: an initial incubation at 25 °C for 10 minutes, followed by reverse transcription at 37 °C for 2 hr, and a final enzyme inactivation step at 85 °C for 5 min. The newly synthesized cDNA was then stored at temperatures between -15 °C and -25 °C to ensure its integrity for further downstream applications [40,41,42,43].
The quantitative PCR (qPCR) was executed in 10 µL reactions on a StepOne PCR machine utilizing BioSyGreen Mix Hi-Rox (2X). Each reaction mixture contained 5 µL of BioSyGreen Mix Hi-Rox (2X), 0.8 µL of combined forward and reverse primers (400 nM final concentration for each), 0.5 µL of cDNA template, and 3.7 µL of nuclease-free water. Reaction assembly involved first combining the master mix components (BioSyGreen Mix, primers, and water), followed by the addition of the cDNA template that were synthesized from the treated and untreated planktonic, ensuring thorough homogenization before thermal cycling. Relative gene expression was quantified using the comparative Ct (ΔΔCt) method. Expression levels were reported as fold changes and normalized to RDN18, which served as the endogenous housekeeping control. All experiments were performed in triplicates and repeated in six independent experiments [37,38].
2.8. Impact of Test Agents on Planktonic Cells and Established Biofilms
The prolonged antifungal (killing) activity of TS, RC, and OC against planktonic Candida and non-albicans Candida species was evaluated under time-dependent treatment conditions. Mid-logarithmic-phase planktonic Candida cultures were standardized to approximately 2-5 × 10⁷ cells/mL and exposed to TS, RC, and OC at their respective EC₁₀ concentrations (see supplementary Table S4). Treated suspensions were incubated at 30 °C for up to 16 h, with samples collected at 0, 2, 4, 8, and 16 h to monitor time-dependent changes in viability and cellular metabolic activity, as described previously (Section 2.5 and Section 2.6).
The effects of treatments on established biofilms were assessed using a modified version of previously published protocols [34,35]. Briefly, 200 mid-log-phase Candida cultures (approximately 2-3 × 10⁵ cells/mL) prepared in modified RPMI 1640 medium were dispensed into sterile 96-well plates and incubated for 24 h at 35 °C to allow biofilm formation. Following biofilm establishment, non-adherent cells were removed by gentle washing with sterile PBS (pH 7.43). Wells were then replenished with 200 µL of fresh modified RPMI medium containing the TS, RC, and OC; see supplementary Table S4) at their respective EC₁₀ concentrations (µg/mL) and incubated for an additional 24 h at 30 °C.
Throughout the assay, modified RPMI medium served as the background/negative control (BC), untreated inoculated wells served as the untreated biofilm control (UBC), AM, FL-, and MN-treated wells were included as RC and OC at their respective EC₁₀ concentrations, and 1% DMSO was used as the dilution control (DC). For the planktonic, kinetic time-course data were reduced to area under the curve (AUC) values to facilitate multivariable comparisons with single-timepoint endpoint measurements. The resulting AUC-derived metrics were then Z-transformed within species/strain, as appropriate, to harmonize scaling across endpoints for integrated analyses. All experiments were performed in triplicates across six independent experiments.
2.8.1. Metabolic Activity and Viability of Planktonic Candida and Non-Albicans Candida
Following treatment and sampling as described in Section 2.5 and Section 2.6 (planktonic cultures) and Section 2.8 (biofilms), samples were processed for metabolic activity and viability analyses. Planktonic cells were centrifuged at 1000 × g for 5 min, washed twice with PBS (pH 7.43), and centrifuged again, whereas biofilm biomass was washed twice with PBS directly in the wells after treatment and sampling (Section 2.8).
Metabolic activity was assessed using previously published resazurin-based assay [34,35]. Briefly, 200 µL of resazurin was added to each sample to obtain a final concentration of 12.5 µM, followed by incubation for 40 min at 30 °C in the dark. Fluorescence was measured at excitation/emission wavelengths of 560/590 nm using a fluorescent multimode microplate reader. Metabolic activity was expressed as a percentage by normalizing fluorescence values to the untreated control (UC) at the corresponding sampling points (Section 2.5 and Section 2.6 and Section 2.8), with the UC defined as 100% metabolic activity. The PBS alone and PBS containing resazurin served as background (BC) and background noise controls (NC), respectively.
In parallel, time-dependent cell viability of both planktonic and biofilm-associated Candida populations was evaluated using an optimized SYBR Green I/propidium iodide (PI) dual-staining assay [33,35]. Samples obtained according to Section 2.5 and Section 2.6 and Section 2.8 were centrifuged (planktonic cells) or washed in situ (biofilms), resuspended in PBS, and stained with a freshly prepared dye mixture containing SYBR Green I (20 µL of a 10,000× stock diluted 1:100 in PBS) and PI (4 µL of a 20 mM DMSO stock diluted 1:500 in PBS). One hundred microliters of staining solution were added per well, followed by incubation for 15 min at room temperature in the dark with gentle agitation. Fluorescence was recorded at 490/525 nm for SYBR Green I and 530/620 nm for PI. Green-to-red fluorescence ratios were used to estimate the proportion of non-viable cells and were normalized to untreated control (UC), PBS served as the blank control (BC) while SYBR Green I/PI mix was considered as noise control (NC). All experiments were performed in triplicates in six independent experiments.
2.8.2. Quantification of Total Biofilm Associated Fungal Biomass
Biofilm biomass was quantified using a crystal violet (CV) staining assay adapted from previously published methods [36]. Following treatment of established biofilms (Section 2.8), the supernatant was removed and wells were gently rinsed twice with PBS (pH 7.43). Adherent biofilms were then fixed with 2% (v/v) formalin prepared in PBS and stained with 0.13% (w/v) CV for 20 min at room temperature. Excess stain was discarded, and wells were washed twice with PBS to remove unbound dye.
To solubilize the retained CV, 1% (w/v) sodium dodecyl sulfate (SDS) prepared in ethanol was added to each well and incubated overnight. Absorbance was measured at 600 nm using a Multiskan EX microplate reader. Biofilm biomass was expressed as a percentage by normalizing absorbance values to the untreated biofilm control (UBC), which was defined as 100% biofilm biomass. CV-only microtiter wells served as background noise controls (NC). All assays were performed in triplicate and repeated across six independent experiments.
2.9. Statistical Analyses
All analyses and data visualization were performed in IBM SPSS Statistics (version 29.0.2.0 (20), IBM LCC, Budapest, Hungary) and OriginPro 2018 (Version 95E, OriginLab Corp., Northampton, USA), respectively. Unless otherwise stated, quantitative outcomes were analyzed on standardized values to enable cross-endpoints integration and to control baseline species-dependent scaling differences. Endpoints used for mechanistic profiling (ROS, RNS, CAT1, GPX1, SOD1) and for integrated efficacy modeling (planktonic and biofilm functional readouts) were standardized by Z-transformation within each species prior to analysis. This transformation expressed each observation as a deviation from the species-specific means in units of the species-specific standard deviation. Accordingly, the standardized values represent relative within-species shifts rather than absolute between-species differences, allowing integration of heterogeneous endpoints while controlling for baseline scaling differences across Candida species. The MIC90 and EC10 were retained on their original concentration scale and analyzed separately as primary susceptibility thresholds. These parameters reflect biologically interpretable concentration-response endpoints and were therefore not standardized. Statistical inference was conducted using two-sided tests with a predefined significance threshold of α = 0.01. When multiple pairwise comparisons were performed, p-values were adjusted using Bonferroni correction to control the family-wise error rate (FWER).
Species-level susceptibility was summarized for MIC90 and EC10 using robust descriptive statistics (median and interquartile range). Between-species differences in MIC90 and EC10 were tested using Kruskal-Wallis tests due to non-normal distributions and heteroscedasticity typical of dilution-based susceptibility measures. To quantify phase plasticity, two derived metrics were computed from the raw thresholds: phase shift (EC10-MIC90) and phase distance (EC10/MIC90; log-transformed where appropriate). These derived plasticity metrics were summarized by species and compared across species using Kruskal-Wallis tests with post hoc pairwise comparisons when indicated.
Treatment effects on functional endpoints (growth/survival, oxidative/nitrosative stress markers, planktonic metabolism and viability, and premature biofilm outcomes) were tested using linear mixed-effects models fitted by restricted maximum likelihood (REML). Models used Satterthwaite approximations for denominator degrees of freedom. Fixed effects included treatment, species, and their interaction to quantify species dependence of treatment efficacy. Estimated marginal means (EMMeans) with 95% confidence intervals were extracted for treatment and species effects; treatment comparisons were conducted using Bonferroni-adjusted pairwise tests. For sections focused on ranking experimental candidates, analyses were repeated on the experimental panel only (excluding reference controls with distinct concentration regimes), whereas mechanistic profiling and mode-of-action analyses included controls to anchor mechanistic space.
To generate an integrated treatment ranking across endpoints, inhibition-coded versions of key efficacy outcomes were created where needed (sign direction aligned such that larger negative shifts on the Z scale corresponded to stronger inhibitory effects). Endpoint-level inhibition measures were then combined into a composite efficacy score. The composite score was analyzed using linear mixed-effects models with treatment, species, and their interaction. Treatment ranking was based on EMMs of the composite score with Bonferroni-adjusted comparisons; additional paired contrasts were used to compare each essential oil (EO) with its corresponding RAMEB-complexed formulation (EO vs RAMEB-EO) to quantify formulation-dependent shifts.
To classify exposure phenotypes unsupervised clustering was performed on species-wise averaged, standardized multivariate response profile that characterizes how a specific Candida species biologically responds to a specific EO or RAMEB–EO treatment (aggregated exposure signatures). Raw replicate-level data were first aggregated to strain × treatment signatures (means) to avoid overweighting repeated measures in clustering and classification. Inhibition-coded endpoint signatures were then subjected to k-means clustering (k = 3), yielding response classes interpreted as (i) susceptible/strong inhibition, (ii) hormetic/adaptive (mixed or stimulatory patterns), and (iii) tolerant/resistant (weak inhibition). Cluster validity was assessed by inspection of cluster centers and by separation in the clustering output. Species enrichment of response classes was evaluated using Pearson χ² tests on contingency tables (response class by species). For mechanistic stress-response stratification, k-means clustering was also applied to treatment × species mean signatures across ROS/RNS and antioxidant genes to define mechanistic exposure classes; cluster membership distributions were tested across treatments and species using χ² tests.
To identify mechanistic predictors of inhibitory phenotypes, response classes collapsed into a binary outcome (responder versus tolerant/resistant) when needed to improve model stability. Binary logistic regression models were fitted with mechanistic markers (RNS, ROS, CAT1, GPX1, SOD1) as predictors, with optional adjustment for species and treatment where specified. Model fit was evaluated using standard goodness-of-fit outputs, and effects were reported as odds ratios with 95% confidence intervals. In addition, decision-tree classification (Classification and Regression Tree; CRT) was used as an interpretable ML-style approach to derive rule-based predictors of responder group from mechanistic variables. Ten-fold cross-validation was applied to estimate generalization error, and terminal node membership was subsequently cross-tabulated against treatment to identify treatments enriched for responder or tolerant/resistant-associated mechanistic rules.
Finally, to visualize global mode of action structure, principal component analysis (PCA) was performed on treatment × species mechanistic signatures (means) across ROS, RNS, CAT1, GPX1, and SOD1. Sampling adequacy was evaluated using the Kaiser-Meyer-Olkin measure and Bartlett’s test of sphericity. Components were extracted using principal components with Varimax rotation, and two-component solutions were retained for visualization based on eigenvalues and explained variance. Rotated loadings were used to interpret mechanistic axes, and rotated component scores (PC1/PC2) were used to generate a treatment landscape plot; treatment centroids across species were computed as mean PC scores to summarize formulation-level positioning in mechanistic space. For visualization clarity, plots were generated both with and without the oxidative-stress control anchor where appropriate.
3. Results
3.1. Species-Level Susceptibility, Phase Plasticity, and Survival Effects
To define baseline interspecies susceptibility architecture, we quantified growth-inhibitory (MIC90) and sub-inhibitory (EC10) concentration thresholds for native essential oils and their corresponding RAMEB inclusion complexes across C. albicans, C. tropicalis, C. krusei, and C. dubliniensis. The MIC90 values reflect near-complete inhibition following prolonged exposure of early-phase cells, whereas EC10 values capture early functional suppression under short-term exposure in mid-log phase populations. These parameters therefore interrogate distinct physiological states and exposure kinetics. Comparative evaluation across species enables discrimination between formulation-dependent potency shifts and intrinsic taxon-specific resistance characteristics. The distributional structure of MIC90 and EC10 values is summarized in Figure 1 and supplementary Table S3-S4 (MIC90 and EC10 raw data, respectively).
To characterize species-dependent susceptibility patterns and quantify the separation between sublethal and inhibitory concentration ranges, raw MIC90 and EC10 values were compared across the four Candida species using nonparametric methods, as expected for concentration-response endpoints with non-normal distributions. Analyses were performed on the experimental essential oil/RAMEB treatment set (controls excluded), with N representing experimental repeat measurements contributing to each species distribution (total N = 162 repeats; C. albicans n = 54, C. tropicalis n = 36, C. krusei n = 36, C. dubliniensis n = 36)
Species differed significantly in MIC90, indicating that the growth-inhibitory threshold is strongly species-structured (Kruskal-Wallis H(3) = 193.329, p < .001). Mean MIC90 values (weighted average) were lowest for C. albicans (22.186 ± 1.005 µg/mL) and increased markedly for non-albicans species, including C. tropicalis (36.557 ± 1.273 µg/mL), C. krusei (36.371 ± 1.257 µg/mL), and most prominently C. dubliniensis (42.789 ± 1.003 µg/mL) for both EO and REO groups. Consistent with these medians, mean rank ordering placed C. dubliniensis highest and C. albicans lowest, supporting a shift toward reduced inhibitory susceptibility in the non-albicans species (p < .001).
The MIC90 values demonstrated clear species-specific structuring and varied significantly across the eight experimental treatments (L, B, P, T, RL, RB, RP, RT) (see Table S2 for strain vs treatment-wise comparisons). Treatment potency of RT (C. albicans: 2.785 ± 0.179 µg/mL), (C. krusei: 9.168 ± 0.88 µg/mL), (C. tropicalis: 9.902 ± 1.02 µg/mL), (C. dubliniensis: 16.44 ± 0.343 µg/mL) and RB (C. albicans: 5.812 ± 0.376 µg/mL), (C. tropicalis: 18.719 ± 1.811 µg/mL), (C. krusei: 19.25 ± 1.977 µg/mL), and (C. dubliniensis: 27.357 ± 0.571 µg/mL) emerged as the most potent inhibitory conditions across all taxa. The C. albicans exhibited the highest susceptibility in these groups (p < .001). Conversely, the highest inhibitory thresholds were observed in treatments L, P, and RP. Notably, C. dubliniensis showed a distinct resistance profile under treatment RP (65.559 ± 0.454 µg/mL), while C. tropicalis and C. krusei displayed their maximum MIC90 values under treatment L (64.16 ± 0.483 µg/mL, and 62.656 ± 0.32 µg/mL, respectively). Across nearly all tested conditions, C. albicans remained the most sensitive species (p < .001). Non-albicans species (NACs) required consistently higher concentrations for inhibition, with C. tropicalis and C. krusei showing nearly identical resistance patterns in several treatments, such as P (62.447 ± 0.325 µg/mL and 62.076 ± 0.623 µg/mL) and RL (22.395 ± 1.356 µg/mL, and 23.134 ± 1.33 µg/mL), respectively. Treatments T, B, and RL resulted in intermediate MIC90 values, further emphasizing a gradient of susceptibility that is both treatment-dependent and species-specific.
A similarly strong species effect was observed for EC10 (Kruskal-Wallis H(3) = 103.63, p < .001), demonstrating that sensitivity within the sublethal concentration range also varies by species. The EC10 was lowest for C. albicans (overall distribution of 6.026 ± 0.254 µg/mL) and increased in C. krusei (7.679 ± 0.35 µg/mL) but was substantially higher in C. tropicalis (12.524 ± 0.307 µg/mL) and C. dubliniensis (12.772 ± 0.375 µg/mL). The rank pattern for EC10 placed C. tropicalis and C. dubliniensis at the highest mean ranks, suggesting that these species require higher concentrations to elicit early measurable inhibition, consistent with diminished low-dose sensitivity or enhanced tolerance-like behavior under subinhibitory exposure (p < .001).
The analysis of EC10 values revealed a distinct species-specific structuring of sublethal thresholds across the eight treatment conditions (Table S3 for strain vs treatment-wise comparisons). The C. albicans consistently emerged as the most sensitive species, particularly under treatments RT (0.731 ± 0.507 µg/mL) and RB (1.652 ± 0.103 µg/mL), where the onset of inhibitory effects occurred at the lowest concentrations. In contrast, non-albicans species required significantly higher concentrations to reach this 10% effective threshold. While RT remained the most potent treatment across all taxa, maintaining mean values under ~10 µg/mL for both C. tropicalis and C. krusei treatments, L (17.905 ± 0.484 µg/mL, and 16.655 ± 0.409 µg/mL) and P (16.87 ± 0.093 µg/mL, and 17.139 ± 0.324 µg/mL) demonstrated the highest sublethal thresholds. Specifically, C. tropicalis and C. krusei exhibited peak EC10 values under treatment L, while C. dubliniensis reached its maximum threshold under treatment RP (19.276 ± 0.264 µg/mL). Overall, these data clearly demonstrate that species-specific differences are most evident at the sublethal level, with non-albicans species displaying a broader range of resistance before the initiation of inhibitory activity, at their mid-log phase when compared to early growth phase.
Because absolute inhibitory thresholds do not fully describe the dynamic transition between sublethal and inhibitory exposure regimes, the geometric relationship between EC10 and MIC90 values for each strain–treatment combination were furthermore analyzed. The resulting Δs (EC10-MIC90) and EC10/MIC90 metrics quantify the separation between early measurable growth perturbation and near-complete growth inhibition, thereby operationalizing the concept of “phase plasticity.” This framework allows assessment of whether species differ in the breadth of their sub-inhibitory tolerance window and whether RAMEB complexation alters the positioning of treatments within the MIC-EC susceptibility landscape. The multidimensional plasticity architecture is depicted in Figure 2.
To capture how the sublethal response region relates to the inhibitory threshold, two plasticity metrics were derived: phase shift (Δs = EC10 - MIC90 (absolute separation)) and phase distance = EC10/MIC90 (relative separation). Both metrics differed significantly across species (phase shift: Kruskal-Wallis H(3) = 189.555, p < .001; phase distance: H(3) = 232.148, p < .001), indicating that EC10 is positioned differently relative to MIC90 depending on the species. For phase shift, means were negative across all species, consistent with EC10 occurring at concentrations below the MIC90 threshold. However, the magnitude of this separation differed: C. albicans showed the smallest absolute separation (-16.159 ± 0.757), whereas C. tropicalis (-24.033 ± 1.061) and especially C. krusei (-28.691 ± 0.982) and C. dubliniensis (-30.066 ± 0.693) exhibited more negative shifts. Interpreted biologically, a more negative phase shifts indicates a larger gap between the concentration where early inhibition begins and the concentration required for near-complete growth inhibition, suggesting species-dependent breadth of the sublethal “adaptive window.” For phase distance, species differences were also evident. The C. krusei exhibited the lowest EC10/MIC90 ratio (0.209 ± 0.004), consistent with the largest proportional separation between sublethal and inhibitory thresholds. In contrast, ratios were higher for C. albicans (0.281 ± 0.001), C. dubliniensis (0.285 ± 0.004), and C. tropicalis (0.473 ± 0.018). Taken together, these plasticity analyses indicate that non-albicans Candida species, particularly C. krusei and C. dubliniensis exhibit a broader separation between EC10 and MIC90, supporting the interpretation that adaptive/tolerance-linked concentration ranges may differ by species (p < .001).
To determine whether species- and formulation-dependent differences in concentration thresholds translate into functional survival outcomes under working exposure conditions, colony-forming unit (CFU) dynamics were analyzed using species-wise standardized linear mixed models. Z-transformation within species isolates treatment-driven deviations from baseline survival variability and permits direct comparison of EO and RAMEB–EO effects across taxa. This analysis tests whether susceptibility and plasticity differences observed at the concentration-response level manifest as measurable shifts in viable population burden. Species-stratified estimated marginal means of standardized CFU responses are presented in Figure 3.
Survival was quantified by calculating the area under the curve (AUC) from CFU counts across all time points. To account for inherent growth variations between strains, these AUC values were Z-transformed. This standardization ensures that values represent within-strain deviations from the baseline, focusing the analysis on relative survival rather than absolute differences in growth capacity. In linear mixed models accounting for experimental repeats, there was no evidence that standardized CFU differed by treatment, species, or their interaction within the experimental EO/RAMEB set (treatment: F(7, 40.538) = 0.744, p = .637; species class: F(3, 41.579) = 0.223, p = 0.880; treatment x species class: F(21, 41.918) = 0.891, p = 0.602). The EMMeans therefore indicated only directional trends (e.g., more negative values suggesting stronger CFU suppression), but these differences were not statistically robust under the model. Importantly, this lack of effect in standardized CFU suggests that, under the tested working conditions and within-strain normalization, survival responses were comparatively uniform across experimental treatments. Susceptibility and plasticity analyses demonstrated clear species-dependent variations at the concentration-response level. However, under the specific working concentrations utilized, survival measured via CFU remained consistent (non-significant) across all tested Candida strains (Figure 3).
3.2. Treatment-Induced Oxidative and Nitrosative Stress Responses to Stratify Exposure Signatures
To determine whether essential oil and RAMEB-EO formulations elicit distinct oxidative and nitrosative stress programs across Candida species, standardized mechanistic markers encompassing intracellular reactive oxygen species (ROS), reactive nitrogen species (RNS), and key antioxidant response genes (CAT1, GPX1, SOD1) were analyzed. Because these variables were Z-transformed within species, the resulting profiles reflect treatment-induced deviations from each species’ baseline stress architecture rather than absolute interspecies differences. This approach was used to enable direct comparison of mechanistic exposure signatures across taxa while controlling for inherent species-level variability in redox homeostasis.
Hierarchical clustering was first applied to the aggregated treatment signatures to define global mechanistic structure. Species-stratified heatmaps were then constructed to visualize how each treatment perturbs the balance between stress generation (ROS/RNS) and antioxidant compensation (CAT1/GPX1/SOD1). Together, these analyses interrogate whether formulation effects primarily alter oxidative burden, antioxidant engagement, or the coordination between these systems. The resulting mechanistic landscape and oxidative-nitrosative response cluster classification is presented in Figure 4 and Table 1 respectively.
Visual inspection of the species-specific heatmaps (Figure 4: panel B-E) for C. albicans, C. tropicalis, C. krusei, and C. dubliniensis demonstrates that these oxidative-nitrosative exposure signatures are broadly conserved across the tested taxa. Despite the significant differences observed in absolute concentration thresholds (EC10 values), the relative mechanistic deviations-most notably the high-stress profile of MN and the suppressed response of AM remain consistent across all species. This conservation suggests that while species differ in their individual sensitivity thresholds, the underlying cellular “mode of action” for these treatments is largely species independent. Hierarchical clustering (Figure 4A) confirms a clear binary split between high-stress anchors and the experimental treatment set. The experimental treatments (B, L, P, T, RL, RB, RP) form a tightly knit hierarchical group characterized by low ROS/RNS generation and a coordinated CAT1/GPX1-driven adaptive response. The proximity of RT and RB to the reference antifungal FL in the dendrogram further suggests that these specific combinations represent a transition state toward higher inhibitory activity while maintaining the general mechanistic signature of the experimental group (see supplementary Tables S4 and S7 for raw percentage reactive oxygen-nitrogen species generation compared to untreated control and pairwise dendrogram distance matrix for hierarchical clustering, respectively).
To define treatment-specific oxidative-nitrosative stress exposure signatures and the associated antioxidant response programs, standardized mechanistic endpoints (ROS, RNS, CAT1, GPX1, SOD1) across C. albicans, C. tropicalis, C. krusei, and C. dubliniensis we analyzed by k-clustering (Table 1). Because all mechanistic variables were Z-transformed within species (split by species standardization), this analysis emphasizes relative mechanistic deviations (mode of action patterns) rather than absolute potency or concentration effects. Accordingly, the experimental treatments were interpreted together with reference anchors: AM and FL as antifungal controls and MN as an oxidative stress positive control. Mechanistic profiles were summarized at the treatment × species level (mean Z-values), yielding N = 44 exposure signatures corresponding to 11 treatments measured in each of 4 species (11 signatures per species). Treatments included A, F, L, B, P, T, RL, RB, RP, RT, MN. The k-means clustering (k = 3) was applied to the five-dimensional signature space (ROS, RNS, CAT1, GPX1, SOD1) and resolved three mechanistic classes (cluster 1 n = 4, cluster 2 n = 7, cluster 3 n = 33). Cluster centers (Z units) indicated that class separation was driven by both the magnitude of ROS/RNS generation and the balance of antioxidant response gene shifts.
In Table 1, cluster 1 exhibited the strongest stress phenotype, with markedly elevated RNS (+2.904) and ROS (+2.839). This was accompanied by a strong SOD1 upshift (+2.616) and pronounced GPX1 suppression (-2.6), while CAT1 remained near baseline (-0.372). Importantly, Cluster 1 consisted exclusively of MN (4/4 signatures), indicating that MN produced a conserved high-stress signature across all four species and served as a robust “high oxidative-nitrosative burden” anchor in the mechanistic space.
Cluster 2 showed modest elevations in stress markers (RNS +0.484; ROS +0.443) but a disproportionately reduced antioxidant response, particularly CAT1 (-1.88) and GPX1 (-0.832), with only a modest positive shift in SOD1 (+0.839). In terms of composition, this mechanistic class was dominated by AM (4/7 signatures; one per species), with additional membership from RT (2 signatures) and FL (1 signature). Thus, AM displayed a reproducible cross-species signature consistent with stress present but CAT1/GPX1 response suppressed, whereas FL and RT showed occasional drift into this phenotype. Cluster 3 formed the dominant mechanistic class and was characterized by below baseline ROS/RNS (RNS -0.454; ROS -0.449) together with relative increases in CAT1 (+0.469) and GPX1 (+0.507) and a decrease in SOD1 (-0.51). This profile is consistent with an adaptive/low stress signature in which oxidative/nitrosative stress markers are not elevated and antioxidant response patterns preferentially involve CAT1/GPX1 rather than SOD1. Cluster 3 included all experimental treatments across all species (B, L, P, T, RL, RB, RP each contributed 4/4 species signatures) and contained most signatures for F (3/4) and RT (2/4). Distances between cluster centers supported clear separation among the mechanistic classes, particularly between the MN-driven high-stress class and the dominant low-stress/adaptive class (cluster 1 vs 3 distance = 6.498; cluster 1 vs 2 = 4.490; cluster 2 vs 3 = 3.287). Despite distinct mechanistic classes, cluster membership was not associated with species under the species-wise standardized framework. Pearson’s chi-square test showed no enrichment (χ²(6) = 1.905, p = 0.928), indicating that the clustering structure is primarily treatment-signature driven rather than species-driven in this mechanistic space. This suggests that the oxidative-nitrosative exposure signatures are broadly conserved across C. albicans, C. tropicalis, C. krusei, and C. dubliniensis, with species effects more likely to emerge in downstream phenotype/efficacy endpoints than in the top-level mechanistic stratification. Within the mechanistic framework (species-wise Z-standardized ROS/RNS and antioxidant gene responses), the most favorable exposure signature was the dominant cluster 3 pattern-low ROS/RNS with CAT1/GPX1 upshift-capturing all experimental treatments (B, L, P, T, RL, RB, RP) consistently across species and most signatures for FL and RT. In contrast, A reproducibly mapped to cluster 2, characterized by moderate ROS/RNS elevation coupled to suppressed CAT1/GPX1 response, representing a mechanistically less desirable pattern in this signature space. As expected, MN formed cluster 1 exclusively, producing the strongest oxidative-nitrosative burden and serving as the high-stress positive control anchor. Overall, these results indicate that the experimental treatment set predominantly expresses a mechanistic profile consistent with low oxidative/nitrosative burden and adaptive antioxidant engagement, whereas AM is associated with a stress-plus-suppressed-response signature and MN represents maximal stress induction.
3.3. Convergence of Planktonic Efficacy and Mature Biofilm Eradication Across Candida Species
To determine whether early planktonic inhibitory effects translate into suppression of structured biofilm-associated phenotypes, we next evaluated treatment performance across complementary functional endpoints spanning planktonic metabolism (PMT), planktonic viability (PVA), biofilm-associated metabolic activity (BMT), biofilm-associated viability (BVA), and biofilm biomass (BB). Linear mixed models were applied to species-wise Z-transformed responses to enable comparison of relative within-species shifts across treatments. This integrative framework allowed direct assessment of whether treatments that perform strongly under planktonic conditions retain inhibitory hierarchy in the more structured and stress-resilient biofilm context, and whether such convergence is conserved across experimented Candida species. The resulting estimated marginal means profiles are shown in Figure 5 (see supplementary Table S5-S6 for reduced percentage PMT, PVA, BB, BMT and BVA raw data).
The results summarized in Figure 5 are supported by two primary visual analyses. First, the estimated marginal means plot (EMMeans) illustrates the overall ranking of treatments, highlighting the significant suppression of metabolism and viability by RT and RP relative to the neutral baseline of the remaining panel. Second, the treatment × species interaction plot visualizes the biological basis of the statistical interaction; it specifically highlights the crossover effects where RB and RP achieve maximal efficacy in C. dubliniensis compared to their more moderate profiles in C. albicans and C. tropicalis. These visualizations confirm the sensitivity of the Z-standardized scale in detecting species-specific physiological shifts.
Strong treatment effects were observed for both planktonic endpoints, demonstrating that Candida planktonic physiology was substantially modulated by the experimental treatment panel. For metabolism, a highly significant overall treatment effect was found (PMT: F(7, 41.506) = 42.829, p < .001), and this effect was even more pronounced for viability (PVA: F(7, 39.861) = 88.926, p < .001), indicating that viability provided high sensitivity for treatment discrimination. The species’ main effect was not found to be significant for PMT (p = 0.3) and was borderline for PVA (p = 0.051). Given the species-wise standardization, these results were expected and indicated that the dominant signal was treatment-driven rather than a reflection of baseline between-species offsets. A significant treatment × species interaction was exhibited by both endpoints, demonstrating that treatment efficacy was not uniform across the four species. This was statistically confirmed for both PMT (F(21, 43.84) = 2.765, p = 0.00224) and PVA (F(21, 41.521) = 6.42, p < .001), while simple-effect analyses confirmed that treatment differences remained significant within each species for both endpoints (all p < .001), supporting a species-stratified interpretation. A concise ranking of treatments on the standardized scale was provided by estimated marginal means (EMMeans), showing consistency between metabolic and viability suppression as efficacy indicators. The RT was identified as the most inhibitory treatment, showing the strongest suppression of metabolism (EMMeans: -1.659 ± 0.133) and viability (-1.679 ± 0.096), while RP (metabolic activity: -0.971 ± 0.134, viability: -1.004 ± 0.096) was ranked second and remained significantly more inhibitory than most of the panels. Whereas RB (0.078 ± 0.134) was found to be near neutral for metabolism but showed a modest, significant reduction in viability (-0.229 ± 0.096), while positive EMMeans were displayed by L, B, P, T, and RL, reflecting weaker inhibition compared to RT/RP. The dominance of RT and RP was reinforced by Bonferroni-adjusted pairwise comparisons, which identified RT as significantly more inhibitory than all other treatments. The biological basis of the interaction was revealed by inspection of EMMs within each species, where RT was characterized as a broad-spectrum inhibitor with strongly negative EMMs produced in all four species for both endpoints, although the magnitude of suppression was attenuated in C. dubliniensis (p < .001). A particularly pronounced inhibitory profile was shown by RP in C. dubliniensis (PMT: -1.438 ± 0.279; PVA: -1.621 ± 0.201), suggesting specific effectiveness against this species, while a striking species-dependent pattern was shown by RB, which explains a major portion of the interaction by showing pronounced inhibition in C. dubliniensis (PVA: -1.509 ± 0.203) despite not being consistently inhibitory in C. albicans and C. tropicalis.
This physiological modulation extended to the inhibition of premature biofilms, where efficacy was similarly quantified through biofilm biomass (BB), metabolic activity (BMT), and viability (BVA). For biofilm metabolism, no significant main effect was detected for treatment (F(7, 40.226) = 0.572, p = 0.774) or species (F(3, 41.071) = 0.893, p = 0.453), indicating that no single treatment performed as the “best” across all species. Global EMM trends for metabolism showed RT at the lowest level (0.306; 95% CI: 0.183-0.429) and RL at the highest (0.377; 95% CI: 0.254-0.501). Analyzing the reduced metabolic activity (compared to UC), shift from essential oil to RAMEB-complexed form, T → RT showed the non-significant metabolic shift (0.049; 95% CI -0.24-0.338). Overall, there was no globally significant difference observed among the treatments, as the collective mean for metabolic inhibition (BMT) for all tested essential oils and their RAMEB-complexed counterparts remained consistently within the 50–60% range relative to the untreated control (UC) (p < .001).
Biofilm viability was identified as the most decisive and treatment-dependent readout in the premature biofilm model (F(7, 39.997) = 10.258, p < .001). A non-significant treatment × species interaction was present (F(21, 40.674) = 1.037, p = 0.446), and species effect remained borderline non-significant (F(3, 40.625) = 2.664, p = 0.446). The RT produced the lowest overall viability (EMMeans: -0.232; 95% CI: -0.369 to -0.096), while B showed the highest (0.392; 95% CI: 0.255 to 0.529). The T → RT transition provided a very large improvement in suppression (shift: 0.62; 95% CI: 0.3 to 0.939, p < .001), marking the strongest “RAMEB-benefit” signal. In contrast to the physiological markers, premature biofilm biomass appeared robust and was not detectably altered by treatments or formulation status on the Z-standardized scale. No significant effects were detected for treatment (F(7, 40.334) = 0.356, p = 0.922), species (F(3, 41.474) = 1.054, p = 0.379), or the interaction (F(21, 41.564) = 0.516, p = 0.947). Overall, EMM trends showed RT with the lowest biomass (0.268; 95% CI: 0.114 to 0.423) and RB with the highest (0.398; 95% CI: 0.243 to 0.552), though these differences were not statistically significant. This highlights a critical decoupling in early biofilm inhibition: while biological markers like viability and metabolism are highly responsive to specialized treatments, the physical biofilm biomass remains insensitive at this stage. In conclusion, treatment efficacy is readily detected at multiple levels and is characterized by a clear species-dependence. The identification of broad-spectrum (RT) versus species-selective (RB, RP) patterns, where RAMEB complexation is not uniformly beneficial, successfully informs subsequent biofilm maturation and mechanistic integration analyses.
3.4. Integrated Treatment Ranking Identifies the Most Effective Regimens Across Endpoints
To move beyond endpoint-specific comparisons and establish a unified hierarchy of treatment performance, a composite efficacy index integrating planktonic and biofilm readouts into a single standardized score were constructed. This integrated metric captures the net biological impact of each formulation across metabolic activity, viability, and biomass endpoints, thereby reducing endpoint-specific bias and highlighting consistent treatment-level effects. Linear mixed modeling was applied to the species-wise Z-transformed composite score to preserve within-species normalization while enabling cross-treatment comparison. This approach highlights the identification of globally superior regimens and, critically, permits direct evaluation of whether RAMEB complexation confers a systematic efficacy advantage within each essential oil family. The integrated ranking and formulation-shift analysis are presented in Figure 6.
Inset: Slope plot summarizing the direction and magnitude of formulation effects within each EO family, comparing the parent EO to its corresponding RAMEB inclusion complex (R-EO) using the same integrated score. Upward slopes indicate improved efficacy after complexation, while downward slopes indicate reduced efficacy, illustrating that RAMEB reformulation produces family-specific shifts rather than a uniform advantage across all EOs.
The mixed model demonstrated a pronounced overall regimen effect on the composite outcome (treatment: F(7, 40.752) = 24.552, p < .001), confirming that the experimental treatments differ substantially in their global efficacy across endpoints when assessed in an integrated framework. In contrast, the species main effect was negligible (F(3, 42.523) = 0.106, p = 0.956), which is consistent with the analytic design: because endpoints were Z-standardized within species, the composite score reflects within-species deviations rather than between-species baseline differences. Importantly, the model detected significant species dependence of integrated efficacy, evidenced by a treatment × species interaction (F(21, 43.016) = 2.26, p = 0.012). This indicates that while some regimens are broadly effective, others show species-selective performance, and the “best regimen” cannot be assumed to be identical for all Candida species under the integrated scoring scheme. Estimated marginal means (EMMeans) for treatment, averaged across species, established a clear hierarchy of integrated efficacy (higher EMMeans = better overall inhibition). The RT ranked as the strongest overall regimen (EMMeans = 0.475, 95% CI 0.346-0.603). Its confidence interval was entirely above zero, indicating consistently high performance relative to the grand mean across endpoints and species. Whereas RP ranked second (EMMeans = 0.106, 95% CI -0.024 to 0.235), representing a modest integrated benefit; its CI slightly crossed zero, suggesting greater variability across species/endpoints compared with RT. The RB, however, followed with a negative mean (EMMeans = -0.175, 95% CI -0.304 to -0.045), indicating that, on average across species, RB did not match the integrated efficacy of RT and was not uniformly suppressive across all included endpoints. The remaining treatments formed a lower-performing group with negative EMMs: B (-0.293), L (-0.371), T (-0.381), RL (-0.394), and P (-0.415) (lowest). These negative composite scores indicate comparatively weaker global suppression across the endpoint set, consistent with limited broad-spectrum efficacy under the integrated scoring framework. Multiplicity-controlled pairwise evidence supports RT as the top regimen among all treatments. The RT was significantly superior to every other regimen, including the second-ranked RP (RT > RP: mean difference = 0.369, p = 0.005, Bonferroni-adjusted pairwise comparison). The RT also exceeded RB and the lower-performing group by larger margins (e.g., RT > RB: difference = 0.649, p < .001), confirming that RT’s leading rank is statistically robust under conservative correction. For RP, pairwise comparisons showed that RP was clearly above the low-performing treatments overall, but the difference between RP and RB did not remain significant after Bonferroni adjustment (RP vs RB: p = 0.100). This result supports that RP is generally a strong regimen, but its advantage over RB is not consistently large enough across the dataset to survive the most stringent correction, reflecting species-structured effects. In C. albicans, RT was decisively the top regimen, with a markedly elevated integrated score (RT = 0.862, 95% CI 0.671 -1.054), indicating strong and consistent inhibition across the endpoint set. The RP was near neutral (RP = 0.028, CI crossing zero), and the weakest integrated performance in this species was observed for T (-0.466). This pattern supports RAMEB encapsulated thyme oil as a broad and high-confidence regimen for C. albicans.
In C. tropicalis, RT again ranked highest (RT = 0.529, 95% CI 0.310-0.749). The RP was close to neutral (-0.015), suggesting limited overall integrated benefit in this species. Notably, RB showed the lowest integrated mean (-0.405), indicating that RB’s performance is not uniformly favorable and may be comparatively weak against C. tropicalis when outcomes are integrated. This species therefore contributes to the interaction by separating RT from RB more strongly.
In case of C. krusei, RT remained at the top regimen (RT = 0.453, 95% CI 0.233-0.672), and RP performed relatively well (0.143), consistent with RP having stronger efficacy in some species contexts than others. The weakest regimen in this species was RL (-0.517). Overall, C. krusei preserves the “RT-best” pattern but differs in the ordering and spacing of the remaining treatments, contributing to the interaction signal.
In contrast to the other three species, C. dubliniensis displayed a shifted integrated ranking, where RP emerged as the top regimen (RP = 0.266, 95% CI -0.004 to 0.536) and RB ranked second (0.141), while RT was comparatively weaker (RT = 0.054). Although RP’s CI narrowly crossed zero, the ordering indicates that C. dubliniensis responds preferentially to RP/RB relative to RT in the integrated framework. The poorest composite performance in this species was P (-0.529).
3.5. Response Classes Reveal Susceptible, Tolerant/resistant, and Hormetic/adaptive Phenotypes with Species Enrichment
To translate multidimensional efficacy patterns into biologically interpretable outcome states, treatment–species signatures into discrete response phenotypes based on their integrated endpoint profiles were classified. Using unsupervised clustering of inhibition-coded functional readouts, each signature was assigned to one of three classes representing strong inhibition (susceptible), weak inhibition (tolerant/resistant), or mixed/hormetic-adaptive behavior. This phenotype-level abstraction enables visualization of how each formulation distributes species across inhibitory states, rather than focusing solely on mean shifts. Importantly, this approach further revealed whether treatments drive uniform suppression across tested Candida species or generate heterogeneous responses suggestive of adaptation or tolerance emergence. The distribution of response classes across treatments is summarized in Figure 7.
To translate multi-endpoint responses into biologically interpretable phenotypes, response classes were derived using unsupervised clustering of aggregated strain × treatment signatures. This approach integrated planktonic metabolism and viability with biofilm biomass, metabolic activity, and viability into a single multivariate response fingerprint, thereby enabling each strain–treatment pair to be assigned to one of three phenotypes: susceptible, hormetic/adaptive, or tolerant/resistant. Importantly, all endpoints contributing to these signatures had been Z-standardized within species, such that class membership reflected within-species deviations in response magnitude (i.e., the extent to which a given strain shifted relative to typical behavior of its own species), rather than baseline differences between species. Aggregated response fingerprints were constructed for four Candida species, including C. albicans, C. tropicalis, C. krusei, and C. dubliniensis. For each strain × treatment combination, mean inhibition-coded responses were computed across endpoints representing planktonic inhibition (In-PMT, reflecting planktonic metabolism; In-PVA, reflecting planktonic viability) and biofilm eradication (Er-BB, reflecting biofilm biomass; In-BMT, reflecting biofilm metabolic activity; In-BVA, reflecting biofilm attached cellular viability). Because inhibition-coded metrics were analyzed (defined as the negative of the original species-wise Z values), larger positive values indicated stronger inhibition for the corresponding endpoint, whereas negative values indicated relative maintenance or enhancement of function under exposure in the standardized response space. Response-class analysis was performed across the experimental regimen set encoded as L, B, P, and T, representing base essential oil exposures in non-encapsulated form, and RL, RB, RP, and RT, representing the corresponding RAMEB-encapsulated formulations of the same treatment types. Consistent with earlier integrated ranking analyses in which RT and RP were placed at the top overall, this phenotype-based framework was used to provide an orthogonal interpretation focused on the qualitative response patterns induced across biological compartments.
Unsupervised learning was then applied to the aggregated inhibition-coded fingerprints using k-means clustering with k = 3, yielding three reproducible response classes. Biological meaning was inferred directly from the final cluster centers, which summarized the multivariate inhibition patterns associated with each phenotype. The first class was interpreted as a susceptible phenotype characterized by global, high-magnitude inhibition and therefore representing “true responders” under the standardized framework. In this class, strong planktonic suppression was observed at the cluster center (In-PMT = 1.57; In-PVA = 2.27), accompanied by marked reduction in biofilm viability (In-BVA = 3.36). By contrast, the center values for biofilm biomass and biofilm metabolism were more modest and variable (Er-BB = -0.37; In-BMT = -0.58). This pattern supported an interpretation in which viability was compromised across compartments particularly within biofilms even when biomass and metabolic readouts did not show immediate or uniform inhibition, consistent with mechanisms that disrupt viability or core physiology without necessarily precipitating rapid biomass collapse.
The second class was interpreted as a hormetic/adaptive phenotype, capturing mixed or compartment-shifted inhibition patterns in which planktonic suppression was apparent while biofilm inhibition remained limited. At the class center, planktonic inhibition remained clearly positive (In-PMT = 1.40; In-PVA = 1.39), whereas biofilm endpoints clustered near neutral or negative values, most notably for biofilm viability (In-BVA = -0.07). Under this phenotype, strain treatment pairs were inferred to exhibit strong inhibition in planktonic assays while failing to translate that inhibition into comparably strong suppression of biofilm traits, a pattern consistent with adaptive compensation, biofilm-associated tolerance emergence, or hormetic-like responses in which stress exposure preferentially triggers protective pathways rather than producing uniform inhibition across compartments.
The third class was interpreted as a tolerant/resistant phenotype, representing weak inhibition across endpoints and consistent with minimal global efficacy under exposure. Negative inhibition-coded values were observed across the included endpoints at the class center (In-PMT = -0.57; In-PVA = -0.57; biofilm measures approximately -0.38 to -0.40), indicating that strains assigned to this class-maintained function across both planktonic and biofilm compartments relative to species-typical behavior in the standardized space. Under this interpretation, treatment regimens mapping to this phenotype were inferred to impose insufficient inhibitory pressure and/or to be countered by strain-level tolerance mechanisms that preserved viability and activity under the tested conditions. Across N = 75 aggregated strain × treatment fingerprints, the tolerant/resistant phenotype dominated the response landscape. Specifically, the susceptible phenotype (Class 1) was rare (n = 3; 4.0%), the hormetic/adaptive phenotype (Class 2) was observed at moderate frequency (n = 20; 26.7%), and the tolerant/resistant phenotype (Class 3) comprised the majority of signatures (n = 52; 69.3%). This distribution indicated that globally susceptible response profiles were uncommon, whereas partial or ineffective inhibition patterns predominated, thereby supporting the broader inference that many strain–treatment combinations failed to produce coordinated suppression across endpoints and compartments in this dataset.
Species representation in the clustered dataset was balanced, with totals of n = 25 for C. albicans, n = 17 for C. tropicalis, n = 17 for C. krusei, and n = 16 for C. dubliniensis. To improve statistical stability for enrichment testing, classes were collapsed into a binary phenotype in which “Responder” combined the susceptible and hormetic/adaptive classes, and “tolerant/resistant” corresponded to the tolerant/resistant class alone. Under this collapsed definition, no evidence of association between responder status and species was detected (Pearson χ²(3) = 0.270, p = 0.966; N = 75), and expected counts were adequate (minimum expected count 4.91). These results indicated that responder versus tolerant/resistant phenotypes were not enriched within any species under the species-wise standardized response framework, suggesting that interspecies baseline differences were effectively controlled and that response heterogeneity was primarily driven by strain-level and regimen-level factors rather than species identity.
In contrast to the null species association, response classes were strongly structured by regimen type, with a pronounced contrast between non-encapsulated exposures and RAMEB-encapsulated formulations. The susceptible phenotype was observed exclusively under RT exposure, indicating that RT uniquely generated globally strong inhibitory signatures across planktonic and biofilm endpoints in this dataset. This exclusivity provided phenotype-level corroboration of earlier integrated ranking findings in which RT consistently emerged as the top-performing regimen, and it further suggested that RT was the only regimen capable of reliably driving strain–treatment signatures into the “true responder” state defined by coordinated inhibition. The hormetic/adaptive phenotype was enriched among the encapsulated regimens, being dominated by RP and RT and additionally represented by RB. Under this pattern, strong planktonic inhibition was frequently induced while biofilm inhibition remained incomplete, consistent with a regimen profile that imposed substantial stress yet permitted a compartmental shift toward biofilm-associated tolerance or adaptive compensation in a subset of strains. By contrast, the tolerant/resistant phenotype was heavily populated by the non-encapsulated regimens (L, B, P, and T) and by RL, indicating comparatively weak global inhibition across endpoints for those exposures. In practical terms, these regimens were most often associated with response fingerprints that remained outside the responder phenotypes, thereby providing a mechanistic and phenotypic explanation for their comparatively lower integrated efficacy. Taken together, the response-class framework complemented the integrated ranking results by specifying not only which regimen performed best, but also the phenotypes they most induced. RT was identified as the most reliable driver of the susceptible phenotype, reflecting global inhibition across compartments and aligning with its consistently high overall performance in prior analyses. RP, RT, and RB were frequently associated with hormetic/adaptive profiles, characterized by strong planktonic inhibition coupled to incomplete suppression of biofilm traits, a pattern consistent with adaptive transitions toward biofilm-associated tolerant states. Meanwhile, the predominance of non-encapsulated regimens within the tolerant/resistant phenotype provided a clear phenotypic rationale for their weaker integrated performance, as these exposures most commonly failed to generate coordinated inhibitory pressure across the multi-endpoint response space.
3.6. Mechanistic Inference Stress and Antioxidant Gene Programs Predict Inhibitory Phenotypes
To determine whether mechanistic stress signatures could predict functional inhibitory outcomes, the relationship between oxidative–nitrosative markers (ROS/RNS) and antioxidant response genes (CAT1, GPX1, SOD1) and the derived inhibitory phenotype classes were modeled. Using aggregated treatment × species mechanistic signatures, a classification and regression tree (CRT) approach with Responder (responder vs tolerant/resistant) as the dependent variable was applied. This analysis allowed the identification of hierarchical decision rules linking specific stress-response programs to phenotypic outcomes, thereby moving beyond descriptive clustering toward predictive mechanistic inference. The resulting tree structure and treatment-wise enrichment across terminal nodes are shown in Figure 8.
To connect the CRT-defined mechanistic programs to regimen identity, terminal node membership was cross-tabulated against treatment, and regimen enrichment was interpreted in the context of the node-wise class composition defined by the Responder outcome. In the full analysis (supplementary Figure S2) that retained the antifungal and stress controls (AM, FL, and MN), treatment signatures were distributed non-randomly across the terminal nodes of the GPX1/CAT1-structured tree, indicating that specific regimens preferentially occupied distinct regions of the stress/antioxidant marker space rather than mapping uniformly across mechanistic programs. In this full model, the controls anchored opposite mechanistic extremes, with AM mapping exclusively to the high-confidence responder terminal program (Node 3; 9/9, 100%) and MN mapping exclusively to the tolerant/resistant-enriched terminal program (Node 5; 9/9, 100%), thereby validating that the CRT terminal states captured coherent and biologically separable mechanistic configurations. The second antifungal control, FL, was distributed across responder-enriched terminal programs, with strongest representation in Node 7 (7/12, 58.3%) and additional mapping to Node 2 (3/12, 25.0%) and Node 3 (2/12, 16.7%), and no mapping to the tolerant/resistant node, consistent with an overall responder-aligned mechanistic profile. Within the experimental regimens, responder-enriched programs were not confined to a single formulation, as the GPX1-high responder program (Node 2) was preferentially occupied by L (6/9, 66.7%), B (5/9, 55.6%), T (5/9, 55.6%), and RL (5/9, 55.6%), with substantial contribution from P (4/9, 44.4%), whereas a second responder-enriched program (Node 7) was preferentially occupied by RB (6/9, 66.7%), with additional contributions from RL (3/9, 33.3%) and P (3/9, 33.3%). In contrast, RT exhibited pronounced heterogeneity in mechanistic mapping, with a substantial fraction aligning with the tolerant/resistant program (Node 5; 6/12, 50.0%) and the remainder distributed across responder-enriched and mixed programs, while RP preferentially occupied the mixed/ambiguous terminal program (Node 8; 4/9, 44.4%), consistent with context-dependent mechanistic engagement under the CRT rule set.
Because control-driven anchoring can inflate apparent separability and obscure finer regimen structure among experimental exposures, a second CRT was evaluated after exclusion of A, F, and MN (Figure 8). In this experimental-only dataset (N = 72), node membership differed significantly by treatment identity (Pearson χ²(14) = 51.162, p < .001), although the contingency table remained sparse and enrichment was therefore interpreted descriptively. In this restricted analysis, terminal node membership segregated strongly by regimen, and a single terminal node was composed exclusively of RT signatures (Node 1; 5/5, 100%), indicating that RT occupied a distinct CAT1-defined mechanistic region when controls were removed. This RT-only node represented 55.6% of all RT observations in the experimental-only subset (5/9), while the remaining RT signatures mapped to the dominant mixed node (Node 3; 4/9, 44.4%) and did not appear in Node 4. The largest terminal node (Node 3; n = 44) captured the majority of experimental signatures and contained all RB observations (9/9, 100%), along with high within-treatment representation for B (7/9, 77.8%), T (7/9, 77.8%), and RP (7/9, 77.8%), and moderate representation for P (5/9, 55.6%), RL (5/9, 55.6%), and L (4/9, 44.4%). The remaining terminal node (Node 4; n = 23) concentrated L signatures (5/9, 55.6%) and included substantial contributions from P (4/9, 44.4%) and RL (4/9, 44.4%), with smaller contributions from B (2/9, 22.2%), T (2/9, 22.2%), and RP (2/9, 22.2%), while remaining entirely unoccupied by RB (0/9, 0%) and RT (0/9, 0%). Thus, after exclusion of controls, regimen stratification persisted but was expressed primarily as differential occupation of CAT1-defined terminal programs, with RB consistently mapping to the dominant mixed terminal node, RT partially isolating into a treatment-specific terminal node, and L/P/RL showing relatively greater representation in the alternative terminal node.
3.7. Multivariate Mode-Of-Action Landscape Defines Treatment Signatures and Mechanistic Axes
To integrate oxidative-nitrosative stress markers and antioxidant gene responses into a unified mechanistic framework, principal component analysis (PCA) on the aggregated treatment × species signatures were performed . Because all variables were standardized within species, this multivariate approach captures relative mechanistic positioning rather than potency differences, enabling comparison of mode-of-action geometry across treatments. The PCA has reduced the five-dimensional stress-response space (RNS, ROS, CAT1, GPX1, SOD1) into orthogonal axes that summarize dominant patterns of covariation. The resulting biplot (Figure 9) visualizes how treatments and species distribute along a primary stress-intensity axis and a secondary antioxidant-program axis, thereby defining the global mechanistic landscape of the EO and RAMEB-EO formulations.
Principal component analysis (PCA) was performed on aggregated treatment × species mechanistic signatures (RNS, ROS, CAT1, GPX1, SOD1; Z-transformed within species). The biplot shows PC1 (86.22%) versus PC2 (13.08%) for each treatment–species signature. Points are colored by treatment type (RC = antifungal reference controls, EO = essential oils, REO = RAMEB-EO complexes) and shaped by Candida species (Ca, Ct, Ck, Cd). Dashed crosshairs indicate the origin (0,0). Grey arrows depict rotated loading vectors: PC1 captures a dominant stress/redox intensity axis (positive direction aligned with ROS and SOD1, opposed to GPX1), whereas PC2 reflects a CAT1-centered antioxidant-response axis (positive direction aligned with CAT1). Centroid labels (treatment codes) indicate the mean position of each treatment across species. Hash marks (#) denote variables with the strongest contributions to the displayed axes (highest absolute loadings). Note: MN is excluded from this panel to prevent stress-control anchor from compressing the experimental space; full PCA including MN is provided in supplementary materials (Figure S3).
Component interpretation was guided by variable vectors projected onto PC space. PC1 was aligned with a strong oxidative-stress direction, as ROS projected prominently in the positive PC1 direction and co-varied with the SOD1 vector, while GPX1 projected strongly in the opposing (negative PC1) direction. The PC2 was dominated by the catalase axis, with CAT1 projecting primarily along the positive PC2 direction. Thus, the MoA plane was interpreted as contrasting ROS/SOD1-associated stress programs against GPX1-associated antioxidant configurations along PC1, with CAT1-associated variation represented orthogonally along PC2. Because treatment centroids and strain-level points were overlaid in the same space, these axes were interpreted as integrated MoA dimensions reflecting coordinated shifts in mechanistic marker configuration across strain–treatment signatures rather than isolated single-marker effects. Two visualizations were required to preserve interpretability across the full mechanistic range of the dataset. In the full MoA map (supplementary Figure S3), inclusion of the oxidative stress control MN generated an extreme displacement along positive PC1 in the direction of ROS (and toward the SOD1-aligned quadrant), thereby anchoring the oxidative-stress end of the landscape but simultaneously compressing the remaining treatments near the origin when a single global scale was applied. For clarity of the experimental regimen structure, a zoomed view (the first image) was therefore examined in which MN was excluded from the plotted space, allowing separation among the remaining treatments to be resolved without altering the underlying PCA solution or its mechanistic interpretation.
Treatment positioning in PC space was non-random and mechanistically interpretable in both views. In the full map, MN was separated far to the right on PC1, consistent with a distinct ROS-dominated stress signature that was not approached by any experimental regimen, thereby providing an internal validation that the PCA captured a coherent oxidative-stress program. The antifungal control AM separated strongly along negative PC2, placing it opposite the CAT1 vector and indicating a mechanistically distinct program characterized by displacement away from the CAT1-aligned direction relative to the experimental cluster. The remaining regimens formed a compact treatment-defined constellation near the negative PC1 region, indicating broad alignment toward the GPX1-associated direction and away from the MN-defined ROS extreme. Within this constellation, the base (non-encapsulated) experimental regimens (L, B, P, and T) clustered tightly with the corresponding encapsulated formulations (RL, RB, and RP), indicating that most experimental exposures shared a broadly similar multivariate stress/antioxidant configuration in this MoA space, with relatively subtle between-regimen differences compared with the control anchors. Notably, RT showed the most consistent displacement among the experimental regimens by shifting downward relative to the main cluster (negative PC2), placing it farther from the CAT1-aligned direction than most other experimental signatures and indicating a distinctive catalase-opposed mechanistic positioning within regimen space. The FL mapped within the central experimental constellation and overlapped most strongly with the region occupied by RB and the densely clustered L/B/P/T/RL/RP signatures, consistent with a responder-aligned but not extreme mechanistic configuration relative to the two control anchors. Formal multivariate testing of PCA scores (listwise N = 96) supported the visual inference that the MoA landscape was treatment-defined. Treatment identity significantly structured the multivariate PC space (Pillai’s Trace = 1.667; F(18,172) = 47.82; p < .001), with significant treatment effects detected on both axes (PC1: F(9,86) = 46.27, p < .001, R² = 0.829; PC2: F(9,86) = 49.46, p < .001, R² = 0.838). In contrast, species did not structure the global PC1-PC2 MoA space (Pillai’s Trace = 0.0147; F(6,184) = 0.226; p = 0.968), indicating that the dominant multivariate organization reflected regimen-associated signature shifts rather than baseline species separation.
Overall, the MoA landscape was defined primarily by treatment identity, with MN and AM providing mechanistically interpretable anchors at opposite extremes of the space. MN uniquely occupied the ROS/SOD1-aligned stress extreme on PC1, whereas AM separated most strongly along PC2 in the direction opposing CAT1. Most experimental regimens (L, B, P, T, RL, RB, and RP) occupied a compact region toward negative PC1 consistent with relative alignment to the GPX1-associated direction and away from ROS-driven stress, while RT exhibited the clearest within-experimental deviation by shifting toward negative PC2, indicating a distinctive catalase-opposed positioning within the treatment-defined MoA space. The complete data on the eigenvalues, rotated component matrix of the mechanistic markers and principle component centroid values can be found in supplementary Tables S8-S10.
4. Discussions
The rising incidence of life-threatening fungal infections driven in part by advanced medical care that expands the population of immunocompromised patients—has intensified the demand for effective clinical interventions. This challenge is compounded by dose-limiting antifungal toxicity and the rapid emergence of antifungal resistance, underscoring an urgent need for innovative therapeutic agents and strategies. In this study, we evaluated the effects of sub-inhibitory concentrations of four Lamiaceae essential oils, lavender (Lavandula angustifolia Mill.), lemon balm (Melissa officinalis L.), peppermint (Mentha piperita L.), and thyme (Thymus vulgaris L.) and their RAMEB counterparts against four Candida species (C. albicans, C. tropicalis, C. krusei, and C. dubliniensis). Because cyclodextrin-based inclusion systems can modify the aqueous availability and free (bioactive) fraction of lipophilic small molecules, RAMEB encapsulation is expected to alter not only the total deliverable dose but also the concentration time profile experienced by cells within planktonic and biofilm states. Comparative multivariate analyses (MANOVA) combined with unsupervised stratification (k-means clustering) revealed a clear hierarchy of efficacy that appears to be driven by the chemical identity of the dominant constituents and their interaction with fungal stress-response capacity, particularly under sub-lethal exposure conditions. The mechanistic interpretations below are therefore framed as literature-consistent hypotheses that explain the phenotypic and multivariate patterns observed here, while recognizing that confirmatory molecular assays (e.g., ROS quantification, enzymatic readouts, transcriptomics) will be required to establish causality.
At the top of this hierarchy, thyme (RT) emerged as the most broadly active formulation, consistent with its phenolic monoterpene-rich profile dominated by thymol and carvacrol [12,31]. These components are widely associated with membrane-active antifungal effects and may promote leakage of intracellular constituents (e.g., ATP, K⁺) alongside disruption of mitochondrial energy homeostasis. In addition, thymol has been reported to induce oxidative stress through reactive oxygen species (ROS) generation and lipid peroxidation, which can burden NADPH-dependent antioxidant systems. In this context, oxidative stress may deplete NADPH required to regenerate reduced glutathione (GSH), thereby compromising NADPH-dependent antioxidant enzymes such as glutathione reductase and diminishing the capacity to neutralize ROS, ultimately amplifying oxidative damage [32,33,34]. Notably, unlike the other tested oils, RT exhibited a “catalase-opposed” -like signature at the phenotypic level, consistent with the possibility that RT either bypasses or functionally suppresses genus-wide CAT1-associated defense capacity. In turn, this may reduce the likelihood that Candida transitions into an adaptive/tolerant state and instead favors a coordinated loss of viability across planktonic and biofilm-associated cells [35]. This interpretation is supported by RT’s exclusive placement within a high-efficacy terminal node in the classification and regression tree (CRT) model and by its distinctive displacement in the PCA space, a pattern that mirrors the multivariate signature of potent clinical antifungals such as amphotericin B [33,36,37].
In contrast, peppermint (RP) and lemon balm (RB) behaved as comparatively “selective” inhibitors and, importantly, displayed features compatible with an increased risk of hormesis-like or adaptive responses under sub-inhibitory exposure. Although these oils showed marked activity against planktonic Candida populations, they did not achieve complete sterilization within biofilm architecture, indicating a reproducible disparity between planktonic killing and biofilm eradication (i.e., a planktonic-biofilm decoupling of efficacy). A mechanistically plausible contributor is the sequestration of non-phenolic monoterpenes, such as menthone (peppermint) and citral (lemon balm) within the extracellular polymeric substance (EPS) matrix. The EPS, a heterogeneous scaffold containing β-1,3-glucans, mannans, and extracellular DNA (eDNA), can function as a physicochemical sink; its hydrophobic domains facilitate non-specific interactions with less polar ligands, attenuating mass transfer kinetics and effectively retaining antimicrobial molecules in the upper strata of the matrix. Consequently, the local concentrations reaching deeper biofilm layers may remain below the threshold required for a “total kill,” allowing basal-layer survivors to persist and mount adaptive responses [38,39,40,41].
At the molecular level, menthol in RP and geranial in RB may exert sub-lethal pressure that preferentially engages antioxidant reconfiguration, consistent with a GPX1-skewed defensive state. Prior studies report that sub-lethal menthol exposure (e.g., 0.5-1 mM) can induce oxidative stress in Candida by compromising membrane integrity and altering respiratory/oxidative phosphorylation dynamics, thereby activating antioxidant defense mechanisms as the fungus attempts to restore homeostasis [42,43,44,45,46]. Under these conditions, fungal cells may be more likely to activate protective pathways and enter a state of biofilm-associated tolerance. However, a notable species-specific “crossover effect” was observed for C. dubliniensis, which-despite being generally less responsive to thyme-proved uniquely vulnerable to RP and RB. Two non-exclusive explanations may account for this pattern. First, species- or strain-dependent differences in cell wall architecture and/or EPS composition in C. dubliniensis may alter partitioning, retention, or local bioavailability of cyclic monoterpenes and phenylpropanoids relative to C. albicans, thereby shifting effective exposure to the cell surface within the biofilm matrix [44]. Second, differential membrane sterol homeostasis and growth-state biology may contribute mutations in ERG3 (sterol C5,6-desaturase) and ERG11 (lanosterol 14α-demethylase) are well-recognized mechanisms that perturb ergosterol biosynthesis and can contribute to reduced susceptibility or resistance to azole agents or functionally azole-like compounds [4,5,28]. In parallel, although C. dubliniensis can form hyphae, its filamentation kinetics and morphogenetic dynamics are frequently distinct and often slower than those of C. albicans. It is therefore plausible that the rapid filamentation program of C. albicans may be particularly vulnerable to membrane-active compounds, given that monoterpenes can disrupt membrane organization during polarized growth associated with germ-tube emergence. At sub-inhibitory concentrations, cells are not killed but may experience substantial physiological stress, and C. albicans relies on conserved stress-response signaling pathways (including the calcineurin/Crz1 pathway) to tolerate and adapt to these conditions [45].
The limited activity of lavender (RL) across taxa further underscores the requirement to exceed a “molecular threshold” to meaningfully perturb Candida homeostasis and overcome basal defense programs. Both the pure oil (L) and its RAMEB-encapsulated form (RL) consistently mapped to a tolerant/resistant-like phenotype. In the PCA landscape, lavender treatments did not displace the cellular response away from baseline, suggesting that the effective concentrations of linalool and linalyl acetate were insufficient to disrupt homeostatic function or did not produce significant inhibition under our sub-MIC conditions. Lavender formulations dominated by linalool/linalyl acetate may remain functionally sub-inhibitory under our conditions, as linalyl acetate has been reported to show comparatively low fungicidal activity against C. albicans, cyclodextrin complexation can buffer the free bioactive fraction, and Candida biofilm matrix (e.g., β-1,3-glucan/eDNA) can further sequester antimicrobials and attenuate effective exposure [46,47,48,49].
Accordingly, in the absence of strongly membrane-disruptive phenolic monoterpenes (e.g., thymol/carvacrol-like constituents) or more pronounced metabolic stressors (e.g., menthol-associated effects), lavender (L and RL) remained effectively sub-inhibitory under our assay conditions, with responses clustering near baseline and indicating that Candida can buffer or neutralize these exposures without a major shift in the measured stress/viability phenotypes.
Across treatments, our data also reveals a critical decoupling between biofilm physical structure and biological viability. Physical biofilm biomass remained robust and relatively insensitive even when cellular viability was markedly suppressed, indicating that while RAMEB-encapsulated oils particularly thyme can penetrate the EPS sufficiently to exert biocidal effects on encased yeast, they do not dismantle the underlying β-glucan and chitin-enriched scaffolding that maintains biofilm integrity [27,44,50]. Consequently, transition toward an effective “responder” phenotype appears to depend strongly on the RAMEB carrier’s capacity to maximize and to sustain the bioavailable (free) fraction of these lipophilic compounds within the biofilm environment. This formulation dependence is likely exacerbated by the intrinsic volatility and hydrophobicity of essential-oil constituents and by standard microplate assay geometry: under non-encapsulated conditions, rapid headspace loss, adsorption to plastic surfaces, and phase partitioning can reduce effective aqueous concentration over time and promote sub-inhibitory exposure gradients within the matrix [51,52,53]. Accordingly, even high-potency oils such as thyme may fail to maintain inhibitory exposure throughout the biofilm, increasing the likelihood of survivor persistence and tolerance-like phenotypes. Together, these considerations emphasize that successful Candida eradication requires both an appropriate chemical mode of action and an optimized delivery system [54,55,56,57].
Finally, the broad-spectrum profile of the RT formulation (relative to RP, RB, and RL) is consistent with cyclodextrin-mediated modulation of free-fraction exposure rather than a simple increase in total dose. Inclusion complexes of phenolic monoterpenes (e.g., thymol, carvacrol) with β-cyclodextrin derivatives exhibit measurable formation (stability) constants that shift the free (bioavailable) fraction; stronger complexation can dampen peak free concentrations while enabling a reservoir effect that sustains delivery as free molecules are depleted at the cell interface [58]. In applied systems, β-cyclodextrin encapsulation of thyme essential oil has been shown to support gradual volatile release over time, consistent with a controlled-delivery mechanism [59]. Moreover, cyclodextrins (including randomly methylated derivatives) can exert carrier-dependent biological effects on Candida biofilm formation and morphology, which should be considered when interpreting species-level responses to RAMEB formulations [60]. A key pharmacodynamic implication is that controlled release is beneficial only if the resulting concentration–time profile remains at or above effective inhibitory levels; if complexation and release kinetics generate prolonged sub-inhibitory “tails,” Candida may experience persistent non-lethal stress that promotes phenotypic adaptation (including altered metabolic/colony phenotypes under sub-MIC essential oil exposure) [61] and engages conserved stress circuitry (including Ca²⁺/calcineurin-linked responses to membrane-active monoterpenes such as carvacrol) [45]. Because antifungal tolerance (supra-MIC growth of susceptible populations) is distinct from resistance and can contribute to persistent infection [28], and because experimental evolution demonstrates that different drug concentrations can select distinct adaptive trajectories (including tolerance- versus resistance-associated outcomes) [9,28,62], an unfavorable slow-release regime could plausibly increase the probability of hormesis-like or tolerance phenotypes and under repeated exposures selection toward reduced susceptibility [8,9,62].
5. Conclusions
This study demonstrates that converting essential oils into RAMEB inclusion complexes does not yield a uniform antifungal upgrade across Candida species; rather, encapsulation produces oil family specific and species-dependent shifts in susceptibility, functional inhibition, and response phenotypes. Although oxidative-nitrosative stress responses appeared broadly conserved, the ability of each regimen to attain and maintain effective inhibitory exposure thereby suppressing planktonic growth and early biofilm viability varied substantially among formulations. Within this landscape, RT was the most consistently inhibitory regimen across endpoints, supporting its prioritization as the lead broad-spectrum candidate. In contrast, RP showed the strongest overall generalist performance but exhibited species-contingent behavior that warrants strain- and species-aware interpretation, particularly in contexts where sub-inhibitory exposure could favor persistence or tolerance-like adaptation. Collectively, these findings argue for a development pathway in which RAMEB encapsulation is optimized and benchmarked empirically for each essential-oil family and target species, advanced preferentially when it produces durable multi-endpoint inhibition, and applied cautiously when phenotypic signatures indicate weak pressure, compartmentalized biofilm effects, or adaptive/tolerance-like trajectories.
Supplementary Materials
The following supporting information can be downloaded at website of this paper posted on Preprints.org, Figure S1: Antioxidant-gene response landscape across treatments (CAT1, GPX1, SOD1); Figure S2: CRT identifies GPX1-CAT1 thresholds that separate responder vs tolerant/resistant phenotypes and shows treatment enrichment across terminal nodes (controls included); Figure S3: Global multivariate mode-of-action landscape separates stress-intensity and antioxidant-program axes across treatments and species; Table S1: Consumables used throughout the studies; Table S2: Oligonucleotide primers and amplicon sizes for quantitative real-time PCR (qPCR) analysis of Candida species genes; Table S3: Minimum inhibitory concentration (MIC90) raw data; Table S4: Minimum effective concentration (EC10) raw data; Table S4: Reactive nitrogen species (RNS) and reactive oxygen species (ROS) generation in different Candida strains; Table S5: Reduced percentage in planktonic metabolism (PMT) and viability (PVA) compared to untreated control (UC); Table S6: Reduced percentage in total biofilm biomass (BB), biofilm attached cellular metabolic activity (BMT) and viability (BVA) compared to untreated biofilm control (UBC); Table S7: Pairwise distance matrix from hierarchical clustering of treatment-induced mechanistic signatures (ROS/RNS and antioxidant gene responses); Table S8: Principal component analysis of mechanistic markers: eigenvalues and variance explained (unrotated and Varimax-rotated solutions); Table S9: Rotated component matrix (Varimax) from PCA: loading vectors of ROS/RNS and antioxidant genes; Table S10: Treatment centroids on the PCA mechanistic landscape (PC1-PC2) derived from within-species Z-standardized ROS/RNS and antioxidant gene signatures (CAT1, GPX1, SOD1).
Author Contributions
Conceptualization, F.B. and S.D.; methodology, Z.G., F.B. and S.D.; software, G.C. and S.D.; validation, T.K., Z.G., and S.D.; formal analysis, T.K and S.D.; investigation, A.S.Sz., G.C., and F.B.; resources, T.K., Z.G., and A.S.; data curation, G.C., F.B. and S.D.; writing—original draft preparation, S.D.; writing—review and editing, A.S.Sz., G.C., F.B. and S.D.; visualization, S.D.; supervision, T.K. Z.G. and S.D.; project administration, T.K, A.M. and G.L.K.; funding acquisition, S.D.
Funding
This research was funded by National Research, Development and Innovation Office “NKFI ÚNKP-23-4-II-PTE-1742” and University of Pécs Rector’s Scientific Fund “008_2025_PTE_RK/28”.
Institutional Review Board Statement
Not applicable.
Informed Consent Statement
Not applicable.
Data Availability Statement
The data presented in this study are available in the supplementary materials.
Acknowledgments
During the preparation of this manuscript, MEGA-GPT and Scopus AI were used for data exploration and collection. The authors have reviewed and edited the output and take full responsibility for the content of this publication.
Conflicts of Interest
The authors declare no conflicts of interest.
Abbreviations
The following abbreviations were used in this manuscript:
| %GC | guanine-cytosine percentage content |
| AM | amphotericin B |
| AUC | area under curve |
| B | lemon balm essential oil |
| BB | biofilm biomass |
| BC | background control |
| BMT | biofilm attached cellular metabolic activity |
| BVA | biofilm attached cellular viability |
| Ca | Candida albicans |
| Cap1 | adenylate cyclase-associated proteins |
| CAT1 | catalase A |
| Cd | Candida dubliniensis |
| CFU | colony forming unit |
| CI | confidence interval |
| Ck | Candida krusei |
| CRT | classification and regression tree |
| Ct | Candida tropicalis |
| CTA4 | cation-transporting P-type ATPase |
| CV | crystal violet |
| DC | dilution control |
| EC10 | minimum effective concentration (10%) |
| EMMeans | estimated marginal means |
| EO | essential oil |
| FL | fluconazole |
| FWER | family-wise error rate |
| GC | growth control |
| GPX1 | glutathione peroxidase 1 |
| Hog1 | high osmolarity glycerol |
| In-PMT | Inverse planktonic metabolic activity |
| KMO | Kaiser-Meyer-Olkin test |
| L | lavender essential oil |
| MAPK | mitogen-activated protein kinase |
| MIC90 | minimum inhibitory concentration (90%) |
| ML | machine learning |
| MN | menadione |
| MoA | mechanism of action |
| NAC | non-albicans Candida |
| NC | background noise control |
| OC | oxidative control |
| P | peppermint essential oil |
| PC | principal component analysis |
| PMT | planktonic metabolic activity |
| PVA | planktonic viability |
| RAMEB | randomly methylated beta cyclodextrin |
| RB | RAMEB encapsulated lemon balm essential oil |
| RC | antibiotic reference controls |
| REML | restricted maximum likelihood |
| REO | RAMEB encapsulated essential oil |
| RL | RAMEB encapsulated lavender essential oil |
| RNS | reactive nitrogen species |
| ROS | reactive oxygen species |
| RP | RAMEB encapsulated peppermint essential oil |
| RT | RAMEB encapsulated thyme essential oil |
| SC | sterility control |
| SOD1 | superoxide dismutase 1 |
| T | thyme essential oil |
| TS | test samples/treatments |
| UBC | untreated biofilm control |
| UBC | untreated biofilm control |
| UC | untreated control |
References
- Pappas, P.G.; Kauffman, C.A.; Andes, D.R.; Clancy, C.J.; Marr, K.A.; Ostrosky-Zeichner, L.; Reboli, A.C.; Schuster, M.G.; Vazquez, J.A.; Walsh, T.J.; et al. Clinical Practice Guideline for the Management of Candidiasis: 2016 Update by the Infectious Diseases Society of America. Clinical Infectious Diseases 2016, 62, e1–e50. [Google Scholar] [CrossRef] [PubMed]
- Kullberg, B.J.; Arendrup, M.C. Invasive Candidiasis. N Engl J Med 2015, 373, 1445–1456. [Google Scholar] [CrossRef] [PubMed]
- Pfaller, M.A.; Diekema, D.J. Epidemiology of Invasive Candidiasis: A Persistent Public Health Problem. Clin Microbiol Rev 2007, 20, 133–163. [Google Scholar] [CrossRef] [PubMed]
- Orozco, A.S.; Higginbotham, L.M.; Hitchcock, C.A.; Parkinson, T.; Falconer, D.; Ibrahim, A.S.; Ghannoum, M.A.; Filler, S.G. Mechanism of Fluconazole Resistance in Candida Krusei. Antimicrob Agents Chemother 1998, 42, 2645–2649. [Google Scholar] [CrossRef]
- Whaley, S.G.; Berkow, E.L.; Rybak, J.M.; Nishimoto, A.T.; Barker, K.S.; Rogers, P.D. Azole Antifungal Resistance in Candida Albicans and Emerging Non-Albicans Candida Species. Front. Microbiol. 2017, 7. [Google Scholar] [CrossRef]
- Borman, A.M.; Szekely, A.; Linton, C.J.; Palmer, M.D.; Brown, P.; Johnson, E.M. Epidemiology, Antifungal Susceptibility, and Pathogenicity of Candida Africana Isolates from the United Kingdom. J Clin Microbiol 2013, 51, 967–972. [Google Scholar] [CrossRef]
- Stefanovic, O.; Comic, L.; Stanojevic, D.; Sukdolak, S.S. Antibacterial Activity of Aegopodium Podagraria L. Extracts and Interaction Between Extracts and Antibiotics. Turkish Journal of Biology 2009. [Google Scholar] [CrossRef]
- Rosenberg, A.; Ene, I.V.; Bibi, M.; Zakin, S.; Segal, E.S.; Ziv, N.; Dahan, A.M.; Colombo, A.L.; Bennett, R.J.; Berman, J. Antifungal Tolerance Is a Subpopulation Effect Distinct from Resistance and Is Associated with Persistent Candidemia. Nat Commun 2018, 9, 2470. [Google Scholar] [CrossRef]
- Berman, J.; Krysan, D.J. Drug Resistance and Tolerance in Fungi. Nat Rev Microbiol 2020, 18, 319–331. [Google Scholar] [CrossRef]
- Bakkali, F.; Averbeck, S.; Averbeck, D.; Idaomar, M. Biological Effects of Essential Oils – A Review. Food and Chemical Toxicology 2008, 46, 446–475. [Google Scholar] [CrossRef]
- Burt, S. Essential Oils: Their Antibacterial Properties and Potential Applications in Foods—a Review. International Journal of Food Microbiology 2004, 94, 223–253. [Google Scholar] [CrossRef] [PubMed]
- Jafri, H.; Ahmad, I. Thymus Vulgaris Essential Oil and Thymol Inhibit Biofilms and Interact Synergistically with Antifungal Drugs against Drug Resistant Strains of Candida Albicans and Candida Tropicalis. Journal de Mycologie Médicale 2020, 30, 100911. [Google Scholar] [CrossRef] [PubMed]
- Serra, E.; Saubade, F.; Ligorio, C.; Whitehead, K.; Sloan, A.; Williams, D.W.; Hidalgo-Bastida, A.; Verran, J.; Malic, S. Methylcellulose Hydrogel with Melissa Officinalis Essential Oil as a Potential Treatment for Oral Candidiasis. Microorganisms 2020, 8, 215. [Google Scholar] [CrossRef] [PubMed]
- Abdellatif, F.; Boudjella, H.; Zitouni, A.; Hassani, A. Chemical Composition And Antimicrobial Activity Of The Essential Oil From Leaves Of Algerian Melissa Officinalis L. EXCLI Journal 2014. [Google Scholar]
- Karpiński, T.M.; Ożarowski, M.; Seremak-Mrozikiewicz, A.; Wolski, H. Anti-Candida and Antibiofilm Activity of Selected Lamiaceae Essential Oils. Front. Biosci. (Landmark Ed) 2023, 28, 28. [Google Scholar] [CrossRef]
- Samperio, C.; Boyer, R.; Eigel, W.N.; Holland, K.W.; McKinney, J.S.; O’Keefe, S.F.; Smith, R.; Marcy, J.E. Enhancement of Plant Essential Oils’ Aqueous Solubility and Stability Using Alpha and Beta Cyclodextrin. J. Agric. Food Chem. 2010, 58, 12950–12956. [Google Scholar] [CrossRef]
- Brewster, M.E.; Loftsson, T. Cyclodextrins as Pharmaceutical Solubilizers. Advanced Drug Delivery Reviews 2007, 59, 645–666. [Google Scholar] [CrossRef]
- Szejtli, J. Introduction and General Overview of Cyclodextrin Chemistry. Chem. Rev. 1998, 98, 1743–1754. [Google Scholar] [CrossRef]
- Mura, P. Analytical Techniques for Characterization of Cyclodextrin Complexes in the Solid State: A Review. Journal of Pharmaceutical and Biomedical Analysis 2015, 113, 226–238. [Google Scholar] [CrossRef]
- Liang, H.; Yuan, Q.; Vriesekoop, F.; Lv, F. Effects of Cyclodextrins on the Antimicrobial Activity of Plant-Derived Essential Oil Compounds. Food Chemistry 2012, 135, 1020–1027. [Google Scholar] [CrossRef]
- Hill, L.E.; Gomes, C.; Taylor, T.M. Characterization of Beta-Cyclodextrin Inclusion Complexes Containing Essential Oils (Trans-Cinnamaldehyde, Eugenol, Cinnamon Bark, and Clove Bud Extracts) for Antimicrobial Delivery Applications. LWT - Food Science and Technology 2013, 51, 86–93. [Google Scholar] [CrossRef]
- Marques, C.S.; Carvalho, S.G.; Bertoli, L.D.; Villanova, J.C.O.; Pinheiro, P.F.; Dos Santos, D.C.M.; Yoshida, M.I.; De Freitas, J.C.C.; Cipriano, D.F.; Bernardes, P.C. β-Cyclodextrin Inclusion Complexes with Essential Oils: Obtention, Characterization, Antimicrobial Activity and Potential Application for Food Preservative Sachets. Food Research International 2019, 119, 499–509. [Google Scholar] [CrossRef] [PubMed]
- Hromatka, B.S.; Noble, S.M.; Johnson, A.D. Transcriptional Response of Candida Albicans to Nitric Oxide and the Role of the YHB1 Gene in Nitrosative Stress and Virulence. Mol Biol Cell 2005, 16, 4814–4826. [Google Scholar] [CrossRef] [PubMed]
- Dantas, A.; Day, A.; Ikeh, M.; Kos, I.; Achan, B.; Quinn, J. Oxidative Stress Responses in the Human Fungal Pathogen, Candida Albicans. Biomolecules 2015, 5, 142–165. [Google Scholar] [CrossRef] [PubMed]
- Beyer, R.; Zangl, I.; Seidl, B.; Pap, I.-J.; Lackner, M.; Strauss, J.; Willinger, B.; Schüller, C. Distinct Properties of Human Pathogenic Candida Species Revealed by Systematic Comparative Phenotypic Screening of Clinical Isolates. mSystems 2025, e00786-25. [Google Scholar] [CrossRef]
- Kong, W.-J.; Zhao, Y.-L.; Xiao, X.-H.; Li, Z.-L.; Jin, C.; Li, H.-B. Investigation of the Anti-Fungal Activity of Coptisine on Candida Albicans Growth by Microcalorimetry Combined with Principal Component Analysis: The Anti-Fungal Activity of Coptisine on C. Albicans Growth. Journal of Applied Microbiology 2009, 107, 1072–1080. [Google Scholar] [CrossRef]
- Li, P.; Seneviratne, C.J.; Alpi, E.; Vizcaino, J.A.; Jin, L. Delicate Metabolic Control and Coordinated Stress Response Critically Determine Antifungal Tolerance of Candida Albicans Biofilm Persisters. Antimicrob Agents Chemother 2015, 59, 6101–6112. [Google Scholar] [CrossRef]
- Yang, F.; Scopel, E.F.C.; Li, H.; Sun, L.; Kawar, N.; Cao, Y.; Jiang, Y.-Y.; Berman, J. Antifungal Tolerance and Resistance Emerge at Distinct Drug Concentrations and Rely upon Different Aneuploid Chromosomes. mBio 2023, 14, e00227-23. [Google Scholar] [CrossRef]
- Cornely, O.A.; Sprute, R.; Bassetti, M.; Chen, S.C.-A.; Groll, A.H.; Kurzai, O.; Lass-Flörl, C.; Ostrosky-Zeichner, L.; Rautemaa-Richardson, R.; Revathi, G.; et al. Global Guideline for the Diagnosis and Management of Candidiasis: An Initiative of the ECMM in Cooperation with ISHAM and ASM. The Lancet Infectious Diseases 2025, 25, e280–e293. [Google Scholar] [CrossRef]
- Dumeaux, V.; Massahi, S.; Bettauer, V.; Mottola, A.; Dukovny, A.; Khurdia, S.S.; Costa, A.C.B.P.; Omran, R.P.; Simpson, S.; Xie, J.L.; et al. Candida Albicans Exhibits Heterogeneous and Adaptive Cytoprotective Responses to Antifungal Compounds. eLife 2023, 12, e81406. [Google Scholar] [CrossRef]
- Das; Horváth; Šafranko; Jokić; Széchenyi; Kőszegi. Antimicrobial Activity of Chamomile Essential Oil: Effect of Different Formulations. Molecules 2019, 24, 4321. [Google Scholar] [CrossRef]
- Bouchelaghem, S.; Das, S.; Naorem, R.S.; Czuni, L.; Papp, G.; Kocsis, M. Evaluation of Total Phenolic and Flavonoid Contents, Antibacterial and Antibiofilm Activities of Hungarian Propolis Ethanolic Extract against Staphylococcus Aureus. Molecules 2022, 27, 574. [Google Scholar] [CrossRef] [PubMed]
- Das, S.; Gazdag, Z.; Szente, L.; Meggyes, M.; Horváth, G.; Lemli, B.; Kunsági-Máté, S.; Kuzma, M.; Kőszegi, T. Antioxidant and Antimicrobial Properties of Randomly Methylated β Cyclodextrin – Captured Essential Oils. Food Chemistry 2019, 278, 305–313. [Google Scholar] [CrossRef] [PubMed]
- Das, S.; Vörös-Horváth, B.; Bencsik, T.; Micalizzi, G.; Mondello, L.; Horváth, G.; Kőszegi, T.; Széchenyi, A. Antimicrobial Activity of Different Artemisia Essential Oil Formulations. Molecules 2020, 25, 2390. [Google Scholar] [CrossRef] [PubMed]
- Das, S.; Czuni, L.; Báló, V.; Papp, G.; Gazdag, Z.; Papp, N.; Kőszegi, T. Cytotoxic Action of Artemisinin and Scopoletin on Planktonic Forms and on Biofilms of Candida Species. Molecules 2020, 25, 476. [Google Scholar] [CrossRef]
- Ločárek, M.; Nováková, J.; Klouček, P.; Hošt’álková, A.; Kokoška, L.; Gábrlová, L.; Šafratová, M.; Opletal, L.; Cahlíková, L. Antifungal and Antibacterial Activity of Extracts and Alkaloids of Selected Amaryllidaceae Species. Natural Product Communications 2015, 10, 1934578X1501000912. [Google Scholar] [CrossRef]
- Sayers, E.W.; Beck, J.; Bolton, E.E.; Brister, J.R.; Chan, J.; Connor, R.; Feldgarden, M.; Fine, A.M.; Funk, K.; Hoffman, J.; et al. Database Resources of the National Center for Biotechnology Information in 2025. Nucleic Acids Research 2025, 53, D20–D29. [Google Scholar] [CrossRef]
- Kumar, S.; Stecher, G.; Tamura, K. MEGA7: Molecular Evolutionary Genetics Analysis Version 7.0 for Bigger Datasets. Molecular Biology and Evolution 2016, 33, 1870–1874. [Google Scholar] [CrossRef]
- Ye, J.; Coulouris, G.; Zaretskaya, I.; Cutcutache, I.; Rozen, S.; Madden, T.L. Primer-BLAST: A Tool to Design Target-Specific Primers for Polymerase Chain Reaction. BMC Bioinformatics 2012, 13, 134. [Google Scholar] [CrossRef]
- Lyu, X.; Peng, K.; Han, Z.; Li, H.; Chen, X.; Gao, S.; Tie, Y.; Gao, Y.; Wang, Y.; Wang, J.; et al. Dual One-Step Recombinase-Aided PCR for Rapid Detection of Candida in Blood. Appl Microbiol Biotechnol 2025, 109, 70. [Google Scholar] [CrossRef]
- He, H.; Wang, Y.; Fan, Y.; Li, C.; Han, J. Hypha Essential Genes in Candida Albicans Pathogenesis of Oral Lichen Planus: An in-Vitro Study. BMC Oral Health 2021, 21, 614. [Google Scholar] [CrossRef] [PubMed]
- Zhang, Y.; Chen, X.; Zhong, Y.; Guo, F.; Ouyang, G.; Mao, R. Rapid and Simple Detection of Candida Albicans Using Closed Dumbbell-Mediated Isothermal Amplification. Front. Cell. Infect. Microbiol. 2025, 15, 1484089. [Google Scholar] [CrossRef] [PubMed]
- He, Z.; Huo, X.; Piao, J. Rapid Preparation of Candida Genomic DNA: Combined Use of Enzymatic Digestion and Thermal Disruption. AMB Expr 2023, 13, 1. [Google Scholar] [CrossRef] [PubMed]
- Ayadi, R.; Sitterlé, E.; d’Enfert, C.; Dannaoui, E.; Bougnoux, M.-E. Candida Albicans and Candida Dubliniensis Show Different Trailing Effect Patterns When Exposed to Echinocandins and Azoles. Front. Microbiol. 2020, 11, 1286. [Google Scholar] [CrossRef]
- Niu, C.; Wang, C.; Yang, Y.; Chen, R.; Zhang, J.; Chen, H.; Zhuge, Y.; Li, J.; Cheng, J.; Xu, K.; et al. Carvacrol Induces Candida Albicans Apoptosis Associated With Ca2+/Calcineurin Pathway. Front. Cell. Infect. Microbiol. 2020, 10, 192. [Google Scholar] [CrossRef]
- Ciobanu, A.; Mallard, I.; Landy, D.; Brabie, G.; Nistor, D.; Fourmentin, S. Inclusion Interactions of Cyclodextrins and Crosslinked Cyclodextrin Polymers with Linalool and Camphor in Lavandula Angustifolia Essential Oil. Carbohydrate Polymers 2012, 87, 1963–1970. [Google Scholar] [CrossRef]
- Nett, J.; Lincoln, L.; Marchillo, K.; Massey, R.; Holoyda, K.; Hoff, B.; VanHandel, M.; Andes, D. Putative Role of β-1,3 Glucans in Candida Albicans Biofilm Resistance. Antimicrob Agents Chemother 2007, 51, 510–520. [Google Scholar] [CrossRef]
- Martins, M.; Uppuluri, P.; Thomas, D.P.; Cleary, I.A.; Henriques, M.; Lopez-Ribot, J.L.; Oliveira, R. Presence of Extracellular DNA in the Candida Albicans Biofilm Matrix and Its Contribution to Biofilms. Mycopathologia 2010, 169, 323–331. [Google Scholar] [CrossRef]
- Pierce, C.; Vila, T.; Romo, J.; Montelongo-Jauregui, D.; Wall, G.; Ramasubramanian, A.; Lopez-Ribot, J. The Candida Albicans Biofilm Matrix: Composition, Structure and Function. JoF 2017, 3, 14. [Google Scholar] [CrossRef]
- Husain, F.M.; Ahmad, I.; Khan, M.S.; Ahmad, E.; Tahseen, Q.; Khan, M.S.; Alshabib, N.A. Sub-MICs of Mentha Piperita Essential Oil and Menthol Inhibits AHL Mediated Quorum Sensing and Biofilm of Gram-Negative Bacteria. Front. Microbiol. 2015, 6. [Google Scholar] [CrossRef]
- Blainey, P.; Krzywinski, M.; Altman, N. Replication. Nat Methods 2014, 11, 879–880. [Google Scholar] [CrossRef]
- Hulankova, R. Methods for Determination of Antimicrobial Activity of Essential Oils In Vitro—A Review. Plants 2024, 13, 2784. [Google Scholar] [CrossRef]
- Mandras, N.; Nostro, A.; Roana, J.; Scalas, D.; Banche, G.; Ghisetti, V.; Del Re, S.; Fucale, G.; Cuffini, A.M.; Tullio, V. Liquid and Vapour-Phase Antifungal Activities of Essential Oils against Candida Albicans and Non-Albicans Candida. BMC Complement Altern Med 2016, 16, 330. [Google Scholar] [CrossRef]
- Kfoury, M.; Landy, D.; Fourmentin, S. Characterization of Cyclodextrin/Volatile Inclusion Complexes: A Review. Molecules 2018, 23, 1204. [Google Scholar] [CrossRef] [PubMed]
- Ciobanu, A.; Landy, D.; Fourmentin, S. Complexation Efficiency of Cyclodextrins for Volatile Flavor Compounds. Food Research International 2013, 53, 110–114. [Google Scholar] [CrossRef]
- Cavanagh, H.M.A. Antifungal Activity of the Volatile Phase of Essential Oils: A Brief Review. Natural Product Communications 2007, 2, 1934578X0700201222. [Google Scholar] [CrossRef]
- Suhr, K.I.; Nielsen, P.V. Antifungal Activity of Essential Oils Evaluated by Two Different Application Techniques against Rye Bread Spoilage Fungi. J Appl Microbiol 2003, 94, 665–674. [Google Scholar] [CrossRef] [PubMed]
- Kfoury, M.; Landy, D.; Ruellan, S.; Auezova, L.; Greige-Gerges, H.; Fourmentin, S. Determination of Formation Constants and Structural Characterization of Cyclodextrin Inclusion Complexes with Two Phenolic Isomers: Carvacrol and Thymol. Beilstein J. Org. Chem. 2016, 12, 29–42. [Google Scholar] [CrossRef]
- Lanciu Dorofte, A.; Dima, C.; Ceoromila, A.; Botezatu, A.; Dinica, R.; Bleoanca, I.; Borda, D. Controlled Release of β-CD-Encapsulated Thyme Essential Oil from Whey Protein Edible Packaging. Coatings 2023, 13, 508. [Google Scholar] [CrossRef]
- Márton, R.; Fenyvesi, É.; Szente, L.; Kese, I.; Molnár, M. Impact of Randomly Methylated Cyclodextrins on Candida Albicans: Biofilm Formation, Morphogenesis and Oxidative Stress. Period. Polytech. Chem. Eng. 2025, 69, 501–509. [Google Scholar] [CrossRef]
- Rajkowska, K.; Otlewska, A.; Kunicka-Styczyńska, A.; Krajewska, A. Candida Albicans Impairments Induced by Peppermint and Clove Oils at Sub-Inhibitory Concentrations. IJMS 2017, 18, 1307. [Google Scholar] [CrossRef]
- Todd, R.T.; Soisangwan, N.; Peters, S.; Kemp, B.; Crooks, T.; Gerstein, A.; Selmecki, A. Antifungal Drug Concentration Impacts the Spectrum of Adaptive Mutations in Candida Albicans. Molecular Biology and Evolution 2023, 40, msad009. [Google Scholar] [CrossRef]
Figure 1.
Species-level susceptibility thresholds (MIC90 and EC10) across Candida species for native EO and RAMEB-EO formulations. (A) MIC90 and (B) EC10 values for the native EO condition; (C) MIC90 and (D) EC10 values for the corresponding RAMEB-EO (REO) condition, shown across the four species groups: Ca (red: C. albicans), Ct (blue: C. tropicalis), Ck (yellow: C. krusei), and Cd (green: C. dubliniensis). Boxplots summarize the distribution within each species (median line with interquartile range), with mean-based overlays shown as indicated in the legend (mean marker; mean ± 1 SE; mean ± 95% CI). Horizontal brackets denote statistically significant between-species differences for the given endpoint/formulation (multiple-comparison-adjusted pairwise contrasts); significance levels are indicated as ** (p < .001) on the plot.
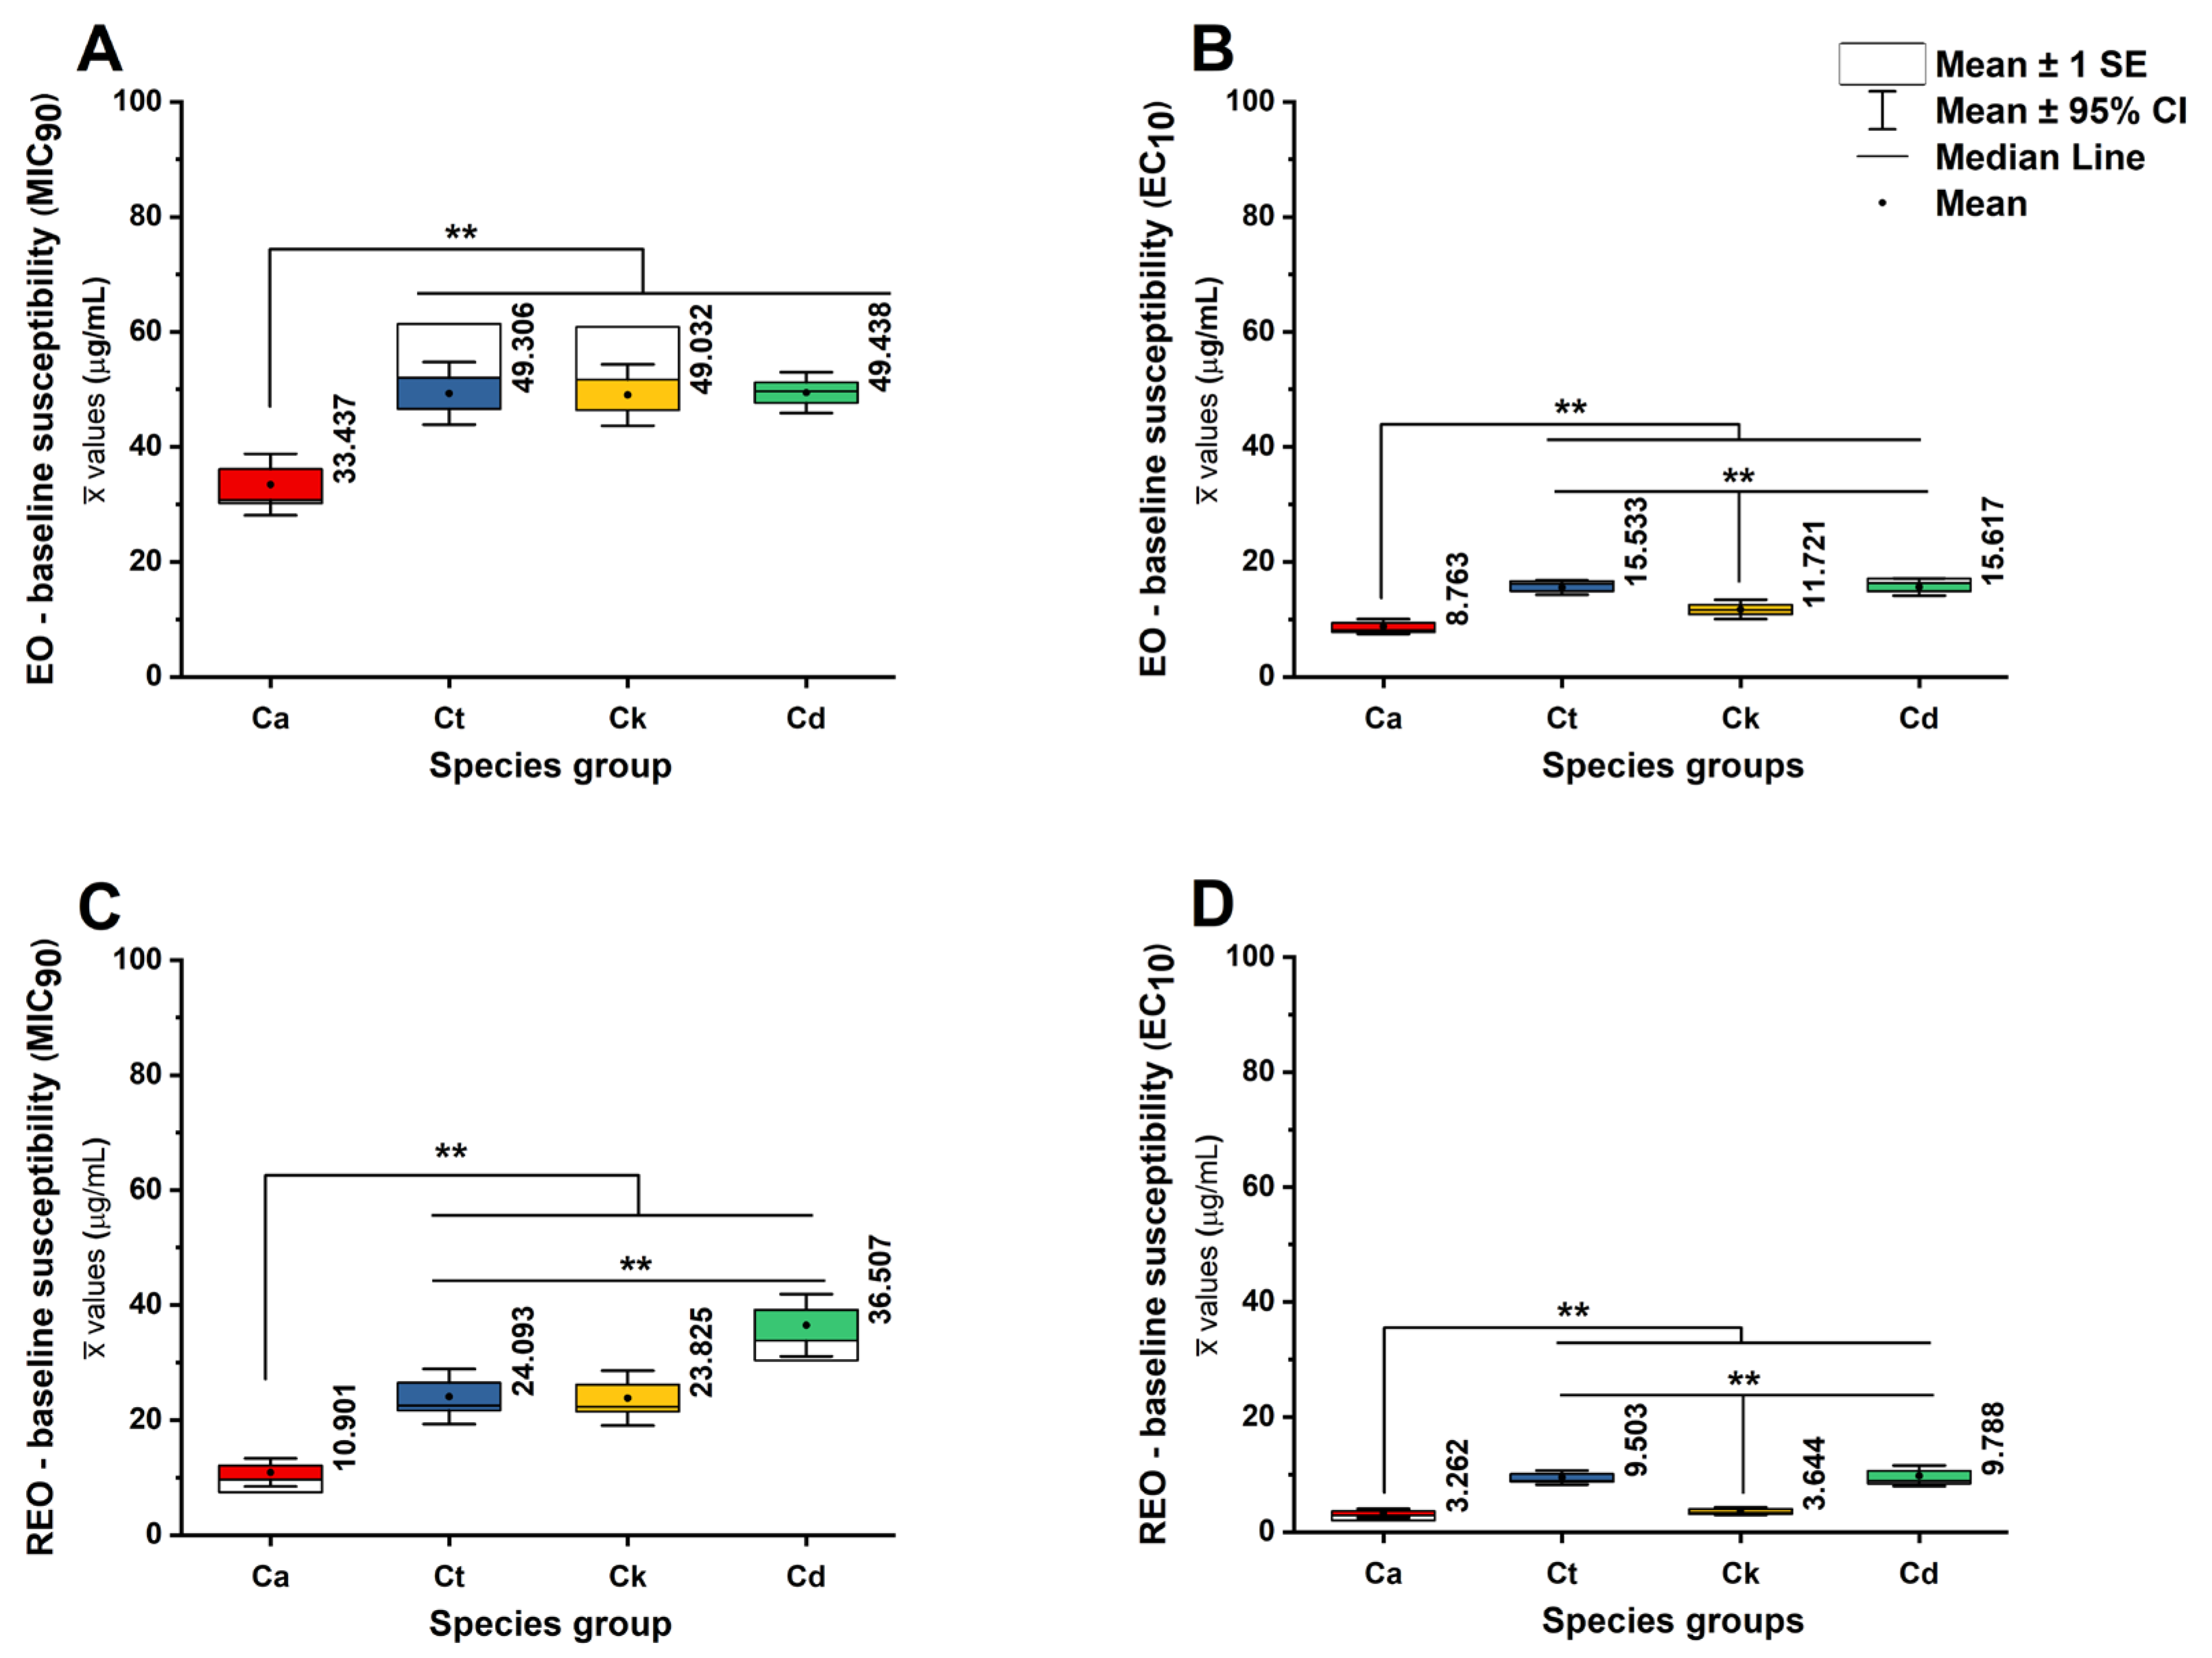
Figure 2.
The MIC90-EC10 phase plasticity landscape highlights species- and formulation-dependent separation between inhibitory and sub-inhibitory regimes. (A) Two-dimensional susceptibility map plotting MIC90 (y-axis) against EC10 (x-axis) for all strain–treatment observations. Points are colored by treatment (legend) and grouped by species (Ca, Ct, Ck, Cd). Grey dashed guides/boxes indicate the within-species spread of MIC90-EC10 coordinates, emphasizing differences in susceptibility dispersion (plasticity) among species. (B) Distribution and geometry of the phase plasticity window, defined as the separation between EC10 and MIC90. The boxplot summarizes the overall distribution of MIC90-EC10 separation (Δs = EC10 - MIC90; top), and the scatter shows MIC90 vs EC10 colored by formulation class (RC: antifungal reference controls vs native EO vs REO: RAMEB-EO), illustrating how formulation shifts points within the MIC-EC plane. Marginal boxplots (right/top) summarize axis-wise distributions. Larger EC10-MIC90 separation indicates a broader sub-inhibitory window (greater phase plasticity), whereas tighter coupling suggests a narrower transition from partial effect to near-complete inhibition.
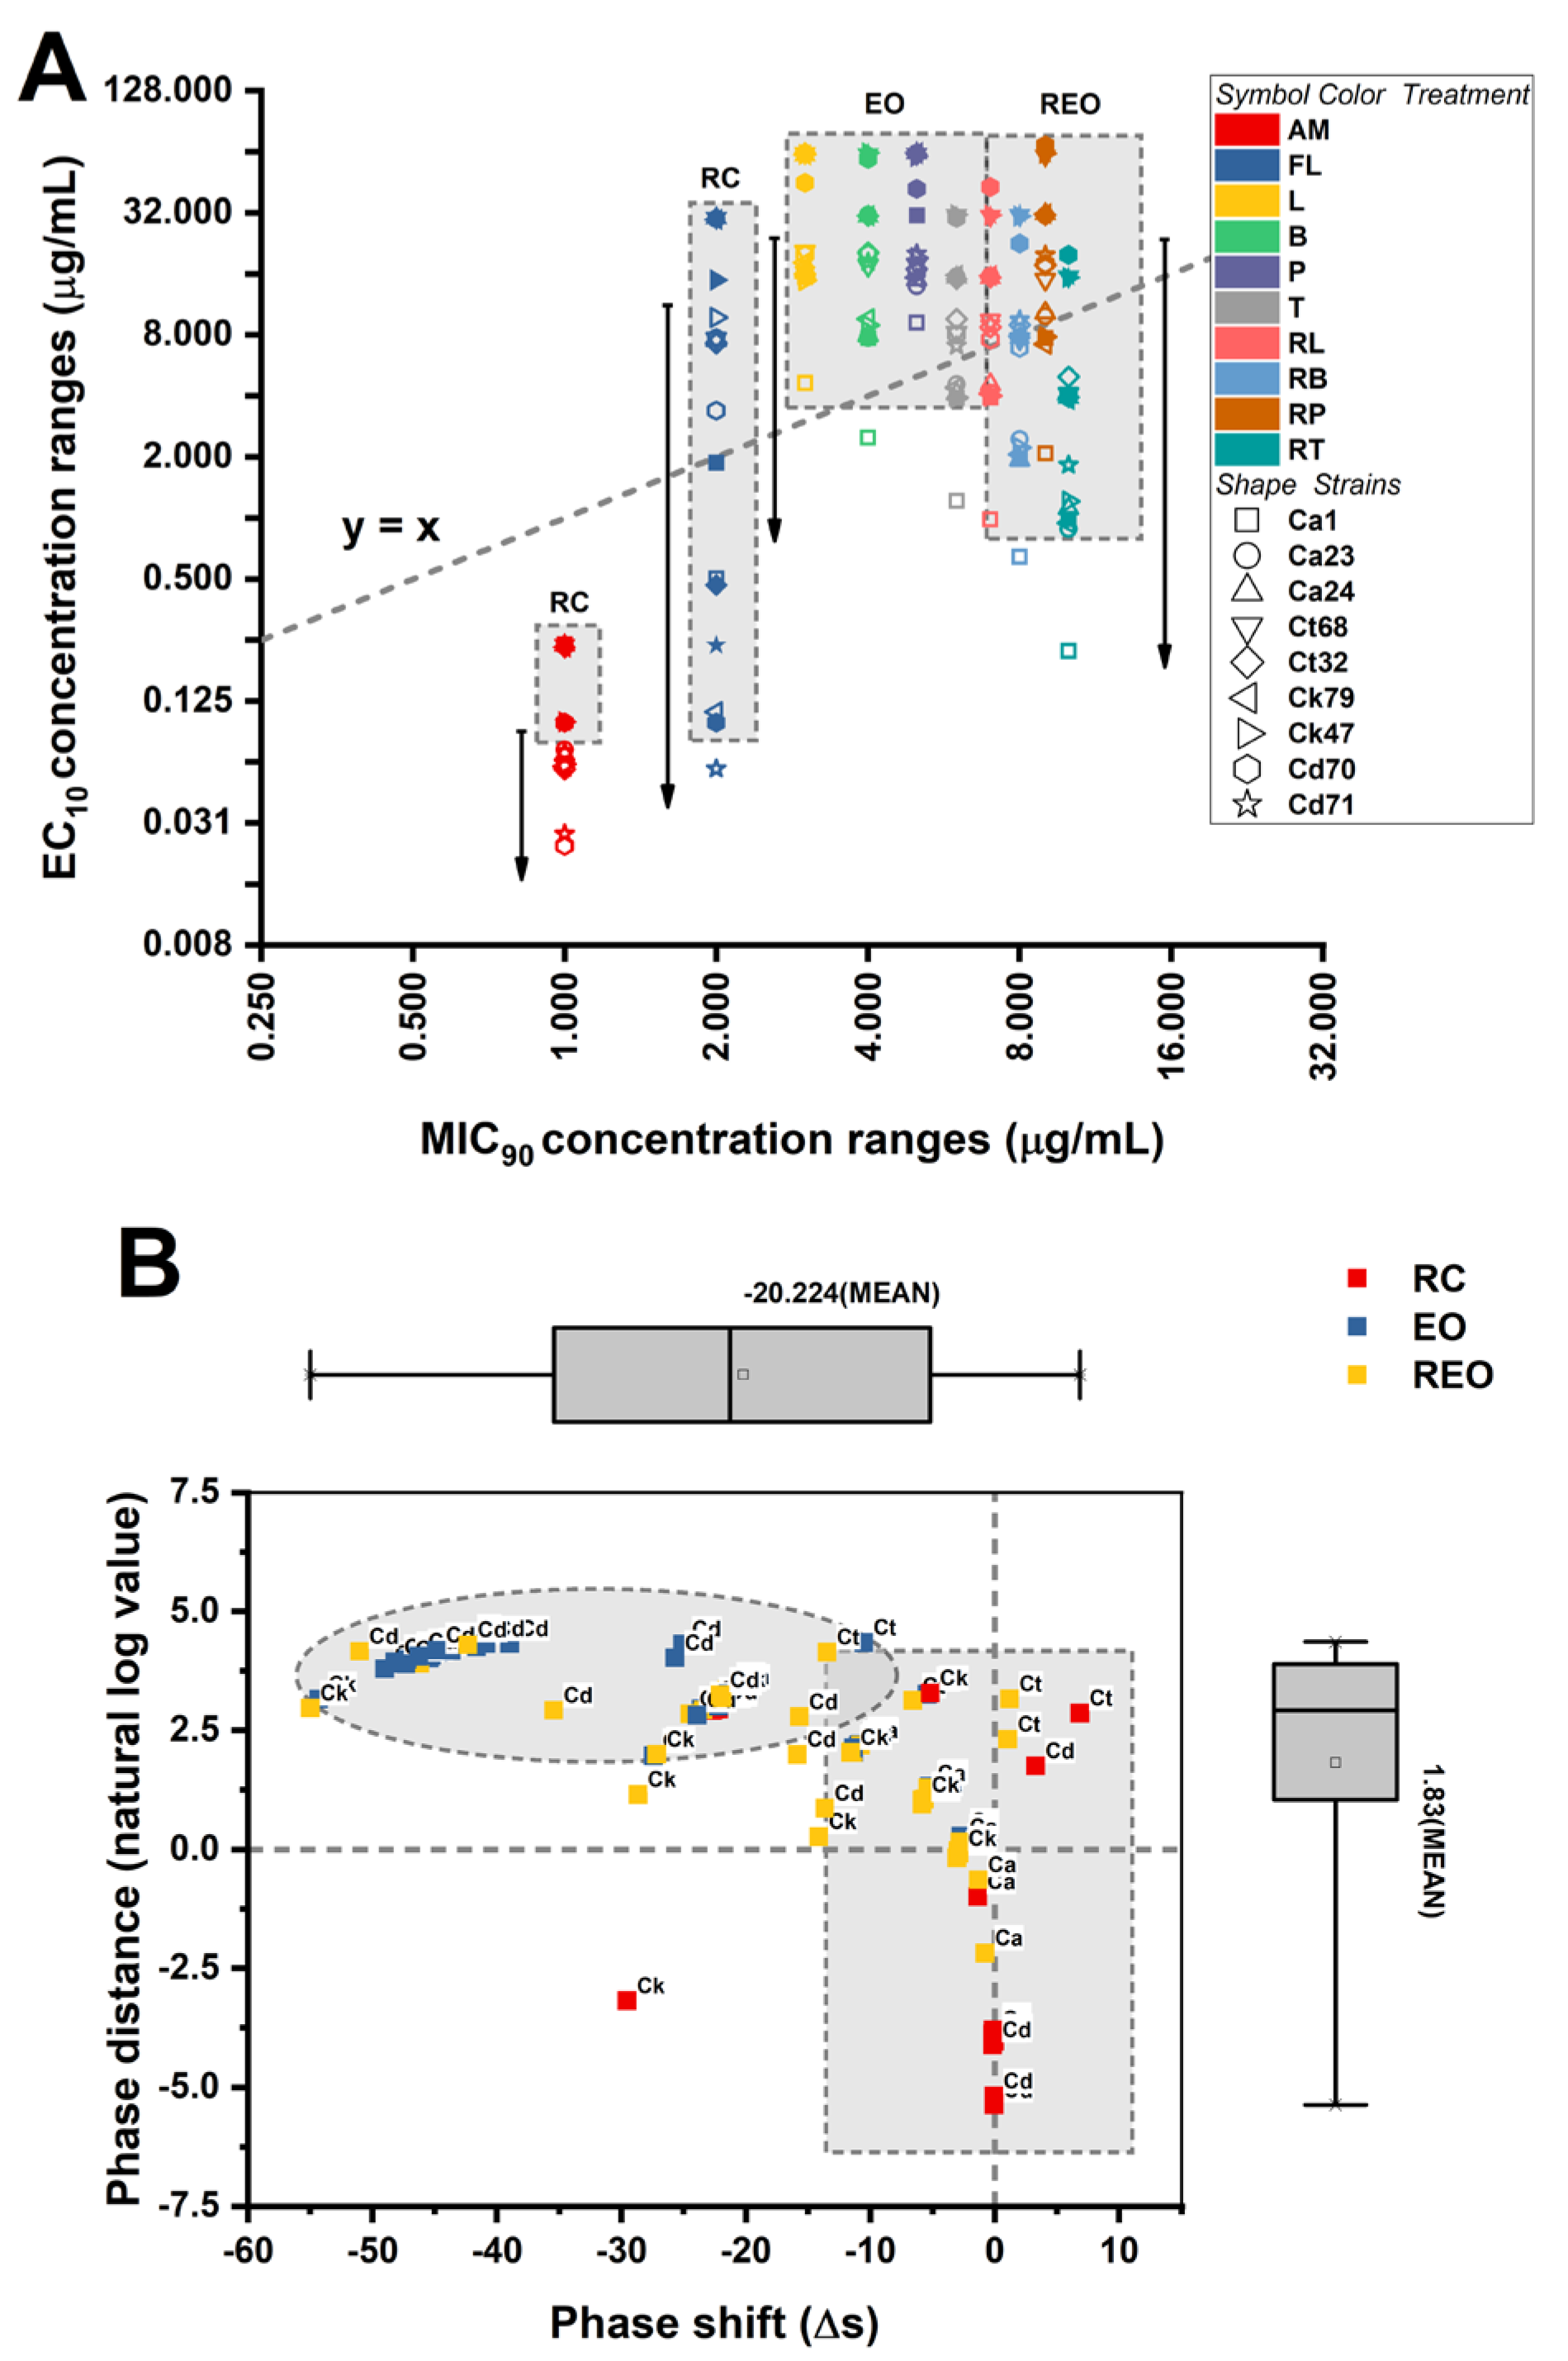
Figure 3.
Species-stratified survival (CFU) responses to essential oils and RAMEB–EO complexes. Estimated marginal means (EMMeans ± SE) of CFU (species-wise Z-transformed) from linear mixed models are shown for each treatment (L, B, P, T and their RAMEB-complexed counterparts RL, RB, RP, RT). Rows correspond to Candida species (red: Ca; blue: Ct; yellow: Ck; and green: Cd). The horizontal dashed line indicates the within-species reference level (Z = 0). Negative EMMeans reflect reduced CFU (greater survival suppression) relative to the species baseline, whereas positive values indicate comparatively higher CFU. This visualization emphasizes species dependence and formulation-dependent shifts (EO vs RAMEB–EO) in survival outcomes across the treatment panel (non-significant data).
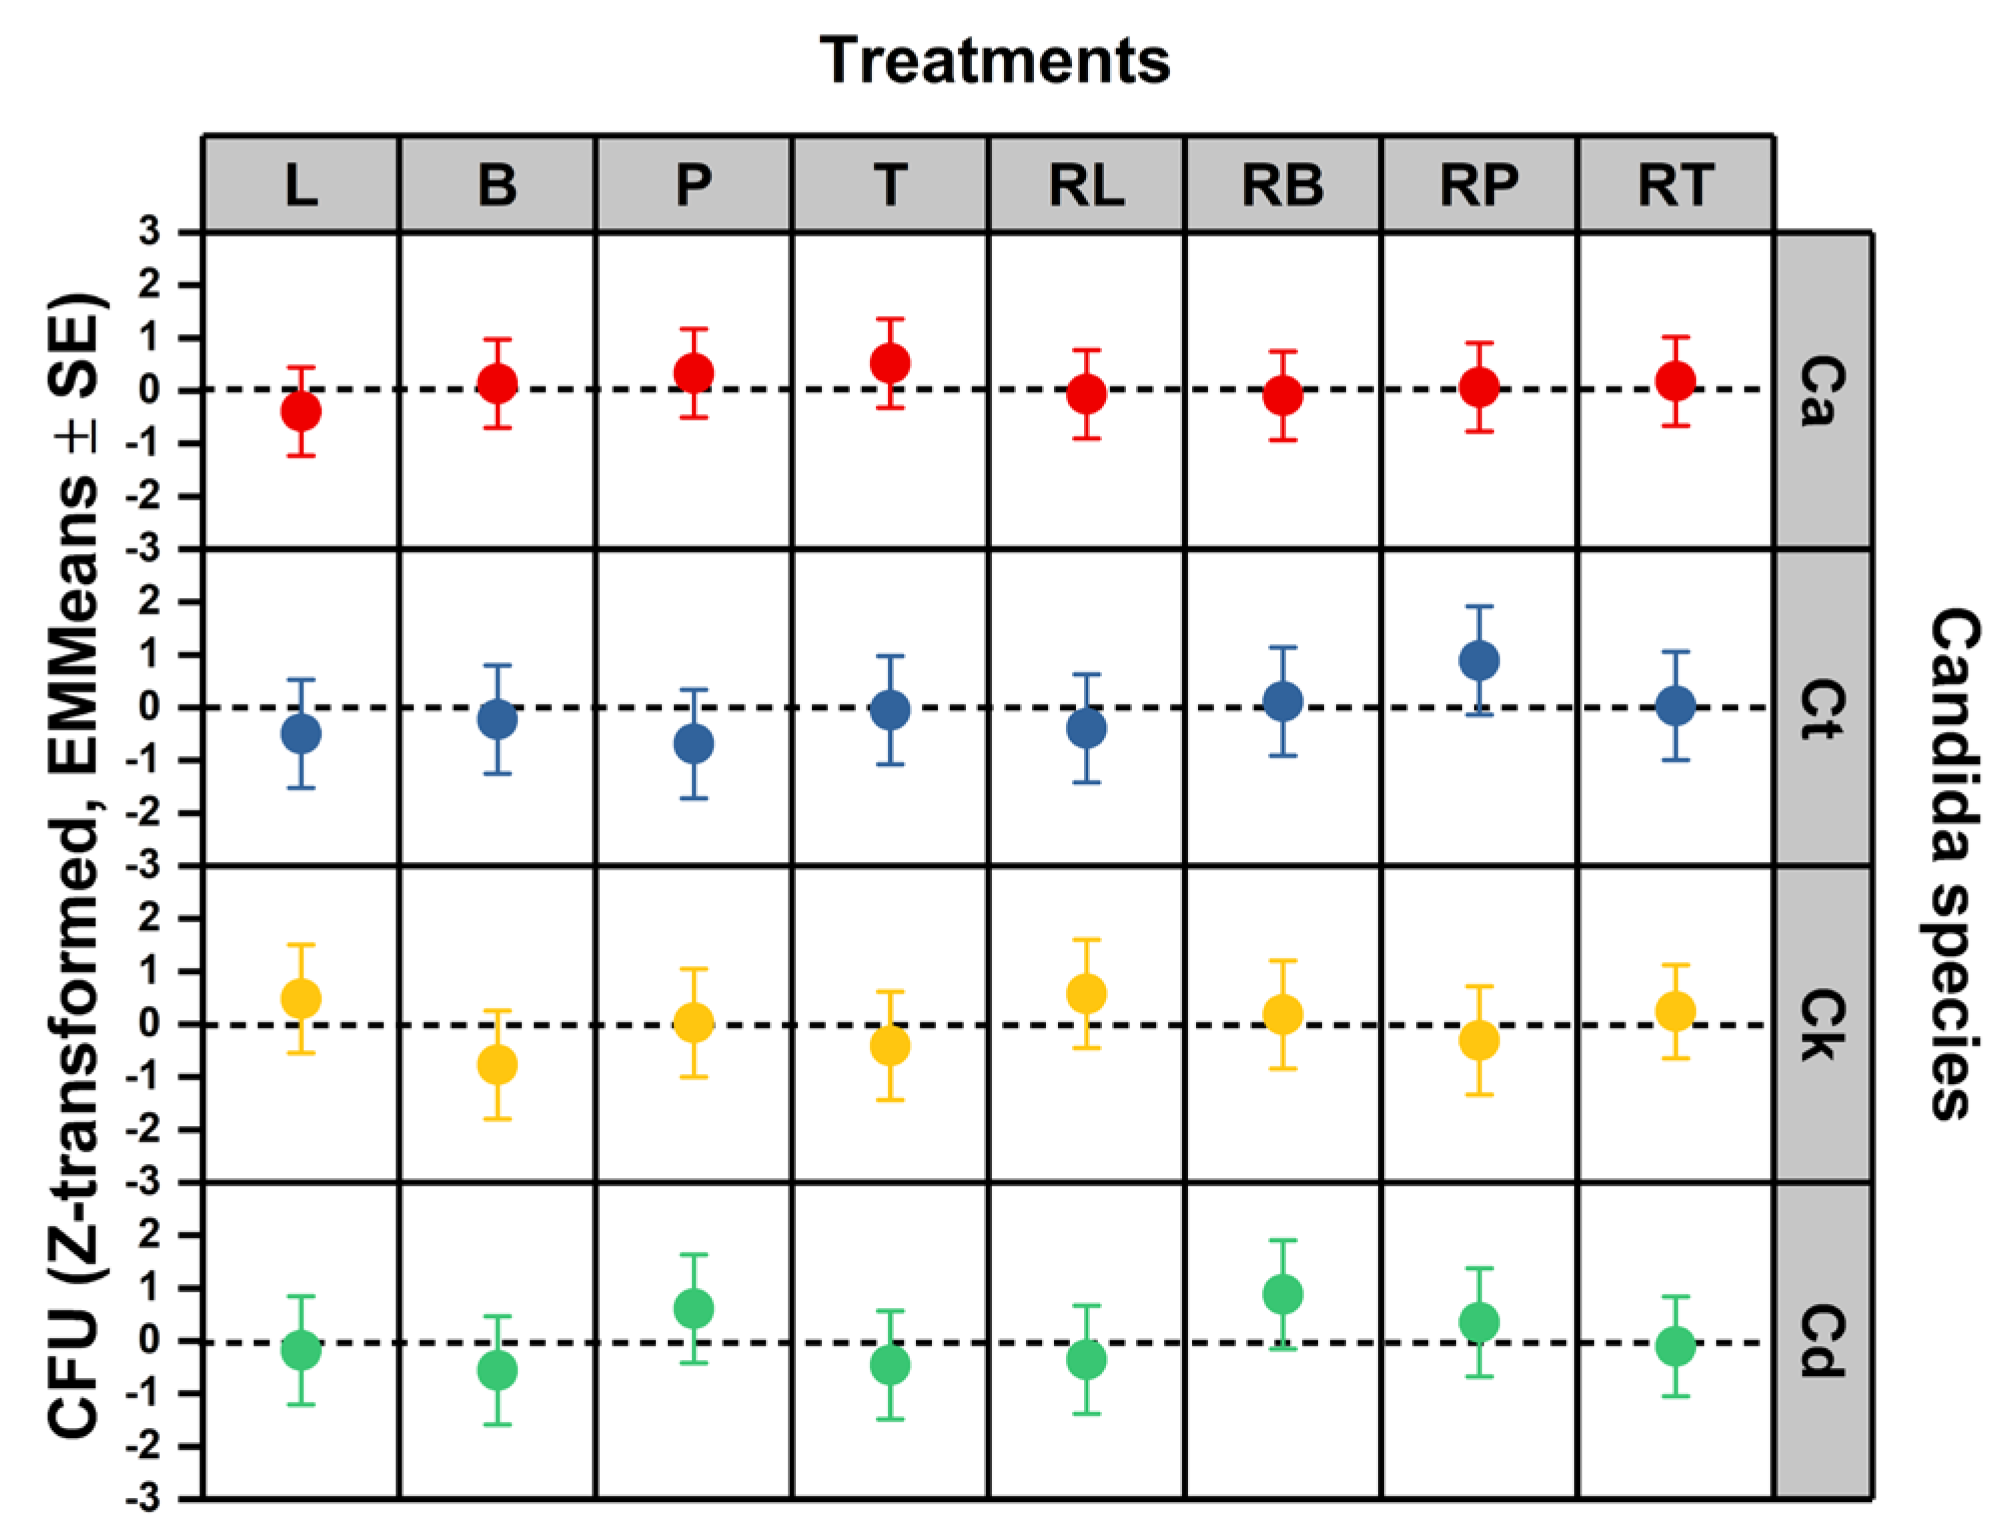
Figure 4.
Treatment-induced oxidative/nitrosative stress signatures across Candida species. (A) Global hierarchical clustering (Euclidean distance) of treatment signatures based on the standardized mechanistic marker panel RNS, ROS, CAT1, GPX1, and SOD1 (species-wise Z-transformed). (B-E) Species-stratified heatmaps showing mean Z-scores for each marker by treatment in (B) C. albicans (Ca), (C) C. tropicalis (Ct), (D) C. krusei (Ck), and (E) C. dubliniensis (Cd). Rows denote treatments (AM and FL: antifungal reference controls; MN: oxidative-stress control; L/B/P/T: essential oils; RL/RB/RP/RT: corresponding RAMEB inclusion complexes). Columns indicate mechanistic readouts; the dashed vertical line separates stress markers (RNS/ROS) from antioxidant gene responses (CAT1/GPX1/SOD1). Color scale represents mean Z-transformed deviation within species (red = higher-than-species mean; blue = lower-than-species mean), enabling direct comparison of mechanistic exposure signatures across treatments while controlling baseline species differences (see supplementary heatmap Figure S1 for treatment-associated changes in antioxidant gene programs).
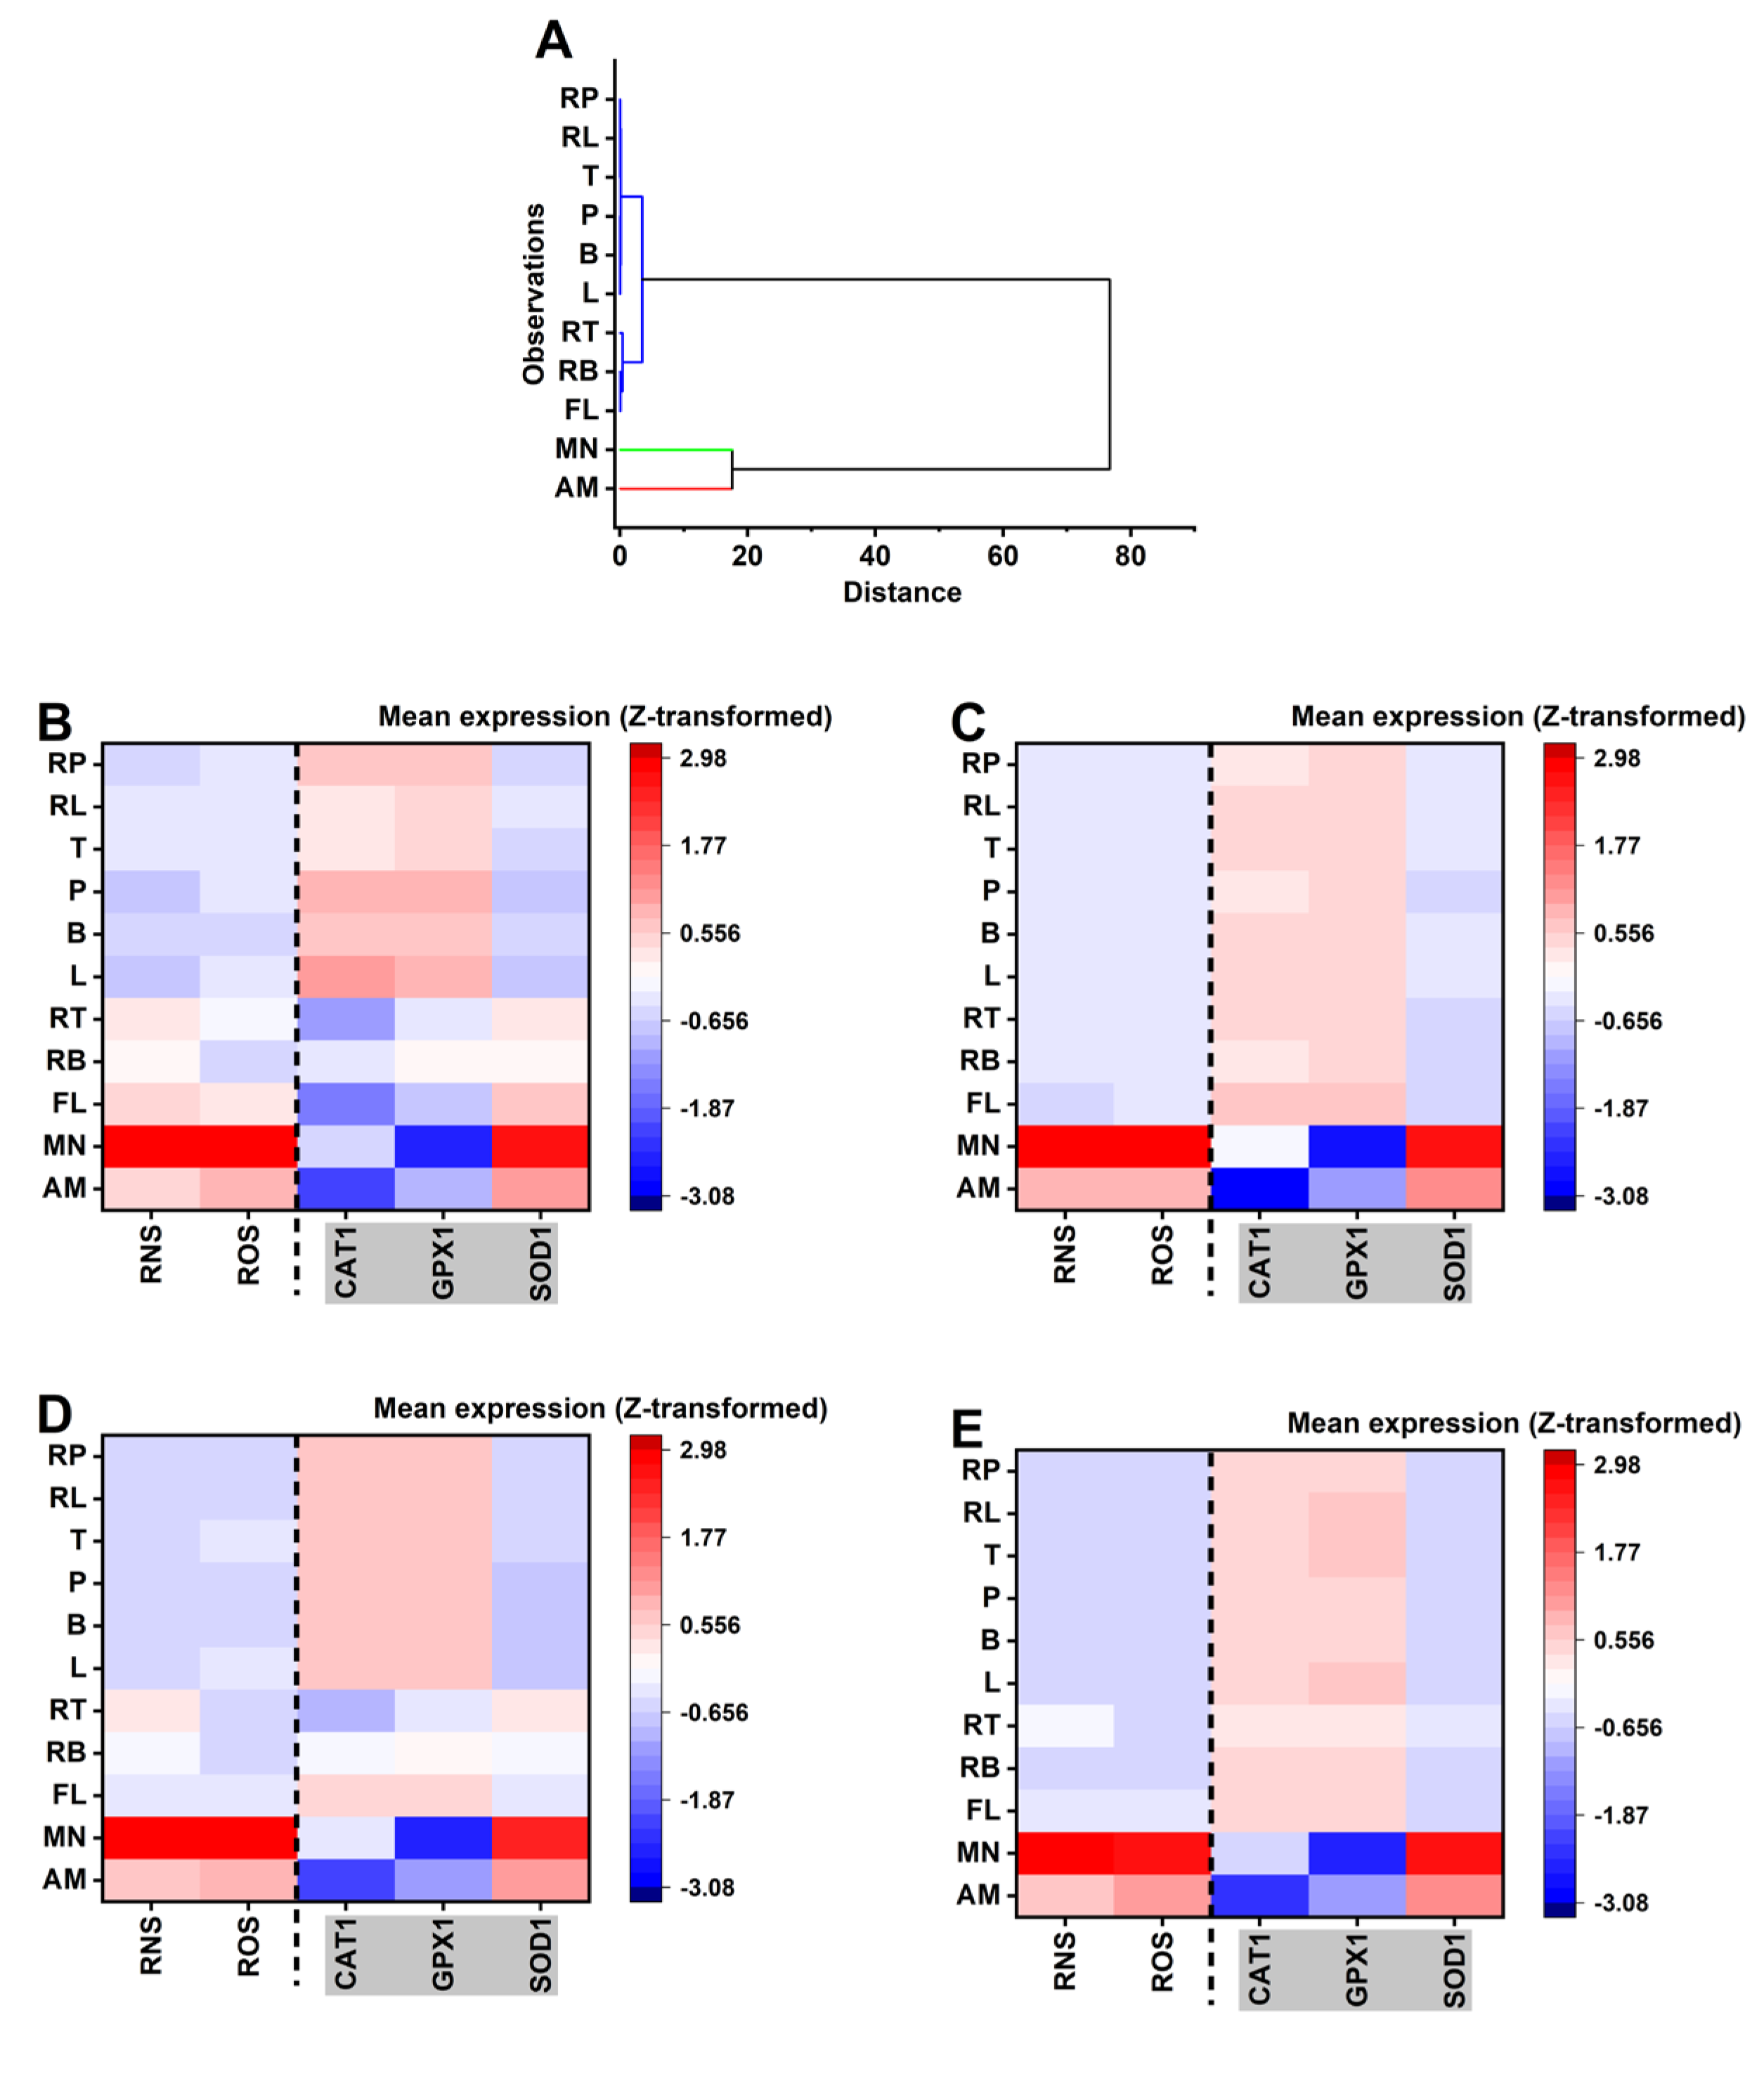
Figure 5.
Planktonic metabolism and viability reveal treatment efficacy and species dependence. Panels show estimated marginal means (EMMeans ± SE) from linear mixed models (REML; Satterthwaite degree of freedom) for planktonic functional endpoints across the experimental treatment set (L, B, P, T, RL, RB, RP, RT), with species indicated by color (red: Ca, blue: Ct, yellow: Ck, green: Cd). The y-axis is the species-wise Z-transformed response (negative values indicate a shift below the species mean; positive values indicate a shift above the species mean). The x-axis lists treatments, grouped by parent essential oil (EO) and its corresponding RAMEB inclusion complex (REO). (A-E) Endpoint-specific EMMeans profiles (one endpoint per panel) illustrate consistent treatment-driven modulation of planktonic physiology, while differences in the separation and ordering of species-colored points across treatments indicate species-dependent efficacy patterns (treatment × species effects). Treatment efficiency levels for the experimental parameters (panel A: planktonic metabolic activity/PMT), panel B: planktonic viability/PVA, panel C: biofilm attached cellular metabolic activity/BMT, panel D: biofilm attached cellular viability/BVA, and panel E: biofilm biomass/BB) decline along the horizontal axis, as indicated by the arrow. The significance levels are indicated as ** (p < .001) on the plot.
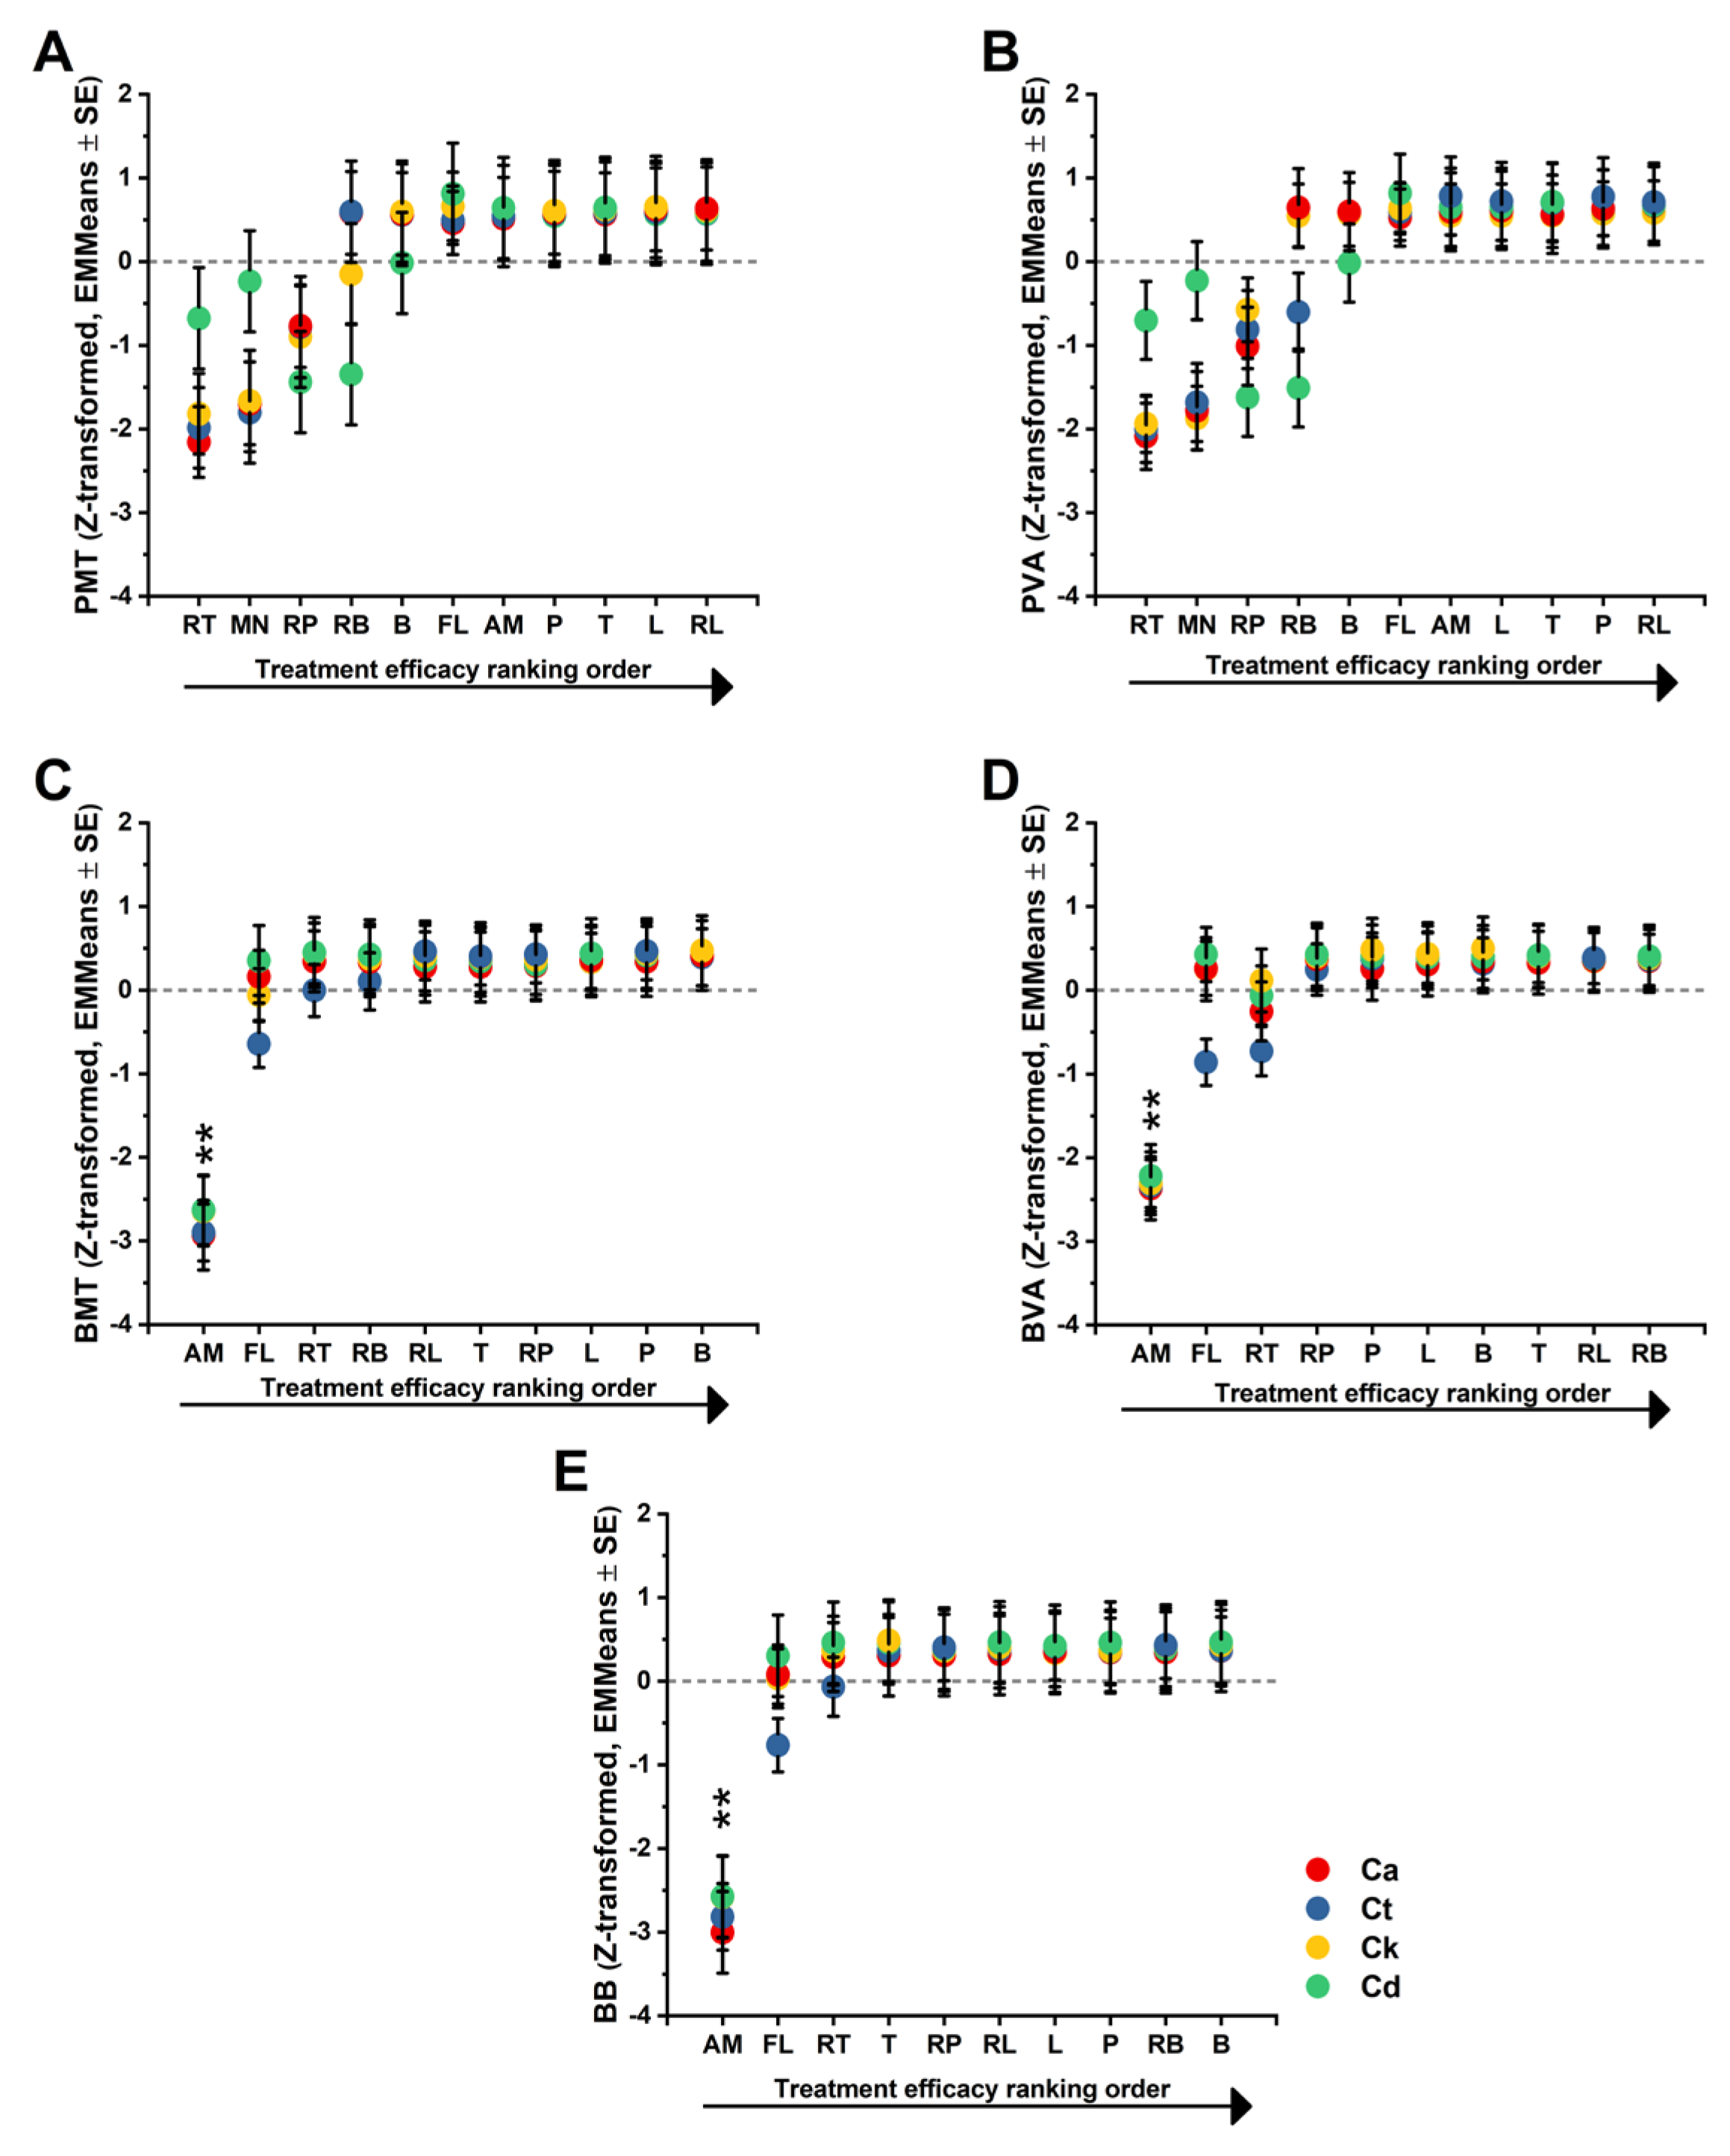
Figure 6.
Integrated treatment ranking identifies the most effective regimens across endpoints and highlights EO→RAMEB formulation shifts. The main panel shows treatment efficacy ranking based on the composite Efficacy score (estimated marginal means, EMMeans ± SE) derived from linear mixed modeling on the standardized (species-wise Z-transformed) integrated endpoint score. Treatments are ordered left-to-right by increasing overall efficacy (arrow indicates rank direction). The dashed horizontal line denotes the neutral reference (0; no shift from the species-wise mean); more positive values indicate higher composite efficacy on the standardized scale, whereas negative values indicate comparatively weaker efficacy. Asterisks denote treatments that differ significantly from the reference level (Bonferroni-adjusted pairwise comparisons; **p < .001).
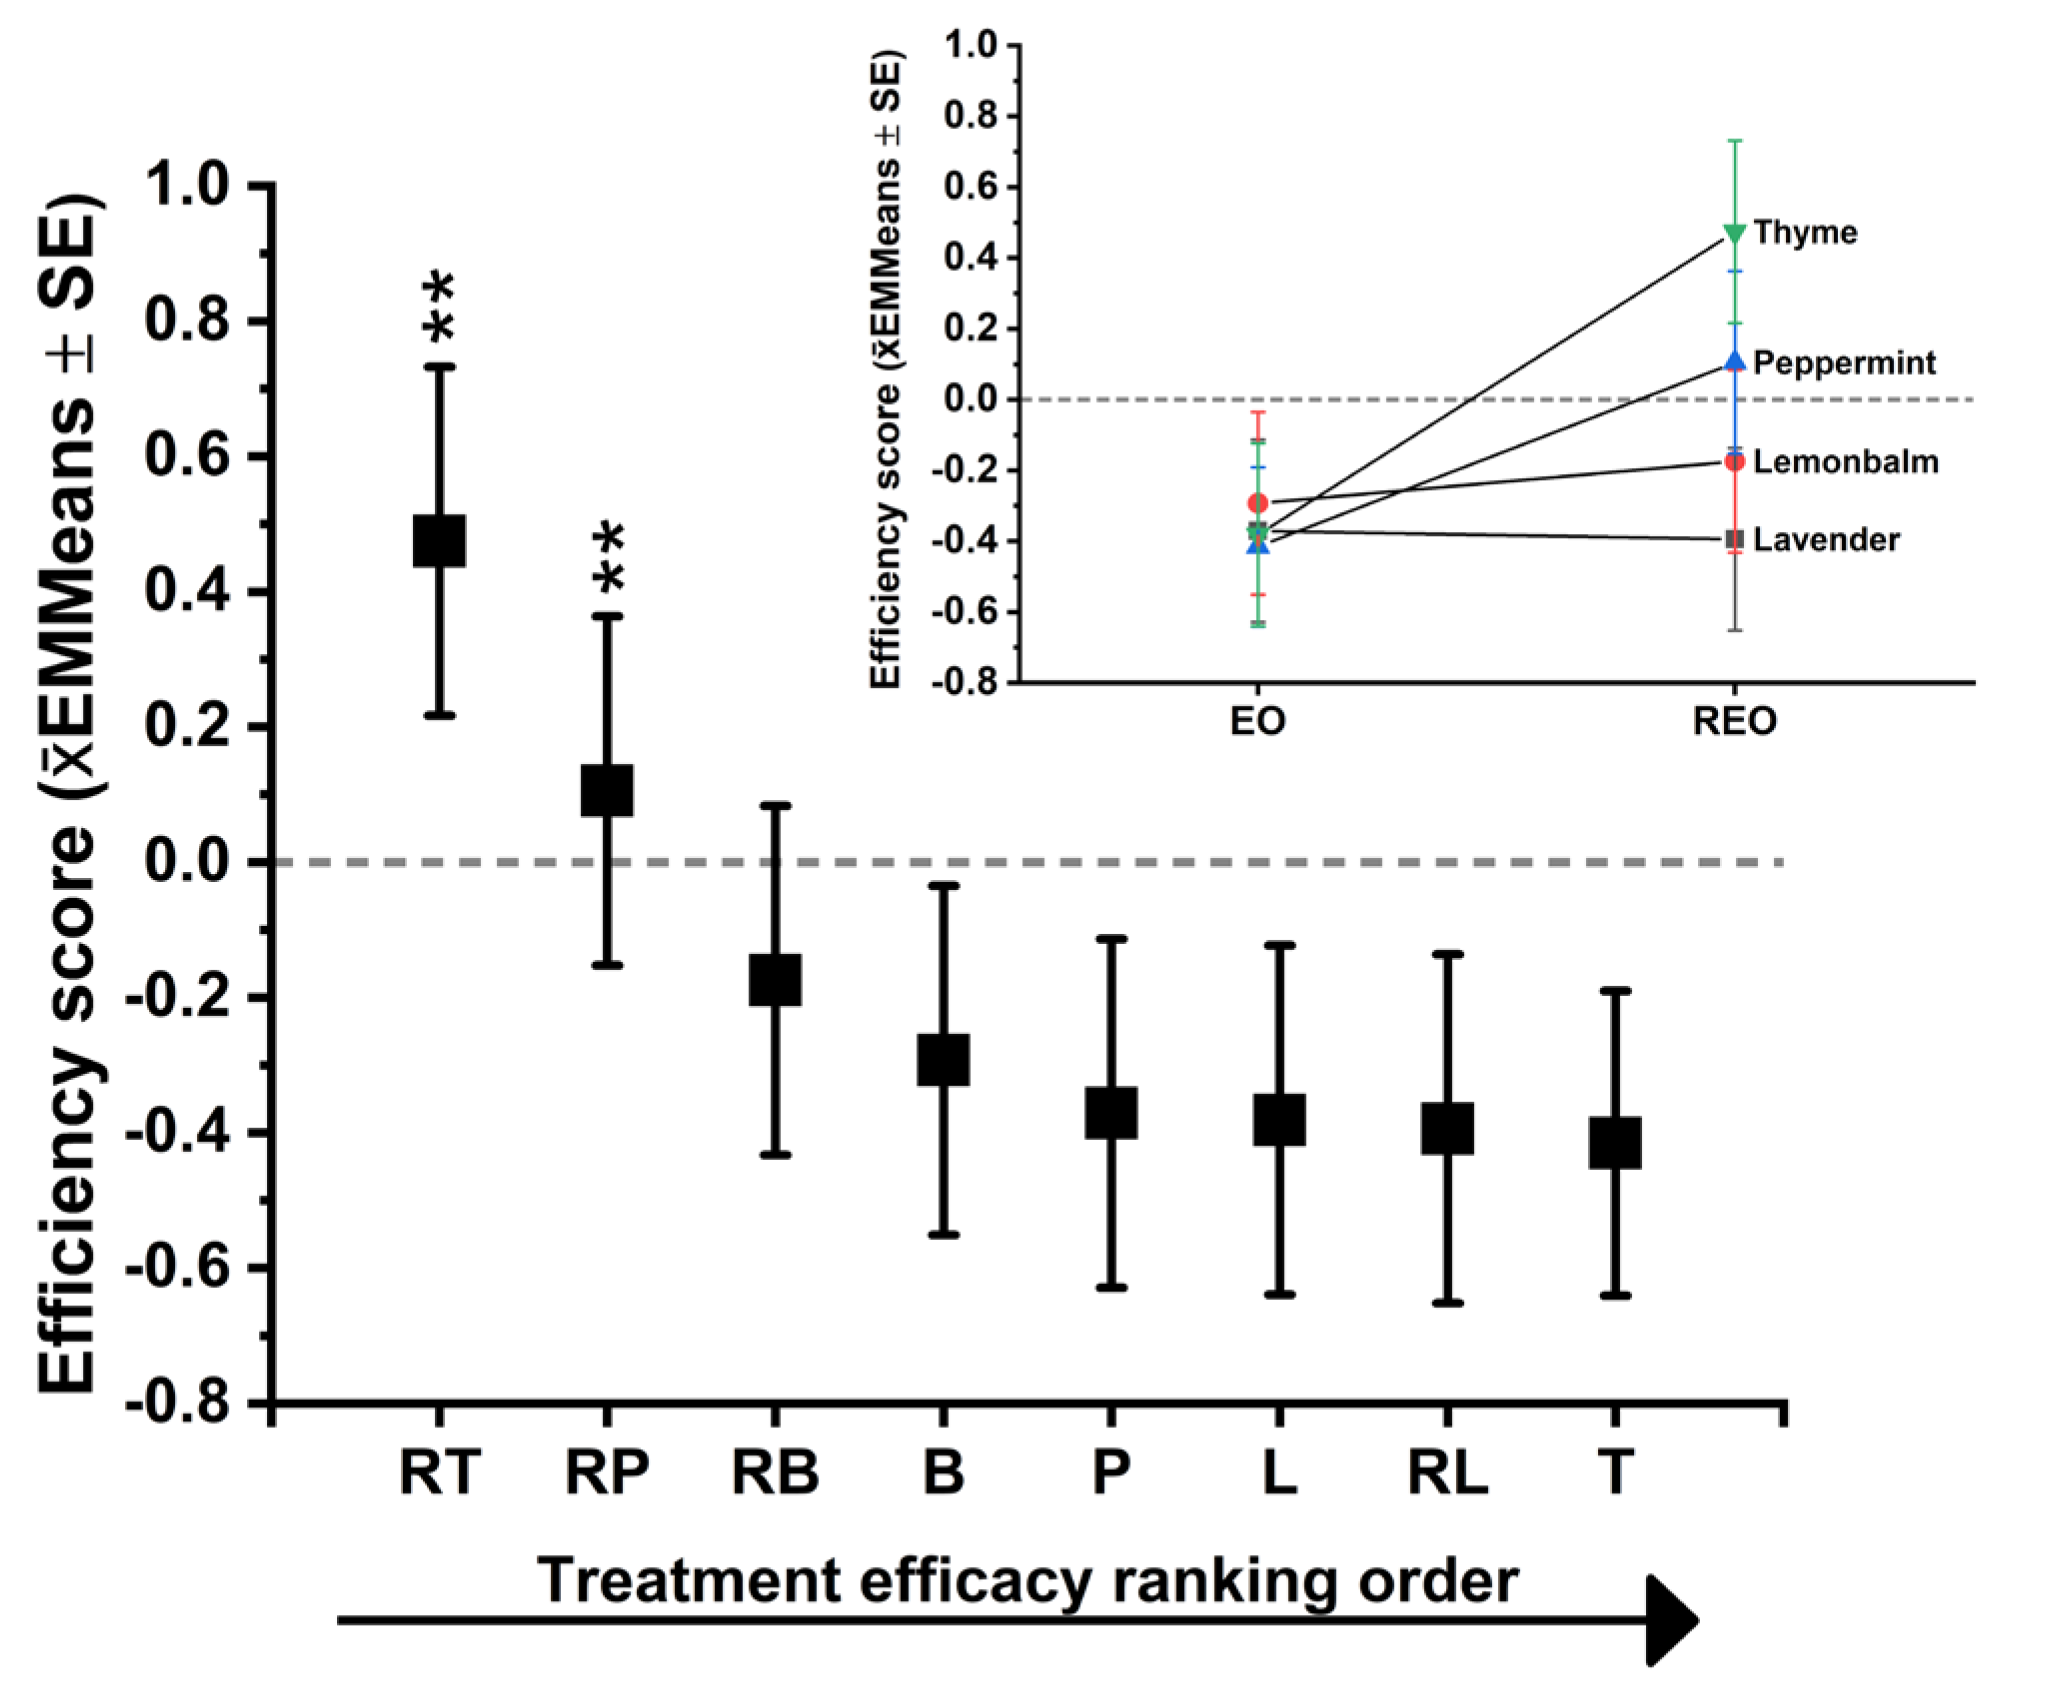
Figure 7.
Response-class composition across treatments reveals differential enrichment of susceptible/adaptive versus tolerant/resistant Candida phenotypes. Stacked bar plots show, for each treatment, the percentage of the total species population assigned to three inhibitory response classes derived from multivariate endpoint patterns: susceptible (strong inhibition), hormetic/adaptive (mixed or stimulation), and resistant/tolerance (weak inhibition) (color key at right). Treatments are ordered by decreasing hormetic/adaptation fraction (x-axis label). Values within bars indicate the within-treatment percentages for key classes. Across the experimental panel, RP, RT, and RB displayed the greatest heterogeneity in phenotype composition, including measurable hormetic/adaptive fractions (red) and a shift away from uniformly resistant/tolerant profiles, whereas the remaining treatments (T, RL, P, B, L) were dominated by a single class (predominantly tolerant/resistant), indicating comparatively limited inhibitory engagement under those exposure conditions. Letters above bars (a–c) denote treatment vs species groupings: (a) Ca, Ct, Ck, Cd (hormetic/adaption): RP, (b) Ca, Ct, Ck, Cd (hormetic/adaption) and Ca, Ct, Ck (susceptible): RT, (c) Ck, Cd (hormetic/adaption).
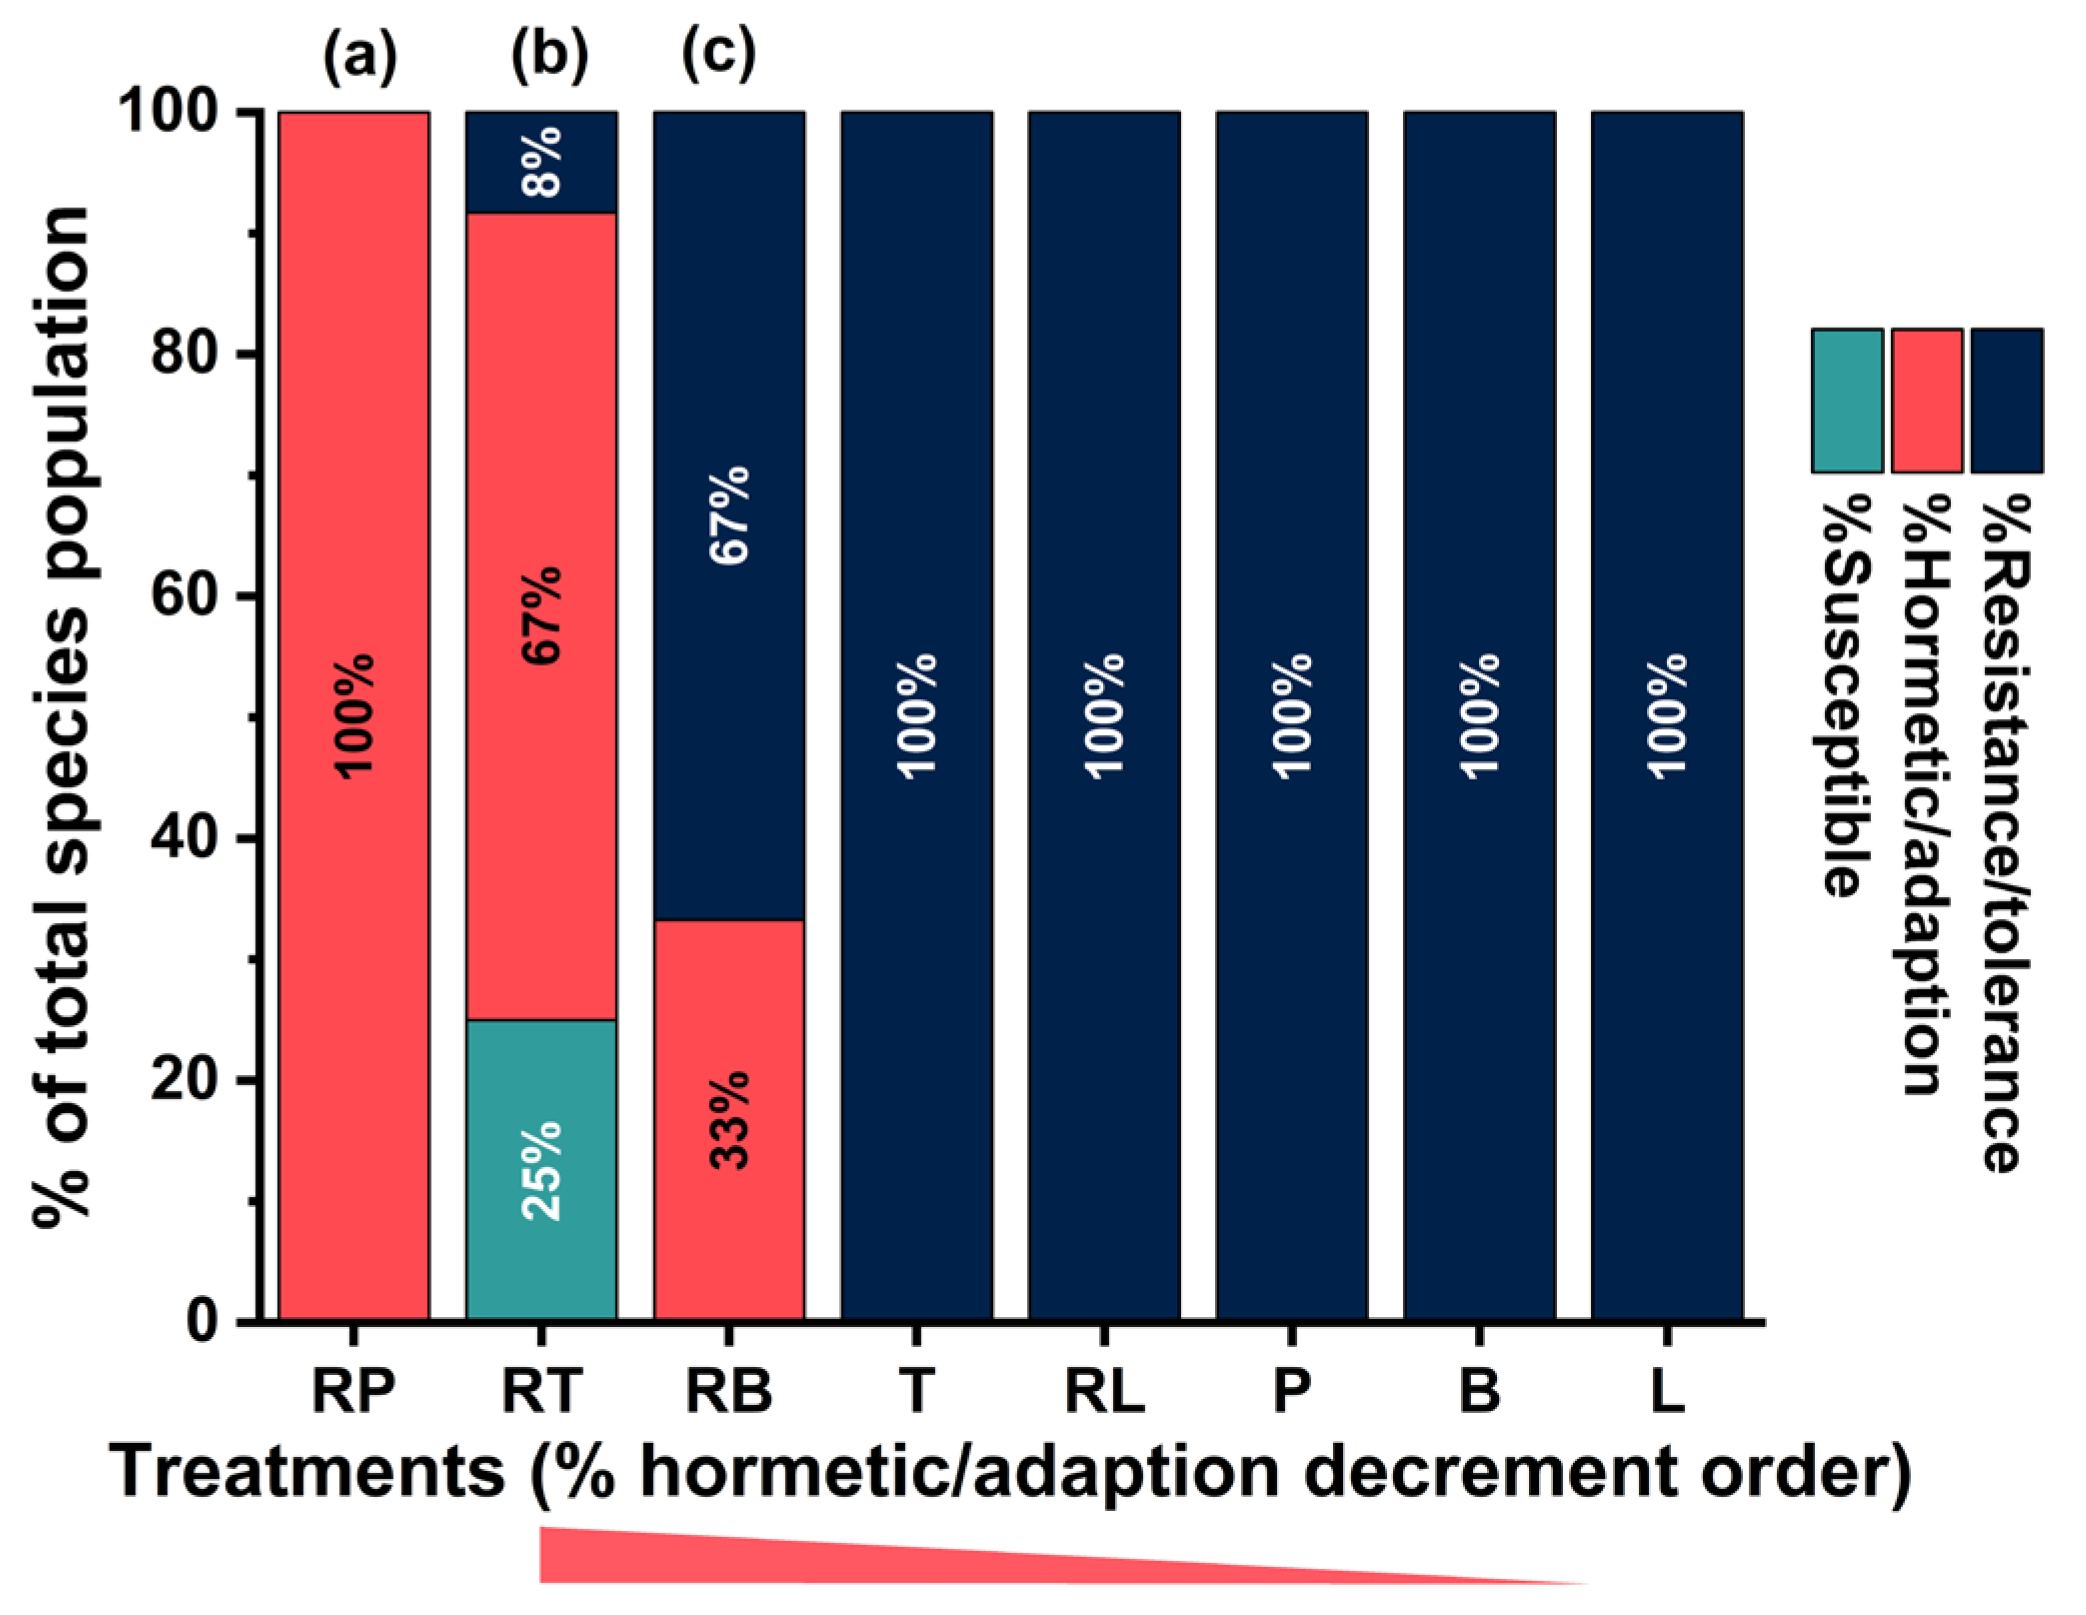
Figure 8.
CART/CRT mechanistic decision-tree links CAT1 to responder status and reveals treatment enrichment across terminal nodes (experimental set, controls excluded). Left: Classification and Regression Tree (CRT; dependent variable Responder2, coded 1 = responder (susceptible + hormetic/adaptive) and 0 = tolerant/resistant) built from aggregated treatment × species mechanistic signatures. The tree identifies CAT1_m (mean CAT1) as the primary discriminating marker. The first split at CAT1_m ≤ −0.772 defines a high-responder node (N1; 100% responders; n = 5), whereas CAT1_m > −0.772 yields a mixed branch that is further separated by a second CAT1_m threshold (0.577) into N3 (responder-enriched; 29.5% responders; n = 44) and N4 (tolerant/resistant–enriched; 91.3% tolerant/resistant; n = 23). Node boxes report class proportions and sample sizes; Improvement values reflect the split contribution to classification at each node. Right: Heatmap shows the within-treatment distribution of signatures across terminal nodes (percent of each treatment’s signatures assigned to a node; rows sum to 100%). Treatments are ordered by decreasing global signature strength (as labeled). The dashed bracket highlights the resistance-enriched region (N4). RT is concentrated in the resistant-enriched node (N4), whereas RB and RP show broader dispersion across N1–N4, indicating more heterogeneous mechanistic–phenotypic behavior across species. Color scale: percentage (0–100%) of a treatment’s signatures falling into each terminal node (darker = lower; warmer = higher).
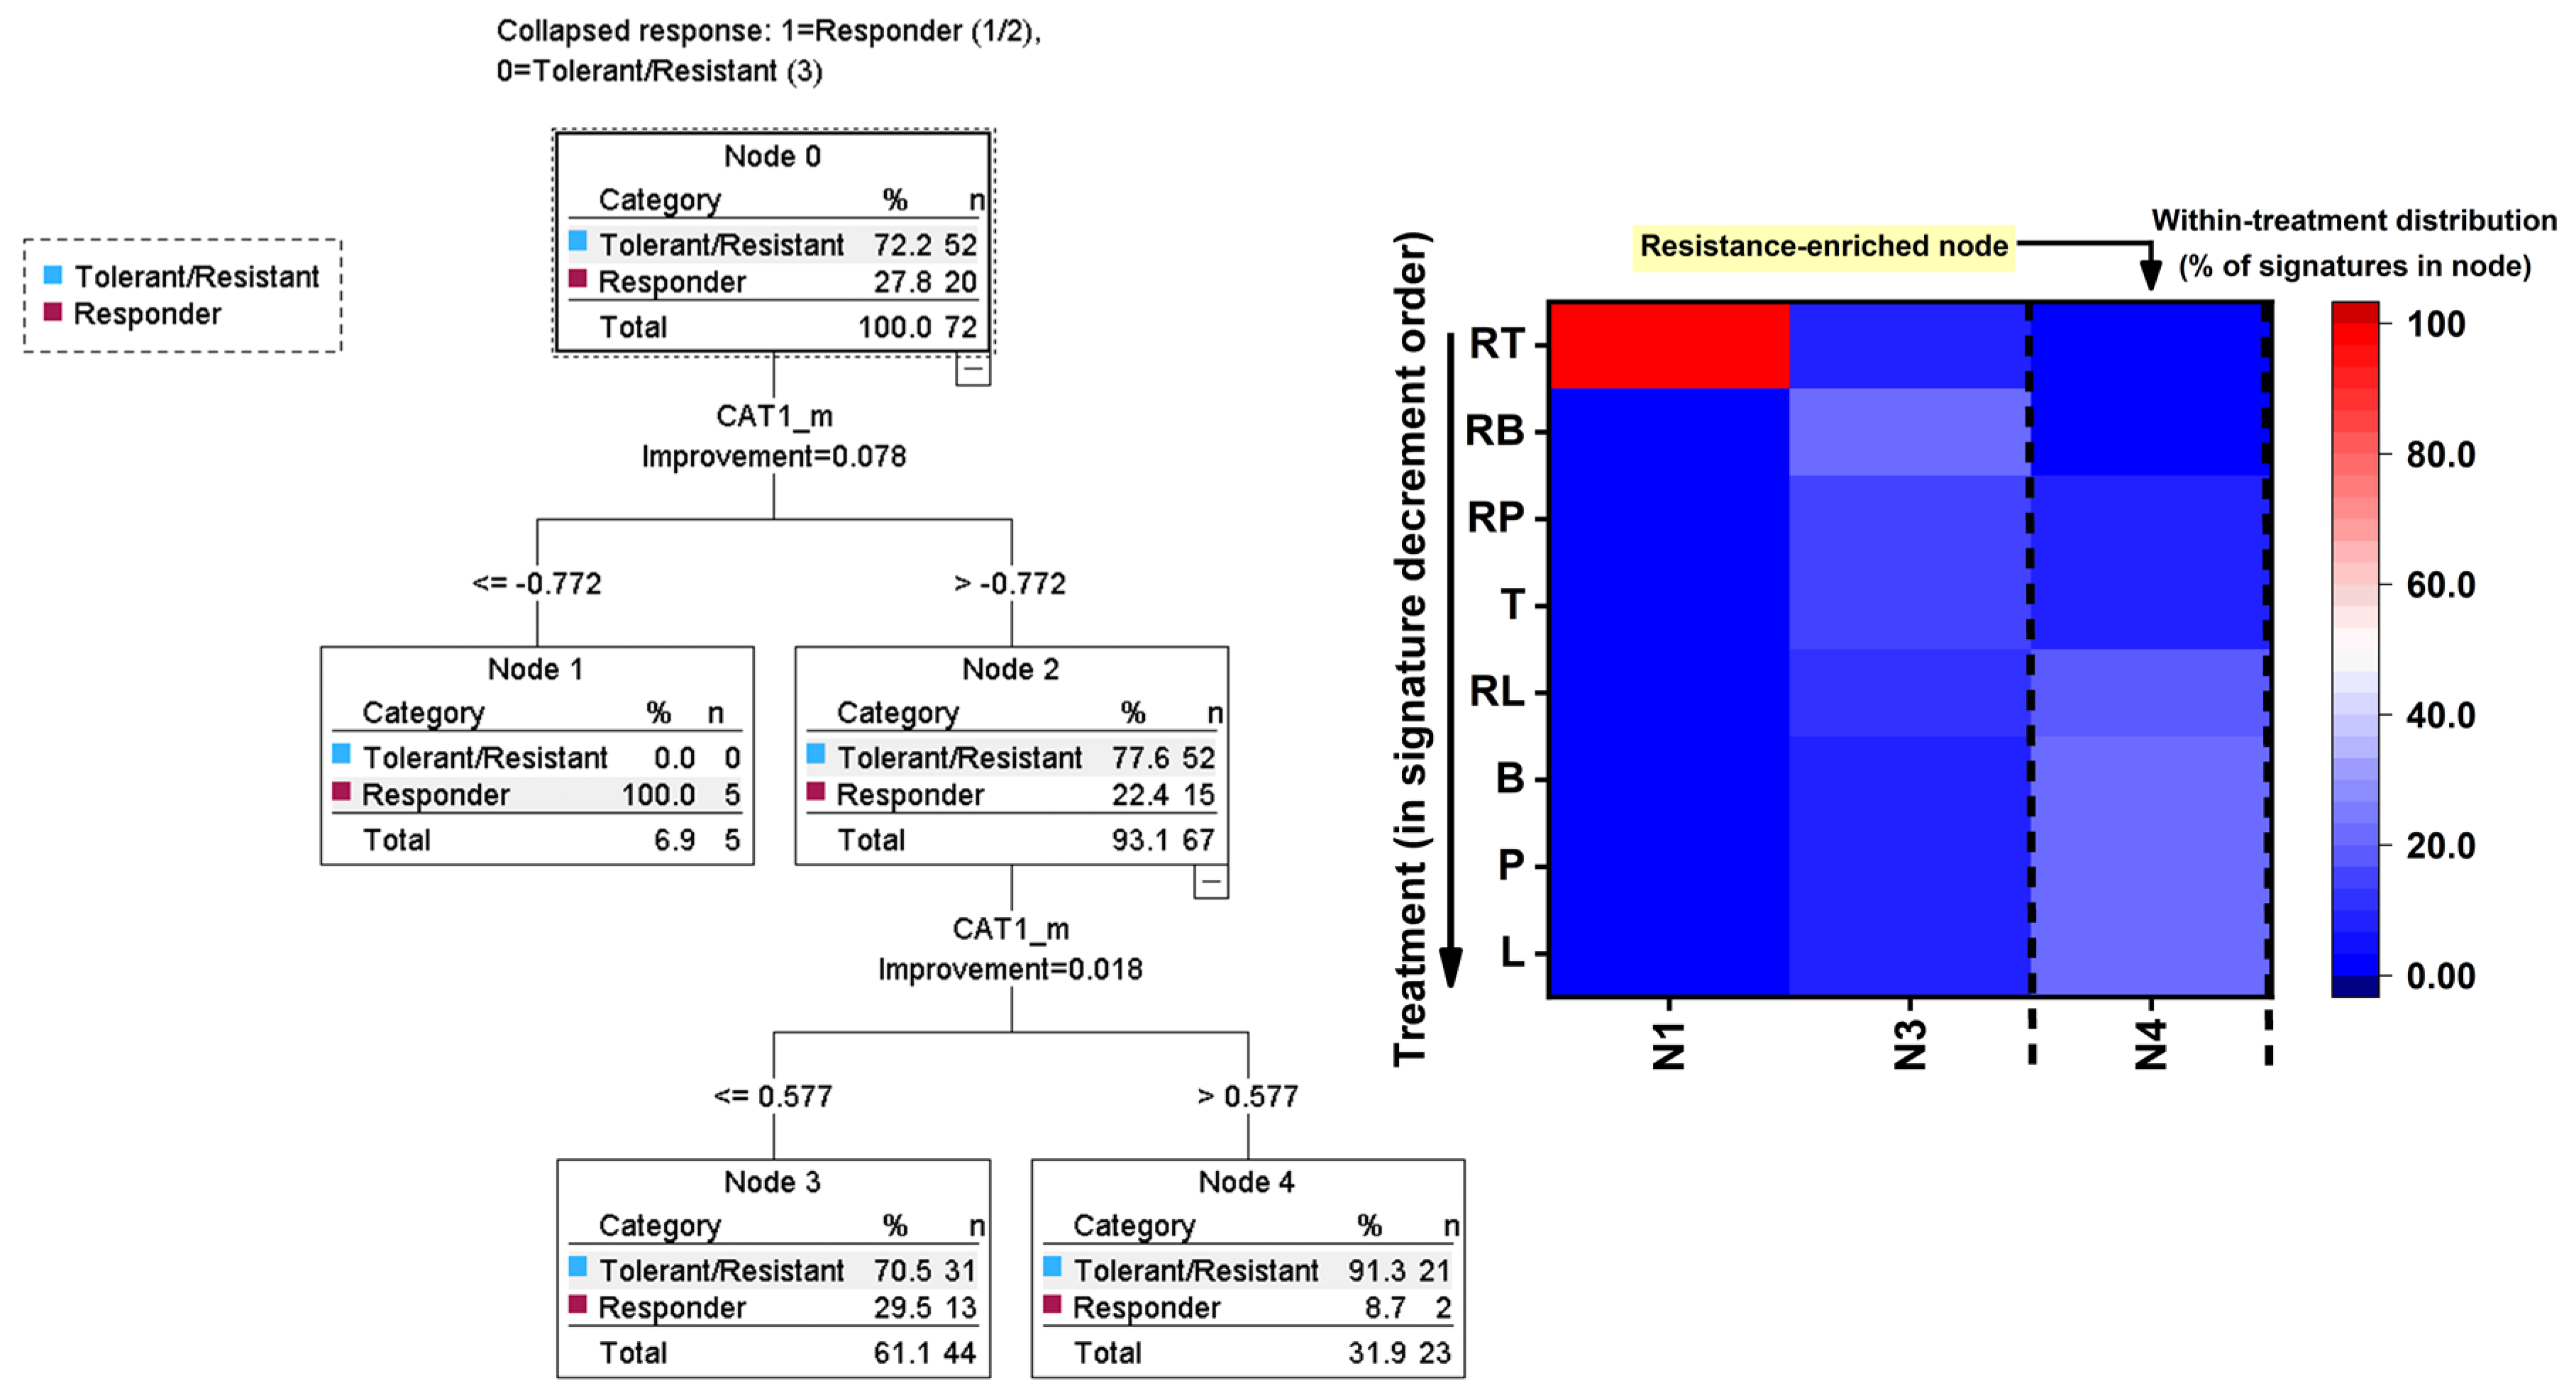
Figure 9.
Multivariate mode-of-action landscape separates stress-intensity and antioxidant-program axes across treatments and species.
Figure 9.
Multivariate mode-of-action landscape separates stress-intensity and antioxidant-program axes across treatments and species.
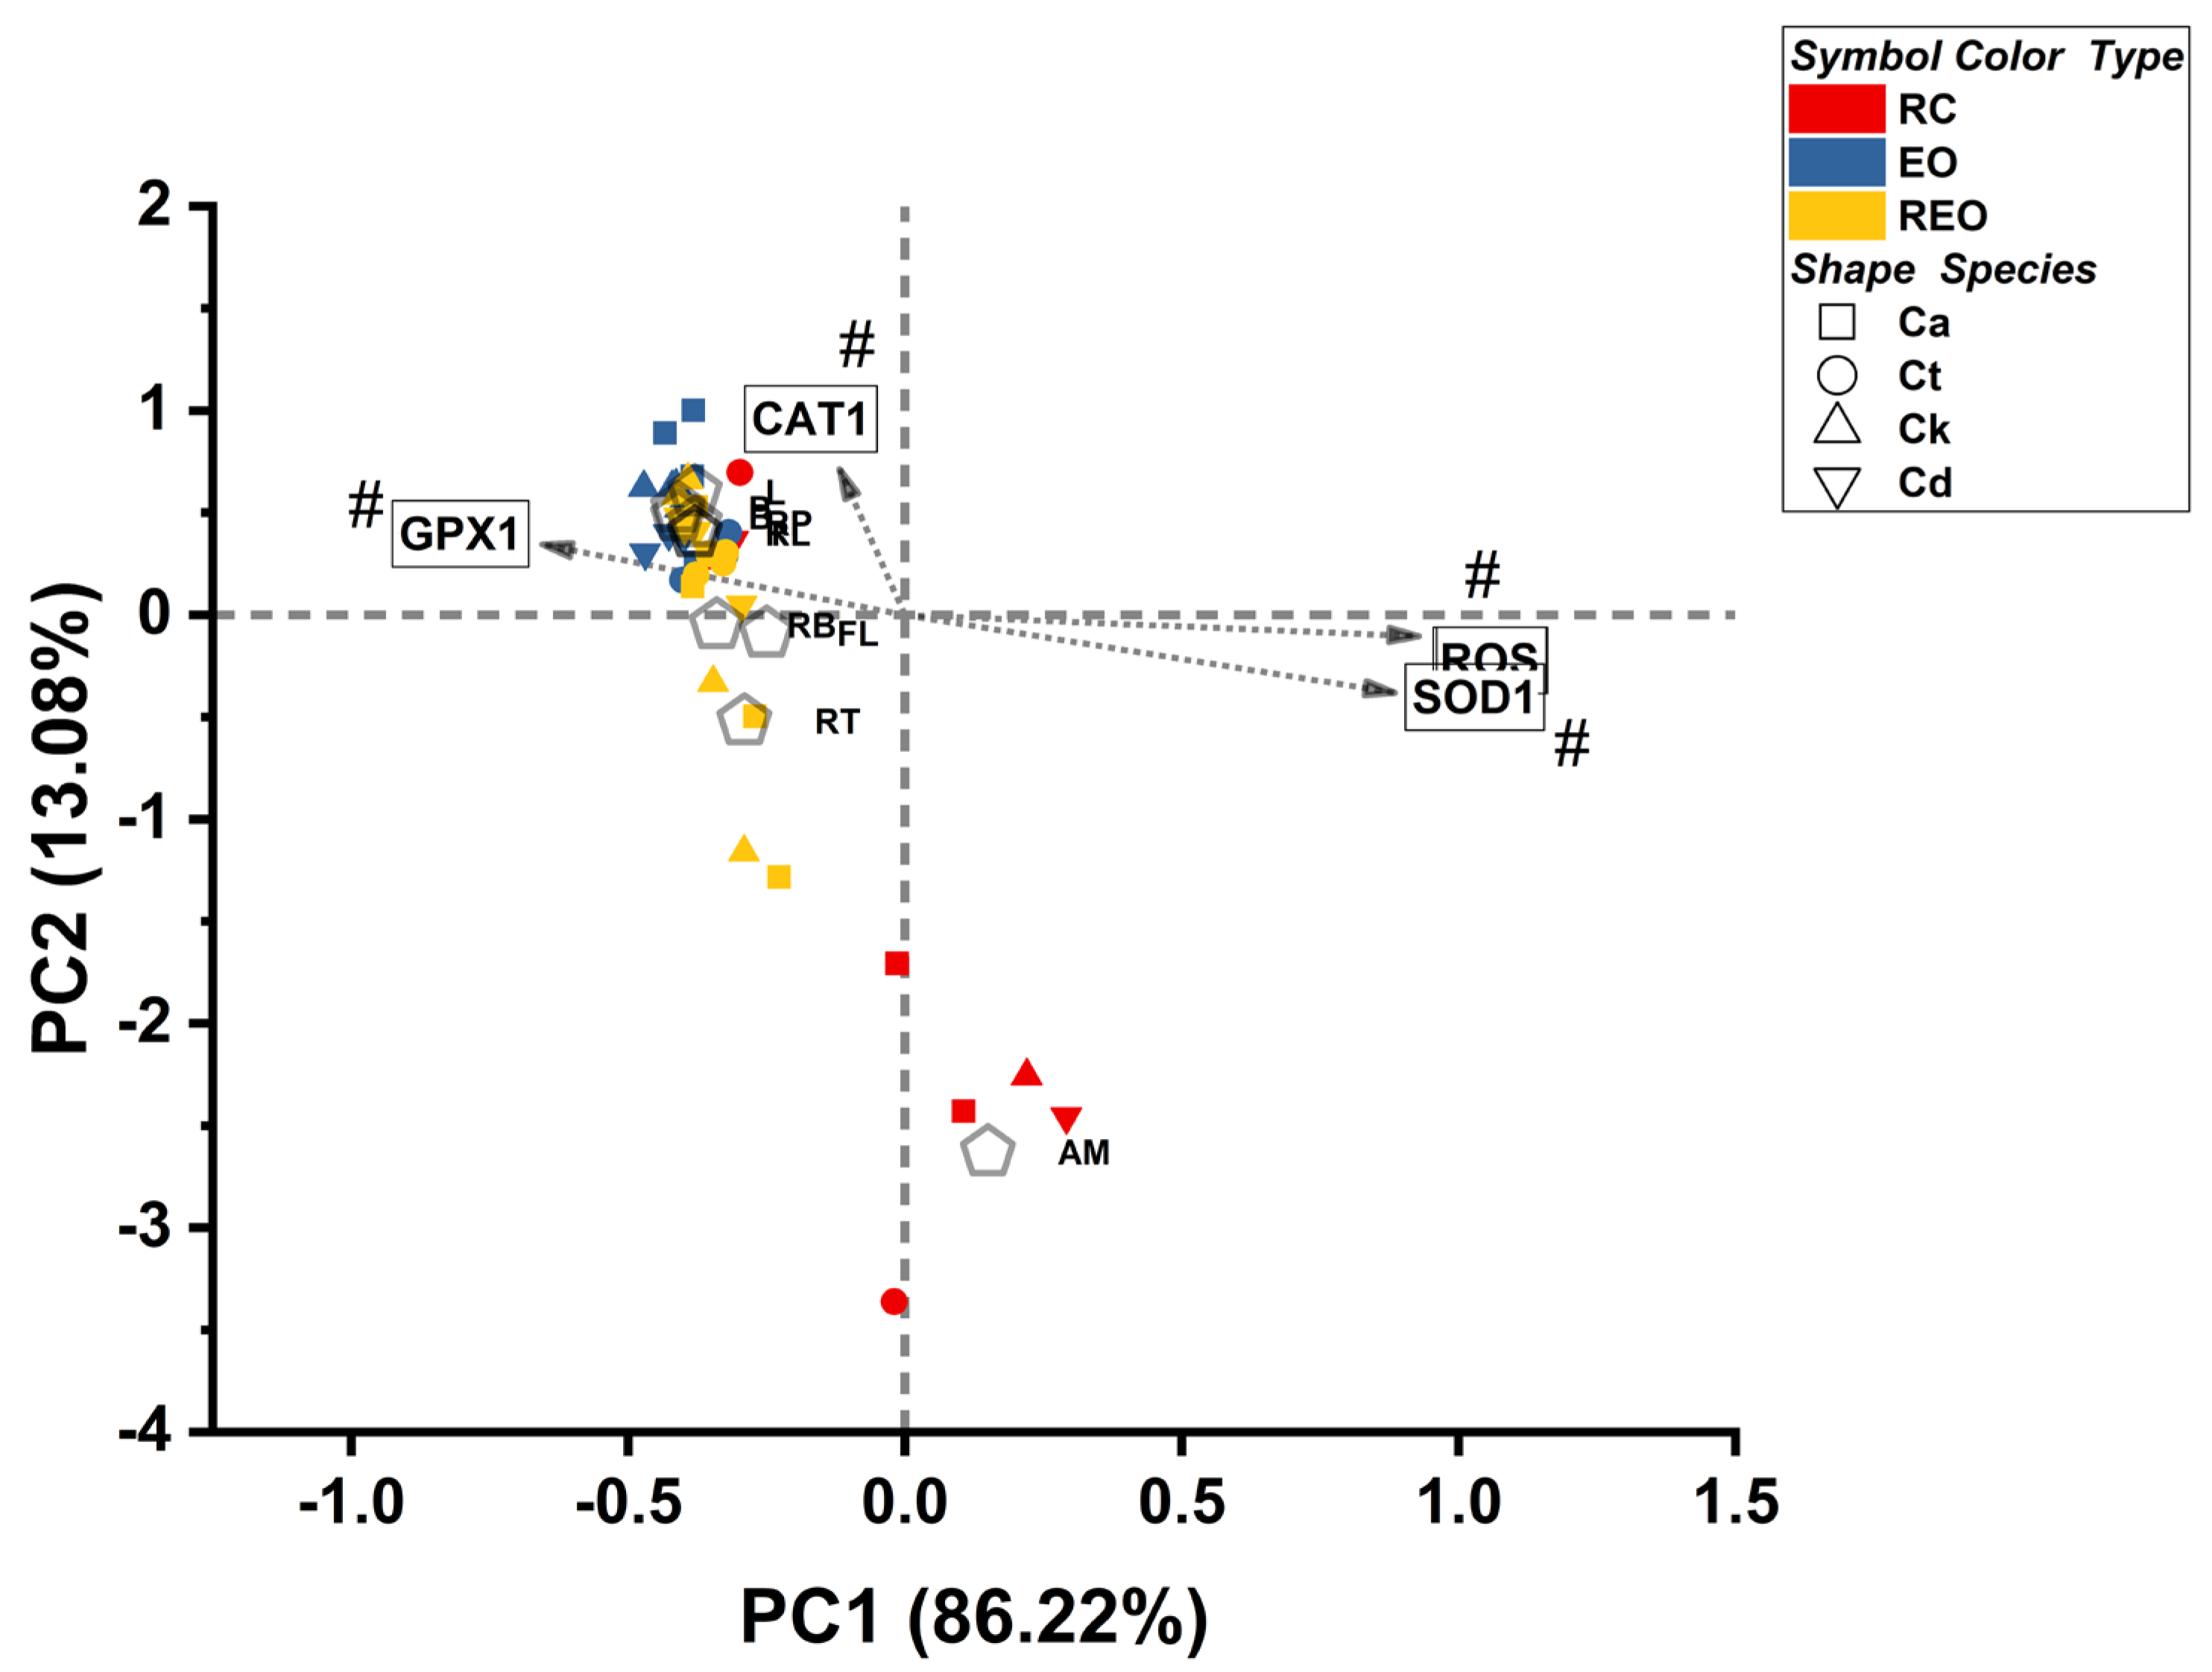

Table 1.
Final cluster centers of oxidative-nitrosative responses calculated using k-clustering method.
Table 1.
Final cluster centers of oxidative-nitrosative responses calculated using k-clustering method.
| Parameter | Cluster | ||
| 1* | 2** | 3*** | |
| RNS | 2.904 | -0.54 | 0.60 |
| ROS | 2.839 | -0.43 | 0.92 |
| CAT1 | -0.372 | 0.66 | -2.42 |
| GPX1 | -2.6 | 0.63 | -1.11 |
| SOD1 | 2.616 | 0.839 | 1.15 |
*Cluster 1: High oxidative-nitrosative stress with SOD1 dominance and GPX1 suppression (n = 4). **Cluster 2: Moderate stress with suppressed CAT1/GPX1 response (n = 7). ***Cluster 3: Low measured stress with CAT1/GPX1 upshift (adaptive/low-stress class; n = 33).
Disclaimer/Publisher’s Note: The statements, opinions and data contained in all publications are solely those of the individual author(s) and contributor(s) and not of MDPI and/or the editor(s). MDPI and/or the editor(s) disclaim responsibility for any injury to people or property resulting from any ideas, methods, instructions or products referred to in the content. |
© 2026 by the authors. Licensee MDPI, Basel, Switzerland. This article is an open access article distributed under the terms and conditions of the Creative Commons Attribution (CC BY) license (http://creativecommons.org/licenses/by/4.0/).
Copyright: This open access article is published under a Creative Commons CC BY 4.0 license, which permit the free download, distribution, and reuse, provided that the author and preprint are cited in any reuse.


