Submitted:
18 February 2026
Posted:
18 February 2026
You are already at the latest version
Abstract
Lake Erhai is an important plateau freshwater lake in China. It serves not only as a crucial drinking water source for the local region but also as the core area of the Cangshan Erhai National Nature Reserve. Consequently, Lake Erhai plays an extremely significant role in the local economy, society, and ecology. However, since the 1970s, the lake has experienced a series of problems, including declining water levels and water pollution. In recent years, the water quality of Lake Erhai has continued to deteriorate, showing a eutrophic trend. To identify the primary driving forces behind these water quality changes, this study employed stepwise regression analysis. Climate conditions, socio-economic development within the basin, and implementation of environmental protection measure (IEPM) were considered as influencing factors for a comprehensive and systematic analysis of Lake Erhai's water quality. The results indicate that air temperature primarily affects total phosphorus (TP) concentration and exhibits a positive correlation. Rainfall predominantly influences TP and total nitrogen (TN) concentrations, also showing positive correlations. Wind speed affects chemical oxygen demand (CODMn), TP, and TN concentrations, exhibiting negative correlations with each. Socio-economic development mainly affects CODMn concentration. Based on these findings, this paper proposes recommendations focusing on formulating more effective non-point source pollution control measures and strengthening water quality monitoring in Lake Erhai during summer. This study systematically analyzed the anthropogenic and natural factors affecting Lake Erhai's water quality, identified the dominant influencing factors, and provides technical support for the subsequent enhancement of Lake Erhai protection measures.
Keywords:
Lake Erhai
; water quality
; stepwise regression analysis
1. Introduction
Lakes are major water bodies on Earth and play a significant role in ecosystems and the global climate. However, due to increased external pollution loads, the influx of agricultural non-point source pollution and urban domestic sewage, as well as lake degradation caused by excessive water resource development, the water environment of lakes has faced significant challenges. Lake Erhai is situated in the Dali Bai Autonomous Prefecture, Yunnan Province, China. It is the second-largest freshwater lake in Yunnan Province. The lake extends 42.5 kilometers from north to south, with a width ranging from 3.4 to 8.4 kilometers from east to west, and has a shoreline of approximately 129 kilometers. The maximum water depth is 21.3 meters, with an average depth of 10.8 meters. The Lake Erhai basin covers an area of 2,565 square kilometers, located between 100°05’ and 100°17’ east longitude and 25°36’ and 25°58’ north latitude (Figure 1). Lake Erhai is not only a crucial drinking water source but also the core area of the Cangshan Erhai National Nature Reserve, playing a critical role in the basin’s economic development and ecosystem protection. However, by the end of that decade, the lake had shifted from oligotrophic to mesotrophic status. This trend intensified after the 1990s, as it further deteriorated to eutrophic conditions [1,2,3,4,5,6,7,8,9]. Ongoing socioeconomic development within the basin has accelerated this decline, with water quality showing a persistent trend toward eutrophication. [10,11,12]. To curb this decline, the local government implemented extensive comprehensive water pollution control measures in the Lake Erhai basin starting in 2016. Following these interventions, some water quality indicators have improved [13,14], particularly evidenced by a significant decrease in TP concentration. However, the concentrations of TN and CODMn in Lake Erhai have continued to rise annually. Water quality is influenced not only by human activities but also by other factors. Analyzing the factors influencing Lake Erhai’s water quality and identifying the primary driving forces are crucial for predicting future water quality trends and implementing effective protection measures.
The main factors influencing Lake Erhai’s water quality have been a focus of scholarly research. Wang Mingjie et al. [16], Pang Yan et al. [17], and Ma Wei et al. [18] all concluded that pollutants in Lake Erhai primarily originate from non-point source pollution. Shi Hongbo et al. [19], Zhang Haoxia et al. [20], and Huang Mingyu [21] identified rainfall as the main factor transporting pollutants into the lake and causing water quality deterioration. An Guoying et al. [22], using linear fitting analysis, suggested a correlation between climate change and Lake Erhai’s water quality. Other scholars have highlighted the direct impact of the basin’s socio-economic development on the lake’s water environment. Zheng Liang et al. [23] and Ke Gaofeng [24] analyzed the influence of socio-economic development on Lake Erhai’s water quality. Existing research collectively recognizes climate change and socio-economic development within the basin as key factors driving water quality changes in Lake Erhai. However, there is a lack of comprehensive studies integrating all major influencing factors, including climate change, socio-economic development, and environmental protection measures. Therefore, this study employs stepwise regression analysis, incorporating climate change, socio-economic development within the basin, and environmental protection measures as influencing factors, to construct a stepwise regression model for a comprehensive and systematic analysis of Lake Erhai’s water quality. Furthermore, it aims to identify the dominant factors driving the changes in the lake’s water quality.
2. Data and Model
2.1. Analysis of Influencing Factors of Lake Water Quality
A lake is a complex system, and its water quality is influenced by numerous factors. This study categorizes the primary factors affecting lake water quality into two classes: climate change and human activities. A schematic diagram of the various factors affecting Lake Erhai is shown in Figure 2.
Firstly, lake water quality is directly affected by climate change, primarily encompassing temperature, rainfall, and wind speed. Temperature plays a significant role in chemical and biochemical reactions within water bodies, as well as affecting aquatic flora and fauna. Temperature-induced changes in water quality are critical [25,26,27,28,29,30]. Air temperature primarily influences water temperature, and changes in water temperature ultimately alter pollutant concentrations. Rainfall directly impacts the influx of pollutants into the lake. On one hand, pollutants in soil are leached out by rainfall and subsequently transported into lakes [31,32,33,34,35,36,37,38]; on the other hand, rainfall also contributes substantial water volume, which can dilute pollutant concentrations. Ultimately, whether rainfall increases or decreases pollutant concentrations depends on specific basin conditions and water body characteristics [39]. Wind is the main driving force for water movement in lakes. It determines lake current patterns and flow velocity, influencing the transport and diffusion of pollutants within the lake, thereby affecting the pollutant carrying capacity of the lake and its main bays [40]. Therefore, this paper selects temperature, rainfall, and wind speed as variables for inclusion in the stepwise regression model.
Secondly, lake water quality is also significantly affected by human activities. These activities primarily encompass two aspects: those increasing pollutant emissions and measures reducing pollutant emissions. Socio-economic development leads to increased pollutant discharges into lakes. Typically, as the economy and society develop, pollutant loads entering lakes increase. Gross domestic product (GDP) is the main indicator for measuring economic development. This study selects GDP as a variable representing economic development. Furthermore, population growth within the basin inevitably leads to increased pollutant discharge. Therefore, population is also included in the stepwise regression model as a variable reflecting the impact of human activities on lake water quality. Additionally, to protect the lake, a series of water environmental protection measures have been implemented, such as lakeside sewage interception, sediment dredging, non-point source pollution control, ecological restoration, and revisions to protection regulations. Both engineering and non-engineering measures positively impact improving lake water quality. Consequently, IEPM is also incorporated into the model as a variable. Due to the complexity of environmental protection measures, it is difficult to describe them. Therefore, in this study, IEPM is set as a binary variable. According to its implementation time, it is 0 before the implementation time and 1 after the implementation time.
2.2. Stepwise Regression Model
This study employs stepwise regression analysis to examine changes in Lake Erhai’s water quality. The basic principle of stepwise regression is as follows: First, perform simple linear regressions of the dependent variable against each independent variable separately and rank the independent variables based on their goodness of fit. Then, introduce the independent variable with the highest fit into the model as the base variable. Subsequently, add other independent variables to the model one by one, simultaneously examining the significance of their t-test values. Variables with significant t-tests are retained; otherwise, they are removed. This process iterates until all significant independent variables are included in the model [41]. The model of this study is as follows:
In Equation (1), Ct is the explained variable, and the subscript t represents time; Xi,t is the explanatory variables, including temperature, rainfall, wind speed, GDP and population; D is also an explanatory variable, indicating whether environmental protection measures have been implemented, and it is a binary variable, with 0 if not implemented and 1 if implemented. βi and γ represent the coefficients of the explanatory variables; μ represents a constant term.
Since 2016, the local government of the Lake Erhai basin has vigorously protected the lake, implementing a series of measures including sewage treatment, ecological relocation, non-point source pollution control, management of inflowing rivers, mine rectification within the basin, suspension of construction on the eastern lakeshore, ecological restoration, and revision of the “Regulations on the Protection and Management of Lake Erhai” [13]. Therefore, 2016 is taken as the time node for the variable D: D = 0 before 2016 and D = 1 from 2016 onwards.
2.3. Water Quality Indicators and Data Sources
This paper selects three water quality indicators, namely CODMn, TP and TN, as the research objects. The water quality monitoring data of Lake Erhai mainly comes from the monthly water quality monitoring data of Dali Bai Autonomous Prefecture Environmental Monitoring Station from 2009 to 2019. It includes five regular water quality monitoring stations in the Lake Erhai area (Longkan, Tacun, Xiaoguanyi, Huxin and Taoyuan), and the monitoring points are shown in Figure 1. Longkan is located in the western lake area, Tachun is in the western lake area, Xiaoguanyi is in the southern lake area, Taoyuan is in the northern lake area, and the lake center is in the southern lake center. The GDP data is sourced from the Statistical Yearbook of Yunnan Province. The meteorological data of Lake Erhai adopted is sourced from National Centers for Environmental Information(https://www.ncei.noaa.gov).
2.4. Standardization of Pollutants Concentration
Due to the inconsistent limit value of water quality indicators, we adopt the water quality limit value for standardization treatment. According to the “ Surface Water Environmental Functional Zoning of Yunnan Province (2010–2020)” [42], the water environment function of Lake Erhai is classified as a national nature reserve, Grade I drinking water, general fish water, and swimming area, so it complies with Class II water quality standards.

Table 1.
Limit Value of Water quality Standard for Class II.
| Variable | CODMn | TP | TN |
| Water Quality Standard | ≤4 mg/L | ≤0.025 mg/L | ≤0.5 mg/L |
The index calculation formula of “Technical guidelines for environmental impact assessment surface water environment (HJ 2.3-2018)”. [43] was adopted to standardize the data:
In Equation (2), Sit is the index of water quality, a value greater than 1 indicates that the water quality indicator exceeds the limit value. Cit is the monitoring value of water quality; Cs is Limit Value of Water quality Standard.
3. Results
3.1. Statistical Description of Primary Variables
Descriptive statistics for Lake Erhai water quality indicators (CODMn, TP, TN), meteorological factors (air temperature, rainfall, wind speed), GDP of Dali Prefecture, and population of Dali Prefecture from 2009 to 2019 are summarized in Table 2. Except for CODMn, the average concentrations of both TP and TN exceeded their respective limit value, by 0.04 times and 0.1 times, respectively. The average air temperature was 16.3 °C, ranging from 8.0 °C to 22.9 °C. Average monthly rainfall was 80.7 mm, with a maximum of 322.8 mm.
The annual average concentrations of the water quality indicators are shown in Figure 3. The annual average concentration of CODMn exhibited a general upward trend. The annual average concentration of TN showed a pattern of initial decrease followed by an increase, with the lowest concentration occurring in 2014. Except for 2014, TN concentrations exceeded the limit value in all years. TP concentration fluctuated around the limit value. In summary, while CODMn concentration remained close to the limit value, TN and TP concentrations consistently exceeded it, with TN exceeding more severely than TP.
The monthly average concentrations of the water quality indicators are shown in Figure 4. Concentrations of CODMn, TP, and TN were generally higher in summer and autumn, but lower in winter and spring. CODMn concentration met the water quality standards in all months. TP concentration met the water quality standards during winter and spring. However, TN concentration failed to meet the water quality standard in any month.
The annual average values of meteorological factors are shown in Figure 5. Overall, from 2009 to 2019, air temperature, rainfall, and wind speed remained relatively stable without significant abrupt changes. The monthly average variations of meteorological factors are shown in Figure 5. Overall, rainfall and temperature patterns coincided, with higher rainfall occurring during periods of higher air temperature, and lower rainfall during cooler periods. In contrast to air temperature and rainfall, wind speed was higher in winter and spring and lower in summer and autumn.
Annual average population and GDP from 2009 to 2019 are shown in Figure 6. Both GDP and population exhibited clear increasing trends year by year, with largely similar annual growth rates.
3.2. Correlation Analysis
The correlation analysis between water quality indicators and meteorological factors is presented in Figure 7. The correlation coefficients of CODMn, TP, and TN with air temperature were 0.1414, 0.4133, and 0.2637, respectively, indicating positive correlations. The correlation coefficients of CODMn, TP, and TN with rainfall were 0.1988, 0.5205, and 0.3205, respectively, also indicating positive correlations. The correlation coefficients of CODMn, TP, and TN with wind speed were -0.3426, -0.6078, and -0.3698, respectively, indicating negative correlations. Overall, among meteorological factors, the three water quality indicators were positively correlated with air temperature and rainfall but negatively correlated with wind speed. Distinct seasonal patterns were observed across all water quality indicators (Figure 7).
The correlation analysis between water quality indicators and GDP and population is shown in Figure 7. The correlation coefficients of CODMn, TP, and TN with GDP were 0.7877, 0.1211, and 0.1118, respectively, indicating positive correlations. The correlation coefficients of CODMn, TP, and TN with population were 0.7591, 0.1312, and 0.1899, respectively, also indicating positive correlations.
3.3. Stepwise Regression Estimation
Given that Lake Erhai’s water quality results from the combined effects of multiple factors, a comprehensive consideration of all variables is necessary. Since the population and GDP indicators have similar changing patterns, to avoid multicollinearity, GDP is calculated as an indicator of human activities. Stepwise regression analysis was conducted using Stata 15.1 software. To avoid the influence of substantial disparities in water quality indicators on correlation coefficients, standardized data were used in the calculations. With a maximum variance inflation factor (VIF) of only 2.04 (far below the threshold of 10), the model shows no evidence of multicollinearity. The regression coefficients reflect the influence of each factor on Lake Erhai’s water quality. A positive coefficient indicates a positive effect (increasing concentration), while a negative coefficient indicates a negative effect (decreasing concentration). The analysis results are presented in Table 3.
According to the stepwise regression results (Table 3):
- The regression coefficients of CODMn with GDP is 0.0043, respectively (positive and significant). The coefficients with wind speed is -0.0413, respectively (negative and significant). The regression coefficients with air temperature, rainfall and IEPM are not statistically significant.
- The regression coefficients of TP with air temperature and rainfall are 0.0077 and 0.0008, respectively (both positive and significant). The coefficient with wind speed is -0.2080 (negative and significant). The regression coefficients with GDP and IEPM are not significant.
- The regression coefficient of TN with rainfall is 0.0003 (positive and significant). The coefficient with wind speed is -0.0766 (negative and significant). The regression coefficients with air temperature, GDP and IEPM are not significant.
From the perspective of influencing factors:
- Air temperature significantly affects TP concentration (positive correlation) but has no significant effect on CODMn or TN.
- Rainfall significantly affects TP and TN concentrations (positive correlations), with a greater impact on TP than TN, but has no significant effect on CODMn.
- Wind speed significantly affects all three water quality indicators (CODMn, TP, TN), showing negative correlations.
- IEPM show no significant impact on CODMn, TP or TN concentrations.
4. Discussion
4.1. Influence of Climate Change on Water Quality
Firstly, air temperature is positively correlated with TP concentration but shows no significant correlation with CODMn or TN. According to relevant literature [44], rising air temperature enhances thermal stratification in lakes, weakening vertical mixing. This accelerates the release of nutrients from sediments under anaerobic conditions [45,46], ultimately increasing pollutant concentrations in the water column [47]. This temperature effect is more pronounced in shallow lakes [48,49]. Lake Erhai is a large, moderately shallow lake. Therefore, increasing air temperature contributes to higher pollutant concentrations. This study’s results also indicate that different pollutants respond inconsistently to air temperature: TP shows a clear response, while CODMn and TN do not exhibit significant responses.
Secondly, rainfall is positively correlated with TN and TP concentrations, while its correlation with CODMn is not significant. TN and TP pollutants in Lake Erhai primarily originate from agricultural non-point sources. The Lake Erhai basin has well-developed agriculture, largely reliant on irrigation, with farmland runoff discharging directly into adjacent ditches and rivers. Increased rainfall leads to greater pollutant loads entering Lake Erhai, causing TN and TP concentrations to rise. Conversely, CODMn in Lake Erhai mainly stems from urban domestic and industrial point sources. The influx of CODMn pollutants does not necessarily increase with rainfall, explaining why its concentration does not show a significant rise with increased precipitation.
Finally, wind speed is negatively correlated with CODMn, TN, and TP concentrations. Wind is the primary driver of water movement in shallow lakes. Lake Erhai, bordered by mountains to the east (Yuanshan) and west (Diancangshan), lies in a north-south oriented canyon with an average depth of 10.8 meters. Consequently, lake water movement depends predominantly on wind. Wind-driven currents facilitate the transport and diffusion of pollutants entering the lake. Additionally, wind speed influences vertical mixing and material fluxes within the lake, affecting chemical and biological processes [44]. The research results indicate that increased wind speed reduces the concentrations of CODMn, TN, and TP. This is mainly attributed to enhanced hydrodynamic conditions within Lake Erhai driven by higher wind speeds in its basin, which accelerate the dilution and degradation of pollutants.
4.2. Influence of Human Activity on Water Quality
Socio-economic development is undoubtedly another major factor influencing Lake Erhai’s water quality. Located at the basin’s center and lowest point, Lake Erhai serves as the water source for surrounding production and domestic activities while continuously receiving wastewater and non-point source pollution from farmland. Furthermore, the rapid economic growth and booming tourism industry in the Lake Erhai basin over the past decade have increased pollutant loads, directly impacting the lake’s water quality. The results show that GDP is positively correlated with CODMn concentration but show no significant correlation with TP or TN. This is because CODMn primarily originates from urban sewage and industrial wastewater, whereas TP and TN mainly come from agricultural non-point sources. Increases in GDP predominantly affect urban and industrial point sources, with less impact on agricultural non-point sources.
Since 2016, alongside socio-economic development, the local government has implemented numerous measures to improve Lake Erhai’s water quality. Our results indicate that the IEPM shows no significant correlation with CODMn, TN or TP concentrations. These indicate that these measures have little impact on the concentrations of CODMn, TP and TN. Due to the inherent complexity of non-point source pollution, the effectiveness of control measures requires longer timeframes to manifest.
4.3. Key Points of Environmental Protection Measures in Erhai Lake
Monitoring results indicate that CODMn concentration is approaching the limit value, TN concentration consistently exceeds it, and TP concentration fluctuates around the limit. The study results show that increasing air temperature will lead to higher pollutant concentrations. The annual average air temperature in the Dali area shows a fluctuating upward trend, and climate warming is evident [21,50], which will exacerbate pollutant concentration increases. Furthermore, the results indicate that increasing GDP will also contribute to higher pollutant concentrations. It is foreseeable that the GDP of the Lake Erhai basin will continue to rise, consequently leading to increasing pollutant concentrations in the lake. Therefore, strengthening the protection of Lake Erhai’s water quality and implementing effective governance measures remains a long-term task. In contrast to eutrophic Lake Dian, Lake Erhai currently maintains relatively good water quality. With appropriate intervention, a continued improving trend can be anticipated. Based on the identified main influencing factors, this article proposes the following two key recommendations:
Firstly, strengthen the implementation and effectiveness of non-point source pollution control. Despite numerous water environmental protection measures implemented after 2016, the complexity of non-point source pollution has prevented significant reductions in TP and TN concentrations. Furthermore, due to the positive correlation between rainfall and TP/TN concentrations, large amounts of non-point source pollutants may enter the lake during the rainy season. Therefore, it is essential to (1) ensure the effective implementation of existing non-point source pollution control measures, and (2) formulate and implement more powerful and targeted non-point source pollution control strategies for Lake Erhai. For instance, inter-basin water diversion is used to supplement clean water and improve the water environment capacity of Lake Erhai.
Secondly, enhance water quality monitoring and algal bloom prevention during summer. In the Lake Erhai basin, the dry season spans November to April, while the rainy season lasts from May to October. May to October are also the months with the higher air temperatures. Given the positive correlation of TP concentration with both air temperature and rainfall, the climatic conditions of high rainfall and high temperature during summer can lead to significant increases in TP concentration. High air temperatures combined with elevated TP concentrations substantially increase the risk of algal blooms in Lake Erhai during summer. Therefore, the local ecological and environmental department should prioritize summer as the key season for algal bloom prevention and control. This includes strengthening water quality monitoring frequency and parameters, and formulating robust environmental emergency response plans specifically for this period.
5. Conclusions
This paper classified the primary factors influencing water quality into climate change and human activities, constructing a stepwise regression model for analysis. By examining the relationships between air temperature, rainfall, wind speed, GDP, population, IEPM, and the concentrations of CODMn, TP, and TN in Lake Erhai, the key factors affecting different pollutants were identified. The main conclusions are as follows:
Firstly, different climatic factors affect different pollutants. Air temperature primarily influences TP concentration and exhibits a positive correlation. Rainfall predominantly affects TP and TN concentrations, showing positive correlations. Wind speed affects CODMn, TP, and TN concentrations, exhibiting negative correlations.
Secondly, human activities mainly impact CODMn concentration but have no significant effect on TP or TN concentrations. Specifically, GDP show positive correlations with CODMn.
Finally, to protect Lake Erhai’s water quality, this study proposes the following recommendations: (1) On the foundation of ensuring the effectiveness of current non-point source pollution control measures, develop and implement more powerful and targeted control strategies; (2) The local ecological and environmental department should prioritize monitoring Lake Erhai’s water quality during the summer months, focusing on preventing algal blooms and establishing specific environmental emergency response measures for this critical period. Due to data availability constraints (only up to 2019), the effects of recent environmental protection measures have not yet been empirically captured in our analysis. In subsequent research, we plan to extend the data series to more fully assess and illustrate the role of these measures in protecting Lake Erhai.
Abbreviations
The following abbreviations are used in this manuscript:
| CODMn | Chemical oxygen demand (potassium permanganate index) |
| TN | Total nitrogen |
| TP | Total phosphorus |
| IEPM | Implementation of environmental protection measure |
| GDP | Gross domestic product |
References
- Wu, Qinglong; Wang, Yunfei. On the succession of Aquatic Communities in Lake Erhai. Journal of Lake Sciences 1999, 11(3), 267–273. [Google Scholar]
- Du, Baohan. Sino-Japanese joint survey on the ecological condition of Lake Erhai. Oceanologia Et Limnologia Sinica 1994, 25(5), 532–538. [Google Scholar]
- Eisma, D.; Sun, S.; Song, X.; Thomasse, E. Sedimentation in Lake Erhai, Yunnan Province, China. Journal of Lake Sciences 2000, 12(1), 25–27. [Google Scholar] [CrossRef]
- Ni, Changjian. Gray prediction of the development trend of nourishment state in Er Sea. Journal of Chengdu University of Information Technology 2001, 16(2), 117–118. [Google Scholar] [CrossRef]
- Dong, Yunxian. Research on blue algae plankton bloom in Lake Erhai. Yunnan Environmental Science 1999, 18(4), 28–31. [Google Scholar] [CrossRef]
- Zhao, Fengqin. Water quality analysis and comprehensive assessment of Lake Erhai. Yunnan Environmental Science 1998, 17(3), 35–37. [Google Scholar] [CrossRef]
- Pan, Hongxi; Wang, Yunfei; Dong, Yunsheng. Factor analysis of eutrophication in Lake Erhai. Journal of Lake Sciences 1999, 11(2), 184–188. [Google Scholar] [CrossRef]
- Du, Baohan. Study on eutrophication of Lake Erhai. Journal of Lake Sciences 1992, 4(2), 86–92. [Google Scholar]
- Han, Tao; Peng, Wenqi; Li, Huaien; Mao, Zhanpo. Evolution of eutrophication in the Lake Erhai and its relevantresearch progress. Journal of China Institute of Water Resources and Hydropower Research 2005, 3(1), 71–3, 78. [Google Scholar] [CrossRef]
- Guo, Honglong. Discussion of Water Environmental Changes in Lake Erhai. Environmental Science Survey 2018, 37(04), 22–5. [Google Scholar] [CrossRef]
- Yang, Hua; Li, Hongyan; Li, Lihuai. Study on Temporal and Spatial Variation of Phosphorus Load in Erhai inflow riversand Eutrophication in Lake Erhai in 2015. Pearl River 2017, 38(7), 77–9. [Google Scholar] [CrossRef]
- Chen, Xiaohua; Qian, Xiaoyong; Li, Xiaoping; Wei, Zhihong; Hu, Shuangqing. Long-term trend of eutrophication state of Lake Erhai in 1988-2013 and analyses of its socio-economic drivers. Journal of Lake Sciences 2018, 30(1), 70–8. [Google Scholar] [CrossRef]
- Chen, Zhenyong. Carrying out lake protection and promoting ecological civilization Construction -- Taking Lake Erhai as an example. Creation 2022, 30(03), 12–3. [Google Scholar]
- Hu, Qimin. Study on pretection and management mode of Plateau Lake-A case study of Lake Erhai. Yunnan Water Power 2022, 38(06), 32–6. [Google Scholar] [CrossRef]
- Yang, J.; Huang, X. The 30 m annual land cover datasets and its dynamics in China from 1985 to 2023. Earth System Science Data 2024, 13(Issue), Pages. [Google Scholar] [CrossRef]
- Pang, Yan; Xiang, Song; Chu, Zhaosheng; Xue, Liqiang; Ye, Bibi. Relationship between agricultural land and water quality of inflow river in Lake Erhai basin. Enviromental Science 2015, 36(11), 4005–12. [Google Scholar] [CrossRef]
- Wang, Mingjie; Yu, Bin; Zhou, Rongrong; Wang, Yi. Correlating analysis of water environment pollution and water enviroment change in Erhai River Basin. Journal of Central China Normal University(Nat. Sci.) 2020, 54(04), 700–10. [Google Scholar] [CrossRef]
- Ma, Wei; Su, Jianguang; Yang, Yang; Jiang, Rucheng; Wu, Jinhai. Study on the evolution characteristics of water quality and its key impact factors of Lake Erhai. Journal of China Institute of Water Resources and Hydropower Research 2022, 20(02), 112–9. [Google Scholar] [CrossRef]
- Shi, Hongbo; Huang, Yue; Li, Jie; Yang, Lirui. Water quality evaluation and source analysis of pollutants of the Lake Erhai. Water Resources and Power 2021, 39(10), 72–5. [Google Scholar]
- Zhang, Haoxia. Analysis of temporal and spatial changes of total nitrogen of Lake Erhai from 1985 to 2019. Environmental Science Survey 2020, 39(06), 4–10. [Google Scholar] [CrossRef]
- Huang, Mingyu. Water quality characteristics and pollution load estimation of main rivers around Lake Erhai. Yangtze River 2022, 53(01), 61–6. [Google Scholar] [CrossRef]
- An, Guoying; Guo, Zhaocheng; Ye, Pei. Climate impacts and Its effects on water quality of Lake Erhai during the period of 1989-2019 in Dali area, Yunnan. Geoscience 2022, 36(02), 406–17. [Google Scholar] [CrossRef]
- Zheng, Liang; An, Zeyu; Chen, Xiaoling; Liu, Hai. Changes in Water Environment in Lake Erhai and Its Influencing Factors. WATER 2021, 13(10), 1362. [Google Scholar] [CrossRef]
- Ke, Gaofeng; Ding, Lieyun. City economic development and empirical analysis of the lake water environmental protection--Lake Erhai and its watershed as an example. Economic Geography 2009, 29(09), 1546–1551. [Google Scholar]
- Kang, Jian. Climate change characteristics and its influence on hydrology and water quality in Wuliangsuhai Basin in recent 50 years. In Hebei University of Engineering; 2016; p. 10. [Google Scholar]
- Long, Tian-yu; Wu, Lei; Meng, Guo-hu; Guo, Wei-hua. Numerical simulation for impacts of hydrodynamic conditions on algae growth in Chongqing Section of Jialing River, China. Ecological Modelling 2010, 222(1), 112–119. [Google Scholar] [CrossRef]
- Whitehead, PG; Wilby, RL; Battarbee, RW; Kernan, M; Wade, AJ. A review of the potential impacts of climate change on surface water quality. Hydrological Sciences Journal. 2009, 54(1), 101–123. [Google Scholar] [CrossRef]
- Hassan, Hany; Hanaki, Keisuke; Matsuo, Tomonori. A modeling approach to simulate impact of climate change in lake water quality: Phytoplankton growth rate assessment. Water Science and Technology 1998, 37(2), 177–185. [Google Scholar] [CrossRef]
- Gómez Martínez Gabriel; Lorena, Galiano; Toni, Rubio. Effects of Climate Change on Water Quality in the Jucar River Basin (Spain). Water 2020, 13(17), 2424–2424. [Google Scholar] [CrossRef]
- Zhang, Zhi-ming; Wang, Xiao-yan; Ma, Wen-lin; Zhang, Jun-zhi; Pan, Run-ze; Yang, Ruo-zi. The effects of global warming on purification processes of Tongzhou section of Beiyun river. China environment Science 2017, 37(2), 730–739. [Google Scholar] [CrossRef]
- Lian, Huishu; Liu, Hongbin; Li, Xudong; Song, Ting; Liu, Shen; Lei, Qiuliang; Ren, Tianzhi; Wu, Shuxia; Li, Ying. Characteristics of nitrogen variation and its response to rainfall: a case study in Wuxi Port at Taihu Lake Basin. Environmental Science 2017, 38(12), 5047–5055. [Google Scholar] [CrossRef]
- Wu, Lei; Peng, Mengling; Qiao, Shanshan; Ma, xiaoyi. Assessing impacts of rainfall intensity and slope on dissolved and adsorbed nitrogen loss under bare loessial soil by simulated rainfalls. CATENA 2018, 170, 51–63. [Google Scholar] [CrossRef]
- Hao, Lipeng. Characteristics of nitrogen and phosphorus losses ofrainfall runoff in Liaoning Hunhe Basin; Shenyang Agricultural University: Shenyang, 2012. [Google Scholar]
- Zhang, Lin; Huang, Zhilin; Xiao, Wenfa; Zeng, Lixiong; Song, Wenmei. Characteristics of nitrogen and phosphorus output in runoff and rainfall runoff in Lanlingxi watershed, Three Gorges reservoir area. Environmental Science 2018, 39(2), 792–799. [Google Scholar] [CrossRef]
- Huang, Jiacong; Zhang, Yinjun; Arhonditsis, George B.; Gao, Junfeng; Chen, Qiuwen; Wu, Naicheng; Dong, Feifei; Shi, Wenqing. How successful are the restoration efforts of China’s lakes and reservoirs? Environment International 2019, 123, 96–103. [Google Scholar] [CrossRef]
- Song, Daping; Zuo, Qiang; Liu, Bensheng; Zou, Guoyuan; Liu, Dongsheng. Estimation of spatio-temporal variability and health risks of nitrogen emissions from agricultural non-point source pollution: a case study of the Huaihe River Basin, China. Journal of Agro-Environment Science 2018, 37(6), 1219–1231. [Google Scholar] [CrossRef]
- Wang, Xiaoling; Li, Jiansheng; Li, Songmin; Zheng, Xiaotong. A study on removing nitrogen from paddy field rainfall runoff by an ecological ditch-zeolite barrier system. Environmental Science and Pollution Research 2017, 24(35), 27090–27103. [Google Scholar] [CrossRef]
- Li, Xiaohong; Lei, Qiuliang; Zhou, Jiaogen; Zhang, Yitao; Li, Ying; Hu, Wanli; Wu, Shuxia; Zhai, Limei; Wang, Hongyuan; Liu, Hongbin. Effect of Rainfall Intensity on the Content of Nitrogen and Phosphorus Components in Plateau Areas: A Case Study of the Fengyu River Watershed. Environmental Science 2019, 40(12), 5375–5383. [Google Scholar] [CrossRef]
- Wang, Xuelian; Liu, Bo; Huang, Zhenfang; Du, Longgang. Changes of water quality before and after rainfall in Typical Watersheds in Beijing. Beijing Water 2022, 2, 38–41. [Google Scholar] [CrossRef]
- Ma, Wei; Liao, Wengen; Kuang, Shangfu; Yu, Xuezhong. Analysis on designed wind field condition for pollution capacity calculation in a large-scale shallow lake. Journal Of Hydraulic Engineering 2009, 40(11), 1313–1319. [Google Scholar] [CrossRef]
- Yang, Weizhong. Statistical analysis and experimental instruction by Stata; Tsinghua University Press: Beijing, 2021. [Google Scholar]
- Department of Ecology and Environment of Yunnan Province. Surface Water Environmental Functional Zoning of Yunnan Province (2010–2020). Available online: http://sthjt.yn.gov.cn/zwxx/zfwj/gsgg/201804/t20180417_178523.html (accessed on 26 February 2022).
- echnical guidelines for environmental impact assessment surface water environment (HJ 2.3-2018). Ministry of Ecology and Environment of the People’s Republic of China (Accessed on 1 March 2019).
- Zhang, Chen; Lai, Shiyu; Gao, Xueping. A review of the potential impacts of climate change on water environment in lakes and reservoirs. Journal of Lake Sciences 2016, 28(4), 691–700. [Google Scholar] [CrossRef]
- Wang, Sheng; Qian, Xin; Han, Bo-Ping; Luo, Lian-Cong; Hamilton, David P. Effects of local climate and hydrological conditions on the thermal regime of a reservoir at Tropic of Cancer, in southern China. Water Research 2012, 46(8), 2591–2604. [Google Scholar] [CrossRef]
- Komatsu, E; Fukushima, T; Harasawa, H. A modeling approach to forecast the effect of long-term climate change on lake water quality. Ecological Modelling 2007, 209, 351–366. [Google Scholar] [CrossRef]
- Wilhelm, Susann; Adrian, Rita. Impact of summer warming on the thermal characteristics of a polymictic lake and consequences for oxygen, nutrients and phytoplankton. Freshwater Biology 2008, 53(2), 226–237. [Google Scholar] [CrossRef]
- Mooij, Wolf M.; Hu¨ lsmann, Stephan; Domis, Lisette N. De Senerpont; Nolet, Bart A.; Bodelier, Paul L. E.; Boers, Paul C. M.; Pires, L. Miguel Dionisio; Gons, Herman J.; Ibelings, Bas W.; Noordhuis, Ruurd; Portielje, Rob; Wolfstein, Kirsten; Lammens, Eddy H. R. R. The impact of climate change on lakes in the Netherlands: a review. Aquatic Ecology 2005, 39(4), 381–400. [Google Scholar] [CrossRef]
- Schep, S; Ter Heerdt, G; Janse, J; Ouboter, M. Possible effects of climate change on ecological functioning of shallow lakes,Lake Loenderveen as a case study. Annals of Warsaw University of Life Sciences SGGW Land Reclamation 2007, 38(1), 95–104. [Google Scholar] [CrossRef]
- Yang, Kunyu. Study on the impact of climate change on ecological quality of Erhai basin in Yunnan. Heilongjiang Environmental Journal 2023, 36(6), 40–42. [Google Scholar] [CrossRef]
Figure 1.
Location of Lake Erhai and monitoring stations (Digital Elevation Model data is provided by Geospatial Data Cloud site, Computer Network Information Center, Chinese Academy of Sciences (http://www.gscloud.cn)); The land use data is sourced from the China land cover dataset of Wuhan University in 2023[15]).
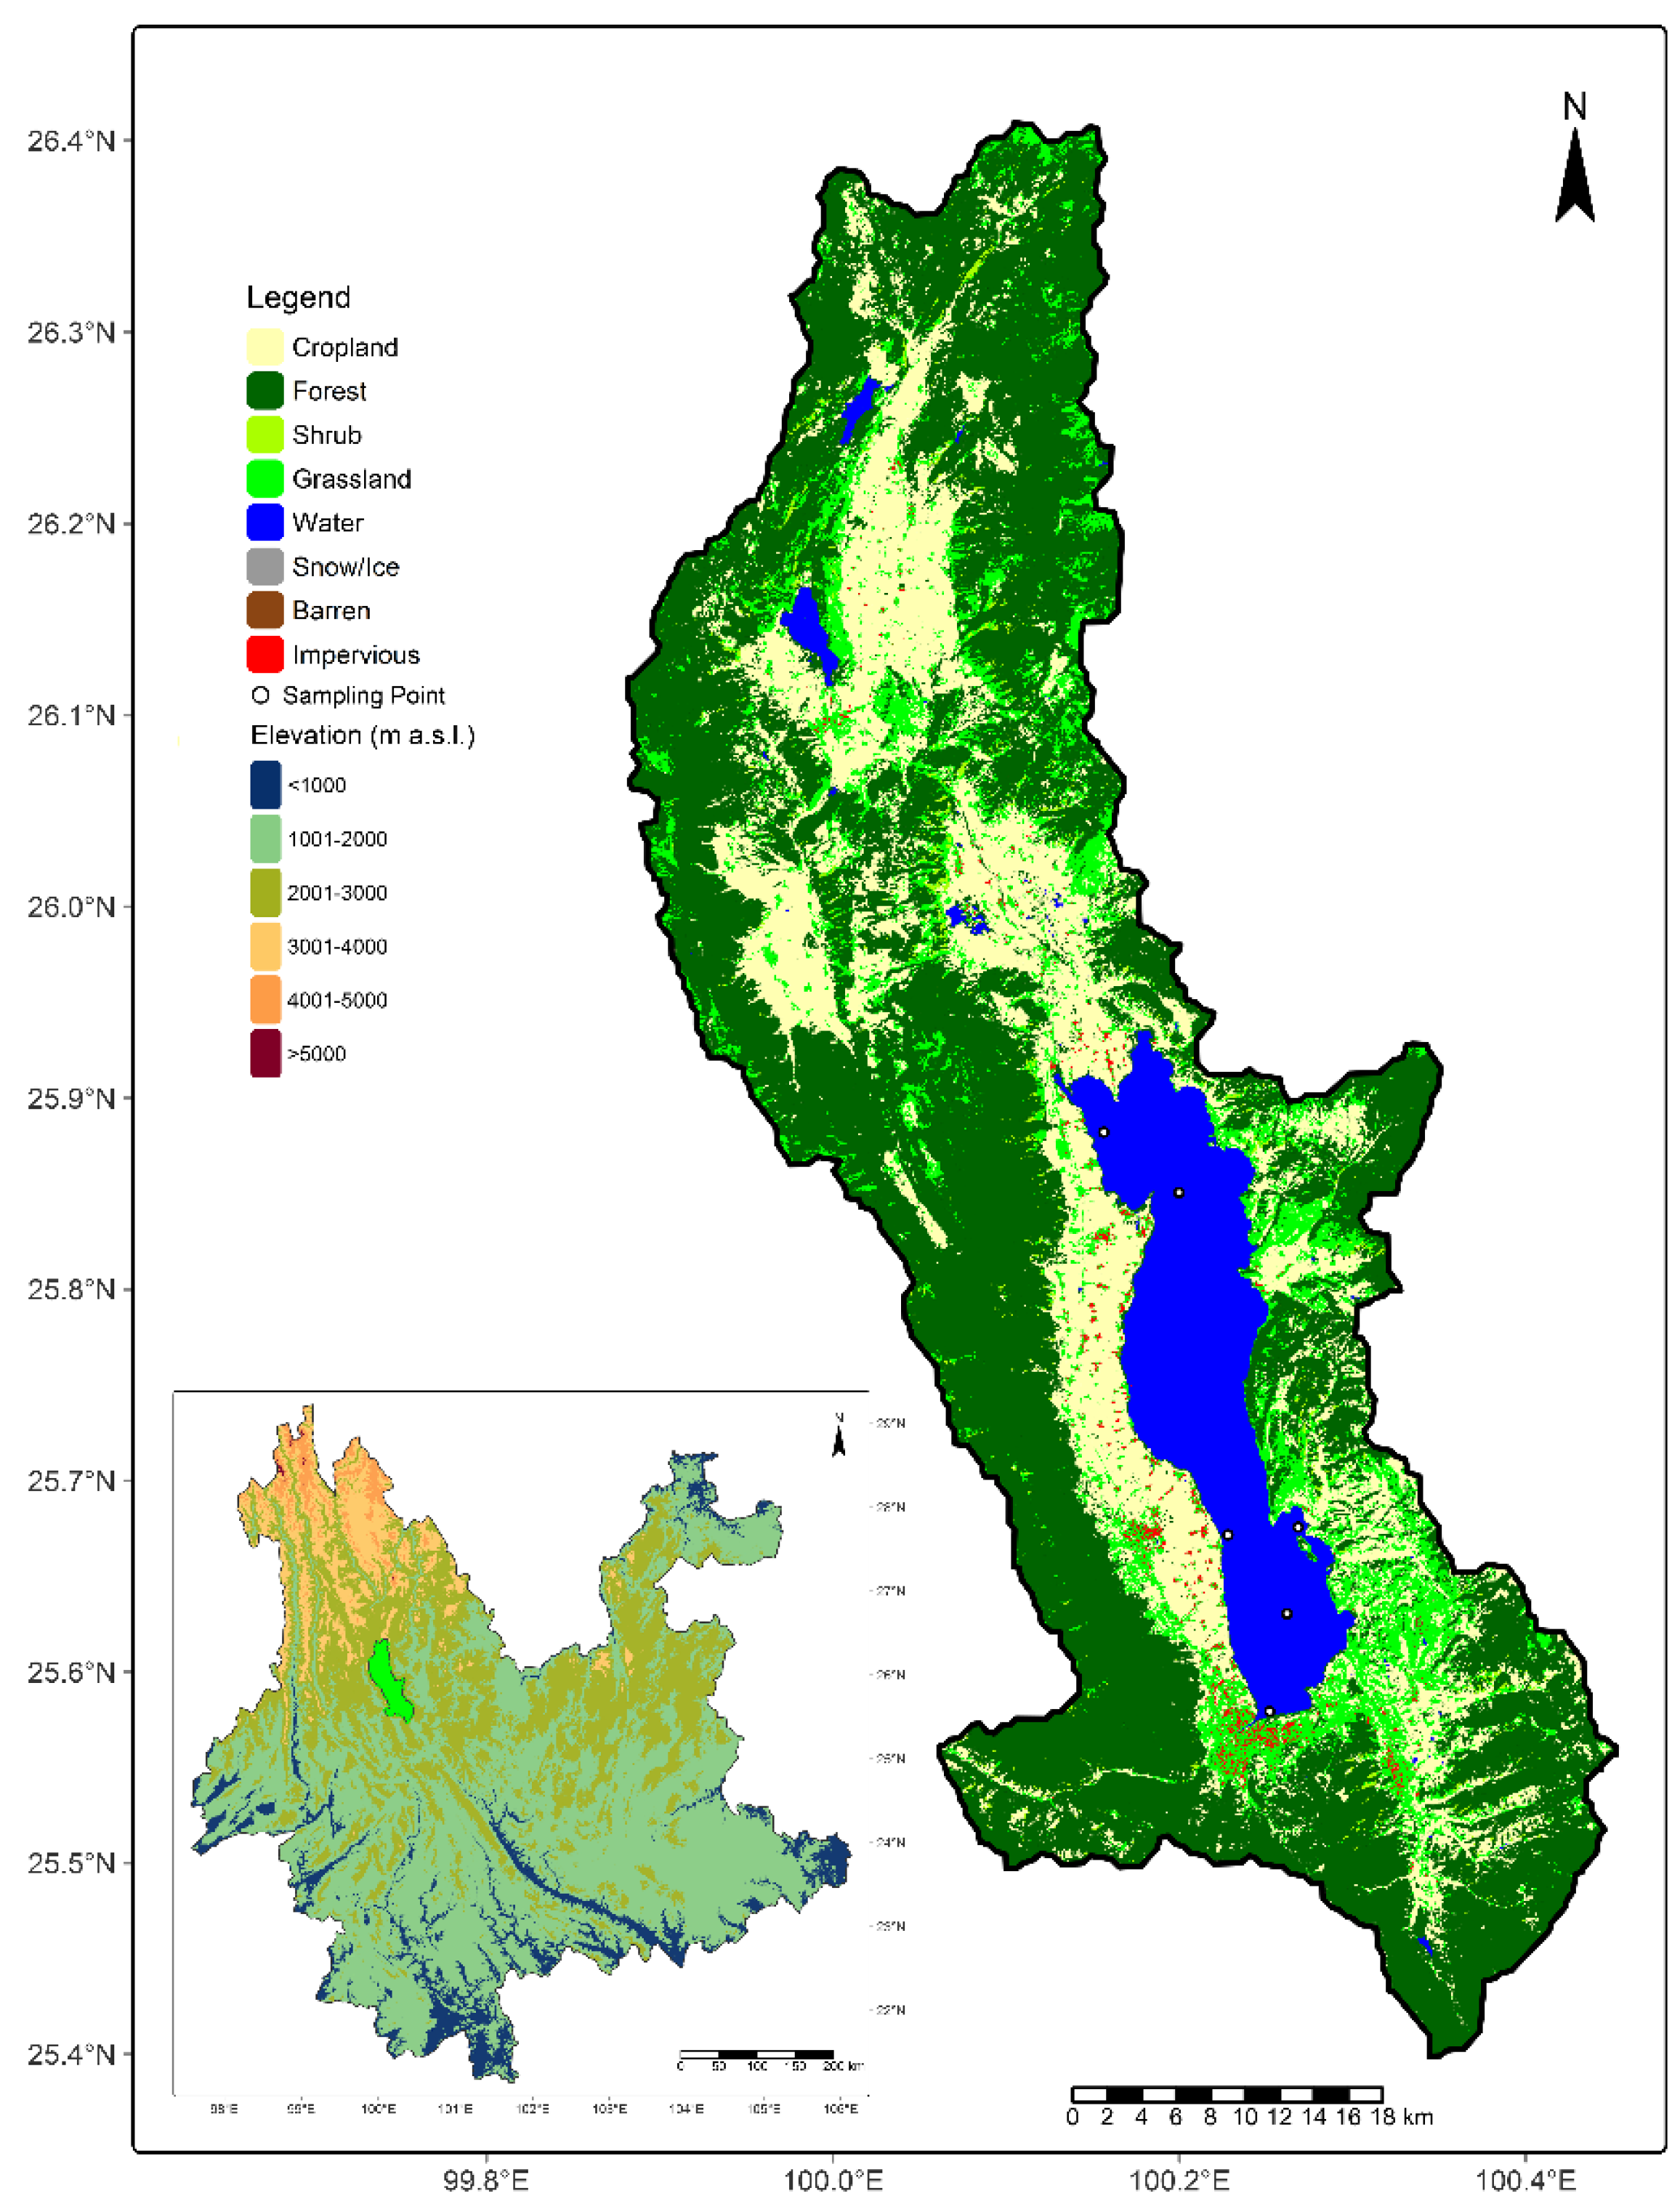
Figure 2.
The schematic diagram of various factors of Lake Erhai.
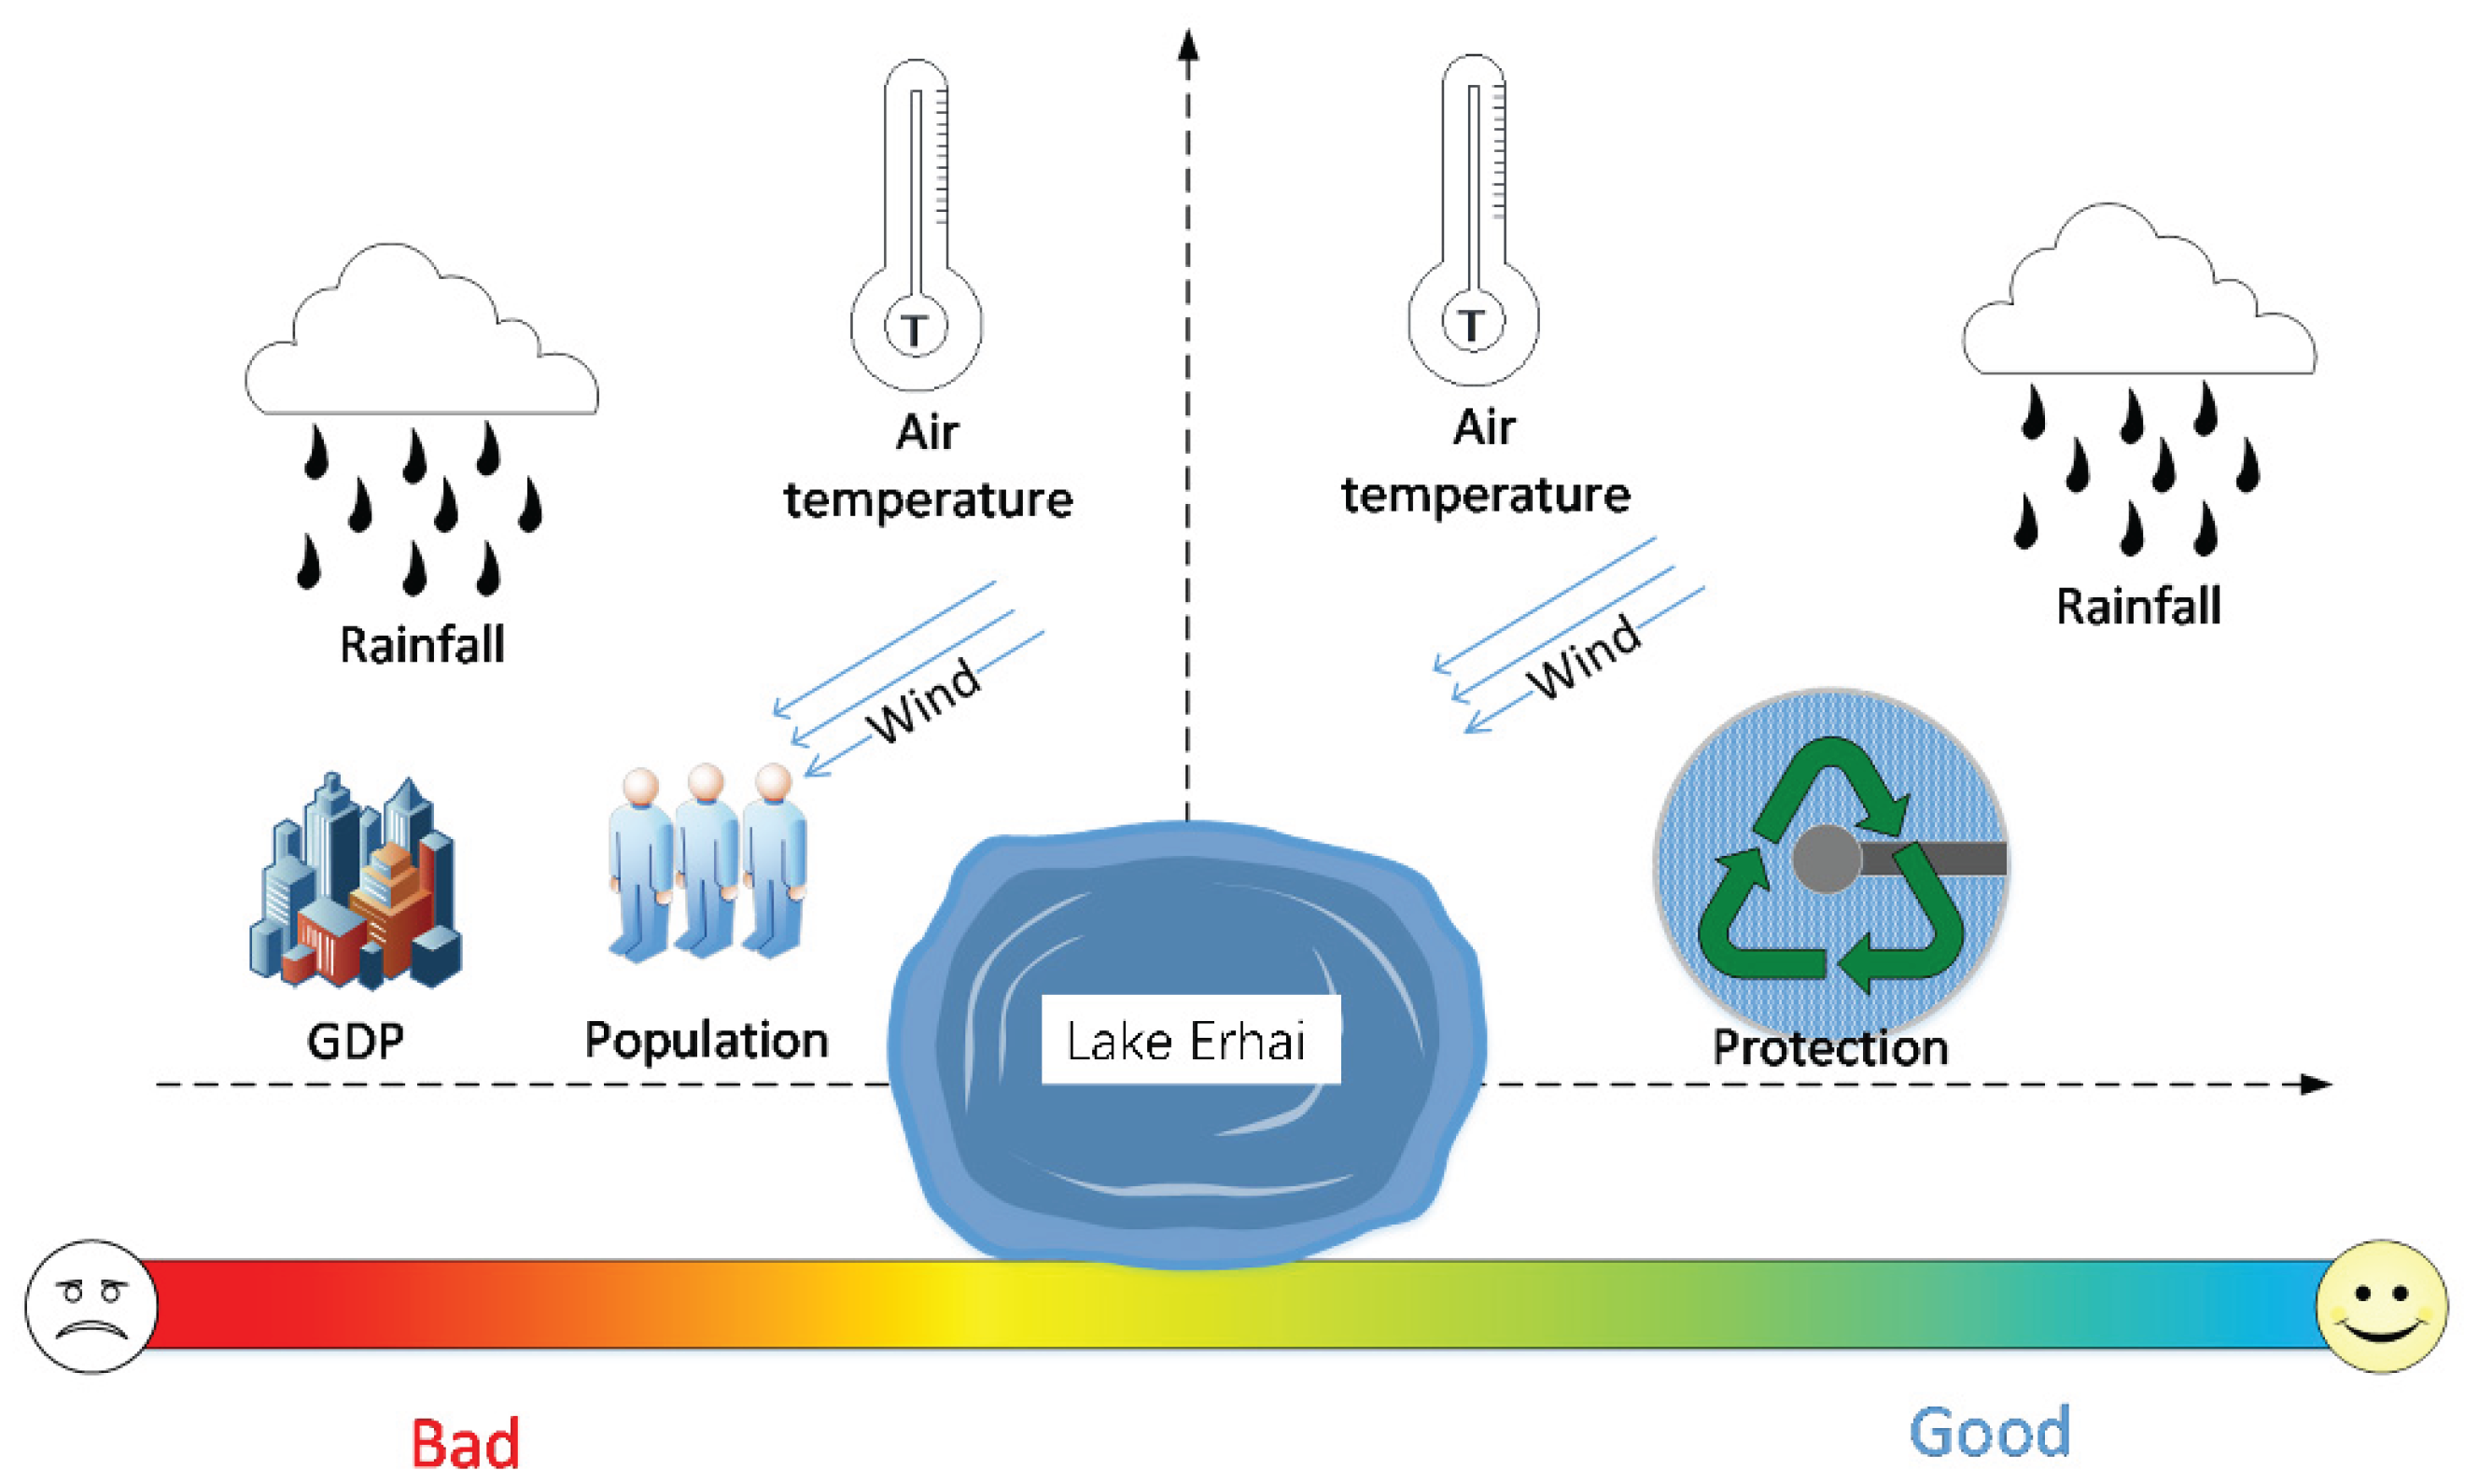
Figure 3.
Violin plot of yearly average concentrations of CODMn (a), TP (b), and TN (c) from 2009 to 2019 in Lake Erhai (five monitoring sections: Longkan, Tacun, Xiaoguanyi, Huxin, and Taoyuan).
Figure 3.
Violin plot of yearly average concentrations of CODMn (a), TP (b), and TN (c) from 2009 to 2019 in Lake Erhai (five monitoring sections: Longkan, Tacun, Xiaoguanyi, Huxin, and Taoyuan).
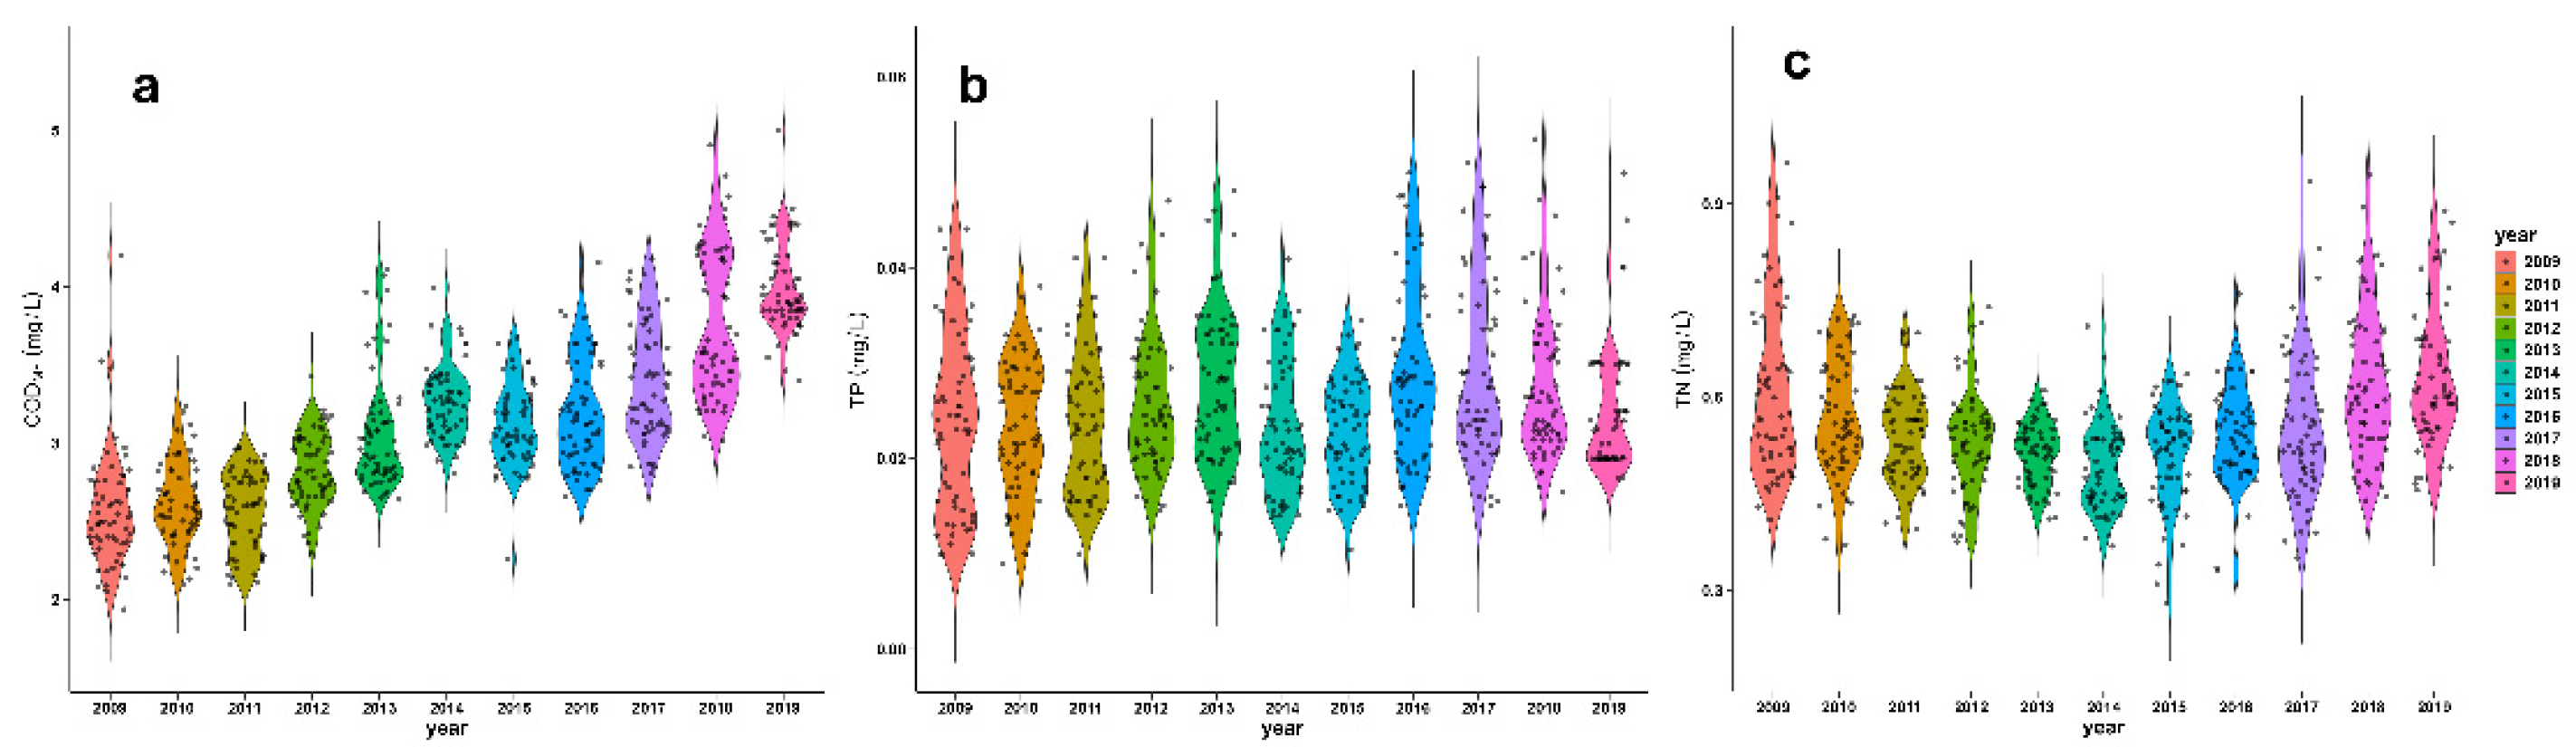
Figure 4.
Violin plot of monthly average concentrations of CODMn (a), TP (b), and TN (c) from 2009 to 2019 in Lake Erhai (five monitoring sections: Longkan, Tacun, Xiaoguanyi, Huxin, and Taoyuan).
Figure 4.
Violin plot of monthly average concentrations of CODMn (a), TP (b), and TN (c) from 2009 to 2019 in Lake Erhai (five monitoring sections: Longkan, Tacun, Xiaoguanyi, Huxin, and Taoyuan).
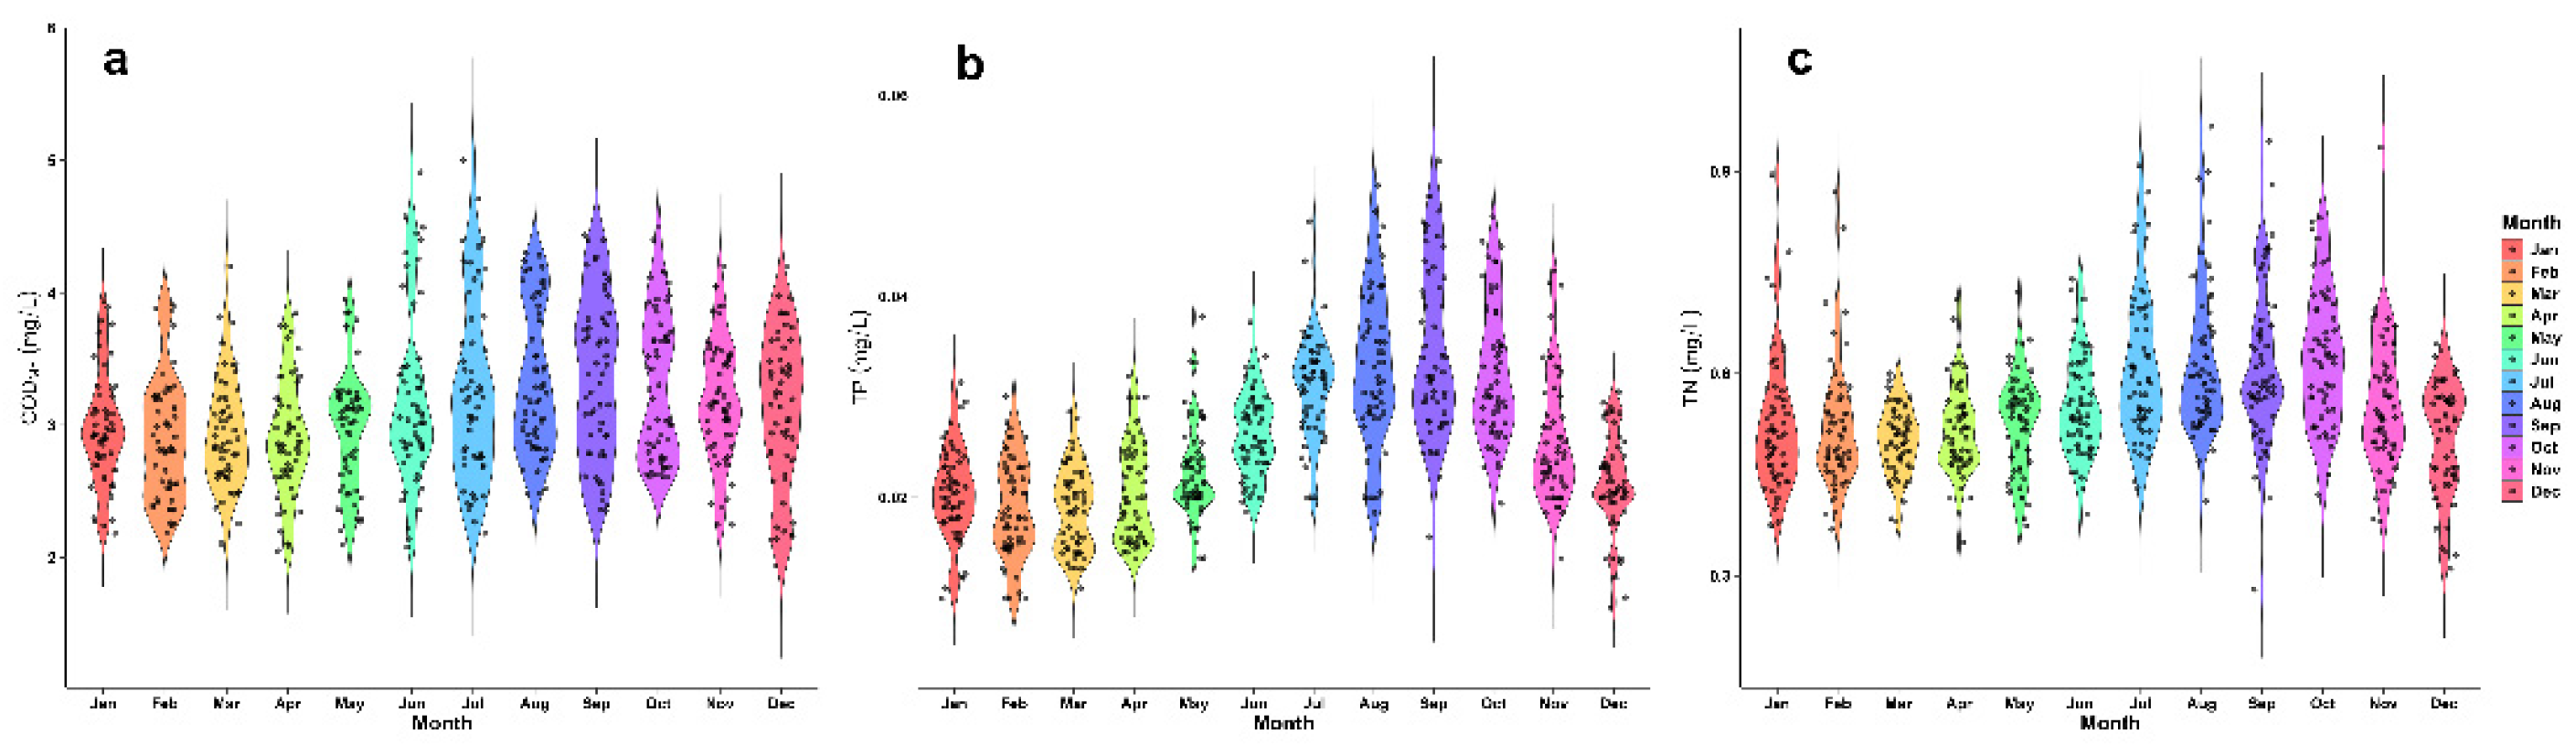
Figure 5.
Characteristics of air-temperature, rainfall and wind-speed from 2009 to 2019 at Dali Meteorological Station.
Figure 5.
Characteristics of air-temperature, rainfall and wind-speed from 2009 to 2019 at Dali Meteorological Station.
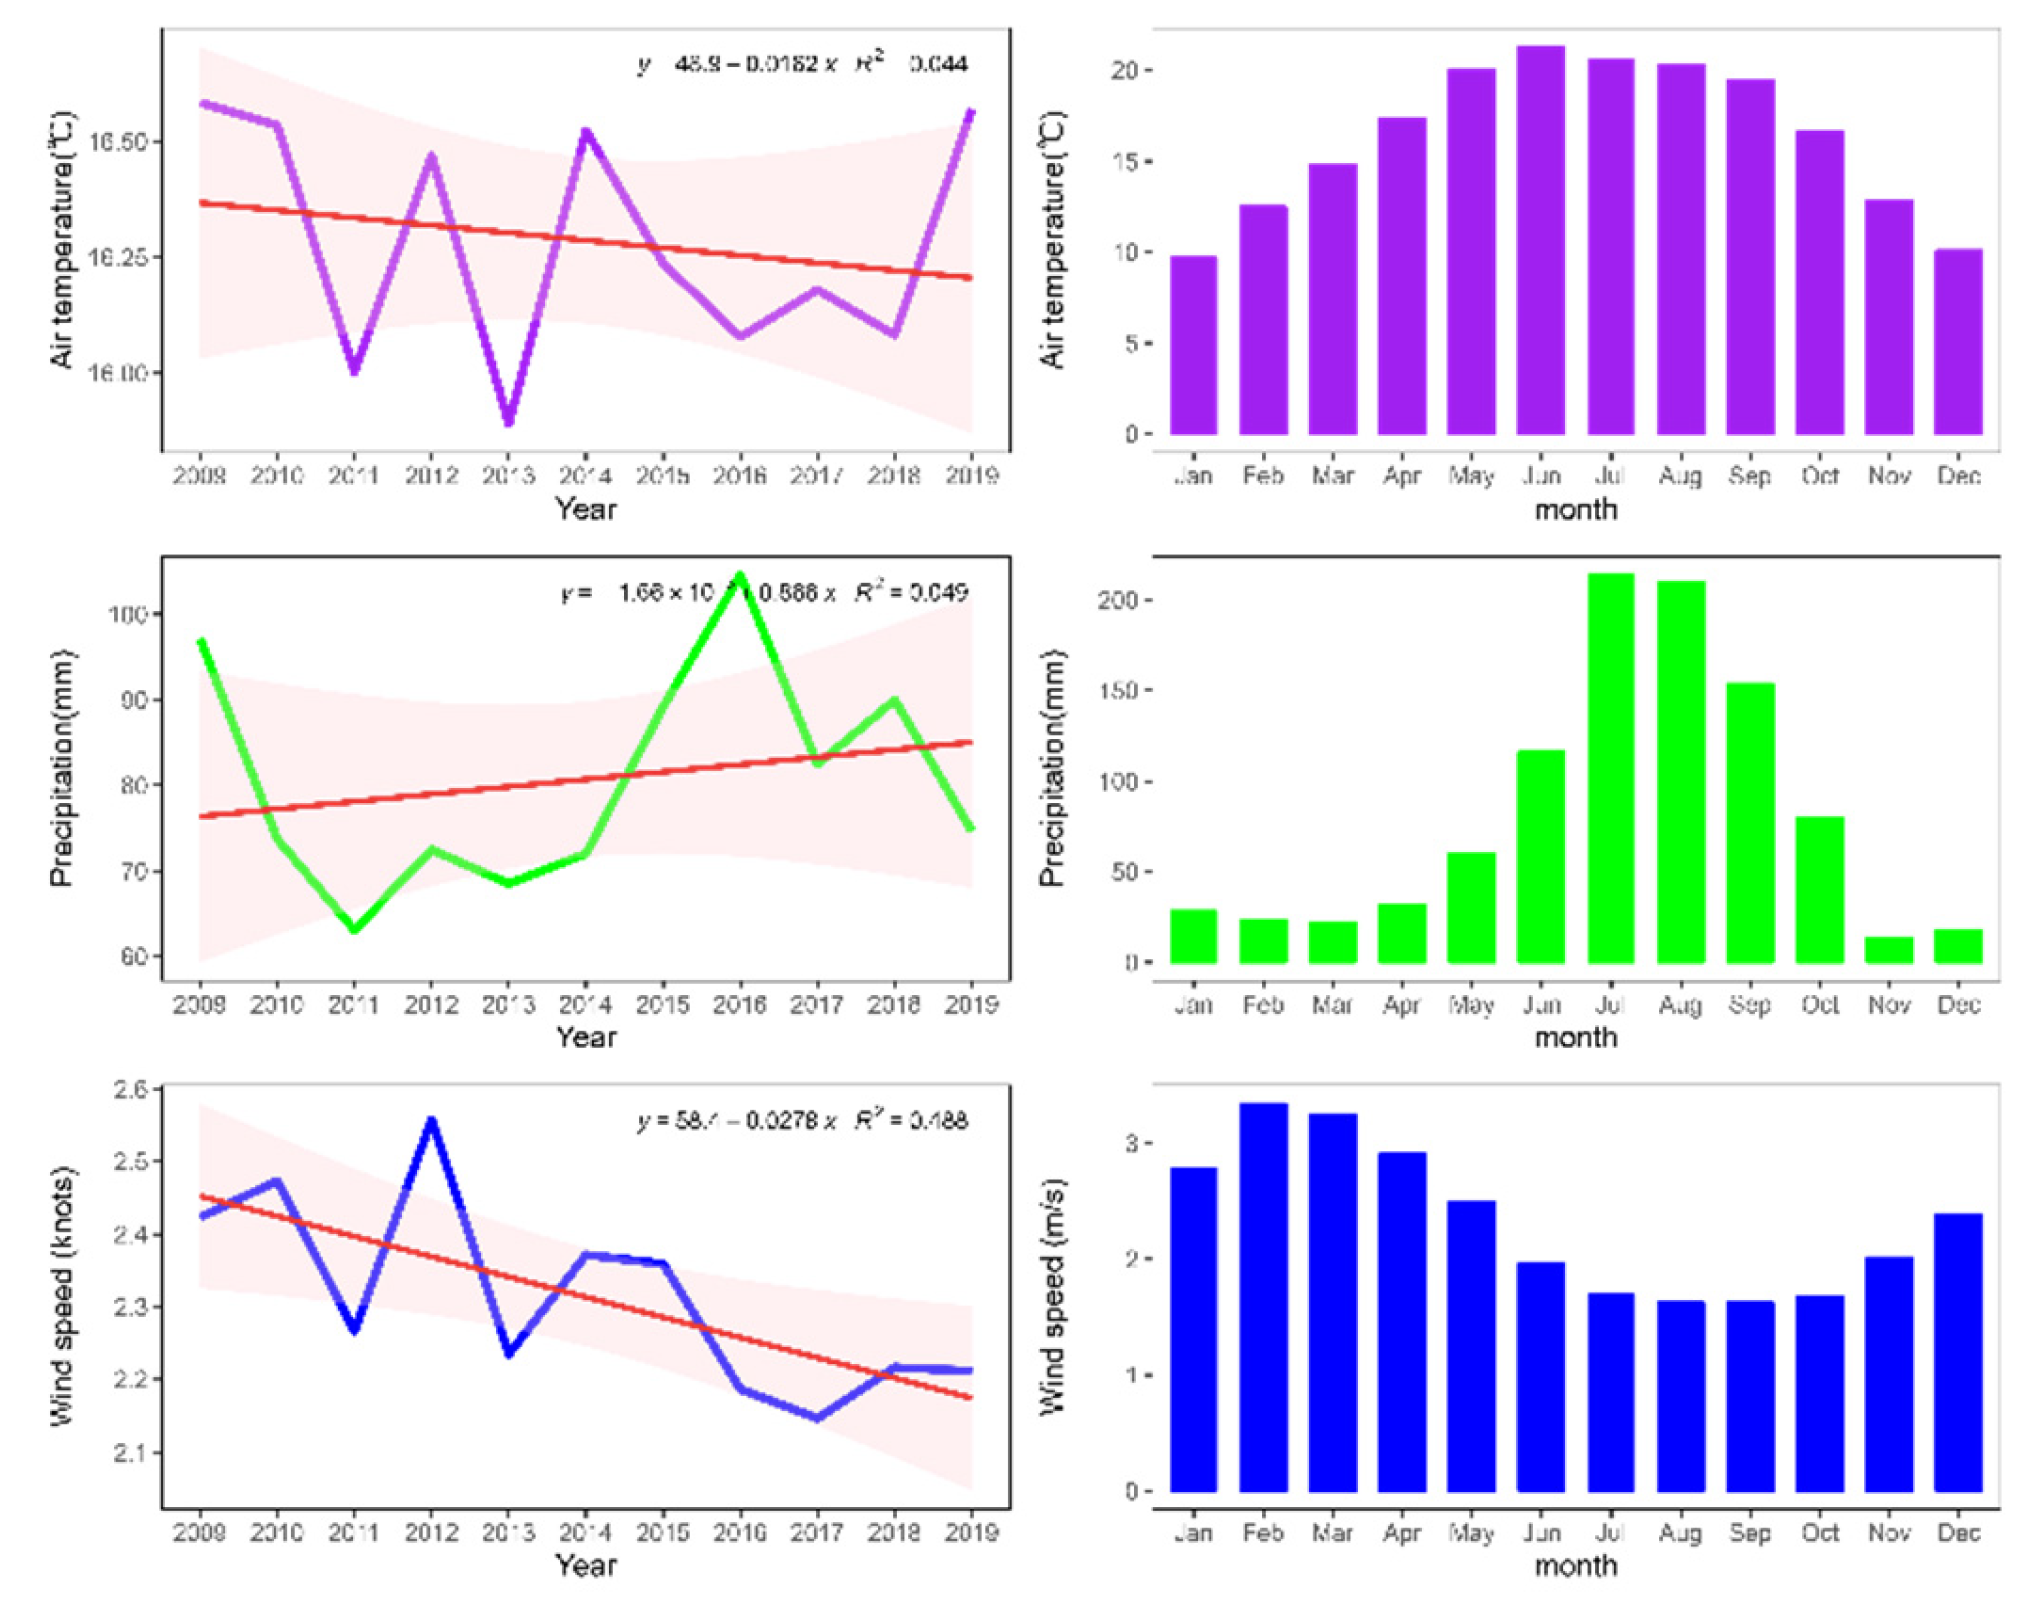
Figure 6.
Annual average population and gross domestic product (GDP) from 2009 to 2019 in Dali Bai Autonomous Prefecture.
Figure 6.
Annual average population and gross domestic product (GDP) from 2009 to 2019 in Dali Bai Autonomous Prefecture.
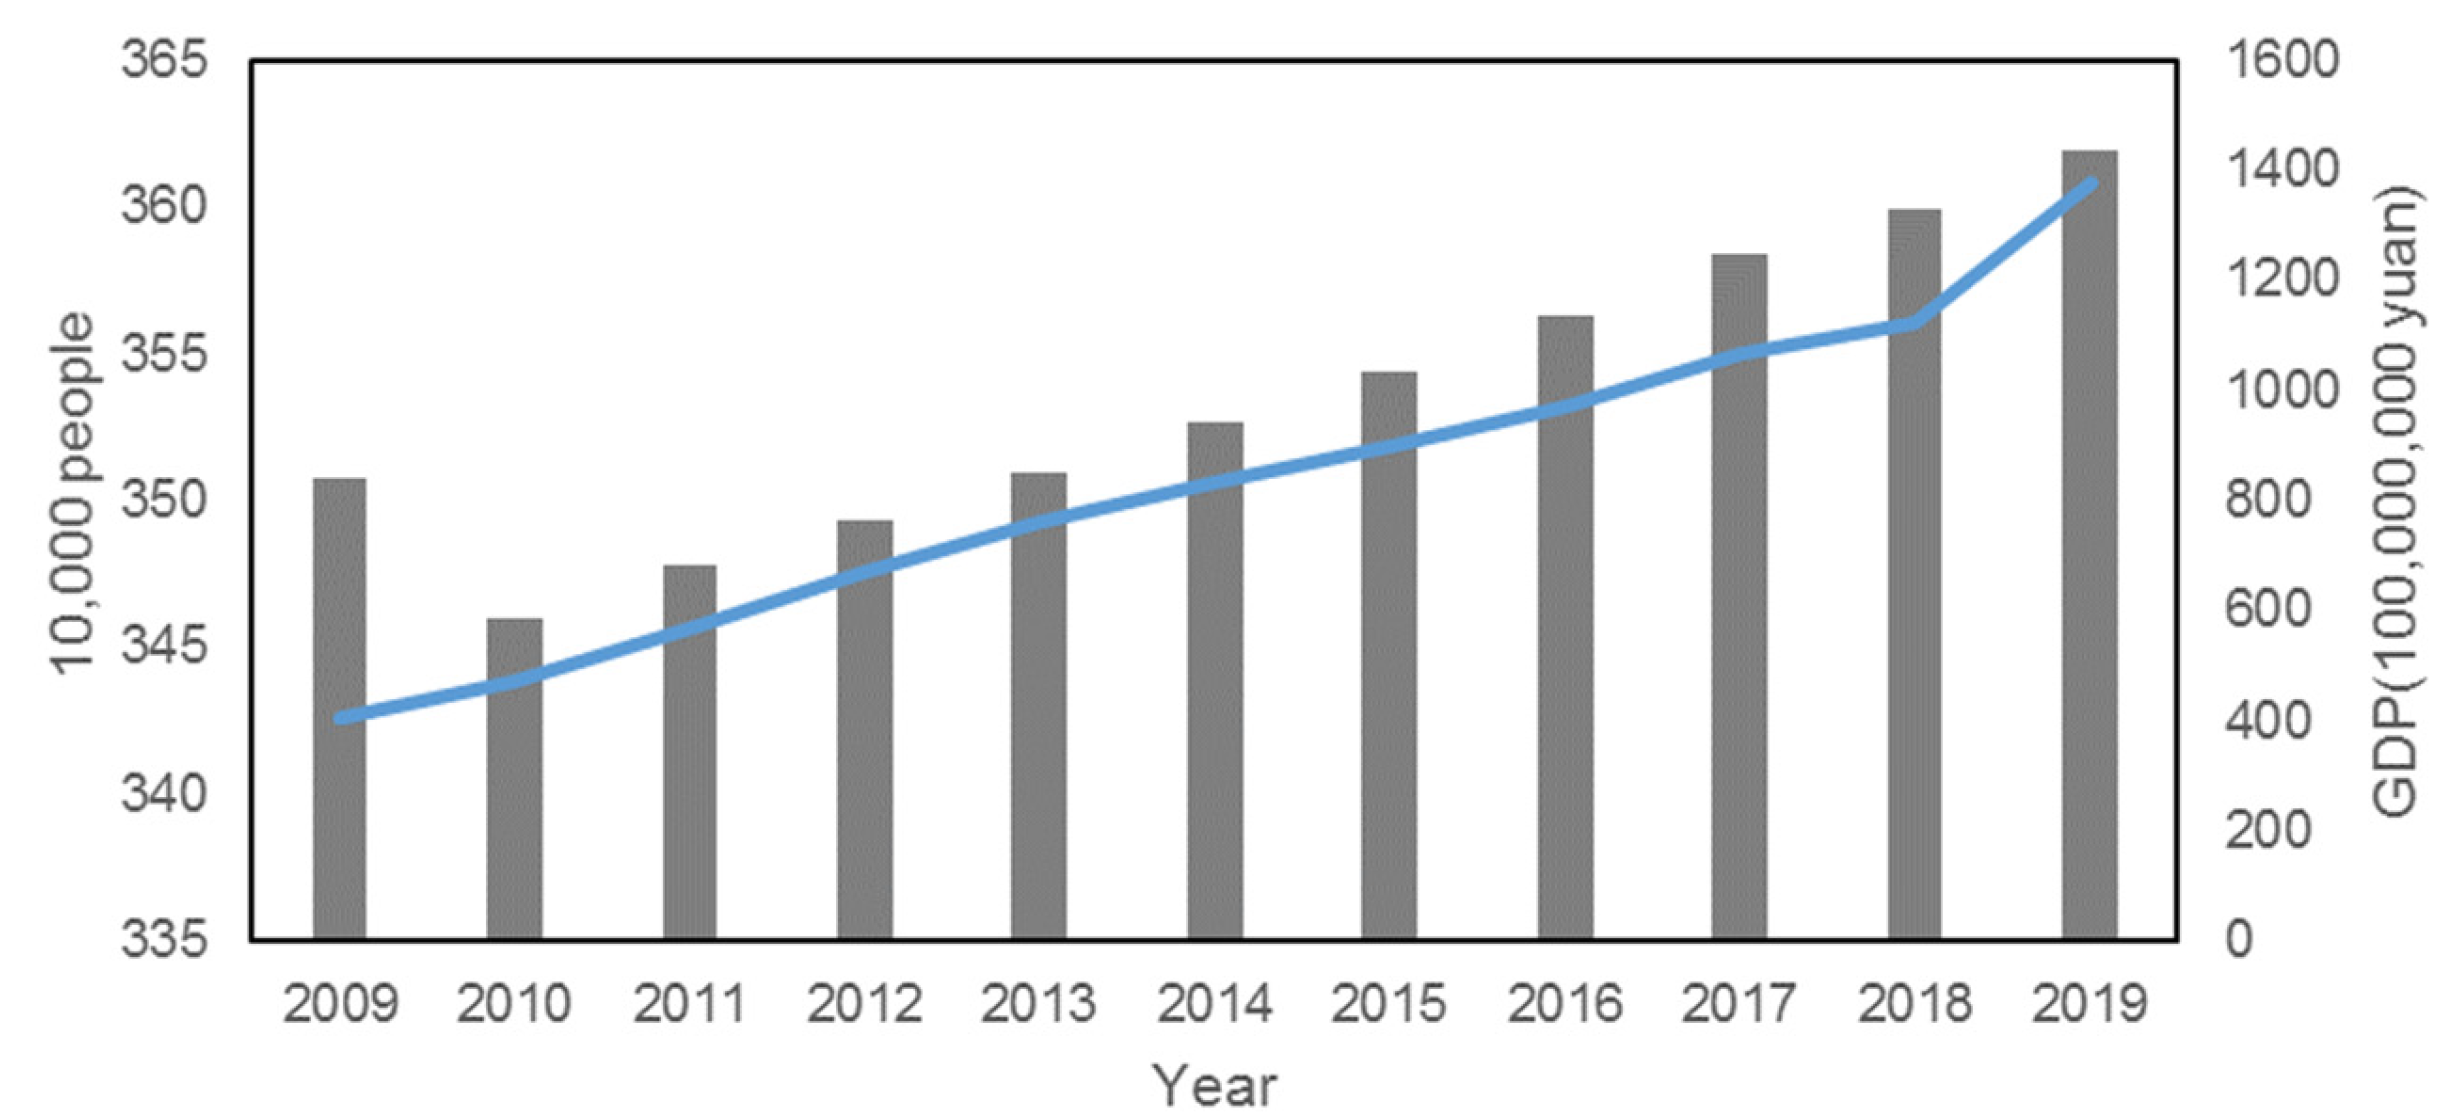
Figure 7.
PCA and Correlation analysis of water quality indicators from 2009 to 2019 in Lake Erhai (Note: AT: Air temperature; RF: Rainfall; WS: Wind speed(m/s); GDP: GDP of Dali Prefecture( 10,000,000,000 Yuan); P: Population of Dali Prefecture(10,000 person); ***are significant at the level of 0.1%, 1%, and 5%, respectively.).
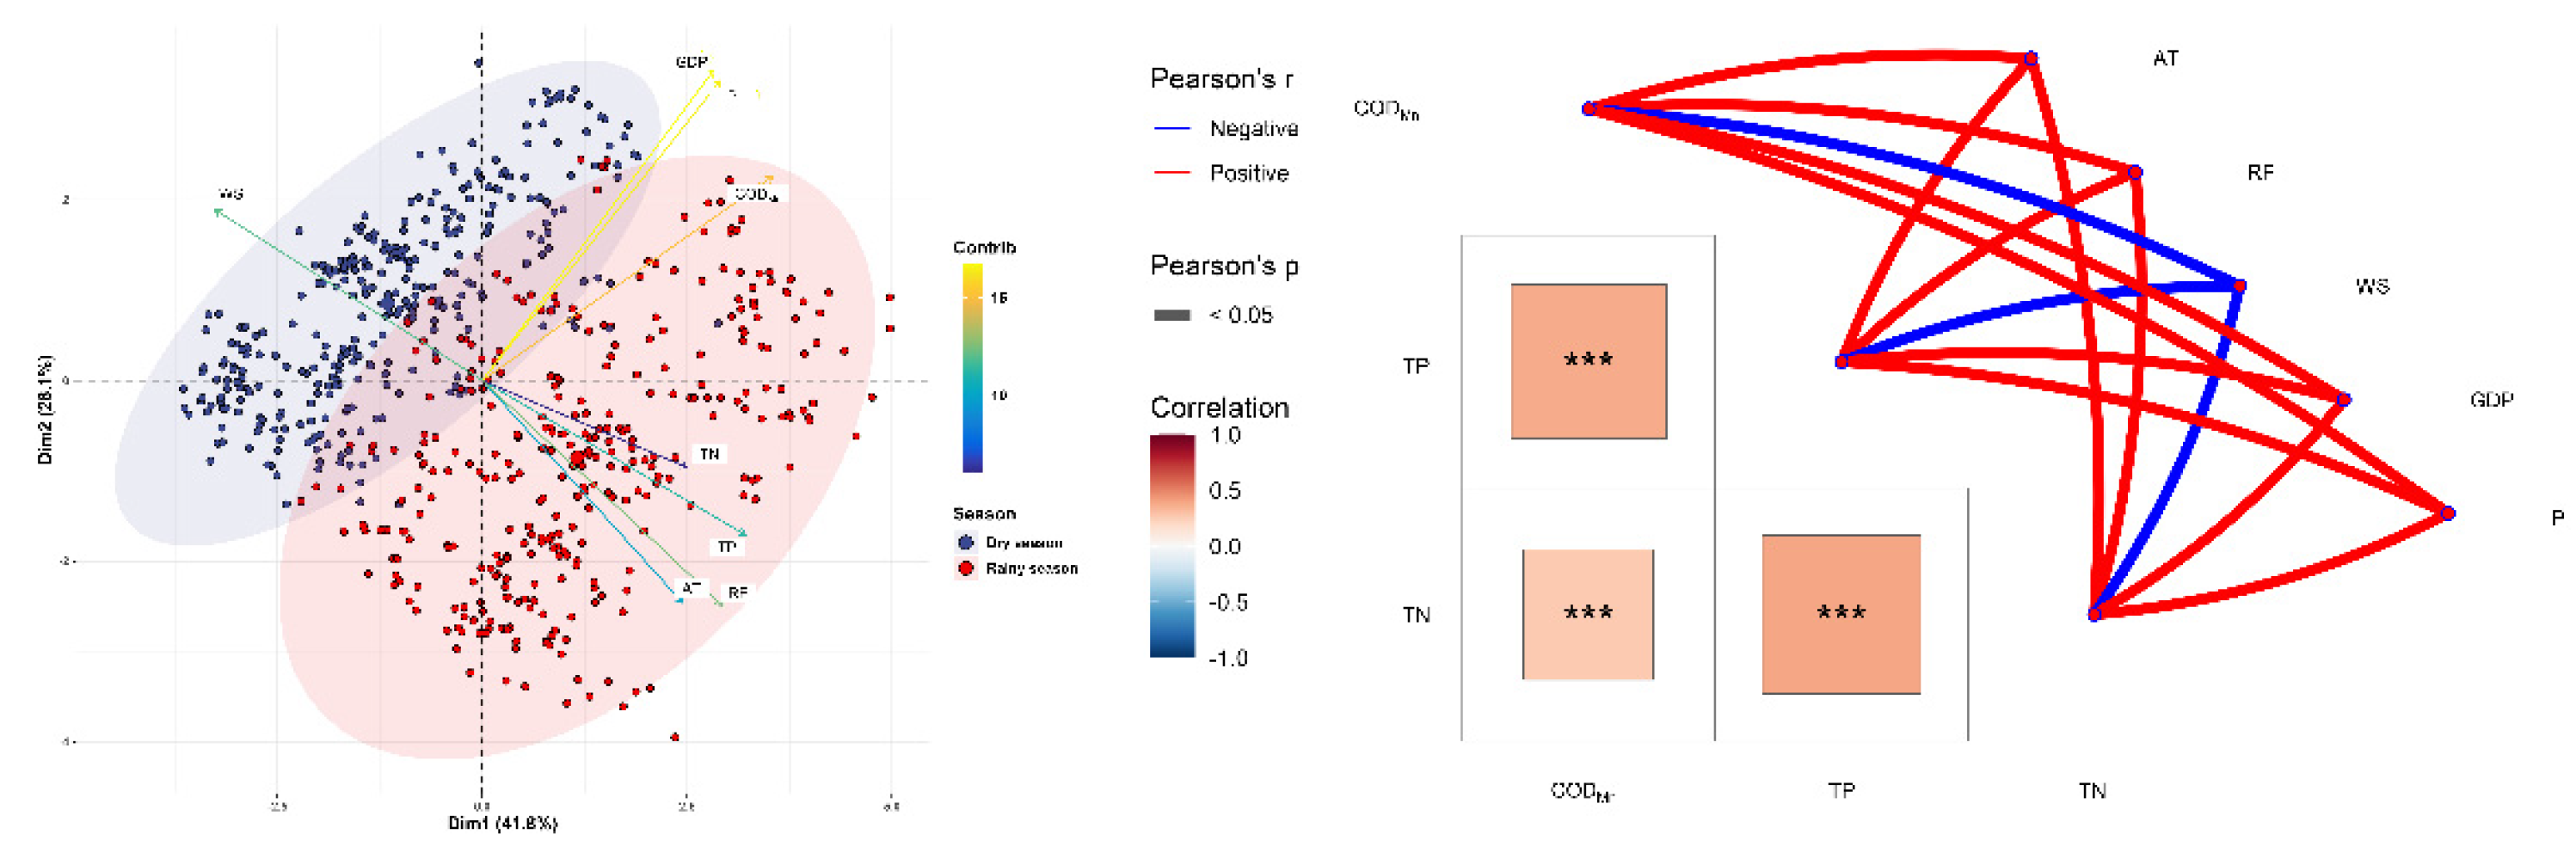
Table 2.
Description summary of primary variable.
| Variable | Mean | Standard Deviation | Min | Max |
| CODMn(mg/L) | 3.1 | 0.5 | 1.9 | 5.0 |
| TP(mg/L) | 0.026 | 0.008 | 0.009 | 0.054 |
| TN(mg/L) | 0.55 | 0.10 | 0.28 | 0.97 |
| Air temperature(℃) | 16.3 | 4.1 | 8.0 | 22.9 |
| Rainfall(mm) | 80.7 | 83.3 | 0.0 | 322.8 |
| Wind speed(m/s) | 2.31 | 0.68 | 1.39 | 3.90 |
| GDP of Dali Prefecture ( 10,000,000,000 Yuan) |
69 | 23 | 34 | 115 |
| Population of Dali Prefecture (10,000 person) |
354 | 5 | 346 | 362 |
Table 3.
Stepwise regression estimation results.
| Variable | CODMn | TP | TN |
| Air temperature | — | 0.0077* | — |
| — | (0.0030) | — | |
| Rainfall | — | 0.0008*** | 0.0003*** |
| — | (0.0002) | (0.0001) | |
| Wind speed | -0.0413*** | -0.2080*** | -0.0766*** |
| (0.0062) | (0.0178) | (0.0137) | |
| GDP of Dali Prefecture | 0.0043*** | — | — |
| (0.0001) | — | — |
Note: ***, **, and * are significant at the level of 0.1%, 1%, and 5%, respectively. The value in brackets is the standard error . “—“represent that the correlation coefficient between two variables is not significant. The significance of the F-statistic was all less than 0.05.
Disclaimer/Publisher’s Note: The statements, opinions and data contained in all publications are solely those of the individual author(s) and contributor(s) and not of MDPI and/or the editor(s). MDPI and/or the editor(s) disclaim responsibility for any injury to people or property resulting from any ideas, methods, instructions or products referred to in the content. |
© 2026 by the authors. Licensee MDPI, Basel, Switzerland. This article is an open access article distributed under the terms and conditions of the Creative Commons Attribution (CC BY) license (http://creativecommons.org/licenses/by/4.0/).
Copyright: This open access article is published under a Creative Commons CC BY 4.0 license, which permit the free download, distribution, and reuse, provided that the author and preprint are cited in any reuse.


