Submitted:
16 February 2026
Posted:
26 February 2026
You are already at the latest version
Abstract
This study compares the accuracy of empirical and regression models for predicting the size distribution of blasted material at drawpoints in sublevel caving. Field data were sourced from Ernest Henry mine (EHM). At EHM, full-scale blasting trials were conducted under controlled conditions by varying explosive density and burden size, with fragmentation measured using laser scanning at different extraction tonnages. To minimise scanning inaccuracies, scan results were combined to represent the particle-size distribution for the EHM data. Five models were evaluated: Kuz-Ram, extended Kuz-Ram, Two Component Model (TCM), Kuznetsov-Cunningham-Ouchterlony (KCO), and a regression-based Underground Ring Blasting Model (URBM) developed in our previous work. Models were assessed for predicting P20, P50, and P80 passing sizes. Results show the extended Kuz-Ram and TCM perform better for finer fragment sizes, with Mean Absolute Percentage Error (MAPE) of 8%. URBM was the most accurate for median and coarse sizes (MAPE 5% for P50 and 3% for P80) and showed the least variability in errors. A SHAP-based sensitivity analysis of the three most accurate models identified key variables for median size prediction, highlighting the importance of rock properties and ring design parameters.
Keywords:
blast-induced rock fragmentation
; sublevel caving
; empirical models
; regression model
; Ernest Henry mine
; fragmentation size distribution in sublevel caving
1. Introduction
Sublevel caving (SLC) is a mass mining method using long blast holes suitable for steeply dipping orebodies with a significant vertical dimension. Extraction begins at the hanging wall and retreats to the footwall (Campbell, 2019, Manzoor, 2023, Wimmer, 2012, Yi et al., 2017). Figure 1 provides an overview of the SLC layout. At each sublevel, production drifts are constructed parallel to one another and extend across the thickness of ore body. In this method, blasted material of various sizes move through the stope, ranging from fine particles under 10 mm to large fragments up to 1.5 m. The finer particles tend to reach the draw point more quickly, whereas larger fragments can block the rock flow within the stope (Campbell, 2019, Campbell and Thurley, 2017).
In SLC mining, ore extraction from the stope continues until dilution reaches a specified threshold. Once this limit is reached, the next ring is blasted and the extraction process moves forward.
The size distribution of the blast-induced rock fragments significantly influences the overall site productivity. Poor fragmentation can produce safety risks such as hang-ups in caving operations (Aler et al., 1996, Campbell and Thurley, 2017, DeGagné, 2005, Hamdi et al., 2001, Manzoor, 2023, Wimmer, 2012). In SLC, blasting plays a decisive role in the final cave flow (Brunton, 2009). The SLC method typically uses fan-shaped rings, of upward-oriented medium to long blast holes (Yi et al., 2017). Figure 2 shows three different fan-shaped ring designs used at the Ridgeway Mine, with seven, eight, and ten blast holes (Brunton et al., 2010).
Particle size distributions induced by blasting are affected by various factors, including the drill and blast design, geological characteristics, and the stress state of the rock mass. A clear understanding of how each of these factors impacts fragmentation is critical for optimizing blasting outcomes. This has been an active research area for decades, leading to several empirical models proposed to estimate fragment sizes induced by blasting (Cunningham, 1987, Djordjevic, 1999, Esen et al., 2003, Onederra et al., 2004, Ouchterlony and Sanchidrián, 2018, Sanchidrián and Ouchterlony, 2017).
1.1. Empirical Models
Specific fragment sizes, such as the average and maximum size of fragments, can be used to derive the overall size distribution of blasted rocks using various cumulative distribution functions (CDF) (Ouchterlony and Sanchidrián, 2018). Different size distribution functions use different size, shape and slope parameters to define the whole distribution. As an example, the Gates-Gaudin-Schuhmann (GGS) power distribution function is based on the maximum size of rock fragments, normalising parameters, and a shape (or slope) parameter (Ouchterlony and Sanchidrián, 2018). A widely used distribution function is the Rosin-Rammler (RR) particle size distribution (Akinbinu et al., 2022, Vesilind, 1980). The Weibull distribution (Weibull, 1951) extends this function to a broader field of statistics and material strength. Neither the original RR nor the Weibull version includes any upper limit on fragment sizes, and this upper size limit was incorporated by Sanchidrián et al. (2014) in response to the limitation of the original Weibull distribution. The Rosin-Rammler-Weibull (RRW) model uses a uniformity index as the shape parameter plus the average fragment size to define the size distribution. The Swebrec function and its extended form were developed later following analyses of sieving data and the observation of the mismatch of RRW predictions with the sieving results (Ouchterlony, 2005a).
Several empirical models were developed after the introduction of the Rosin-Rammler (RR) distribution by using new parameters for the median fragment size and uniformity index to improve prediction accuracy. Cunningham developed Kuznetsov’s empirical fragment size equation further into the practical Kuz-Ram model by adding a relative weight-strength factor for commercial explosives, expressing explosive energy through the powder factor, and finally combining the adjusted size equation with the RR distribution (Cunningham, 1983, Koshelev et al., 1971). Lilly’s blastability index (Lilly, 1986) was incorporated to account for variations in the rock mass, a rock factor (A, see below) is defined by the Rock Mass Description (RMD), Joint Factor (JF), Hardness Factor (HF), and Rock Density Factor (RDF). The mean fragment size of the Kuz-Ram model is shown in Eq. 1(Cunningham, 1987, Cunningham, 2005):
where is the mean fragment size (in cm), Q is the weight of explosive (kg), E is the Relative Weight Strength (RWS) with respect to ANFO, and q is the specific charge (kg/m3).
The uniformity index is derived from blast design parameters, and can be defined in two different forms. The first form is shown in Eq. 2 (Cunningham, 1987):
where B is the burden (m), d is the blast hole diameter (mm), W is the drilling deviation (m), S is the spacing between holes (m), L is the explosive charge length (m), and H is the bench height (m). When a blast hole contains two explosives, a bottom charge and a column (main) charge, Eq. 2 is modified and becomes the second form as shown in Eq. 3. (Gheibie et al., 2009).
where Lₜₒₜ is the total charge length, Lb and Lc are the bottom and column charge lengths of the explosives, respectively.
The extended Kuz-Ram model (Cunningham, 2005) is an alternative form of the Kuz-Ram model, incorporating the influence of the initiation delay. It was perceived that shorter intra-row delays produced more uniform, finer particles. Studies also indicated that the optimum inter-row delay is roughly twice the time required for a crack to propagate across the burden (Bergmann et al., 1974, Cunningham, 2005). Eqs. 4 to 6 comprise the delay timing using the term Aₜ, which accounts for the inter-row delay and the P-wave velocity of the rock mass (Cunningham, 2005):
where At is the delay timing factor, is the scatter ratio, is the preferred time interval between holes (ms), is the standard deviation of the initiation system (ms), is the theoretical optimum inter-hole delay for maximum fragmentation through constructive stress-wave and gas-interaction effects (ms), Cp is the P-wave velocity (m/ms), “15.6” is the scaling factor related to compressional stress wave velocity of Bergmann’s granite (5.2 km/s) multiplied by 3 ms as the standard delay (Bergmann et al., 1974), is the nominal intra-row delay (ms), and C(A) and C(n) are the multiplicative factors. In addition, in this version of the extended Kuz-Ram model, the rock factor is defined without considering the Joint Factor (Cunningham, 2005).
The Swedish Detonic Research Foundation (SveDeFo) function (Hjelmberg, 1983, Ouchterlony and Sanchidrián, 2018), and the US Bureau of Mines (USBM) model (Chung and Katsabanis, 2000, Stagg et al., 1990) were developed as extensions of the Kuz-Ram model to incorporate a more complete description of the blast design and rock mass to increase the applicability of the model for different blasting scenarios.
To address the problem of an underestimation of fines, observed in some blasting cases when the Kuz-Ram model was applied, the Crushed Zone Model (CZM) and the Two-Component Model (TCM) were developed at the Julius Kruttschnitt Mineral Research Centre (JKMRC). Both models utilize two Kuz-Ram models stitched together where one fits to the fine portion of the fragmentation distribution and the second the coarse portion. The fines are associated with the crushed zone radius, while the coarse particles are influenced by tensile fracturing and the inherent properties of the rock mass (Djordjevic, 1999, Esen et al., 2003, Onederra et al., 2004). The uniformity index for fines is defined in Eq. 7:
where is the explosive density (kg/m3), D is velocity of detonation (m/s), is UCS (MPa), is the crushed zone radius (mm), is the pressurized blast hole radius (mm) and P50 is the median fragment size (mm).
The Swebrec function was developed to address the differences between the Rossin-Rammler curve and sieving data obtained in the European Union (EU) ‘Less Fines’ project, a collaboration between the Swedish Rock Engineering Research Foundation and Montan Leoben University. The Swebrec function (Ouchterlony, 2005; Ouchterlony and Sanchidrián, 2018) is:
where b is the shape parameter, xmax is the maximum size of blasted materials, P50 is the median fragment size and x is the fragment size.
The Kuznetsov-Cunningham-Ouchterlony (KCO) model was developed by replacing the Rosin-Rammler function with the Swebrec function in the Kuz-Ram formula. The median KCO fragment size is defined in Eq. 9 (Ouchterlony, 2005a):
where g(n) is the mean to median conversion factor. The shape function for the KCO model is defined in Eq. 10:
in which b is the Swebrec shape function.
In a study by Khodayari et al. (2025), a series of simulations were conducted using the Mechanistic Blasting Model (MBM), which model the impacts of explosive loading, rock fracturing, and the effects of explosive gases on rock fragmentation. The simulations used data from the Ernest Henry Mine (Campbell, 2019) to establish the baseline blast design and rock mass conditions and then compared predicted fragmentation sizes to measured data. A total of 34 scenarios were modelled, including variations in explosive charge density, burden size, rock fracture density, tensile strength, in-situ stress, blasthole diameter and charge spacing. Multivariate regression analysis was used to develop formulas based on these variables to predict P20, P50 and P80, as shown in Eqs. 11 to 13. The regression model was also tested with another data set from EHM which demonstrated it was able to predict all size fractions with less than 30% error. In the regression model developed, the variables were incorporated into three factors: Blast Design Factor (BDF), Rock Property Factor (RPF) and In-Situ Stress (IS) factor. The BDF includes burden, spacing, explosive charge density and blasthole diameter, with burden and spacing used as the numerator and explosive density and hole diameter as the denominator. These are all controllable design variables. The RPF for P20 and P50 was defined by multiplying tensile strength and fracture density. For P80, due to the varying effect of fracture density on the coarser part of the fragmentation size distribution and based on available simulation data, RPF was defined as the ratio of tensile strength to fracture density (Khodayari et al., 2025).
This regression model was developed through research funded by the Australian Research Council’s Industrial Transformation Training Centre for Integrated Operations for Complex Resources (IOCR). This initiative is supported by a collaboration involving universities, industry partners, and the Australian Government. The model was developed by the IOCR research group and is hereafter referred to as the IOCR Underground Ring Blast Model (URBM).
The input variables of different fragmentation models discussed above are summarized in Table 1.
1.2. Data Collection
At the Ernest Henry Mine in Australia, full-scale experiments were conducted in an active sublevel caving mine to test the effects of ring burden, explosive density, and cross-cut heights (Campbell, 2019) on production performance. Statistical analysis showed that reducing the cross-cut height from 5 to 4 m did not make a significant difference to the average recovery so the reduced cross-cut height test was not continued at the secondary recovery level (sublevel below). The experiments assessed how design variables affected detonation performance, rock fragmentation, material flow and recovery. Fragmentation data were collected using a 3D laser scanner at different draw stages and extraction tonnages, while markers in the rings were used to track flow and recovery at the draw-points (Campbell, 2019, Campbell and Thurley, 2017). Increasing the explosive density from 1.1 g/cc to 1.25 g/cc produced finer fragmentation, however, it resulted in lower recovery. Reducing the explosive density improved primary recovery (including back break) by 8% and secondary recovery by 10%. The recovery increased as the burden increased across the three burden dimensions trialled (2.2 m, 2.6 m and 3.0 m). Increased burden and lower explosive density led to improved flow conditions and higher ore recovery. This suggested that although higher explosive density and a smaller burden typically produced finer fragmentation due to increased powder factor and stronger detonation performance, the resulting compaction appeared to have a negative impact on material flow and recovery. A total of 31 rings with a burden of 2.2 m and another 31 rings with a burden of 3.0 m were blasted and monitored (Campbell, 2019, Campbell and Power, 2017). None of these rings froze or blocked access to the brow of the next ring. These trials showed that ring burdens larger than 2.5 m can be effectively blasted using 102 mm diameter blast holes. The research showed that ring burden and explosive density can significantly affect ore recovery. Figure 3 shows a sample laser scan at a draw-point and how the images were processed, flagging areas of very fine material and overlapping fragments (Campbell, 2019).
In the current study, published fragmentation data from Ernest Henry mine, together with corresponding rock properties and blast design information, were used to evaluate the accuracy of empirical and regression models on the prediction of size distributions measured in the field. To avoid bias in fragmentation prediction, it is preferable to use data from multiple mine sites. However, the practical challenges of fragmentation measurement, such as image-processing inaccuracies, operational disruptions, and limitations on data collection, restrict the availability of reliable datasets. As a result, and because no other datasets were accessible, only the available trials from the EHM case were used in this study. A comprehensive sensitivity analysis was performed to identify the most influential parameters affecting particle size distribution in these models.
2. Methodology
The work presented here begins by selecting blasts and the corresponding fragmentation data to represent a baseline for Ernest Henry Mine. The P50 value for each baseline case is then calculated using these models: Kuz-Ram, extended Kuz-Ram, TCM, KCO, and URBM. Next, the shape or slope function is determined for all models. Each model is then calibrated against the baseline data, and the calibration factors are applied to other scenarios studied. The TCM model includes two separate calibration parameters for the shape/slope of the distribution function. In the URBM, P80 and P20 are calculated directly along with P50, which are then used to derive the shape parameter for the Swebrec function.
Finally, the predictions from calibrated models are compared with field data from EHM. A sensitivity analysis is performed using SHapley Additive exPlanations (SHAP) analysis to identify the most influential variables in these models.
2.1. Data Analysis
There is very limited fragmentation data available for full-scale drill-and-blast operations at SLC mine sites due to the complexity and high cost of data collection (Brunton, 2009). The problem is further compounded by the fact that most SLC operations use consistent ring designs and sublevel spacings such that there is no variation in blast design to correlate with the fragmentation measurement data. The operational and fragmentation data used in this study are sourced from a comprehensive dataset collected by Campbell in the Ernest Henry Mine SLC operation (Campbell, 2019, Campbell, 2022, Campbell and Power, 2017, Campbell and Thurley, 2017).
2.1.2. EHM Blast Design and Fragmentation Data
The EHM SLC ring design parameters and the rock properties of the volcanic ore used in the trials are listed in Table 2 and Table 3.
In the EHM dataset, 125 fragmentation measurements were taken at different stages of extraction at the draw points. Laser scans were captured at every 250 tonnes up to 1,000 tonnes, and then every 500 tonnes until the target draw was reached. This approach helped minimize bias in calculating the size distribution when all the fragmentation data from a draw point was combined into one dataset (Campbell, 2019). The P20, P50 and P80 values for various combined datasets measured at EHM are presented in Table 4. The baseline blast design parameters are the same as the input parameters reported in Table 2. For other scenarios listed in Table 4, only one parameter was changed, while other parameters were the same as the baseline case. For example, in the Burden 3.0 m case (S4), the burden was the only parameter changed, increasing from 2.6 m to 3.0 m.
Apart from the differences in blast design and rock properties, the production tonnages from the test rings were also different. In EHM, the ring mass was 2412 t, 2850 t and 3288 t for the burdens of 2.2 m, 2.6 m and 3.0 m, respectively.
3. Results and Discussion
Different calibration methods were used depending on the empirical or regression model. For models that include calibration parameters such as C(A) and C(N) in the extended Kuz-Ram model, or g(n) in the KCO model, these parameters were calibrated against baseline fragmentation data from EHM. For models without explicit calibration factors in their formulas, a calibration multiplier was applied to their final predicted size distribution. Using these calibrated parameters or multipliers, the models were then used to predict the fragment size distributions for other scenarios. The predicted distributions from the various models, together with the corresponding field data, are presented in Table 5, Table 6 and Table 7. To assess prediction performance for P20 (fine), P50 (medium), and P80 (coarse) fragment sizes, the Mean Absolute Percentage Error (MAPE) was calculated for each case.
Figure 4 presents dot plots for each size distribution, illustrating the differences between the predicted and actual fragment sizes across all scenarios.
Table 5 lists the predicted P20 values from each model. In this case, burden and spacing are taken as the design values for each ring; local variations in effective burden caused by hole deviation, which can influence fragmentation, are not considered due to the lack of deviation data. Table 6 shows that for the EHM dataset, when explosive density varies, all Kuz-Ram-based models predict P50 less accurately compared with the URBM model. However, for P20 prediction, the Kuz-Ram-based models perform better. Since P50 is often used as the reference size, while other particle sizes also matter, higher accuracy in P50 prediction improves the overall reliability of the model when applying P50 and the shape factor to derive fine and coarse particle size distributions. To understand this discrepancy, it is important to identify the parameters in the original Kuz-Ram model that are directly or indirectly influenced by explosive density. These are powder factor and explosive weight, both of which appear in the Kuz-Ram median size prediction formula with fixed exponents. Since powder factor is a function of explosive charge density, burden and charge spacing, modifying its exponent would affect the influence of all three variables. Given that the model already performs well in predicting fragment size changes due to variation in burden, it is better to leave the powder factor exponent unchanged. Instead, the adjustment was applied to the exponent governing the contribution of explosive charge mass as it appears explicitly in the Kuz-Ram formulation. This modification does not change the physical explosive mass used in the calculations; rather, it alters the weighting (sensitivity) of explosive charge mass within the empirical model. Modifying the exponent of explosive weight could improve the accuracy of the model in handling variations in explosive charge density, without compromising its reliable predictions related to burden variations. If the exponent for explosive weight in the Kuz-Ram model is changed from 1/6 to 1/3, the prediction error for median fragment size is reduced by approximately 3%. With this adjustment, the predicted P50 values for the EHM dataset with explosive densities of 0.9 g/cc and 1.25 g/cc change to 253 mm and 191 mm, respectively.
This demonstrates that empirical models with fixed exponents can achieve higher accuracy when those exponents are recalibrated to match field observations. In the original Kuz–Ram model, the exponent of 1/6 was introduced empirically by Kuznetsov (1973) after analyzing 167 blasts in various open-pit mines, and the adjustment of this exponent from 1/6 to 1/3 can be viewed as a calibration of the model to suit underground ring blasting environment. This exponent does not have a direct physical meaning but reflects an observed power-law relationship between fragment size and explosive energy, indicating that fragmentation improves with increasing charge weight but at a diminishing rate. Moreover, when considering variants of the Kuz-Ram model that explicitly incorporate calibrated exponents, such as the extended Kuz-Ram and the KCO model, it can improve their prediction for field data. In addition, the KCO model calibration and prediction is also controlled by the definition of maximum fragment size, a parameter that will be examined in detail later in this paper.
The EHM P80 field data with burdens of 2.2 m and 3.0 m shown in Table 7 appears unreliable. When the burden was reduced from 2.6 m to 2.2 m, the P50 decreased by less than 1% (from 216 mm to 215 mm), while the P20 dropped by about 5% (from 94 mm to 89 mm). By contrast, increasing the burden to 3.0 m produced a much stronger coarsening effect, with P50 increasing by around 8% (232 mm compared with 216 mm) and P20 rising by nearly 48% (139 mm compared with 94 mm). The data report a lower P80 when the burden was increased, which is the opposite of what is expected. Under conventional blasting conditions, a larger burden lowers the powder factor and should produce coarser fragments, while a smaller burden raises the powder factor and should give finer fragments. Possible sources of the reported error related to P80 changes by varying the burden size in the field data include uncertainties associated with image-processing techniques, or material presenting at the draw point containing waste rock or ore from previous rings. As it is not rational to expect an empirical model to predict a coarser fragmentation with a higher powder factor, the cases of 2.2 m and 3.0 m burden from EHM dataset are excluded in the P80 error calculation. In these cases, despite the higher powder factor, the measured fragmentation was unexpectedly coarser, likely due to local geological or operational factors such as variations in confinement, joint orientation, or charge distribution. Including these outliers would bias the error analysis and misrepresent the predictive performances of the models.
Overall the model predictions closely match the EHM field data. This indicates that the field data is reliable, except in the excluded cases where larger burden size provides finer P80 as discussed above.
For the averaged errors (Table 8), the URBM model provides the most accurate predictions for median (P50) and coarse (P80) fragment sizes, with MAPE values of 5% and 3%, respectively. The URBM prediction for fines also performs well, with only 2% less accuracy compared to the extended Kuz-Ram model. For fine particles, the TCM also performs well, achieving a MAPE value of 8%, the same as the extended Kuz-Ram model.
As shown in Table 8 and evident from the fragmentation data, the predictions of the median size from the TCM and the Kuz-Ram model are identical, as both models use the same formula to calculate P50. The main difference between the TCM and Kuz-Ram lies in the use of two different uniformity indices in the TCM: a fine uniformity index applied below 50% passing size, and a coarse uniformity index applied to above 50% passing size. The coarse uniformity index in TCM is equivalent to the uniformity index used in the Kuz-Ram model. As a result, the predicted coarse fragment sizes remain consistent across both models and therefore both models yield the same MAPE values for P50 and P80. The fine uniformity index in TCM refines the finer fraction and reduces MAPE by approximately 1.5% compared to the original Kuz-Ram model. One constraint of the Kuz-Ram and extended Kuz-Ram models is the use of the Rosin–Rammler distribution, which forces the curve to be symmetric around the median particle size. This can increase the inaccuracy of particle size prediction, particularly for finer particles. To overcome this, models like URBM, TCM, and KCO were developed to provide more flexibility in the distribution above and below the median size compared to the original Kuz-Ram model.
The KCO model consistently underestimates the proportion of fine fragments across all field datasets. This model uses the Swebrec function to represent the fragmentation distribution. The Swebrec distribution is defined by three parameters: the maximum particle size Xmax, the median particle size P50, and a shape factor b.
Figure 5 illustrates how variations in the shape factor and maximum particle size influence the Swebrec size distribution, while the median particle size is kept constant at 200 mm.
Compared with the baseline curve (red) with an Xmax of 1500 mm and a b value of 2, the increase of b value to 4 leads to the new curve (green), corresponding to a more uniform size distribution, with finer passing sizes above P50 and coarser sizes below P50 compared to the baseline. On the other hand, increasing Xmax from 1500 mm to 4500 mm (dark blue curve) produces a less uniform distribution with coarser fragments above P50 and finer fragments below P50. When both Xmax and b are increased at the same time, the size distribution above P50 remains mostly unchanged (light blue) compared to the baseline case (red), while below P50 the fragmentation is coarser. To improve the accuracy and correct the underestimation of fine particles in the KCO model, two modifications can be made on the original KCO model. Initially, the original shape factor from Eq. 9 can be replaced by an updated version defined by Ouchterlony, as shown in Eq. 14 (Ouchterlony, 2005b):
After model calibration using the updated shape factor, the average MAPE values for P80 decrease to 4%.
Another key parameter that can be modified is the maximum particle size. In the original KCO model, the maximum particle size (Xmax) is defined as the minimum of three parameters: the in-situ block size, the burden, or the spacing (often referred to collectively as the hole pattern parameters). To test model performance related to the changes in this parameter, Xmax is adjusted to two, three, four, and five times of its original value. The results show a significant reduction in prediction errors, with the lowest MAPE value achieved when Xmax is set to four times of the original value. Under this condition, the MAPE for P80 remains at 4% while the P20 error decreases from 8% in the original KCO model to 6.3% in the modified model,. The modified KCO model predicts P20 with higher accuracy than the URBM, TCM, and extended Kuz-Ram models, while its P80 prediction shows accuracy lower than URBM but higher than the TCM and extended Kuz-Ram model.
The difference in median fragment sizes with the change in burden size between the original Kuz-Ram model and the extended Kuz-Ram model results from the inclusion of delay time and a modified rock factor in the extended version. Both the KCO and the extended Kuz-Ram models use the same rock factor, which excludes the joint factor in the calculation compared to the original Kuz-Ram model. Since the delay time is constant across all field data, the predicted P50 for both models remains the same, except when the burden size differs from the baseline model. For example, in the cases where the explosive density changes to 0.9 g/cc and 1.25 g/cc, while the burden size remains at 2.6 m, the predicted P50 values from both the KCO and extended Kuz-Ram models are identical. However, differences in the P50 predictions are observed in other two field cases where the burden size changes to 3.0 m and 2.2 m. These differences occur because the burden size is a component of the delay timing factor, as defined in Eq. 6. In the EHM case with ∆T = 25 ms and Cp = 4.665 m/ms, reducing the burden size from 2.6 m to 2.2 m increases At by approximately 5%. Table 6 shows a comparative 5% increase in the predicted median size from the extended Kuz-Ram model (199 mm), compared with the original Kuz-Ram model(190 mm). Furthermore, increasing the burden size from 2.6 m to 3.0 m decreases At by roughly 3.5%. The corresponding P50 value decreases from 240 mm in the Kuz-Ram model to 232 mm in the extended Kuz-Ram model, showing the same relative decrease of 3.5%. These changes demonstrate that the application of At in the extended Kuz-Ram model for P50 prediction improves the alignment between predictions and field data.
URBM along with KCO and TCM have greater flexibility to predict the finer and coarser particles either side of P50 compared to the Kuz-Ram models. URBM is the only model that predicts the three passing sizes directly. In contrast, other models derive the median fragment size and a curve uniformity or shape factor, from which other percentage passing sizes are calculated. The URBM model uses multivariate regression analysis to account for both controllable and uncontrollable blasting parameters simultaneously. Unlike other models that include some input parameters without clear physical meaning, all parameters used in URBM are physically meaningful and can be easily measured or obtained. One limitation of the URBM model is that it relies on the average charge spacing per ring and therefore does not capture section-by-section variations within the ring. In principle, reducing the number of blast holes while keeping the blasted volume constant increases both hole spacing and toe spacing, which reduces the powder factor and leads to coarser fragmentation. Moreover, using fewer holes decreases the total explosive weight, further contributing to coarser fragmentation. Because the URBM blast-design factor does not explicitly account for toe spacing or total explosive weight, these effects are not directly represented in the model. Consequently, although URBM provides more accurate average fragmentation predictions than many existing empirical models, its predictive capability could be further improved by incorporating a toe-spacing term or an explosive-weight term, potentially through refinement of the charge-spacing or explosive-density components already included in the blast design factor.
The MAPE values of several models are similar, therefore, identifying the best-performing model requires more than just comparing average errors. The consistency of each model is another useful performance metric. Consistency refers to the ability of a model to produce stable and repeatable results across different samples or conditions. This is best assessed through the size of error bars. A model that performs moderately well but with high consistency may be more valuable in practice than one with slightly improved accuracy but large variability.
Figure 6 presents the performance comparison of the five models analysed in this work. Models that display narrow interquartile ranges and few outliers are considered more consistent. URBM performs best for P50 and P80, showing both high accuracy and high consistency. At P20, TCM and the original Kuz-Ram are more consistent, while the extended Kuz-Ram is more accurate. The extended Kuz-Ram also shows slightly better consistency for P50 in EHM. Overall, all the models display similar accuracy and consistency, with no significant outliners in performance with the EHM data.
Note that for the KCO results, the modified Xmax is used for the final error calculations. Without this modification, KCO shows poorer consistency and higher MAPE, making it less reliable. In general, recalibrating model exponents with field data can improve reliability.
As a general conclusion from the analyses discussed in this section, URBM, TCM, and extended Kuz-Ram are the most reliable when both accuracy and consistency are considered (Figure 6).
3.1. Sensitivity Analysis
Fragment size prediction in blasting depends on a broad set of variables that can be divided into two categories. The first group contains parameters with a clear physical basis that are easy to measure or specify in the field. These include blast design variables such as burden, spacing, hole diameter, stemming length, charge length, delay timing, powder factor, explosive type, explosive properties such as relative weight strength, velocity of detonation and detonation pressures. They also include rock properties such as elastic and plastic properties, as well as rock discontinuities. The second category consists of purely empirical terms that some fragmentation models introduce solely to improve the fit to site data. These fitting parameters may help reproduce historical results, yet they lack direct physical interpretation, making them difficult to measure consistently or transfer from one operation to another. Notable examples are found in the Distribution-Free Blast Model and the Fragmentation Energy-Fan Model, described by (Sanchidrián and Ouchterlony, 2017, Segarra et al., 2018).
Because measuring every possible variable is neither practical nor consistently reliable, an effective fragmentation prediction model should strike a balance. It should rely on a concise set of inputs that are straightforward to obtain on site, preserve clear physical meaning for each parameter, and still deliver acceptable prediction accuracy. Models that meet these criteria are easier for engineers and production crews to implement, adjust, and trust in blast design and operation optimisations. To determine the most influential parameters in the prediction of fragmentation size distributions, out of the five models tested in previous sections, three of them with higher accuracy (URBM, TCM and extended Kuz-Ram models) were selected to derive their most sensitive parameters. A dataset of 20,000 samples was generated by randomly sampling input variables within specified ranges. These input values were defined based on the formulas described in Section 1.1. In the sensitivity analysis, considerations were given not only to the accuracy of the models, but also to their ability to provide a comprehensive explanation of how the reference sizes responded to changes in its input variables. In all cases, the target output variable was P50 passing size. A Random Forest Regressor was trained on the synthetic dataset to learn the relationship between the input variables and the predicted P50 values. This regressor was chosen because, among machine learning methods, Random Forest is a powerful and reliable algorithm for learning feature patterns, with strong prediction performance and simple interpretability (Kong and Yu, 2018). To identify the most important features, SHapley Additive exPlanations (SHAP) plots were used. SHAP values effectively show the degree of contribution from each input variable toward the output prediction, allowing assessment of feature importance for each model (Awan, 2023). To reduce computational cost while maintaining robustness of feature-importance rankings, SHAP values were computed using a random subset of 5,000 samples drawn from the original 20,000 sample dataset. Tests with smaller and larger subsets showed that the ranking of feature importance remained consistent beyond approximately 4,000 samples, indicating that 5,000 samples were sufficient to obtain stable SHAP value distributions without unnecessary computational cost. The SHAP plots for the URBM, TCM and the extended Kuz-Ram model (Figure 7) show that there are differences in the ranking of feature importance with regard to rock properties and blast design parameters when predicting the median size of blasted materials using these models.
As can be observed, the two most influential rock property variables in the URBM predictions are the tensile strength and the fracture density of the rock mass. It should be noted that in the URBM model, the impacts of fracture density on fine and coarse fragments are different. For the blast design and explosive variables, charge spacing is the most important followed by explosive charge density and hole diameter. These factors together determine the distribution of explosive energy in the rock mass. On the other hand, in-situ stress has the least relative influence out of the listed features, though the impact is still noticeable. Pre-stressed rock can fracture more easily when the explosive loading is applied. Thus, higher stress is expected to contribute to finer fragmentation.
SHAP analysis of the extended Kuz-Ram model highlights delay time as the most influential parameter for the prediction of median fragment size. In the EHM baseline case, an inter-hole delay time of 25 ms yields a P50 of 216 mm. Increasing the delay time to 35 ms raises P50 to 238 mm (about a 10% increase), while shortening the delay time to 10 ms drops P50 to 183 mm (roughly a 15% decrease). For comparison, enlarging the burden from 2.6 m to 3.0 m shifts P50 from 216 mm to 232 mm which is only about a 7% change. Although the model places delay time at the top of the list, treating it as the overall dominant parameter is questionable. Numerous field and laboratory studies (Katsabanis et al., 2006, Tang et al., 2023) reported that longer delays can result in finer fragmentation in certain ground and blast conditions. In available datasets, the same delay time was used. However, when the burden was changed in the EHM case, the median size predicted by the extended Kuz-Ram model differed from the original Kuz-Ram model. The timing factor in the extended Kuz-Ram model influenced the change in median size with the changes in burden. For a more meaningful improvement, a revised Kuz-Ram model could use a different exponent, rather than timing, to better capture the effect of burden. In addition, if the timing is supposed to affect the inter-row fragmentation, it has no bearing here as SLC is single ring firing so there is no inter-row delay involved. If the geometry does not have the optimal condition, altering delay time alone often has little effect. In practice, delay time should therefore be viewed as a tool which is only effective conditional on a well-designed blast layout and suitable rock properties.
Rock properties are also highly influential in the extended Kuz-Ram model. The Rock Mass Description (RMD) accounts for the blastability of the rock mass, collectively representing the degree of jointing, fracturing, and overall rock structure. It ranks third in the importance list among the variables affecting median size prediction. This parameter is closely related to fracture density, which is used in the URBM model. Among the energy-related inputs, specific charge has the strongest effect. A higher amount of explosive per cubic metre consistently produces finer fragmentation. Burden shows moderate importance: a burden that is too large reduces breakage and results in coarser fragments, while an optimal smaller burden improves fragmentation. Explosive weight alone appears low in the SHAP ranking because its effect is already captured by specific charge. Although both burden and spacing contribute to specific charge, burden shows moderate standalone importance because it directly governs confinement and breakage at the borehole scale, beyond its contribution to specific charge. In contrast, spacing primarily influences the interaction between adjacent holes, which is less explicitly captured in the extended Kuz-Ram model and therefore does not appear as a separate parameter in the SHAP ranking.
For TCM, the SHAP plot shows RWS and specific charge as the main influencing factors, with both pushing SHAP negative as they increase, meaning lowering P50 and producing finer fragments. Larger joint-plane spacing shifts SHAP positive and produces coarser fragmentation. Compared with the extended Kuz-Ram model, the Two-Component Model considers joint-plane spacing explicitly, so part of the rock mass blastability is already captured by this variable. Consequently, the Rock Mass Description in TCM mainly reflects other geological attributes such as intact rock strength, degree of fracturing, and weathering, and is therefore less influential than in the Kuz-Ram framework. The impact of explosive weight appears weak because its effect is already captured by specific charge. Apart from joint-plane spacing and angle, which are not explicit in the extended Kuz-Ram model, and delay time, which is not included in the TCM, the overall set of significant parameters are consistent between the two models.
It should be noted that the URBM has higher range of SHAP values in comparison with the extended Kuz-Ram model, meaning that the URBM predictions are more sensitive to changes in key input features.
4. Conclusions
In this study, critical analyses of a range of empirical and regression models are conducted to identify the most accurate model for the prediction of the size distribution of blast-induced fragments at the draw points in sublevel caving operations. To achieve this, field data from the Ernest Henry Mine (EHM), were collected from published research and analysed. At EHM, full-scale blasting trials were conducted in an active sublevel caving operation. Fragmentation was measured using a laser scanner across six trials, with variations in blasthole diameter, burden size, and explosive charge density.
A range of empirical and regression models were applied to predict the size distributions, and their results were compared to the field data. The prediction accuracy of 20%, 50%, and 80% passing sizes (P20, P50 and P80) of the distribution was assessed.
Results showed that the Underground Ring Blasting Model (URBM) captures the effect of changes in explosive density more accurately than the Kuz-Ram-based models. In the Kuz-Ram formulations, explosive density affects fragmentation primarily through the explosive mass term and the powder factor. However, the powder factor is also sensitive to burden and charge spacing, which makes it difficult to attribute changes in predicted fragmentation to explosive density alone. It was found a change in the explosive-weight exponent from 1/6 to 1/3 improved the prediction of the median fragment size.
The analysis has showed that applying an adjustment = to the maximum size (Xmax) used in the Kuz-Ram Cunningham Ouchterlony (KCO) model can improve the size distribution predictions. The study has demonstrated that individual calibrations of the exponents used in different models against field data can increase their accuracy for fragmentation size prediction. In addition, the results showed that the models which are capable of applying different shaped curves (i.e., non-symmetrical, unlike the Rosin Ramler model where the curve is symmetrical) above and below P50 can be more accurately accounting for variations in field measured data. Among the assessed models, the URBM, TCM and KCO offer the flexibility of different shaped curves either side of P50. The definition of the uniformity index for fines in TCM increased the accuracy of the original Kuz-Ram model by about 1.5% in the fines portion of the curve.
The Mean Absolute Percentage Error (MAPE) for URBM is 5% for P50 and 3% for P80 and 10% for P20. The extended Kuz-Ram model has an improved prediction for P20 with the MAPE of 8%. The prediction of P20 from TCM and extended Kuz-Ram model has the same accuracy. Overall, URBM has demonstrated strong consistency in the prediction performance, with less variability in errors compared with other models, indicating not only low MAPE values but also reliable performance across different scenarios. Calibration of URBM is easier compared with Kuz-Ram–based models because it uses a smaller and more direct set of input parameters. For example, in URBM, burden and charge spacing are entered as two independent variables and can be adjusted directly. As shown in Table 1, for the Kuz-Ram, extended Kuz-Ram, TCM and KCO models, however, the effects of burden and spacing are partly hidden inside composite terms such as specific charge or the rock factor. This makes calibration more complicated, since changing one parameter can unintentionally alter the influence of others. In URBM, each parameter is decoupled, so you can change one without over-capturing its effect through two or three other inputs.
A SHAP-based sensitivity analysis of P50 clarified the important influential variables for each model. In URBM, tensile strength is the most influential variable, highlighting the primacy of rock breakage resistance in confined underground conditions. In the extended Kuz-Ram model, delay time is considered as the most important variable. While the delay time certainly affects fragmentation, treating it as the most sensitive variable is questionable. The analysis of the EHM cases, using the same delay time, showed that incorporating the delay time factor in the extended Kuz-Ram model enhances the sensitivity of predicted fragmentation to variations in burden, compared to the original Kuz-Ram model without using the delay time parameter. It is important to note that model accuracy metrics alone are insufficient to ensure physically realistic fragmentation predictions, because the results remain strongly dependent on the reliability and representativeness of the input parameters used in the model. The high consistency and reliability of the EHM dataset explain the similarly good performance of all fragmentation models, with only minor differences in their predictions. Accordingly, model selection should prioritise formulations that use parameters easily obtainable from field measurements. To further improve the ability of the extended Kuz-Ram model to predict the influence of burden sizes, an input variable more physically meaningful than delay timing could be considered. Such an alternative could involve parameters that explicitly describe energy coupling and rock responses, such as the stemming to burden ratio, burden to hole diameter ratio, or a wave interaction index that accounts for stress-wave overlap between adjacent holes. For the TCM, SHAP analysis showed that its most influential parameters are the RWS and blastability of the rock.
Future research should focus on expanding field datasets to capture influences of input variables under a wider range of conditions for underground mining operations where ring blasting is involved. Since remote fragmentation measurement systems can introduce inaccuracies, careful analysis at the time of measurement is essential. With larger and higher-quality datasets, advanced approaches such as artificial intelligence could further improve prediction accuracy and generalisability of the models.
Acknowledgments
This research was funded by the Australian Research Council Integrated Operations for Complex Resources Industrial Transformation Training Centre (project number IC190100017) and jointly supported by universities, industry, and the Australian Government.
References
- AKINBINU, V. A.; ONIYIDE, G. O.; IDRIS, M. A. Assessment of rock fragmentation and strength properties using the Rosin-Rammler and Extended Swebrec Distribution functions parameters. International Journal of Mining and Geo-Engineering 2022, 56, 53–60. [Google Scholar]
- ALER, J.; DU MOUZA, J.; ARNOULD, M. Measurement of the fragmentation efficiency of rock mass blasting and its mining applications. In International journal of rock mechanics and mining sciences & geomechanics abstracts; Elsevier, 1996; pp. 125–139. [Google Scholar]
- AWAN, A. An Introduction to SHAP Values and Machine Learning Interpretability. In DataCamp. Recuperado; 2023; p. 23. [Google Scholar]
- BERGMANN, O.; WU, F.; EDL, J. Model rock blasting measures effect of delays and hole patterns on rock fragmentation: 8F, 1T, 20R. ENGNG. MIN. J. V175, N6, JUNE, 1974, P124–127. International Journal of Rock Mechanics and Mining Sciences & Geomechanics Abstracts 1974, Pergamon. A233. [Google Scholar]
- BRUNTON, I. The impact of blasting on sublevel caving material flow behaviour and recovery; University of Queensland, 2009. [Google Scholar]
- BRUNTON, I.; FRASER, S.; HODGKINSON, J.; STEWART, P. Parameters influencing full scale sublevel caving material recovery at the Ridgeway gold mine. International Journal of Rock Mechanics and Mining Sciences 2010, 47, 647–656. [Google Scholar] [CrossRef]
- CAMPBELL, A. Full-scale experiments and numerical modelling to improve ore recovery in sublevel cave mines. 2019. [Google Scholar] [CrossRef]
- CAMPBELL, A. A global review of recovery, dilution and draw control in sublevel caving mines. In Caving 2022: Proceedings of the Fifth International Conference on Block and Sublevel Caving; Australian Centre for Geomechanics, 2022; pp. 909–926. [Google Scholar]
- CAMPBELL, A.; POWER, G. Improving calibration of flow models against SLC marker trials by linking blasting effects to particle mobility. 13th AusIMM Underground Operators’ Conference; 2017. [Google Scholar]
- CAMPBELL, A.; THURLEY, M. Application of laser scanning to measure fragmentation in underground mines. Mining Technology 2017, 126, 240–247. [Google Scholar] [CrossRef]
- CHUNG, S. H.; KATSABANIS, P. Fragmentation prediction using improved engineering formulae. Fragblast 2000, 4, 198–207. [Google Scholar] [CrossRef]
- COPCO, A. Mining methods in underground mining; Atlas Copco: Nacka, Sweden, 2007. [Google Scholar]
- CUNNINGHAM, C. The Kuz-Ram model for prediction of fragmentation from blasting. Proc. first int. symp. on rock fragmentation by blasting; 1983; pp. 439–453. [Google Scholar]
- CUNNINGHAM, C. Fragmentation estimations and the Kuz-Ram model-four years on. Proc. 2nd int. symp. on rock fragmentation by blasting; 1987; pp. 475–487. [Google Scholar]
- CUNNINGHAM, C. The Kuz-Ram fragmentation model–20 years on. Brighton conference proceedings; European Federation of Explosives Engineer Brighton, UK, 2005; pp. 201–210. [Google Scholar]
- DEGAGNÉ, D. The Influence of Blasting Fragmentation on Ore Recovery in Sublevel Cave Mines. ARMA US Rock Mechanics/Geomechanics Symposium, ARMA; 2005; p. ARMA-05-811. [Google Scholar]
- DJORDJEVIC, N. A two-component model of blast fragmentation. AusIMM Proceedings; 1999; pp. 9–13. [Google Scholar]
- ESEN, S.; ONEDERRA, I.; BILGIN, H. A. Modelling the size of the crushed zone around a blasthole. International Journal of Rock Mechanics and Mining Sciences 2003, 40, 485–495. [Google Scholar] [CrossRef]
- GHEIBIE, S.; AGHABABAEI, H.; HOSEINIE, S.; POURRAHIMIAN, Y. Modified Kuz—Ram fragmentation model and its use at the Sungun Copper Mine. International Journal of Rock Mechanics and Mining Sciences 2009, 46, 967–973. [Google Scholar] [CrossRef]
- HAMDI, E.; DU MOUZA, J.; FLEURISSON, J. Evaluation of the part of blasting energy used for rock mass fragmentation. Fragblast 2001, 5, 180–193. [Google Scholar] [CrossRef]
- HJELMBERG, H. Some ideas on how to improve calculations of the fragment size distribution in bench blasting. 1st international symposium on rock fragmentation by blasting; Lulea University Technology Lulea Sweden, 1983; pp. 469–494. [Google Scholar]
- KATSABANIS, P.; TAWADROUS, A.; KENNEDY, C.; BROWN, C. Timing effects on fragmentation. Proceedings of the annual conference on explosives and blasting technique 2006, 1999, 243. [Google Scholar]
- KHODAYARI, A.; XU, C.; BRYAN, P. D.; DOWD, P.; LAPCEVIC, V.; METCALFE, A. Impact of blast design parameters on rock fragmentation in sub-level caving: A multivariate regression approach. Journal of Rock Mechanics and Geotechnical Engineering 2025. [Google Scholar] [CrossRef]
- KONG, Y.; YU, T. A deep neural network model using random forest to extract feature representation for gene expression data classification. Scientific reports 2018, 8, 16477. [Google Scholar] [CrossRef]
- KOSHELEV, E.; KUZNETSOV, V.; SOFRONOV, S.; CHERNIKOV, A. Statistics of the fragments forming with the destruction of solids by explosion. Journal of Applied Mechanics and Technical Physics 1971, 12, 244–256. [Google Scholar] [CrossRef]
- LILLY, P. A. An empirical method of assessing rock mass blastability. In The Aus; 1986. [Google Scholar]
- MANZOOR, S. Role of Fragmentation at the Production Level of a Sublevel Caving Operation; Luleå University of Technology, 2023. [Google Scholar]
- ONEDERRA, I.; ESEN, S.; JANKOVIC, A. Estimation of fines generated by blasting–applications for the mining and quarrying industries. Mining Technology 2004, 113, 237–247. [Google Scholar] [CrossRef]
- OUCHTERLONY, F. The Swebrec© function: linking fragmentation by blasting and crushing. Mining Technology 2005a, 114, 29–44. [Google Scholar] [CrossRef]
- OUCHTERLONY, F. What does the fragment size distribution of blasted rock look like? EFEE World Conference on Explosives and Blasting: 14/09/2005-16/09/2005; European Federation of Explosives Engineers, 2005b; pp. 189–199. [Google Scholar]
- OUCHTERLONY, F.; SANCHIDRIÁN, J. A. A review of the development of better prediction equations for blast fragmentation. Rock Dynamics and Applications 2018, 3, 25–45. [Google Scholar] [CrossRef]
- SANCHIDRIÁN, J. A.; OUCHTERLONY, F. A distribution-free description of fragmentation by blasting based on dimensional analysis. Rock Mechanics and Rock Engineering 2017, 50, 781–806. [Google Scholar] [CrossRef]
- SANCHIDRIÁN, J. A.; OUCHTERLONY, F.; SEGARRA, P.; MOSER, P. Size distribution functions for rock fragments. International Journal of Rock Mechanics and Mining Sciences 2014, 71, 381–394. [Google Scholar] [CrossRef]
- SEGARRA, P.; SANCHIDRIÁN, J. A.; NAVARRO, J.; CASTEDO, R. The fragmentation energy-fan model in quarry blasts. Rock Mechanics and Rock Engineering 2018, 51, 2175–2190. [Google Scholar] [CrossRef]
- STAGG, M. S.; RHOLL, S. A.; OTTERNESS, R. E.; SMITH, N. S. Influence of shot design parameters on fragmentation. Proc. 3rd Int. Symp. On Rock Fragmentation by Blasting, Brisbane; 1990. [Google Scholar]
- TANG, H.-L.; YANG, J.; YU, Q. Experimental Investigation of the Effect of Delay Time on Rock Fragmentation in Multi-Hole Bench Blasting. Applied Sciences 2023, 13, 7329. [Google Scholar] [CrossRef]
- VESILIND, P. A. The Rosin-Rammler particle size distribution. Resource Recovery and Conservation 1980, 5, 275–277. [Google Scholar] [CrossRef]
- WEIBULL, W. A statistical distribution function of wide applicability. Journal of applied mechanics 1951. [Google Scholar] [CrossRef]
- WIMMER, M. Towards understanding breakage and flow in sublevel caving (SLC): Development of new measurement techniques and results from full-scale tests; Luleå tekniska universitet, 2012. [Google Scholar]
- YI, C.; SJÖBERG, J.; JOHANSSON, D. Numerical modelling for blast-induced fragmentation in sublevel caving mines. Tunnelling and Underground Space Technology 2017, 68, 167–173. [Google Scholar] [CrossRef]
Figure 1.
SLC layout (Copco, 2007).
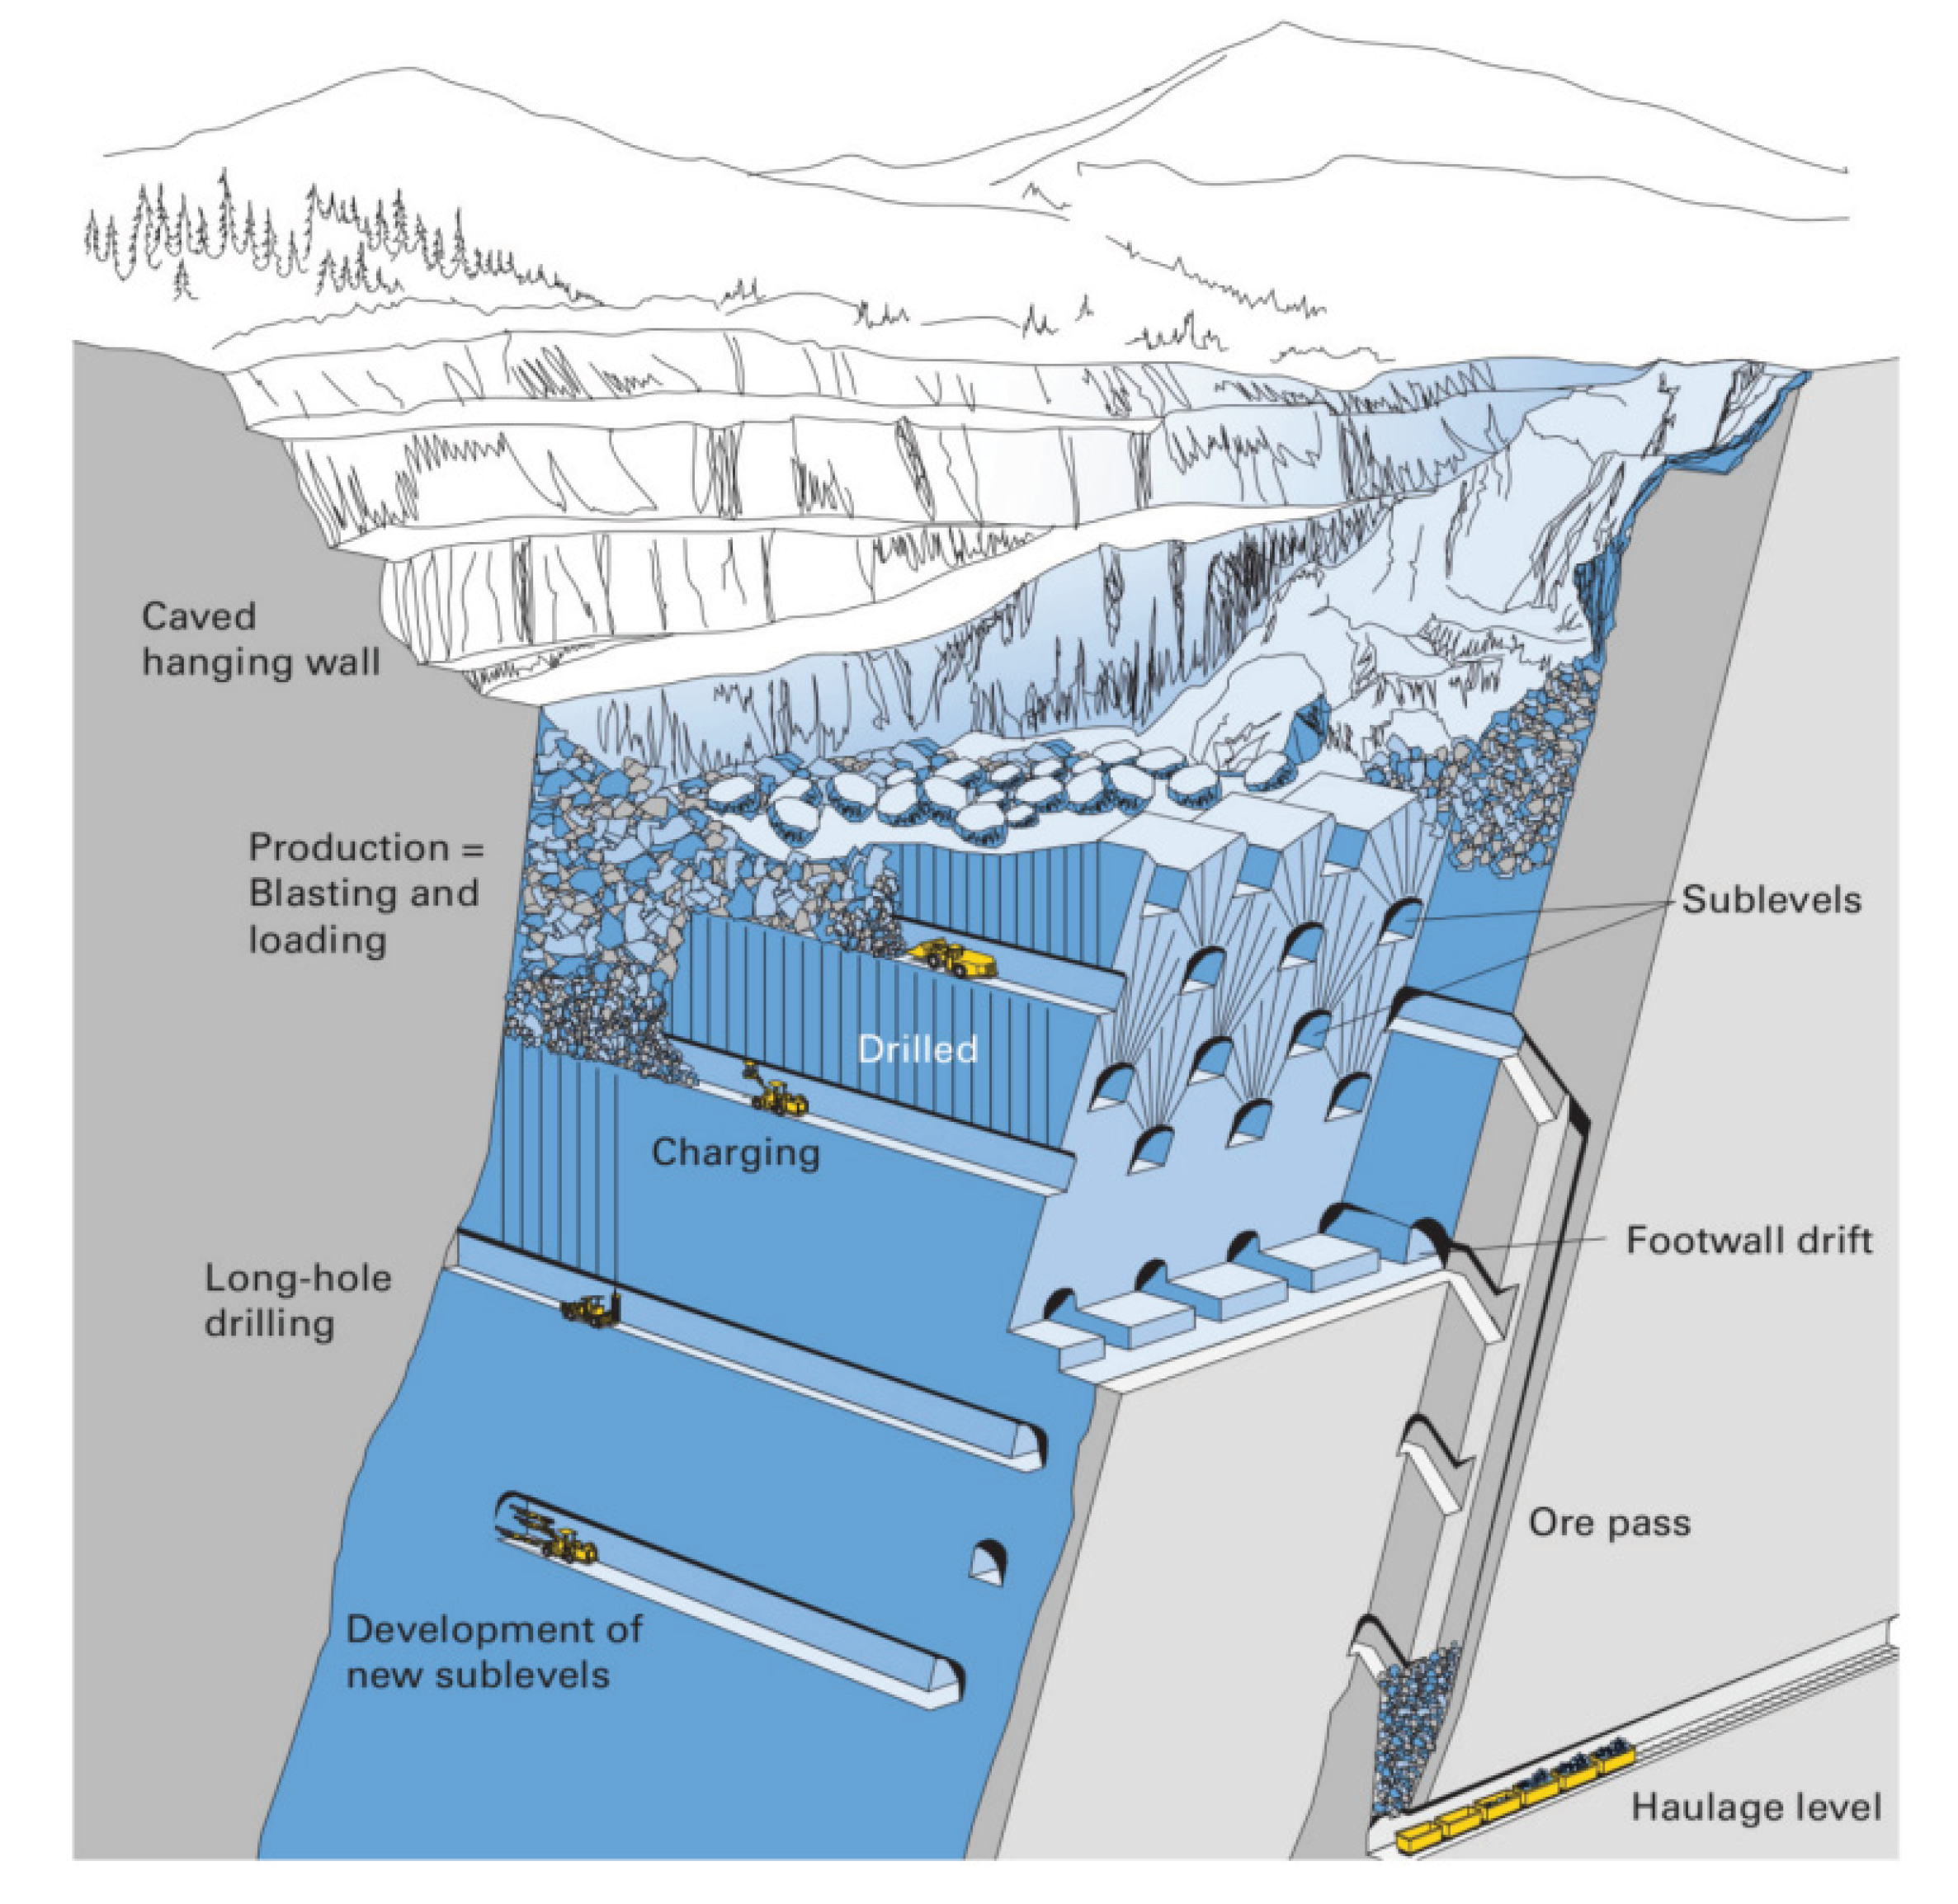
Figure 2.
Different ring blasting patterns in Ridgeway Mine (Brunton et al., 2010).
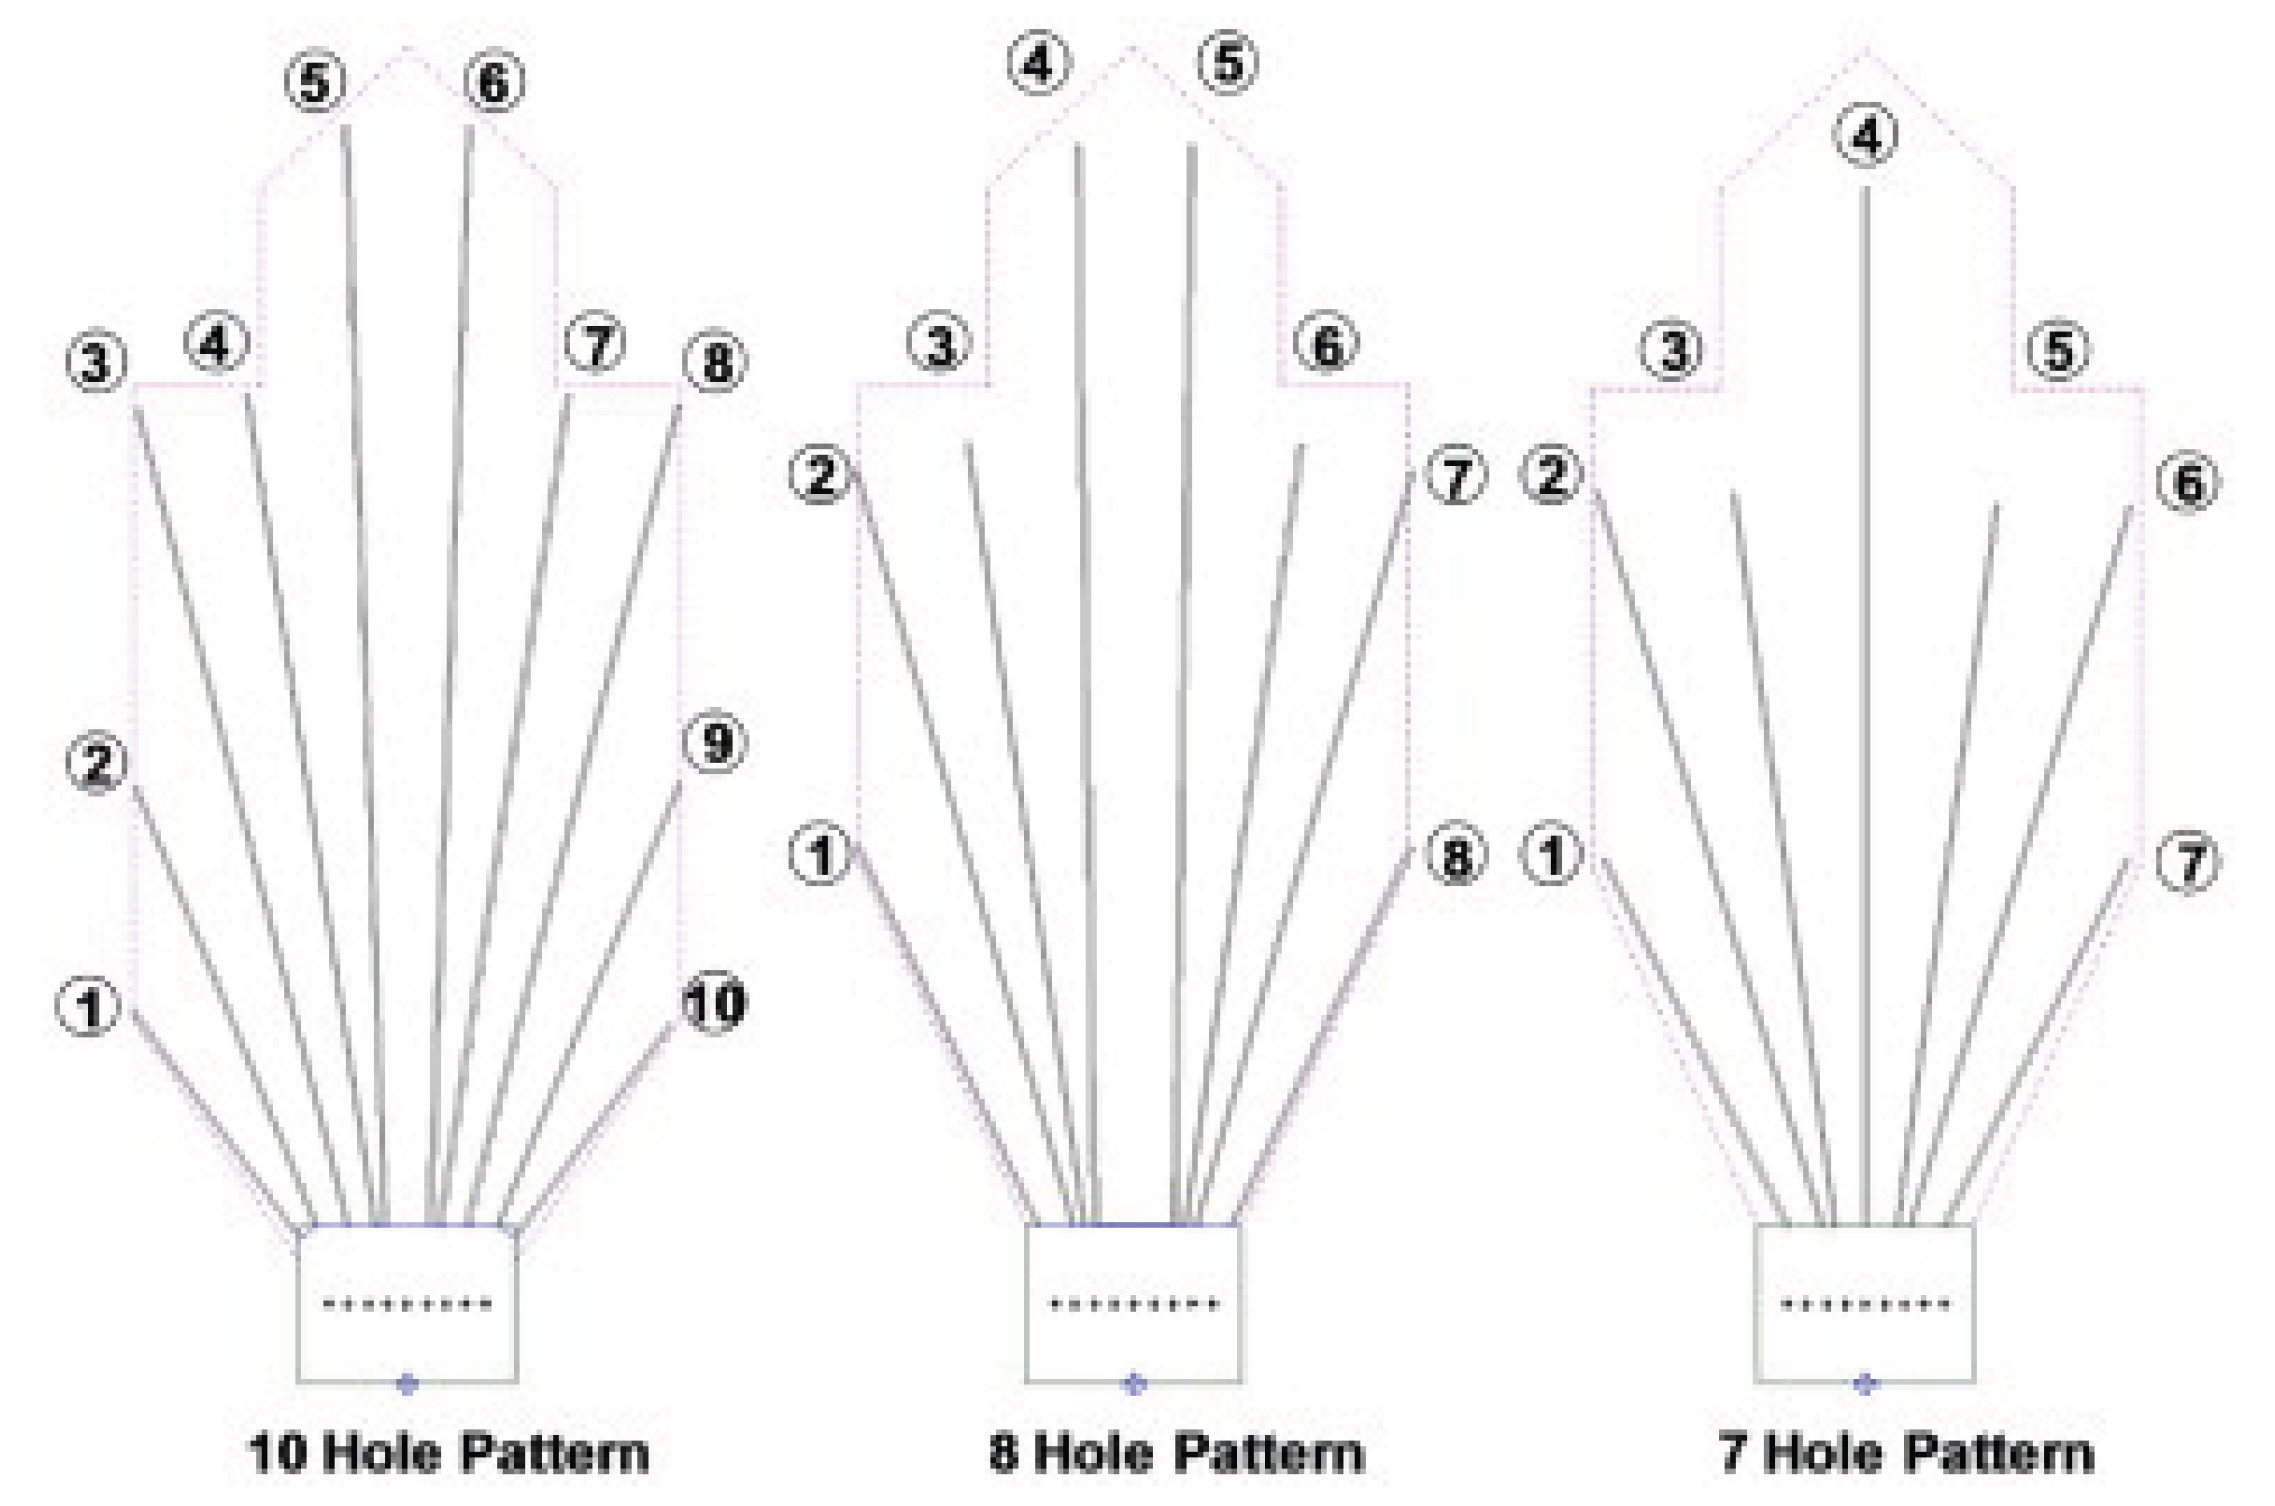
Figure 3.
Draw-point scan of ring 38 at EHM, illustrating: a) the masked original scan, b) the fines region, c) detection of non-overlapped particles, and d) detection of overlapped particles (Campbell, 2019).
Figure 3.
Draw-point scan of ring 38 at EHM, illustrating: a) the masked original scan, b) the fines region, c) detection of non-overlapped particles, and d) detection of overlapped particles (Campbell, 2019).
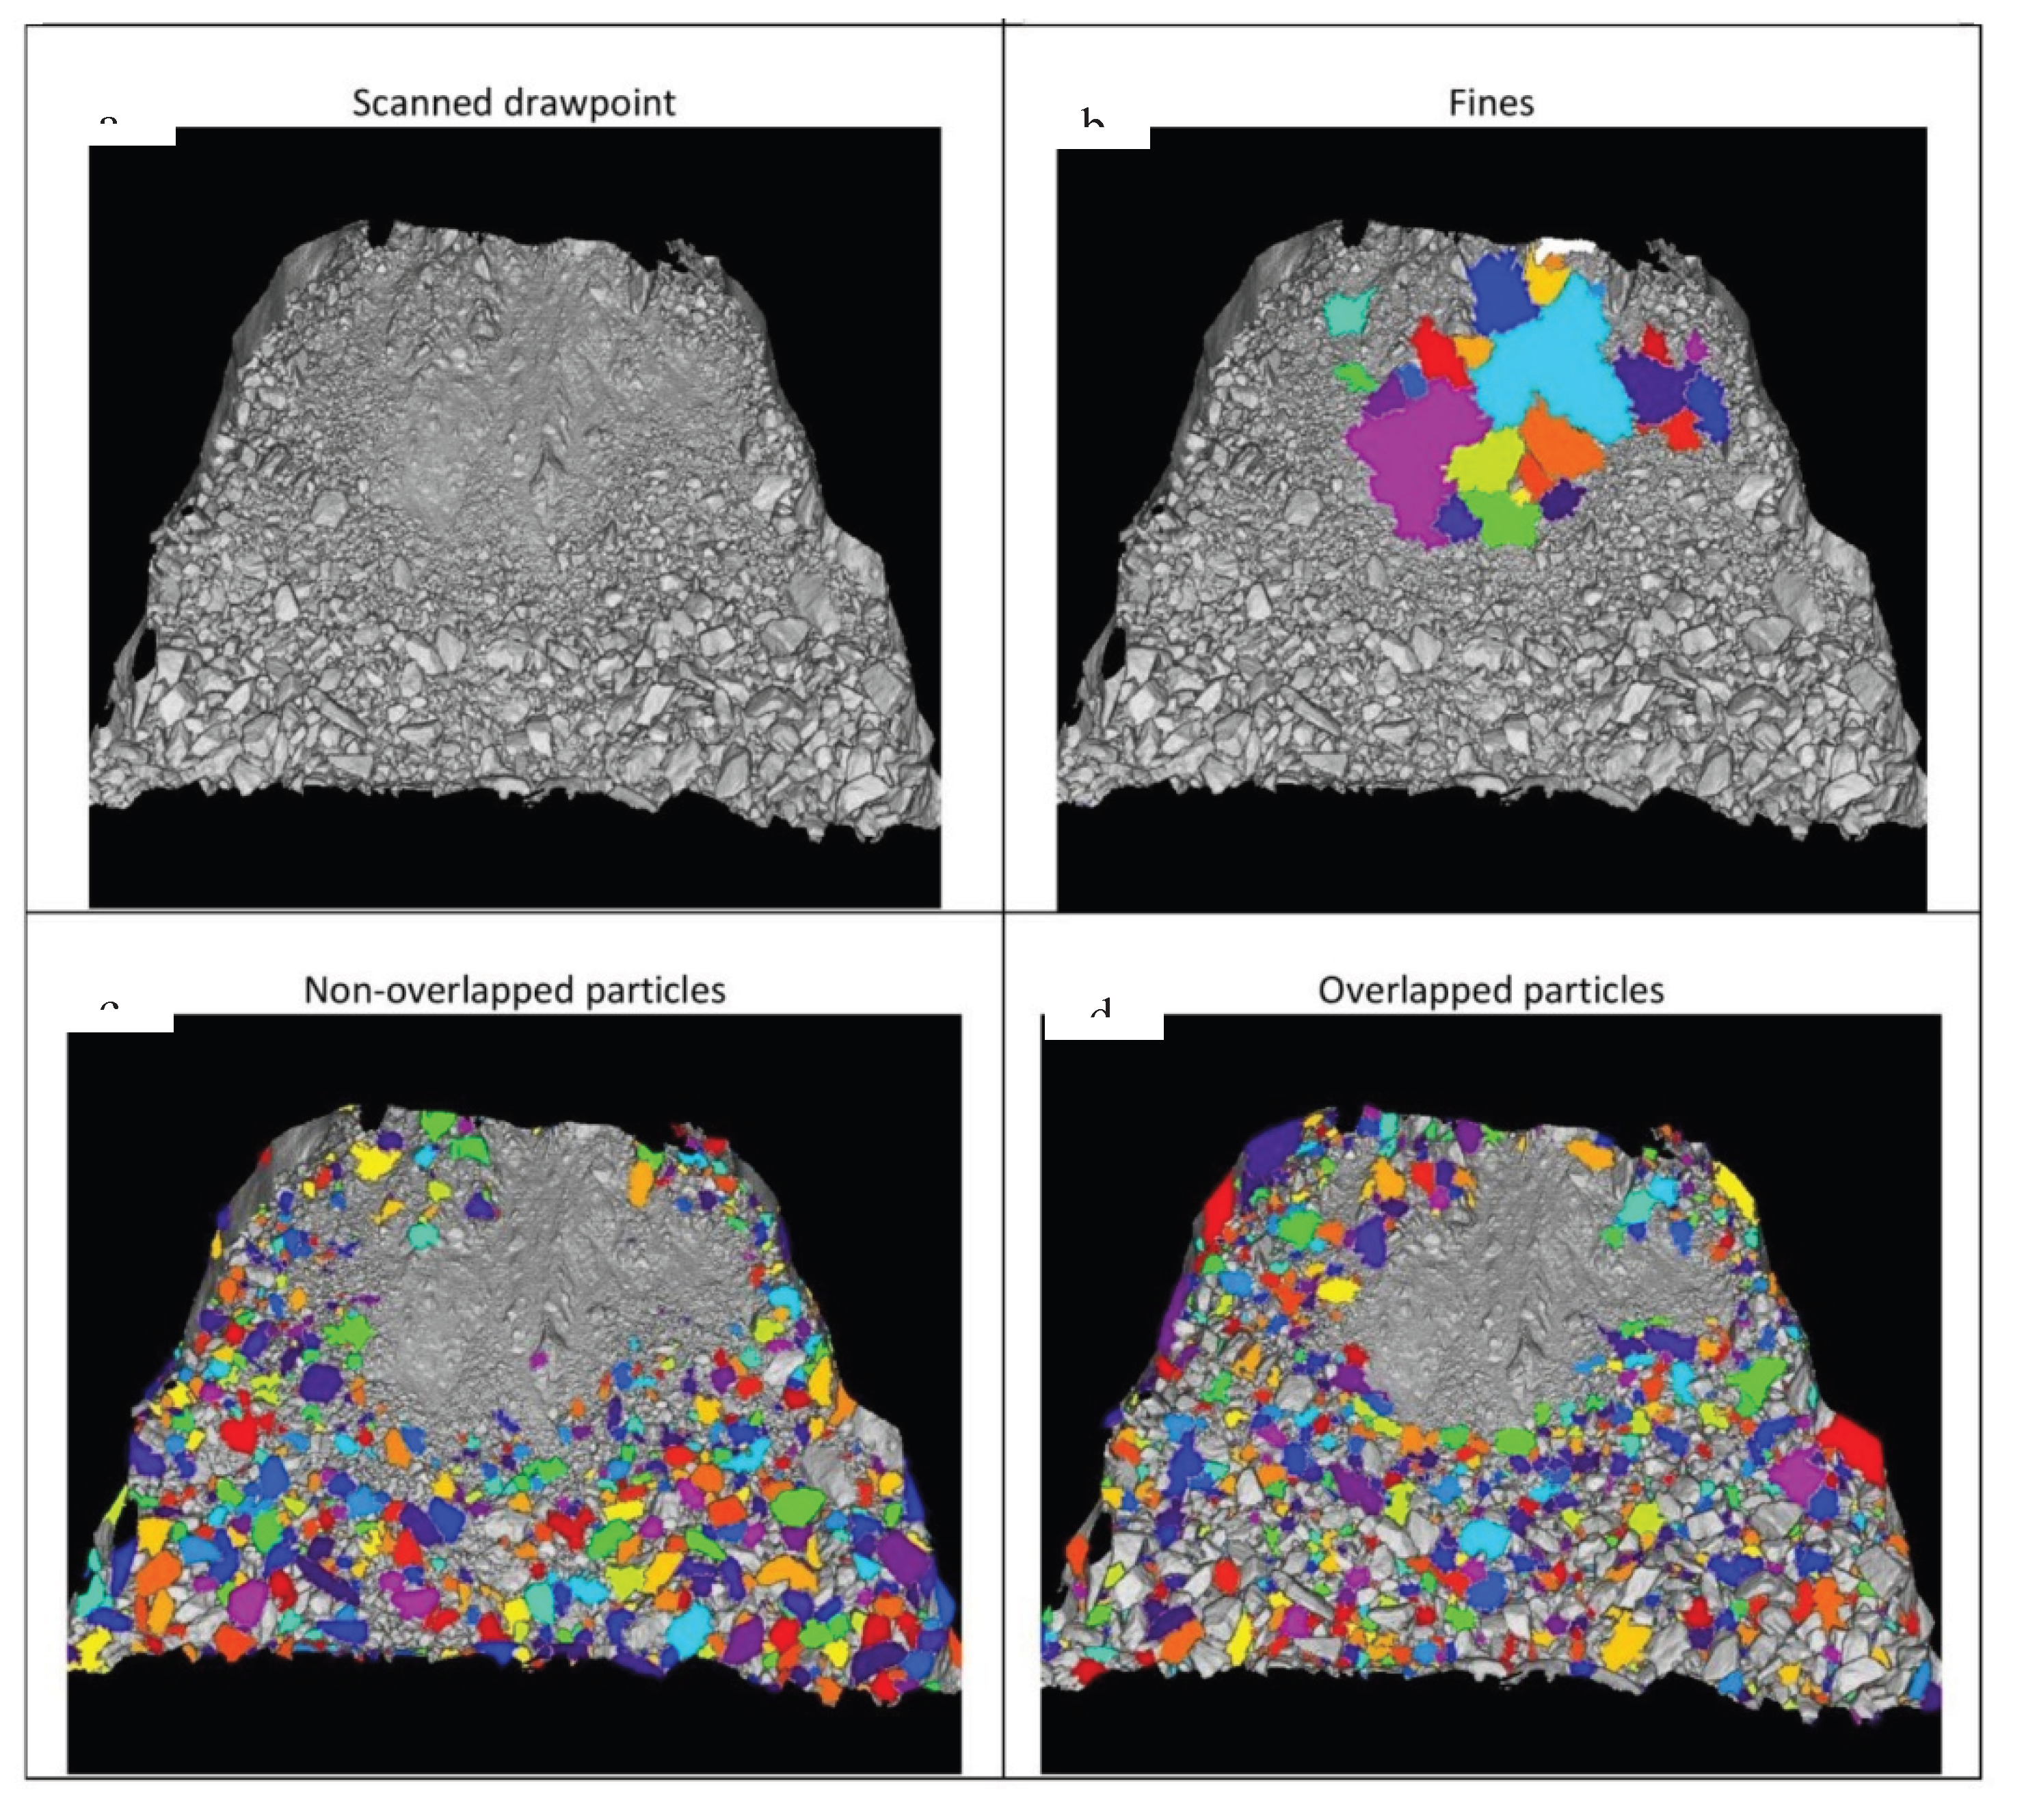
Figure 4.
Variation in the prediction of a) P20, b) P50, and c) P80 by different models across all scenarios.
Figure 4.
Variation in the prediction of a) P20, b) P50, and c) P80 by different models across all scenarios.
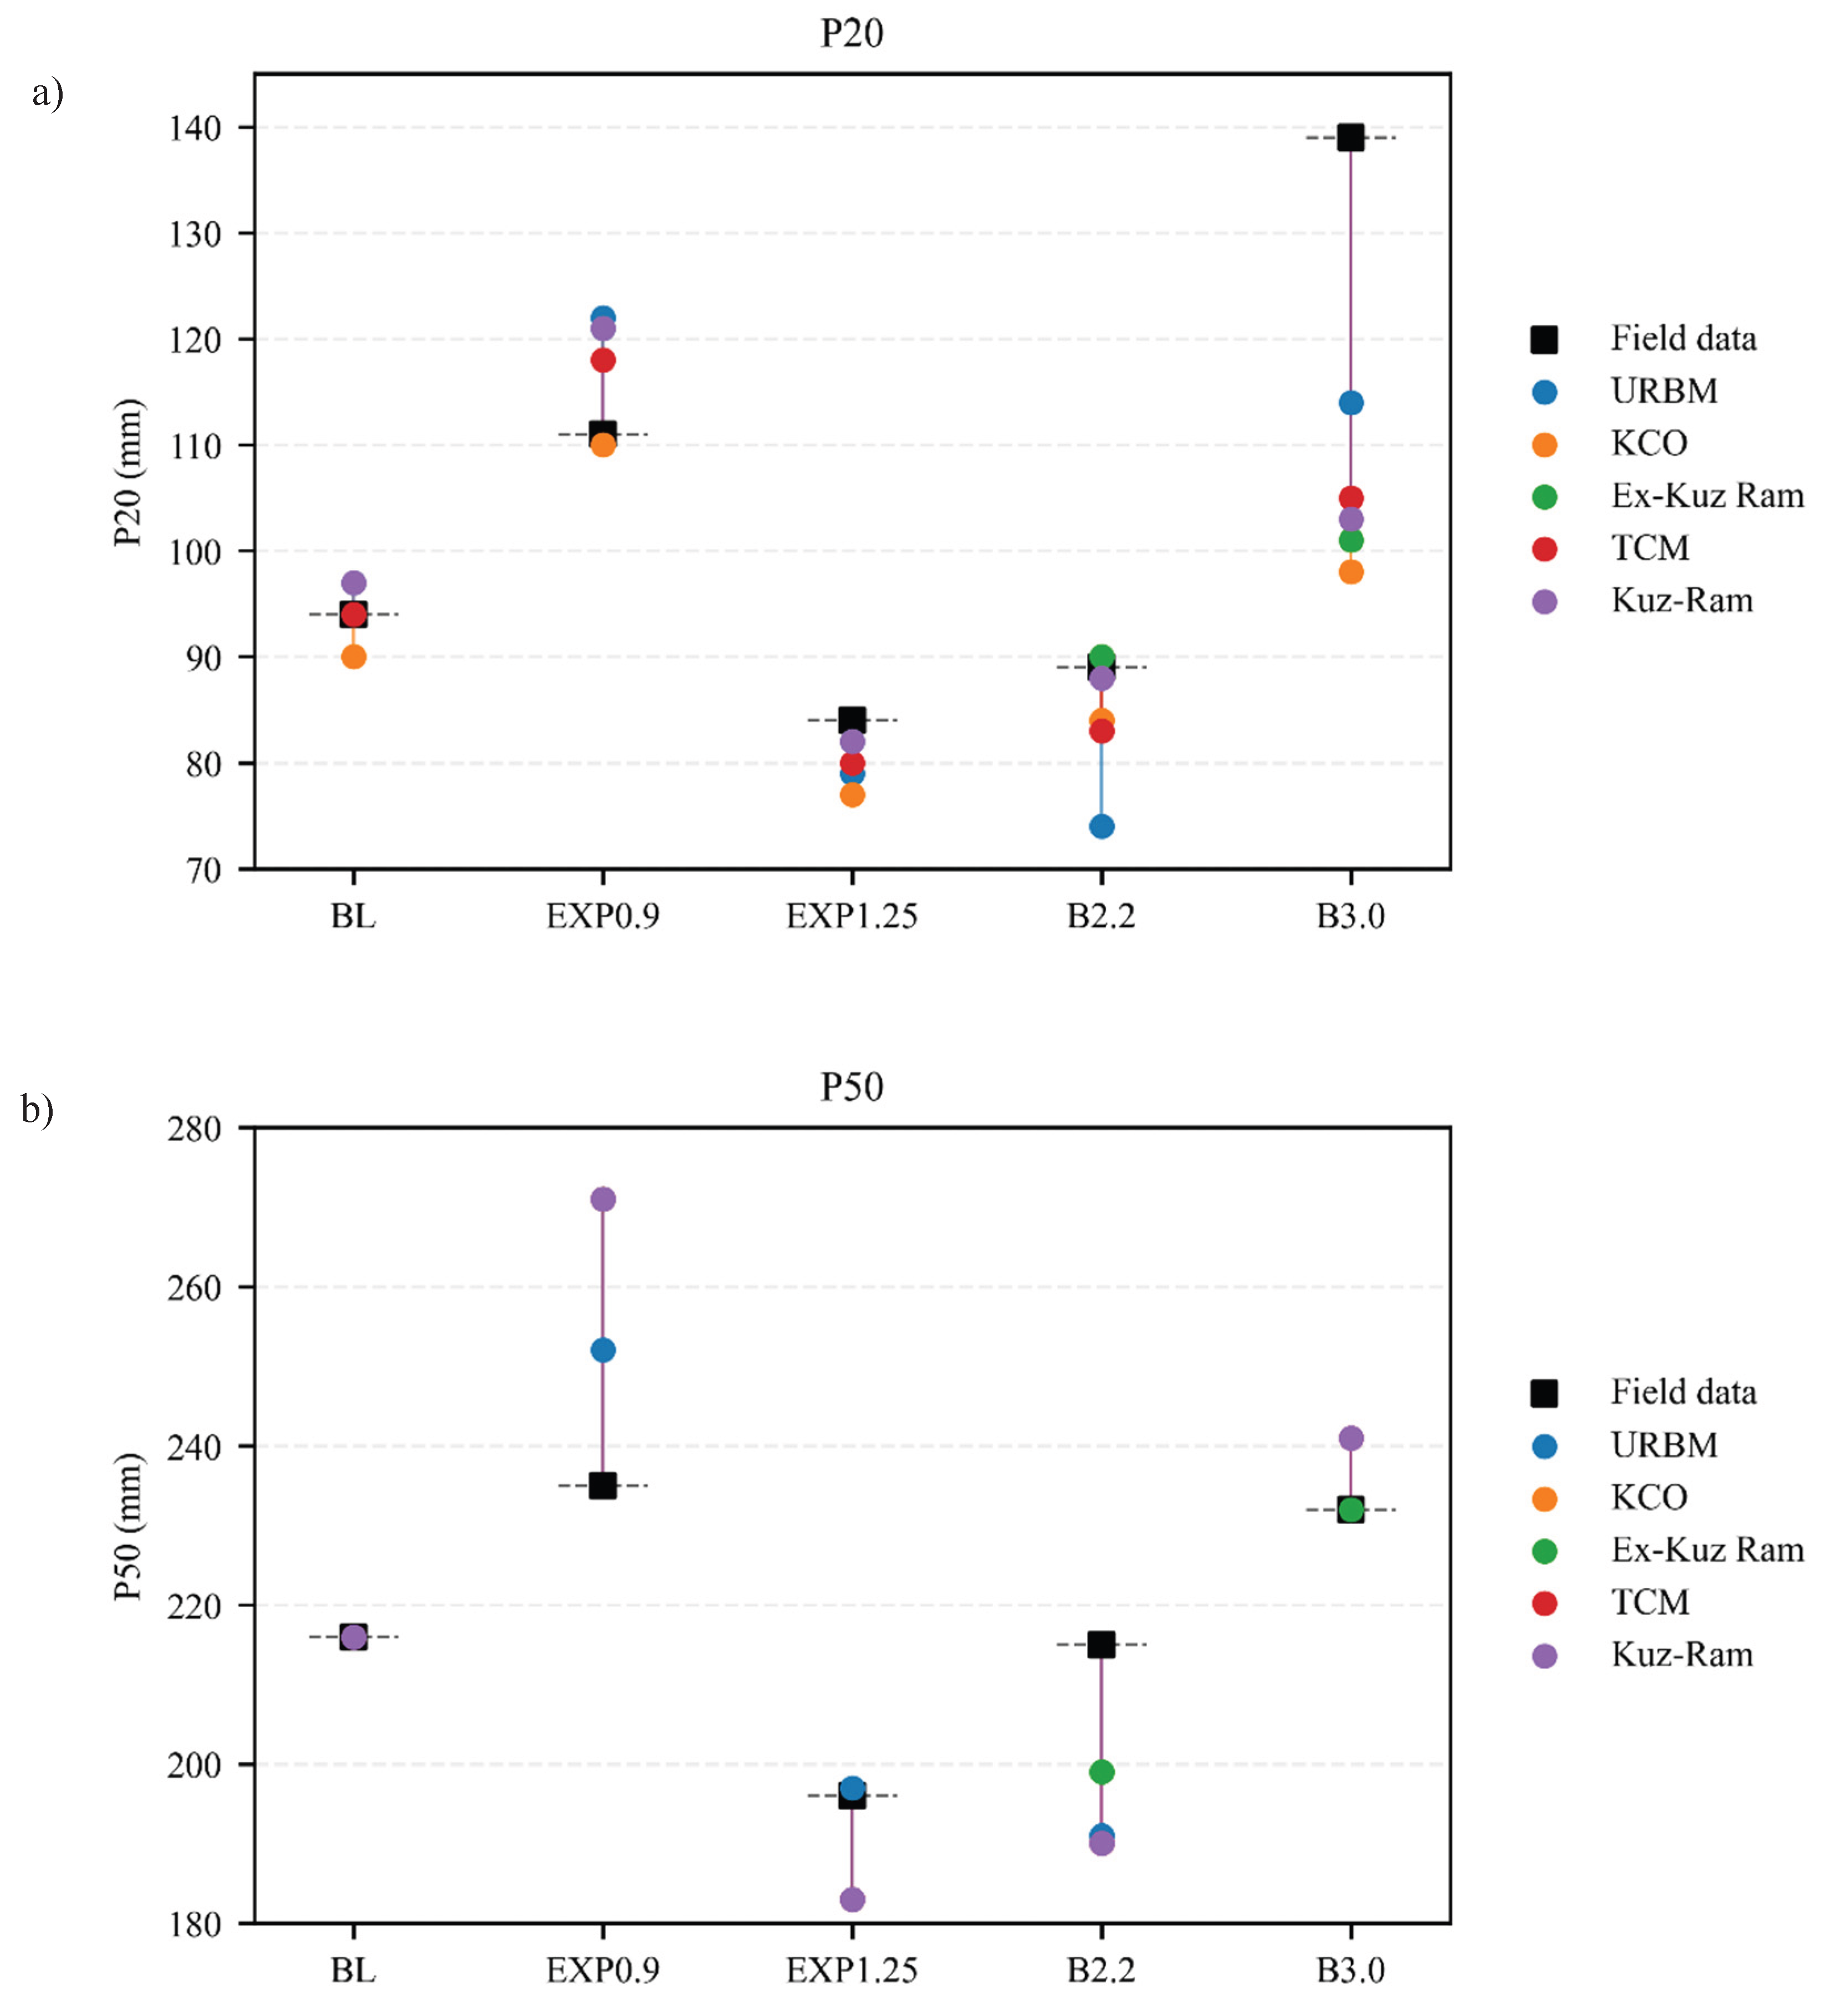
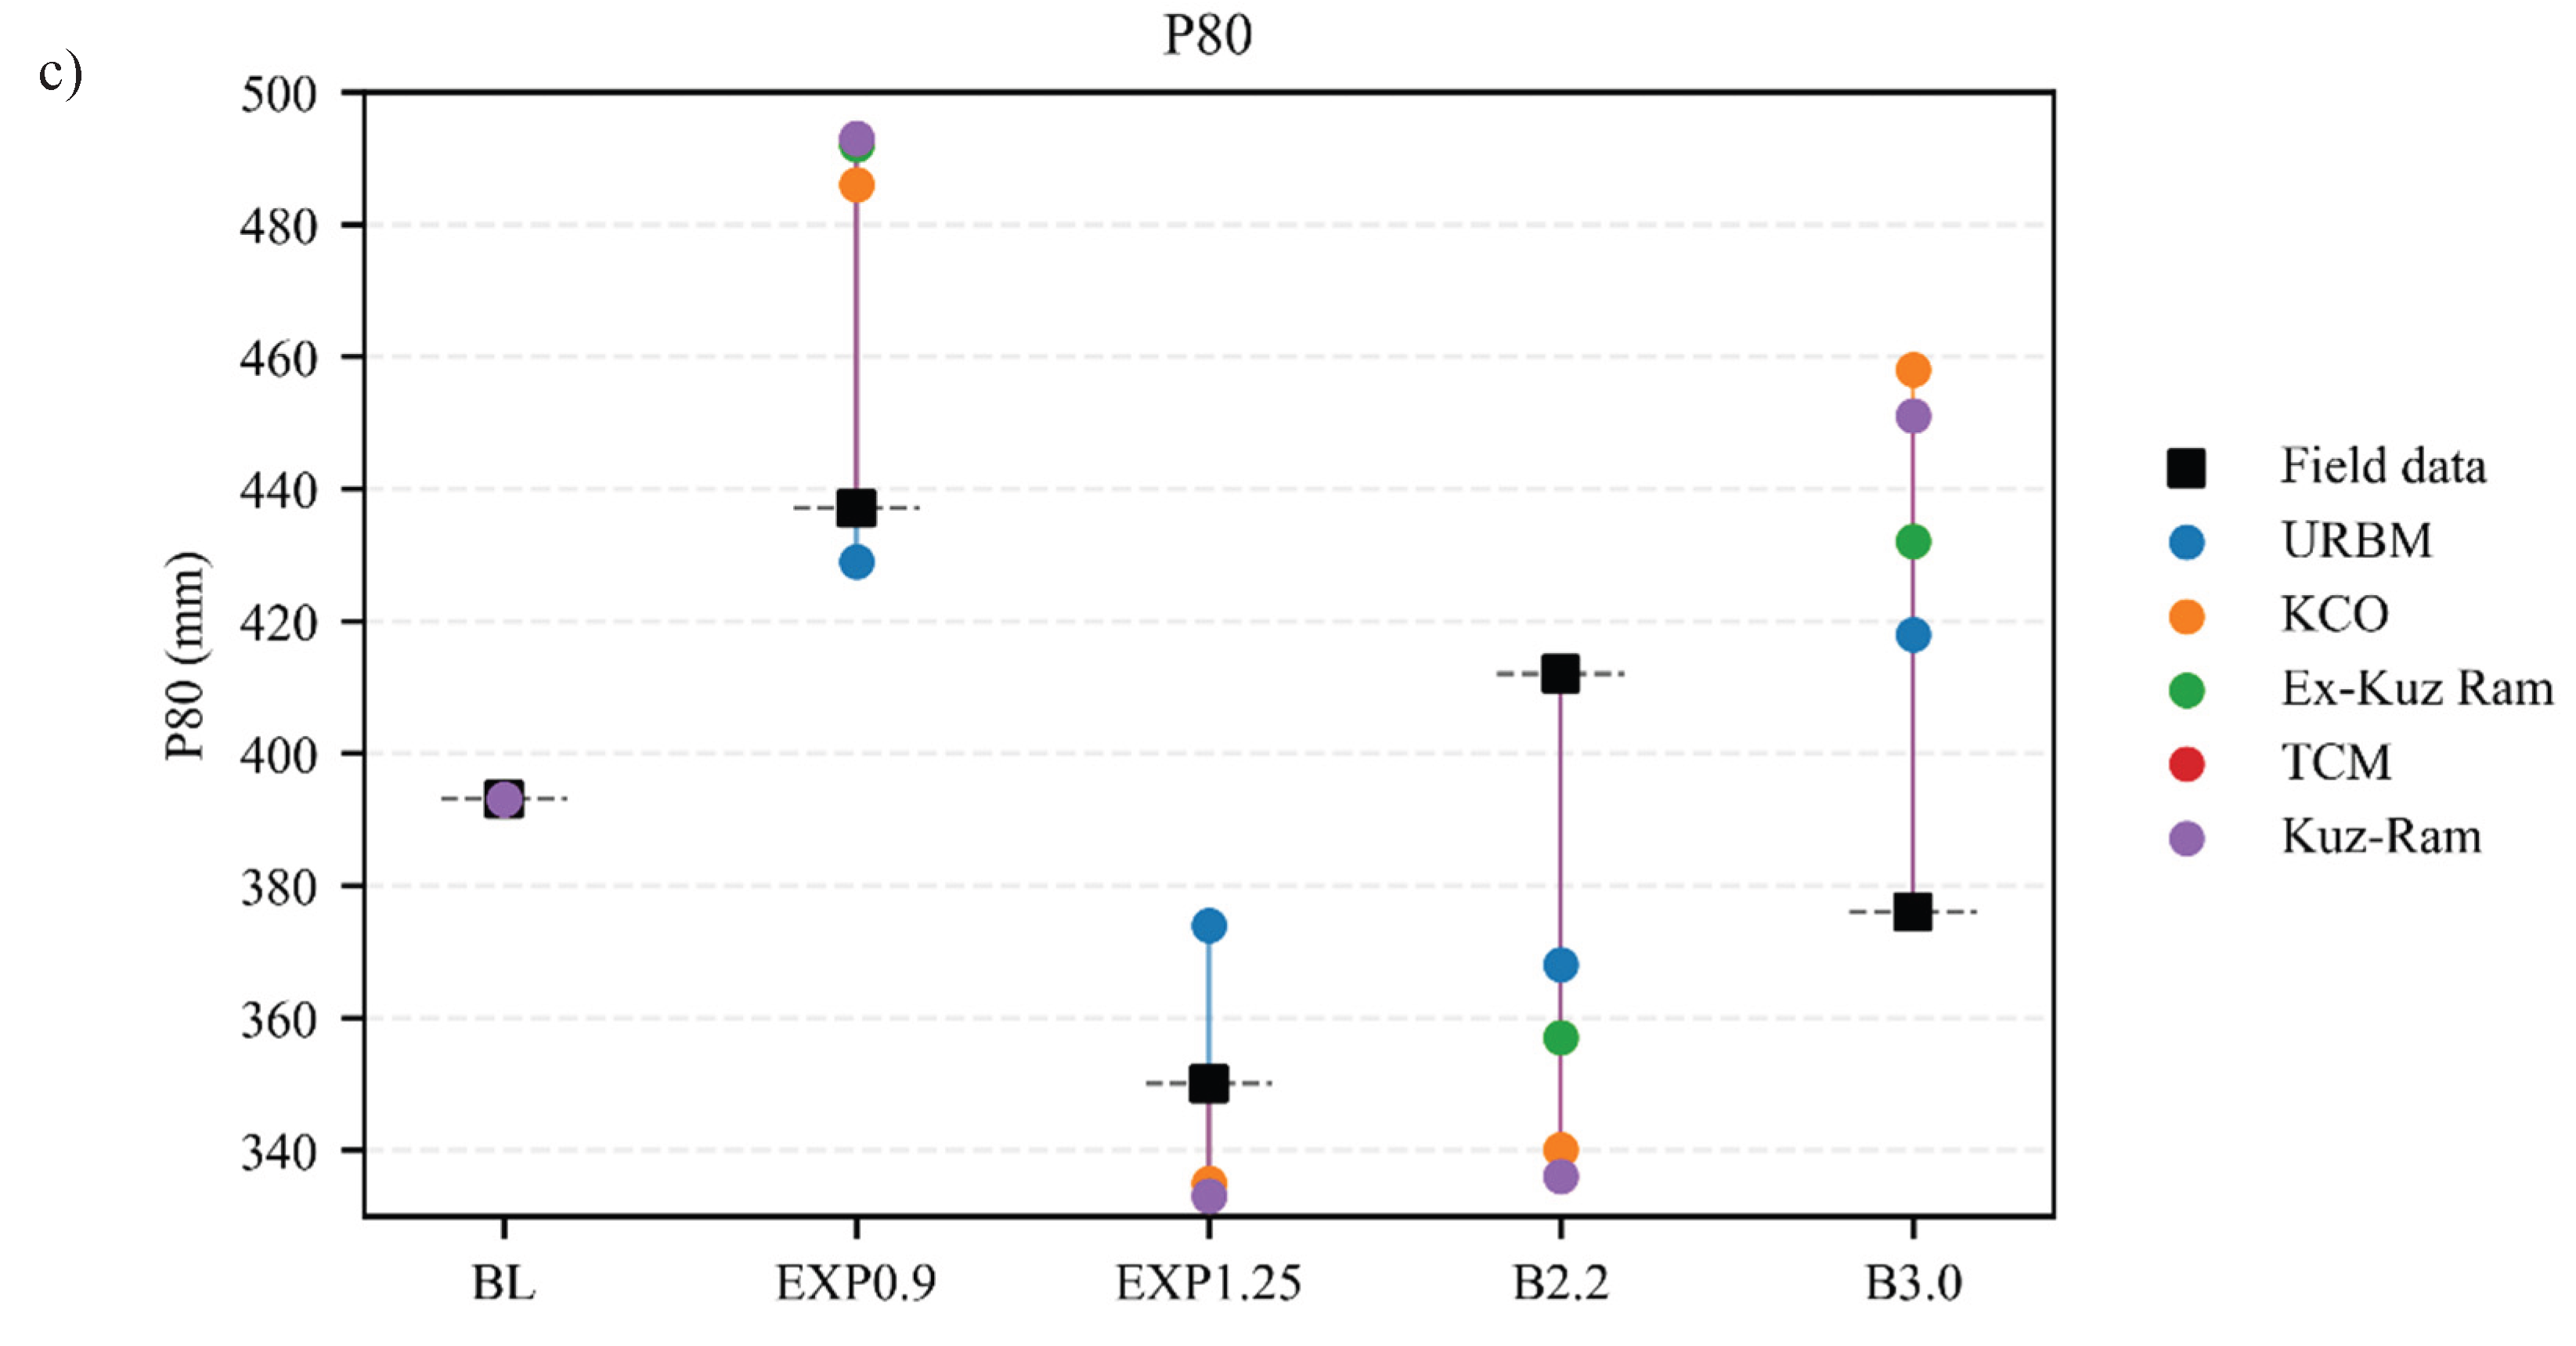
Figure 5.
Swebrec curves for different values of Xmax and b.
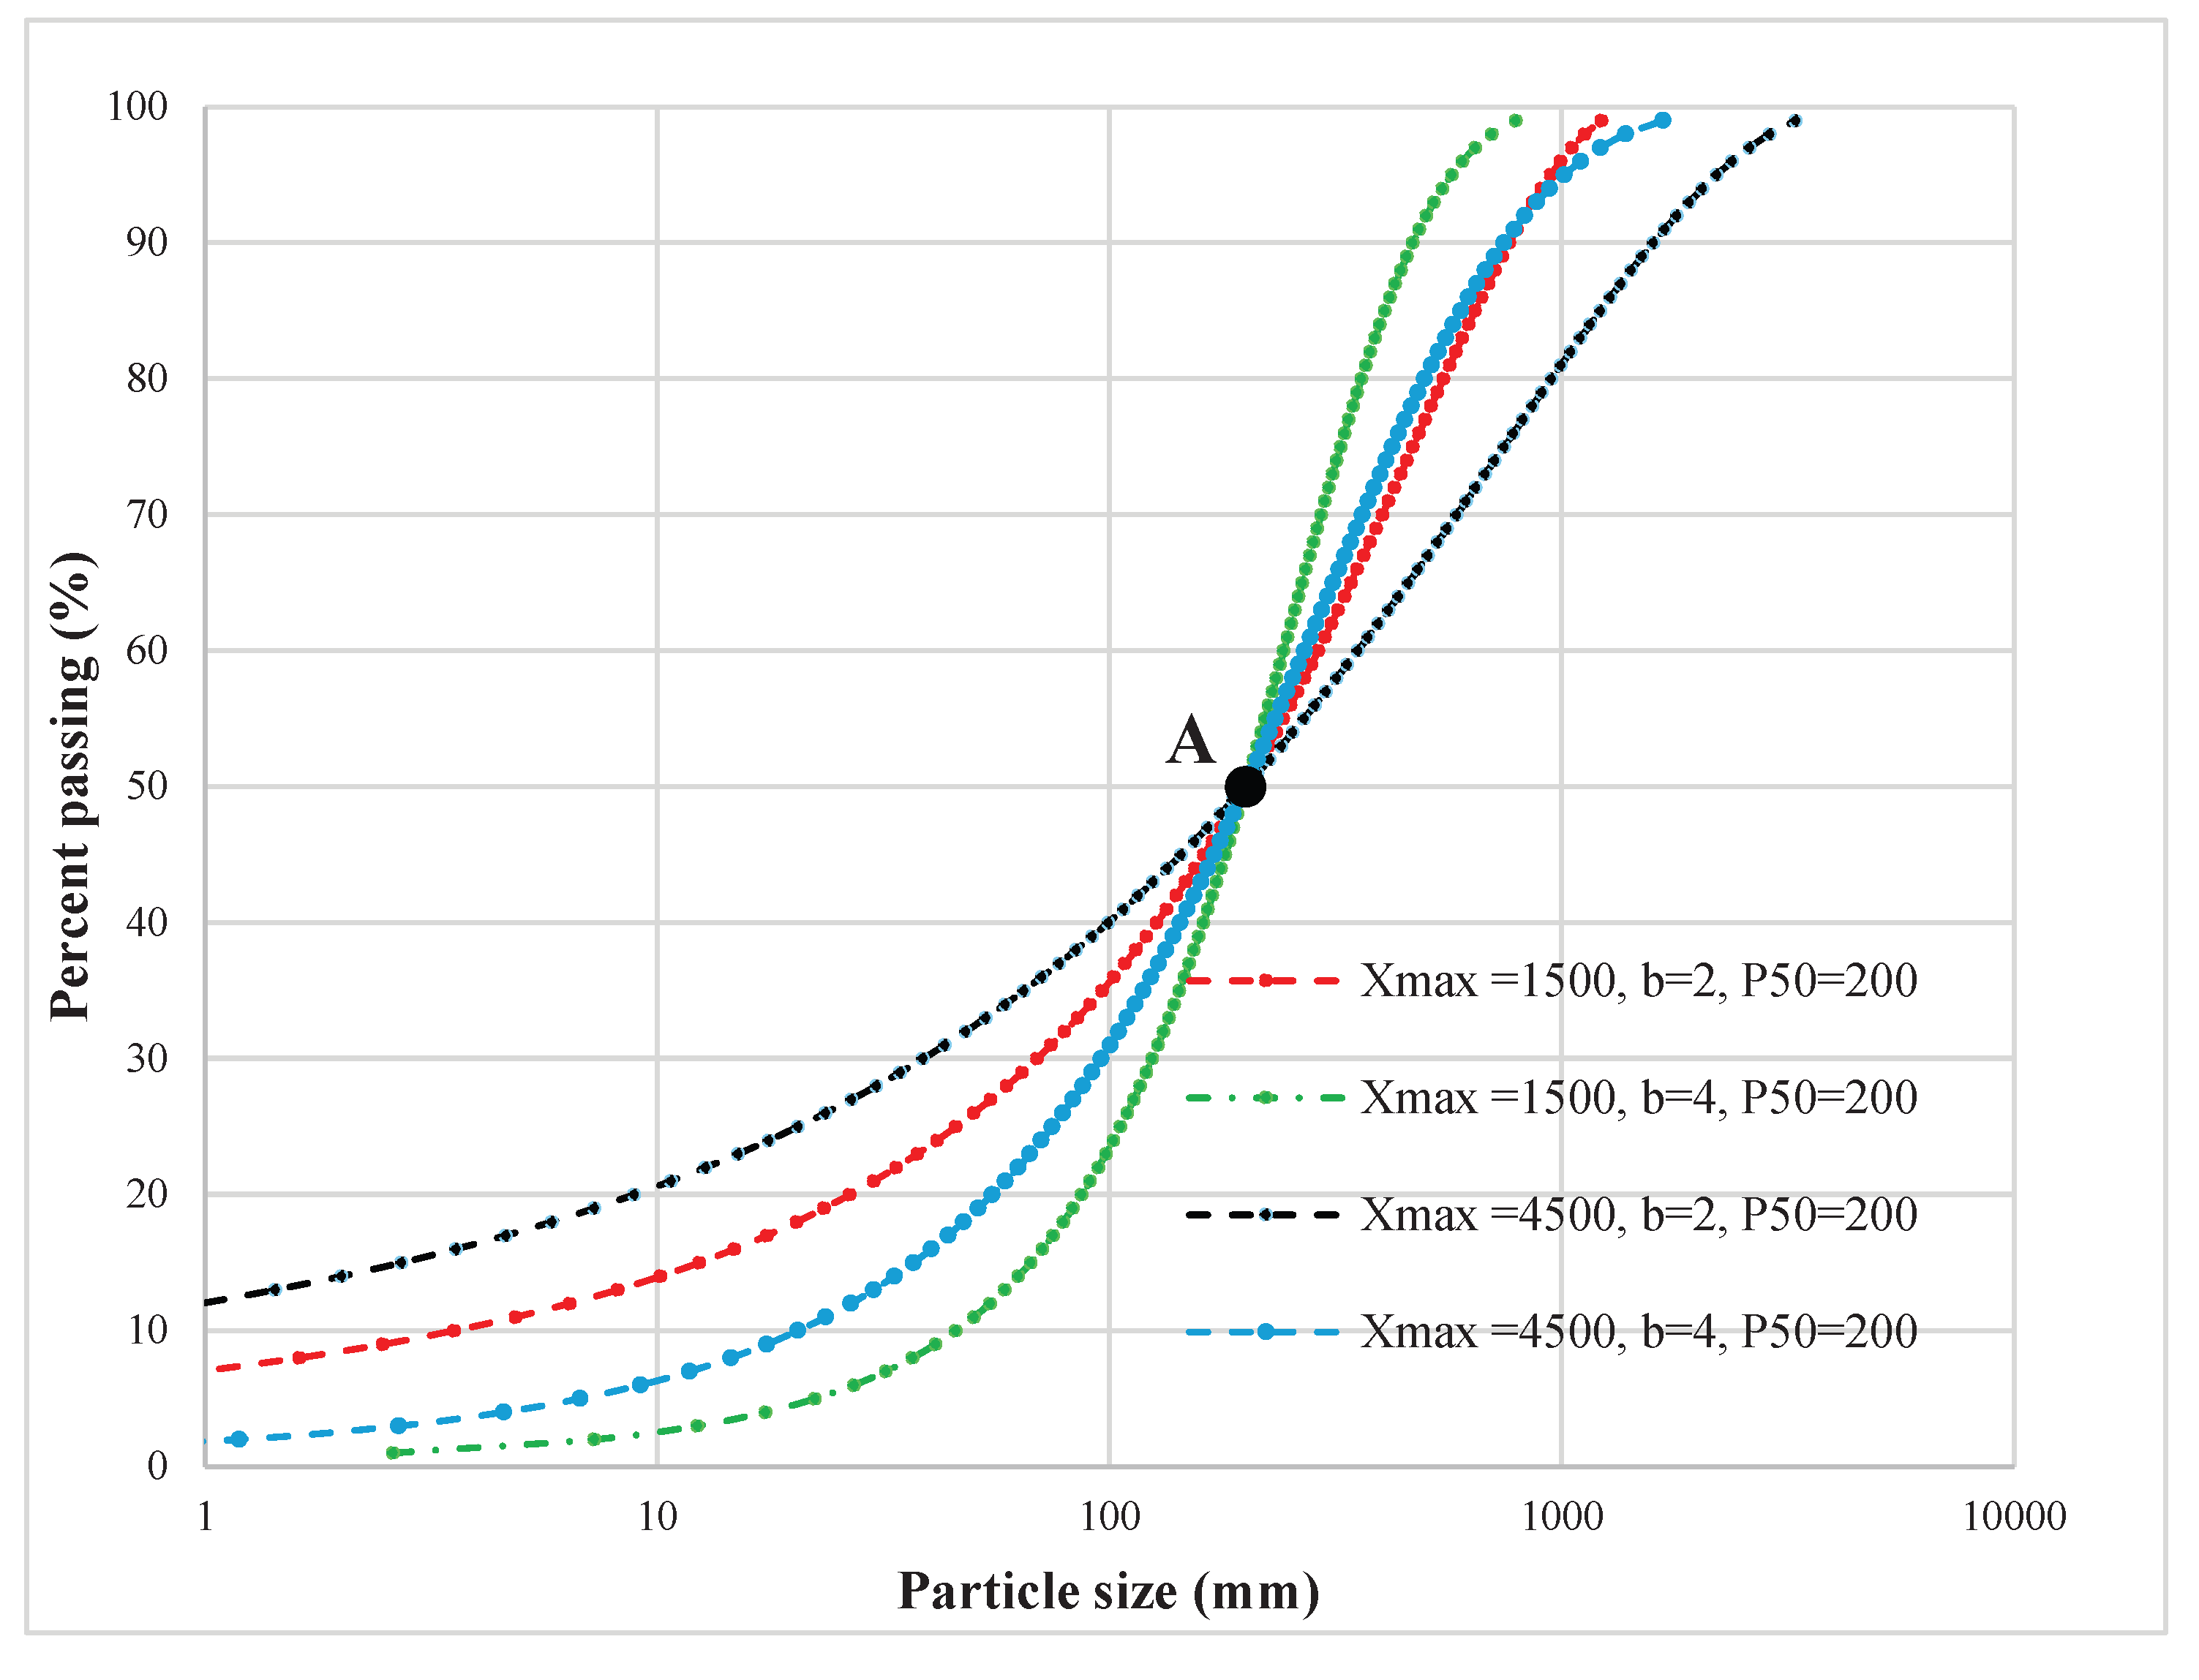
Figure 6.
Boxplots of MAPE for different fragmentation models: a) P20, b) P50 and c) P80.
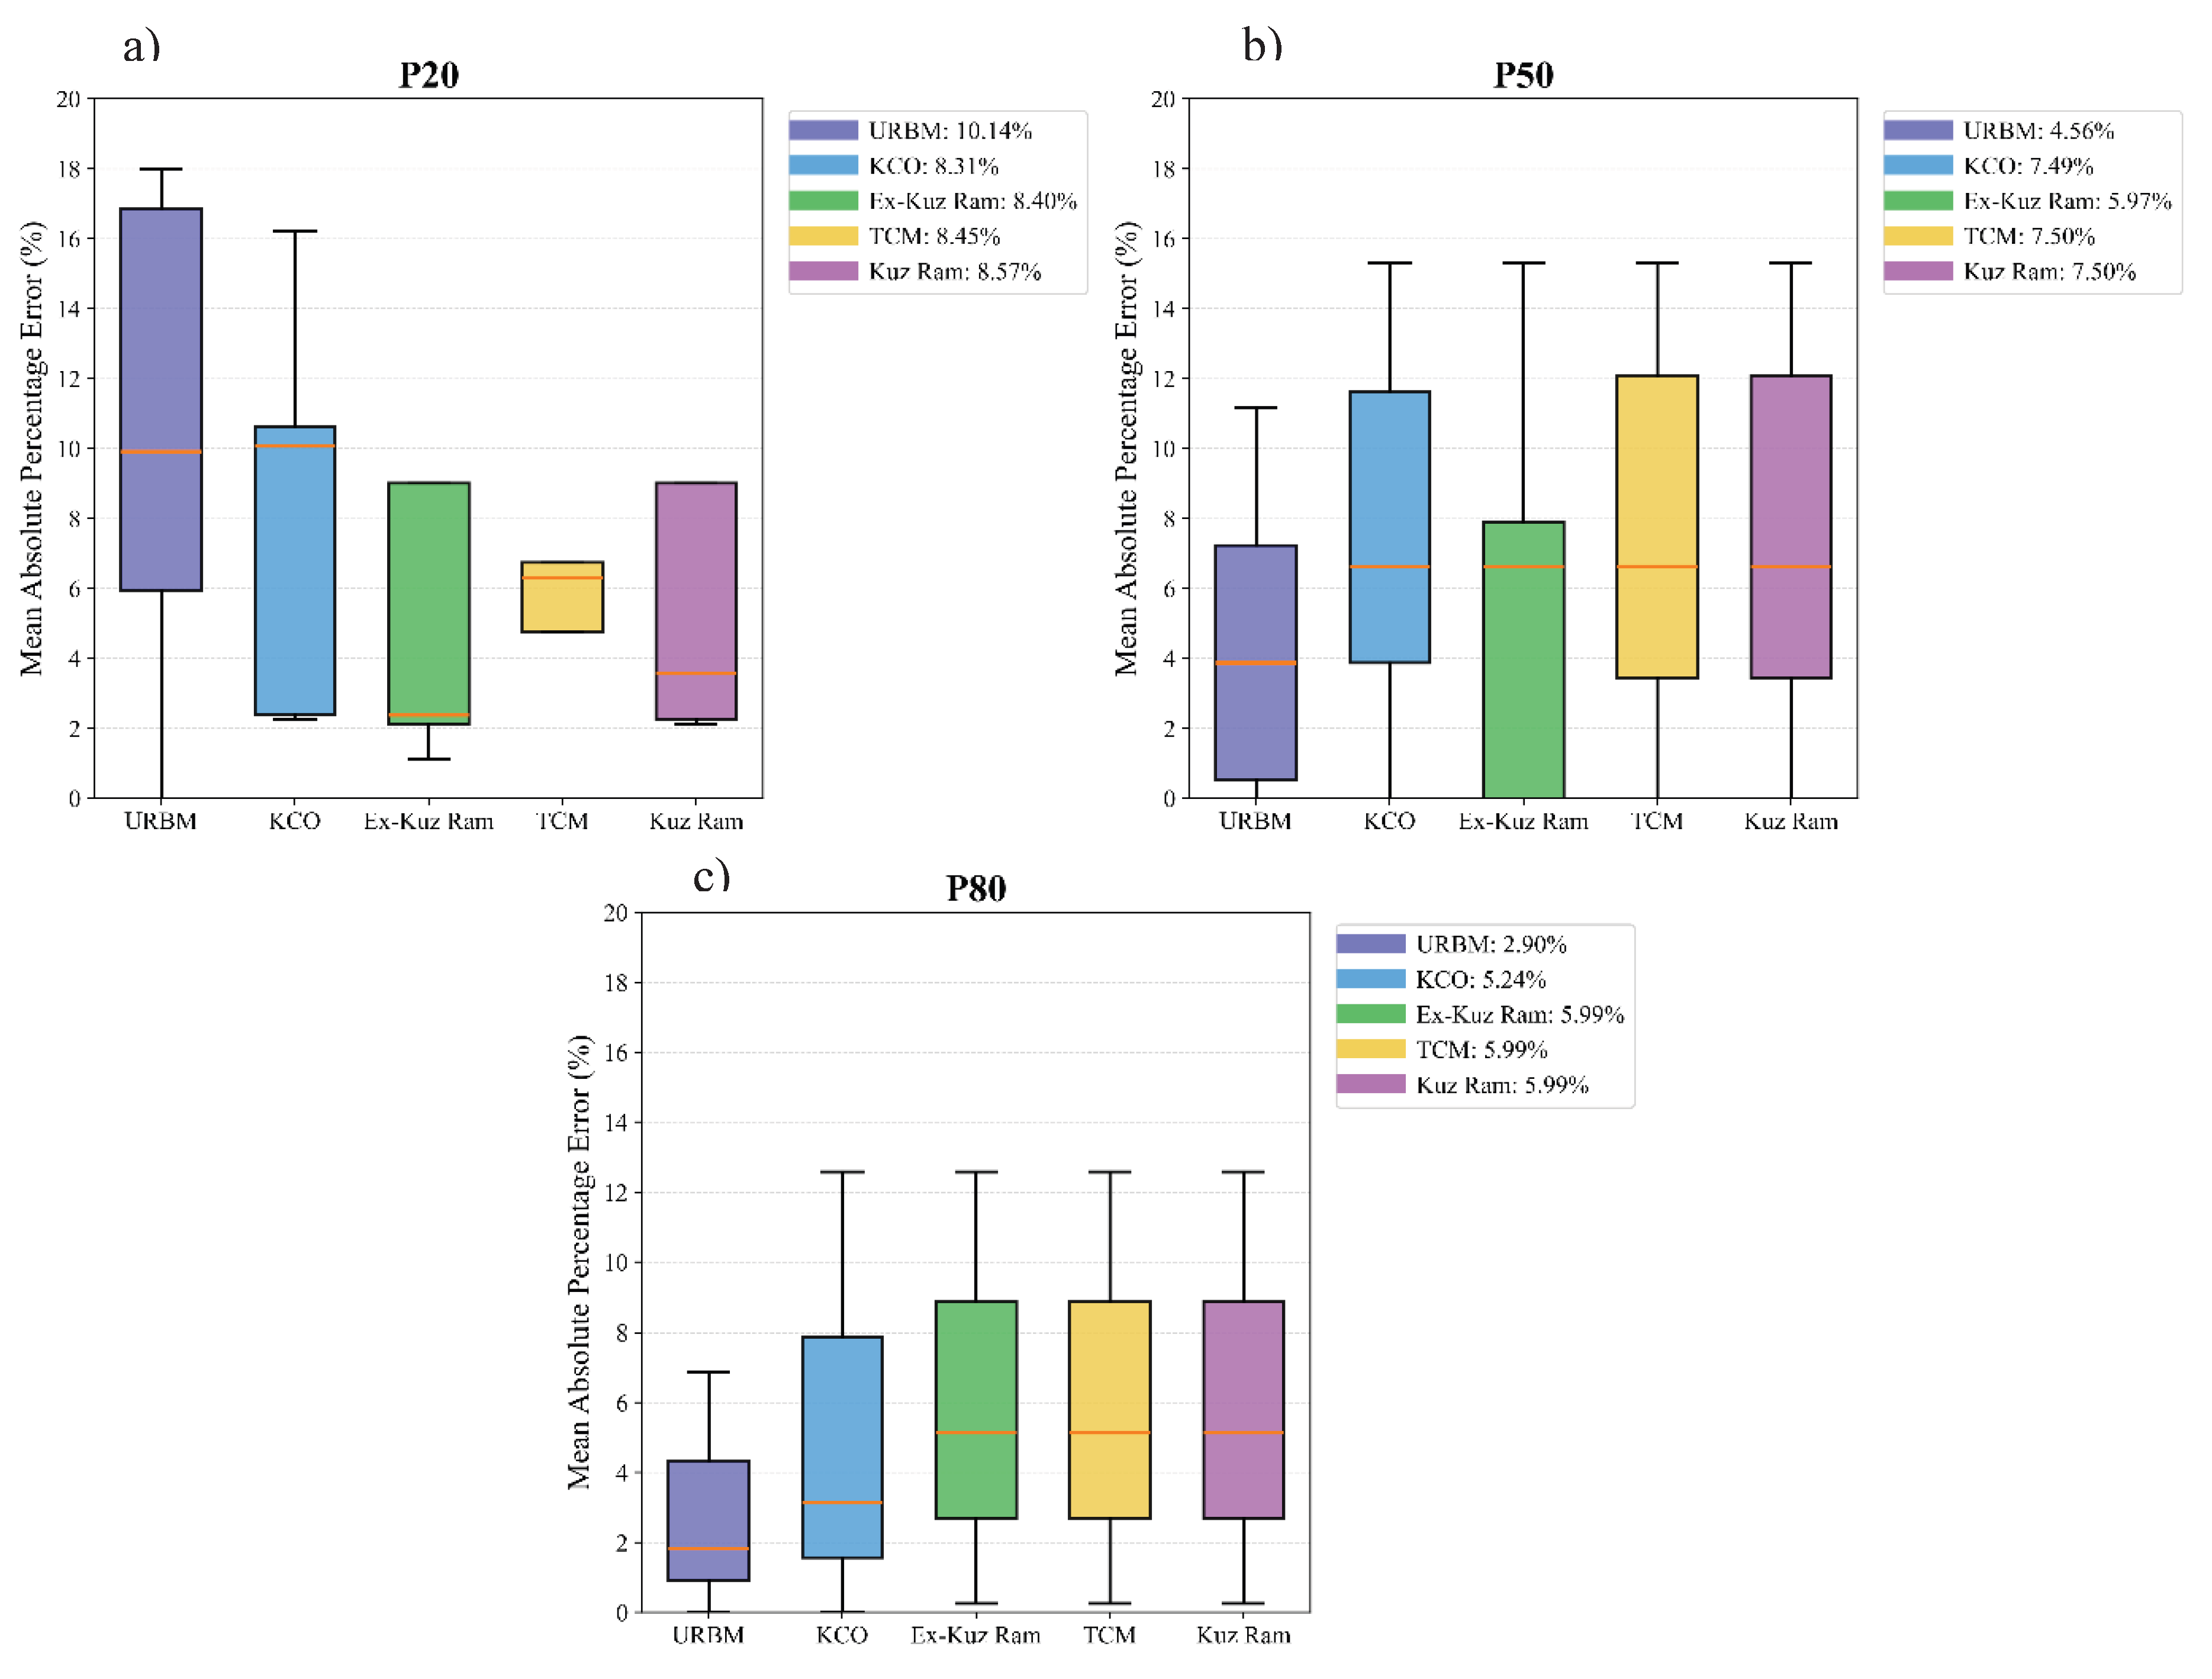
Figure 7.
SHAP plots showing the most influential parameters in predicting median fragment size for: a) URBM, b) extended Kuz-Ram model, and c) TCM.
Figure 7.
SHAP plots showing the most influential parameters in predicting median fragment size for: a) URBM, b) extended Kuz-Ram model, and c) TCM.
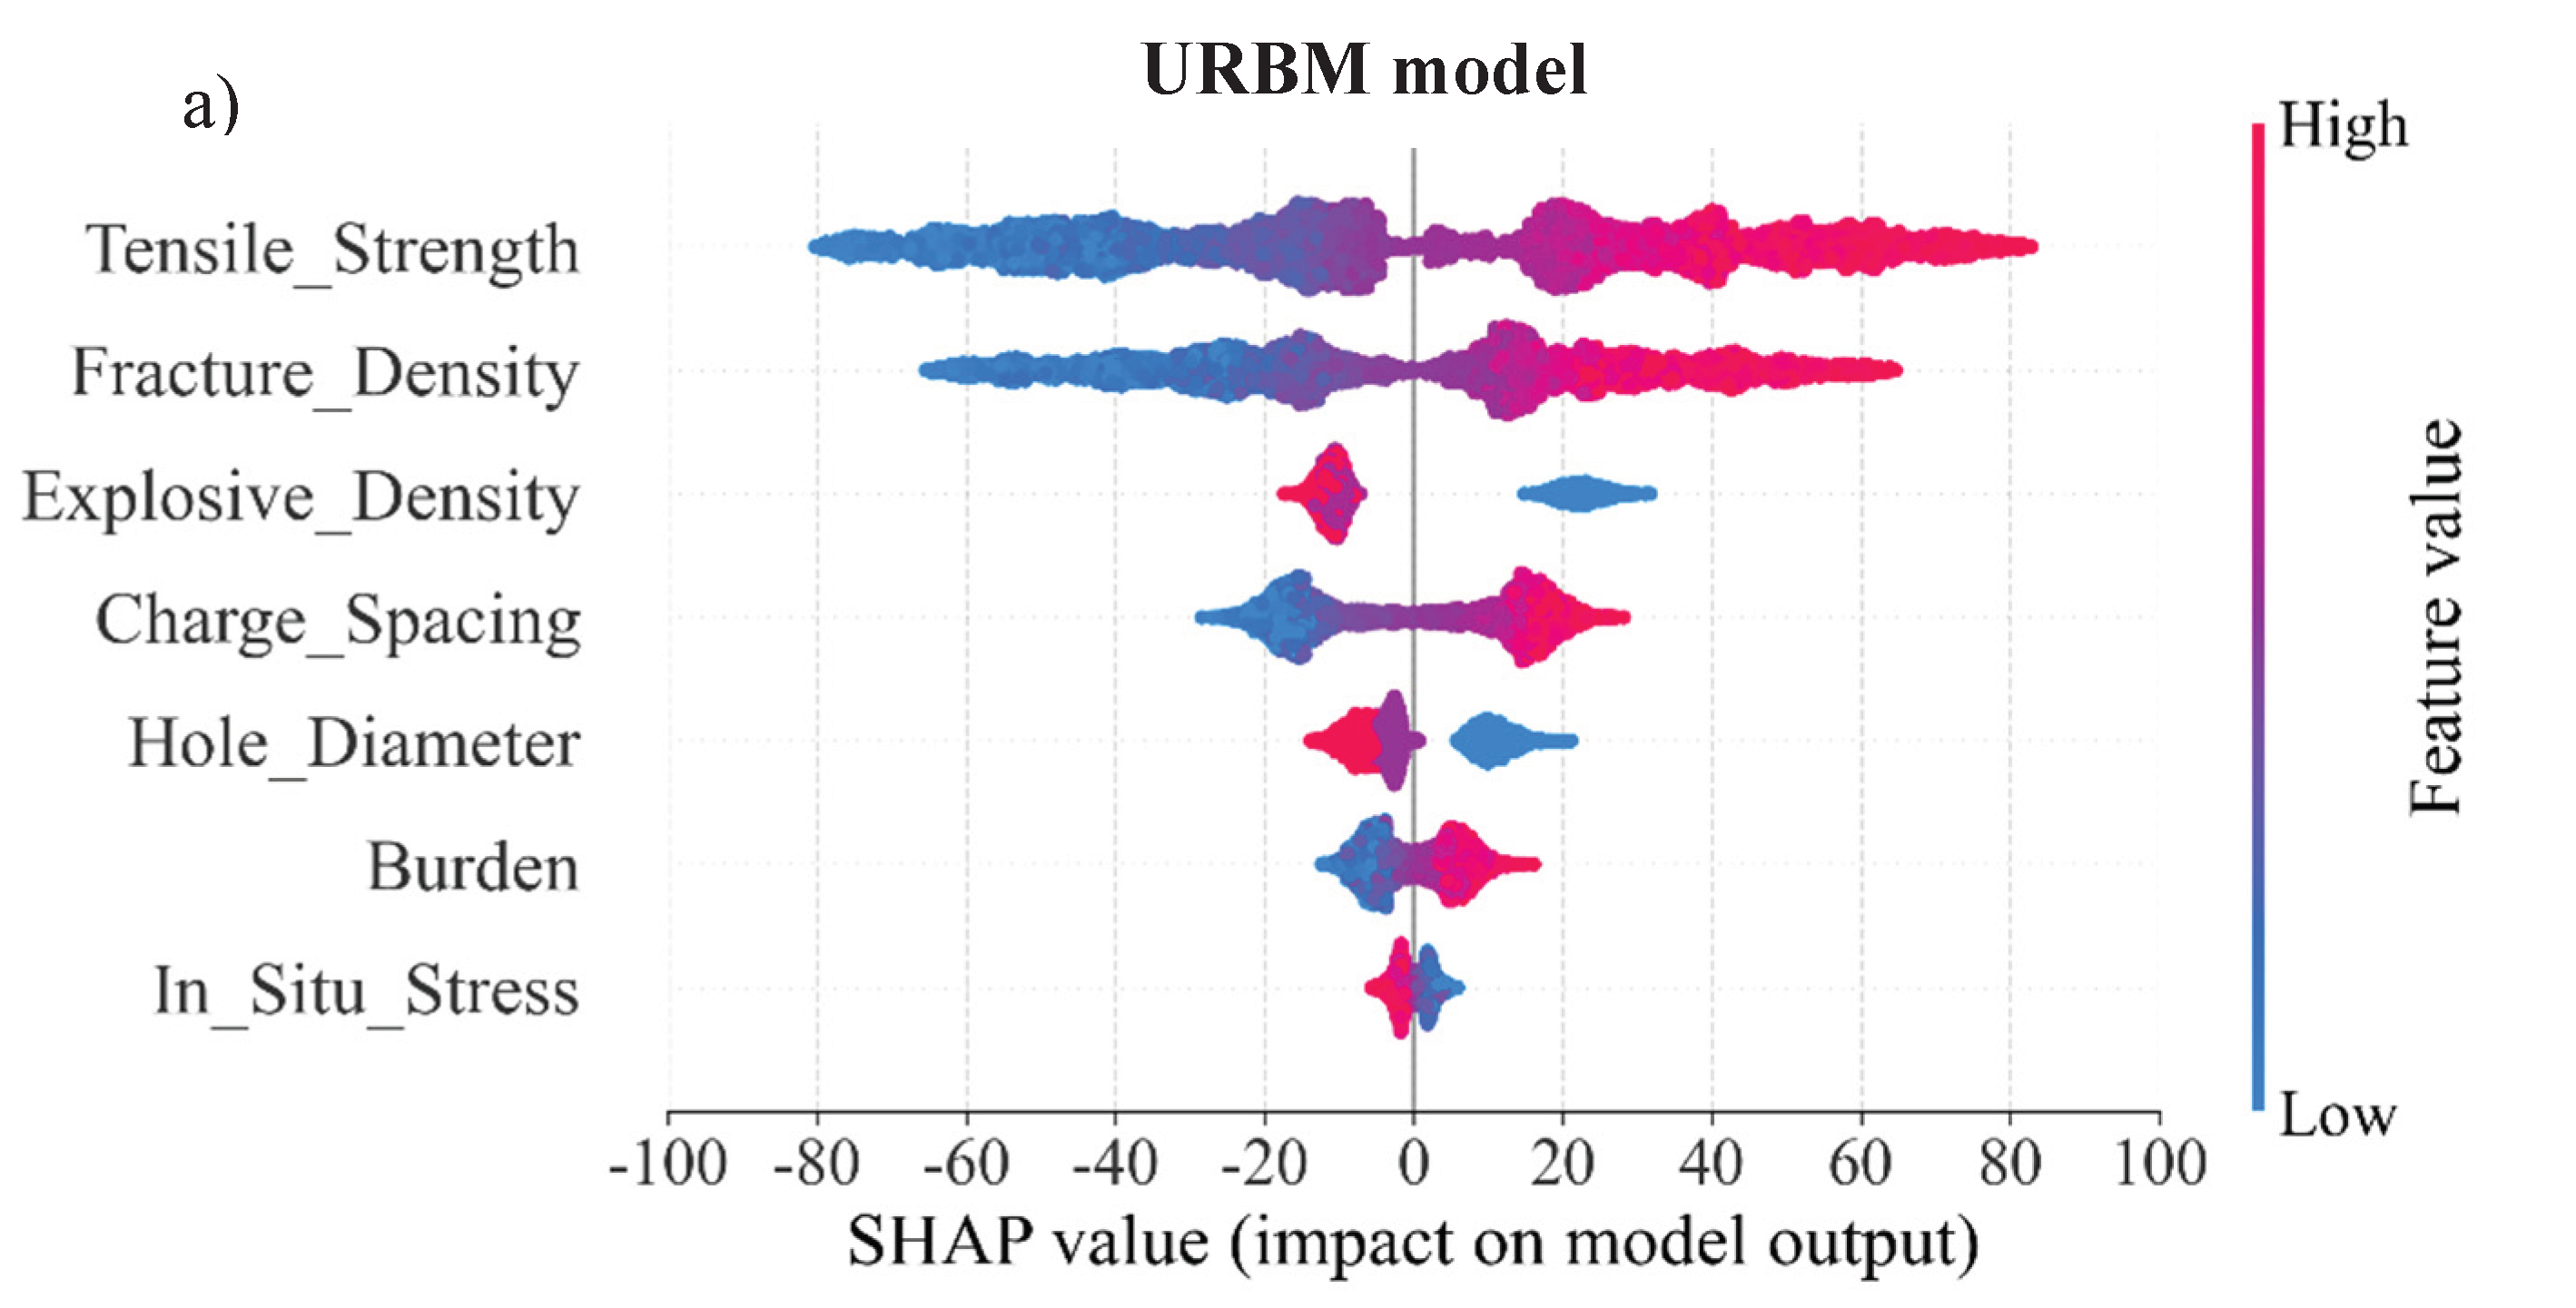
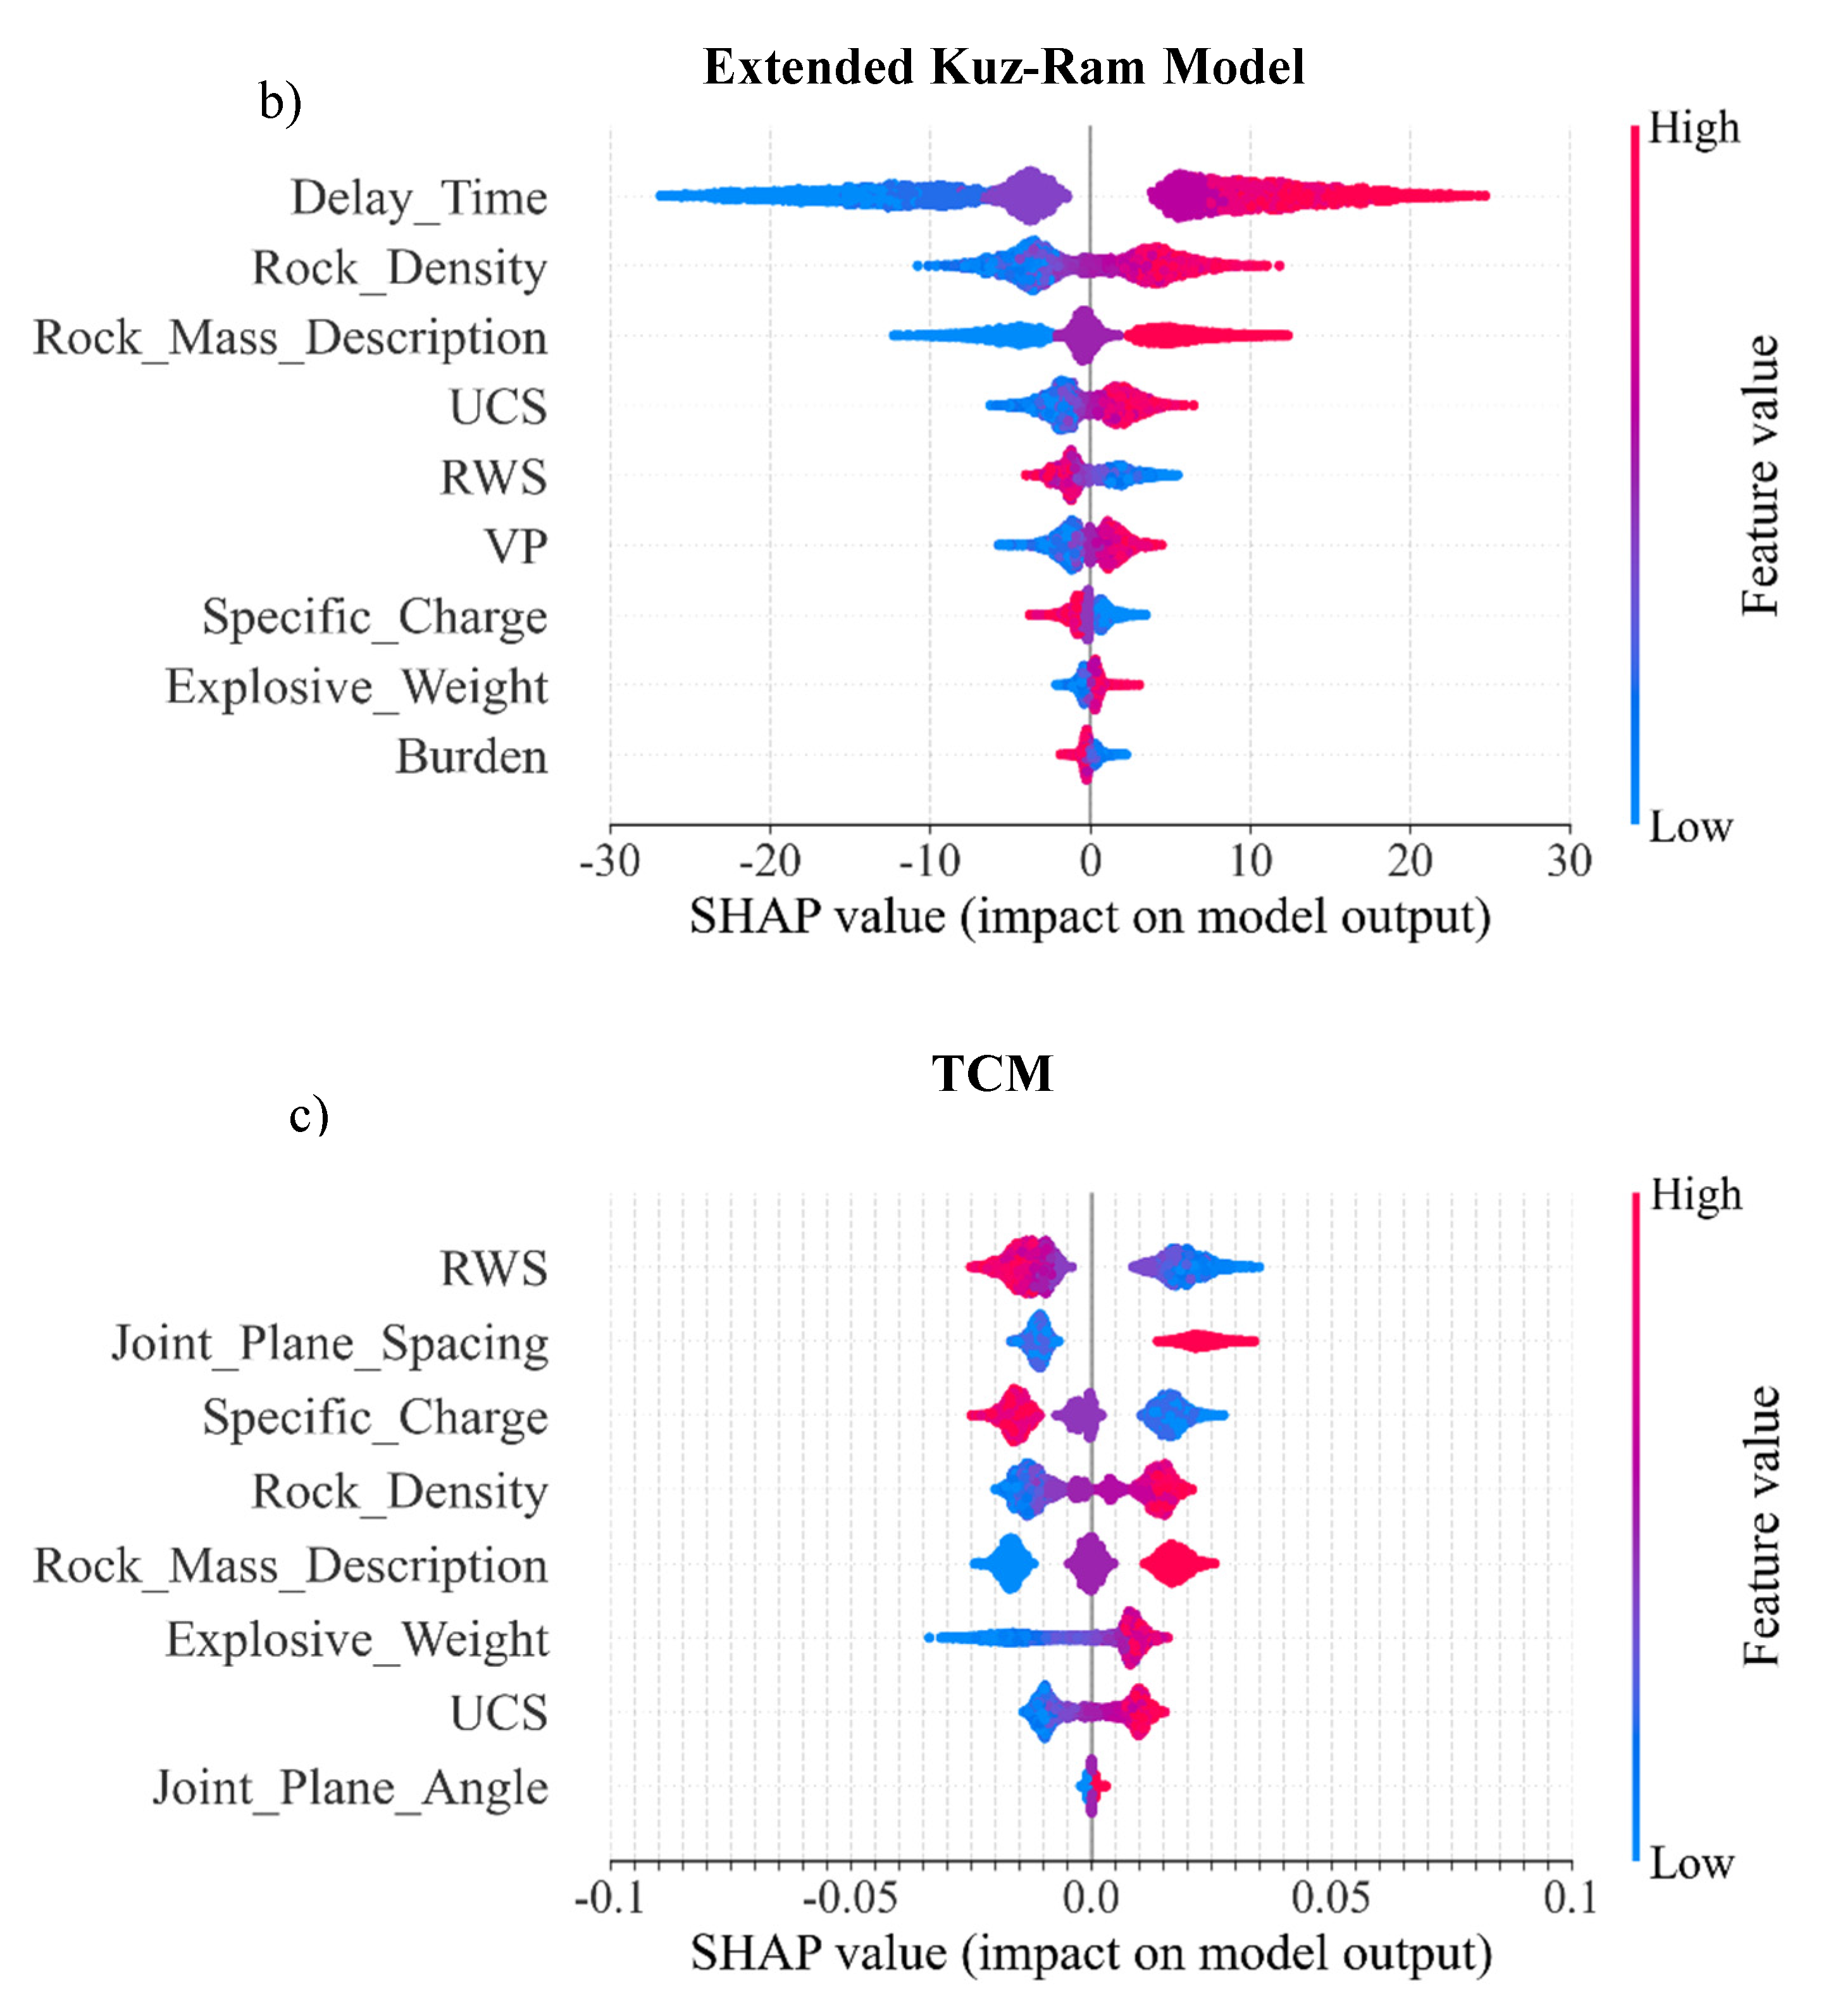

Table 1.
Summary of input parameters used in the prediction models for blast-induced fragmentation in SLC operations.
Table 1.
Summary of input parameters used in the prediction models for blast-induced fragmentation in SLC operations.
| Model | Input Variables |
| Kuz-Ram | Burden, Spacing, Hole diameter, Drilling accuracy, Charge length, Bench height, Charge weight per hole, Powder factor / Specific charge, Relative Weight Strength, Rock factor (derived from Rock Mass Description, Joint Factor, Hardness Factor, Rock Density Factor) |
| Extended Kuz-Ram | All Kuz-Ram inputs except the Joint Factor plus: Inter-hole delay, Timing precision or scatter, Wave velocity, Correction factors, Modified uniformity factor |
| KCO | All Kuz-Ram inputs plus: Hole depth, Maximum fragment size, Median size, Mean-to-median conversion factor g(n) |
| TCM | All Kuz-Ram inputs plus: Explosive density, Detonation velocity, Uniaxial compressive strength, Crushed-zone radius, Pressurized blast-hole radius |
| URBM | Burden, Spacing, Hole diameter, Explosive density, Fracture density, Tensile strength, In-situ stress |
Table 2.
Ring blast design parameters (Campbell, 2019, Campbell and Thurley, 2017).
| Borehole Diameter (mm) | 102 |
| Burden (m) | 2.6 |
| Number of holes per ring | 8 |
| Explosive density (g/cc) | 1.1 |
| Inter-ring delay time (ms) | 25 |
| Cross-cut height (m) | 5 |
| Longest Hole (m) | 25.11 |
| Shortest Hole(m) | 11.5 |
| Total Drilling (m) | 165 |
| Explosive Mass (Kg) | 1186 |
| Powder Factor (Kg/t) | 0.4 |
| VOD(m/s) | 5433 |
| Explosive type | Titan 7000i |
Table 3.
Rock properties (Campbell, 2019, Campbell and Thurley, 2017).
| Rock Type | Volcanic Ore |
| Density (g/cc) | 3.83 |
| Young’s Modulus (GPa) | 66.7 |
| Poisson’s Ratio | 0.27 |
| P-wave Velocity (m/s) | 4665 |
| S-wave Velocity (m/s) | 2618 |
| UCS (MPa) | 193.8 |
| Tensile Strength (MPa) | 9.2 |
| Fracture Frequency (fractures per meter) | 2 |
| Fracture Toughness (MPa/m2) | 1.8 |
Table 4.
EHM measured fragmentation data (Campbell, 2019).
| Percent passing (%) | Passing Size (mm) | ||||
| Baseline | Explosive Density 0.9 (g/cc) | Explosive Density 1.25 (g/cc) | Burden 2.2 (m) |
Burden 3.0 (m) |
|
| BL | EXP0.9 | EXP1.25 | B2.2 | B3.0 | |
| 20 | 94 | 111 | 84 | 89 | 139 |
| 50 | 216 | 235 | 196 | 215 | 232 |
| 80 | 393 | 437 | 350 | 412 | 376 |
Table 5.
The predicted 20% passing fragment sizes (P20) using different models.
| Scenario | Field data (mm) | URBM (mm) | KCO (mm) | Ex Kuz-Ram (mm) | TCM (mm) | Kuz-Ram (mm) |
| BL | 94 | 94 | 90 | 97 | 94 | 97 |
| EXP0.9 | 111 | 122 | 110 | 121 | 118 | 121 |
| EXP1.25 | 84 | 79 | 77 | 82 | 80 | 82 |
| B2.2 | 89 | 74 | 84 | 90 | 83 | 88 |
| B3.0 | 139 | 114 | 98 | 101 | 105 | 103 |
Table 6.
The predicted 50% passing fragment sizes (P50) using different models.
| Scenario | Field data (mm) | URBM (mm) | KCO (mm) | Ex Kuz-Ram (mm) | TCM (mm) | Kuz-Ram (mm) |
| BL | 216 | 216 | 216 | 216 | 216 | 216 |
| EXP0.9 | 235 | 252 | 271 | 271 | 271 | 271 |
| EXP1.25 | 196 | 197 | 183 | 183 | 183 | 183 |
| B2.2 | 215 | 191 | 190 | 199 | 190 | 190 |
| B3.0 | 232 | 241 | 241 | 232 | 241 | 241 |
Table 7.
The predicted 80% passing fragment sizes (P80) using different models.
| Scenario | Field data (mm) | URBM (mm) | KCO (mm) | Ex Kuz-Ram (mm) | TCM (mm) | Kuz-Ram (mm) |
| BL | 393 | 393 | 393 | 393 | 393 | 393 |
| EXP0.9 | 437 | 429 | 486 | 492 | 493 | 493 |
| EXP1.25 | 350 | 374 | 335 | 333 | 333 | 333 |
| B2.2 | 412 | 368 | 340 | 357 | 336 | 336 |
| B3.0 | 376 | 418 | 458 | 432 | 451 | 451 |
Table 8.
The MAPE of various model predictions for the fragment sizes in EHM.
| Model name | EHM | Average Error | ||
| P20 | P50 | P80 | ||
| URBM | 10% | 5% | 3% | 6.0% |
| KCO | 10% | 7% | 5% | 7.4% |
| Ex-Kuz Ram | 8% | 6% | 6% | 6.7% |
| TCM | 8% | 7% | 6% | 7.0% |
| Kuz Ram | 9% | 7% | 6% | 7.4% |
Disclaimer/Publisher’s Note: The statements, opinions and data contained in all publications are solely those of the individual author(s) and contributor(s) and not of MDPI and/or the editor(s). MDPI and/or the editor(s) disclaim responsibility for any injury to people or property resulting from any ideas, methods, instructions or products referred to in the content. |
© 2026 by the authors. Licensee MDPI, Basel, Switzerland. This article is an open access article distributed under the terms and conditions of the Creative Commons Attribution (CC BY) license (http://creativecommons.org/licenses/by/4.0/).
Copyright: This open access article is published under a Creative Commons CC BY 4.0 license, which permit the free download, distribution, and reuse, provided that the author and preprint are cited in any reuse.


