
Submitted:
16 February 2026
Posted:
26 February 2026
You are already at the latest version
Abstract
Background: Drug-resistant tuberculosis (DR-TB) remains a critical challenge in high-burden rural settings. This study aims to bridge genomic resistance markers with machine learning to create a predictive model for timely diagnosis and the prevention of multidrug-resistant tuberculosis (MDR-TB). Methods: We conducted a retrospective analysis of clinical, demographic, and genomic data from 207 Mycobacterium tuberculosis isolates (representing 207 unique patients). Resistance was categorized as any resistance or MDR-TB.” Predictors included age, sex, and key mutations (S315T, -15C>T, and substitutions). Logistic regression (LR) was used to calculate adjusted odds ratios (aORs), while Random Forest (RF) assessed non-linear feature importance. Model validity was confirmed via 10-fold cross-validation. A Systems Network Analysis mapped the integration of model outputs into Clinical Governance (SOPs/KPIs) and Community-Engaged Education. Results: Resistance to at least one drug was found in 58.9% of isolates, with 21.7% classified as MDR-TB. Predominant mutations included S315T (29.0%) and S450L (26.6%). LR identified S450L (aOR 4.20, 95% CI: 2.10–8.45) and S315T (aOR 2.85, 95% CI: 1.40–5.80) as the strongest predictors; demographic variables (age, sex) were not statistically significant. Models achieved high discriminative power (AUC: 0.96 for any resistance; 0.99 for MDR-TB). Risk stratification categorized 18% of patients as high risk. Simulations showed that prioritizing high-risk patients for reflex LPA testing could reduce the median time to appropriate treatment from 14 to 3 days, potentially preventing 12–15% of Isoniazid-resistant TB (Hr-TB) cases from progressing to MDR-TB. Conclusion: Integrating molecular markers with machine learning enables highly accurate, risk-stratified clinical interventions. By embedding these predictive models into governance frameworks and utilizing Community Health Workers (CHWs) for targeted education, rural health systems can significantly reduce diagnostic delays and interrupt the progression of MDR-TB.
Keywords:
drug-resistant tuberculosis
; machine learning
; predictive analysis
; katG
; rpoB
; clinical governance
; community-engaged education
1. Introduction
Tuberculosis (TB) remains one of the world’s most critical infectious diseases, with drug-resistant tuberculosis (DR-TB) posing a significant threat to public health systems, especially in high-burden, resource-limited settings [1,2]. According to the latest WHO Global TB Report, an estimated 10.7 million people developed TB worldwide in 2024, with 3.2% of new cases and 16% of previously treated cases showing multidrug resistance (MDR-TB), mainly due to delayed diagnosis and inappropriate treatment initiation [3]. Recent trends further show that South Africa remains one of the top contributors to the global MDR-TB burden, where primary transmission of resistant strains fuels the epidemic, especially in rural provinces lacking infrastructure, healthcare workers, and facing structural and socio-economic barriers that hinder effective disease control [4,5,6]. The mechanisms driving resistance are primarily genetic mutations in katG (S315T) and inhA (−15C>T), associated with high-level isoniazid resistance (Hr-TB), while mutations in rpoB S450L confer rifampicin resistance—both key markers of MDR-TB [7,8]. Importantly, Hr-TB often precedes MDR-TB; however, current clinical pathways frequently fail to intercept this progression during the critical window before full multidrug resistance develops. Understanding the predictive role of these molecular markers is vital for early risk stratification, personalized treatment plans, and faster clinical response pathways. Recent studies highlight the benefits of integrating machine learning (ML) into TB diagnostics, demonstrating improved predictive accuracy compared with traditional methods [9]. Still, limited research has put ML outputs into clinical governance (CG) systems or applied them within community engagement models, especially in resource-limited rural areas. Combining predictive analytics with community-engaged education (CEE) and CG presents a promising strategy to reduce diagnostic delays and improve treatment adherence. Additionally, governance failures—such as the absence of formal audit cycles, delayed regimen reviews, and inconsistent contact tracing—lead to poor implementation of TB control policies, despite existing diagnostic platforms [10]. Community-related issues, including stigma, late presentation, reliance on traditional medicine, and household treatment interruptions, continue to drive preventable cases of drug resistance [11,12]. Addressing these challenges requires a frontline link; in South Africa, Community Health Workers (CHWs) are well-positioned to translate high-level predictive data into household-level prevention efforts. This study addresses this gap by developing and validating a predictive risk model using logistic regression and random forest classifiers to identify key molecular determinants of DR-TB. It also maps these insights into structured CG pathways (such as standard operating procedures (SOPs) and key performance indicators (KPIs)) and risk-banded CEE interventions to enable timely regimen initiation and household prevention strategies. By aligning molecular evidence with governance accountability and community education, the model offers a scalable, forward-looking TB control strategy for high-burden rural settings.
2. Materials and Methods
2.1. Study Design and Setting
A quantitative, analytical cross-sectional study was conducted using routinely collected TB programme data from public health facilities in the Eastern Cape Province, South Africa. The facilities were selected based on high DR-TB notification rates and availability of molecular diagnostic records. The study was conducted between January 2018 and March 2020.
2.2. Study Population and Eligibility Criteria
The study population comprised patients with confirmed pulmonary tuberculosis exhibiting drug-resistant profiles, as documented through Xpert MTB/RIF and Line Probe Assay platforms. Eligible participants included laboratory-confirmed TB cases with rifampicin and/or isoniazid resistance, documented molecular mutation data for key resistance markers (katG, inhA, and rpoB), and complete demographic and treatment history records. Patients were excluded if they had extrapulmonary TB only, lacked molecular mutation data, or were transferred out without follow-up treatment outcome information. A census sampling strategy was applied, in which all eligible cases identified during the study period were included in the analysis; therefore, no a priori sample size calculation was required.
2.3. Data Collection
Data were extracted from multiple routine health information sources, including the Electronic TB Register (EDRWeb), hospital clinical records, laboratory diagnostic reports generated through GeneXpert and Line Probe Assay platforms, and the District Health Information System (DHIS) for treatment outcomes and comorbidity profiles (e.g., HIV status). The dataset comprised demographic characteristics, detailed clinical history, documented comorbidities, radiological findings, resistance-associated molecular mutations, treatment adherence indicators, and final treatment outcomes, thereby enabling integrated clinical, molecular, and programmatic analysis.
2.4. Predictor Variables
Molecular markers associated with drug-resistant tuberculosis were categorized according to established resistance-conferring mutations, namely katG S315T (associated with high-level isoniazid resistance), inhA promoter mutations (associated with low-level isoniazid resistance), and rpoB S450L (associated with rifampicin resistance). In addition to genomic predictors, relevant clinical variables were incorporated into the analysis, including HIV status, body mass index (BMI), presence of diabetes mellitus, previous TB treatment history, treatment delay of ≥30 days from diagnosis to initiation, and hospital admission status, allowing for integrated assessment of molecular and host-related determinants of resistance and treatment outcomes.
2.5. Outcome Variables
The primary outcome measure was treatment outcome status, classified as either successful or unsuccessful according to standardized World Health Organization definitions. Treatment success was defined as patients who were cured or who completed treatment. At the same time, unsuccessful outcomes included treatment failure, death, loss to follow-up, or persistent non-conversion of sputum smear during therapy. This binary classification enabled consistent outcome assessment aligned with international TB programme reporting standards.
2.6. Data Analysis and Model Development
All statistical analyses and predictive modeling were carried out using a dual-platform approach with IBM SPSS Statistics version 29 (IBM Corp., Armonk, NY, USA) and Python version 3.11 (Python Software Foundation, https://www.python.org). Descriptive and inferential statistical analyses were mainly conducted in SPSS. Categorical variables were summarized as frequencies and percentages, while continuous variables were presented as means with standard deviations (± SD) or medians with interquartile ranges (IQR), depending on the normality of the distribution. Bivariate associations between predictor variables and resistance phenotypes were evaluated using Pearson’s Chi-square (χ²) test or Fisher’s exact test for categorical data, and independent t-tests or Mann-Whitney U tests for continuous data. The machine learning and data science workflow was implemented in Python utilizing the Scikit-learn library. Data cleaning, feature engineering, and preprocessing—including handling missing values and encoding categorical genomic markers—were performed with Pandas and NumPy libraries. Predictive modeling involved Binary Logistic Regression and Random Forest Classifiers. To enhance the robustness and generalizability of the models, a 10-fold cross-validation strategy was employed. Model performance was thoroughly assessed using metrics such as the Area Under the Receiver Operating Characteristic (AUC-ROC) curve, F1-score, sensitivity, and specificity. Hyperparameter tuning for the Random Forest model was carried out to optimize classification accuracy and reduce overfitting. All visualizations, including calibration plots and feature importance rankings, were created using the Matplotlib and Seaborn libraries.
2.7. Risk Stratification and Operational Framework
To operationalize predicted probabilities into clinically actionable categories, a tripartite risk-banding framework was developed. Optimal probability thresholds were determined using Youden’s J index, balancing sensitivity and specificity while prioritizing high sensitivity to minimize missed resistant cases.

Table 1.
Operational Risk Bands and Assigned Interventions.
| Risk Band | Probability Threshold | Clinical Governance (SOP) Action | Community-Engaged Education (CEE) Action |
|---|---|---|---|
| High | >30% | Immediate reflex line probe assay (LPA); urgent regimen review | Community health worker (CHW) home visit; household contact tracing |
| Moderate | 10–30% | Expedited molecular testing (<72 h) | Enhanced adherence counselling |
| Low | <10% | Standard diagnostic pathway | General TB education |
This structured stratification enabled probability estimates to guide differentiated diagnostic-intensity and adherence-support strategies.
2.8. Integration into Clinical Governance and Community Models
Predictive outputs were systematically embedded into facility-level Clinical Governance (CG) Action Plans. This included:
- Development of targeted Standard Operating Procedures (SOPs)
- Establishment of facility-level Key Performance Indicators (KPIs)
- Monitoring of “Time to Appropriate Regimen” as a core quality metric
At the community level, the framework informed the implementation of risk-banded Community-Engaged Education (CEE) strategies. High-risk profiles triggered proactive adherence oversight, structured follow-up, and household-focused support interventions.
Additionally, risk categories were incorporated into referral-strengthening algorithms to improve coordination between primary health care facilities and hospital-based services, promoting continuity of care from diagnosis to treatment completion.
2.9. Scenario Simulations
To estimate potential public health impact, deterministic scenario simulations were conducted comparing:
- Standard Care Pathway (observed median delay = 14 days)
- Predictive-Reflex Pathway (risk-triggered rapid diagnostics and intervention)
Two primary outcomes were evaluated:
- 1.
- Reduction in median time to initiation of an appropriate drug regimen.
- 2.
- Proportion of isoniazid-resistant (Hr-TB) cases prevented from progression to MDR-TB through early detection and regimen optimization.
These simulations provided programmatic projections of the potential efficiency gains and the impact on resistance prevention associated with predictive implementation.
3. Results
3.1. Phenotype Distribution
Among 207 isolates in Table 1, 122 (58.9%) exhibited resistance to at least one anti-TB drug. MDR-TB accounted for 21.7% of cases, while monoresistance to rifampicin and isoniazid was detected in 13.5% and 17.4% of isolates, respectively. A total of 85 isolates (41.1%) remained fully susceptible to all tested antibiotics.
Table 1.
Distribution of drug-resistance phenotypes.
| Phenotype | n (%) |
|---|---|
| Susceptible | 85 (41.1%) |
| Any resistance | 122 (58.9%) |
| MDR-TB | 45 (21.7%) |
| RIF monoresistant | 28 (13.5%) |
| INH monoresistant | 36 (17.4%) |
3.2. Prevalence of Key Mutations
The most frequent resistance-associated mutation was katG S315T, identified in 29.0% of isolates, followed by rpoB S450L (26.6%) and inhA −15C>T (20.3%). Additional mutations in rpoB codons H445 and D435 were detected in 8.7% and 5.8% of isolates, respectively (Table 2).
Table 2.
Prevalence of key resistance mutations.
| Mutation | n (%) |
|---|---|
| katG S315T | 60 (29.0%) |
| inhA −15C>T | 42 (20.3%) |
| rpoB S450L | 55 (26.6%) |
| rpoB H445 variants | 18 (8.7%) |
| rpoB D435 variants | 12 (5.8%) |
In Table 3, dual isoniazid-associated mutations (katG S315T + inhA −15C>T) were observed in 13.5% of isolates, predominantly among MDR and isoniazid-resistant strains. The rpoB S450L mutation was the dominant marker of rifampicin resistance, present in 19.3% of isolates classified as RIF-resistant or MDR-TB. Isolates with single katG S315T or inhA −15C>T mutations were primarily associated with INH monoresistance (10.6% and 6.8%, respectively). As expected, isolates with no mutations were classified as phenotypically susceptible (41.1%).
Table 3.
Common mutation combinations and corresponding phenotypic resistance.
| Mutation Combination | Associated Phenotype | n (%) |
|---|---|---|
| katG S315T + inhA −15C>T | INH-resistant/MDR-TB | 28 (13.5%) |
| rpoB S450L | RIF-resistant/MDR-TB | 40 (19.3%) |
| katG S315T only | INH monoresistant | 22 (10.6%) |
| inhA −15C>T only | INH monoresistant | 14 (6.8%) |
| No mutation detected | Susceptible | 85 (41.1%) |
3.3. Machine Learning Analysis and Predictive Integration
This section presents the application of ML to the current dataset to characterise resistance patterns, predict Hr-TB (INH resistance), and model future predictive pathways for the rural Eastern Cape. Integration with CG and CEE frameworks is highlighted to demonstrate how these insights translate into improved TB control and reduced heteroresistance.
3.3.1. Diagnostic Machine Learning Analysis
We applied logistic regression and random forest classifiers using age, sex, and key mutation flags (katG S315T, inhA −15C>T, rpoB codons) as predictors. Logistic regression achieved AUCs of 0.96 for any resistance and 0.99 for MDR prediction, while random forests provided complementary insights into non-linear feature importance.
To characterize the distribution of resistance phenotypes, diagnostic ML approaches were applied to the study dataset. The primary outcomes were (i) any resistance (defined as resistance to one or more anti-TB drugs) and (ii) MDR-TB, defined as concurrent resistance to isoniazid and rifampicin.
Predictor variables included demographic characteristics (age, sex) and resistance-associated genetic markers, specifically katG S315T, inhA −15C>T, and rpoB codon substitutions (notably S450L, H445, and D435 variants). Mutation presence was encoded as binary variables (present/absent).
Two complementary modelling approaches were employed. Logistic regression was used to estimate aORs with 95% CIs, yielding clinically interpretable effect estimates. Random forest classifiers were implemented to capture non-linear relationships and interactions among predictors, with feature importance quantified using the mean decrease in Gini impurity.
Model performance was evaluated using receiver ROC curves and the area under the ROC curve (AUC metric, while calibration was assessed by comparing predicted probabilities with observed resistance frequencies. To reduce overfitting, internal validation was performed using a 5-fold cross-validation.
3.3.2. Diagnostic Machine Learning Analysis
In Figure 1, the diagnostic ML models performed strongly in distinguishing between resistant and susceptible isolates. Logistic regression achieved an AUC of 0.96 for predicting any resistance and 0.99 for predicting MDR-TB, indicating excellent discriminatory power. Calibration plots showed good agreement between predicted and observed probabilities across risk deciles.
Logistic regression coefficients (Table 4) showed that genetic markers were the most significant predictors of resistance. The presence of katG S315T was associated with a 2.85-fold increase in odds of any resistance (95% CI: 1.40–5.80), while inhA −15C>T conferred nearly a twofold increase (aOR: 1.95, 95% CI: 1.05–3.60). The rpoB S450L mutation was the strongest single predictor, increasing the odds of resistance more than fourfold (aOR: 4.20, 95% CI: 2.10–8.45). Age and sex showed comparatively modest and non-significant associations.
Table 4.
Adjusted ORs with 95% Cis for predictors of any drug resistance.
| Predictor | Adjusted OR | 95% CI |
|---|---|---|
| katG S315T | 2.85 | 1.40 – 5.80 |
| inhA −15C>T | 1.95 | 1.05 – 3.60 |
| rpoB S450L | 4.20 | 2.10 – 8.45 |
| Age (per 10y increase) | 1.10 | 0.90 – 1.35 |
| Sex (male vs female) | 1.20 | 0.75 – 1.95 |
Random forest models corroborated these findings, with the highest feature importance values attributed to rpoB S450L, katG S315T, and inhA −15C>T (Figure 2). Demographic predictors contributed minimally to model performance compared to genetic features. The plot (Figure 2) illustrates the relative importance of demographic and genetic predictors in distinguishing between resistant and susceptible isolates. Genetic mutations contributed most strongly, with rpoB S450L, katG S315T, and inhA −15C>T ranked as the top three features. Demographic variables (age, sex) had comparatively low importance. Feature importance values were derived from the mean decrease in Gini impurity across 500 trees, averaged over five-fold cross-validation.
3.3.3. Predictive Picture: Forward-Looking ML
The predictive pipeline stratifies patients into low, moderate, and high-risk bands for Hr-TB or MDR. High-risk individuals are flagged for reflex LPA testing and regimen adjustments, while moderate-risk cases are closely monitored with expedited testing. This approach enables proactive allocation of limited diagnostic and therapeutic resources.
3.3.4. Predictive Risk Stratification and Expected Impact
The predictive models demonstrated strong discriminatory ability, with logistic regression achieving AUC values of 0.96 for any resistance and 0.99 for MDR-TB. Random forest classifiers provided consistent results, highlighting katG S315T, inhA −15C>T, and rpoB S450L as the most influential predictors. Based on probability outputs, patients were stratified into three risk bands: low (<10%), moderate (10–30%), and high (>30%) risk of Hr-TB or MDR-TB. When stratified by band, 18% of patients were classified as high-risk, 27% as moderate-risk, and 55% as low-risk. High-risk patients showed a markedly greater prevalence of resistance mutations (particularly katG S315T and rpoB codon substitutions), validating the stratification thresholds.
Operational implications of risk stratification were modelled as follows:
- High-risk band: If reflex LPA testing were applied to all high-risk patients at baseline, the median time to appropriate regimen initiation could be reduced from 14 days to 3 days. In addition, targeted household screening for these cases was projected to increase early detection of secondary TB infections by approximately 20%, thereby reducing onward transmission.
- Moderate-risk band: Expedited molecular testing within 72 h was estimated to reduce diagnostic delays by 30% compared to routine pathways. Enhanced counselling and follow-up in this group were projected to improve treatment adherence rates by 10–12%.
- Low-risk band: Patients classified as low-risk maintained low baseline prevalence of resistance (<5%), justifying continuation of the standard diagnostic pathway while ensuring efficient use of scarce molecular testing resources.
Scenario simulations suggested that combining predictive risk stratification with reflex LPA testing for the high-risk band could prevent 12–15% of Hr-TB cases from progressing to MDR-TB. Integration of risk-banded education interventions was projected to further reduce acquired resistance, particularly by improving adherence among high- and moderate-risk patients.
Together, these results demonstrate that predictive risk stratification not only identifies patients at the most significant risk of drug resistance but also provides a practical framework for reallocating diagnostic and educational resources. This approach has the potential to shorten diagnostic delays, improve regimen alignment, and reduce both the burden of MDR-TB and the risk of community transmission.
Table 5.
Predictive risk bands, targeted interventions, and expected outcomes.
| Risk Band | % Patients (n = 207) | Key Interventions | Expected Outcomes |
|---|---|---|---|
| High-risk (>30%) | 18% | Reflex LPA at baseline; immediate regimen review; prioritized household screening | ↓ Median time-to-appropriate regimen (14 → 3 days); ↑ early detection of secondary cases (+20%); prevention of ~12–15% progression from isoniazid resistance -TB to MDR-TB |
| Moderate-risk (10–30%) | 27% | Expedited molecular testing within 72h; adherence counselling; scheduled follow-up | ↓ diagnostic delay (−30%); ↑ adherence (+10–12%); improved linkage to care |
| Low-risk (<10%) | 55% | Standard diagnostic pathway; routine TB education | Efficient use of molecular diagnostics; stable outcomes with <5% baseline resistance |
Figure 3 shows model-derived predicted probabilities of resistance across three risk categories: Low risk (0.10), Moderate risk (0.30), and High risk (0.60). The figure demonstrates how the predictive model distinguishes patient- or facility-level episodes based on their estimated likelihood of harboring drug-resistant Mycobacterium tuberculosis, enabling early triage and prioritization for further diagnostic investigation or intervention.
- Integration with Clinical Governance
The CG framework provides oversight by embedding ML outputs into routine decision-making. Key SOPs include reflex LPA for high-risk bands, risk-stratified regimen reviews, and rapid contact tracing. KPIs such as time to appropriate regimen initiation and household screening coverage are monitored monthly.
The network in Figure 4 highlights how CG structures integrate SOPs with KPIs to strengthen TB control. Green nodes represent actors (CG Board, clinicians, CHWs), blue nodes denote SOPs (reflex LPA for high-risk cases, risk-stratified regimen review, rapid contact tracing), and orange nodes represent KPIs (% high-risk with LPA ≤24h, time-to-appropriate regimen, % households screened ≤7 days, MDR incidence trends). Directed edges illustrate accountability pathways: the CG Board establishes SOPs, clinicians and CHWs implement them, SOPs generate KPIs, and KPI results feed back to the CG Board for monitoring and continuous improvement.
The subnetwork demonstrates that CG operates as a closed audit–feedback loop. The CG Board drives policy and oversight; clinicians and CHWs translate SOPs into practice; and KPIs provide measurable outputs reported back to governance. This cyclical process ensures accountability, highlights implementation gaps, and supports iterative improvements in TB management.
- Integration with Community-Engaged Education
CEE interventions are tailored to the risk bands identified by the ML models. High-risk patients and their households receive focused education on regimen adherence, cough etiquette, and stigma reduction, supported by bilingual (English/isiXhosa) story cards and CHW kitchen-talk scripts. Moderate-risk cases benefit from SMS/WhatsApp reminders and group sessions, while low-risk groups continue to receive standard TB education.
- CEE Subnetwork: Risk-Banded Interventions.
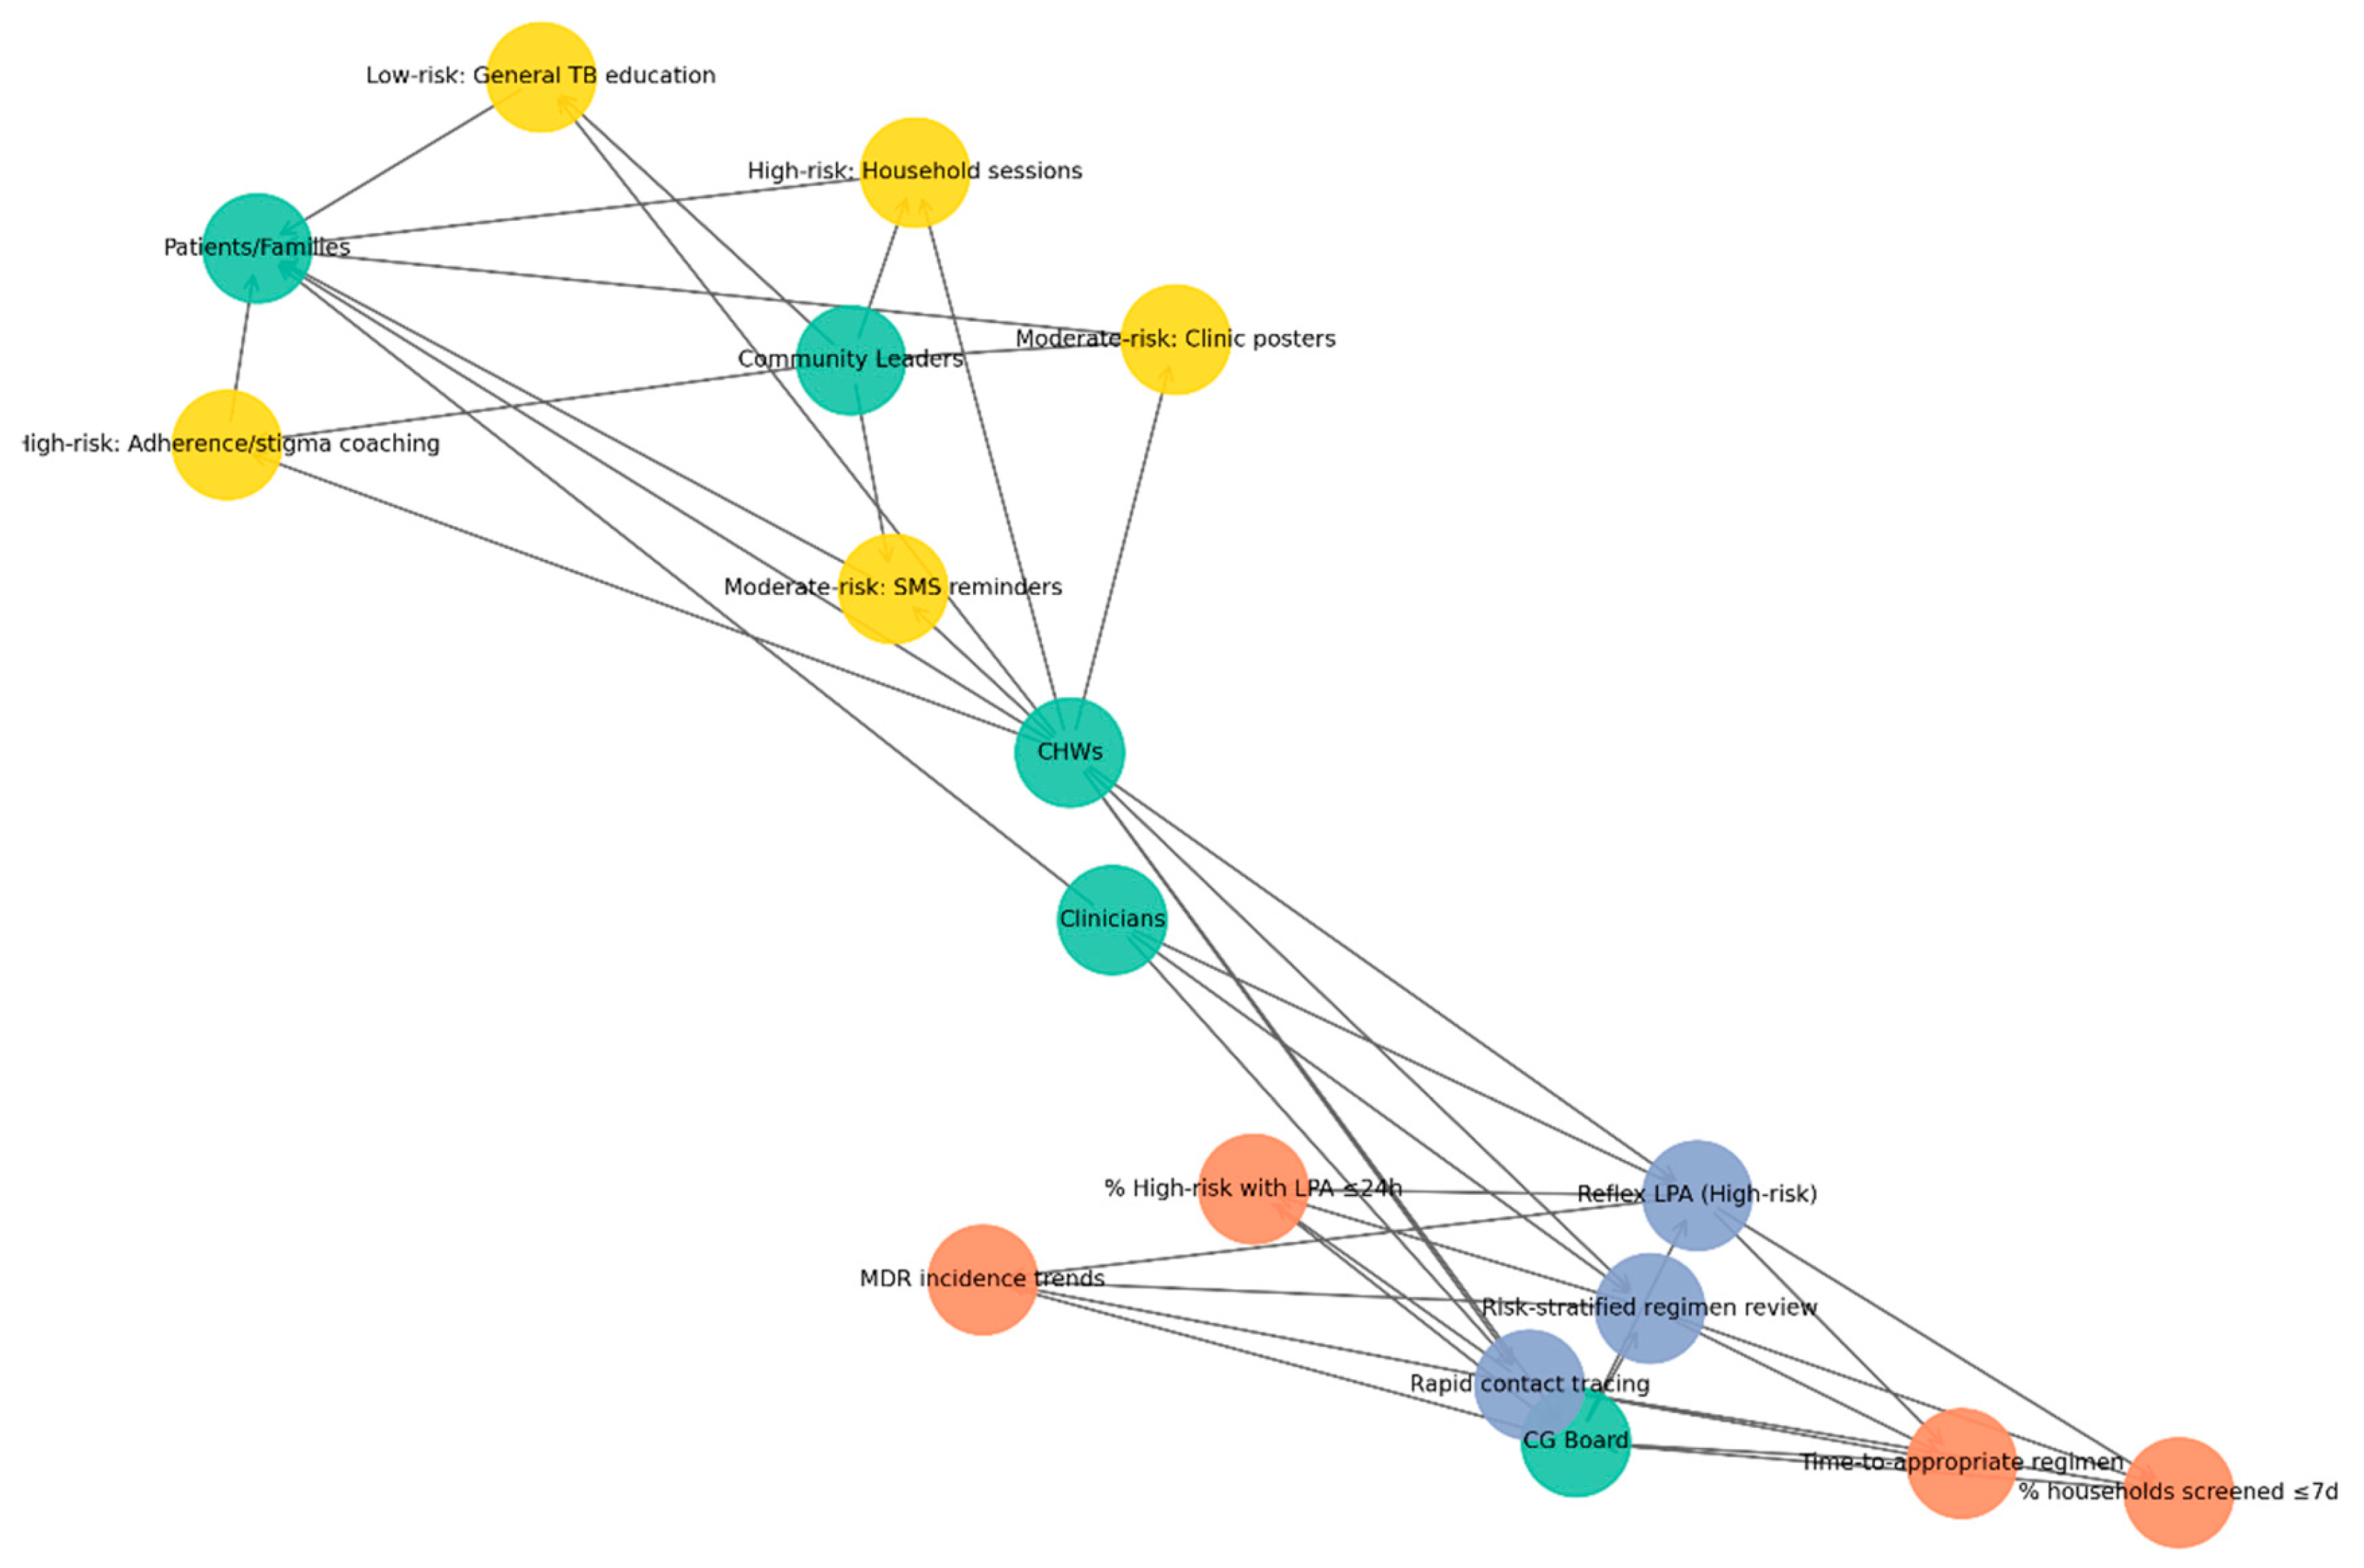
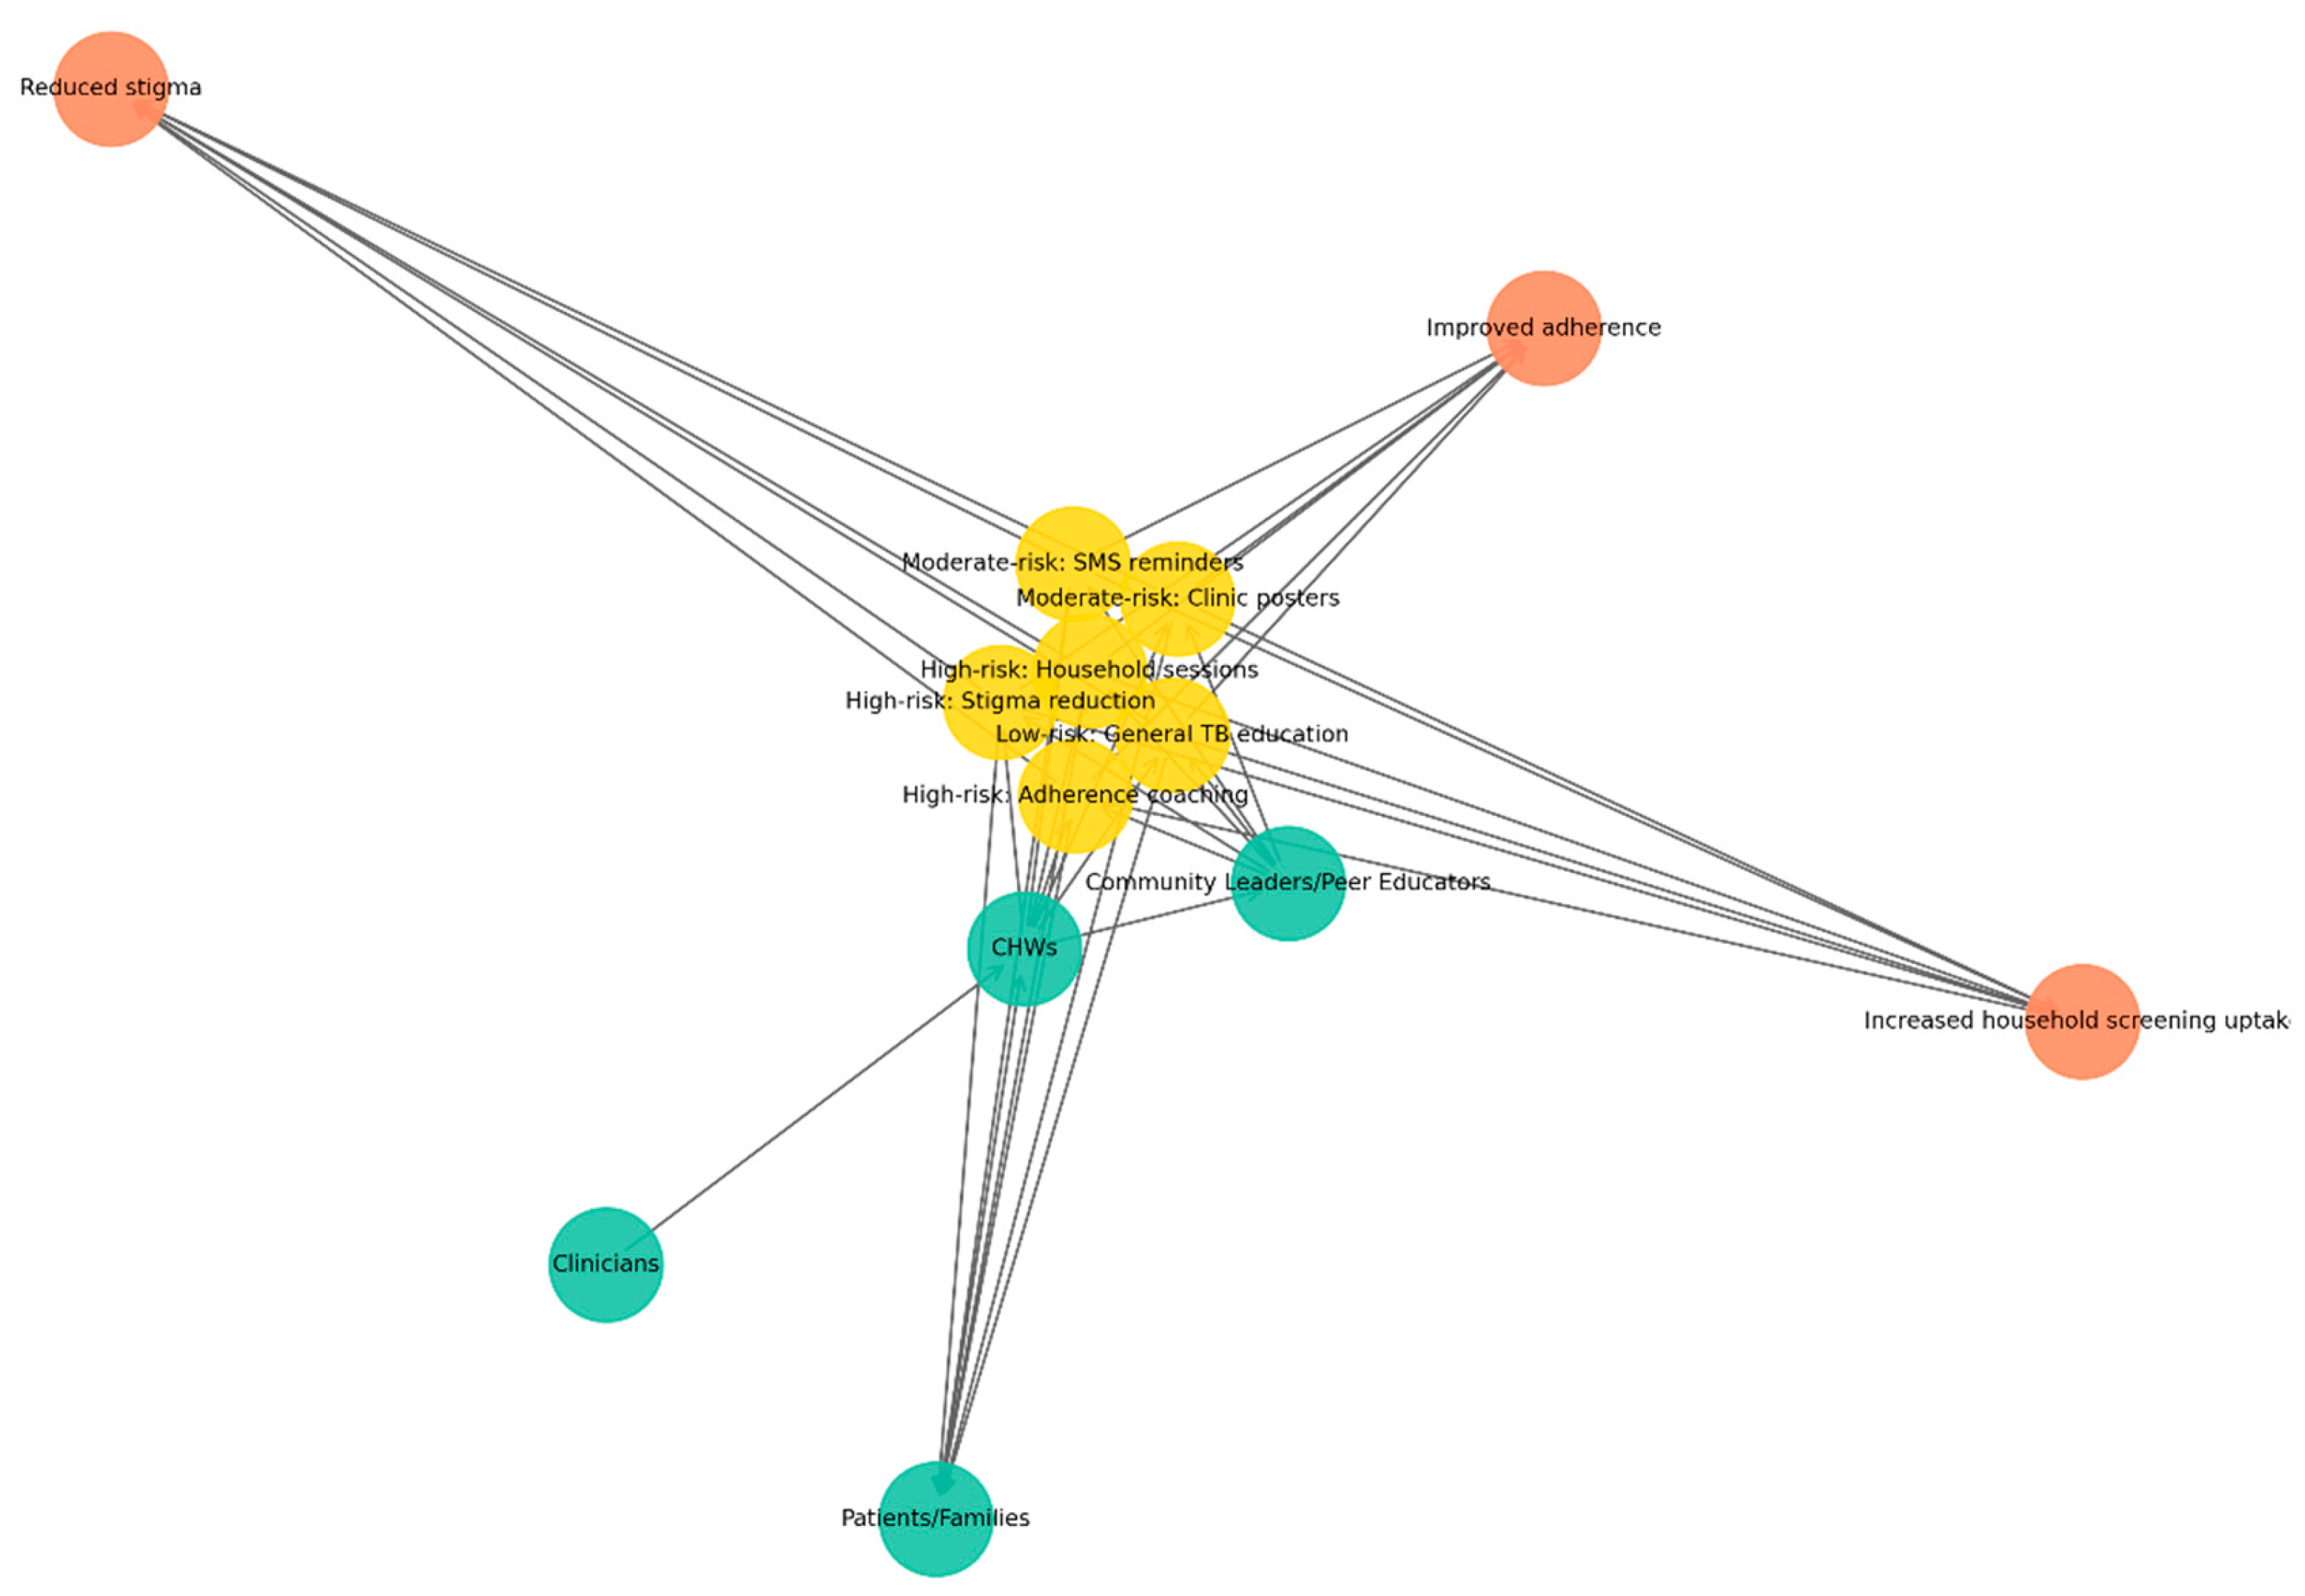
This network in Figure 5 illustrates how CHWs serve as central agents in delivering risk-banded TB education. Green nodes represent actors (CHWs, clinicians, patients/families, and community leaders or peer educators), yellow nodes denote interventions stratified by risk: high-risk households (household sessions, stigma reduction, adherence coaching), moderate-risk groups (SMS/WhatsApp reminders, clinic posters), and low-risk groups (general TB education). In contrast, orange nodes represent outcomes (improved adherence, reduced stigma, increased household screening uptake). Directed edges depict flows of delivery, support, and reinforcement: CHWs deliver interventions to patients and families, clinicians provide technical back-up, and community leaders reinforce education messages. Feedback loops are visible when patients report challenges to CHWs, who then engage leaders to mobilize responses.
The CEE subnetwork highlights the crucial role of CHWs in delivering targeted educational interventions across diverse risk levels. By linking clinicians, households, and community leaders, CHWs ensure that health messages are not only delivered but also contextualized and reinforced. This configuration strengthens patient adherence, reduces stigma, and promotes timely household screening, demonstrating how community engagement complements clinical governance in sustaining TB control.
The figure illustrates a network model linking risk-tiered TB interventions (yellow nodes: low-, moderate-, and high-risk strategies) with community and health-system actors (green nodes: community health workers, clinicians, community leaders, patients/families) and expected outcomes (orange nodes: reduced stigma, improved adherence, increased household screening uptake). Interventions such as SMS reminders, clinic posters, household education sessions, stigma-reduction activities, general TB education, and adherence coaching are positioned centrally, demonstrating how different risk-stratified actions mobilize various stakeholders to achieve targeted public health effects. The network highlights the multi-sectoral nature of TB control and the central role of community-based approaches in strengthening prevention, adherence, and screening uptake.
- CG Structures and CEE Interventions
Green nodes represent key actors, including clinicians, CHWs, patients and families, and community leaders. Blue nodes denote CG SOPs, such as reflex LPAs for high-risk cases, risk-stratified regimen reviews, and rapid contact tracing. Orange nodes indicate KPIs, including the proportion of high-risk patients receiving LPAs within 24 h, time to initiation of the appropriate regimen, household screening coverage within seven days, and monitoring of MDR incidence trends. Yellow nodes highlight CEE interventions tailored by risk-band, with high-risk households receiving targeted sessions and adherence/stigma coaching, moderate-risk groups supported through SMS reminders and clinic posters, and low-risk individuals provided with general TB education. Directed edges capture accountability, implementation, and feedback loops between governance structures, health workers, and communities, with CHWs emerging as pivotal bridging agents linking governance oversight with community-based interventions.
The systems map (Figure 6, Table 6) illustrates the interconnected roles of CG and CEE in strengthening TB control. Nodes were grouped into four categories: actors (clinicians, CHWs, the CG Board/M&M committee, patients and families, and community leaders or peer educators); processes (SOPs) on the CG side (reflex LPAs for high-risk cases, risk-stratified regimen reviews, and rapid contact tracing); KPIs (proportion of high risk patients with LPAs within 24 h, time to appropriate regimen initiation, household screening coverage within seven days, and monitoring of MDR incidence trends); and CEE interventions stratified by risk-band (high risk households receiving targeted sessions, stigma reduction and adherence coaching; moderate-risk groups supported through SMS/WhatsApp reminders and clinic posters; and low-risk individuals provided with general TB education).
Directed edges represent accountability, operational, and feedback relationships. Accountability edges link the CG Board to SOPs and KPIs, with feedback loops returning to clinicians and CHWs. Operational edges connect clinicians and CHWs through bi-directional risk communication, while community edges capture CHWs delivering education to households and peer educators engaging with community leaders. Feedback edges further demonstrate CHWs’ reporting barriers and adherence challenges, which are ultimately returned to the CG Board. Overall, the network underscores CHWs as pivotal bridging agents, integrating governance oversight with community-based action and sustaining accountability loops between policy, clinical practice, and patient education.
Figure 6.
Integration of CG and CEE in TB control.
This system map (Figure 6) illustrates the dynamic relationships between key actors, CG structures, and CEE interventions within the TB care continuum. The framework shows how CG processes such as oversight, quality assurance, adherence monitoring, and coordination of care interact with community-centred educational strategies, including outreach, peer-led learning, and household-level engagement. Together, these components create a feedback-driven system designed to strengthen early detection, treatment adherence, patient support, and public health responsiveness in high-burden, resource-limited settings.
Table 6.
Summary of nodes included in the network analysis, organized by category.
| Category | Nodes |
|---|---|
| Actor | Clinicians |
| Actor | CHWs |
| Actor | CG Board |
| Actor | Patients/Families |
| Actor | Community Leaders |
| CG SOP | Reflex LPA (High risk) |
| CG SOP | Risk-stratified regimen review |
| CG SOP | Rapid contact tracing |
| KPI | % High risk with LPA ≤24h |
| KPI | Time-to-appropriate regimen |
| KPI | % households screened ≤7d |
| KPI | MDR incidence trends |
| CEE intervention | High risk: Household sessions |
| CEE intervention | High risk: Adherence/stigma coaching |
| CEE intervention | Moderate risk: SMS reminders |
| CEE intervention | Moderate risk: Clinic posters |
| CEE intervention | Low risk: General TB education |
4. Discussion
4.1. Phenotype and Mutation Analysis
The high prevalence of resistance phenotypes (58.9%) observed in this study underscores the ongoing burden of drug-resistant TB in the study setting. MDR-TB (21.7%) remains a significant challenge, aligning with WHO global estimates for high-burden regions and emphasizing the need for robust diagnostic and treatment strategies [13,14].
Mutation analysis revealed a consistent pattern with global resistance mechanisms. The katG S315T mutation was the most frequent, confirming its role as the primary driver of high-level isoniazid resistance [15,16]. The presence of inhA-15C>T, often in combination with katG S315T, underscores the complexity of INH resistance, in which dual mutations may further compromise treatment efficacy and limit regimen flexibility [17,18]. Similarly, rpoB S450L was the predominant rifampicin resistance mutation, consistent with its well-documented global dominance in MDR-TB cases [15,19].
The correlation between mutation profiles and phenotypic resistance supports the use of molecular diagnostics (e.g., LPAs and whole-genome sequencing) for rapid detection of resistance [20,21]. Notably, the enrichment of dual katG and inhA mutations among MDR isolates suggests that relying solely on a single diagnostic marker could underestimate the risk of resistance. From a public health perspective, these findings highlight several priorities. Expanded molecular surveillance is needed to capture the full spectrum of resistance-associated mutations, while treatment regimens must be tailored to address high-level isoniazid resistance driven by katG mutations. Strengthening CG is crucial to ensure the rapid translation of diagnostic data into timely adjustments of treatment regimens. Community education strategies remain essential to improve adherence, as resistance amplification is often linked to incomplete or delayed treatment [22,23]. Taken together, the convergence of phenotypic and genotypic findings in this cohort underscores that molecular markers are reliable predictors of resistance and should serve as a cornerstone for both predictive modelling and programmatic decision-making [24,25].
4.2. Diagnostic Machine Learning Analysis
The application of diagnostic ML approaches provided complementary insights into the determinants of drug resistance in this study. Logistic regression confirmed that resistance-associated mutations, particularly rpoB S450L and katG S315T, were the strongest independent predictors of resistance. The random forest classifier further reinforced these findings by ranking genetic features as the most influential predictors, with consistent importance values across multiple iterations. The convergence of logistic regression and random forest results increases confidence in the robustness of the identified predictors. Notably, the ability of both models to achieve excellent discrimination (AUCs of 0.96 for any resistance and 0.99 for MDR-TB) underscores the potential of ML approaches to complement standard statistical inference by enhancing predictive accuracy. Our findings are supported by the study conducted by Babirye et al., on ML-based prediction of antibiotic resistance in Mycobacterium tuberculosis clinical isolates in Uganda [26]. In contrast, several studies reported that ML models do not consistently outperform traditional statistical models. For instance, Boakye et al. found no significant difference in AUC between ML algorithms and logistic regression, highlighting the critical role of proper validation and calibration in model evaluation [27]. These findings have several implications. First, they support the incorporation of katG, inhA, and rpoB markers into diagnostic algorithms for rapid resistance profiling, ensuring that patients are initiated on appropriate regimens without delay. Second, the demonstration that demographic predictors contributed little to model performance suggests that, when resources are constrained, programmatic interventions should prioritize mutation-based diagnostics over demographic risk profiling. Ultimately, integrating ML output into CG frameworks could facilitate more systematic risk stratification, providing clinicians and program managers with real-time feedback. Nevertheless, the diagnostic ML framework should be interpreted with caution. Although internal cross-validation confirmed good model stability, the analysis was limited to a single study. External validation in independent populations is required before these models can be deployed at scale. Moreover, while ML improves predictive performance, interpretability remains essential for clinical adoption, underscoring the continued value of logistic regression in providing odds ratios that are readily understandable to clinicians and policymakers. In summary, diagnostic ML analysis highlights the dominant role of specific mutations in predicting resistance and demonstrates the added value of combining statistical inference with ML-based prediction. This dual approach strengthens the evidence base for mutation-driven diagnostics and offers a framework for embedding predictive analytics into both clinical practice and governance structures.
4.3. Predictive Risk Stratification and Expected Impact
The predictive risk stratification framework demonstrated that integrating ML–based probability estimates with clinical decision rules can substantially improve the targeting of diagnostic and treatment resources. By grouping patients into low-, moderate-, and high-risk bands, the models provided a structured approach to reflex testing, regimen review, and community interventions that align with the principles of precision medicine and health system efficiency. Risk stratification is increasingly promoted as a practical way to translate complex outputs into actionable program signals, and recent overviews argue that genomics-enabled surveillance can support early, individualized treatment optimization [28,29].
The model-derived predicted probabilities (0.10 low, 0.30 moderate, 0.60 high) indicate meaningful risk stratification; the model is not simply labeling episodes as “resistant vs susceptible,” but ranking patient- or facility-level episodes along a clinically interpretable continuum of likelihood for drug-resistant Mycobacterium tuberculosis. In practice, this kind of probability separation supports differentiated decision-making: low-risk episodes can follow routine diagnostic pathways, while moderate- and high-risk episodes can be escalated for rapid confirmatory testing and earlier programmatic action. This aligns with the broader move toward prediction tools that support triage and prioritization rather than relying solely on binary classification, particularly in resource-constrained settings where confirmatory testing capacity may be limited [30,31].
From an implementation perspective, the high-risk category (0.60) is critical because it represents a subgroup with a higher expected yield of drug-resistance confirmation, enabling rapid molecular diagnostics and intensified follow-up to be more efficient. WHO guidance emphasizes the importance of rapid, molecular WHO-recommended diagnostic tests (e.g., Xpert MTB/RIF or Ultra) as initial tests for TB and rifampicin resistance detection, reflecting the public health urgency of early resistance identification and prompt initiation of effective regimens [32]. When a predictive model consolidates suspected resistance into a smaller “high-risk” group, it can help programs use rapid tests and infection-control responses more strategically, especially when GeneXpert cartridges, culture capacity, or second-line DST are constrained.
The observed separation across risk categories is consistent with a growing body of evidence showing that clinical and routinely collected variables can be used to predict drug resistance with useful discrimination, including machine-learning and multivariable approaches. A recent study has demonstrated the feasibility of predicting drug resistance from clinical profiles using ML methods, supporting the idea that routinely available data can drive early warning systems [31]. Similarly, nomogram-based models have been developed to predict MDR-TB risk using combinations of patient and disease characteristics, reinforcing that risk prediction can be operationalized into pragmatic tools for earlier recognition of likely resistance [33]. Beyond individual studies, synthesis evidence suggests machine learning has measurable accuracy for DR-TB identification/prediction overall. However, performance varies by setting, predictors used, and outcome definition, highlighting the need for local validation and careful governance when translating risk scores into practice.
High-risk patients, who represented approximately one-fifth of the cohort, stood to benefit most from immediate reflex LPA testing and prioritized regimen review. Modelling indicated that such interventions could shorten the median time to an appropriate regimen from nearly two weeks to just three days, a reduction likely to prevent the amplification of resistance and reduce transmission within households. The emphasis on early household screening for this group is consistent with WHO recommendations on intensified contact investigation in high-burden settings. It may help identify secondary cases before further spread occurs.
4.4. Predictive Picture (Forward-Looking Risk and Resource Targeting)
The predictive modelling framework offers a proactive approach to TB management by linking individual-level risk probabilities with operational decision-making. By stratifying patients into low-, moderate-, and high-risk groups, the model advances beyond descriptive resistance profiling to provide actionable guidance for clinicians and program managers. This forward-looking perspective ensures that diagnostic and treatment resources are deployed where they are most likely to have impact, an essential consideration in rural, resource-limited settings.
For high-risk patients, the model emphasizes the importance of reflex molecular testing and prompt review of the regimen. Simulation of this approach suggested significant reductions in time to appropriate therapy, which is critical for preventing the amplification of resistance and for reducing the risk of household and community transmission. Targeted contact tracing and household education, when triggered by high-risk classification, provide further opportunity to interrupt transmission chains early. Moderate-risk patients, while less urgently in need of regimen changes, benefit from expedited molecular testing and enhanced adherence support. This group often represents individuals at risk of poor outcomes due to delayed confirmation of resistance or inconsistent treatment. By directing additional counselling and monitoring toward this risk band, programs can reduce diagnostic delays, improve regimen adherence, and thereby lower the probability of acquired resistance. Low-risk patients, who represent the majority of cases, reinforce the framework’s efficiency. Their classification ensures that scarce molecular diagnostics and intensive adherence interventions are prioritized elsewhere, while these patients continue to benefit from routine TB services and standard health education. This not only optimizes resources but also maintains equity by ensuring that all patients receive care proportionate to their risk.
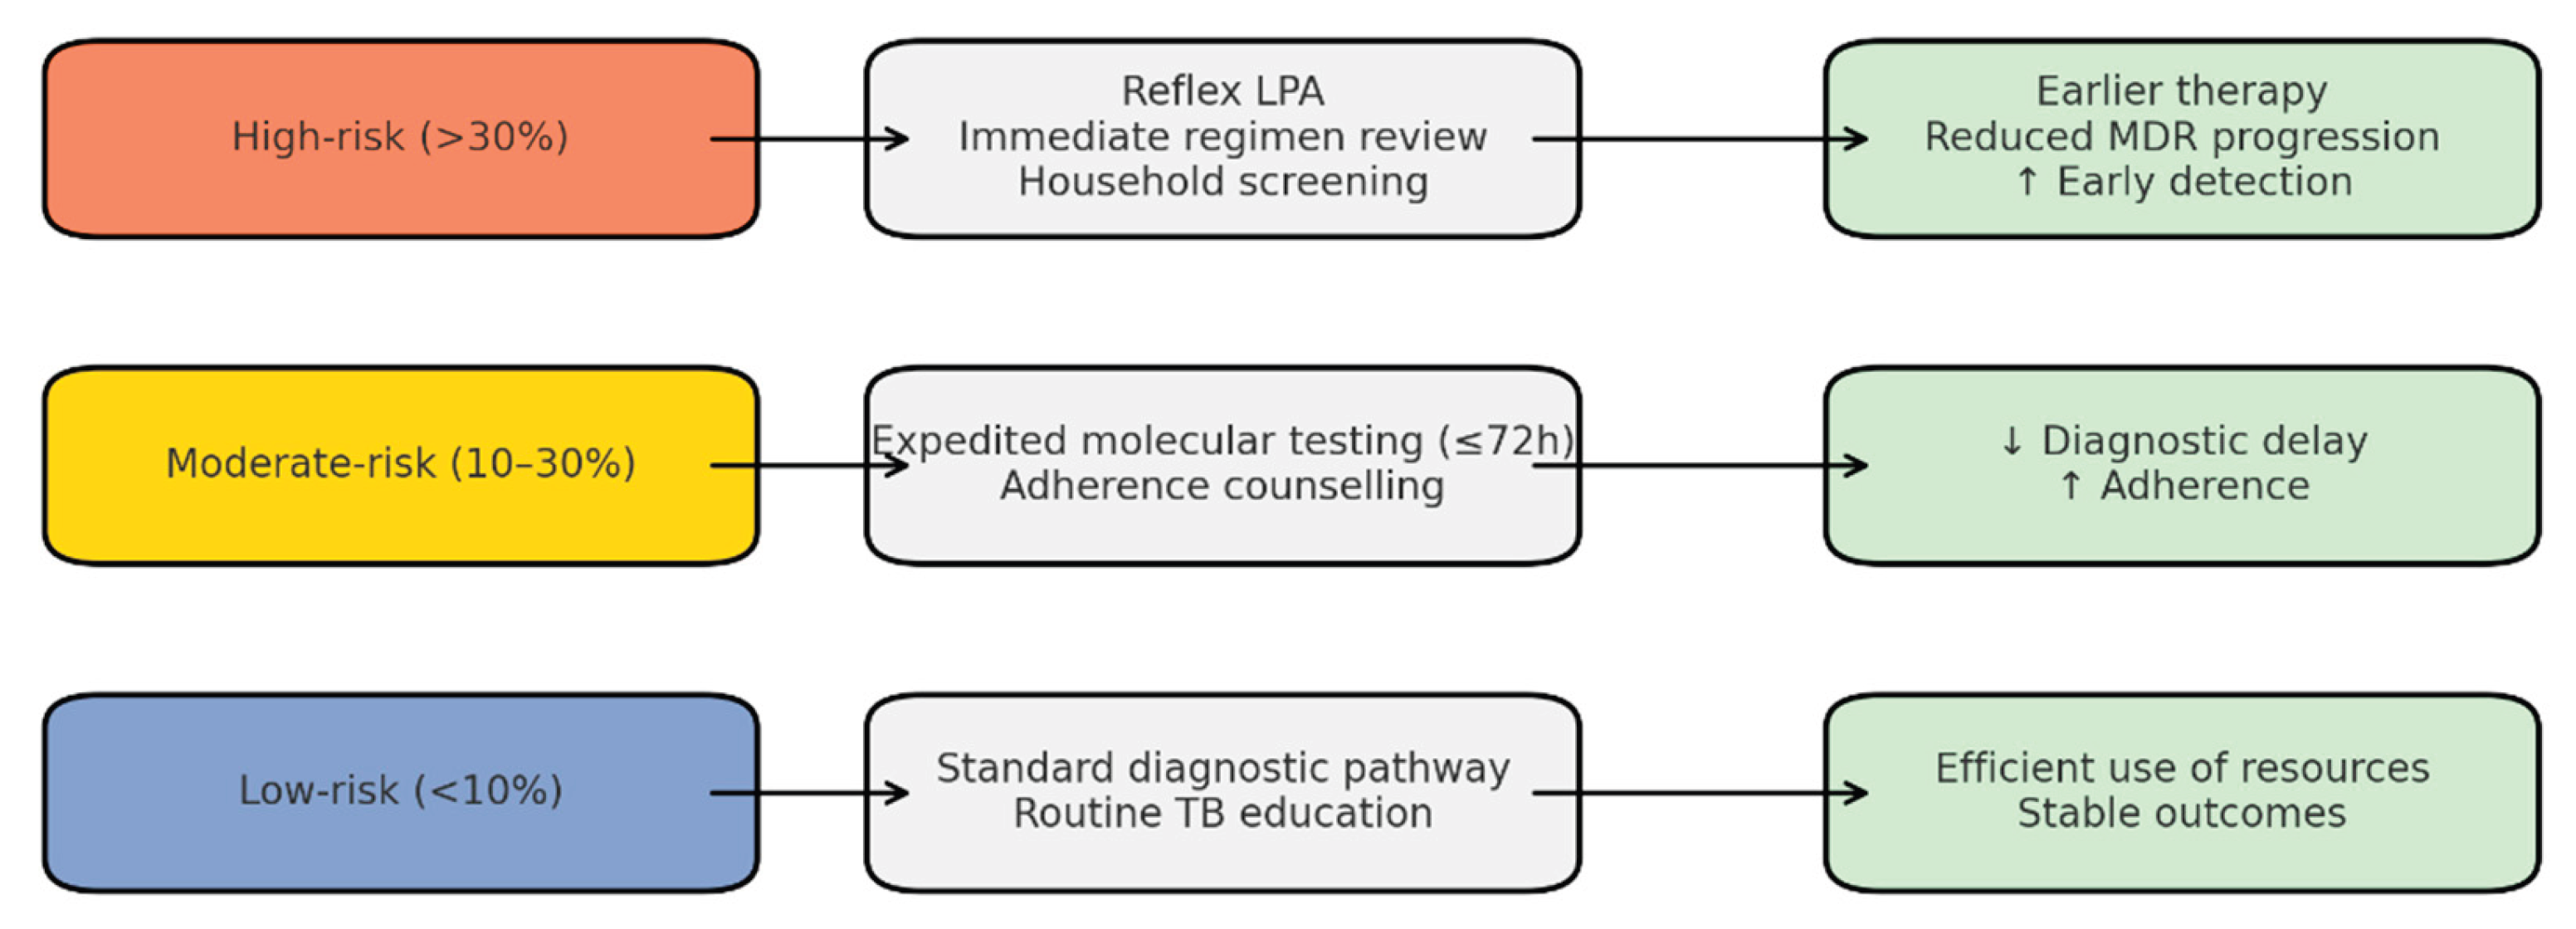
The predictive picture also strengthens the link between clinical governance and community engagement. Risk thresholds can be embedded into clinical governance structures as audit criteria, ensuring accountability in the timely use of reflex testing and household screening. Simultaneously, community-engaged education can be stratified by risk, ensuring that high-risk families receive intensive household-level support, while moderate- and low-risk groups are reached with scalable community-level interventions. This dual integration ensures that predictive modelling does not remain a technical exercise but becomes embedded in day-to-day clinical practice and public health programming. Overall, the predictive picture suggests that machine learning–driven stratification has the potential to reduce delays, optimize resource allocation, and enhance both clinical and community-based interventions. However, further validation in larger, diverse populations and integration with additional clinical predictors such as HIV status, treatment history, and comorbidities will be essential to confirm its scalability and generalizability. The schematic illustrates the forward-looking risk stratification model applied to patients with TB. Patients are categorized into three bands: High-risk (>30%), Moderate-risk (10–30%), and Low-risk (<10%) probability of isoniazid-resistant TB or MDR-TB. High-risk patients are directed to reflex LPA testing, immediate regimen review, and prioritized household screening, resulting in earlier diagnosis, reduced treatment delays, and prevention of MDR progression. Moderate-risk patients undergo expedited molecular testing within 72 h and receive enhanced adherence counselling, leading to shorter diagnostic delays and improved adherence. Low-risk patients follow the standard diagnostic pathway and receive routine TB education, ensuring efficient resource allocation with stable outcomes. Arrows indicate the flow from risk stratification to interventions and expected outcomes, highlighting how the predictive framework links patient-level risk to programmatic action.
Figure 6.
Predictive Risk Stratification Framework: Patient Flow, Interventions, and Outcomes.
4.5. Limitations
This analysis should be interpreted in light of several limitations. First, the sample size, although adequate for exploratory modelling, restricts the precision of some estimates and limits the detection of less common resistance-associated mutations. Second, the study was conducted within a single geographic setting, which may limit its generalizability to other regions with differing epidemiological or genetic profiles of M. tuberculosis. Third, incomplete clinical data, particularly regarding HIV status, prior treatment history, and comorbidities, prevented the incorporation of these potentially essential predictors into the models. This may have attenuated the ability to capture host- or treatment-related drivers of resistance. These limitations underscore the need for larger, multi-site datasets and more comprehensive clinical annotations to enhance predictive accuracy and ensure the broader utility of the diagnostic ML framework.
5. Conclusions
This study demonstrates that predictive modelling using molecular markers, combined with clinical and sociodemographic risk indicators, can accurately identify patients at high risk of unsuccessful treatment outcomes for drug-resistant tuberculosis. The Random Forest model showed superior predictive accuracy compared to logistic regression, highlighting its potential for early risk stratification and clinical decision support. The integration of these predictive outputs into structured CG pathways and CEE models provides a practical, scalable intervention framework, particularly for rural health systems, where delayed diagnosis, health system fragmentation, and socioeconomic barriers continue to undermine effective disease control. Findings emphasise the need to move beyond treatment-after-diagnosis models and adopt a proactive approach that enables early risk identification, responsive CG actions, and targeted community support strategies. Strengthening the interface between laboratory detection, predictive analytics, and clinical decision-making can significantly improve treatment adherence, reduce TB progression and mortality, and optimise healthcare resource allocation. In settings with high DR-TB prevalence and limited infrastructure, such as the rural Eastern Cape, this model holds promise for enhancing surveillance, improving patient outcomes, and advancing public health goals. Future research should focus on piloting implementation within real-time monitoring systems and expanding the model to incorporate additional biomarkers and community-led behavioural data.
Author Contributions
Siphosihle Conham: Conceptualization, methodology, original draft writing, review, and editing. Ncomeka Sineke: Conceptualization, Methodology review, and editing. Ntandazo Dlatu: Conceptualization, Methodology, co-supervision, review, and editing. Lindiwe Modest Faye: Conceptualization, methodology, supervision, formal analysis, data interpretation, original draft writing, review, and editing. Mojisola Clara Hosu: Literature review, methodology, review, and editing. Teke Apalata: Supervision, review and editing, and final approval of the manuscript.
Funding
This research received no specific grant from any funding agency in the public, commercial, or not-for-profit sectors. Institutional support was provided by Walter Sisulu University, Faculty of Health Sciences.
Institutional Review Board Statement
This follow-up study was approved by the Walter Sisulu University Human Research Ethics Committee (WSU HREC 105/2025, approved on 09 July 2025) and the Eastern Cape Department of Health Research Ethics Committee (EC_202507_030, approved on 11 July 2025). All data were anonymized prior to analysis, and no personal identifiers were used. The research adhered to the principles outlined in the Declaration of Helsinki.
Informed Consent Statement
Informed consent was not required for this study because it involved a retrospective analysis of routinely collected de-identified laboratory and clinical data. The research did not involve direct patient contact, interaction, or additional specimen collection. All data were anonymized before analysis, and no identifiable personal information was accessible to the research team.
Data Availability Statement
The datasets generated and analyzed during the current study are not publicly available due to data protection regulations of the Eastern Cape Department of Health and the National Health Laboratory Service. De-identified aggregated data may be made available from the corresponding author upon reasonable request and with permission of the respective data custodians.
Acknowledgments
The authors acknowledge the Eastern Cape Department of Health, the National Health Laboratory Service, and the participating health facilities for their cooperation. We also thank the Walter Sisulu University TB Research Unit for technical and administrative support.
Conflicts of Interest
The authors would like to inform readers that they have no competing interests to disclose regarding the content of this article.
References
- Liebenberg, D.; Gordhan, B.G.; Kana, B.D. Drug-resistant tuberculosis: Implications for transmission, diagnosis, and disease management. Front. Cell. Infect. Microbiol. 2022, 12, 943545. [Google Scholar] [CrossRef]
- Elbehiry, A.; Marzouk, E.; Edrees, H.M.; AlShaqi, R.; Ellethy, A.T.; Alzaben, F.; Anagreyyah, S.; Algarni, A.; Almuhaydili, K.; Alotaibi, I.; et al. Advancing the fight against tuberculosis: Integrating innovation and public health in diagnosis, treatment, vaccine development, and implementation science. Front. Med. 2025, 12, 1596579. [Google Scholar] [CrossRef]
- World Health Organization. Global Tuberculosis Report 2025; WHO: Geneva, Switzerland, 2025. [Google Scholar]
- Murdoch, J.; Curran, R.; van Rensburg, A.J.; Awotiwon, A.A.; Dube, A.; Bachmann, M.; Petersen, I.; Fairall, L. Identifying contextual determinants of problems in tuberculosis care provision in South Africa: A theory-generating case study. Infect. Dis. Poverty 2021, 10, 67. [Google Scholar] [CrossRef]
- Holtgrewe, L.M.L.; Johnson, A.; Nyhan, K.; Boffa, J.; Shenoi, S.V.; Karat, A.S.; et al. Burden of tuberculosis in underserved populations in South Africa: A systematic review and meta-analysis. PLOS Glob. Public Health 2024, 4, e0003753. [Google Scholar] [CrossRef]
- Li, S.; Mensah, E.; Liu, M.; Pan, L.; Lu, W.; Zhou, S.; Zhang, L.; Cheng, Y.; Zhao, H.; Wei, S.; et al. The burden of tuberculosis and drug resistance in 22 Sub-Saharan African countries, 1990–2021. Front. Microbiol. 2025, 16, 1695592. [Google Scholar] [CrossRef]
- Domínguez González, J.; Castillo Mewa, J.; González, P.; Del Cid, P.; Pérez Ruíz, J.A.; Rosas Hermosilla, S.E. Mutations associated with resistance to rifampicin and isoniazid identified in strains of the Mycobacterium tuberculosis complex. Microbiol. Spectr. 2025, e02400-24. [Google Scholar] [CrossRef]
- Chun, Z.M.; Jun, J.Q. Drug-resistant Mycobacterium tuberculosis isolates from new and previously treated TB patients in China. Rev. Soc. Bras. Med. Trop. 2021, 54, e0728-2020. [Google Scholar] [CrossRef]
- Ding, S.; Yi, X.; Gao, J.; Huang, C.; Zhou, Y.; Yang, Y.; Cai, Z. Combining bioinformatics and machine learning to identify diagnostic biomarkers of TB. Tuberculosis 2024, 149, 102570. [Google Scholar] [CrossRef]
- van der Westhuizen, H.M.; Giddy, J.; Coetzee, R.; Makanda, G.; Tisile, P.; Galloway, M.; Bunyula, S.; Schoeman, I.; Nathavitharana, R.R. Strengthening accountability for tuberculosis policy implementation in South Africa. BMC Glob. Public Health 2024, 2, 48. [Google Scholar] [CrossRef]
- Adejumo, O.A.; Jinabhai, C.; Daniel, O.; Haffejee, F. The effects of stigma and social support on quality of life in drug-resistant TB. Qual. Life Res. 2025, 34, 1305–1316. [Google Scholar] [CrossRef]
- Kipp, A.M.; Olivier, D.; Skonje, N.; Majiza, L.; Free, E.; Preacher, K.J.; Daftary, A.; Ngcelwane, N.; Medina-Marino, A. Community variability in TB-related stigma in South Africa. medRxiv 2025, 2025.04.15.25325605. [Google Scholar] [CrossRef]
- Faye, L.M.; Hosu, M.C.; Oostvogels, S.; Dippenaar, A.; Warren, R.M.; Sineke, N.; Vasaikar, S.; Apalata, T. Detection of mutations and genotyping of drug-resistant Mycobacterium tuberculosis strains. Infect. Dis. Rep. 2023, 15, 403–416. [Google Scholar] [CrossRef]
- World Health Organization. Global Tuberculosis Report 2024; WHO: Geneva, Switzerland, 2024. [Google Scholar]
- Traoré, A.N.; Rikhotso, M.C.; Mphaphuli, M.A.; Patel, S.M.; Mahamud, H.A.; Kachienga, L.O.; Kabue, J.P.; Potgieter, N. Isoniazid and rifampicin resistance-conferring mutations in South Africa. Pathogens 2023, 12, 1015. [Google Scholar] [CrossRef]
- Rodríguez-Martínez, L.M.; Chavelas-Reyes, J.L.; Medina-Ramírez, C.F.; Fuentes-Chávez, E.; Muñoz-Troncoso, Z.S.; Estrada-Vega, Á.G.; Rodríguez-Díaz, E.; Torres-Morales, D.; Moreno-Treviño, M.G.; Rodríguez-González, J.G. Molecular epidemiology of Mycobacterium tuberculosis in Mexico. Microorganisms 2025, 13, 2453. [Google Scholar] [CrossRef]
- Singh, A.K.; Singh, N.; Kumar, S.; Mishra, A.K.; Singh, N.P. Molecular insights of drug-resistant tuberculosis. Front. Microbiol. 2025, 16, 1669327. [Google Scholar] [CrossRef]
- Nono, V.N.; Nantia, E.A.; Mutshembele, A.; Teagho, S.N.; Simo, Y.W.; Takong, B.S.; et al. Prevalence of katG and inhA mutations. BMC Microbiol. 2025, 25, 127. [Google Scholar]
- Li, M.C.; Lu, J.; Lu, Y.; Xiao, T.Y.; Liu, H.C.; Lin, S.Q.; Xu, D.; Li, G.L.; Zhao, X.Q.; Liu, Z.G.; et al. rpoB mutations and effects on rifampin resistance. Infect. Drug Resist. 2021, 14, 4119–4128. [Google Scholar] [CrossRef]
- Hasan, Z.; Razzak, S.A.; Kanji, A.; Shakoor, S.; Hasan, R. Whole-genome sequencing reveals genotypic resistance. Int. J. Mycobacteriol. 2023, 12, 179–183. [Google Scholar] [CrossRef]
- Vasiliauskaitė, L.; Bakuła, Z.; Vasiliauskienė, E.; Bakonytė, D.; Decewicz, P.; Dziurzyński, M.; Proboszcz, M.; Davidavičienė, E.V.; Nakčerienė, B.; Krenke, R.; et al. Detection of multidrug-resistance by phenotype and molecular assays. Ann. Clin. Microbiol. Antimicrob. 2024, 23, 81. [Google Scholar] [CrossRef]
- Okumu, A.O.; Orwa, J.; Sitati, R.; Omondi, I.; Odhiambo, B.; Ogoro, J.; Wandiga, S. Factors associated with tuberculosis drug resistance. J. Clin. Tuberc. Other Mycobact. Dis. 2024, 37, 100466. [Google Scholar] [CrossRef]
- Nyasulu, P.S. Multidrug-resistant tuberculosis: Proactive strategies. Curr. Opin. Pulm. Med. 2024, 30, 364–372. [Google Scholar] [CrossRef]
- Tagami, Y.; Horita, N.; Kaneko, M.; Muraoka, S.; Fukuda, N.; Izawa, A.; et al. Whole-genome sequencing predicting phenotypic drug resistance. J. Infect. Dis. 2024, 229, 1481–1492. [Google Scholar] [CrossRef]
- Pfurtscheller, T.; Tsutsunava, A.; Maghradze, N.; Gujabidze, M.; Bablishvili, N.; Yerlikaya, S.; Denkinger, C.M.; Tukvadze, N.; Gupta-Wright, A. Diagnostic accuracy of Xpert MTB/XDR. Open Forum Infect. Dis. 2025, 12, ofaf022. [Google Scholar] [CrossRef]
- Babirye, S.R.; Nsubuga, M.; Mboowa, G.; et al. Machine learning-based prediction of antibiotic resistance. BMC Infect. Dis. 2024, 24, 1391. [Google Scholar] [CrossRef]
- Boakye, N.F.; O’Toole, C.C.; Jalali, A.; Hannigan, A. Comparing logistic regression and machine learning. Int. J. Med. Inform. 2025, 199, 105887. [Google Scholar] [CrossRef]
- Mboowa, G. Reimagining tuberculosis control in the era of genomics. Pathogens 2025, 14, 975. [Google Scholar] [CrossRef]
- Koura, K.G.; Hashmi, S.; Menon, S.; Gando, H.G.; Yamodo, A.K.; Budts, A.-L.; Meurrens, V.; Lapelou, S.-C.S.K.; Mbitikon, O.B.; Potgieter, M.; et al. Leveraging artificial intelligence to predict TB hotspots. Trop. Med. Infect. Dis. 2025, 10, 93. [Google Scholar] [CrossRef]
- Xu, C.; Zhao, L.Y.; Ye, C.S.; Xu, K.C.; Xu, K.Y. The application of machine learning in clinical microbiology. Front. Cell. Infect. Microbiol. 2025, 15, 1545646. [Google Scholar] [CrossRef]
- Falcao, I.W.S.; Cardoso, D.L.; dos Santos, A.E.C.; Paixao, E.; Costa, F.A.R.; Figueiredo, K.; Carneiro, S.; da Rocha Seruffo, M.C. Predicting drug resistance using machine learning techniques. PeerJ Comput. Sci. 2024, 10, e2246. [Google Scholar] [CrossRef]
- World Health Organization. WHO Consolidated Guidelines on Tuberculosis: Module 3—Diagnosis; WHO: Geneva, Switzerland, 2025. [Google Scholar]
- He, F.; Wang, S.; Wang, H.; Ding, X.; Huang, P.; Fan, X. Development and validation of a nomogram predicting multidrug-resistant tuberculosis risk. PeerJ 2025, 13, e19112. [Google Scholar] [CrossRef]
Figure 1.
Diagnostic ML performance (logistic regression). (“Logit” is short for logistic regression, and it refers to the log-odds transformation used inside the model).
Figure 1.
Diagnostic ML performance (logistic regression). (“Logit” is short for logistic regression, and it refers to the log-odds transformation used inside the model).
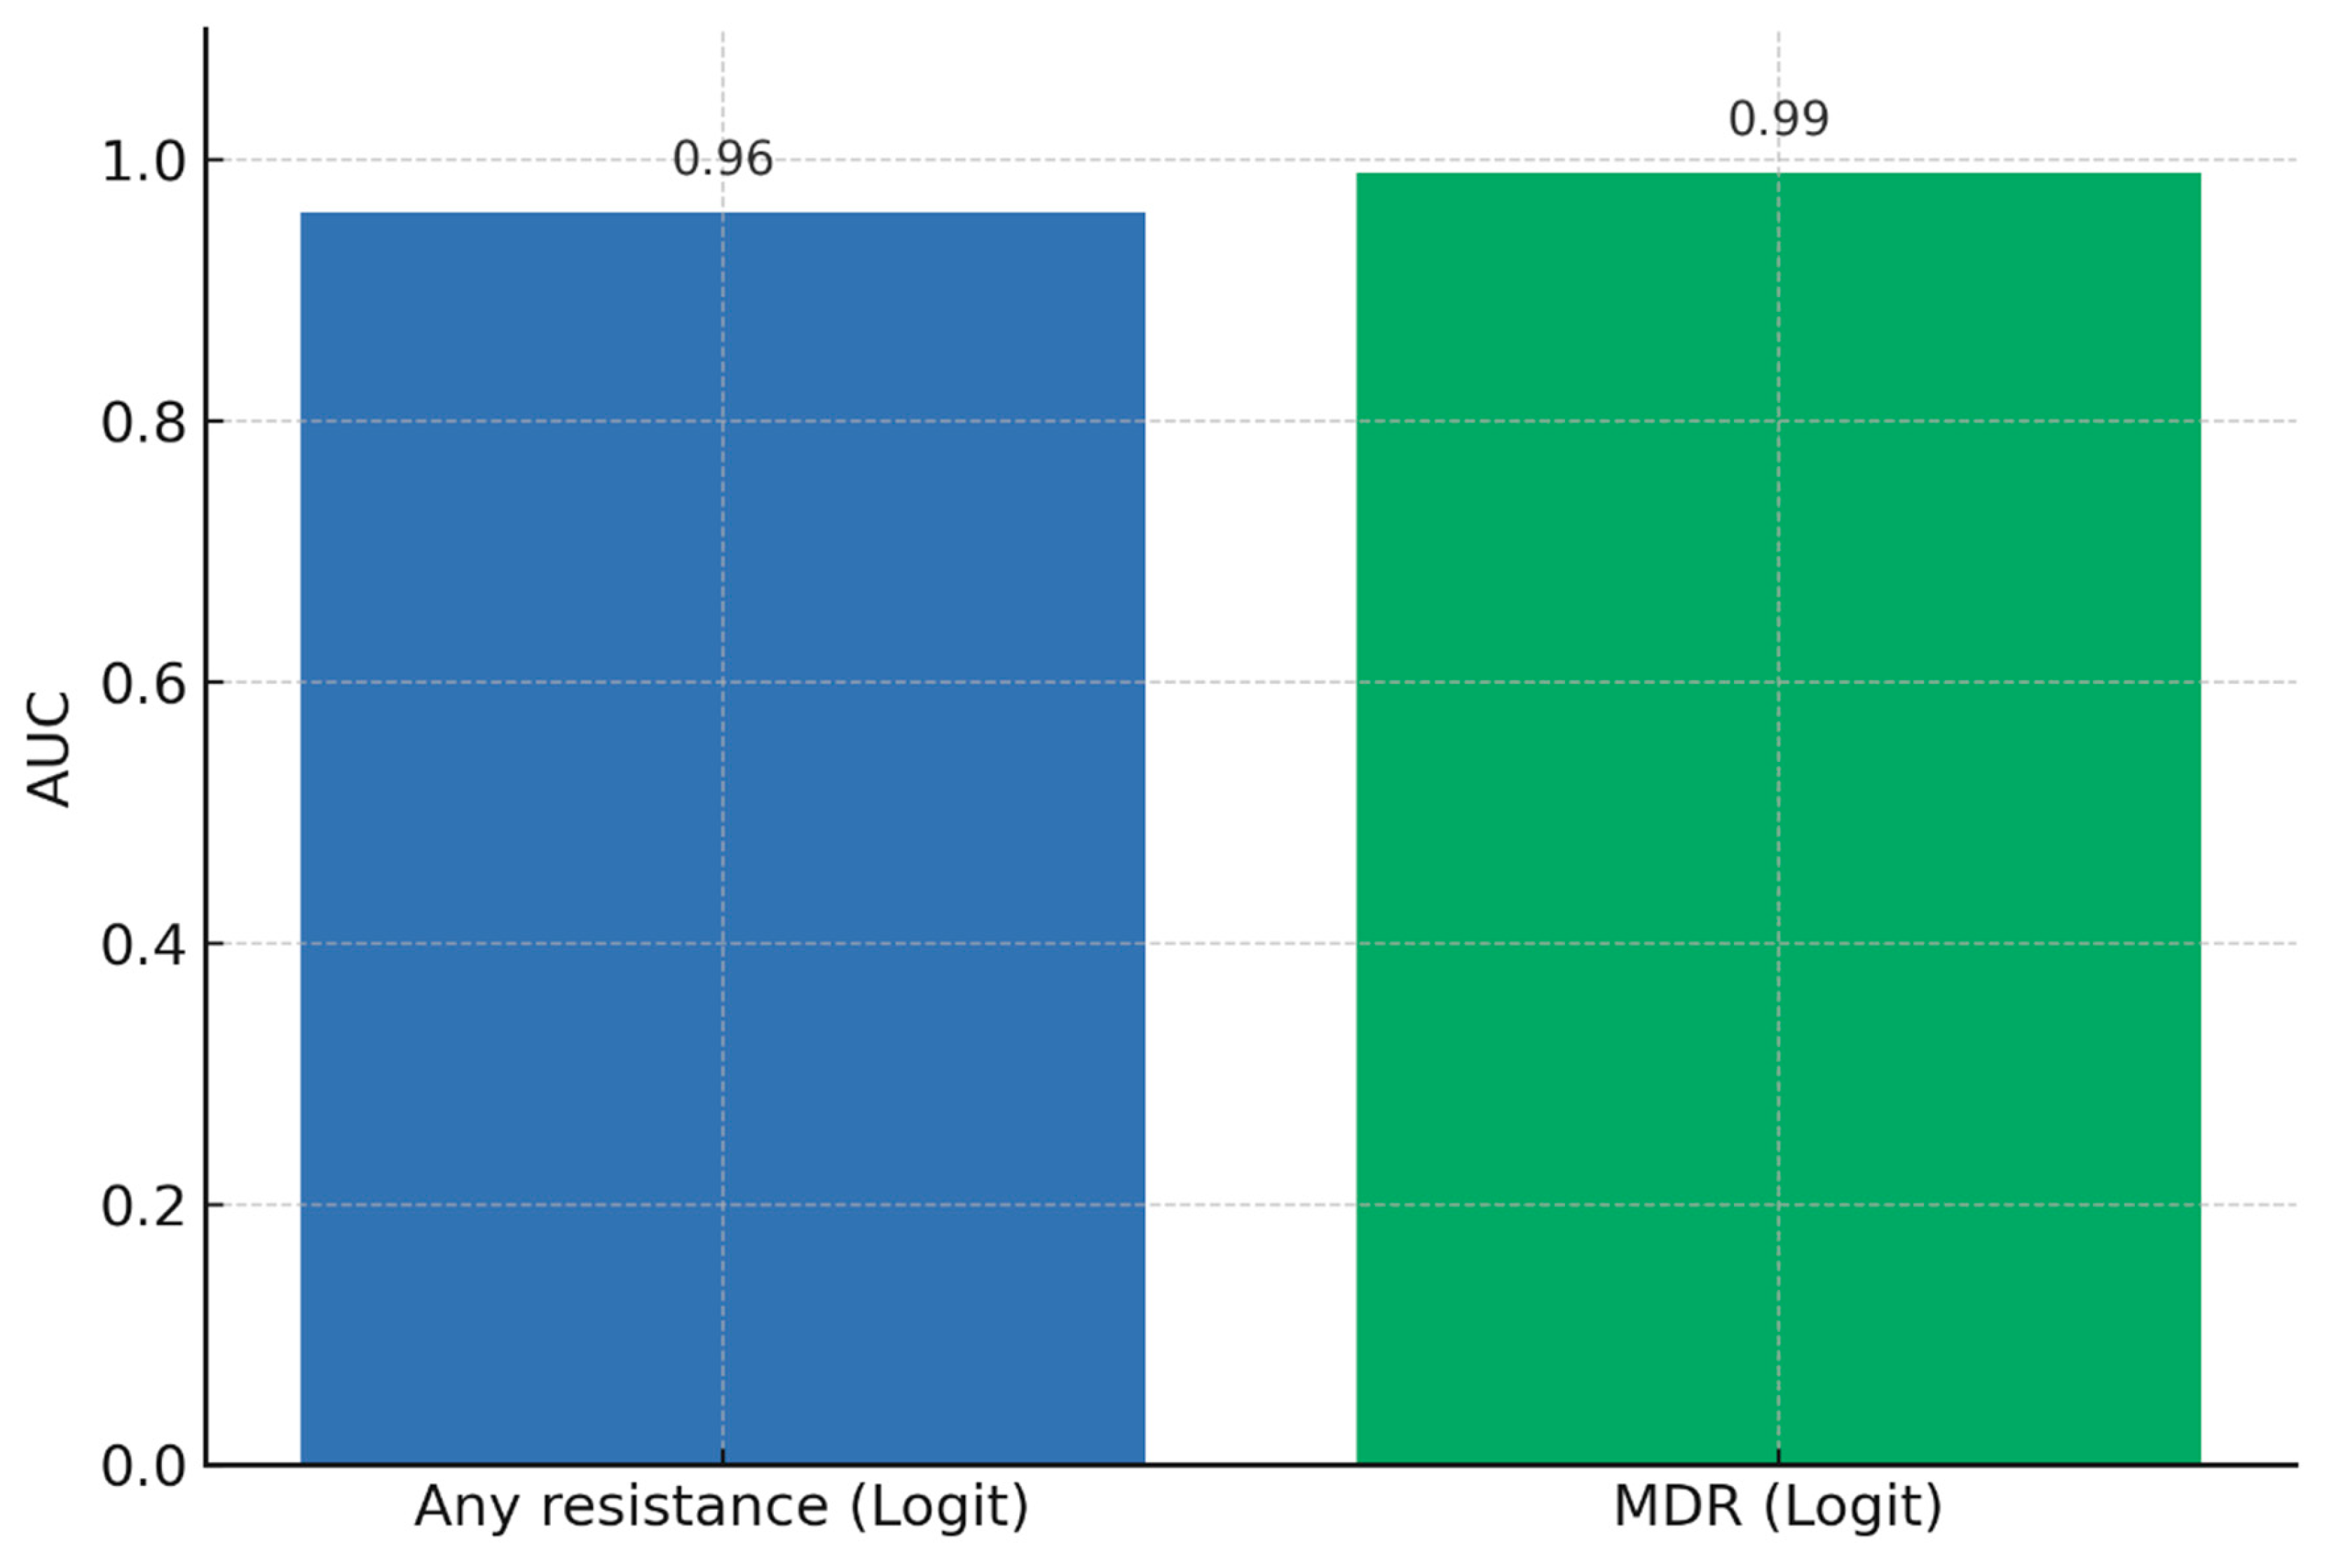
Figure 2.
Random forest feature importance for predictors of drug resistance.
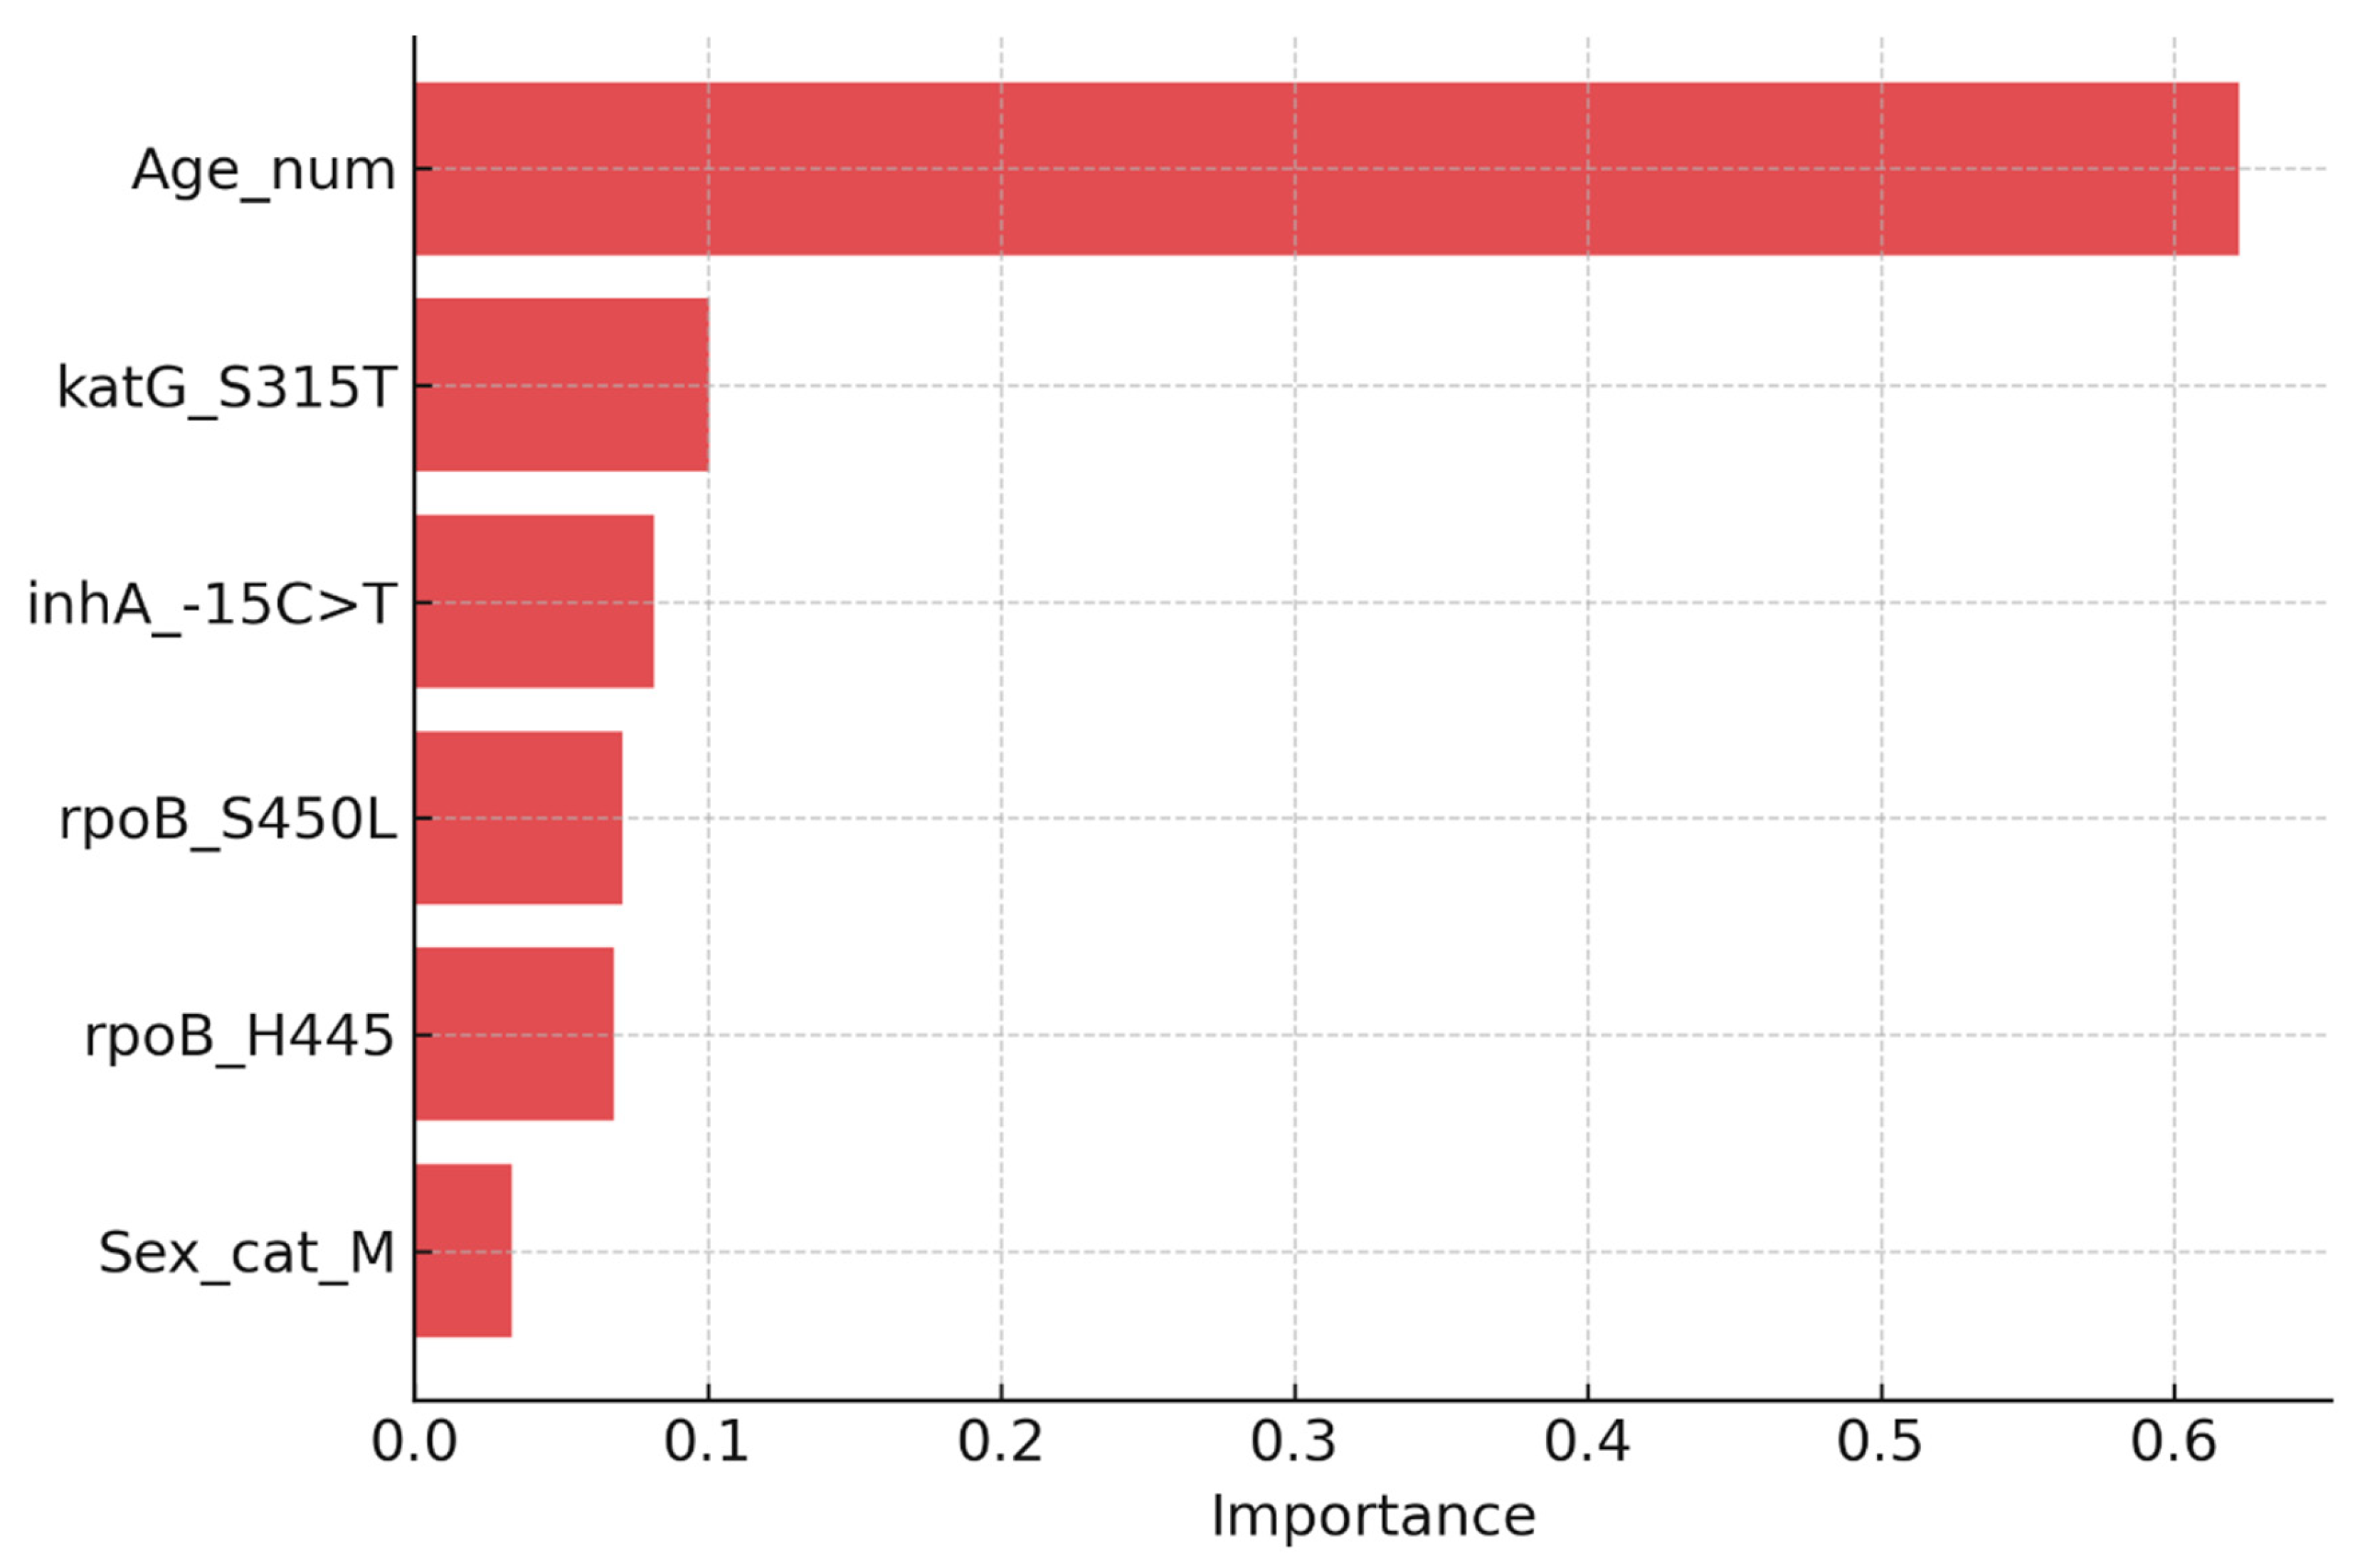
Figure 3.
Risk stratification based on predicted probability of drug resistance.
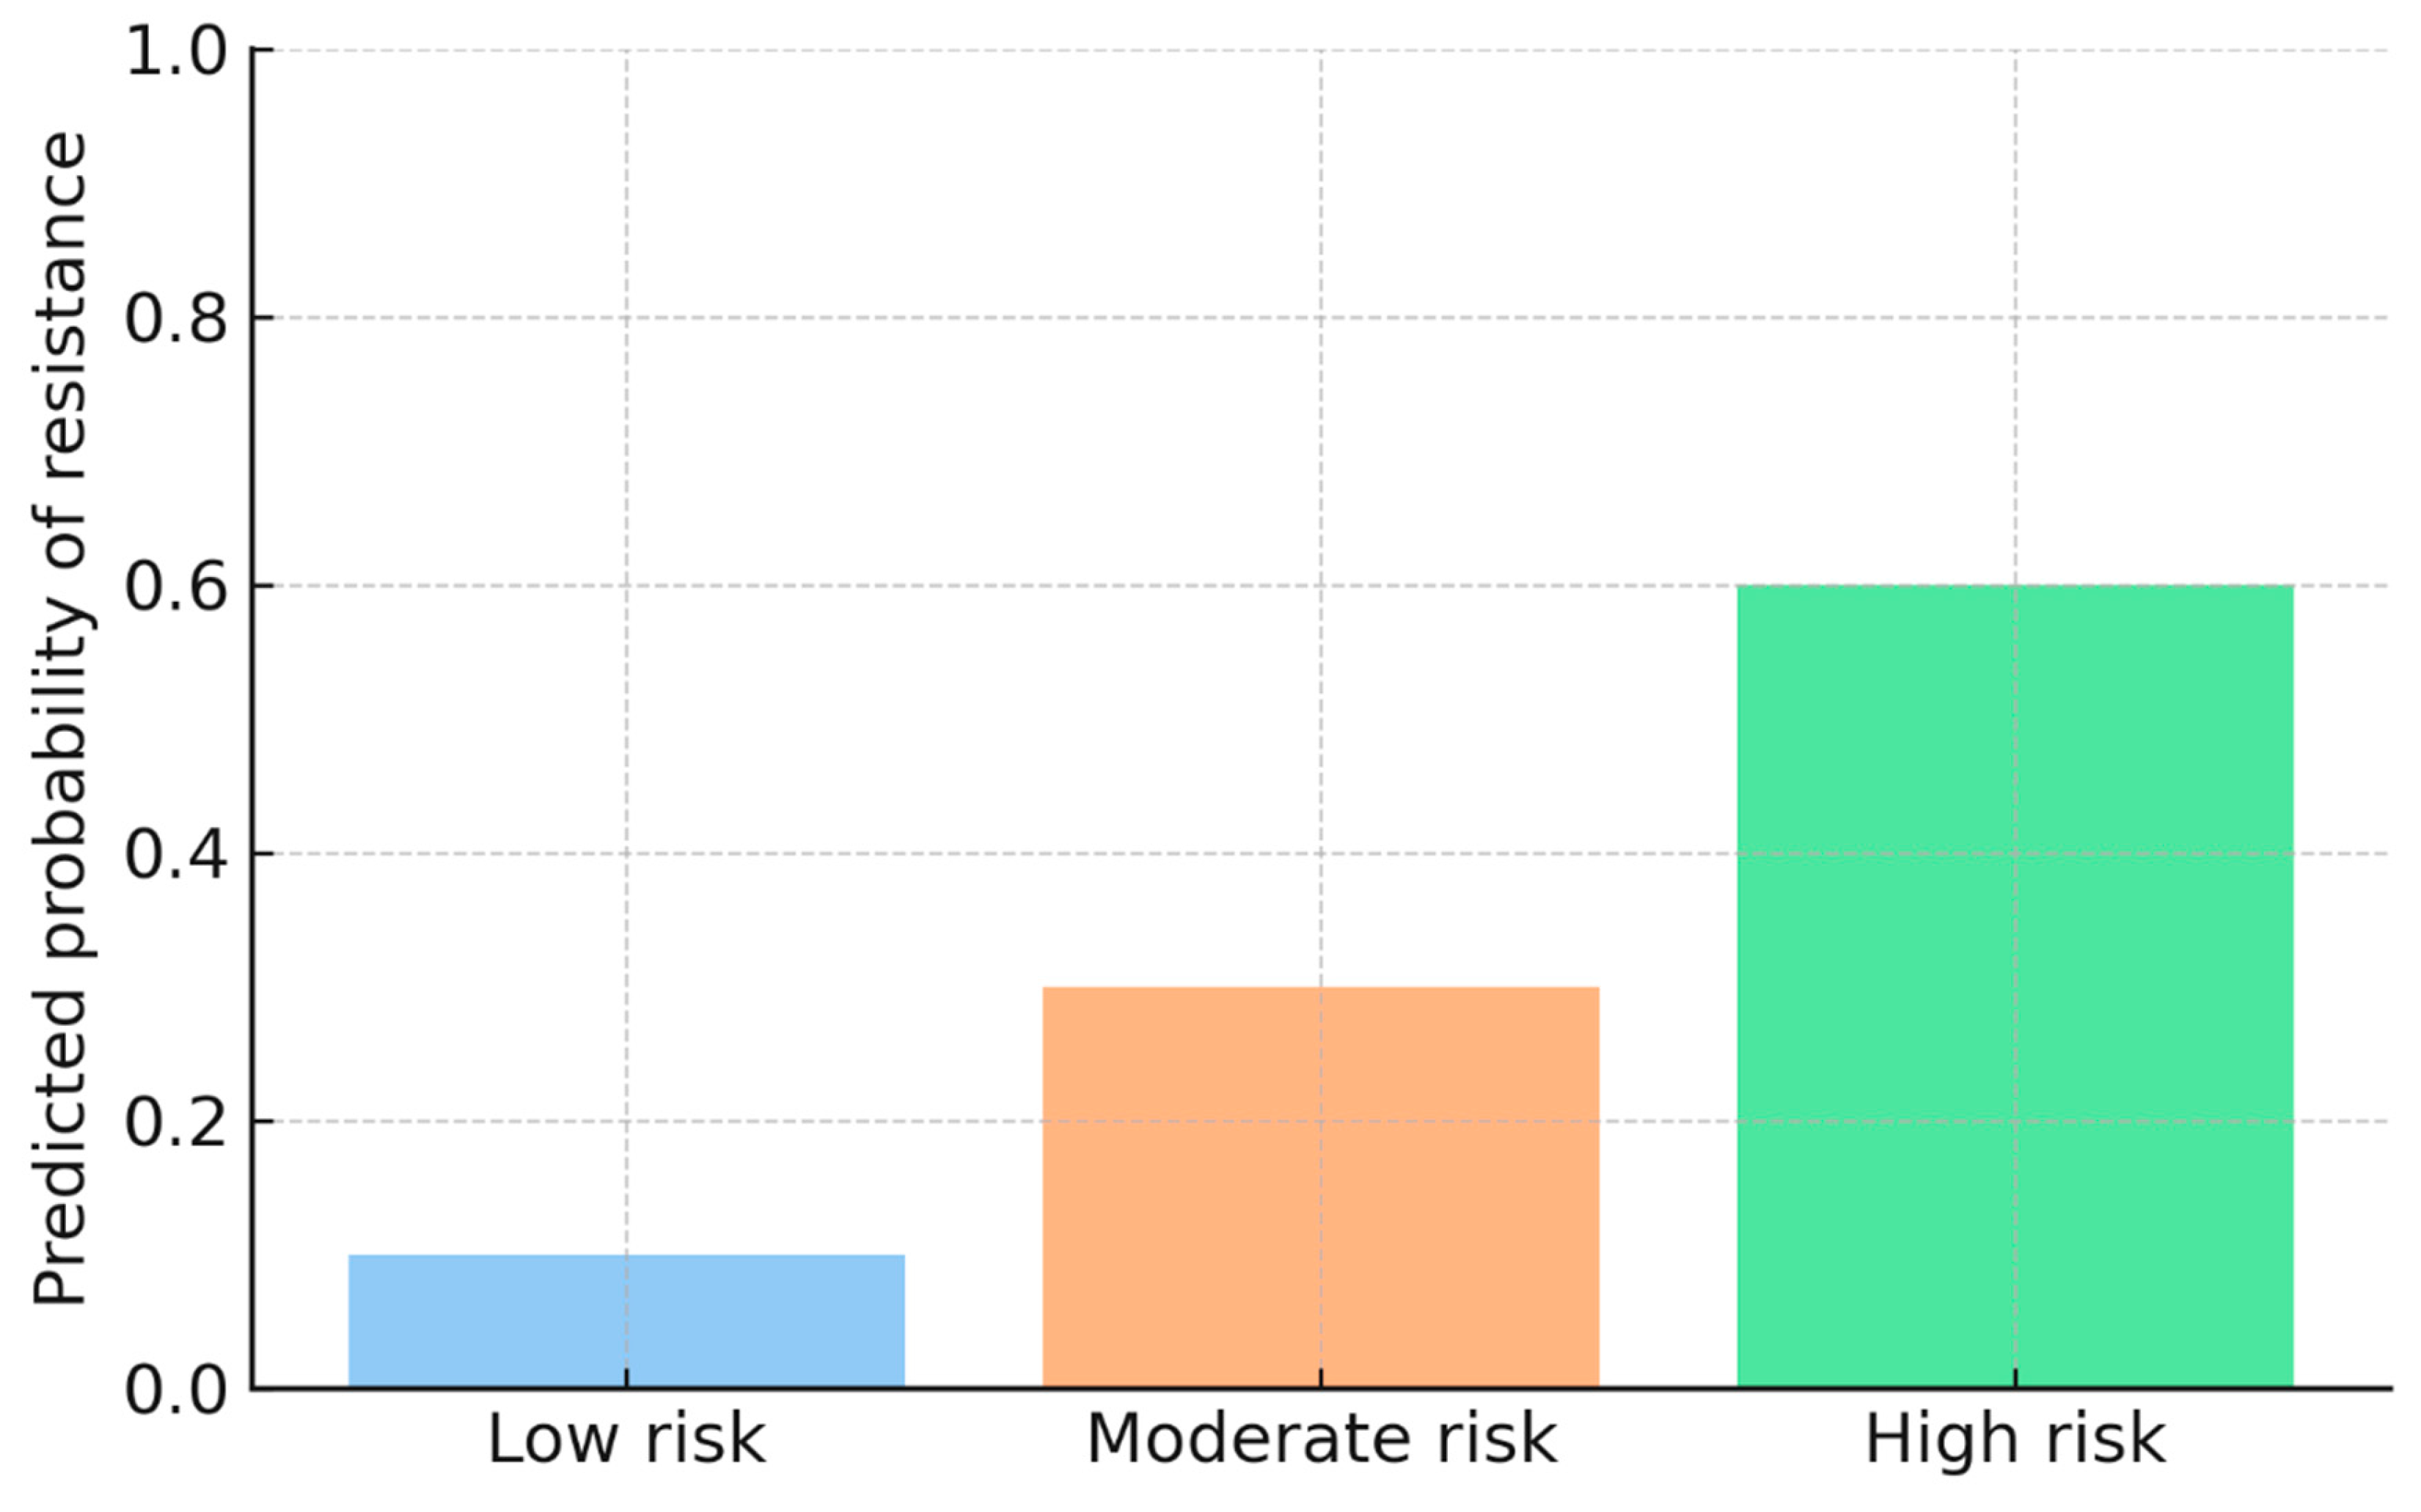
Figure 4.
Clinical governance subnetwork: SOPs and KPIs.
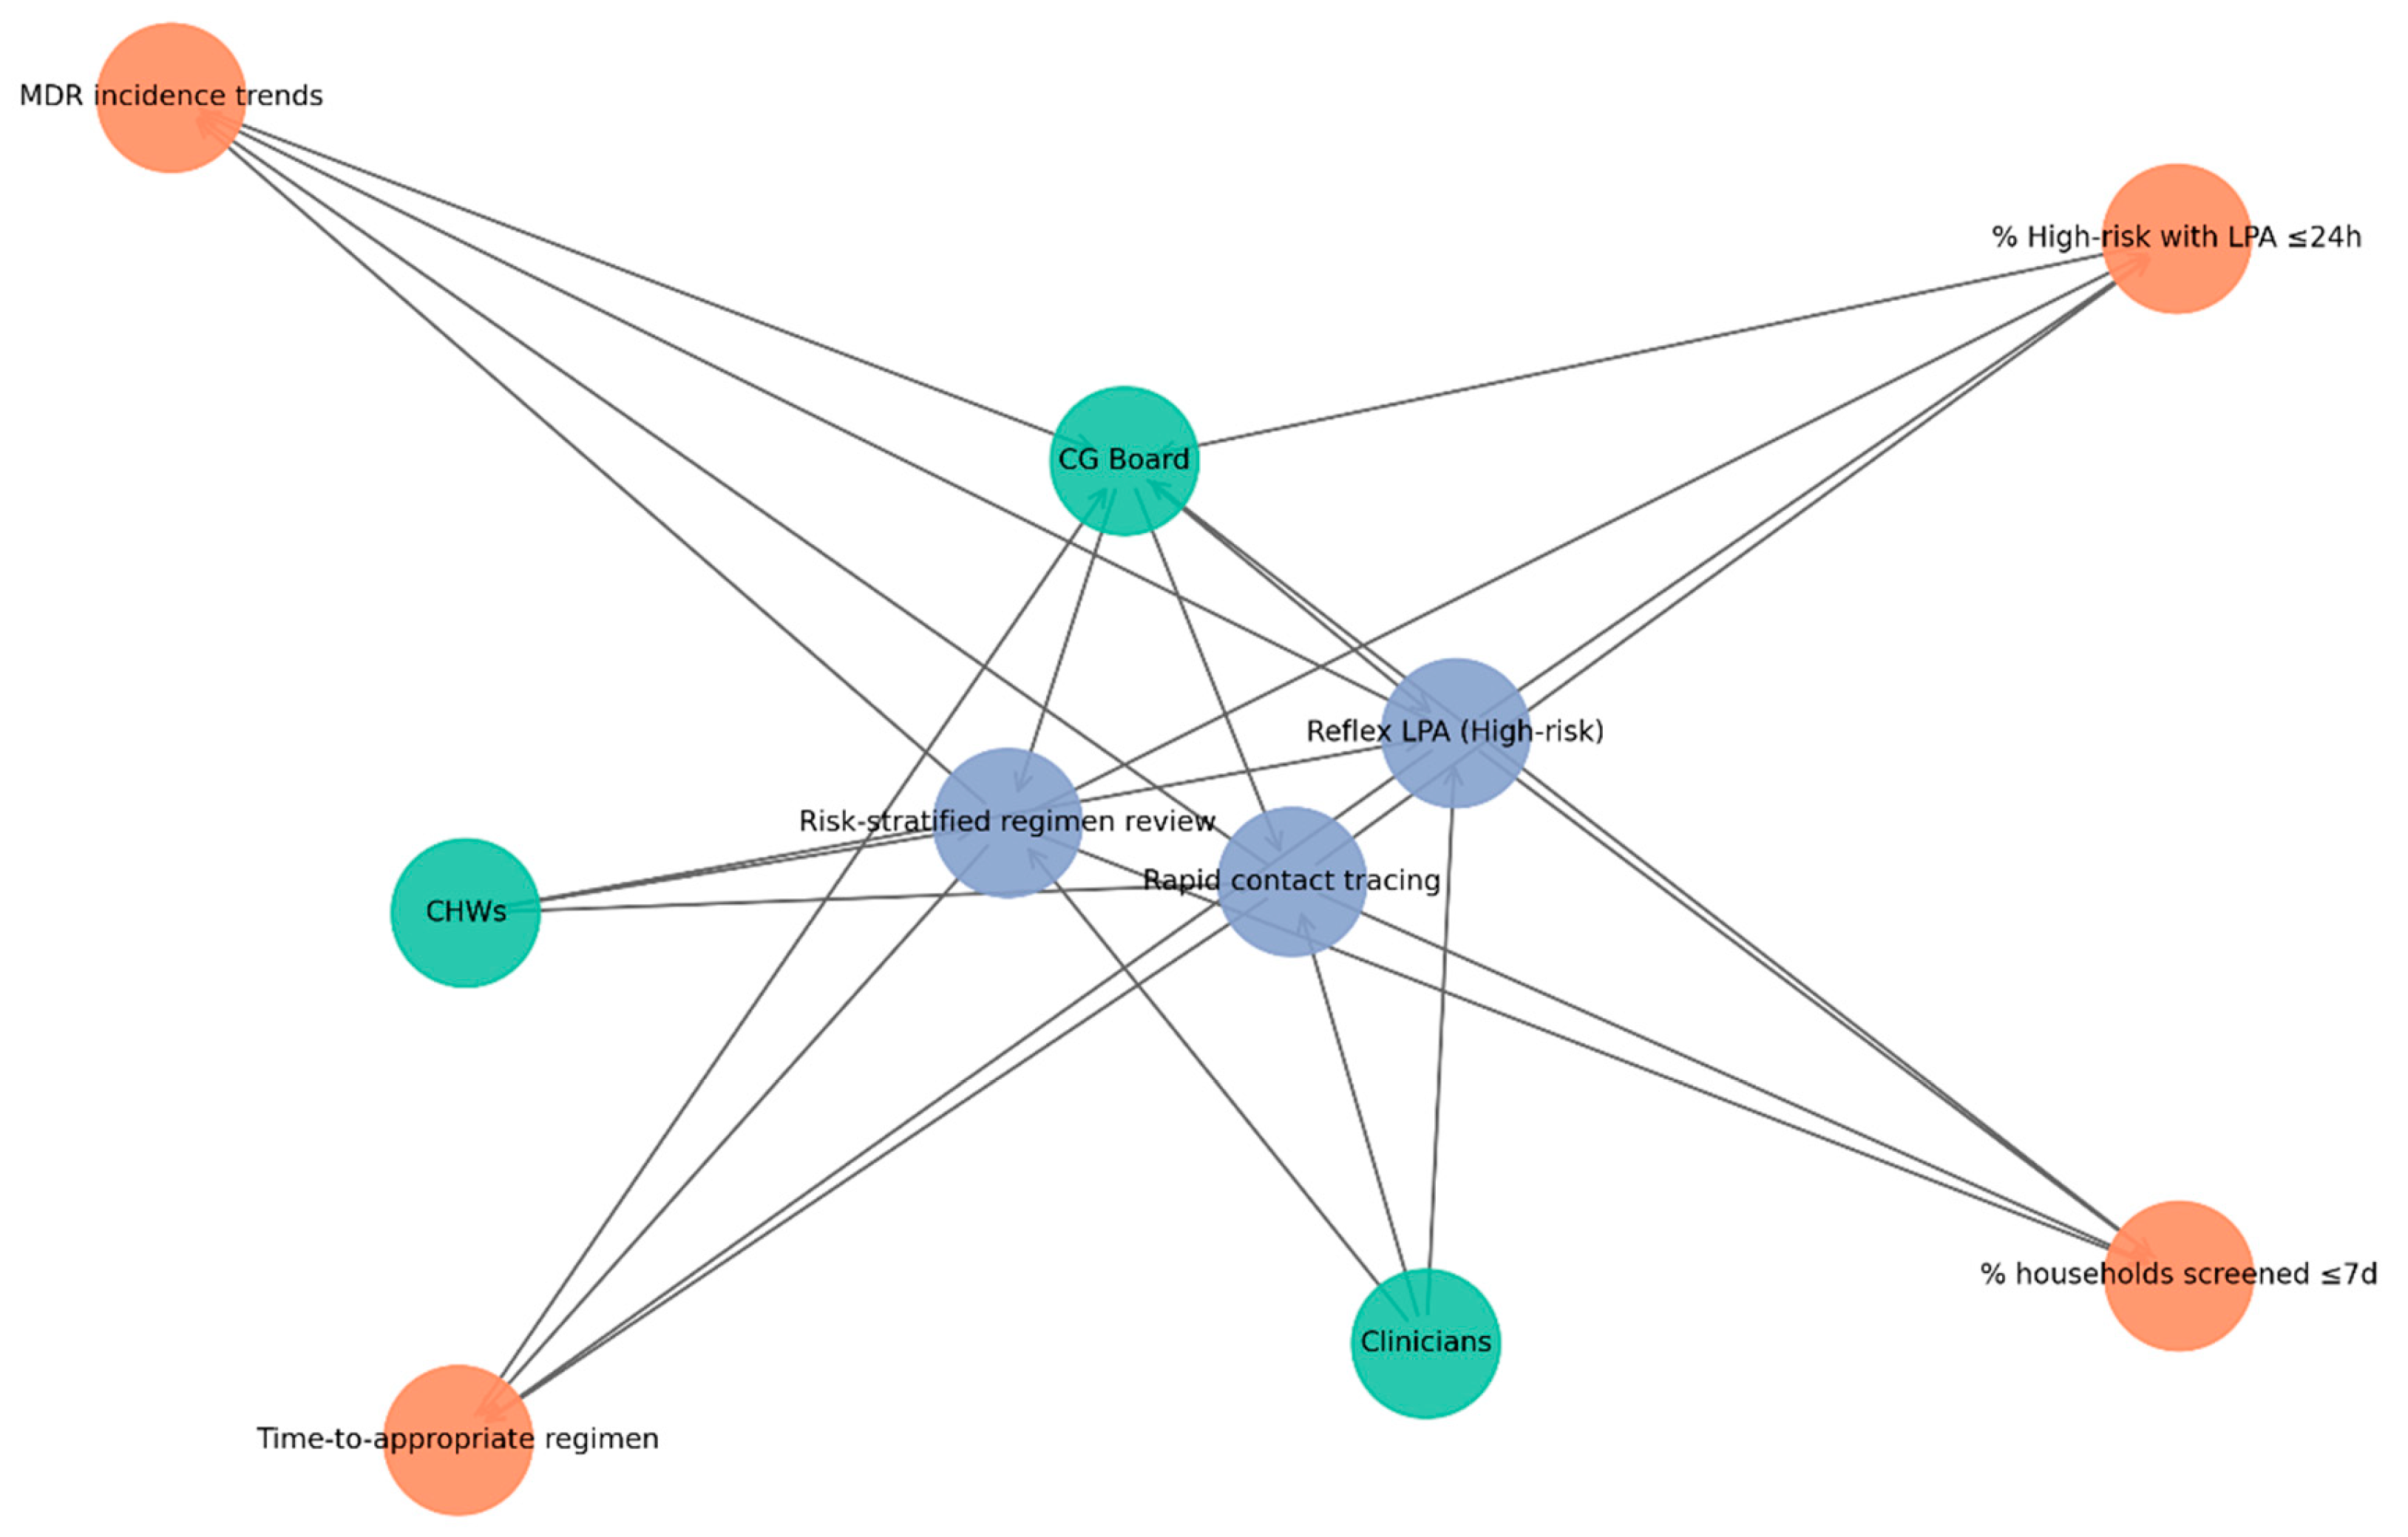
Figure 5.
Network of risk-stratified tuberculosis interventions mapped to key community actors and anticipated outcomes.
Figure 5.
Network of risk-stratified tuberculosis interventions mapped to key community actors and anticipated outcomes.
Disclaimer/Publisher’s Note: The statements, opinions and data contained in all publications are solely those of the individual author(s) and contributor(s) and not of MDPI and/or the editor(s). MDPI and/or the editor(s) disclaim responsibility for any injury to people or property resulting from any ideas, methods, instructions or products referred to in the content. |
© 2026 by the authors. Licensee MDPI, Basel, Switzerland. This article is an open access article distributed under the terms and conditions of the Creative Commons Attribution (CC BY) license.
Copyright: This open access article is published under a Creative Commons CC BY 4.0 license, which permit the free download, distribution, and reuse, provided that the author and preprint are cited in any reuse.


