
Submitted:
14 February 2026
Posted:
26 February 2026
You are already at the latest version
Abstract
Background: Leukaemia is a hematopoietic defect, and the development of this condition has a correlation with the hematopoietic receptor c-MPL. The function of c-MPL is mostly regulated by the crosstalk and stoichiometry of the different isoforms of c-MPL. Although expression of c-MPL in hematological disorders has been studied, the regulation of the isoforms, their balance, and the mechanism of action in conditions like acute and chronic leukaemias and myeloproliferative neoplasms need to be revealed to develop c-MPL as a therapeutic target for leukaemia cases. Methods: The association of c-MPL isoforms with increased tumorigenesis in leukaemia cells was examined using various molecular and cell biology techniques. The significance of the work depends on the statistical analysis of the experimental and technical triplicates. Results: The severity of the leukemic condition directly depends on the increased expression ratio of MPL-FL/MPL-TR. Furthermore, we have observed that with an increase in the MPL-FL/MPL-TR ratio, STAT5 activation increases to promote the transition of HSC from the G0 state to the HSC proliferative state, leading to an increase in the severity. Conclusion: Through this work, we have observed increased c-MPL expression in cells with hematopoietic disorders, but the severity of the condition is independent of the total MPL expression. Our study also provides compelling evidence for the regulatory role of c-MPL isoforms, particularly MPL-FL, in increasing disease severity in blood cancers. This finding is a significant step towards developing c-MPL as a therapeutic target for leukemic conditions like acute and chronic leukaemias and myeloproliferative neoplasms, but it needs a large-scale validation using AML patient samples.
Keywords:
c-MPL receptor
; AML condition
; STAT5 activation
; c-MPL isoforms
; Severity
; HSC proliferation
1. Introduction
Leukaemia is a group of hematological cancers arising from the uncontrolled proliferation of abnormal white blood cells. These abnormal non-functional immune cells take the pool of hematopoietic stem cells (HSCs) and occupy the space, resulting in improper production of normal white blood cells, platelets, and red blood cells from the bone marrow [1]. Leukaemia has been divided into several classes depending on its cell origin and maturity. Myeloid or myelogenous leukaemia describes cancers that impact cells from myeloid progenitors such as mast cells, neutrophils, basophils, eosinophils, erythrocytes, and macrophages. On the other hand, lymphoid or lymphoma refers to those that impact lymphocytes, such as T cells, B cells, and natural killer cells. Further classification of acute and chronic leukaemia is based on the immature hematopoietic cells and partially matured hematopoietic cells, respectively [2]. These defects in blood are maintained and initiated by a small subset of cells known as Leukaemia Stem Cells (LSCs), which can form tumour cells.
c-Myeloproliferative Leukaemia (c-MPL) is considered as the LSC surface marker, making the cells resistant to conventional therapy [3]. It is also well known for regulating hematopoiesis. It also plays a critical role in maintaining hematopoietic stem cells (HSCs) and is the key cytokine regulating the production of platelets from megakaryocytes [4]. The total MPL expression consists of MPL-Full length (FL) L (P), MPL-Truncated (Tr) or S, MPL-K, and MPL-del. It is a member of the hematopoietic growth factor receptor super-family, encodes the 635 amino acid protein c-MPL, which has a signal peptide domain, two extracellular cytokine receptor domains, a transmembrane domain and two intracellular cytokine receptor box motifs [5]. The c-MPL-FL, an isoform of this protein, is essential for the maintenance of hematopoietic stem cells (HSCs) and serves as the primary regulator of platelet production from megakaryocytes. It is the primary cell surface receptor required for TPO-mediated activation of JAK/STAT, MAP/ERK, and PI3K/AKT pathways. The c-MPL-FL lacking the transmembrane domain forms the truncated form (c-MPL-TR), and both these isoforms are conserved across species. This isoform regulates TPO-dependent signalling in an isoform-ratio-dependent manner. c-MPL-K arises due to premature termination in the unspliced region of intron 10 and doesn’t respond to TPO-mediated signalling. c-MPL-D, on the other hand, contains 24 amino acids less than compared to c-MPL -FL but dimerizes with c-MPL-FL and also promotes TPO binding and its internalization, leading to activation of different pathways [6]. Research work with the total MPL reveals oncogenic activating mutations in the receptor c-MPL and its functional abnormalities, which are associated with several haematological disorders [7,8,9,10,11]. Mutations, primarily in intracellular and transmembrane domains of c-MPL account for around 2% of the overall mutations in acute myeloid leukaemia (AML) [12]. A more prevalent mutation, W515L/K/K, contributes to increased cell proliferation in AML. This mutation has been reported to be present in around 25% of acute megakaryoblastic leukaemia (AMKL) cases, a sub-type of AML [13]. In addition, even in the absence of mutations, many AML patients express c-MPL, and the proliferation and survival of HSCs are enhanced in response to c-MPL. Overexpression of total c-MPL correlates with shorter and complete remission in patients with AML [14]. Additionally, patients with different types of leukaemia have increased c-MPL expression, which correlates with CD34 expression [15]. Furthermore, patients with c-MPL+ LSCs have a worse prognosis and are resistant to conventional chemo-therapies [3]. In Rac1-mediated leukaemia initiation and maintenance, the overexpression of total c-MPL plays a vital role in the interaction of leukaemia cells with the bone marrow (BM) niche and contributes to quiescence and chemotherapy resistance [16]. In few chronic myeloid leukaemia (CML) cases, mutations in the c-MPL genes are also observed [17]. An increase in c-MPL expression shows greater leukemic properties and resistance to BCR: ABL inhibitors in CML [18]. Expression of c-MPL was also found on the majority of B cell lines in an in vitro study, which suggests that the TPO/c-MPL interaction might play an important role in the growth and regulation of B-precursor leukaemia cells [19]. In acute Lymphoblastic leukaemia (T-ALL) conditions, c-MPL has been implicated in the self-renewal of both normal and leukemic stem cells, and its expression also contributes to chemo resistance and disease lapse [20].
All these studies demonstrate that there is high expression of c-MPL in leukemic cases, which increases the resistance towards conventional therapies and is also involved in maintaining stem cell-like properties of LSCs. However, the unexplored aspect is whether all these functions of c-MPL and its association with leukemogenesis are dependent on its specific isoform. Therefore, there is a need to understand the mechanism and interplay of the c-MPL isoforms in developing the severity in patients with leukaemic conditions. In this study, we explored the link between the expression of these isoforms and the severity.
2. Materials and Methods
2.1. Materials
The cell lines used in the study were primarily procured from NCCS Pune, except the PBMC cells, which were purchased from Himedia. The PBMCs were collected from a single healthy donor and taken as control cells, and ethical clearance was also provided by Himedia. PBMCs were used as a non-malignant hematopoietic reference population to compare relative c-MPL expression in leukemic cell lines. The antibodies used in the study were sourced from various sources: MPL and Ki67 from Invitrogen, STAT, pSTAT and Caspase from Cell Signalling Technology (CST), and CD44+ from Abcam. The antibodies and their concentrations used in the study are listed in Table 1. The cDNA synthesis kit and SyBr Green were purchased from Takara. The DAPI used in Immunofluorescence, Propidium Iodide (PI) and RNase A, used in cell cycle analysis, were all purchased from Himedia.
2.2. Cell Culture
The human leukemic cell lines like KG1 (AML), K562 (CML), HL60 (APML), Jurkat (ALL), and normal cells, PBMCs, were cultured in RPMI-1640 supplemented with 10% FBS, 1 mM sodium pyruvate, and 50 IU/ml antibiotics/antimycotics and maintained at 37 °C with 5% CO2. All the experiments were performed after the cells reached 70-75% confluency.
2.3. Preparation of Cell Lysates and Western Blot Analysis
The cells were treated under the appropriate conditions, quickly placed on ice, and washed with ice-cold PBS. After that, the cells were treated with RIPA lysis buffer (20 mM Tris HCl (pH 7.4), 150 mM NaCl, 5 mM EDTA, 1% Nonidet P-40, 1 mM Na3VO4) supplemented with proteinase inhibitor [21]. Sonication was performed for 3 min with 30 amps and a pulse of 10 sec on/off. Protein estimation was performed with Bradford’s reagent. 50 µg of protein was loaded for each cell line for β-actin, c-MPL, STAT5, and pSTAT5, and the results were analyzed by the chemo gel doc system software.
2.4. RNA Extraction and RT‒PCR
RNA extraction was performed using the TRIzol chloroform method, which was then quantified by a micro-volume spectrometer [22]. Reverse transcription for cDNA synthesis from 1 ug of total RNA was allowed to proceed at 37 °C for 15 min and 85 °C for 5 sec in a final volume of 20 µl. RT‒PCR of the cDNA (100 µg) was performed in a final volume of 10 µl containing 2X SYBR Green and 10 µM of forward and reverse primers for the c-MPL, β-actin, and Bcl-2 genes (Table 2).
2.5. Cell Cycle Analysis
The cells were seeded overnight in a 60 mm dish. Then, 0.5 million cells/ml were collected in an Eppendorf tube and washed with PBS. The cells were then fixed in ethanol at -20 °C for 1 hr. After washing with PBS, the cells were incubated in a DNA staining solution containing 0.5 mg/ml PI, 0.1% sodium citrate, 2% Triton X-100, and 2 mg/ml RNase A for 20 min in the dark [23]. Cell cycle analysis was then performed using Guava flow cytometry (Merck, Millipore, FCS version 7.0).
2.6. Immunofluorescence
The expression of the cell surface marker c-MPL was analyzed by an immunofluorescence assay with the following protocol: 0.5 million/ml cells were washed with PBS, then fixed with 4% PFA (Paraformaldehyde) and incubated at RT in the dark for 20 min at 37 °C. The supernatant was discarded after centrifugation, and the cells were then treated with a permeabilization agent (0.1% Triton X-100 in 1X PBS) and incubated at RT for 15 min, followed by washing with PBS. Blocking was performed with 2% BSA in 1X PBS for 1 hr. Primary antibody incubation was performed in 0.1% BSA in 1X PBS overnight at 4 °C. After washing, the cells were incubated with a fluorescently tagged secondary Alexa Fluor 488 antibody in 1X PBS for 1 hr. The cells were then stained with DAPI after a 1X PBS wash and incubated at room temperature for 20 min. followed by mounting on a slide and visualization via fluorescence microscopy.
2.7. Immunophenotyping
A total of 0.5 million cells were collected, washed with PBS, followed by 15 min of incubation in FACS staining buffer [Fetal Bovine Serum (2%), PBS (96%), 0.5M EDTA (1%), and Penicillin/Streptomycin (1%)] used for flow cytometry analysis. The supernatant was discarded after centrifugation, and the cells were then treated with a permeabilizing agent (0.1% Triton X-100 in 1X PBS) and incubated at RT for 15 min, followed by washing with 1X PBS. Blocking was performed with 2% BSA in 1X PBS for 1 hr. The cells were then incubated in FACS buffer stain, followed by incubation in the primary antibody at 4 °C overnight. Then, the cells were incubated with Alexa Fluor 488, a fluorescent-tagged secondary antibody, for 1 hr at RT. The cells were then washed, and fresh FACS buffer was added. The data were acquired through Guava flow cytometry (Merck, Millipore, FCS version 7.0).
2.8. Clonogenic Assay
To grow suspension cell colonies, a base layer was prepared by mixing an equal volume of 1% low-melting agarose with complete RPIM-1640 media kept at 42 °C. This was poured into a 6-well plate and was allowed to solidify at room temperature for 10minutes. The top layer was prepared by suspending the cells (10,000) in pre-warmed complete media and mixing this 1:1 with 0.6% low-melting agarose. Plates were kept at room temperature for 5-10 minutes until solidified completely. Above the agar, 1.5 ml of media was added, and the plates were transferred to the incubator maintained at 37 °C with 5% CO2. Fresh media was added twice a week to keep the cell healthy. Colonies were allowed to develop for 10 days, after which they were visualized by staining with crystal violet, and counted by Image J software.
2.9. Statistical Analysis
All experimental data are presented as mean ± SEM and were obtained from at least three independent experiments. Statistical analysis was performed using Graph Pad Prism version 8.4.3 (GraphPad Software, San Diego, CA, USA). Comparisons among groups were conducted using one-way or two-way analysis of variance (ANOVA) followed by post hoc analysis, as appropriate, to identify statistically significant differences. A p-value of less than 0.05 was considered statistically significant.
3. Results and Discussion
3.1. Over-Expression of Total c-MPL in Different Leukaemic Cell Lines Compared to WT Cells
The c-MPL receptor maintains the proliferative and quiescent state of HSCs [24]. To understand the correlation between leukaemia with c-MPL and its isoforms, we explored the relative expression of c-MPL in various leukaemia cell lines and normal PBMCs . As both myeloid and lymphoid cells originate from the common progenitor cells, i.e., HSC, we performed in vitro analysis with different leukemic cell lines representing KG1 (AML), K-562 (CML), HL-60 (APL-AML), and Jurkat (T-ALL), along with peripheral blood mononuclear cells (PBMC’s) as a control to check the c-MPL expression [25,26]. Our findings revealed that all leukaemia cell lines expressed significantly greater levels of c-MPL than the control cells. Among these, the HL60 and Jurkat cell lines, which reflect the M2 stage of AML in the FAB categorization [27] and T-ALL, respectively, had the greatest amount of c-MPL expression. Immunofluorescence assays showed c-MPL proteins on the cell membrane, with stronger fluorescence signals in leukaemia cell lines than in PBMCs (Figure 1 A, B). Through qRT-PCR analysis, we further found that compared to the normal cells, all the leukaemia cell lines expressed more c-MPL. Furthermore, the expression of c-MPL in HL60 and Jurkat cells was found to be more compared to the other leukaemia lines KG1 and K562 (Figure 1 C). Similar results were obtained by analyzing the c-MPL expression through immunophenotyping in different cell lines (Figure 1 D, E). Collectively, these results validated the enhanced expression of c-MPL in leukaemia cell lines. Also, there is a variation in the overexpression of c-MPL within the leukaemia lines, particularly in the HL60 and Jurkat cell lines, providing a clue for the interplay of other factors in leukemic pathophysiology.
3.2. Different Leukaemia Cell Lines Exhibit Different Levels of Severity Even with Overexpression of c-MPL
After confirming that c-MPL was overexpressed in various leukaemia lines, compared to the normal PBMC cells, we next tried to understand the relationship between severity and enhanced c-MPL expression. We checked the cell cycle pattern in different leukemic cells. We found that most of the leukemic cells are either in pre-replicative stage (G1) or post-replicative stage G2/M in the cell cycle and spend less time in the S-phase compared to other phases This cell cycle pattern in leukaemia cell lines indicates its proliferative nature (Suppl. Figure 1 A, B). We confirmed the proliferative nature of these cell lines by studying the expression of the Ki-67 protein, a known cell proliferation marker. All of the leukaemia cell lines showed higher levels of Ki67 expression, compared to the normal cell (PBMC). Within the leukaemia cell lines, the HL60 cell line showed the highest levels of Ki67 expression, followed by Jurkat cells, indicating its more proliferative and aggressive nature (Figure 2 A, B). To further check the proliferative ability and carcinogenesis of these cell lines, which results in aggressiveness [28], we performed the clonogenic assay based on soft agar colony formation. We found that among all the cancerous cell lines, HL60 and Jurkat were showing the highest colony formation after 10 days of cell seeding compared to other cell lines (Figure 2 C, D). We evaluated the expression of Caspase-3 as well, to assess the differential severity of the leukaemia cell lines. Caspase-3 is an apoptotic marker whose expression decreases in severe AML cases [29]. We observed that less number of cells in the HL60 cell line exhibited Caspase-3 expression than the other leukaemia cell lines, indicating HL60 cells’ resistance to apoptosis, leading to the accumulation of tumor cells, hence, increasing the severity (Figure 2 E, F). Finally, we evaluated the expression of BCL-2 in leukaemia cell lines and PBMCs. Bcl-2 acts as an anti-apoptotic protein by stabilizing mitochondrial membrane integrity and release of cytochrome, which otherwise results in apoptosis [30]. It has also been reported that the Bcl-2 overexpression is related to the chemo-resistance in AML cases, making this gene also a target for therapeutic purposes [31]. We found that there is high Bcl-2 expression in leukemic cases compared to PBMCs, with HL60 and Jurkat having even higher expression, making them more severe (Figure 2 G). The severity was supported by the expression of the tumorogenic/stem cell marker CD44+ in different cell lines. Here also, we observed HL60 cell line had a noticeably higher number of cells with CD44 expression than the other leukaemia cell lines, again indicating the aggressiveness of the HL60 cell line (Suppl. Figure 2 A, B). So, despite the fact that all of the leukaemia lines had high levels of c-MPL expression, we discovered that the severity of the leukemic condition varies amongst them, as evidenced by indicators of stemness, apoptotic resistance, and proliferation. The HL60 cell line showed the highest expression of severity markers (high Ki67, CD44+ and Bcl-2 expression) when compared to the other leukaemia cell lines. This all indicates that, even with high c-MPL expression, the severity of leukaemia varies, supporting the existence of additional variables that influence severity.
3.3. The Severe Leukaemia Conditions Show an Increase in MPL-FL Isoforms
Even though we have confirmed the link between c-MPL expression and leukaemia, we demonstrated in the previous section that there is no correlation between total c-MPL expression and leukaemia severity. All leukemic cell lines showed high c-MPL expression relative to control cells, but only HL60 exhibited marked severity. To address the variations in severity, we focused on the expression status of c-MPL isoforms, mainly c-MPL-FL (full-length) and c-MPL-TR (truncated) instead of the total c-MPL. Studies have shown that the stoichiometric balance between c-MPL-FL and c-MPL-TR isoforms regulates hematopoiesis, i.e., the more the c-MPL-FL isoform, the more the proliferation of the hematopoietic stem cells and hence the severity of the leukemic condition [32]. We identified four isoforms of c-MPL through western blot analysis and found that c-MPL-FL expression was notably greater in the HL60 cells compared to other cell lines (Figure 3 A). Furthermore, c-MPL-FL was greater than c-MPL-TR in all the leukaemia lines. Specifically, c-MPL-FL levels were significantly elevated in the HL60 cell line compared to the other leukaemia cell lines (Figure 3. A, B). These data also confirmed that the ratio of c-MPL-FL to c-MPL-TR is greater in the HL60 cell line than in the other leukaemia lines or in the noncancerous line. In the previous section, we confirmed that the HL60 cell line shows the most severe leukemic condition compared to the other leukemic cell lines. This suggests that elevated c-MPL-FL expression correlates with increased STAT5 activation and proliferative potential, particularly in HL60 cell line. To further confirm these findings, we performed RT-PCR analysis of c-MPL isoforms with isoform-specific primers (Table. 2). The results showed that the expression of c-MPL, particularly c-MPL-FL transcripts, was greater in HL60 and Jurkat leukaemia cell lines among all the other leukaemia cell lines, confirming the western blot results and the statement that the c-MPL-FL isoform might play the role of bringing in severity in leukaemia (Figure 3 C). Conversely, the experiments show that the expression of the truncated isoform c-MPL-TR was significantly lower. This increase in the imbalance between the expression of c-MPL isoforms contributes to the aggressiveness of leukaemia.
3.4. Overexpression of c-MPL-FL Exacerbates Leukemic Conditions Through Activation of the STAT Pathway
In this section, we have established the mechanism of development of severity by the overexpression of the c-MPL-FL isoform. STAT5, a critical downstream molecule activated by the dimer of c-MPL-FL, which, when phosphorylated to pSTAT5, acts as a transcription factor promoting cell proliferation [33]. As the c-MPL-TR isoform doesn’t have the trans membrane domain, it is unable to reach the cell membrane, resulting in less expression of c-MPL and downregulating the TPO-mediated proliferation of HSCs. This absence of TPO/ c-MPL-TR interaction inhibits the internalization of TPO for the activation of the downstream processes. Sometimes, constitutive activation of c-MPL happens in the absence of TPO binding due to mutations in the extracellular or cytoplasmic juxtamembrane regions. Because of the absence of both the juxtamembrane and transmembrane regions, the truncated isoform is capable of regulating both the TPO dependent and TPO independent ways of activation of c-MPL (Figure 4). To study the activation of the downstream pathways by overexpressed c-MPL-FL isoforms in HL60 and Jurkat cells, we examined its effect on its downstream effector molecules through immunophenotyping experiments. We found that compared to the normal cell (PBMCs), the levels of STAT5 in the leukaemia cell lines were greater (Figure 5 A). While the inactive STAT5 levels were relatively low in HL60 cells, the levels of pSTAT5 were significantly higher in this cell line compared to the other leukemic cell lines (Figure 5 B, C). The activation of STAT5 was further confirmed by western blot analysis. The intensity of the STAT5 band in the western blot was significantly lower in HL60 cells compared to the other leukemic cells (Figure 5 D, E), whereas the phosphorylated STAT5 expression was significantly higher in the HL60 line (Figure 5 F, G). This indicates that the cells with high c-MPL-FL isoforms (HL60 and Jurkat) activate the STAT5 more, leading to stronger proliferative and transcriptionally active signals and hence add to the severity of the leukemic condition. Through this study, we were able to establish a strong correlation between c-MPL-FL and STAT5 activation, followed by cell proliferation in terms of leukaemia severity. Both inactive and phosphorylated STAT levels were low in normal cells, suggesting that the activation of STAT5 is linked to the proliferation of cancerous cells.
4. Discussion and Conclusions
The present study examines the role of c-MPL isoforms, instead of the total c-MPL, in modulating the severity of leukaemia. c-MPL is a key regulator of hematopoietic stem cell maintenance and megakaryopoiesis. Irregularites in c-MPL have been found in various malignant haematological disorders. Through this study, we established a correlation between the hematopoietic receptor c-MPL and AML using in vitro studies. Our study also demonstrated that there is high expression of c-MPL in leukemic cell lines, with the highest in the HL60 cell line, which suggests that c-MPL might play an important role in disease progression (Figure 4). We have also observed that, even though there is high expression of c-MPL in certain leukaemia cases but the severity of AML condition increases with increasing c-MPL-FL isoform levels (Figure 4). Previous studies have suggested that regulating the two isomers of c-MPL plays an important role in megakaryocyte development and hematopoiesis [34]. A knockout model of the spliceosome-associated Ott1 gene demonstrated that Ott1 binds to c-MPL pre-mRNA and regulates splicing between c-MPL-TR and c-MPL-FL in HSCs by regulating epigenetic marks. The activation of STAT5, a critical downstream effector of the TPO/MPL axis, is dramatically reduced in c-MPL-stimulated Ott1-/- HSCs. HSCs expressing a greater ratio of c-MPL-TR:c-MPL-FL have dramatically reduced engraftment when transplanted [35]. Our work also suggests that the tumorogenic markers (Ki67, CD44) increase in those leukemic conditions that contain high expression of c-MPL-FL isoform (Figure 2 and Figure 3). An increase in the c-MPL-FL isoform disturbs the stoichiometric balance of c-MPL-FL and c-MPL-TR on HSCs, leading to a more proliferative state [35]. A high level of c-MPL-FL results in increased c-MPL dimer formation, which internalizes more TPO to activate the JAK-STAT pathway and promote random proliferation of HSCs, resulting in more severe disease [36]. On the contrary, the truncated c-MPL can lead to deregulation of proliferative hematopoietic stem cells, and as a result, it can maintain the reservoir for hematopoietic stem cells in the G0 phase, which can play a major role in preventing megakaryocyte malignancies [35]. We have also observed that high levels of pSTAT5 in leukaemia cells with high c-MPL-FL, even in the absence of TPO, which the ligand typically requires for c-MPL activation (Figure 5). This suggests that the STAT pathway is constitutively activated in leukaemia cells in which there is abundant c-MPL-FL, likely due to the formation of ample c-MPL dimers in the absence of TPO, which results in continuous signalling through the c-MPL/JAK/STAT pathway. c-MPL-TR and c-MPL-FL are conserved among different species, which confirms the importance of their presence and role in hematopoiesis [37]. Our observations also confirmed the role of the ratio of c-MPL-TR to c-MPL-FL in maintaining the G0 and proliferative states of HSCs. In the case of malignancies due to defects in hematopoiesis, the balance between the two isoforms is affected. This loss of the stoichiometric balance of c-MPL-FL and c-MPL-TR may drive the uncontrolled cell proliferation characteristic of leukaemia, making c-MPL-FL a critical target for understanding the disease mechanisms and potentially developing targeted therapies. Therefore, future studies focusing on isoform-specific genetic manipulation, large-scale clinical validation of c-MPL isoform ratios, and therapeutic strategies for restoring this balance through antisense oligonucleotide-mediated splice switching may provide a rational framework for developing targeted and precision-based interventions for leukaemia.
Author Contributions
MAH: Writing original draft, Data Curation, conducting experiments, Analyzing, Referencing, and figure designing.MK: Reviewing, conducting experiments and editing the figures.SL: Conceptualization, Structuring, Funding acquisition, Supervision, Resources, Writing original draft, reviewing, Editing, Project Administration.
Funding
The funding from ICMR (Indian Council of Medical Research) to SL (Project No.-5/13/31/2018/NCD-III) was received for executing the study and performing the related research activities. We would also like to mention the Seed grant project to SL (YU/Seed grant/132-2022) by the Yenepoya (Deemed to be) University for providing the initial laboratory setup.
Data Availability Statement
The data supporting this study’s findings will be available upon reasonable request.
Acknowledgments
We would like to acknowledge Yenepoya Deemed to be a University for providing the Seed grant project and the facility to carry out the research and partially providing the fellowship to Mr. Amjad Hussain to carry out the research activities. We would also like to acknowledge the Indian Council of Medical Research (ICMR) for providing the fellowship to AH. We would like to acknowledge Ms. Sushma Atri for helping with the setting up of some experiments.
Conflicts of Interest
The authors declare that they have no known competing financial interests or personal relationships that could have appeared to influence the work reported in this paper.
References
- Nemkov, T; D’Alessandro, A; Reisz, JA. Metabolic underpinnings of leukemia pathology and treatment. Cancer Reports 2019, 2(2), e1139. [Google Scholar] [CrossRef] [PubMed]
- Kondo, M. Lymphoid and myeloid lineage commitment in multipotent hematopoietic progenitors. Immunological reviews 2010, 238(1), 37–46. [Google Scholar] [CrossRef] [PubMed]
- Li, H; Zhao, N; Li, Y; Xing, H; Chen, S; Xu, Y; Tang, K; Tian, Z; Wang, M; Rao, Q; Wang, J. c-MPL is a candidate surface marker and confers self-renewal, quiescence, chemotherapy resistance, and leukemia initiation potential in leukemia stem cells. Stem Cells 2018, 36(11), 1685–96. [Google Scholar] [CrossRef]
- Ng, A.P.; Kauppi, M.; Metcalf, D.; Hyland, C.D.; Josefsson, E.C.; Lebois, M.; Zhang, J.G.; Baldwin, T.M.; Di Rago, L.; Hilton, D.J.; Alexander, W.S. Mpl expression on megakaryocytes and platelets is dispensable for thrombopoiesis but essential to prevent myeloproliferation. Proceedings of the National Academy of Sciences 2014, 111(16), 5884–5889. [Google Scholar] [CrossRef]
- Hitchcock, I.S.; Hafer, M.; Sangkhae, V.; Tucker, J.A. The thrombopoietin receptor: revisiting the master regulator of platelet production. Platelets 2021, 32(6), 770–778. [Google Scholar] [CrossRef] [PubMed]
- Hussain, MA; Das, SP; Kulkarni, M; Laha, S. A review on the functional characteristics of the c-Myeloproliferative Leukaemia (c-MPL) gene and its isoforms. Cellular Oncology 2024, 47(5), 1607–26. [Google Scholar] [CrossRef]
- Pikman, Y.; Lee, B.H.; Mercher, T.; McDowell, E.; Ebert, B.L.; Gozo, M.; Cuker, A.; Wernig, G.; Moore, S.; Galinsky, I.; DeAngelo, D.J. MPLW515L is a novel somatic activating mutation in myelofibrosis with myeloid metaplasia. PLoS medicine 2006, 3(7), e270. [Google Scholar] [CrossRef]
- Ding, J.; Komatsu, H.; Wakita, A.; Kato-Uranishi, M.; Ito, M.; Satoh, A.; Tsuboi, K.; Nitta, M.; Miyazaki, H.; Iida, S.; Ueda, R. Familial essential thrombocythemia associated with a dominant-positive activating mutation of the c-MPL gene, which encodes for the receptor for thrombopoietin. Blood 2004, 103(11), 4198–4200. [Google Scholar] [CrossRef]
- Wang, T; Wang, Z; Yang, R. Thrombopoietic growth factors in the treatment of immune thrombocytopenic purpura. Critical reviews in oncology/hematology 2011, 77(3), 172–83. [Google Scholar] [CrossRef]
- Duensing, S.; Duensing, A.; Meran, J.G.; Kreft, A.; Büsche, G.; Ganser, A.; Georgii, A. Molecular detection of c-MPL thrombopoietin receptor gene expression in chronic myeloproliferative disorders. Molecular Pathology 1999, 52(3), 146. [Google Scholar] [CrossRef]
- Bridgford, J.L.; Lee, S.M.; Lee, C.M.; Guglielmelli, P.; Rumi, E.; Pietra, D.; Wilcox, S.; Chhabra, Y.; Rubin, A.F.; Cazzola, M.; Vannucchi, A.M. Novel drivers and modifiers of MPL-dependent oncogenic transformation identified by deep mutational scanning. Blood, The Journal of the American Society of Hematology 2020, 135(4), 287–292. [Google Scholar] [CrossRef]
- Chen, Y.; Xie, J.; Shen, Z.; Shi, J.; Chen, S.; Wang, G. Clinical and molecular characteristics of acute myeloid leukemia with MPL mutation. Hematology 2022, 27(1), 530–534. [Google Scholar] [CrossRef] [PubMed]
- He, X.; Chen, Z.; Jiang, Y.; Qiu, X.; Zhao, X. Different mutations of the human c-MPL gene indicate distinct haematopoietic diseases. Journal of Hematology & Oncology 2013, 6, 1–8. [Google Scholar] [CrossRef] [PubMed]
- Yu, P.; Qiu, S.W.; Rao, Q.; Lin, D.; Xing, H.Y.; Tang, K.J.; Tian, Z.; Wang, M.; Wang, J.X. Expression of c-MPL in leukemic stem cells from acute myeloid patients. Zhongguo shi yan xue ye xue za zhi 2012, 20(5), 1052–1055. [Google Scholar]
- Albitar, M.; Manshouri, T.; Kantarjian, H.; Keating, M.; Estrov, Z.; Faber, J.; Freireich, E.J.; Pierce, S.; Estey, E. Correlation between lower c-MPL protein expression and favorable cytogenetic groups in acute myeloid leukemia. Leukemia research 1999, 23(1), 63–69. [Google Scholar] [CrossRef]
- Wang, J.Y.; Yu, P.; Chen, S.; Xing, H.; Chen, Y.; Wang, M.; Tang, K.; Tian, Z.; Rao, Q.; Wang, J. Activation of Rac1 GTPase promotes leukemia cell chemotherapy resistance, quiescence and niche interaction. Molecular oncology 2013, 7(5), 907–916. [Google Scholar] [CrossRef] [PubMed]
- Klairmont, MM; Cheng, J; Schwartzberg, L; Ho, HH; Gradowski, JF. Chronic myeloid leukemia, BCR-ABL1-positive with CALR and MPL mutations. International Journal of Laboratory Hematology 2018, 40(3). [Google Scholar] [CrossRef]
- Zhang, B; Li, L; Ho, Y; Li, M; Marcucci, G; Tong, W; Bhatia, R. Heterogeneity of leukemia-initiating capacity of chronic myelogenous leukemia stem cells. The Journal of clinical investigation 2016, 126(3), 975–91. [Google Scholar] [CrossRef]
- Iijima, K; Sugita, K; Inukai, T; Goi, K; Tezuka, T; Uno, K; Sato, H; Kagami, K; Nakazawa, S. Expression of thrombopoietin receptor and its functional role in human B-precursor leukemia cells with 11q23 translocation or Philadelphia chromosome. Leukemia 2000, 14(9), 1598–605. [Google Scholar] [CrossRef]
- Yamazaki, H; Nishida, H; Iwata, S; Dang, NH; Morimoto, C. CD90 and CD110 correlate with cancer stem cell potentials in human T-acute lymphoblastic leukemia cells. Biochemical and biophysical research communications 2009, 383(2), 172–7. [Google Scholar] [CrossRef]
- Katheeja, M.N.; Das, S.P.; Das, R.; Laha, S. BRCA1 interactors, RAD50 and BRIP1, as prognostic markers for triple-negative breast cancer severity. Frontiers in Genetics 2023, 14, 1035052. [Google Scholar] [CrossRef]
- Adel, A.; Djida, A.A.; Hamid, N.; Lila, B.H.; Souhil, T.; Abderrezak, G.; Idir, B. TRIzol-Based RNA extraction for detection protocol for SARS-CoV-2 of the coronavirus Disease 2019. In New Microbes and New Infections.
- Laboratory Techniques in Cellular and Molecular Medicine; Hajdúch, M., Drábek, J., Eds.; Palacky University Olomouc, 2021. [Google Scholar]
- Yoshihara, H.; Arai, F.; Hosokawa, K.; Hagiwara, T.; Takubo, K.; Nakamura, Y.; Gomei, Y.; Iwasaki, H.; Matsuoka, S.; Miyamoto, K.; Miyazaki, H. Thrombopoietin/MPL signaling regulates hematopoietic stem cell quiescence and interaction with the osteoblastic niche. Cell stem cell 2007, 1(6), 685–697. [Google Scholar] [CrossRef]
- Maktoof, S.A.; Al-Ammar, N.S.; Al-Kashwan, T.A.; Jumaa, A.K.; Bader, P.; Kreyenberg, H. The expressions of myeloid differentiation and non-lineage specific differentiation antigens among FAB subtypes of acute myeloid leukemia in Iraqi patients. Romanian medical JouRnal 2024, 71(4). [Google Scholar] [CrossRef]
- Jensen, H.A.; Yourish, H.B.; Bunaciu, R.P.; Varner, J.D.; Yen, A. Induced myelomonocytic differentiation in leukemia cells is accompanied by noncanonical transcription factor expression. FEBS open bio 2015, 5, 789–800. [Google Scholar] [CrossRef] [PubMed]
- Skopek, R.; Palusińska, M.; Kaczor-Keller, K.; Pingwara, R.; Papierniak-Wyglądała, A.; Schenk, T.; Lewicki, S.; Zelent, A.; Szymański, Ł. Choosing the right cell line for acute myeloid leukemia (AML) research. International journal of molecular sciences 2023, 24(6), 5377. [Google Scholar] [CrossRef]
- Borowicz, S; Van Scoyk, M; Avasarala, S; Rathinam, MK; Tauler, J; Bikkavilli, RK; Winn, RA. The soft agar colony formation assay. Journal of visualized experiments: JoVE 2014, 27(92), 51998. [Google Scholar]
- Wu, Y.; Zhao, B.; Chen, X.; Geng, X.; Zhang, Z. Circ_0009910 sponges miR-491-5p to promote acute myeloid leukemia progression through modulating B4GALT5 expression and PI3K/AKT signaling pathway. International journal of laboratory hematology 2022, 44(2), 320–332. [Google Scholar] [CrossRef]
- Salavatipour, MS; Kouhbananinejad, SM; Lashkari, M; Bardsiri, MS; Moghadari, M; Kashani, B; Farsinejad, A; Vahidi, R. Kermanian propolis induces apoptosis through upregulation of Bax/Bcl-2 ratio in acute myeloblastic leukemia cell line (NB4). Journal of Cancer Research and Therapeutics 2023, 19(2), 327–34. [Google Scholar] [CrossRef] [PubMed]
- Mehta, SV; Shukla, SN; Vora, HH. Overexpression of Bcl-2 protein predicts chemoresistance in acute myeloid leukemia: its correlation with FLT3. Neoplasma 2013, 60(6), 666–75. [Google Scholar] [CrossRef]
- Coers, J; Ranft, C; Skoda, RC. A truncated isoform of c-MPL with an essential C-terminal peptide targets the full-length receptor for degradation. Journal of Biological Chemistry 2004, 279(35), 36397–404. [Google Scholar] [CrossRef] [PubMed]
- Wang, Z.; Bunting, K.D. STAT5 in hematopoietic stem cell biology and transplantation. Jak-stat 2013, 2(4), e27159. [Google Scholar] [CrossRef] [PubMed]
- Kaushansky, K. The molecular mechanisms that control thrombopoiesis. The Journal of clinical investigation 2005, 115(12), 3339–3347. [Google Scholar] [CrossRef]
- Xiao, N.; Laha, S.; Das, S.P.; Morlock, K.; Jesneck, J.L.; Raffel, G.D. Ott1 (Rbm15) regulates thrombopoietin response in hematopoietic stem cells through alternative splicing of c-MPL. Blood, The Journal of the American Society of Hematology 2015, 125(6), 941–948. [Google Scholar] [CrossRef]
- Spivak, J.L.; Moliterno, A.R. The thrombopoietin receptor, MPL, is a therapeutic target of opportunity in the MPN. Frontiers in Oncology 2021, 11, 641613. [Google Scholar] [CrossRef] [PubMed]
- Skoda, R.C.; Seldin, D.C.; Chiang, M.K.; Peichel, C.L.; Vogt, T.F.; Leder, P. Murine c-mpl: a member of the hematopoietic growth factor receptor superfamily that transduces a proliferative signal. The EMBO journal 1993, 12(7), 2645–2653. [Google Scholar] [CrossRef] [PubMed]
Figure 1.
Total c-MPL is expressed more in different leukemic cell lines compared to the control line. (A) Immunofluorescence assays revealed the c-MPL protein expression in different cell lines. Blue panels demonstrate the DAPI, whereas green panels depict the c-MPL expression. The third panel is the merged images of DAPI and c-MPL. (B) This figure represents the quantification of the immunofluorescence between different cell lines. (C) The bar graph in the figure represents the mRNA expression of total c-MPL through RT-PCR. X-axis represents the different cell lines whereas Y-axis represent depicts relative mRNA expression. (D, E) The figures are the histogram and bar graph representation of the c-MPL expression through immunophenotyping and its analysis, which shows the c-MPL expression in unstained and stained samples. The different cell lines are mentioned in the X-axis, whereas the Y-axis represents the expression in percentage. The stars present in the graph represent the relative statistical significance (p) (**p˂0.01, *** p˂0.001, ****p˂0.0001).
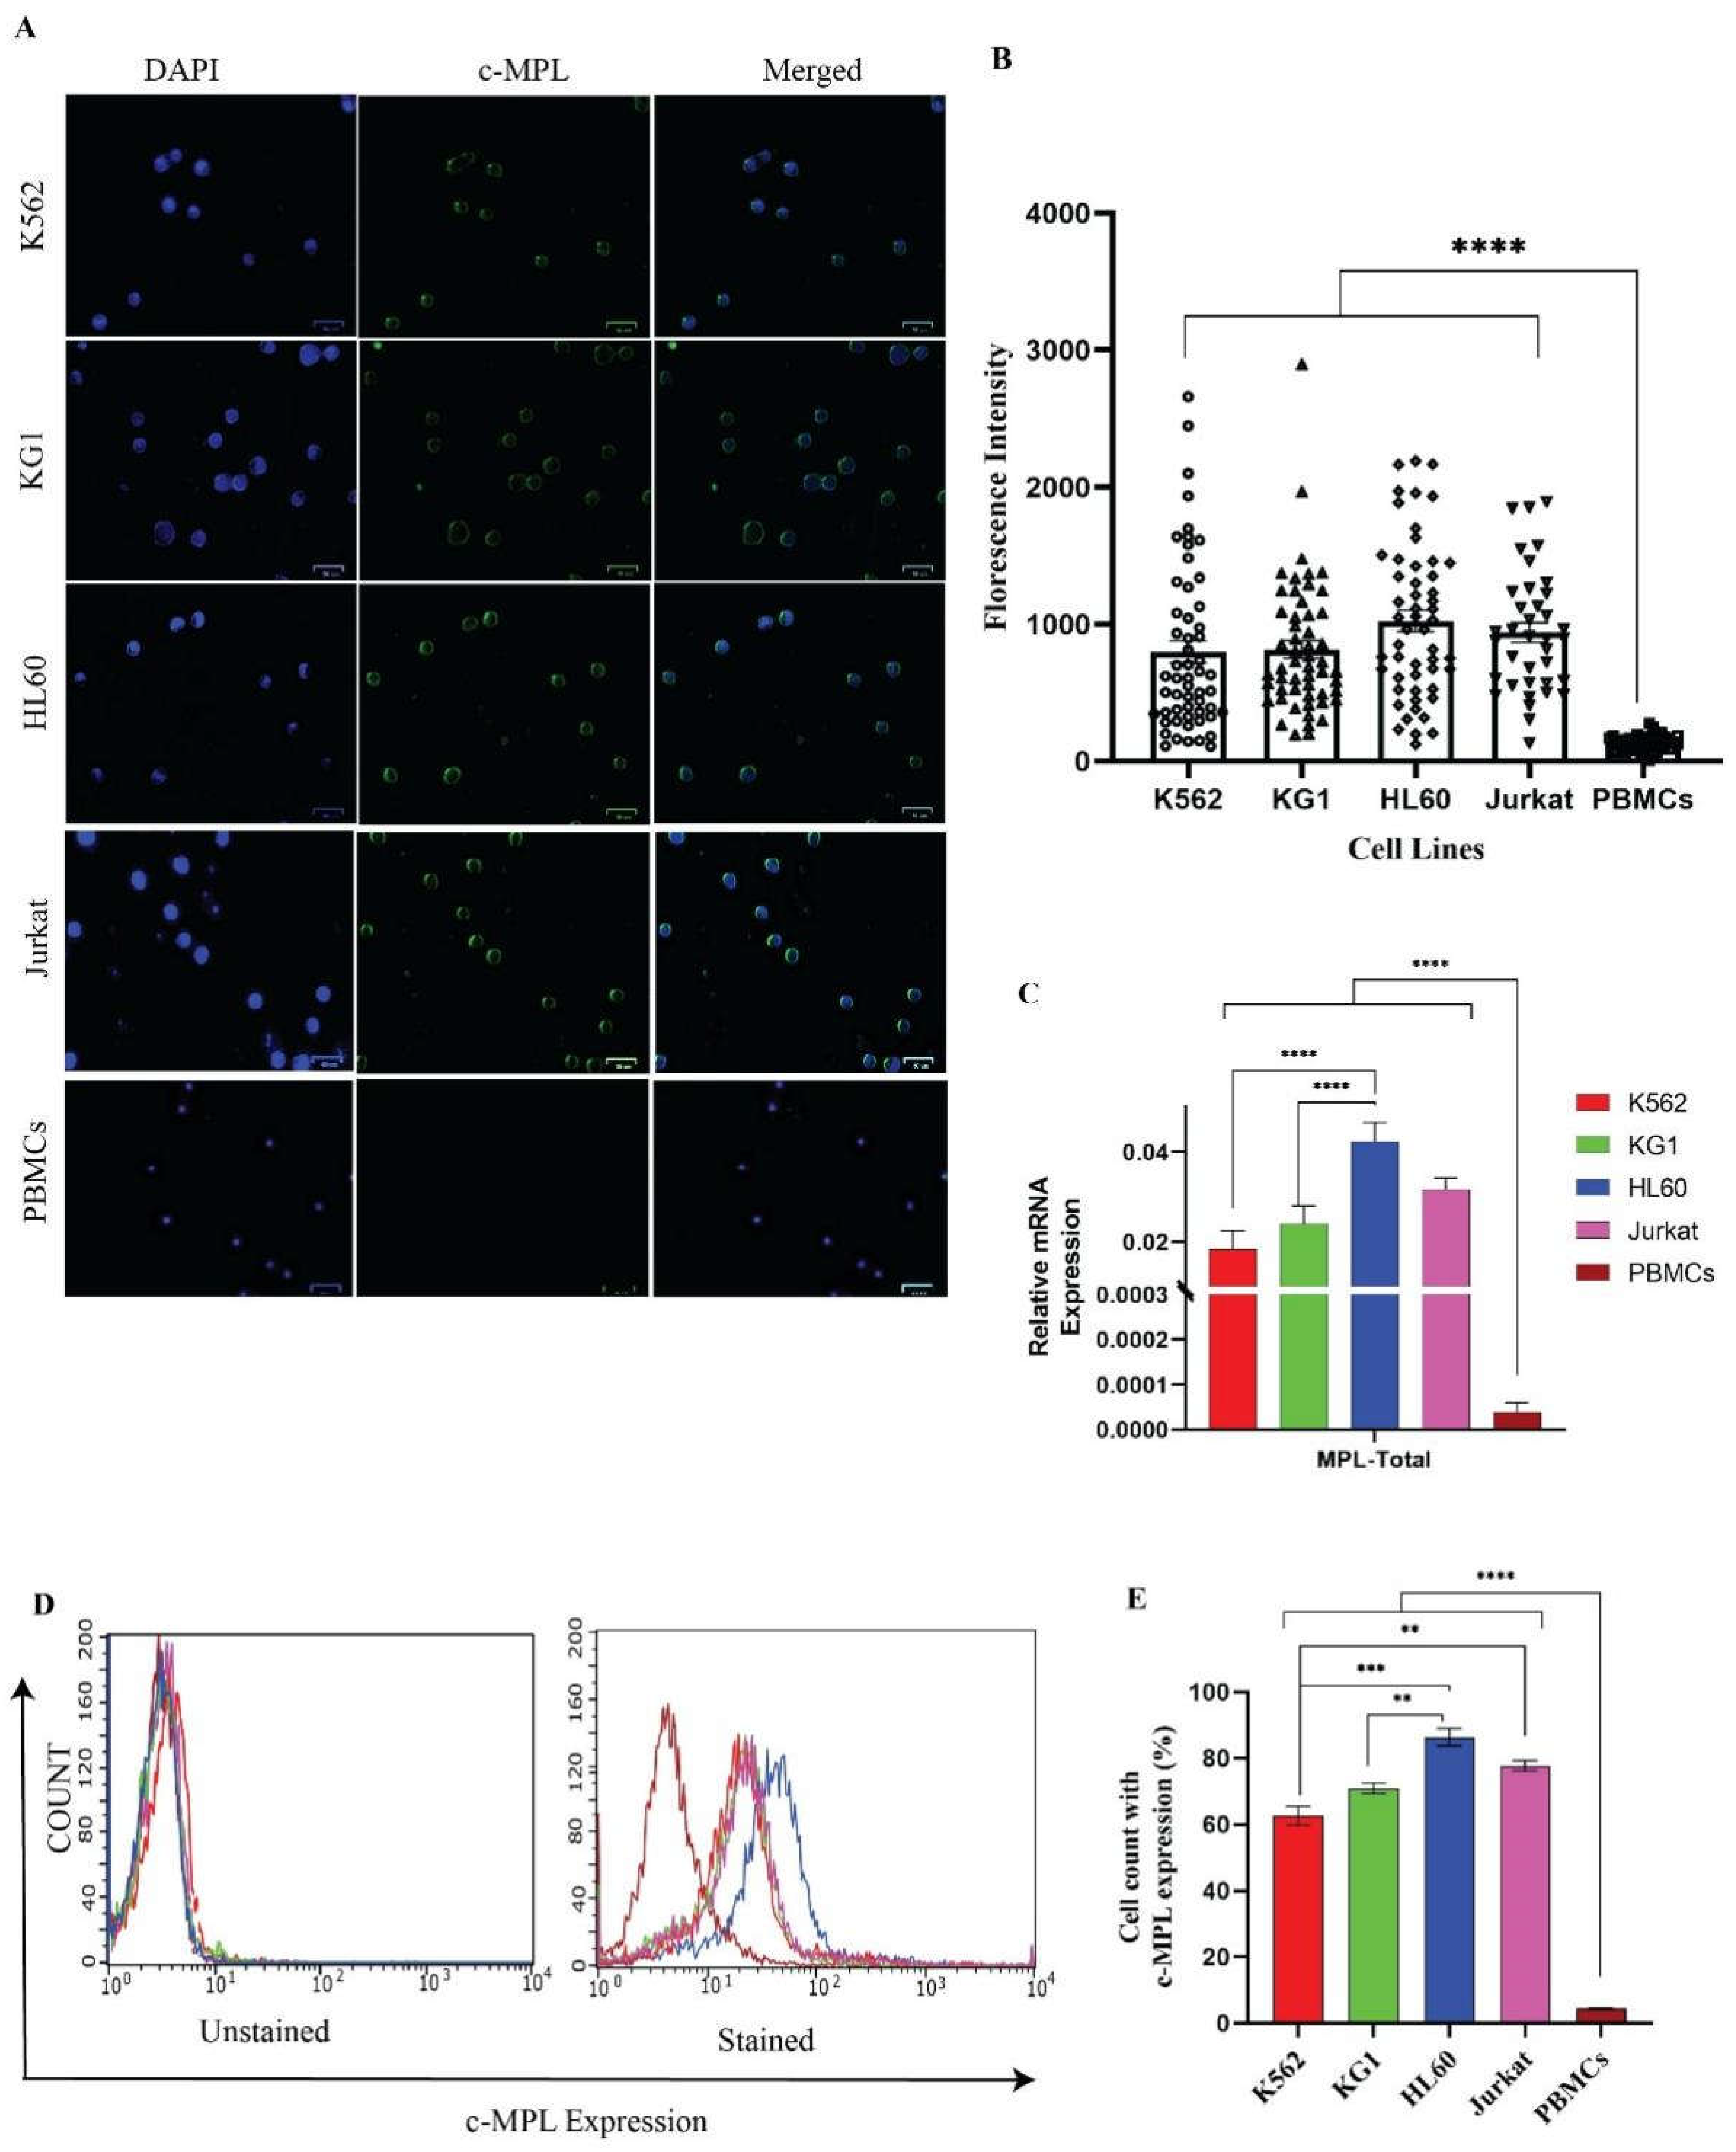
Figure 2.
Different leukaemia cell lines exhibit different levels of severity even with overexpression of c-MPL. (A) The histogram plots from the flow cytometer depict the Ki67 expression, a proliferative marker, in various cell lines. The left panel represents the unstained, whereas the right panel represents the stained cell lines. (B) The bar graph represents the flow cytometer data analysis of Ki67, with the X-axis representing different cell lines and the Y-axis showing the expression of Ki67. (C, D) These represents the colony formation of the different cell lines and their analysis. (E, F) The histogram plots from the flow cytometer represent the expression of Caspase-3, an important apoptotic marker, among various cell lines. The unstained and stained are shown in the left histogram panel, whereas the right panels represent the analysis of the caspase-3 expression. (G) The bar graph plot represents the Bcl-2 expression in leukaemia and normal cell lines. The stars present in the graph represent relative statistical significance (p) (*p˂0.05, **p˂0.001, ****p˂0.0001).
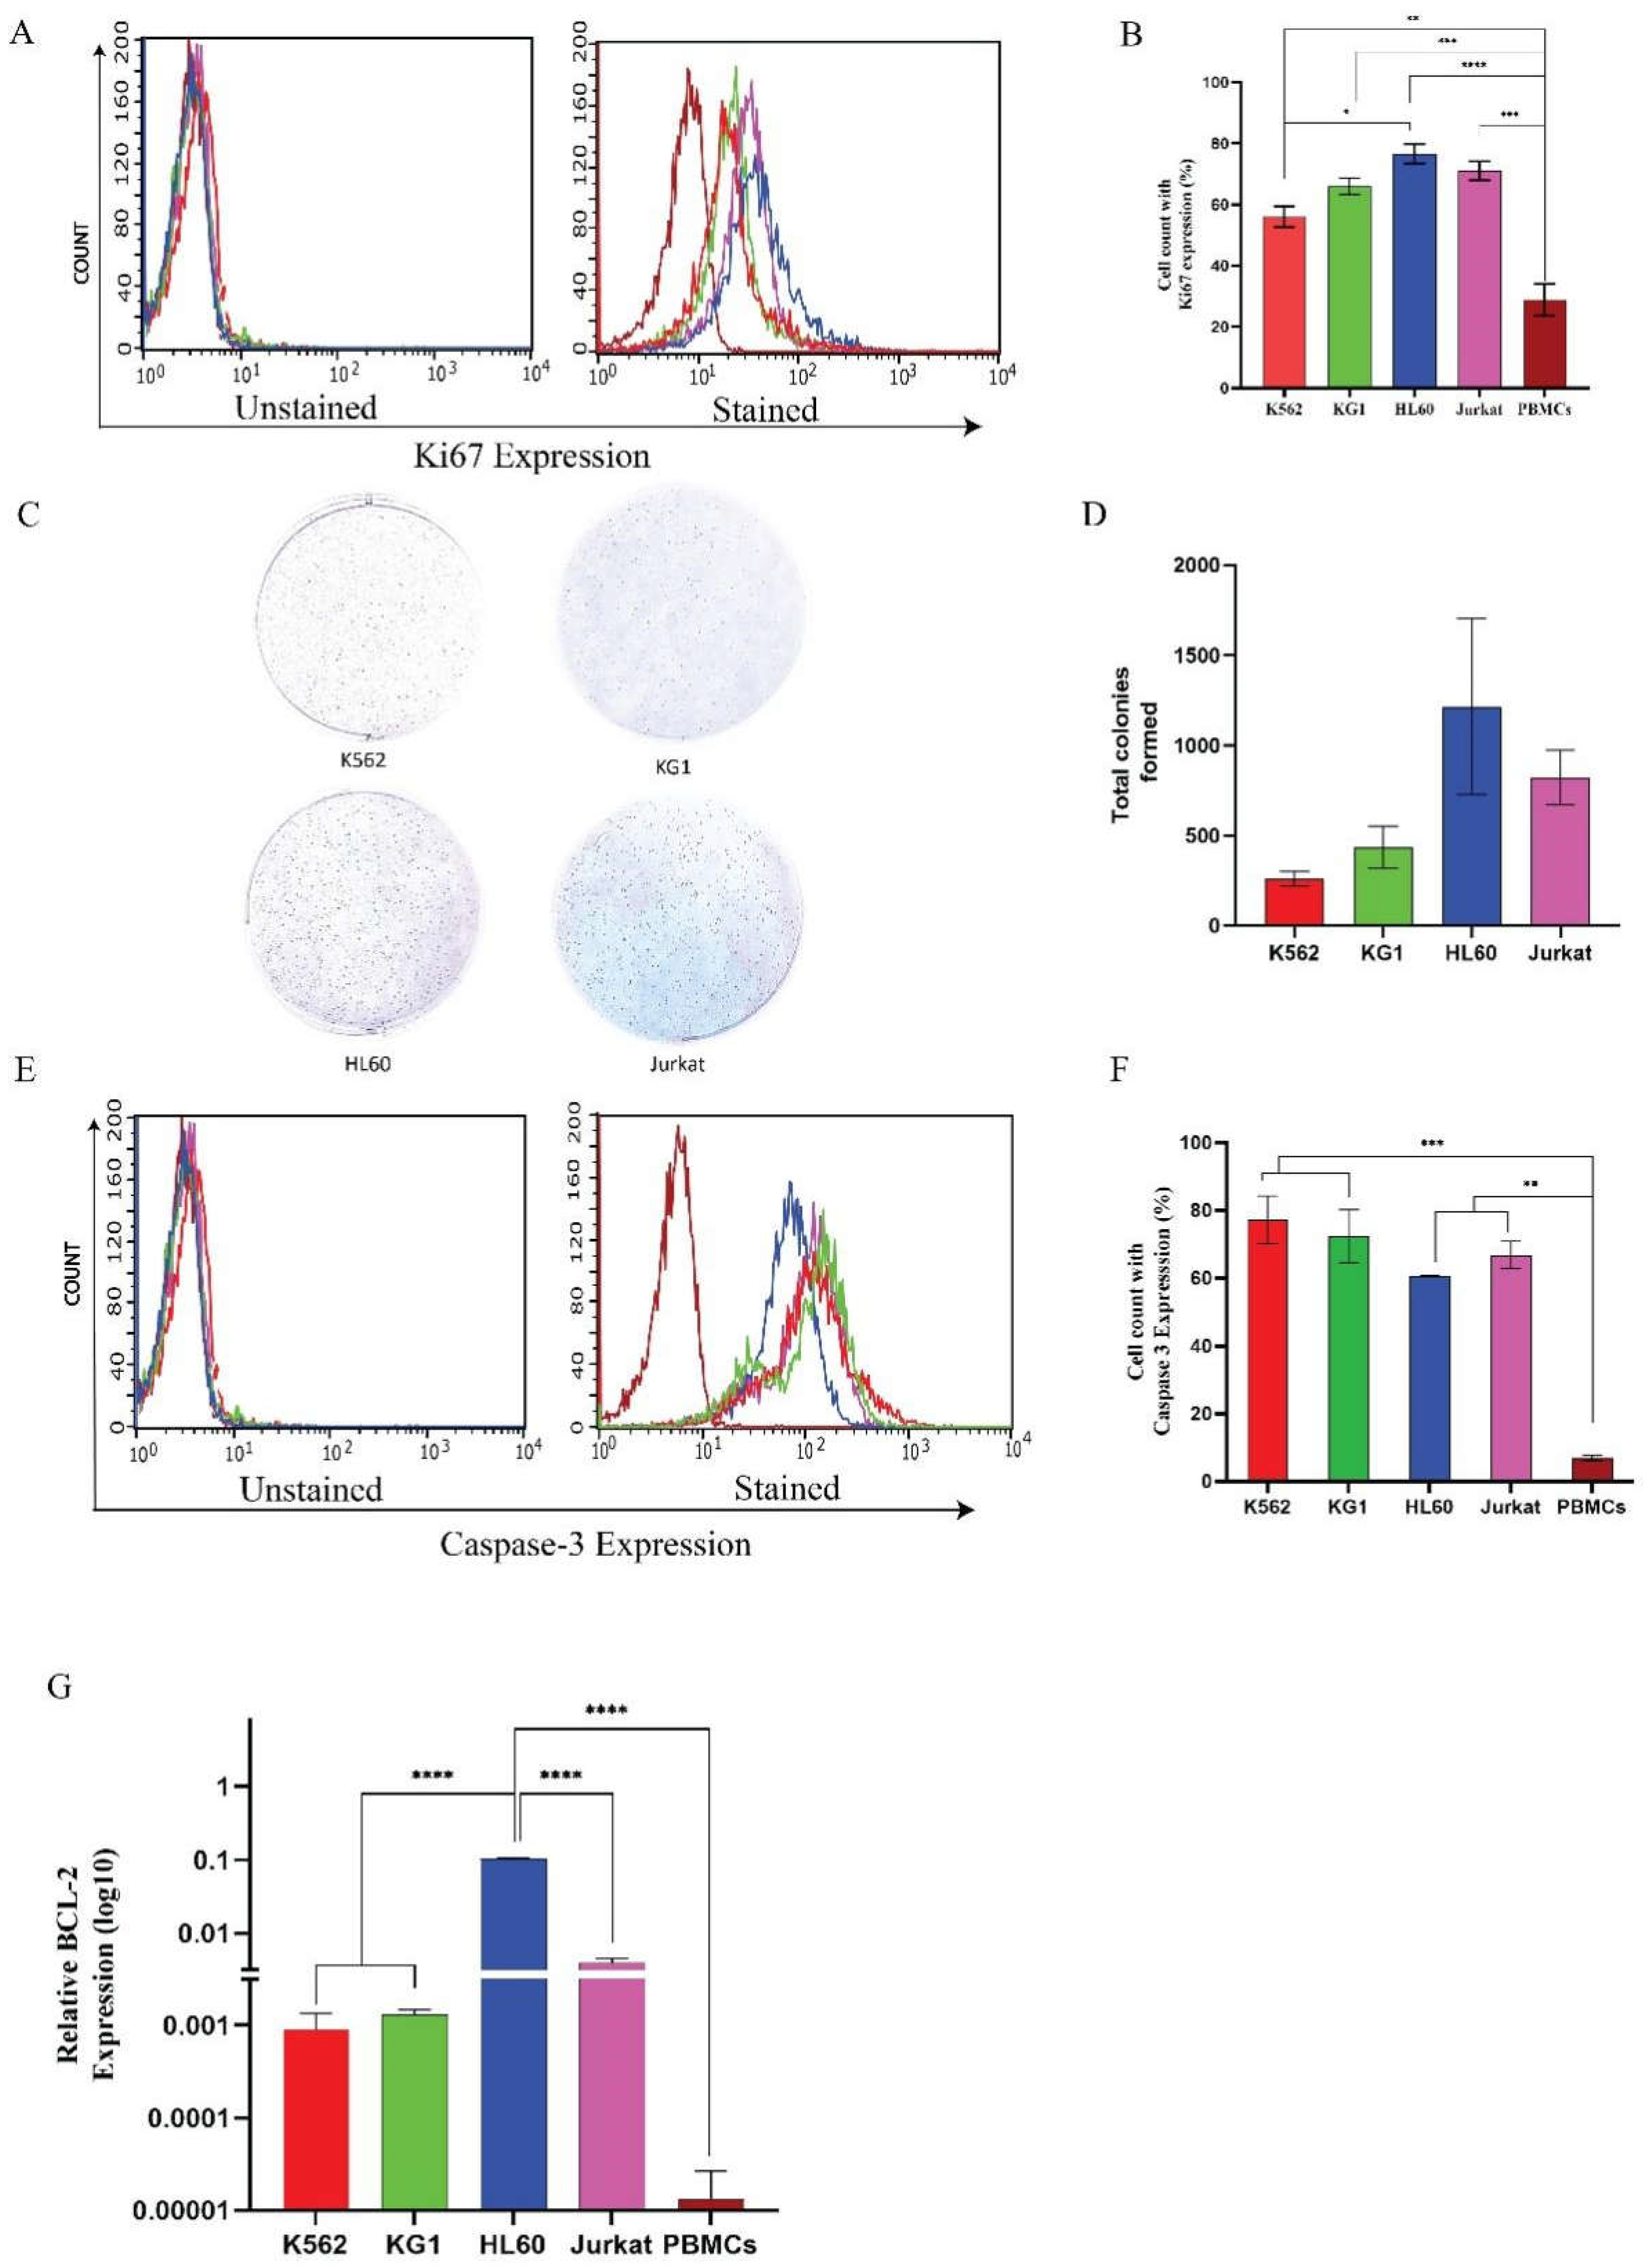
Figure 3.
Overexpression of c-MPL-FL increases in leukaemia conditions. (A) The figure depicts the expression of four different isoforms of c-MPL through western blotting, which is mainly present in humans. The molecular weight for different isoforms ranges from 70 kDa to 60 kDa. Figure (B) The intensities of the bands of western blotting were analyzed using Chemi Doc software, taking c-MPL-FL and c-MPL-TR into consideration and normalizing with beta-actin. (C) The figure represents the c-MPL isoform expression through RT-PCR. The X-axis represents two different isoforms, whereas the Y-axis represents the relative mRNA expression of c-MPL isoforms in different cell lines. (p) (*p˂0.01, **p˂0.001, ***p˂0.0002, **** p˂0.0001).
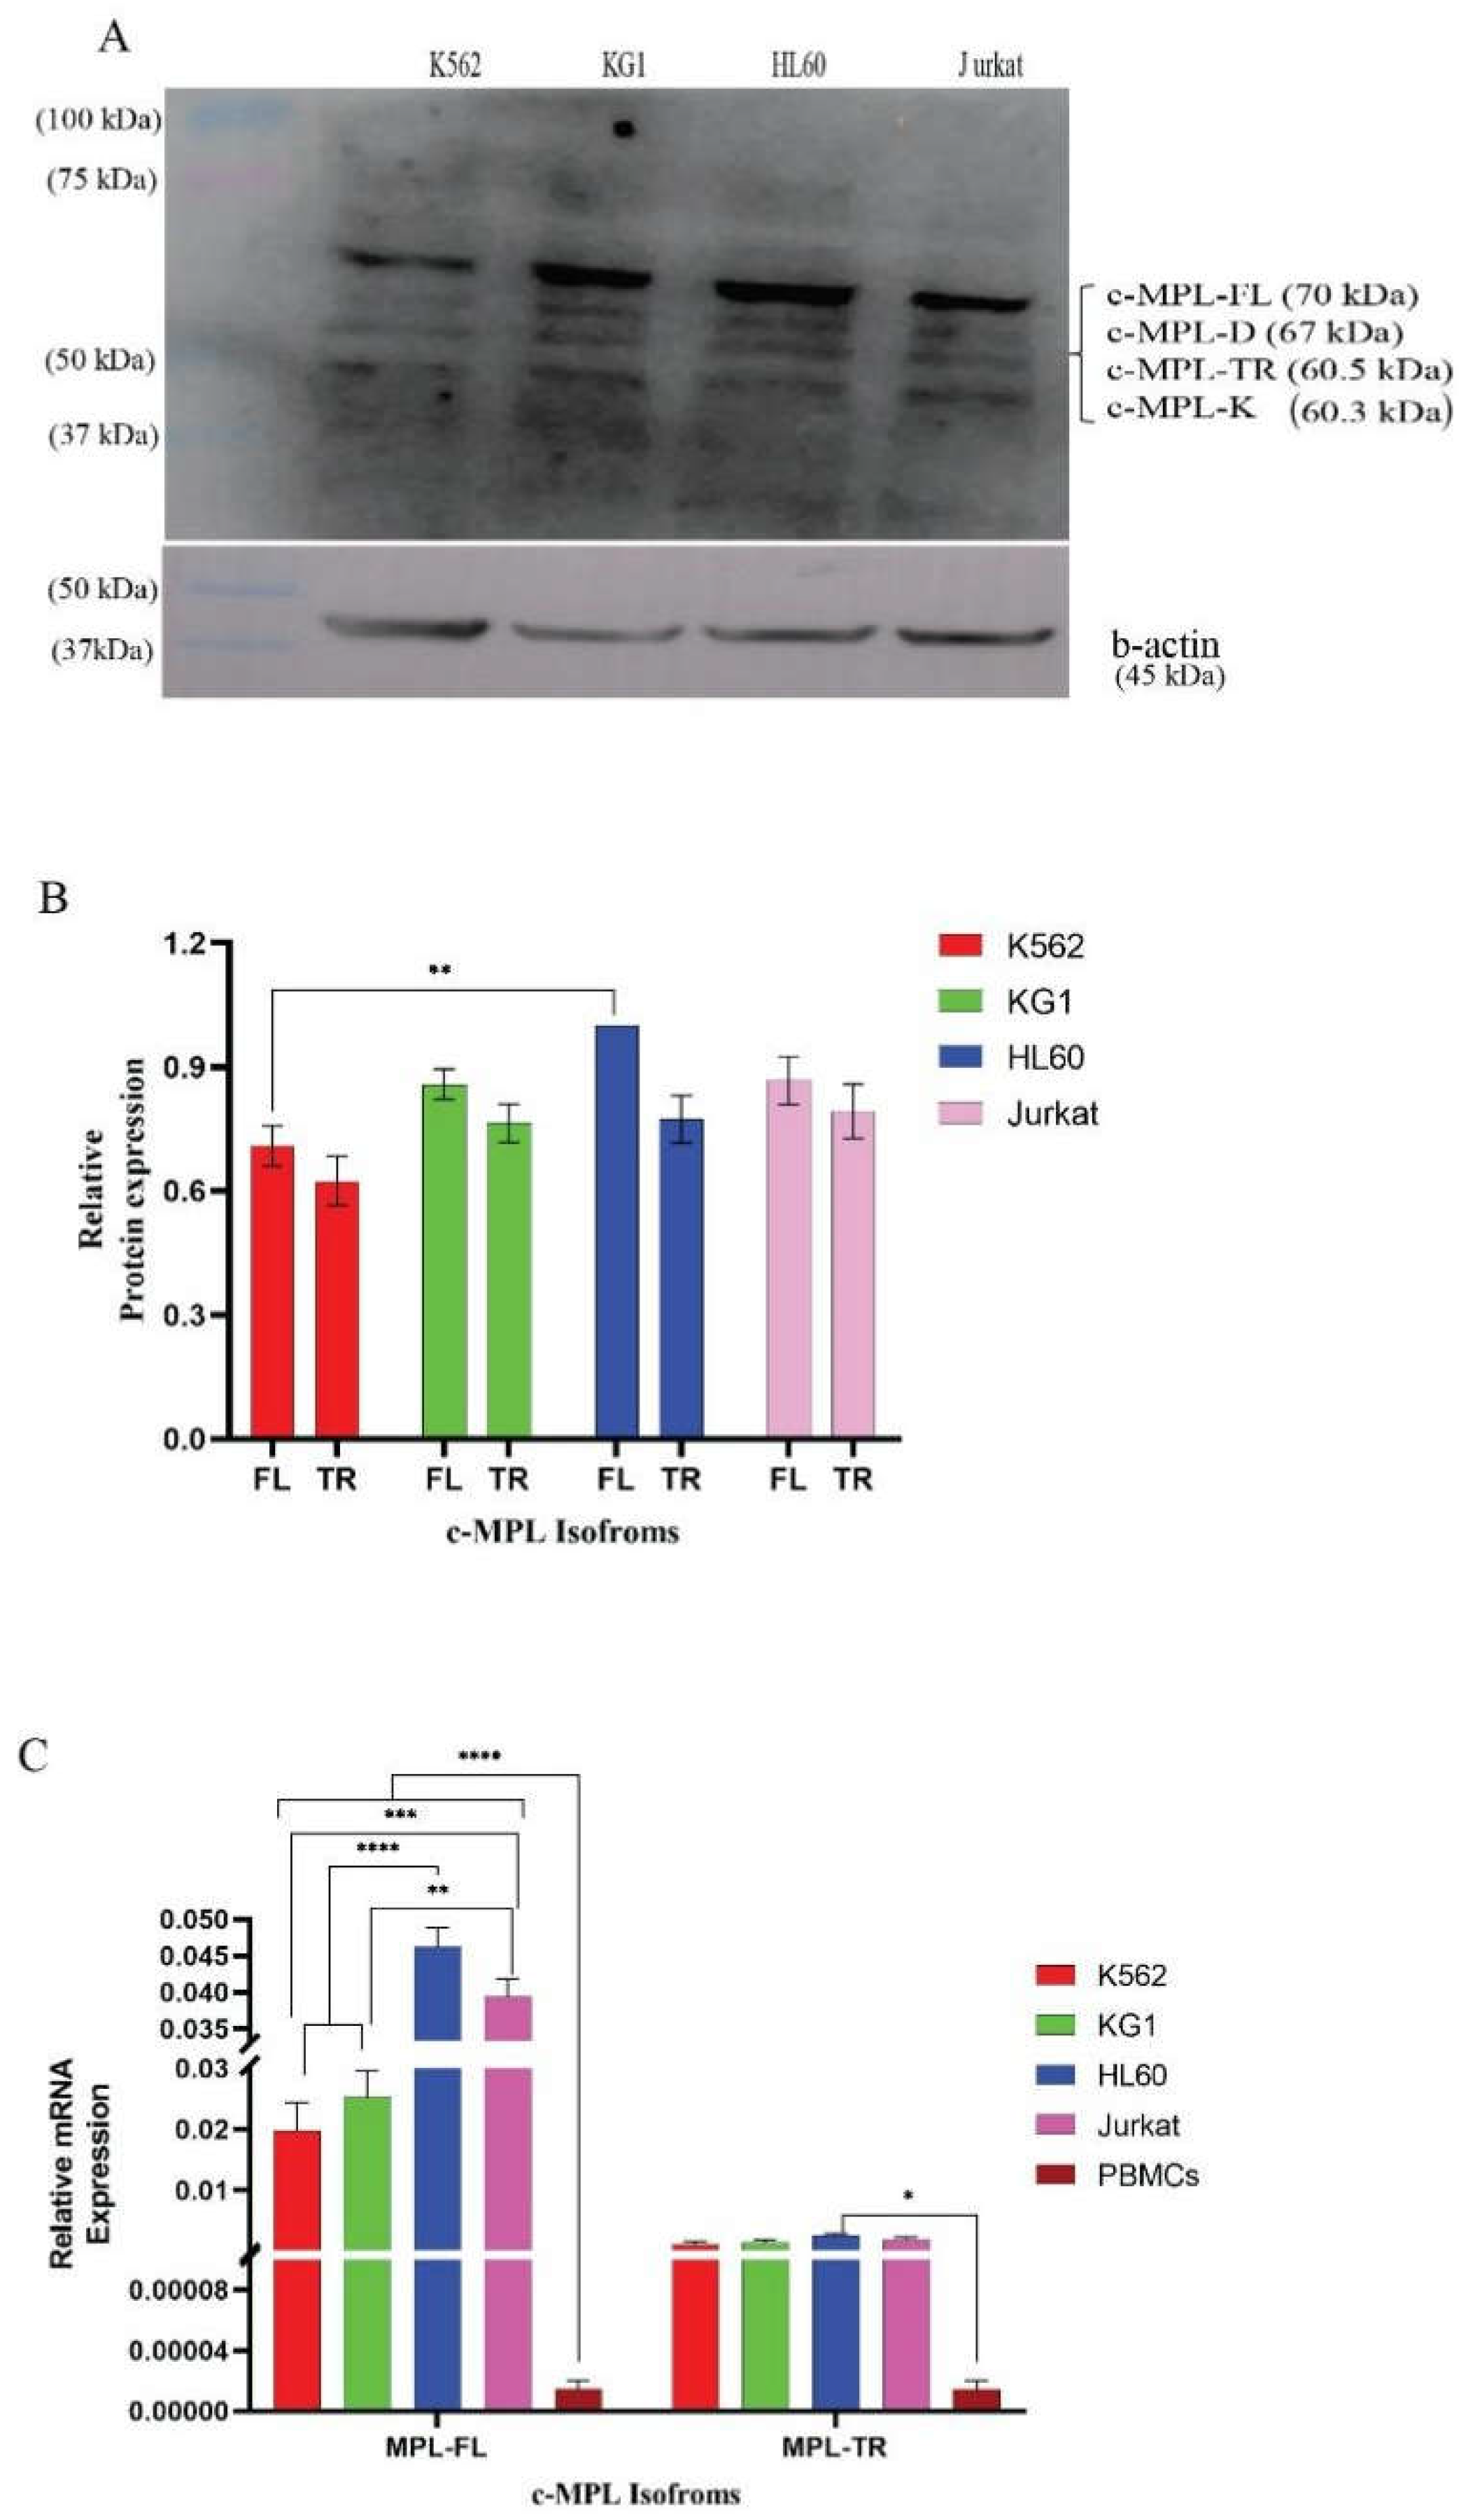
Figure 4.
Schematic representation of c-MPL/STAT5 signalling pathway. This figure represents the schematic diagram of STAT5 activation in the presence of c-MPL-FL, leading to an increase in cell proliferation. (The cell and nuclear membrane have been designed using Med Servier Art licensed under Creative Commons Attribution 4.0 International (CC BY 4.0).
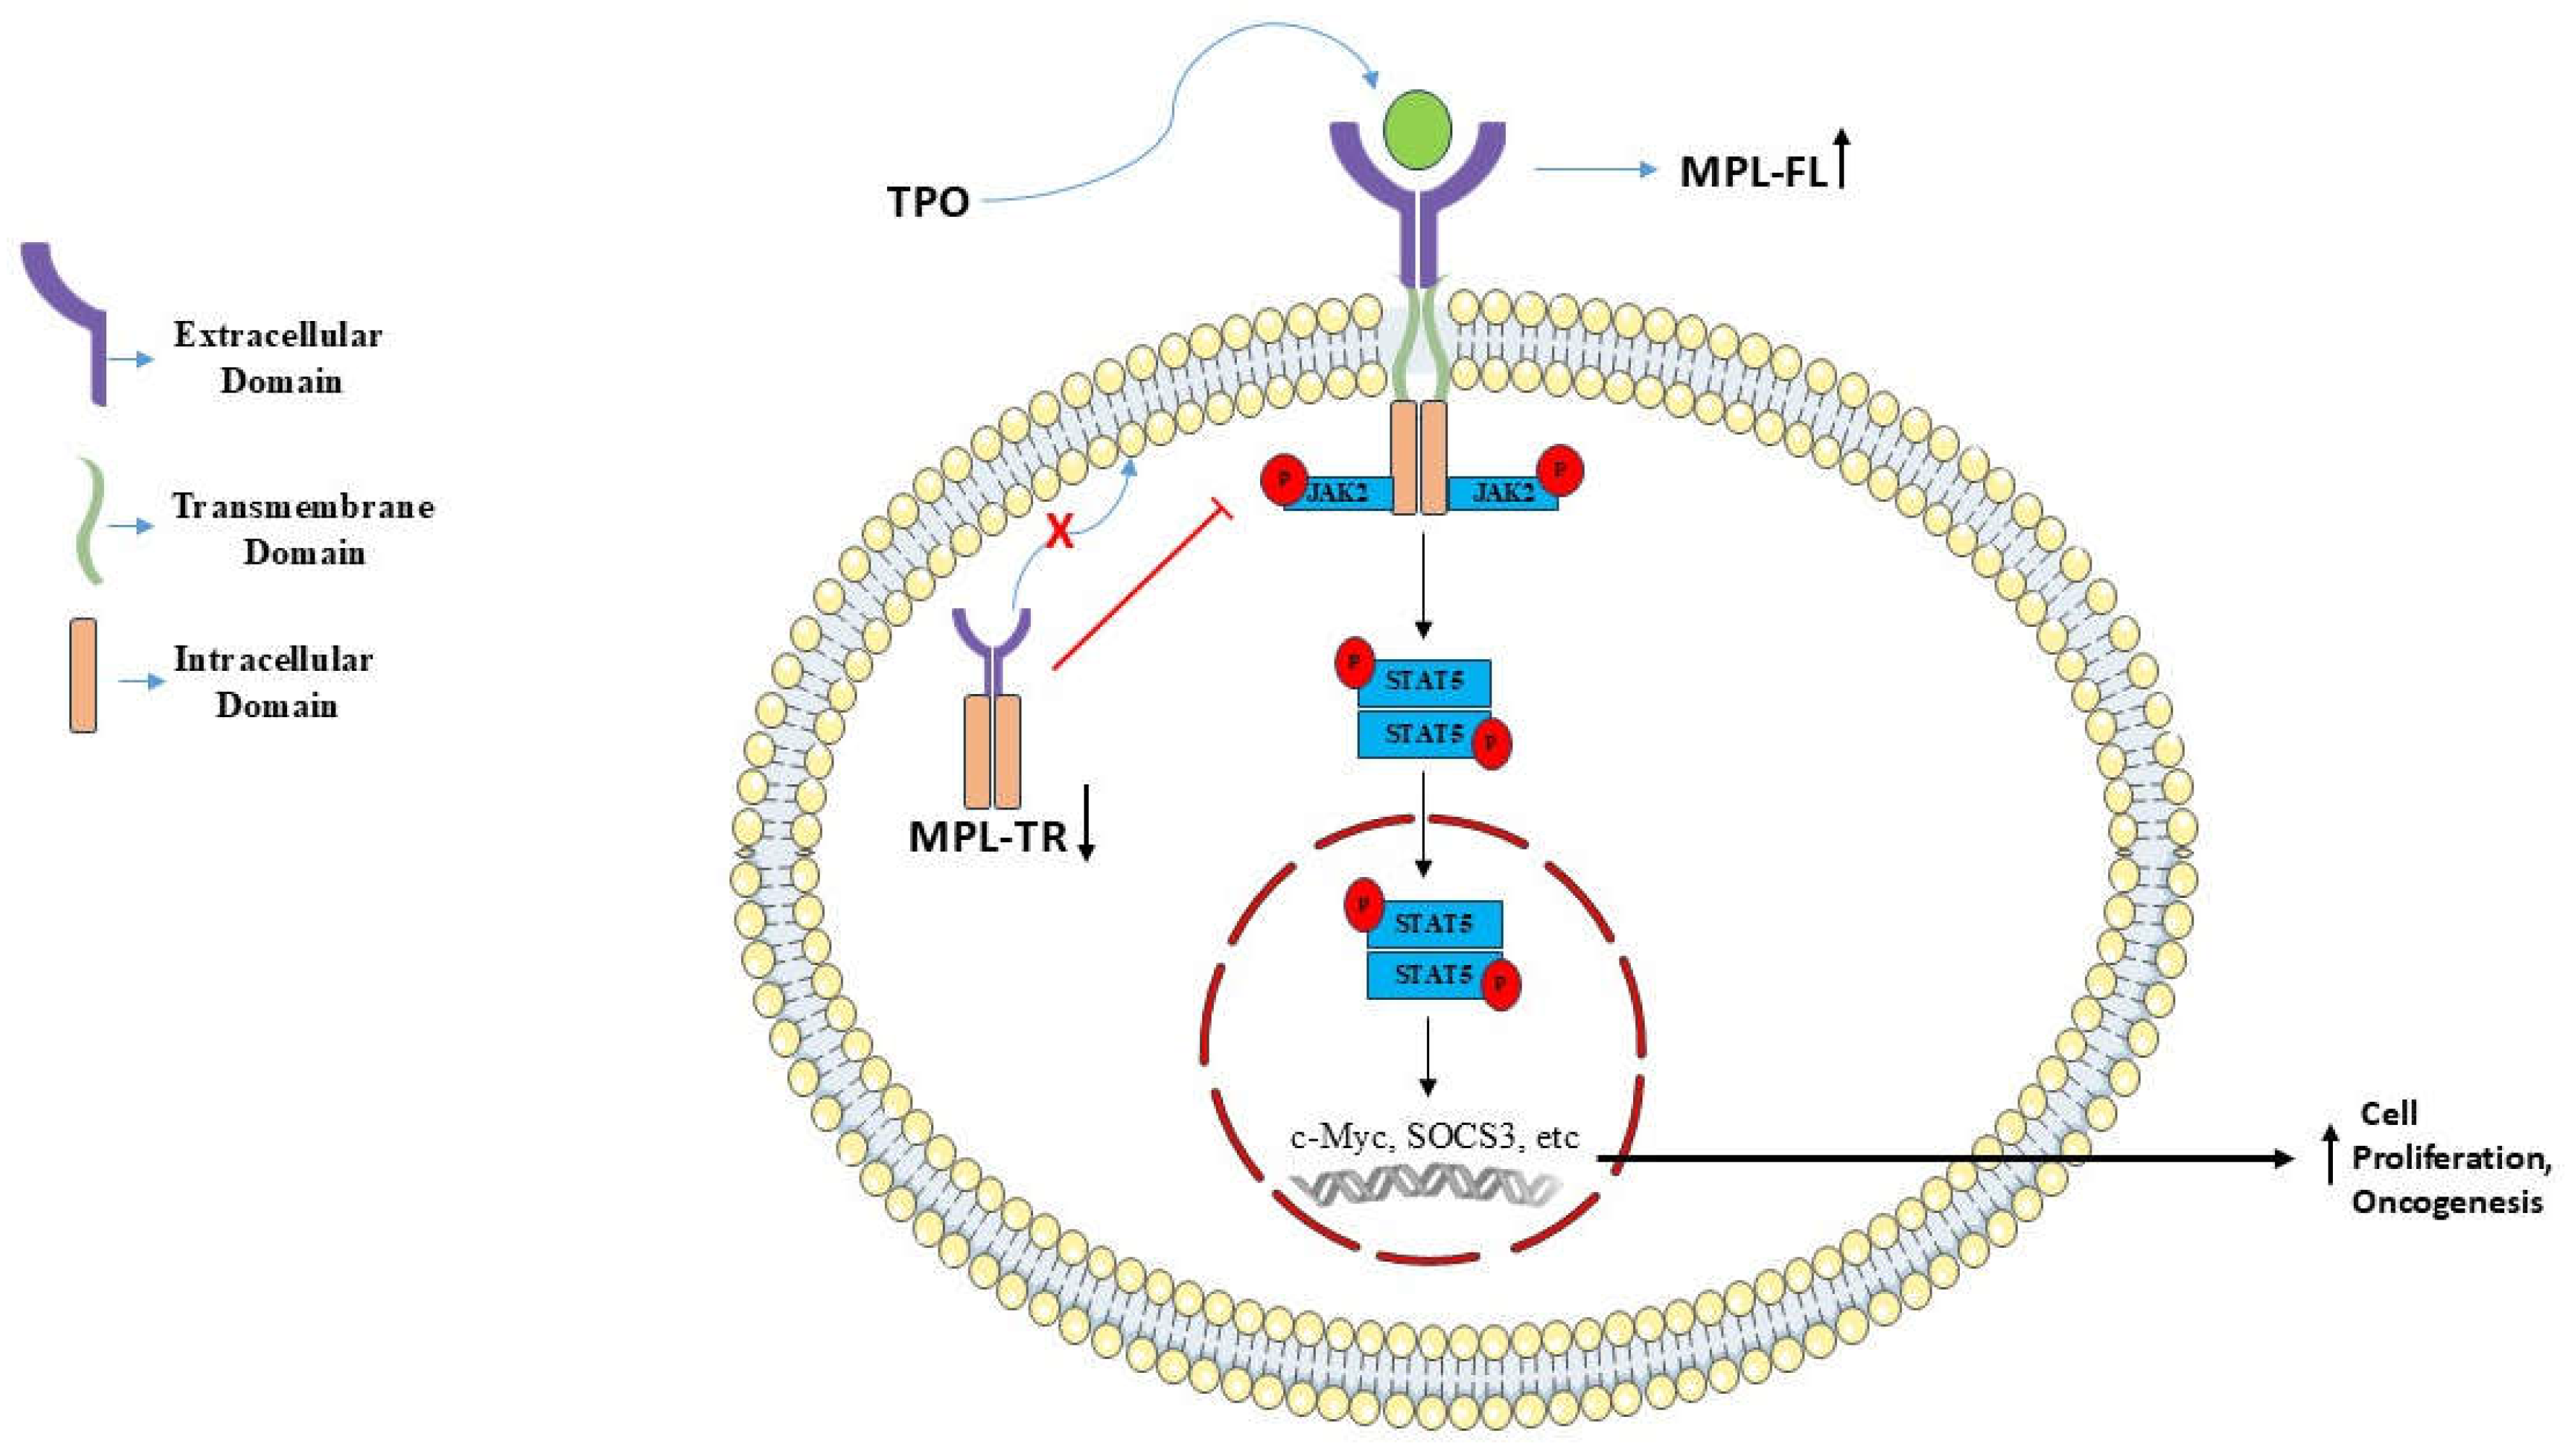
Figure 5.
Overexpression of c-MPL-FL leads to pSTAT5 expression. (A) This figure represents the histogram plot for the expression of STAT5 and pSTAT5 through immunophenotyping with unstained and stained cells. (B, C) This bar graph represents the analysis of the immunophenotyping. (D, E) The figure represents the inactive STAT5 and its analysis, which is a downstream signalling molecule for c-MPL expression through the western blotting. (F, G) This figure describes the expression of activated STAT5 (pSTAT5) through western blotting. The X-axis represents the different cell lines under study, whereas the Y-axis represents the relative protein expression of pSTAT5. The stars present in the graph represent relative statistical significance (p) (*p˂0.01, **p˂0.001, ***p˂0.0002, **** p˂0.0001).
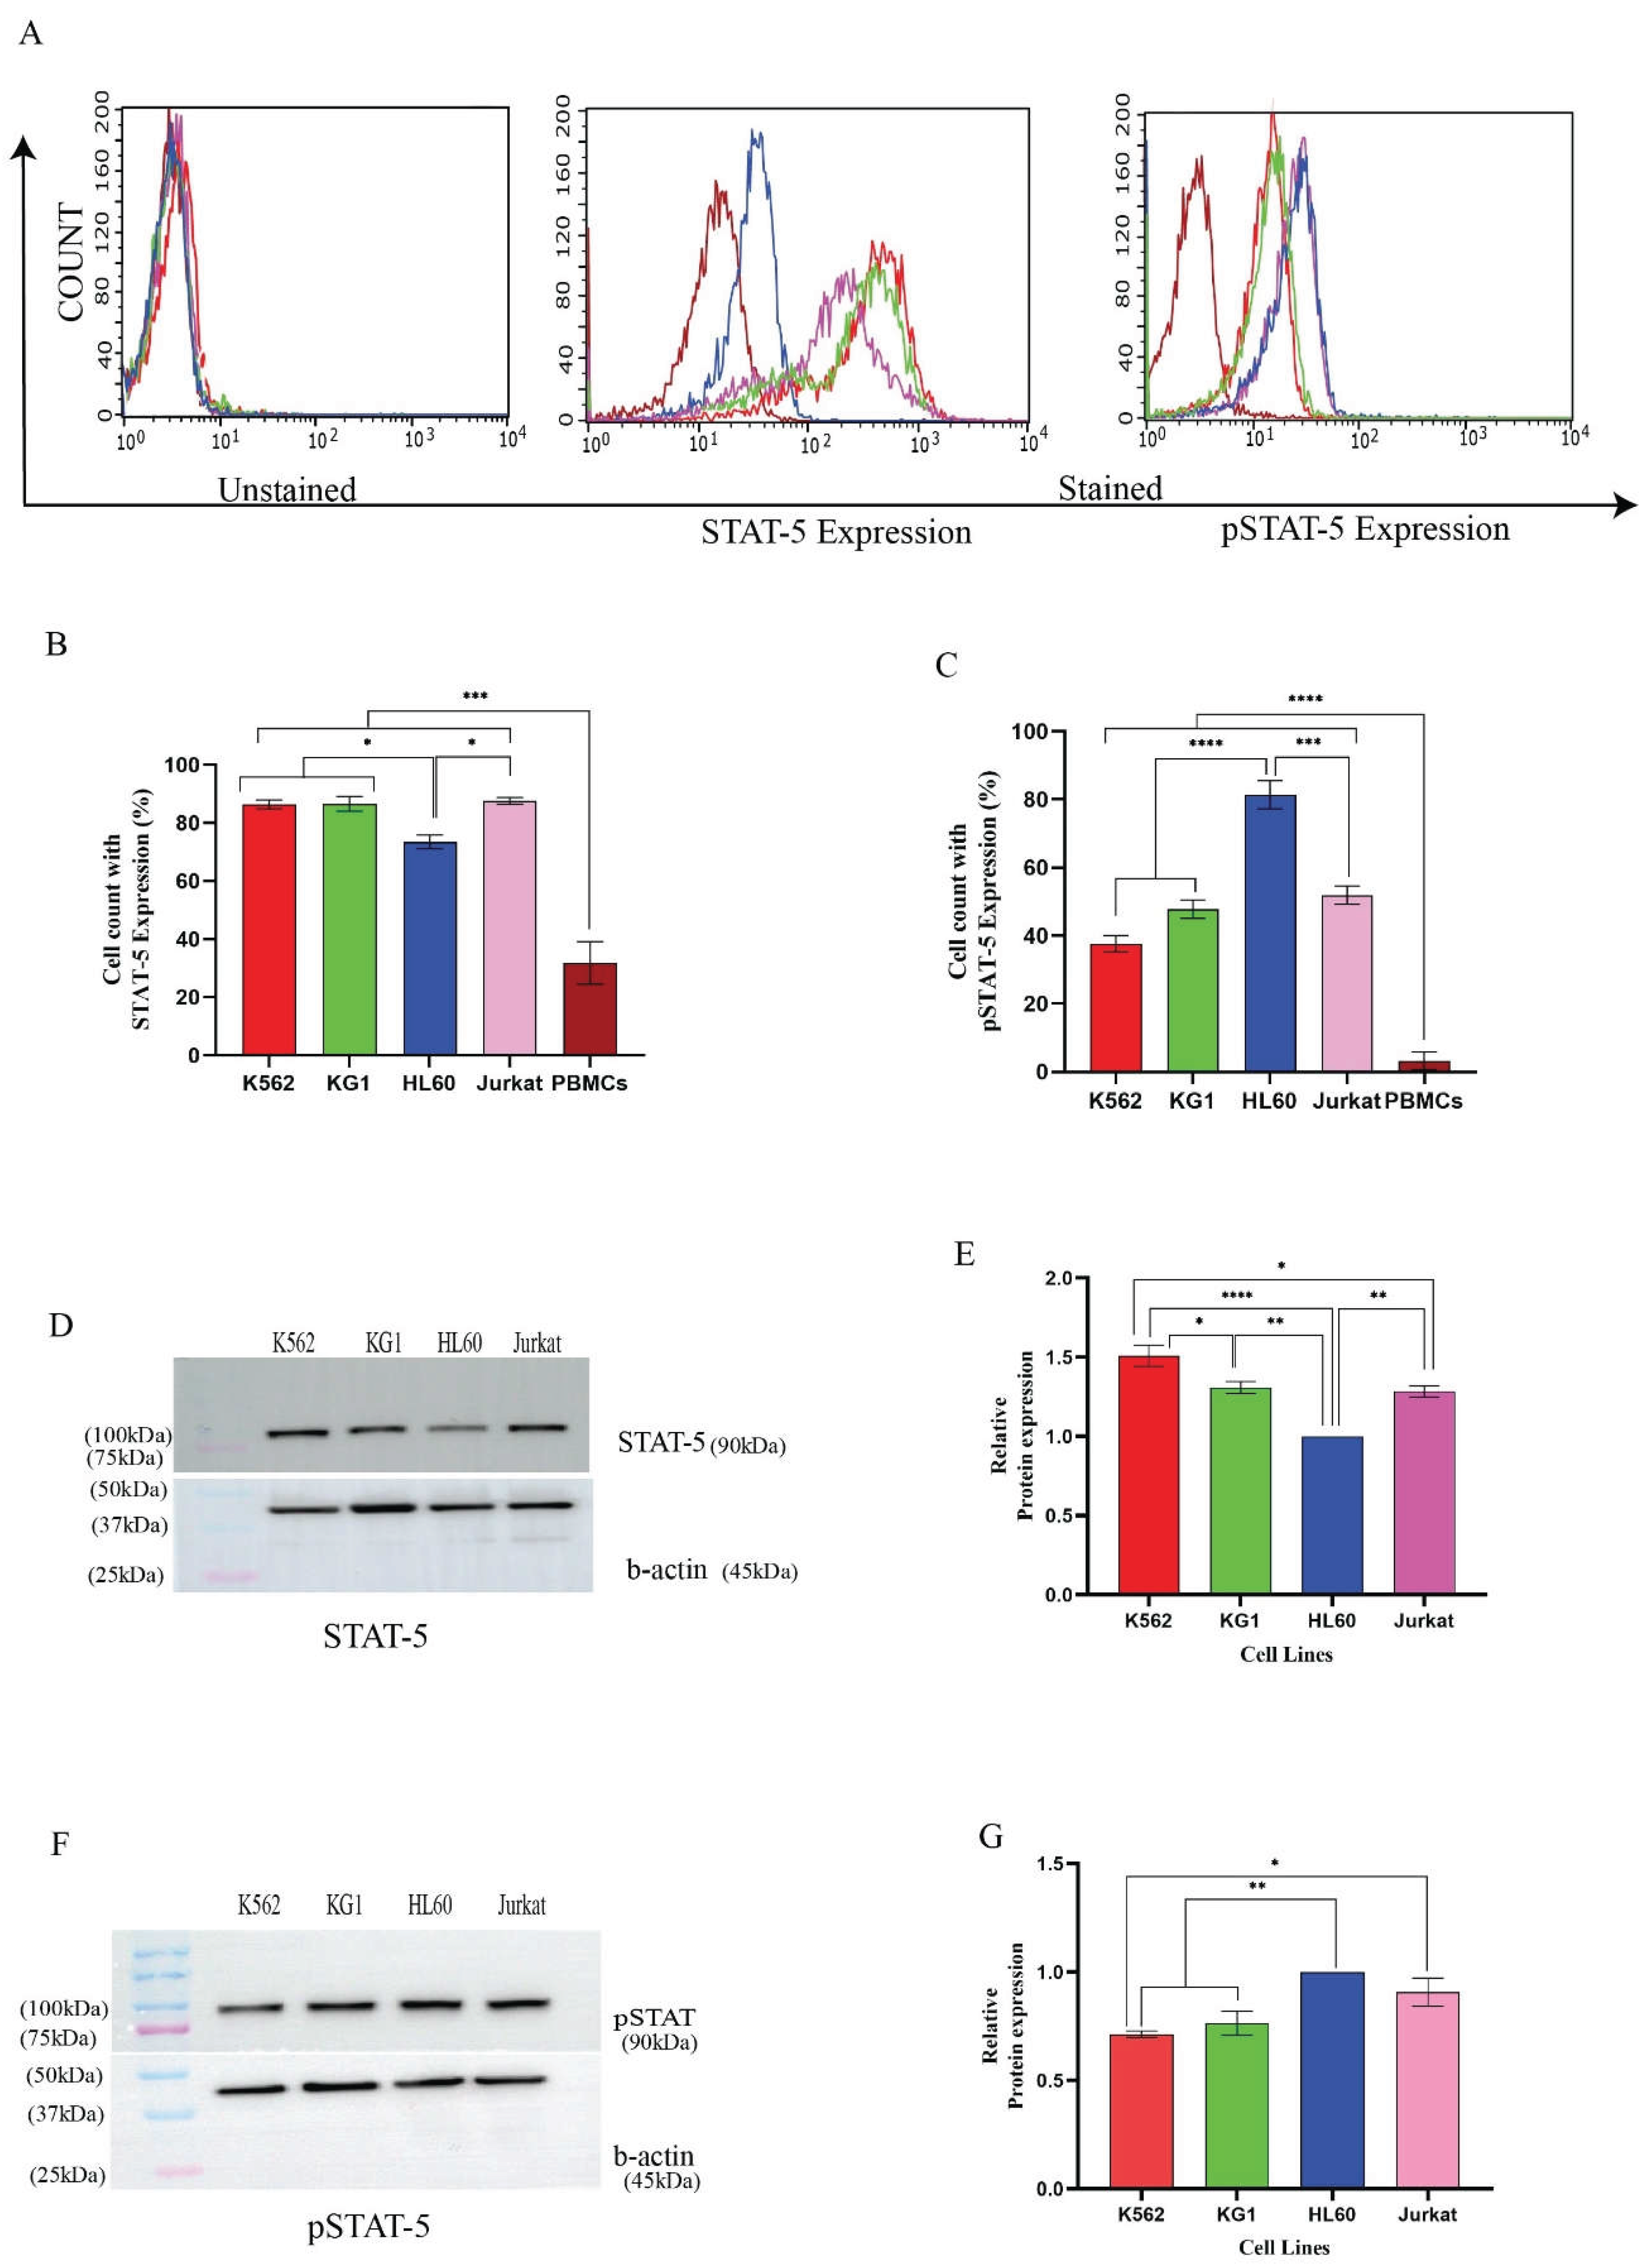

Table 1.
List of Antibodies and their concentration mentioned in the paper.
| S. No | Antibody | Purpose | Concentration | Company | Secondary Antibody concentration |
| 1 | c-MPL | Western Blotting | 1:1000 | Invitrogen | 1:2000 |
| 2 | STAT5 | Western Blotting | 1:1000 | CST | 1:2000 |
| 3 | p-STAT5 | Western Blotting | 1:1000 | CST | 1:2000 |
| 4 | c-MPL | Immunofluorescence | 1:200 | Invitrogen | 1:250 |
| 5 | c-MPL | Immunophenotyping | 1:200 | Invitrogen | 1:250 |
| 6 | Caspase | Immunophenotyping | 1:200 | CST | 1:250 |
| 7 | STAT | Immunophenotyping | 1:200 | CST | 1:250 |
| 8 | p-STAT | Immunophenotyping | 1:200 | CST | 1:250 |
| 9 | CD44 | Immunophenotyping | 1:100 | Abcam | Conjugated |
| 10 | Ki67 | Immunophenotyping | 1:200 | Invitrogen | 1:250 |
Table 2.
List of Primers and their sequence mentioned in the paper. c-MPL -P (NM_005373) has been designed from exon 9 (forward) and 10 (reverse). The c-MPL-S has been designed from the exon 8-11 junction for forward and the exon 11 for reverse.
Table 2.
List of Primers and their sequence mentioned in the paper. c-MPL -P (NM_005373) has been designed from exon 9 (forward) and 10 (reverse). The c-MPL-S has been designed from the exon 8-11 junction for forward and the exon 11 for reverse.
| Primers | Position | Sequence |
| c-MPL-FL (MPL-P) | Forward Primer | 5′ GCGATCTCGCTACCGTTTAC 3′ |
| Reverse Primer | 5′ AGGAAACTGCCACCTCAGC 3′ | |
| c-MPL -TR (MPL-S) | Forward Primer | 5′ AGGACTGGAAGGAGAC 3′ |
| Reverse Primer | 5′ TCAGGCTGCAGTGTCCTAAG 3′ | |
| c-MPL -Total | Forward Primer | 5′ GAGAAGCTTCAGCTCTGAC 3′ |
| Reverse Primer | 5′ CAAGTGCCACTGCATCTCCA 3′ | |
| Beta-actin | Forward Primer | 5′ACTGGAACGGTGAAGGTGAC 3′ |
| Reverse Primer | 5′AGAGAAGTGGGGTGGCTTTT3′ | |
| BCL-2 | Forward Primer | 5′GACTGAGTACCTGAACCGGC 3′ |
| Reverse Primer | 5′GTTCCACAAAGGCATCCCAGC 3′ |
Disclaimer/Publisher’s Note: The statements, opinions and data contained in all publications are solely those of the individual author(s) and contributor(s) and not of MDPI and/or the editor(s). MDPI and/or the editor(s) disclaim responsibility for any injury to people or property resulting from any ideas, methods, instructions or products referred to in the content. |
© 2026 by the authors. Licensee MDPI, Basel, Switzerland. This article is an open access article distributed under the terms and conditions of the Creative Commons Attribution (CC BY) license (http://creativecommons.org/licenses/by/4.0/).
Copyright: This open access article is published under a Creative Commons CC BY 4.0 license, which permit the free download, distribution, and reuse, provided that the author and preprint are cited in any reuse.


