Submitted:
14 February 2026
Posted:
27 February 2026
You are already at the latest version
Abstract
Competence-oriented Education for Sustainable Development requires evidence that immersive and gamified learning experiences elicit sustainability-relevant change beyond short pre-post windows. This study examines the Art Nouveau Path, a location-based mobile augmented reality heritage game implemented in Aveiro, Portugal, using a four-wave repeated cross-sectional design with anonymous student samples: baseline (S1-PRE, N = 221), immediate post-activity (S2-POST, N = 439, validated n = 438), follow-up (S3-FU, N = 434), and distant follow-up (S4-DFU, N = 69, validated n = 67). Analyses were anchored in an invariant 25-item GreenComp-based questionnaire (GCQuest) block targeting Embodying Sustainability Values (ESV; 1 to 6 scale) and combined distribution-aware descriptives, nonparametric omnibus and pairwise tests with Holm correction, and planned robustness checks including equal-n downsampling and alternative scoring. Results displayed a pronounced post-activity peak (S2-POST), partial attenuation at follow-up (S3-FU), and convergence toward baseline at distant follow-up (S4-DFU), accompanied by loss of the high-agreement tail. Item-level contrasts indicated that later-wave declines concentrated in effortful self-regulation and critical appraisal items, whereas values endorsement items were more stable. These findings indicate that field-deployable mobile AR heritage paths may generate strong proximal competence-aligned signals, but durable enactment-oriented change is likely to require structured reinforcement and integration into broader curricular sequences.
Keywords:
extended reality (XR)
; augmented reality (AR)
; gamification
; Human–Computer Interaction (HCI)
; User Experience (UX)
; usability
; location-based learning
; mobile learning
; sustainability competences
; cross-sectional design
1. Introduction
Education for Sustainable Development (ESD), which can be characterized as an evolving pedagogical paradigm, is presently undergoing a significant transformation that aligns it more closely with a comprehensive and competency-based educational objective, all while being framed within a broader international context that emphasizes global cooperation and shared educational goals [1]. This framework focuses significantly on improving awareness or merely accumulating sustainability insights; it aims to build integrated sustainability capabilities that harmonize knowledge with skills, values, and responsible attitudes for thoughtful judgment and actions in multiple contexts [2]. In this perspective, the pertinent educational question concerns whether students amplify their capacity to decode sustainability challenges, render value-oriented judgments, and operate responsibly in tangible environments. The United Nations Educational, Scientific and Cultural Organization (UNESCO) ESD 2030 roadmap formalizes this shift by emphasizing action-oriented learning pathways and the need for evidence that educational interventions support meaningful learner change, not merely short-term engagement [3]. In the European context, this competence orientation is operationalized through the European Sustainability Competence Framework, commonly known as the GreenComp, which specifies sustainability competences as integrated outcomes spanning values, complexity thinking, futures thinking, and action [4]. Complementary research argues that competence-oriented ESD requires explicit concepts or wording and measurement models capable of capturing change patterns, rather than relying on generic attitude measures [5,6].
Digital learning interventions, including immersive and location-based experiences, are frequently proposed as practical vehicles for competence-oriented ESD because they can situate learning in authentic environments and prompt context-sensitive reasoning. Through this lens, the relevance of mobile AR can be quite prominent when reflecting on its skill to link genuine surroundings with digital cues, multimedia enhancements, and related contextual undertakings.
Syntheses of AR in education consistently report learning benefits while also highlighting constraints that become critical in field settings, including usability, technical disruptions, cognitive load, and the orchestration demands created by movement and public space [7]. Meta-analytic evidence further indicates that AR can support learning outcomes across experimental and quasi-experimental studies, with effect sizes shaped by design decisions and contextual conditions rather than the presence of AR alone [8]. These underscore the necessity for competence-centered AR research that delineates not only the disparities in outcomes but also the way outcome trajectories are interconnected with the design and execution of experiential conditions.
The concept of gamification is extensively acknowledged and elaborated upon within research discussions as the intentional integration and use of diverse game design components and mechanics into contexts that are intrinsically non-gaming, as outlined in the thorough research undertaken by Deterding and colleagues in 2011 [9]. Within educational paradigms, its relevance is amplified when perceived as a practical design framework that orchestrates progress, feedback, and persistence in ways that achieve specific pedagogical objectives, rather than functioning merely as an enhancement to the enjoyment of activities. Self-determination theory clarifies the basis for this effectiveness: design decisions that promote genuine autonomy, indicators of competence, and social interaction can elevate engagement, while overly controlling or reward-centric frameworks may undermine intrinsic motivation [10,11]. Meta-analytic evidence suggests a predominantly favorable influence of gamification on educational outcomes, albeit with substantial variability that correlates with contextual elements, duration of intervention, learners characteristics, and, crucially, the congruence between game elements and educational targeted aims [12,13].
In applied AR initiatives that specifically target environmental behaviors, significant pre-and post-intervention changes in sustainability-related metrics have been observed, indicating that action-oriented prompts can be evident when evaluative designs are meticulously defined [14,15]. Other syntheses reinforce this pattern: positive average effects are common, yet results vary widely, elevating the importance of transparent designs, clear outcome definitions, and robustness checks [16,17]. Broad, but previous reviews likewise conclude that the field has matured while continuing to face issues of comparability and over-reliance on short evaluations that may inflate novelty-driven findings [18].
The intersection of mobile AR and gamification is therefore of direct applied interest for ESD. Mobile AR-based initiatives, due to its diverse features, such as graphical or innovative aspects, have the capacity to situate the process of meaning-making within a specific context, whereas gamification serves to effectively implement mechanisms of progression, feedback, and structured goals. Systematic reviews focusing on the combined use of AR and gamification document growing adoption and a predominance of positive reports but also highlight uneven measurement practices and limited use of designs capable of supporting stronger claims about competence [19]. Adjacent syntheses on gamified immersive environments (including VR) similarly underline that applied research benefits most when outcomes are paired with clear descriptions of the intervention as a socio-technical system, including design choices, UX constraints, and enactment conditions [20].
A persistent evaluation gap is especially relevant for competence-oriented ESD interventions implemented in schools or educational contexts. Numerous research depend on isolated implementations, limited sample sizes, or straightforward pre-and-post assessments, thereby complicating the evaluation of whether the discerned outcomes can be generalized across different cohorts and academic years [2]. When individual longitudinal tracking is constrained by logistics, consent, or cohort turnover, repeated cross-sectional designs provide a defensible approach to detect population-level change patterns across waves, if measurement remains consistent and cohort composition is handled carefully [21,22]. Without explicit robustness work, differences across waves may reflect sampling or composition shifts rather than competence-relevant change associated with the intervention.
Against this background, this paper examines whether participation in the Art Nouveau Path, a mobile AR game (MARG) implemented as a heritage-based city path, can be associated with patterns consistent with sustainability competence development across four assessment waves (S1-PRE, baseline; S2-POST, immediately after experience; S3-FU, first Follow-Up; and, S4-DFU, distant Follow-Up) using a repeated cross-sectional design.
The Art Nouveau Path has been previously documented as a competence-oriented MARG grounded in GreenComp [4], providing the design and validation basis for an outcome-focused multiwave cross-sectional evaluation [23,24]. The present analysis is positioned as a capstone evidence layer: it tests whether competence indicators shift across waves in the expected direction, identifies where the change signal concentrates, and assesses whether conclusions remain stable under composition adjustment and planned sensitivity analyses. Therefore, this study is guided by the following research questions (RQs):
RQ1. Do sustainability competence scores (and high-agreement prevalence indicators) show monotonic or net-positive cross-wave shifts consistent with competence development associated with participation in the gamified mobile AR experience?
RQ2. Which GCQuest ESV items (Q1–Q25) account for the largest cross-wave differences (effect sizes and rank-based contrasts), indicating the most temporally sensitive competence targets within the ESV domain?
RQ3. Are the answers to RQ1 and RQ2 stable under composition adjustment and planned sensitivity analyses (for example, alternative scoring, threshold operationalizations, resampling or weighting strategies, and robustness to plausible self-report reference bias)?
The remainder of this article is organized as follows. Section 2 establishes the theoretical background for competence-oriented Education for Sustainable Development (ESD), place-based learning, and the role of mobile augmented reality and gamification, and it motivates the use of a four-wave repeated cross-sectional design with explicit robustness requirements. Section 3 describes this study’s case, the intervention context, the four-wave questionnaire series and measures, and the data preparation and analysis pipeline. Section 4 presents the findings, reporting cross-wave trends in the GCQuest ESV outcome, item-level sensitivity patterns, and planned robustness and contextual checks. Section 5 discusses implications for competence-oriented ESD evaluation and for evidence standards in applied XR and gamified learning interventions. Section 6 presents the main contributions, acknodwlege limitations, and future research paths.
2. Theoretical Background
2.1. Competence-Oriented ESD and the Problem of Detecting Change
Competence-oriented ESD places evaluation pressure on what learners can operationalize in situated sustainability-relevant contexts, including how trade-offs are reasoned, how judgments are formed, and how value-informed action tendencies are selected, rather than on the recall of concepts [3,4]. This competence logic does not eliminate the role of knowledge, but it reframes evidence standards: interpreted change must be linked to a clearly delineated construct and to a measurement approach that can support comparability across cohorts and time.
Across sustainability education research, competence assessment is implemented through heterogeneous approaches, including performance tasks, observations, portfolios, vignettes, and self-report scales, with method choice typically reflecting feasibility constraints and construct focus [5]. In field-based and school-embedded interventions, self-report remains prevalent because it can capture perceived capability and values-based positioning that are central to competence frameworks, particularly for values-oriented competence areas such as those articulated in [4]. However, self-report indicators are interpretable as competence evidence only when response processes and comparability threats are treated as primary validity conditions, not as secondary analytic caveats.
Two threats are especially relevant for competence-oriented self-report in multiwave and multi-cohort settings.
First, response shift refers to systematic change in the internal standards, values, or construct meaning that respondents apply when rating themselves over time. In the response-shift model, apparent score change may reflect recalibration (a changed benchmark), reprioritization (a changed weighting of what matters), or reconceptualization (a changed understanding of the construct itself) [25]. In competence-oriented ESD, response shift is plausible because learning experiences can refine what counts as “competent” sustainability reasoning and action, raising internal standards and altering how response categories are used.
Second, reference bias concerns between-group differences in implicit standards and scale mapping. When different cohorts interpret response categories through different reference frames, the same numeric response can correspond to different latent levels, compromising cross-cohort comparability even under identical item wording [26]. Reference bias is especially plausible when cohorts differ in contextual exposures that shape what is perceived as demanding, realistic, or meaningful sustainability action, including differences in school culture, prior curricular emphases, and issue salience.
These threats do not invalidate self-report competence indicators. Instead, they raise the evidentiary threshold for what can be claimed. Competence assertions are most defensible when (i) constructs are explicitly specified and framework-aligned, (ii) instrumentation preserves a stable measurement spine across waves, and (iii) interpretations are bounded to conclusions that remain stable under transparent scoring choices and robustness checks designed to present plausible alternative response mappings [25,26]. Accordingly, competence evidence in this paper is treated as cohort-level, distribution-level signal aligned to a defined competence framework, rather than as a direct measure of individual retention trajectories. The following sections build on this validity logic by specifying how place-based mobile AR design can elicit competence-relevant enactment, and why multiwave repeated cross-sectional evidence with explicit robustness boundaries is used to support transfer-relevant inference.
2.2. Place-Based Learning, Mobile AR Affordances, and Field Constraints
Competence-oriented ESD is often promoted through experiential learning opportunities situated within authentic local environments that necessitate learners to decipher indicators, evaluate limitations, and exercise judgement within the context [27]. Within this educational framework, situated learning posits that knowledge and evaluative judgement are inextricably linked to the practices and contexts wherein they are performed, while experiential learning conceptualizes competence acquisition as a recursive process encompassing concrete experience, reflective observation, conceptualization, and active experimentation [28,29,30]. A persistent design objective in place-based education is the fostering of a “sense of place,” which is interpreted as the learners’ rich understanding of and emotional connection to local contexts, thereby anchoring curricular engagement in pertinent civic and environmental issues [31,32]. In contrast to decontextualized classroom stimuli, place-based assignments render sustainability reasoning dependent on observable indicators and limitations present in quotidian environments, thereby enhancing the ecological validity of the reasoning that the pedagogical activity aims to provoke.
For heritage-oriented learning, this framing implies that AR should be evaluated as an instructional system whose outcomes depend on design quality and enactment conditions, rather than as a media add-on [33]. Mobile AR is particularly relevant because it can bind physical locations to layered prompts and evidence at the point of encounter, enabling context-sensitive inquiry, interpretation of visible features, and feedback during action [34,35]. Field-based implementations such as EcoMOBILE also illustrate that learning gains are achievable under authentic outdoor constraints when orchestration and inquiry are coherently supported by activity design [36].
At the same time, in-the-field AR introduces constraints that directly bound applied claims, including technical disruptions, usability friction, attentional competition, and orchestration demands created by movement in public space [7,34,37]. Syntheses of AR in education consistently report overall benefits while emphasizing that outcomes are contingent on design and enactment conditions, not on AR “presence” alone [7,8,37,38]. These contingencies are especially salient in location-based activities where connectivity, device heterogeneity, attention management, and safety constraints shape what can be enacted reliably across cohorts [34]. Evidence from undergraduate outdoor ecology and environmental science contexts further reinforces orchestration as a first-order design variable in mobile location-based AR learning [36].
2.3. Why Gamification Can Be an Applied Design Layer for Competence-Oriented AR Initiatives
In essence, gamification is about the thoughtful employment of game mechanics in situations that are not games to influence how users engage and experience [9]. In educational systems, gamification is most defensible when treated as an applied design layer that structures progression, feedback, and persistence in ways that align with pedagogical objectives, rather than as an ornamental add-on intended only to make activities “more enjoyable”.
Self-determination theory helps clarify why this may work: design choices that support meaningful choice, competence cues, and social connection can strengthen engagement, whereas overly controlling or reward-saturated structures can undermine intrinsic motivation [10,11]. Concerning this, meta-analytic evidence points to positive average effects of gamification on learning-related outcomes, but with wide dispersion that tracks contextual conditions, intervention duration, learner characteristics, and, critically, the fit between game elements and learning goals [12,13]. In applied AR interventions targeting climate action and sustainability problem-solving, pre-post shifts in sustainability-related outcomes have been reported, indicating that action-oriented signals can be detectable when evaluation designs are appropriately specified [14,42]. Separately, location-based AR applications for cultural heritage education with gamified mechanics have reported gains in knowledge-related and challenge-related indicators under field deployment, supporting the value of explicit evaluation schemes beyond engagement metrics [15].
For competence-oriented ESD, this variability is not merely noise. It signals that competence claims become interpretable only when the gamified layer is coherent with the targeted competence model and when the design rationale is explicit. The framework concerning gamified learning posits that gamification serves as a pivotal mechanism that fundamentally transforms the way instructional methods impact the learning process by modifying the various opportunities available to learners for engaging in actions, the contingencies associated with feedback, and the cues that serve to enhance motivation [43,44]. In mobile AR experiences, gamification also performs an operational function: it can pace activity across dispersed locations, provide recoverable closure through short feedback loops, and sustain task completion under time, mobility, and group-coordination constraints [44]. Evaluation is therefore strengthened by construct-aligned outcomes and reporting practices that document design intent, implementation constraints, and boundary conditions, consistent with expectations in applied gamification research in adjacent information systems and HCI-oriented literatures [18,44]. Recent studies of collaborative AR serious games in sustainability contexts have reported changes in indicators such as sustainability awareness and commitment, supporting the case for pairing XR mechanics with competence-relevant constructs rather than relying on engagement metrics [42].
2.4. Why Four-Wave Repeated Cross-Sectional Evidence, and Why Robustness Is Required
A persistent evidence gap in field-based AR and gamified learning research is the reliance on single deployments, small samples, or simple pre-post designs [7,18]. These approaches are informative for feasibility and short-term signal detection, but they are weak for judging whether observed patterns generalize across cohorts and academic years. When individual longitudinal tracking is constrained by logistics, consent, or cohort turnover, repeated cross-sectional designs provide a defensible alternative for detecting population-level trend patterns across waves, if measurement is consistent and cohort composition is handled explicitly [22,45] This is not only a methodological argument: educational measurement research has long developed and applied scale-invariant, distribution-based approaches to compare trends and gaps in large repeated cross-sectional assessment programs [46]. A four-wave design can further strengthen inference by distinguishing short-term uplift from attenuation and longer-term persistence patterns across cohorts and academic years, rather than relying on a single pre-post contrast. In repeated cross-sectional inference, the central validity risk is that apparent change reflects composition differences rather than intervention-consistent development. Robustness, thus, emerges as an integral component of the theoretical rationale, rather than merely an analytical preference. Three robustness pillars are particularly relevant:
- Third, composition sensitivity strategies, including weighting when harmonized covariates are available and resampling-based perturbations when they are not, help bound interpretation to patterns that remain stable under reasonable changes in sample composition and scoring choices [45].
Positioned as a capstone evidence layer, a four-wave repeated cross-sectional analysis can therefore strengthen applied claims by testing whether competence indicators move consistently across cohorts, by identifying where the signal concentrates (dimensions and items), and by showing whether conclusions persist under planned robustness checks [22,45]. This logic directly motivates RQ1 to RQ3 and clarifies why the present contribution is not only another evaluation, but an explicit attempt to produce transfer-relevant evidence under realistic school constraints and bounded interpretive claims.
2.5. Bridges to the Present Study
Nestled within the expanding realm of gamified experiences and advanced immersive tech, this initiative is articulated as a thorough extended reality (XR) educational model, featuring location-sensitive mobile AR as a deployable AR-centric environment. Within this framing, the intervention operationalizes gamification in an AR environment and foregrounds UX and interface constraints that are also central to immersive learning systems in mixed reality (MR). The present contribution therefore targets applied evidence needs in gamified XR research by pairing construct-aligned outcomes with multiwave trend logic and robustness boundaries, under realistic school and deployment constraints [9,19,20].
This study evaluates whether participation in the Art Nouveau Path, a gamified mobile AR heritage path, is associated with cross-wave patterns consistent with sustainability competence development across four assessment waves, and whether conclusions remain stable under composition adjustments and sensitivity analyses. Prior studies regarding this the intervention provide the design and construct-alignment basis; the present contribution focuses on multiwave outcome patterns and robustness as applied evidence [23,24,49,50].
3. Materials and Methods
3.1. Study Design and Reporting Scope
This study follows a consistent cross-sectional (trend) framework featuring four private evaluation stages (S1-PRE [51], S2-POST [52], S3-FU [53], S4-DFU [54]). Because questionnaires were completed anonymously, responses cannot be paired at the individual level; inference is therefore limited to differences between wave samples (cohort-level patterns), rather than within-person change [22,55,56,57].
The S1–S3 administrations and their core outcome reporting have been described previously, including the definition of the primary composite outcome (ESV) as the mean of GCQuest items Q1–Q25 [58] and the use of ordinal-robust and heteroscedasticity-robust analyses as sensitivity checks. The present paper extends that evidence by adding a fourth wave (S4-DFU) and by coupling cross-wave outcome patterns with S4-specific mechanism-oriented indicators (heritage engagement and XR/UX frictions) that make usability and navigation bounds explicit for HCI-relevant interpretation and transfer, alongside pre-specified robustness boundaries appropriate to small-sample follow-up data [59,60,61,62].
3.2. Educational Intervention and Context
The educational intervention was the Art Nouveau Path, a MARG implemented as an outdoor, location-based heritage path in Aveiro, Portugal, within the EduCITY Digital Teaching and Learning Ecosystem (DTLE) [49]. The path comprises eight georeferenced points of interest (POIs) associated with Aveiro’s Art Nouveau built heritage and a total of 36 quiz-type tasks distributed across POIs (P1.1–P8.2), enabling modular progression by completing a compact task block at each location before moving to the next [49]. Tasks prompt in situ observation of architectural cues and urban features, supported by authored multimodal resources (such as archival photographs, short videos, and an audio prompt) and, where applicable, optional AR overlays anchored to facades and monuments ([49]. The AR content is triggered by pre-existing, contextualized markers (Figure 1).
The implementation phase occurred during regular school hours as a teacher-mediated city walk. This Art Nouveau Path activity has been integrated in the Municipal Educational Action Program of Aveiro 2024–2025 (PAEMA) [63]. This provided a convenience sample.
Accompanying teachers (N = 24) supported logistics, pacing, safety, and curricular framing, while students enacted the experience in collaborative groups, typically two to four students sharing one EduCITY Project mobile device per group [49]. This was deliberated, granting participants the same game experience.
The main field implementation cohort comprised N = 439 students (ages 13 to 18; grades 7th to 12th) participating across 19 classes (grade 7th: n = 19; grade 8: n = 135; grade 9: n = 156; grade 10: n = 37; grade 11: n = 20; grade 12: n = 72). Delivery was distributed across 18 field sessions.
App logs registered 118 group sessions and complete coverage of 4,248 group-item submissions (118 × 36), consistent with full path completion at the group level [49]. Overall activity duration was approximately 90–120 minutes including briefing and walking transitions, while app-recorded active gameplay time per group ranged from 26 to 55 minutes (Mean (M) = 42.38 minutes) [49].
3.3. Participants and Recruitment
Participants were recruited through school-based participation in the activity, as a convenience sample embedded in school scheduling constraints and based on an educational broader educational program of the municipality of Aveiro [63].
Considering that questionnaires were administered anonymously, wave samples are treated as independent cohorts [55,56,57]. Prior waves (S1–S3) included multi-grade participation typical of lower and upper secondary school cohorts. In S4-DFU, 69 students responded to the questionnaire, with 67 meeting the complete-case criterion for the GCQuest ESV block (Q1–Q25).
This smaller distant follow-up motivated conservative claims, composition-aware reporting, and an explicit separation between primary analyses and sensitivity analyses [59,64,65].
Grade composition was recorded in S4-DFU via a dedicated metadata item (A.0.1) and is reported descriptively where relevant. Given small and imbalanced grade cell sizes, grade-stratified comparisons were treated as exploratory contextual checks rather than primary inferential targets, and pooled cross-wave estimates are interpreted as cohort-level patterns under repeated cross-sectional logic [55,57].
3.4. Instruments and Measures
3.4.1. Students’ Questionnaire Series, Wave Nomenclature, and Instrument Foundations
Four anonymous students’ questionnaires administrations were conducted. As independent instruments, they are referenced using a unified code that conveys both timing and the corresponding questionnaire form: S1-PRE (pre-intervention baseline), S2-POST (immediate post-intervention), S3-FU (follow-up), and S4-DFU (distant follow-up). In this study, the term wave denotes the data-collection cycle and its sample, whereas questionnaires form denotes the instrument version administered at that cycle (i.e., the specific form used in S1, S2, S3, or S4).
All forms were derived from the GreenComp-based Questionnaire (GCQuest) [58], developed to operationalize the European Sustainability Competence Framework (GreenComp) with a primary emphasis on the competence area Embodying Sustainability Values (ESV) [4].
Within GCQuest, ESV is represented through three interrelated competences, namely valuing sustainability, supporting fairness, and promoting nature, framed through self-assessment statements aligned with knowledge (K), skills (S), and attitudes (A), and therefore intended to capture perceived competence orientation rather than performance-based attainment [50].
Across all four waves, cross-wave trend inference is anchored in the invariant GCQuest ESV block consisting of 25 Likert-type items scored on a 1 to 6 scale (Q1–Q25), preserving construct continuity and comparability. The study’s primary quantitative outcome, ESV, is operationalized as the mean of Q1–Q25, with higher scores indicating stronger self-reported alignment with sustainability values and dispositions ([50]. The 6-point response format was selected to remove a neutral midpoint and encourage directional self-assessment [67,68,69]. Questionnaire completion time in S1–S3 was approximately 20 minutes [23], whereas S4-DFU required approximately 20–25 minutes due to added interpretability blocks.
Beyond the shared ESV anchor, wave-specific sections captured complementary descriptors and interpretability indicators. Regarding S4-DFU instrument, additional blocks were included to characterize sample composition (grade) and to contextualize distant follow-up patterns via mechanism-oriented indicators (such as heritage engagement and XR/UX frictions), while preserving the GCQuest anchor for cross-wave comparisons. Grade level was not collected in the previous questionnaires, which supports the data minimization principle. In S4-DFU, grade information was collected and used solely to verify eligibility, ensuring that only students who participated in the three previous data-collection cycles completed the questionnaire, in line with normal class progression [70].
3.4.2. Wave Instruments and Comparability Principle
Across waves, questionnaire forms differ in several sections, but all include a shared GCQuest block consisting of 25 Likert items scored on a 1–6 scale. Cross-wave trend analyses are anchored in this shared block to preserve construct continuity and comparability for the primary outcome, while acknowledging that Likert-type measurement motivates distribution-aware reporting and robustness checks [71,72,73]. Table 1 summarizes wave timing, questionnaire form characteristics, and analytic N/n for the invariant GCQuest ESV block.
As presented in Table 1, cross-wave analyses therefore treat the GCQuest block as the invariant measurement spine of the instrument series, while all other sections are reported and analyzed as wave-specific complements.
3.4.3. Primary Outcome: GCQuest and the ESV Composite Score
The primary quantitative outcome is ESV [4], operationalized as the mean of the 25 GCQuest Likert items (Q1–Q25; response scale 1 to 6). This operationalization matches the previously reported scoring pipeline and supports direct comparability across S1–S4, while remaining compatible with both rank-based inference and mean-based sensitivity analyses often used with Likert composites [71,73].
3.4.4. S4-Specific Indicators for Mechanisms and Interpretability
The S4-DFU questionnaire includes additional blocks beyond the shared GCQuest outcome, enabling exploratory mechanism-oriented analyses that contextualize distant follow-up patterns: (i) Composition metadata: grade (8th–12th) to support composition reporting and stratified descriptives; (ii) A.1. Impact and transfer indicators: includes open-ended retention/transfer prompts (A.1.1), a binary sustainable action indicator with a new open-ended example (A.1.2.1), and a global perceived influence rating (A.1.7; 1–6). (iii) A.2 Heritage engagement and narrative coherence: binary plus open-ended items supporting optional composite indices and qualitative themes; and, (iv) A.3 XR/UX and conceptual literacy indicators: usability barriers/facilitators and a three-category map-use item from which MapUsed and MapEasy are derived.
These blocks are treated as interpretability indicators that operationalize the field constraints discussed in Section 2.2, supporting bounded interpretation of distant follow-up patterns and deployment-facing refinement priorities rather than introducing additional primary outcomes.
For map-related variables, structural missingness is handled explicitly: MapUsed distinguishes users from non-users of the map, and MapEasy is computed only for map users (missing for “did not use”), consistent with missing-data principles that distinguish nonresponse from inapplicability [74].
3.5. Data Ingestion, Freezing, and Quality Control
The S4-DFU raw export was frozen prior to analysis, with immutable storage procedures and integrity recording. The final S4-DFU instrument file and the S4 to S3 mapping documentation were versioned to ensure traceability of variable definitions and item equivalence, consistent with reproducible computational practice [75,76]
Quality control procedures included duplicate detection (via integrity checks over response patterns where applicable), range validation for all Likert-type blocks (restricted to 1–6), validation of binary and three-category fields, and missingness profiling distinguishing structural missingness from nonresponse. Recoding, exclusions, or anomaly resolutions were documented in an auditable decision log [74,77].
The primary outcome (ESV) was computed under a strict complete-case rule for the 25-item GCQuest block (Q1–Q25), requiring valid responses to all 25 items. This criterion is reported transparently (raw N, analytic N, exclusions). As an optional sensitivity check, a relaxed completeness rule (at least 20 valid responses out of 25 items) can be applied to bound interpretations under partial item nonresponse [74].
3.6. Quantitative Analysis
3.6.1. Descriptive and Distribution-Aware Summaries
For ESV, the following are reported by wave: valid N, M, Standard Deviation (SD), 95% Confidence Interval (CI), Median (MDN), and Interquartile Range (IQR), complemented by distribution plots. For S4 binary items, proportions with 95% confidence intervals are reported; the three-category map-use item is summarized without forced collapsing [64]. For interpretability only, the combined share of map difficulty or non-use is reported descriptively alongside the three-category breakdown.
3.6.2. Cross-Wave Trend Inference (S1–S4)
Cross-wave differences in ESV are evaluated using rank-based inference consistent with the established pipeline: Kruskal–Wallis omnibus testing across waves with epsilon-squared effect size, followed (when permitted) by Dunn post hoc tests with Holm correction and Cliff’s delta effect sizes (reported with a first wave minus second wave sign convention) [81,82,83,84,85].
Considering that a harmonized covariate set was not available across all four waves, weighting was not applied; instead, composition adjustment was addressed through equal-n down-sampling sensitivity analyses [45]. This choice aligns with current expectations in applied XR and gamification research, where claims are strengthened when evidence is multiwave, construct-aligned, and accompanied by robustness checks that bound interpretation and support transferability [16,17,20]. A heteroscedasticity-robust mean-based sensitivity layer (Welch ANOVA and Holm-adjusted pairwise Welch tests, with Hedges’ g and confidence intervals) was used to check the stability of conclusions under an alternative inferential framing [86,87].
3.6.3. Threshold Prevalence Indicators
To support interpretability, two agreement thresholds are applied to the ESV distribution: (i) ESV ≥ 4.00 (above the midpoint 3.50 on a 1–6 scale); and, (ii) ESV ≥ 4.50 (high-agreement benchmark)
Prevalence is reported by wave. Cross-wave prevalence distributions may be compared using chi-square tests with Cramer’s V as effect size, explicitly framed as descriptive interpretability indicators rather than competence attainment claims, and interpreted alongside uncertainty rather than dichotomous p-value [64].
3.6.4. S4-Only Exploratory Associations (Mechanisms)
Given the observed analytic S4-DFU sample (N = 69, validated n = 67), S4-only analyses were treated as exploratory and mechanism-oriented. Analyses included Spearman associations (with bootstrap confidence intervals where feasible) between ESV and the global perceived influence rating (A.1.7), and between ESV/A.1.7 and the optional indices HeritageEngagement and TechUsability, plus MapUsed where applicable. Grade-level differences within S4-DFU were examined using Mann–Whitney tests as an exploratory contextual check. Boundaries of robustness were applied to limit the excessive interpretation of connections obtained from limited sample sizes [59,62].
3.7. Analysis Governance, Risk Controls, and Reproducibility
A pre-specified Standard Operating Procedure (SOP) governed S4-DFU ingestion, cleaning, scoring, quantitative analyses, and integration of S4 contextual indicators with the S1–S4 trend layer. The SOP defines mandatory inputs and outputs, acceptance criteria per phase (data freeze, QC, derivations, analyses, integration), and an audit stream requirement whereby any decision affecting analytic N, primary scoring, or recoding is logged and verifiable, aligning with reproducibility and open science recommendations [60,61,75,76].
A risk register with formal stop rules bounded inference under small-sample and composition constraints. In particular, between-wave inference and post hoc testing are downgraded or avoided when S4-DFU analytic N (67 validated ESV block questionnaires) is insufficient; subgroup inference is restricted under grade imbalance; and modelling is prohibited under sparse-cell conditions (for example, any relevant 2 × 2 cell count below 5 or separation warnings). The inflation associated with multiple testing is mitigated via family-wise correction (Holm minimum) for interconnected test sets [59,82].
Reproducibility is supported through versioned datasets, derivation specifications, decision logs, scripted table and figure generation, and stored intermediate outputs. The project file structure separates raw exports, processed data, code, outputs, and reporting materials to preserve auditability [75,76].
3.8. Ethics and Data Availability
Participation in the broader study was voluntary. Informed consent was obtained from teachers and from students with supplementary parental or legal guardian authorization. Data handling followed data-minimization principles aligned with General Data Protection Regulation (GDPR) dated 27 November 2024, and in accordance with ethical guidelines of the University of Aveiro (protocol code 1-CE/2025, 5 February 2025). This privacy-by-design stance is particularly relevant for gamified immersive systems deployed in public space, where usability logging and interaction traces must be bounded by explicit minimization and governance [70].
4. Results
4.1. Data Completeness and Analytic Sample (ESV Block, Q1–Q25)
Analyses were anchored in the identical GCQuest ESV block (Q1–Q25) across the four waves, applying a strict complete-case rule for this block. The analytic samples were: (i) S1-PRE, 221/221 complete; (ii) S2-POST, 438/439 complete; (iii) S3-FU, 434/434 complete; and, (iv) S4-DFU, 67/69 complete. In S2-POST, the excluded record contained seven missing cells concentrated in Q11–Q17. In S4-DFU, two records were excluded due to one missing response each, in Q15 and Q23. Unless stated otherwise, all results below use these complete-case samples.
4.2. Does Adding S4-DFU Change the Global ESV Trend Across S1–S4?
To address RQ1 and test whether the inclusion of S4-DFU alters the overall ESV trajectory, ESV was compared across S1–S4 using wave-level summary statistics and threshold prevalence patterns. Table 2 summarizes ESV (participant-level mean of Q1–Q25 under complete-case scoring) by wave with 95% confidence intervals. The distribution pattern presents a clear high point in S2-POST, immediately after the MARG’s implementation, a reduction in S3-FU, and a fallback to baseline conditions in S4-DFU. Threshold prevalence follows the same pattern: the share of high agreement (ESV ≥ 4.50) is highest immediately post-activity in S2-POST, decreases at follow-up, and is absent in S4-DFU.
Table 2 delineates a discernible wave-dependent pattern: ESV exhibits its apex immediately following the activity (S2-POST M = 4.64; MDN = 4.68), subsequently diminishes at the follow-up stage (S3-FU M = 4.13; MDN = 4.12), and is closer to baseline levels during the distant follow-up (S4-DFU M = 3.79; MDN = 3.84 in contrast to S1-PRE M = 3.70; MDN = 3.60). The variability contracts following the baseline measurement (SD 0.54 in S1-PRE compared to 0.36 in S3-FU and 0.30 in S4-DFU). The prevalence of thresholds reflects this transition: ESV ≥ 4.00 escalates from 29.00% (S1-PRE) to 88.60% (S2-POST), sustains a considerable level at 75.10% (S3-FU), and declines to 34.30% (S4-DFU); for ESV ≥ 4.50, the prevalence peaks in S2-POST (70.80%), diminishes in S3-FU (9.90%), and is non-existent in S4-DFU (0.00%, upper 95% bound 5.40%).
A comprehensive between-wave analysis corroborated statistically significant discrepancies in ESV across the four measurement waves (Kruskal–Wallis H(3) = 478.47, p < 0.001; epsilon squared = 0.41). Employing pairwise Dunn tests with Holm correction elucidated this pattern (Table 3). S2-POST was markedly elevated compared to all other waves (all pHolm < 0.001). S3-FU remained significantly elevated relative to both S1-PRE and S4-DFU (both pHolm < 0.001). In contrast, a small but statistically detectable difference was observed between S1-PRE and S4-DFU (Z = -2.11, pHolm = 0.0345; Cliff’s delta = -0.171). Effect sizes were considerable remarkable for contrasts involving S2-POST and moderate for S3-FU versus S4-DFU (Table 3).
As presented in Table 3, adding S4-DFU shifts interpretation away from any monotonic trend. Instead, the aggregate pattern is non-monotonic, characterized by a post-activity peak (S2-POST), partial attenuation (S3-FU), and a later-wave convergence toward baseline in S4-DFU that is accompanied by upper-tail attenuation.
Figure 2 visualizes the ESV distributions across waves, highlighting the pronounced S2-POST peak, attenuation in S3-FU, and the later-wave convergence toward baseline with upper-tail attenuation in S4-DFU.
Figure 2 displays the distribution of participant-level ESV (mean of Q1–Q25; 1–6) for each wave using the analytic samples (S1-PRE N = 221; S2-POST N = 438; S3-FU N = 434; S4-DFU N = 67), supporting visual inspection of location shifts, dispersion, and upper-tail attenuation.
4.3. Is the Item-Level Pattern in S4 Consistent with S1–S3 and Which Items Are Most Temporally Sensitive?
To answer RQ2, item-level patterns were evaluated across S1–S4 using Kruskal–Wallis tests (Holm-adjusted), which were significant for all 25 items (pHolm < .001), largely reflecting the pronounced S2-POST peak; temporal sensitivity in the most recent period was then isolated via Holm-corrected Mann–Whitney contrasts between S3-FU and S4-DFU, identifying eleven items with significant declines in S4-DFU (Table 4), led by Q19 (Δ mean S4 minus S3 = -1.32; pHolm < 1e-15; Cliff’s delta = 0.614), followed by Q25 and Q4, with the remaining effects in the moderate range (|Delta| ≈ 0.35–0.55), and full item wording and mappings reported in Appendix A.
As presented in Table 4, this item-level evidence indicates that the decline from S3-FU to S4-DFU is not confined to a single question; it is concentrated in a subset of items that jointly contribute to the aggregate ESV reduction observed in RQ1.
Figure 3 summarizes item-level sensitivity by displaying Q1–Q25 mean profiles across waves, showing that change is non-uniform across items rather than a homogeneous shift.
Figure 3 displays the distribution of participants-level ESV (mean of Q1–Q25; 1–6) for each wave using the analytic samples (S1-PRE N = 221; S2-POST N = 438; S3-FU N = 434; S4-DFU N = 67), supporting visual inspection of location shifts, dispersion, and upper-tail attenuation.
4.4. Are Trend Inferences Robust to Plausible Analytic Choices?
To answer RQ3, robustness and sensitivity analyses assessed whether the observed four-wave ESV pattern (S2-POST highest, S3-FU intermediate, and S4-DFU closer to S1-PRE in practical terms) is contingent on scoring choices, sample-size imbalance, or distributional and measurement properties: (i) Alternative scoring: using the participants-level MDN across Q1–Q25 (instead of the mean) reproduced the same qualitative pattern, and the omnibus across-wave test remained significant (Kruskal–Wallis H(3) = 403.46, p < .001; epsilon squared = 0.35); (ii) Downsampling to address N imbalance: to test whether larger samples in S2-POST and S3-FU were driving detection, repeated downsampling to n = 67 per wave (2,000 iterations) was performed. The Kruskal–Wallis result remained consistently significant (MDN p = 2.24e-24; 95% CI ≈ [7.10e-30, 6.41e-19]). Under this equal-n regime, the S1-PRE versus S4-DFU contrast was rarely significant after Holm correction (0.50% of iterations), consistent with the small magnitude of that difference and limited power under balanced sampling; (iii) Distributional shift, not only mean shift: a shift-function analysis comparing ESV distributions indicated that S4-DFU was lower than S3-FU across the distribution. Differences (S4 minus S3) at key quantiles were negative with bootstrap 95% intervals excluding zero, for example: q10 = -0.47 (95% CI -0.60, -0.23), q50 = -0.28 (95% CI -0.36, -0.20), and q90 = -0.36 (95% CI -0.52, -0.30); (iv) Response-style indicators: the proportion of higher top responses (5–6) across all Q cells was markedly higher in S2-POST (57.10%) than in S1-PRE (32.30%), S3-FU (35.50%), and S4-DFU (23.10%). This pattern is consistent with a stronger ceiling tendency in S2-POST and supports interpreting the peak as a distributional, not only a location, shift; (v) Internal consistency: Cronbach’s alpha for the 25-item construct was 0.72 in S1-PRE (95% bootstrap CI 0.66, 0.77), 0.88 in S2-POST (0.85, 0.90), 0.75 in S3-FU (0.69, 0.80), and 0.60 in S4-DFU (0.38, 0.72). The wider uncertainty in S4-DFU is consistent with its smaller sample size; and, (vi) Equivalence framing for S1-PRE versus S4-DFU (supplementary): regarding the small S1-PRE versus S4-DFU contrast, an equivalence test evaluated practical similarity using a smallest effect size of interest of ±0.20 ESV points. The mean difference (S4 minus S1) was 0.091 with a 90% CI of (0.006, 0.176), fully contained within the equivalence bounds; the two one-sided tests supported equivalence (p = 0.017).
Overall, these checks indicate that between-wave differences are not an artefact of a specific scoring choice and that the S1-PRE versus S4-DFU contrast remains small under balanced-n sensitivity analyses.
4.5. Exploratory S4-DFU Contextual Indicators (Regarded as Not Primary Outcomes)
S4-DFU includes additional contextual items related to perceived heritage value and technology experience. These measures were used only to contextualize S4-DFU patterns and to bound interpretation of distant follow-up evidence, not to replace the primary cross-wave outcomes.
In the analytic S4-DFU sample (N = 67), a Heritage Engagement index (sum of five yes/no items A.2.1 to A.2.5, range 0 to 5) had mean 3.78 (SD = 0.98; MDN = 4). A Technology Usability index (A.3.2 and A.3.4 coded positive, plus reverse-coded A.3.5 and A.3.6, range 0 to 4) had M = 3.03 (SD = 0.87; MDN = 3). Most participants reported that using the path map was easy (A.3.3: 47/67, 70.10%), but a non-trivial share reported navigation frictions, either map difficulty or non-use (20/67, 29.90%; Table 5). None of these contextual indicators showed a meaningful association with ESV within S4-DFU (Spearman absolute rho values below 0.09; all p > 0.49). Variations in ESV across different grade levels within S4-DFU, did not yield statistically significant results (Mann-Whitney p = 0.176).
Table 5 synthesizes S4-DFU’s contextual indicators: heritage engagement was high, while usability and navigation results indicate generally favorable XR/UX experience but with a meaningful minority reporting map-related friction (difficulty or non-use), which is informative for bounding interpretation of distant follow-up patterns and for prioritizing deployment-facing refinements. These indicators also speak directly to UX/UI design questions in gamified immersive systems, where navigation interfaces can moderate engagement, pacing, and outcome signals under real-world constraints.
4.6. Baseline-to-Latest Contrast: S1-PRE vs S4-DFU (Complete-Case Q1–Q25)
This subsection isolates the baseline wave (S1-PRE) and the latest wave (S4-DFU) to provide a start-to-last contrast that complements the four-wave omnibus analyses. All computations use complete-case responses for Q1–Q25 (ESV block), consistent with the frozen analytic rule.
4.6.1. Descriptives and 95% Confidence Intervals
ESV was computed at the participant level as the mean of Q1–Q25. Ninety-five percent confidence intervals (CI) for means and medians were estimated via percentile bootstrap (B = 20,000). Proportion CIs were computed using the Wilson score method. Table 6 reports wave descriptives for S1-PRE and S4-DFU (complete-case Q1–Q25), including location, dispersion, and two threshold-prevalence indicators.
As presented in Table 6 two patterns are noteworthy. First, central tendency is similar across waves: S1-PRE M = 3.70 (95% CI (3.63, 3.77)) versus S4-DFU M = 3.79 (95% CI (3.72, 3.86)), with overlapping CIs, whereas the median is higher in S4-DFU (3.84, 95% CI (3.76, 3.92)) than in S1-PRE (3.60, 95% CI (3.56, 3.72)). Second, dispersion and upper-tail prevalence differ: S4-DFU shows lower variability (SD 0.30; IQR 3.64–4.02) than S1-PRE (SD 0.54; IQR 3.32–4.08), and no participants reach the stricter threshold ESV ≥ 4.50 in S4-DFU (0.00%, 95% CI (0.00%, 5.40%)) compared with S1-PRE (9.00%, 95% CI (5.90%, 13.60%)).
4.6.2. Two-Sample Contrast (S1 vs S4), Effect Sizes, and 95% Intervals
A two-sided Mann–Whitney U test was conducted for the primary comparison. Complementary estimators included Cliff’s delta and the Hodges–Lehmann location shift. CIs for distributional estimators were obtained via bootstrap. Table 7 illustrates the correlated positions, their fluctuations, and the effect size estimates.
Table 7 indicates a small center-shift in ESV for S4-DFU relative to S1-PRE (MDN and Hodges–Lehmann differences positive; MWU p = 0.0345; small Cliff’s delta), and this contrast remains comparatively modest in the four-wave inference frame next to the larger S2-POST and S3-FU separations.
Interpretation should be framed in two layers. As an isolated two-wave comparison, S4-DFU shows a small upward shift relative to S1-PRE around the center of the distribution (positive MDN and Hodges–Lehmann differences; MWU p = 0.0345; small Cliff’s delta). Within the four-wave family of contrasts, the S1 versus S4 separation remains comparatively modest when placed alongside the larger differences involving S2-POST and S3-FU (as presented in Table 3).
4.6.3. Differences in High-Agreement Prevalence (S4 − S1) with 95% CI
Prevalence differences were computed using Newcombe’s method for the CI of a difference in proportions. Table 8 reports prevalence levels and differences in percentage points with 95% CI.
As presented in Table 8, the strict threshold (ESV ≥ 4.50) is particularly informative because it reflects the presence or absence of a high-agreement tail. In S4-DFU, this tail is absent under the complete-case rule.
4.6.4. Distributional Shift Across Quantiles (Shift Function)
Item-level S1 vs S4 contrasts were examined using Mann–Whitney tests for each item, with Holm correction across 25 tests. Six items remained statistically reliable after correction (Table 9). Full item wording and item-type classification used for content-sensitive interpretation are provided in Appendix A.
Table 9 presents a mixed baseline-to-latest profile, with six items remaining significant after Holm correction, comprising three decreases (largest for Q19) and three increases (largest for Q18), indicating selective attenuation and consolidation rather than uniform change from S1-PRE to S4-DFU.
A content-sensitive reading of these changes can be structured by item type, aligned with the questionnaire’s intent to capture prolonged sustainability-value enactment (“Since participating in the activity, in my daily life I try to…”). Items that decreased from baseline to latest concentrate in statements that demand sustained critical reflection and self-regulation of everyday practices, particularly those involving resource-oriented self-assessment (Q19) and broader critical appraisal of contextual impacts (Q25), alongside a justice-oriented component (Q9). Items that increased are closer to values-based appraisal and declared intent (Q6, Q12) and a culturally framed appreciation component (Q18). Overall, the baseline-to-latest contrast is therefore not a uniform shift in ESV, but a mixed pattern in which some orientation or endorsement items rise while maintenance-sensitive, effortful self-regulation and critique items decline, consistent with the quantile results and with the loss of the high-agreement tail in S4-DFU.
Figure 4 displays item-level mean differences between S4-DFU and S1-PRE (Delta = M S4-DFU minus M S1-PRE) for Q1–Q25 as bars, with 95% bootstrap confidence intervals and Holm-adjusted significance markers for the S4 versus S1 item-wise contrasts (Mann–Whitney U with Holm correction; Holm, 1979; Mann & Whitney, 1947).
As presented in Figure 4, the baseline-to-latest contrast remains mixed at item level rather than uniformly positive. The largest positive deltas cluster in items closer to values-based appraisal or declared intent, whereas the clearest declines concentrate in maintenance-sensitive items that require sustained self-monitoring and critical appraisal of everyday practices. This concentration of statistically detectable shifts in a subset of items supports the earlier distributional interpretation of attenuation at distant follow-up and motivates the need to consider reinforcement opportunities if durable enactment-oriented claims are a design goal.
5. Discussion
5.1. What the Four-Wave Evidence Adds to Competence-Oriented ESD Evaluation
The current study enhances a competence-focused evaluative framework by incorporating a fourth repeated cross-sectional wave (S4-DFU) to an established multiwave dataset that is rooted in a uniform 25-item ESV block (Q1–Q25).
This methodological selection directly addresses an evaluative deficiency highlighted in competence-oriented ESD, specifically that credible assertions are contingent upon construct-aligned metrics and methodologies capable of differentiating intervention-consistent trends from artifacts resulting from temporal and cohort variability [3,5,6]. Within this context, the principal outcome is not characterized by a linear competence trajectory. Rather, the inclusion of S4-DFU refines the interpretation into a non-linear pattern: a marked peak immediately following the activity (S2-POST), a decline during the follow-up phase (S3-FU), and a convergence toward baseline levels in the most recent wave (S4-DFU) at the aggregate ESV level (Table 2 and Table 3). This trend aligns with the broader observation that studies employing applied XR and gamified learning frequently document more robust proximal indicators than enduring population-level trend improvements, particularly in scenarios where interventions are deployed under authentic field constraints [7,8,18,19,20].
Concurrently, the multiwave methodology facilitates a more nuanced interpretation than a mere “effect or no effect” dichotomy. The findings suggest that (i) inter-wave disparities are both significant and systematic, (ii) the signal is predominantly concentrated in the immediate post-activity phase, and (iii) subsequent cohorts do not maintain the distributional characteristics observed in S2-POST, particularly within the upper tail.
5.2. Interpreting the S2-POST Peak Under Mobile AR and Gamification as a Socio-Technical System
The strong elevation in S2-POST may be compatible with the Art Nouveau Path being enacted as a coherent socio-technical learning path, in which competence prompts are triggered in situ under time-bounded, collaborative progression and are therefore most intense and interpretable near the intervention point (Section 2.2). Under this lens, the post-activity peak is not attributed to AR or gamification in isolation: it reflects a high-coherence enactment phase where contextual cues, task framing, pacing, and feedback converge to make values-based judgement salient and actionable [49]. Accordingly, the proximal signal is most defensibly interpreted as an instructional-system effect bounded by enactment conditions, rather than as a media effect.
Gamification likely contributes to this proximal signal by structuring progression, feedback, and task completion under mobility and time constraints, rather than operating as a purely decorative engagement layer [9,44]. Meta-analytic work shows that gamification yields positive average effects on learning-related outcomes, while also documenting substantial heterogeneity that depends on context, duration, and alignment with learning goals [12,13,18]. This heterogeneity is consistent with the present results: the strongest shift occurs where the socio-technical system is most intense and coherent, immediately after participation, when the experience is salient and the competence prompts are recent.
Motivational accounts grounded in self-determination theory also provide a plausible interpretive layer, insofar as outdoor collaborative tasks can temporarily amplify perceived autonomy, competence, and relatedness during and immediately after enactment [10,11]. This does not imply that the post-activity peak is purely motivational; rather, it offers a theoretically consistent explanation for why competence-aligned self-report indicators often show their strongest signal near the intervention point in applied learning contexts [12,13].
5.3. Why Attenuation and Convergence Toward Baseline Are Not Anomalous in Competence-Oriented ESD Measurement
The attenuation in S3-FU and the convergence toward baseline in S4-DFU should not be interpreted as a failure of competence-oriented design by default. Competence frameworks treat sustainability competences as integrated capabilities and dispositions that require repeated opportunities for application, reflection, and reinforcement across contexts, rather than a single exposure, even when the exposure is high quality [3,4,6]. Empirical ESD studies that detect competence-relevant change under real-world designs typically foreground sustained pedagogical sequences and repeated practice opportunities, particularly for systems thinking and action competence constructs [88,89]. A single path experience, even when well-designed, is therefore expected to produce a strong proximal salience effect and a weaker long-horizon signal unless reinforced.
A second interpretive layer concerns self-report validity threats that are explicitly relevant for competence indicators across cohorts. Response shift and reference bias can lead different cohorts to use response scales differently or to recalibrate internal standards for what “trying to” enact sustainability values means in daily life [25,26].The present design reduces construct drift by anchoring all waves in an identical item block, but cohort-level changes in standards remain plausible in competence-oriented self-report measurement. For that reason, the observed wave pattern is most defensibly treated as distribution-level evidence under repeated cross-sectional inference, not as an individual retention trajectory [22,45,46]. The emphasis on robustness checks and distribution-aware reporting aligns with these interpretive concepts.
5.4. Item-Level Meaning: What Changes Appear Fragile at Distant Follow-Up
A key value of the present analysis is that it shows the non-uniformity of change within the ESV construct. Item-level contrasts indicate that the decline from S3-FU to S4-DFU concentrates in a subset of items (Table 4), and the baseline-to-latest contrast (S1-PRE vs S4-DFU) yields a mixed pattern, with both increases and decreases among the most reliable items (Table 6; Appendix A). This supports an interpretation in which aggregate ESV changes cannot be reduced to a single “more or less sustainable” conclusion. Instead, specific competence-relevant dimensions appear more fragile at distant follow-up.
The strongest declines are located in items that demand sustained self-regulation and critical appraisal in everyday life, especially the item targeting the questioning of personal needs and longer-term resource management (Q19). This item is conceptually closer to effortful enactment than to declarative endorsement, and its behavior is therefore consistent with the competence perspective in GreenComp that values-based sustainability is not only a matter of agreement but a capacity for disciplined judgement and action over time [4]. In contrast, items that increase in the baseline-to-latest contrast include statements closer to values-based appraisal and declared intent (for example, Q6 and Q12) and culturally framed appreciation (Q18). This asymmetry is theoretically coherent: orientation and endorsement can remain elevated or recover, while the most effortful and self-demanding items may require continued scaffolding to remain high in later cohorts.
These item-level differences reinforce the argument that competence-oriented evaluation benefits from moving beyond a single composite mean and from reporting where the signal concentrates, as advocated in competence assessment reviews [5]. In applied XR and gamified learning, this is particularly important because contextual constraints and design choices shape which elements of the competence construct are actually elicited and rehearsed during the experience [7,34,44].
5.5. Implications for Applied XR Evidence Standards and for Interpreting Transfer-Relevant Results
From an applied research perspective, the present discussion supports three interpretive implications that align with expectations in AR and gamification syntheses:
- First, multiwave evidence strengthens claims when it is paired with construct-aligned outcomes and robustness checks, rather than relying on single deployments or short pre-post windows [7,18,20]. The inclusion of S4-DFU functions as a stress test: the S2-POST peak remains a robust feature of the evidence, but the longer-horizon pattern is clarified as attenuation and convergence toward baseline.
- Second, field constraints should be treated as first-order explanatory variables when interpreting outcome trajectories in outdoor mobile AR. Under the socio-technical framing established in Section 2.2, usability friction, technical disruption, attentional switching, and orchestration demands can systematically divert processing away from competence-relevant reasoning, thereby shaping when self-report signals peak and how they attenuate across cohorts [7,34,36,37]. In this perspective, the pronounced S2-POST elevation and later attenuation are compatible with a high-salience field encounter that is difficult to sustain without reinforcement cycles beyond the path, rather than with a monotonic competence trajectory.
- Third, S4-DFU contextual indicators suggest that XR/UX frictions were not negligible in the field setting: 20/67 participants (29.90%) reported map-navigation difficulty or did not use the map. These indicators are not treated as outcomes, but as deployment-relevant bounds that qualify transfer-oriented interpretations and inform refinement priorities for gamified XR systems deployed in authentic settings [20]. Such navigation and interface frictions are also a known moderating factor in immersive experiences more broadly, including VR, where interaction design choices can shape cognitive load, persistence, and the interpretability of learning signals [20].
- Fourth, transparency about the intervention as a socio-technical system remains central for transfer-relevant interpretation. The Art Nouveau Path has been documented as a competence-oriented design anchored in GreenComp [4], providing the design and construct-alignment basis for outcome interpretation [23,24,49,50]. Other related studies extend the adoption and resilience lenses through a city-scale transfer focus and a curriculum-aligned urban resilience framing.
6. Conclusions, Limitations, and Future Paths
6.1. Conclusions
This study extended a competence-oriented evaluation of a curriculum-aligned, outdoor mobile AR learning path by adding a fourth repeated cross-sectional wave (S4-DFU) to an existing multiwave dataset anchored in the identical 25-item ESV block (Q1–Q25). The resulting four-wave evidence supports three conclusions:
- First, the aggregate trajectory is non-monotonic. ESV shows a pronounced post-activity elevation (S2-POST), partial attenuation at follow-up (S3-FU), and convergence toward baseline levels in the latest wave (S4-DFU). The addition of S4-DFU therefore strengthens interpretive discipline by moving the narrative away from monotonic trend expectations and toward a time-sensitive pattern in which proximal signals are strongest;
- Second, change is not uniform within the ESV construct. Item-level analyses indicate that the recent decline from S3-FU to S4-DFU is concentrated in a subset of items, most notably the item targeting longer-term resource management through questioning personal needs (Q19). In the baseline-to-latest contrast (S1-PRE versus S4-DFU), reliable item-level differences show a mixed pattern, with increases in some values-consistent appraisal and cultural appreciation items alongside decreases in maintenance-sensitive self-regulation and critique items. This reinforces the value of reporting item-level concentration of effects when interpreting competence-oriented measures;
- Third, the core pattern is robust to plausible analytic choices. The main conclusions were preserved under alternative scoring (median-based ESV), equal-n sensitivity through repeated downsampling, and distribution-aware analyses (shift functions).
These checks signify that comprehensive interpretation is not merely a byproduct of an individual scoring criterion or a discrepancy in sample representation.
6.2. Limitations
Several limitations constrain inference and should frame interpretation:
- First, the four-wave evidence is repeated cross-sectional rather than individually longitudinal, so observed differences can reflect cohort composition and contextual variation as well as intervention-consistent development. Even when measurement is held constant, the design cannot directly separate within-person change from between-cohort differences, and causal attribution remains constrained in the absence of random assignment or individual tracking [55,56];
- Second, sampling is necessarily opportunistic within school-based field conditions, and the distant follow-up wave is affected by reachability and participation constraints, increasing the plausibility of selection effects and limiting the ability to fully characterize nonresponse mechanisms [74];
- Third, outcomes rely on self-report Likert-type responses, which can be influenced by social desirability, shifting internal standards, and appraisal recalibration over time. These mechanisms are consistent with response shift and reference bias, which can distort between-group or between-wave comparisons even when instrument wording is unchanged [25,26];
- Fourth, the analytic sample size in the latest wave is comparatively small, so the study is less sensitive to small effects and estimates may be more sample-dependent than in earlier waves; this limitation is structural in long-horizon school follow-ups and should temper claims about subtle item-level changes [59];
- Fifth, item-wise inference entails multiple comparisons; although familywise control was applied, statistical significance should not be treated as a binary proxy for educational importance, and interpretation should remain anchored in effect magnitudes, uncertainty, and the plausibility of mechanisms [64];
- Sixth, field deployment of mobile AR introduces variability in device heterogeneity, outdoor lighting, tracking stability, and usability frictions, which can influence experience quality and potentially downstream reporting; these conditions are difficult to standardize across cohorts and academic years in authentic settings [7,34,37];
- Seventh, this study operationalizes sustainability competence through a single GreenComp [4] domain and self-assessed endorsement, so generalization to broader competence domains, behavioral enactment, or performance-based outcomes should be treated as out of scope;
- Eighth, additional S4-DFU blocks and open-ended prompts were collected to support transfer-oriented and planning-facing analyses, but they are not exhaustively analyzed in this article and are reserved for follow-on work.
6.3. Future Paths
Future work can strengthen both substantive and methodological defensibility while remaining compatible with the practical constraints of outdoor, school-mediated implementations:
- First, the observed pattern motivates designs that treat the path as a competence catalyst that benefits from planned reinforcement cycles. Lightweight booster routines aligned with the curriculum (brief consolidation prompts, short classroom revisits, or periodic micro-tasks connected to selected POIs) are plausible next steps to test whether maintenance-sensitive items can be stabilized across later cohorts;
- Second, formal tests of measurement invariance for the ordinal ESV block across waves would strengthen comparability claims and help separate outcome shifts from response-style shifts. Complementary indicators, such as short behavioral intention checks, trace-derived proxies, or teacher-reported corroboration, could also improve triangulation without increasing student burden;
- Third, within repeated cross-sectional constraints, future analyses can use trend-focused quasi-experimental approaches, such as cohort-aligned sampling, matched school comparisons, or interrupted time-series style logic if implementation timing and exposure intensity can be documented more precisely;
- Fourth, S4-DFU included mechanism- and transfer-oriented blocks beyond the invariant ESV core, while the present article intentionally treats these as contextual bounds rather than outcomes. A dedicated continuation paper can therefore exploit the unused S4-DFU extensions to examine transfer-facing indicators, including everyday noticing and planning-facing micro-interventions for public space, thereby extending the research program from competence trend monitoring to human-centered urban design and climate-adaptation cue legibility;
- Fifth, replication should be treated as a primary research path. EduCITY provides authoring tools that support the creation of AR-based, place-based learning experiences, and its web-based workflow enables location-based games across multiple urban settings. This makes it feasible to replicate the Art Nouveau Path logic in other Art Nouveau cities or to translate it to other heritage typologies, while testing how local morphology, POI density, and municipal routines moderate both usability envelopes and learning-relevant signals;
- Sixth, scalable deployment requires explicit governance, stewardship, and maintenance routines rather than ad hoc pilots. Future work should operationalize a municipal-ready replication package, including content rights and update cycles, safety and accessibility procedures, device and connectivity contingencies, and privacy-proportionate monitoring, so that cross-city evidence becomes comparable and cumulative.
6.4. Synthesis
In the broader research program focused on competence-oriented ESD in an urban mobile AR learning ecosystem, this study adds a temporal stress test: the intervention can generate strong proximal competence signals at scale, but later waves suggest that population-level trend gains are conditional and likely depend on reinforcement and stable implementation conditions. This synthesis provides a defensible bridge to future research that focuses on maintenance mechanisms, longitudinal comparability, and sustainable delivery routines in real educational systems.
Author Contributions
Conceptualization, J.F.-S.; methodology, J.F.-S.; validation, J.F.-S. and L.P.; formal analysis, J.F.-S.; investigation, J.F.-S.; resources, J.F.-S.; data curation, J.F.-S.; writing–original draft, J.F.-S.; writing–review and editing J.F.-S. and L.P.; visualization, J.F.-S.; supervision, L.P.; project administration, J.F.-S. and L.P. All authors have read and agreed to the published version of the manuscript.
Funding
This work was funded by National Funds through the FCT – Fundação para a Ciência e a Tecnologia, I.P., under Grant Number 2023.00257.BD., with the following DOI: https://doi.org/10.54499/2023.00257.BD. The EduCITY project is funded by National Funds through the FCT – Fundação para a Ciência e a Tecnologia, I.P., under the project PTDC/CED-EDG/0197/2021.
Institutional Review Board Statement
This study was conducted in accordance with the Declaration of Helsinki, approved by the GDPR (27 November 2024), and approved by the Ethics Committee of University of Aveiro (protocol code 1-CE/2025 on 5 February 2025).
Informed Consent Statement
Informed consent was obtained from all participants involved in the study.
Data Availability Statement
The datasets supporting the findings of this study were generated during the implementation of the Art Nouveau Path mobile augmented reality game in Aveiro, Portugal. The raw research datasets (student questionnaires S1-PRE, S2-POST, S3-FU, and S4-DFU; teacher reflection forms T1-R; and teacher observation records T2-OBS) are not publicly available due to GDPR and ethical restrictions. Versions of these datasets may be made available by the corresponding authors upon reasonable request, subject to institutional approval and applicable data-sharing conditions. To support transparency, non-sensitive instruments and aggregated resources are openly available in the project’s Zenodo community “Art Nouveau Path”, including: the complete Art Nouveau Path MARG and its mapping to the GreenComp framework (DOI: 10.5281/zenodo.16981236). All publicly shared files omit sensitive fields, and full item-level gameplay logs are available upon reasonable request under the same ethical and institutional conditions.
Acknowledgments
The authors acknowledge the support of the research team of the EduCITY project. The authors also appreciate the willingness of the participants to contribute to this study. During the preparation of this manuscript, the authors used Microsoft Word, Excel and PowerPoint (Microsoft 365), DeepL (DeepL Free Translator) was used to translate selected passages from Portuguese to English, ChatGPT (GPT-5, released 7 August 2025), R (version 4.4.1) and Julius.AI for the respective purposes of writing and editing text, cleaning and organizing data, designing schemes and tables, translation and language improvement, statistical analysis and data visualization, and cross checking descriptive statistics, clustering procedures and wording consistency. All outputs were treated as suggestions. Quantitative data were initially cleaned and preprocessed in Excel and subsequently analyzed and visualized in R (version 4.4.1) using the tidyverse ecosystem and ggplot2 to generate publication quality figures. Julius.AI was used only as an auxiliary environment to recalculate selected statistics and to validate the reproducibility of the R-based analyses. Numerical data outputs and score computations were independently cross-checked in MATLAB (version R2025b) by an external researcher as a computational verification step. The authors have reviewed and edited all outputs and take full responsibility for the content of this publication.
Conflicts of Interest
The authors declare no conflicts of interest. The funders had no role in the design of the study; in the collection, analyses, or interpretation of data; in the writing of the manuscript; or in the decision to publish the results.
Abbreviations
The following abbreviations are used in this manuscript:
| AR | Augmented Reality |
| S1-PRE | Students’ Pre-activity Questionnaire |
| S2-POST | Students’ Post-activity Questionnaire |
| S3-FU | Students’ Follow-up Questionnaire |
| S4-DFU | Students’ Distant Follow-up Questionnaire |
| GCQuest | GreenComp-Based Questionnaire |
| ESV | ‘Embodying Sustainability Values’ |
| XR | Extended Reality |
| (HCI) | Human–Computer Interaction |
| UX | User Experience |
| ESD | Education for Sustainable Development |
| UNESCO | United Nations Educational, Scientific and Cultural Organization |
| GreenComp | European Sustainability Competence Framework |
| MARG | Mobile Augmented Reality Game |
| RQ | Research Question |
| Q | GCQuest item |
| MR | Mixed Reality |
| DTLE | Digital Teaching and Learning Environment |
| POI | Point of Interest |
| M | Mean |
| K | Knowledge |
| S | Skills |
| A | Attitudes |
| SD | Standard Deviation |
| CI | Confidence Interval |
| MDN | Median |
| IQR | Interquartile Range |
| SOP | Standard Operating Procedure |
| GDPR | General Data Protection Regulation |
| R | Range |
| MWU | Mann–Whitney U test |
| pp | Percentual Point |
Appendix A
Appendix A.1. S4-DFU (Distant Follow-Up) Questionnaire: Blocks, Response Types, and Coding Rules
The S4-DFU questionnaire (distant follow-up wave) combines the standard GreenComp-based Questionnaire (GCQuest) block for Embodying Sustainability Values (ESV; Q1–Q25) with additional, mechanism-oriented blocks capturing delayed transfer indicators, heritage engagement and narrative coherence, recalled usability and feature use, and public-space cue literacy plus micro-intervention proposals. Items are referenced by their dataset codes.

Table A1.
Questionnaire blocks and response formats (S4-DFU).
| Item code | Indicator / construct (brief) | Response format |
Notes (skip logic, coding) |
|---|---|---|---|
| A.0 | Grade band (composition metadata) | Categorical | Self-reported grade band at the time of S4-DFU. |
| A.1.1 | Everyday noticing / retention prompt (open recall) | Open-ended text | Short free-text statement; analyzed qualitatively. |
| A.1.2 | Sustainability-related behavior change since the path | Yes/No | Binary self-report indicator. |
| A.1.2.1 | Example of sustainability-related action adopted | Open-ended text | Conditional follow-up to A.1.2 (if “Yes”); qualitative. |
| A.1.3 | Additional transfer indicator (binary) | Yes/No | Binary self-report indicator (as administered on the S4-DFU form). |
| A.1.4 | Additional transfer indicator (binary) | Yes/No | Binary self-report indicator (as administered on the S4-DFU form). |
| A.1.5.1 | Perceived value of learning outdoors / in situ (binary) | Yes/No | Binary preference/valuation indicator. |
| A.1.5.2 | Justification for A.1.5.1 | Open-ended text | Conditional follow-up to A.1.5.1; qualitative. |
| A.1.6 | Personal definition of “sustainability” | Open-ended text | Short free-text definition; qualitative. |
| A.1.7 (1-6) | Global perceived influence of the path on daily life | 6-point Likert | Higher values indicate higher perceived influence. |
| A.2.1 | Heritage recall / engagement trigger (binary) | Yes/No | Binary indicator. |
| A.2.1.1 | Example of recalled heritage element | Open-ended text | Conditional follow-up to A.2.1; qualitative. |
| A.2.2 | Heritage-related engagement indicator (binary) | Yes/No | Binary indicator (as administered on the S4-DFU form). |
| A.2.3 | Heritage-related engagement indicator (binary) | Yes/No | Binary indicator (as administered on the S4-DFU form). |
| A.2.4 | Civic responsibility for local heritage (binary) | Yes/No | Binary indicator. |
| A.2.5 | City as a shared resource (binary) | Yes/No | Binary indicator. |
| A.2.6.1 | Perceived narrative coherence (binary) | Yes/No | Binary indicator. |
| A.2.6.2 | Explanation for A.2.6.1 | Open-ended text | Conditional follow-up to A.2.6.1; qualitative. |
| A.3.1 | Recalled usability / ease indicator (binary) | Yes/No | Binary indicator (as administered on the S4-DFU form). |
| A.3.2 | Recalled usability / ease indicator (binary) | Yes/No | Binary indicator (as administered on the S4-DFU form). |
| A.3.3 | Use of the in-app map feature | Yes/No/Did not use | Feature-use item; “did not use” enables explicit structural non-use. |
| A.3.4 | Recalled usability / ease indicator (binary) | Yes/No | Binary indicator (as administered on the S4-DFU form). |
| A.3.5 | Recalled usability / ease indicator (binary) | Yes/No | Binary indicator (as administered on the S4-DFU form). |
| A.3.6 | Recalled usability / ease indicator (binary) | Yes/No | Binary indicator (as administered on the S4-DFU form). |
| A.3.7 | Recalled usability / ease indicator (binary) | Yes/No | Binary indicator (as administered on the S4-DFU form). |
| A.3.8 | Recalled usability / ease indicator (binary) | Yes/No | Binary indicator (as administered on the S4-DFU form). |
| A.3.9 | Most salient facilitator or barrier (e.g., weather, glare, signal) | Open-ended text | Free-text; analyzed qualitatively; supports interpretation of A.3.1–A.3.8. |
| A.3.10 | Suggested improvement to the path/app | Open-ended text (optional) | Free-text; may be blank/NA; analyzed qualitatively. |
| A.4.1.1 (1-6) | Cue literacy: perceived salience of public-space domain 1 | 6-point Likert | Six parallel items (A.4.1.1–A.4.1.6) administered in the order presented on the form. |
| A.4.1.2 (1-6) | Cue literacy: perceived salience of public-space domain 2 | 6-point Likert | See note for A.4.1.1. |
| A.4.1.3 (1-6) | Cue literacy: perceived salience of public-space domain 3 | 6-point Likert | See note for A.4.1.1. |
| A.4.1.4 (1-6) | Cue literacy: perceived salience of public-space domain 4 | 6-point Likert | See note for A.4.1.1. |
| A.4.1.5 (1-6) | Cue literacy: perceived salience of public-space domain 5 | 6-point Likert | See note for A.4.1.1. |
| A.4.1.6 (1-6) | Cue literacy: perceived salience of public-space domain 6 | 6-point Likert | See note for A.4.1.1. |
| A.4.2 | Micro-intervention proposal for improving a local public space | Open-ended text | Free-text proposal; analyzed qualitatively. |
| A.4.3 | Everyday noticing indicator aligned with A.4 domains (binary) | Yes/No | Binary indicator. |
| A.4.4 | Everyday noticing indicator aligned with A.4 domains (binary) | Yes/No | Binary indicator. |
| A.4.5 | Everyday noticing indicator aligned with A.4 domains (binary) | Yes/No | Binary indicator. |
| A.4.6 | Everyday noticing indicator aligned with A.4 domains (binary) | Yes/No | Binary indicator; |
| A.4.7 | Everyday noticing indicator aligned with A.4 domains (binary) | Yes/No | Binary indicator. |
| A.4.5 | Sustainability values block aligned with GreenComp (ESV domain) | Q1–Q25 | 6-point Likert (forced-choice) |
Table A2.
Mapping of S4-FU ‘Embodying Sustainability Values’5 items (GCQuest Q1–Q25) to GreenComp competences and KSA IDs.
Table A2.
Mapping of S4-FU ‘Embodying Sustainability Values’5 items (GCQuest Q1–Q25) to GreenComp competences and KSA IDs.
| Q at GCQuest | Item core | KSA | GreenComp competence |
GreenComp KSA ID |
|---|---|---|---|---|
| Q1 | … be prone to act in line with values and principles for sustainability. | A | 1.1 Valuing sustainability | 1.1.A1 |
| Q2 | … articulate and negotiate sustainability values, principles and objectives while recognising different viewpoints. | S | 1.1 Valuing sustainability | 1.1.S4 |
| Q3 | … identify processes or action that avoid or reduce the use of natural resources. | S | 1.3 Promoting nature | 1.3.S5 |
| Q4 | … know about the main parts of the natural environment (geosphere, biosphere, hydrosphere, cryosphere and atmosphere) and that living organisms and non-living components are closely linked and depend on each other. | Knowledge | 1.3 Promoting nature | 1.3.K1 |
| Q5 | … be open-minded to others and their world-views. | A | 1.1 Valuing sustainability | 1.1.A3 |
| Q6 | … bring personal choices and action in line with sustainability values and principles. | S | 1.1 Valuing sustainability | 1.1.S3 |
| Q7 | … acknowledge cultural diversity within planetary limits. | S | 1.3 Promoting nature | 1.3.S3 |
| Q8 | … apply equity and justice for current and future generations as criteria for environmental preservation and the use of natural resources. | S | 1.2 Supporting fairness | 1.2.S1 |
| Q9 | … know about environmental justice, namely considering the interests and capabilities of other species and environmental ecosystems. | K | 1.2 Supporting fairness | 1.2.K2 |
| Q10 | … know the main views on sustainability: anthropocentrism (human-centric), technocentrism (technological solutions to ecological problems) and ecocentrism (nature-centred), and how they influence assumptions and arguments. | K | 1.1 Valuing sustainability | 1.1.K1 |
| Q11 | … be critical towards the notion that humans are more important than other life forms. | A | 1.3 Promoting nature | 1.3.A2 |
| Q12 | … evaluate issues and action based on sustainability values and principles. | S | 1.1 Valuing sustainability | 1.1.S2 |
| Q13 | … be willing to share and clarify views on sustainability values. | A | 1.1 Valuing sustainability | 1.1.A2 |
| Q14 | … find opportunities to spend time in nature and helps to restore it. | S | 1.3 Promoting nature | 1.3.S4 |
| Q15 | … show empathy with all life forms. | A | 1.3 Promoting nature | 1.3.A3 |
| Q16 | … know that values and principles influence action that can damage, does not harm, restores or regenerates the environment. | K | 1.1 Valuing sustainability | 1.1.K3 |
| Q17 | … assess own impact on nature and consider the protection of nature an essential task for every individual. | S | 1.3 Promoting nature | 1.3.S1 |
| Q18 | … respect, understand and appreciate various cultures in relation to sustainability, including minority cultures, local and indigenous traditions and knowledge systems. | S | 1.2 Supporting fairness | 1.2.S3 |
| Q19 | … know that humans shape ecosystems and that human activities can rapidly and irreversibly damage ecosystems. | K | 1.3 Promoting nature | 1.3.K4 |
| Q20 | … continuously strive to restore nature. | A | 1.3 Promoting nature | 1.3.A5 |
| Q21 | … know that individuals and communities differ in how and how much they can promote sustainability. | K | 1.2 Supporting fairness | 1.2.K4 |
| Q22 | … help build consensus on sustainability in an inclusive manner. | S | 1.2 Supporting fairness | 1.2.S4 |
| Q23 | … identify and include values of communities, including minorities, in problem framing and decision making on sustainability. | S | 1.1 Valuing sustainability | 1.1.S5 |
| Q24 | … know that people are part of nature and that the divide between human and ecological systems is arbitrary. | K | 1.3 Promoting nature | 1.3.K3 |
| Q25 | … be ready to critique and value various cultural contexts depending on their impact on sustainability. | A | 1.1 Valuing sustainability | 1.1.A4 |
5 Note: Based on GreenComp [REF].
References
- UNESCO Education for Sustainable Development in Action; UNESCO, Ed.; Paris; UNESCO, 2012; ISBN 9789230010638. [Google Scholar]
- Cebrián, G.; Junyent, M.; Mulà, I. Current Practices and Future Pathways towards Competencies in Education for Sustainable Development. Sustain. 2021, 13, 8733. [Google Scholar] [CrossRef]
- UNESCO Education for Sustainable Development: A Roadmap; UNESCO, 2020; ISBN 978-92-3-100394-3.
- Bianchi, G.; Pisiotis, U.; Cabrera, M.; Punie, Y.; Bacigalupo, M. The European Sustainability Competence Framework; 2022; ISBN 9789276464853. [Google Scholar]
- Redman, A.; Wiek, A. Competencies for Advancing Transformations Towards Sustainability. Front. Educ. 2021, 6, 1–11. [Google Scholar] [CrossRef]
- Wiek, A.; Withycombe, L.; Redman, C. Key Competencies in Sustainability: A Reference Framework for Academic Program Development. Sustain. Sci. 2011, 6, 203–218. [Google Scholar] [CrossRef]
- Akçayır, M.; Akçayır, G. Advantages and Challenges Associated with Augmented Reality for Education: A Systematic Review of the Literature. Educ. Res. Rev. 2017, 20, 1–11. [Google Scholar] [CrossRef]
- Chang, H.-Y.; Binali, T.; Liang, J.-C.; Chiou, G.-L.; Cheng, K.-H.; Lee, S.W.-Y.; Tsai, C.-C. Ten Years of Augmented Reality in Education: A Meta-Analysis of (Quasi-) Experimental Studies to Investigate the Impact. Comput. Educ. 2022, 191, 104641. [Google Scholar] [CrossRef]
- Deterding, S.; Dixon, D.; Khaled, R.; Nacke, L. From Game Design Elements to Gamefulness. In Proceedings of the Proceedings of the 15th International Academic MindTrek Conference: Envisioning Future Media Environments, New York, NY, USA, September 28 2011; ACM; pp. 9–15. [Google Scholar]
- Ryan, R.M.; Deci, E.L. Self-Determination Theory and the Facilitation of Intrinsic Motivation, Social Development, and Well-Being. Am. Psychol. 2000, 55, 68–78. [Google Scholar] [CrossRef]
- Caffrey, L.; Browne, F. Understanding the Social Worker–Family Relationship through Self-determination Theory: A Realist Synthesis of Signs of Safety. Child Fam. Soc. Work 2022, 27, 513–525. [Google Scholar] [CrossRef]
- Bai, S.; Hew, K.F.; Huang, B. Does Gamification Improve Student Learning Outcome? Evidence from a Meta-Analysis and Synthesis of Qualitative Data in Educational Contexts. Educ. Res. Rev. 2020, 30, 100322. [Google Scholar] [CrossRef]
- Sailer, M.; Homner, L. The Gamification of Learning: A Meta-Analysis. Educ. Psychol. Rev. 2020, 32, 77–112. [Google Scholar] [CrossRef]
- Wang, K.; Tekler, Z.D.; Cheah, L.; Herremans, D.; Blessing, L. Evaluating the Effectiveness of an Augmented Reality Game Promoting Environmental Action. Sustainability 2021, 13, 13912. [Google Scholar] [CrossRef]
- Kleftodimos, A.; Moustaka, M.; Evagelou, A. Location-Based Augmented Reality for Cultural Heritage Education: Creating Educational, Gamified Location-Based AR Applications for the Prehistoric Lake Settlement of Dispilio. Digital 2023, 3, 18–45. [Google Scholar] [CrossRef]
- Li, M.; Ma, S.; Shi, Y. Examining the Effectiveness of Gamification as a Tool Promoting Teaching and Learning in Educational Settings: A Meta-Analysis. Front. Psychol. 2023, 14. [Google Scholar] [CrossRef]
- Zeng, J.; Sun, D.; Looi, C.; Fan, A.C.W. Exploring the Impact of Gamification on Students’ Academic Performance: A Comprehensive Meta-analysis of Studies from the Year 2008 to 2023. Br. J. Educ. Technol. 2024, 55, 2478–2502. [Google Scholar] [CrossRef]
- Koivisto, J.; Hamari, J. The Rise of Motivational Information Systems: A Review of Gamification Research. Int. J. Inf. Manage. 2019, 45, 191–210. [Google Scholar] [CrossRef]
- Lampropoulos, G.; Keramopoulos, E.; Diamantaras, K.; Evangelidis, G. Augmented Reality and Gamification in Education: A Systematic Literature Review of Research, Applications, and Empirical Studies. Appl. Sci. 2022, 12, 6809. [Google Scholar] [CrossRef]
- Lampropoulos, G.; Kinshuk. Virtual Reality and Gamification in Education: A Systematic Review. Educ. Technol. Res. Dev. 2024, 72, 1691–1785. [Google Scholar] [CrossRef]
- Morgan, S.L.; Lee, J. A Rolling Panel Model of Cohort, Period, and Aging Effects for the Analysis of the General Social Survey. Sociol. Methods Res. 2024, 53, 369–420. [Google Scholar] [CrossRef]
- Lebo, M.J.; Weber, C. An Effective Approach to the Repeated Cross-Sectional Design. Am. J. Pol. Sci. 2015, 59, 242–258. [Google Scholar] [CrossRef]
- Ferreira-Santos, J.; Pombo, L. The Art Nouveau Path: Promoting Sustainability Competences Through a Mobile Augmented Reality Game. Multimodal Technol. Interact. 2025, 9, 77. [Google Scholar] [CrossRef]
- Ferreira-Santos, J.; Pombo, L. The. Art Nouveau Path: Valuing Urban Heritage Through Mobile Augmented Reality and Sustainability Education 2025, 44. [Google Scholar] [CrossRef]
- Sprangers, M.A..; Schwartz, C.E. Integrating Response Shift into Health-Related Quality of Life Research: A Theoretical Model. Soc. Sci. Med. 1999, 48, 1507–1515. [Google Scholar] [CrossRef] [PubMed]
- Lira, B.; O’Brien, J.M.; Peña, P.A.; Galla, B.M.; D’Mello, S.; Yeager, D.S.; Defnet, A.; Kautz, T.; Munkacsy, K.; Duckworth, A.L. Large Studies Reveal How Reference Bias Limits Policy Applications of Self-Report Measures. Sci. Rep. 2022, 12, 19189. [Google Scholar] [CrossRef]
- Gruenewald, D.A. The Best of Both Worlds: A Critical Pedagogy of Place. Educ. Res. 2003, 32, 3–12. [Google Scholar] [CrossRef]
- Ho, S.-J.; Hsu, Y.-S.; Lai, C.-H.; Chen, F.-H.; Yang, M.-H. Applying Game-Based Experiential Learning to Comprehensive Sustainable Development-Based Education. Sustainability 2022, 14, 1172. [Google Scholar] [CrossRef]
- Kolb, D.A. Experiential Learning: Experience as the Source of Learning and Development, 2nd ed.; Pearson Education Inc.: Upper Saddle River, New Jersey, 2015; ISBN 9780133892505. [Google Scholar]
- Lave, J.; Wenger, E. Situated Learning: Legitimate Peripheral Participation; Cambridge University Press: Cambridge, 1991; ISBN 978-0521423748. [Google Scholar]
- Semken, S.; Freeman, C.B. Sense of Place in the Practice and Assessment of Place-based Science Teaching. Sci. Educ. 2008, 92, 1042–1057. [Google Scholar] [CrossRef]
- Sobel, D. Place-Based Education, Connecting Classrooms and Communities Closing the Achievement Gap: The SEER Report. NAMTA J. 2014, 39, 61–78. [Google Scholar]
- Ibañez-Etxeberria, A.; Gómez-Carrasco, C.J.; Fontal, O.; García-Ceballos, S. Virtual Environments and Augmented Reality Applied to Heritage Education. An Evaluative Study. Appl. Sci. 2020, 10. [Google Scholar] [CrossRef]
- Dunleavy, M.; Dede, C. Augmented Reality Teaching and Learning. In Handbook of Research on Educational Communications and Technology; Spector, J.M., Merrill, M.D., Elen, J., M. J., B., Eds.; Springer: New York, 2014; pp. 735–745. [Google Scholar]
- Wu, H.K.; Lee, S.W.Y.; Chang, H.Y.; Liang, J.C. Current Status, Opportunities and Challenges of Augmented Reality in Education. Comput. Educ. 2013, 62, 41–49. [Google Scholar] [CrossRef]
- Kamarainen, A.M.; Metcalf, S.; Grotzer, T.; Browne, A.; Mazzuca, D.; Tutwiler, M.S.; Dede, C. EcoMOBILE: Integrating Augmented Reality and Probeware with Environmental Education Field Trips. Comput. Educ. 2013, 68, 545–556. [Google Scholar] [CrossRef]
- Radu, I. Augmented Reality in Education: A Meta-Review and Cross-Media Analysis. Pers Ubiquit Comput 2014, 18, 1533–1543. [Google Scholar] [CrossRef]
- Garzón, J.; Acevedo, J. Meta-Analysis of the Impact of Augmented Reality on Students ’ Learning Gains. Educ. Res. Rev. 2019, 27, 244–260. [Google Scholar] [CrossRef]
- Mayer, R. Multimedia Learning; Cambridge University Press, 2020; ISBN 9781316941355. [Google Scholar]
- Sweller, J. Cognitive Load During Problem Solving: Effects on Learning. Cogn. Sci. 1988, 12, 257–285. [Google Scholar] [CrossRef]
- Sweller, J.; Ayres, P.; Kalyuga, S. Cognitive Load Theory; Springer, 2011. [Google Scholar]
- Strada, F.; Lopez, M.X.; Fabricatore, C.; Diniz dos Santos, A.; Gyaurov, D.; Battegazzorre, E.; Bottino, A. Leveraging a Collaborative Augmented Reality Serious Game to Promote Sustainability Awareness, Commitment and Adaptive Problem-Management. Int. J. Hum. Comput. Stud. 2023, 172, 102984. [Google Scholar] [CrossRef]
- Wilhelm, S.; Förster, R.; Zimmermann, A.B. Implementing Competence Orientation: Towards Constructively Aligned Education for Sustainable Development in University-Level Teaching-And-Learning. Sustainability 2019, 11, 1891. [Google Scholar] [CrossRef]
- Landers, R.N. Developing a Theory of Gamified Learning. Simul. Gaming 2014, 45, 752–768. [Google Scholar] [CrossRef]
- Ye, K.; Bilinski, A.; Lee, Y. Difference-in-Differences Analysis with Repeated Cross-Sectional Survey Data. Heal. Serv. Outcomes Res. Methodol. 2025. [Google Scholar] [CrossRef]
- Ho, A.D. A Nonparametric Framework for Comparing Trends and Gaps Across Tests. J. Educ. Behav. Stat. 2009, 34, 201–228. [Google Scholar] [CrossRef]
- Putnick, D.L.; Bornstein, M.H. Measurement Invariance Conventions and Reporting: The State of the Art and Future Directions for Psychological Research. Dev. Rev. 2016, 41, 71–90. [Google Scholar] [CrossRef]
- Vandenberg, R.J.; Lance, C.E. A Review and Synthesis of the Measurement Invariance Literature: Suggestions, Practices, and Recommendations for Organizational Research. Organ. Res. Methods 2000, 3, 4–70. [Google Scholar] [CrossRef]
- Ferreira-Santos, J.; Pombo, L. The Art Nouveau Path: From Gameplay Logs to Learning Analytics in a Mobile Augmented Reality Game for Sustainability Education. Information 2026, 17(1). [Google Scholar] [CrossRef]
- Ferreira-Santos, J.; Pombo, L. The Art Nouveau Path: Longitudinal Analysis of Students’ Perceptions of Sustainability Competence Development Through a Mobile Augmented Reality Game. Computers 2026, 15, 86. [Google Scholar] [CrossRef]
- “S1-PRE Questionnaire”. Available online: https://zenodo.org/records/16540741 (accessed on 12 February 2026).
- “S2-POST Questionnaire”. Available online: https://zenodo.org/records/17738943 (accessed on 12 February 2026).
- “S3-FU Questionnaire”. Available online: https://zenodo.org/records/17739015 (accessed on 12 February 2026).
- “S4-DFU Questionnaire”. Available online. (accessed on 12 February 2026). [CrossRef]
- Brady, H.E.; Johnston, R. Repeated Cross-Sections in Survey Data. In Emerging Trends in the Social and Behavioral Sciences; Wiley, 2015; pp. 1–18. [Google Scholar]
- Deaton, A. Panel Data from Time Series of Cross-Sections. J. Econom. 1985, 30, 109–126. [Google Scholar] [CrossRef]
- Pelzer, B.; Eisinga, R.; Franses, P.H. “Panelizing” Repeated Cross Sections. Qual. Quant. 2005, 39, 155–174. [Google Scholar] [CrossRef]
- Ferreira-Santos, J.; Marques, M.M.; Pombo, L. GreenComp-Based Questionnaire (GCQuest): Questionnaire Development and Validation. unpublished Work. 2024. [Google Scholar]
- Button, K.S.; Ioannidis, J.P.A.; Mokrysz, C.; Nosek, B.A.; Flint, J.; Robinson, E.S.J.; Munafò, M.R. Power Failure: Why Small Sample Size Undermines the Reliability of Neuroscience. Nat. Rev. Neurosci. 2013, 14, 365–376. [Google Scholar] [CrossRef]
- Nosek, B.A.; Alter, G.; Banks, G.C.; Borsboom, D.; Bowman, S.D.; Breckler, S.J.; Buck, S.; Chambers, C.D.; Chin, G.; Christensen, G.; et al. Promoting an Open Research Culture. Science (80-. ). 2015, 348, 1422–1425. [Google Scholar] [CrossRef]
- Nosek, B.A.; Ebersole, C.R.; DeHaven, A.C.; Mellor, D.T. The Preregistration Revolution. Proc. Natl. Acad. Sci. 2018, 115, 2600–2606. [Google Scholar] [CrossRef] [PubMed]
- Simmons, J.P.; Nelson, L.D.; Simonsohn, U. False-Positive Psychology. Psychol. Sci. 2011, 22, 1359–1366. [Google Scholar] [CrossRef] [PubMed]
- Municipal Educational Action Program of Aveiro 2024–2025 (PAEMA). Available online: https://tinyurl.com/PAEMAveiro (accessed on 12 February 2026).
- Wasserstein, R.L.; Lazar, N.A. The ASA Statement on p -Values: Context, Process, and Purpose. Am. Stat. 2016, 70, 129–133. [Google Scholar] [CrossRef]
- Upsher, R.; Dommett, E.; Carlisle, S.; Conner, S.; Codina, G.; Nobili, A.; Byrom, N.C. Improving Reporting Standards in Quantitative Educational Intervention Research: Introducing the CLOSER and CIDER Checklists. J. New Approaches Educ. Res. 2025, 14, 2. [Google Scholar] [CrossRef]
- Garland, R. The Mid-Point on a Rating Scale: Is It Desirable? Mark. Bull. 1991, 2, 66–70. [Google Scholar]
- Beglar, D.; Nemoto, T. Developing Likert-Scale Questionnaires. In Proceedings of the JALT2013 Conference Proceedings, 2014; pp. 1–8. [Google Scholar]
- South, L.; Saffo, D.; Vitek, O.; Dunne, C.; Borkin, M.A. Effective Use of Likert Scales in Visualization Evaluations: A Systematic Review. Comput. Graph. Forum 2022, 41, 43–55. [Google Scholar] [CrossRef]
- Regulation (European Union) 2016/679 of the European Parliament and of the Council of 27 April 2016 on the protection of natural persons with regard to the processing of personal data and on the free movement of such data (General Data Protection Regulation). Official Journal of the European Union L119, 1–88. Available online: https://zenodo.org/records/16540741 (accessed on 12 February 2026).
- Boone, H.; Boone, D. Analyzing Likert Data. J. Ext. 2012, 50. [Google Scholar] [CrossRef]
- Jamieson, S. Likert Scales: How to (Ab)Use Them. Med. Educ. 2004, 38, 1217–1218. [Google Scholar] [CrossRef]
- Norman, G. Likert Scales, Levels of Measurement and the “Laws” of Statistics. Adv. Heal. Sci. Educ. 2010, 15, 625–632. [Google Scholar] [CrossRef]
- Little, R.J.A.; Rubin, D.B. Statistical Analysis with Missing Data, 3rd ed.; 2019; ISBN 978-0-470-52679-8. [Google Scholar]
- Peng, R.D. Reproducible Research in Computational Science. Science (80-. ). 2011, 334, 1226–1227. [Google Scholar] [CrossRef]
- Wilkinson, M.D.; Dumontier, M.; Aalbersberg, Ij.J.; Appleton, G.; Axton, M.; Baak, A.; Blomberg, N.; Boiten, J.-W.; da Silva Santos, L.B.; Bourne, P.E.; et al. The FAIR Guiding Principles for Scientific Data Management and Stewardship. Sci. Data 2016, 3, 160018. [Google Scholar] [CrossRef]
- Van den Broeck, J.; Argeseanu Cunningham, S.; Eeckels, R.; Herbst, K. Data Cleaning: Detecting, Diagnosing, and Editing Data Abnormalities. PLoS Med. 2005, 2, e267. [Google Scholar] [CrossRef]
- Taber, K.S. The Use of Cronbach’s Alpha When Developing and Reporting Research Instruments in Science Education. Res. Sci. Educ. 2018, 48, 1273–1296. [Google Scholar] [CrossRef]
- Zinbarg, R.E.; Revelle, W.; Yovel, I.; Li, W. Cronbach’s α, Revelle’s β, and Mcdonald’s ΩH: Their Relations with Each Other and Two Alternative Conceptualizations of Reliability. Psychometrika 2005, 70, 123–133. [Google Scholar] [CrossRef]
- Dunn, T.J.; Baguley, T.; Brunsden, V. From Alpha to Omega: A Practical Solution to the Pervasive Problem of Internal Consistency Estimation. Br. J. Psychol. 2014, 105, 399–412. [Google Scholar] [CrossRef]
- Dunn, O.J. Multiple Comparisons Using Rank Sums. Technometrics 1964, 6, 241–252. [Google Scholar] [CrossRef]
- Holm, S. A Simple Sequentially Rejective Multiple Test Procedure. Scand. J. Stat. 1979, 6, 65–70. [Google Scholar] [CrossRef]
- Kruskal, W.H.; Wallis, W.A. Use of Ranks in One-Criterion Variance Analysis. J. Am. Stat. Assoc. 1952, 47, 583–621. [Google Scholar] [CrossRef]
- Kerby, D.S. The Simple Difference Formula: An Approach to Teaching Nonparametric Correlation. Compr. Psychol. 2014, 3(11), IT.3.1. [Google Scholar] [CrossRef]
- Cureton, E.E. Rank-Biserial Correlation. Psychometrika 1956, 21, 287–290. [Google Scholar] [CrossRef]
- Delacre, M.; Leys, C.; Mora, Y.L.; Lakens, D. Taking Parametric Assumptions Seriously: Arguments for the Use of Welch’s F-Test Instead of the Classical F-Test in One-Way ANOVA. Int. Rev. Soc. Psychol. 2019, 32, 13. [Google Scholar] [CrossRef]
- Welch, B.L. On the Comparison of Several Mean Values: An Alternative Approach. Biometrika 1951, 38, 330–336. [Google Scholar] [CrossRef]
- Demssie, Y.N.; Biemans, H.J.A.; Wesselink, R.; Mulder, M. Fostering Students’ Systems Thinking Competence for Sustainability by Using Multiple Real-World Learning Approaches. Environ. Educ. Res. 2023, 29, 261–286. [Google Scholar] [CrossRef]
- Olsson, D.; Gericke, N.; Boeve-de Pauw, J. The Effectiveness of Education for Sustainable Development Revisited – a Longitudinal Study on Secondary Students’ Action Competence for Sustainability. Environ. Educ. Res. 2022, 28, 405–429. [Google Scholar] [CrossRef]
Figure 1.
In-app (version 1.3) and In Situ AR Markers.
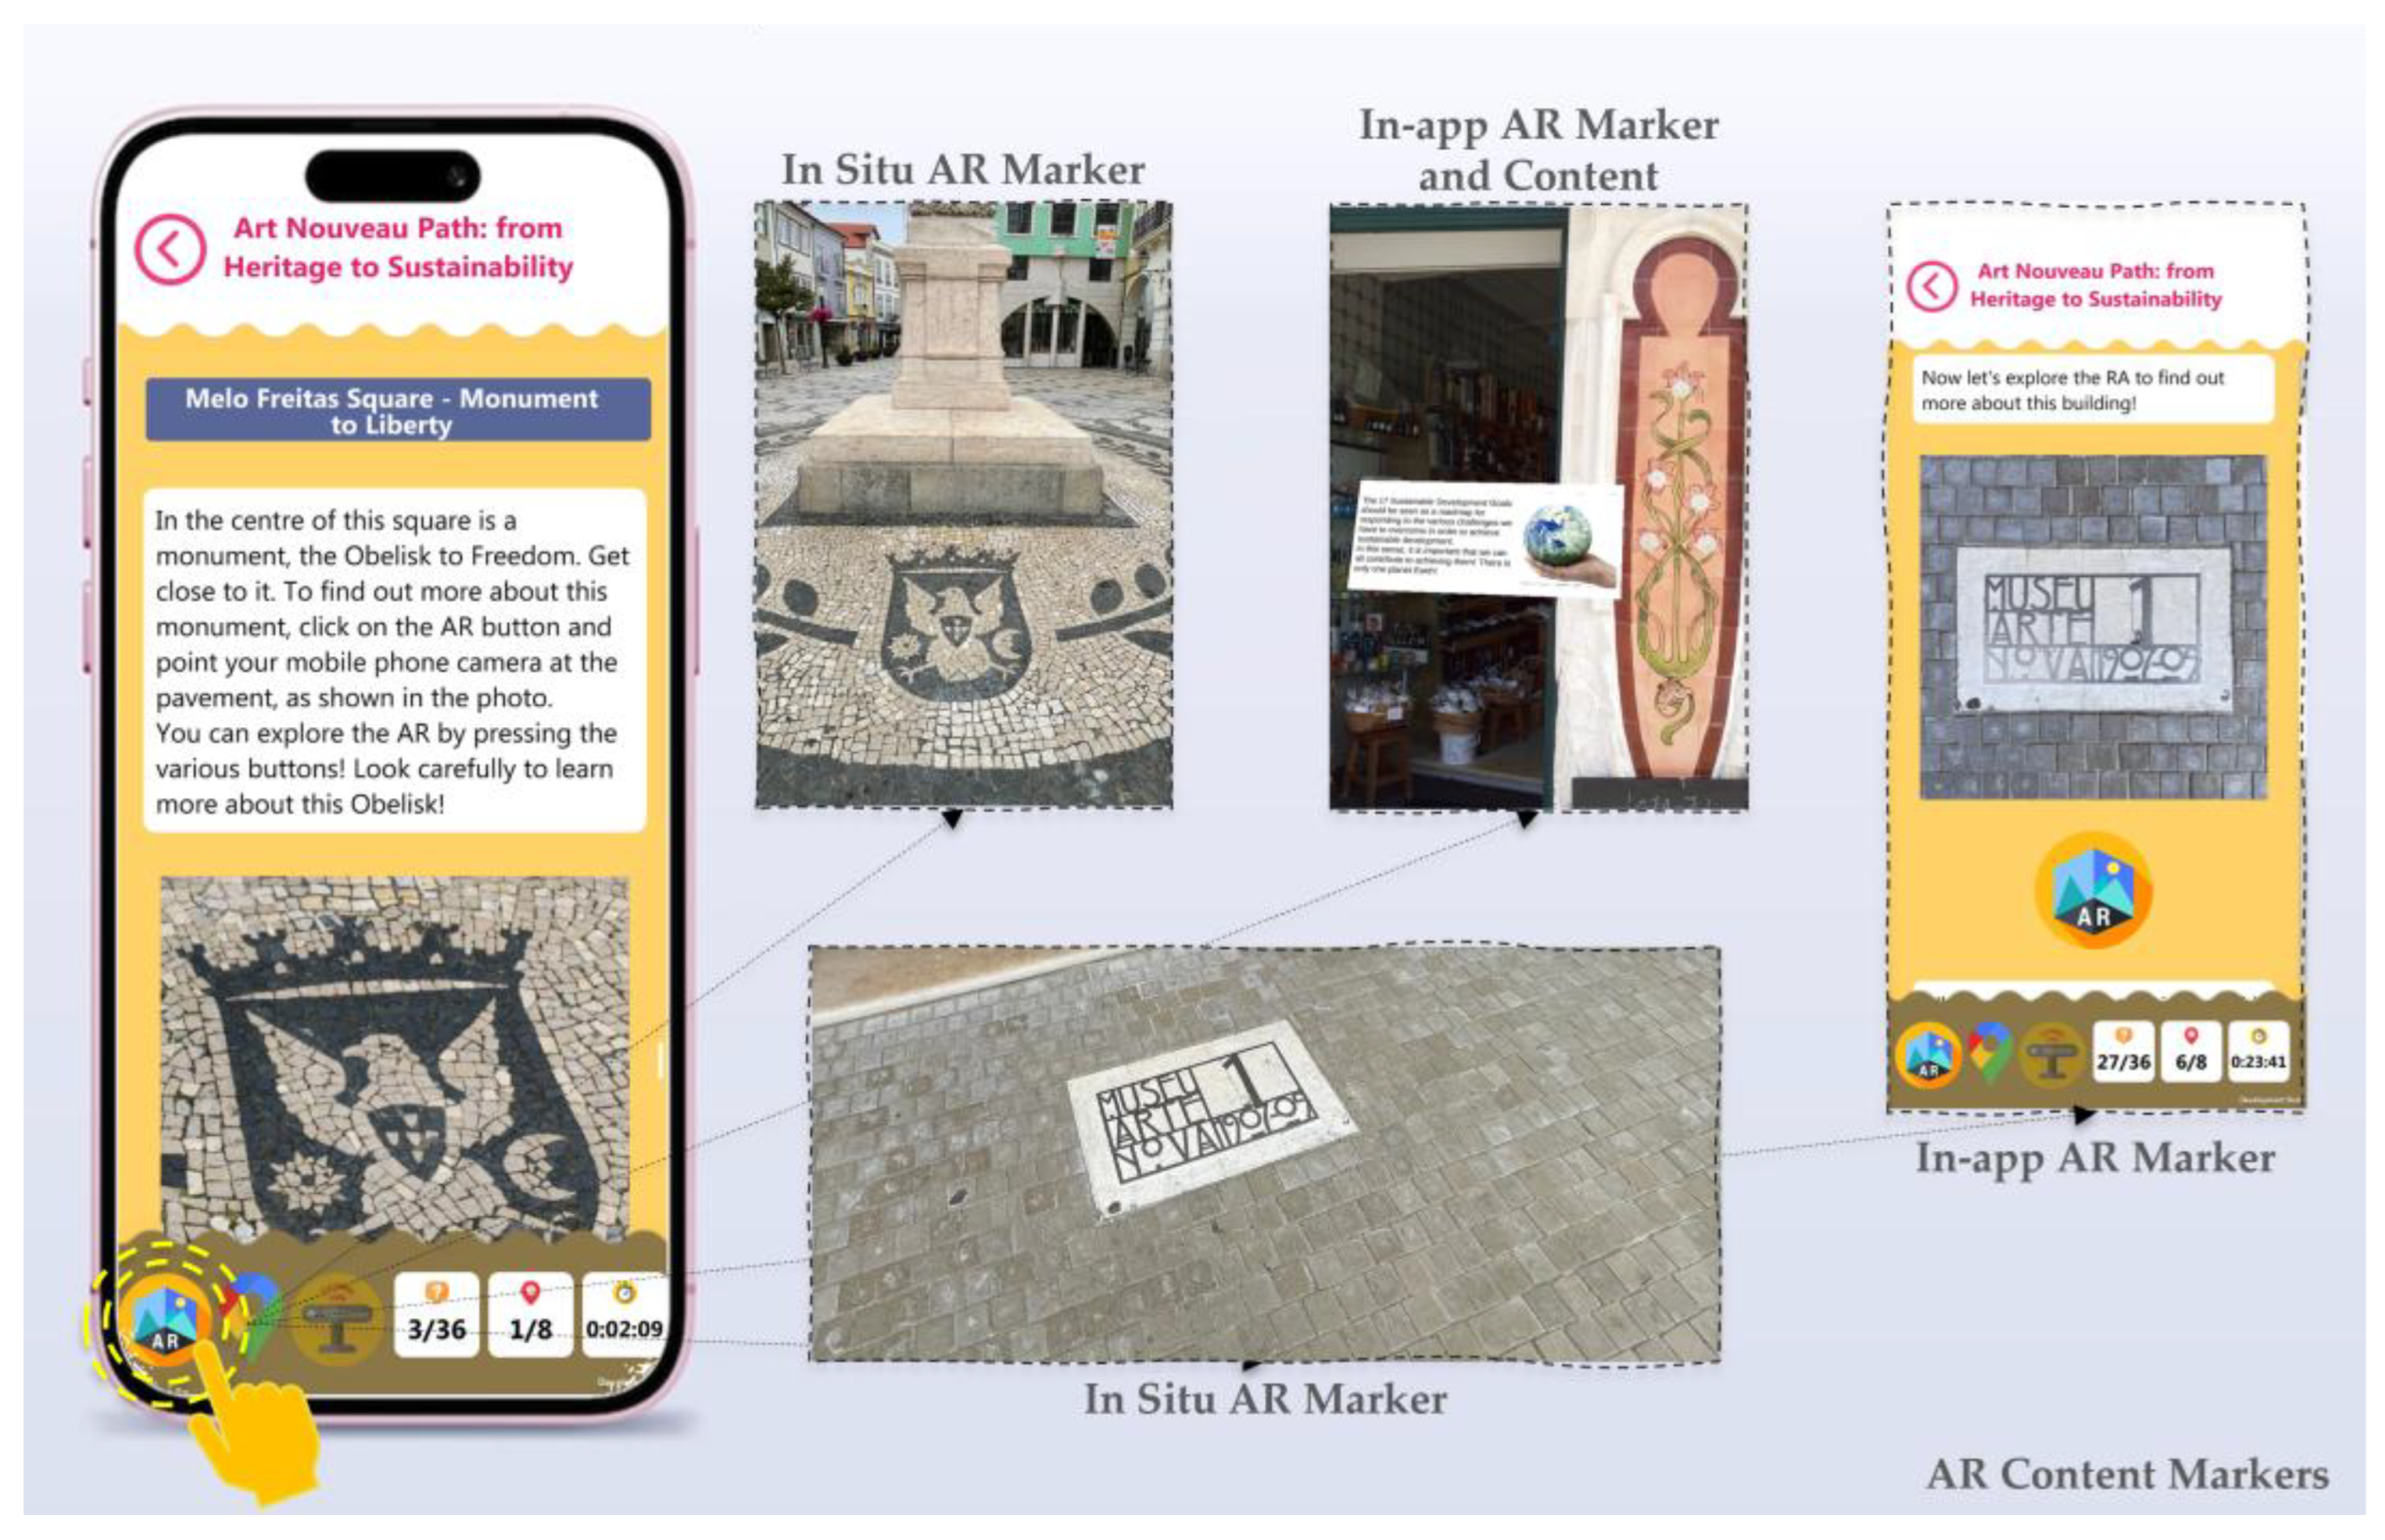
Figure 2.
Distribution of ESV by wave (S1-PRE, S2-POST, S3-FU, S4-DFU).
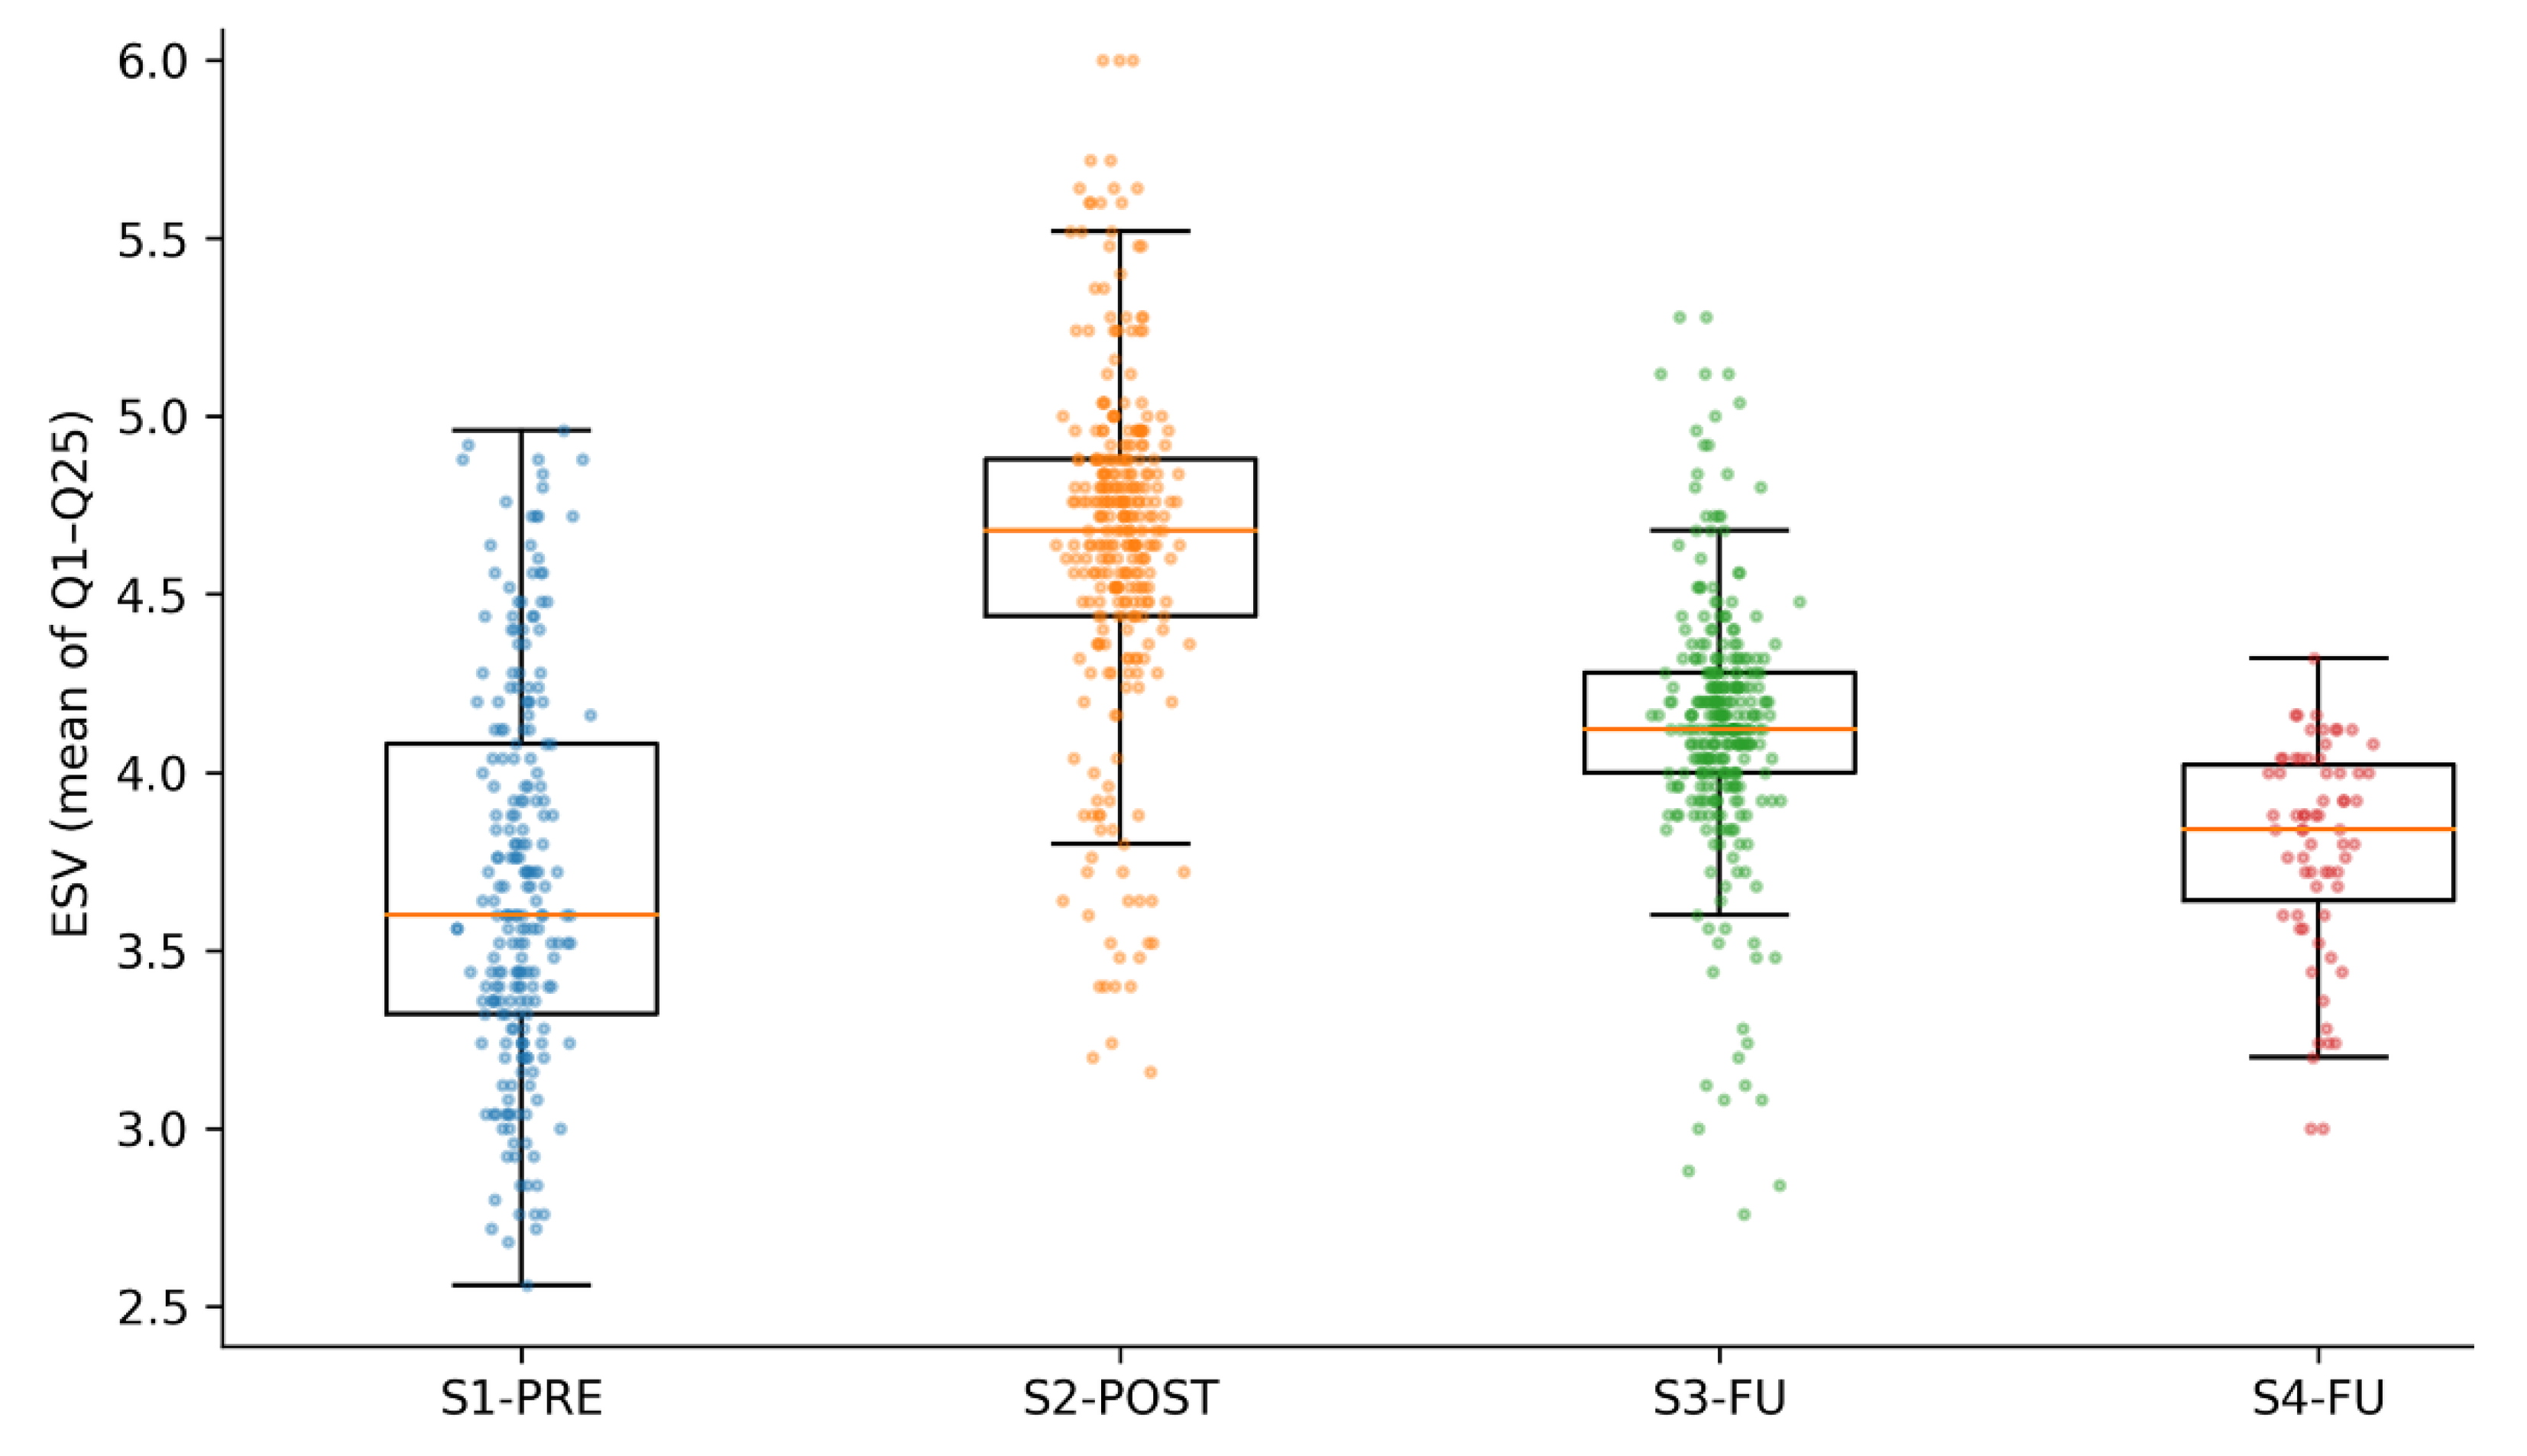
Figure 3.
Heatmap of item means (Q1–Q25) across waves. Cell values represent wave-specific item means on the 1–6 scale, enabling inspection of non-uniform item sensitivity across time and supporting content-sensitive interpretation beyond the aggregate ESV composite.
Figure 3.
Heatmap of item means (Q1–Q25) across waves. Cell values represent wave-specific item means on the 1–6 scale, enabling inspection of non-uniform item sensitivity across time and supporting content-sensitive interpretation beyond the aggregate ESV composite.
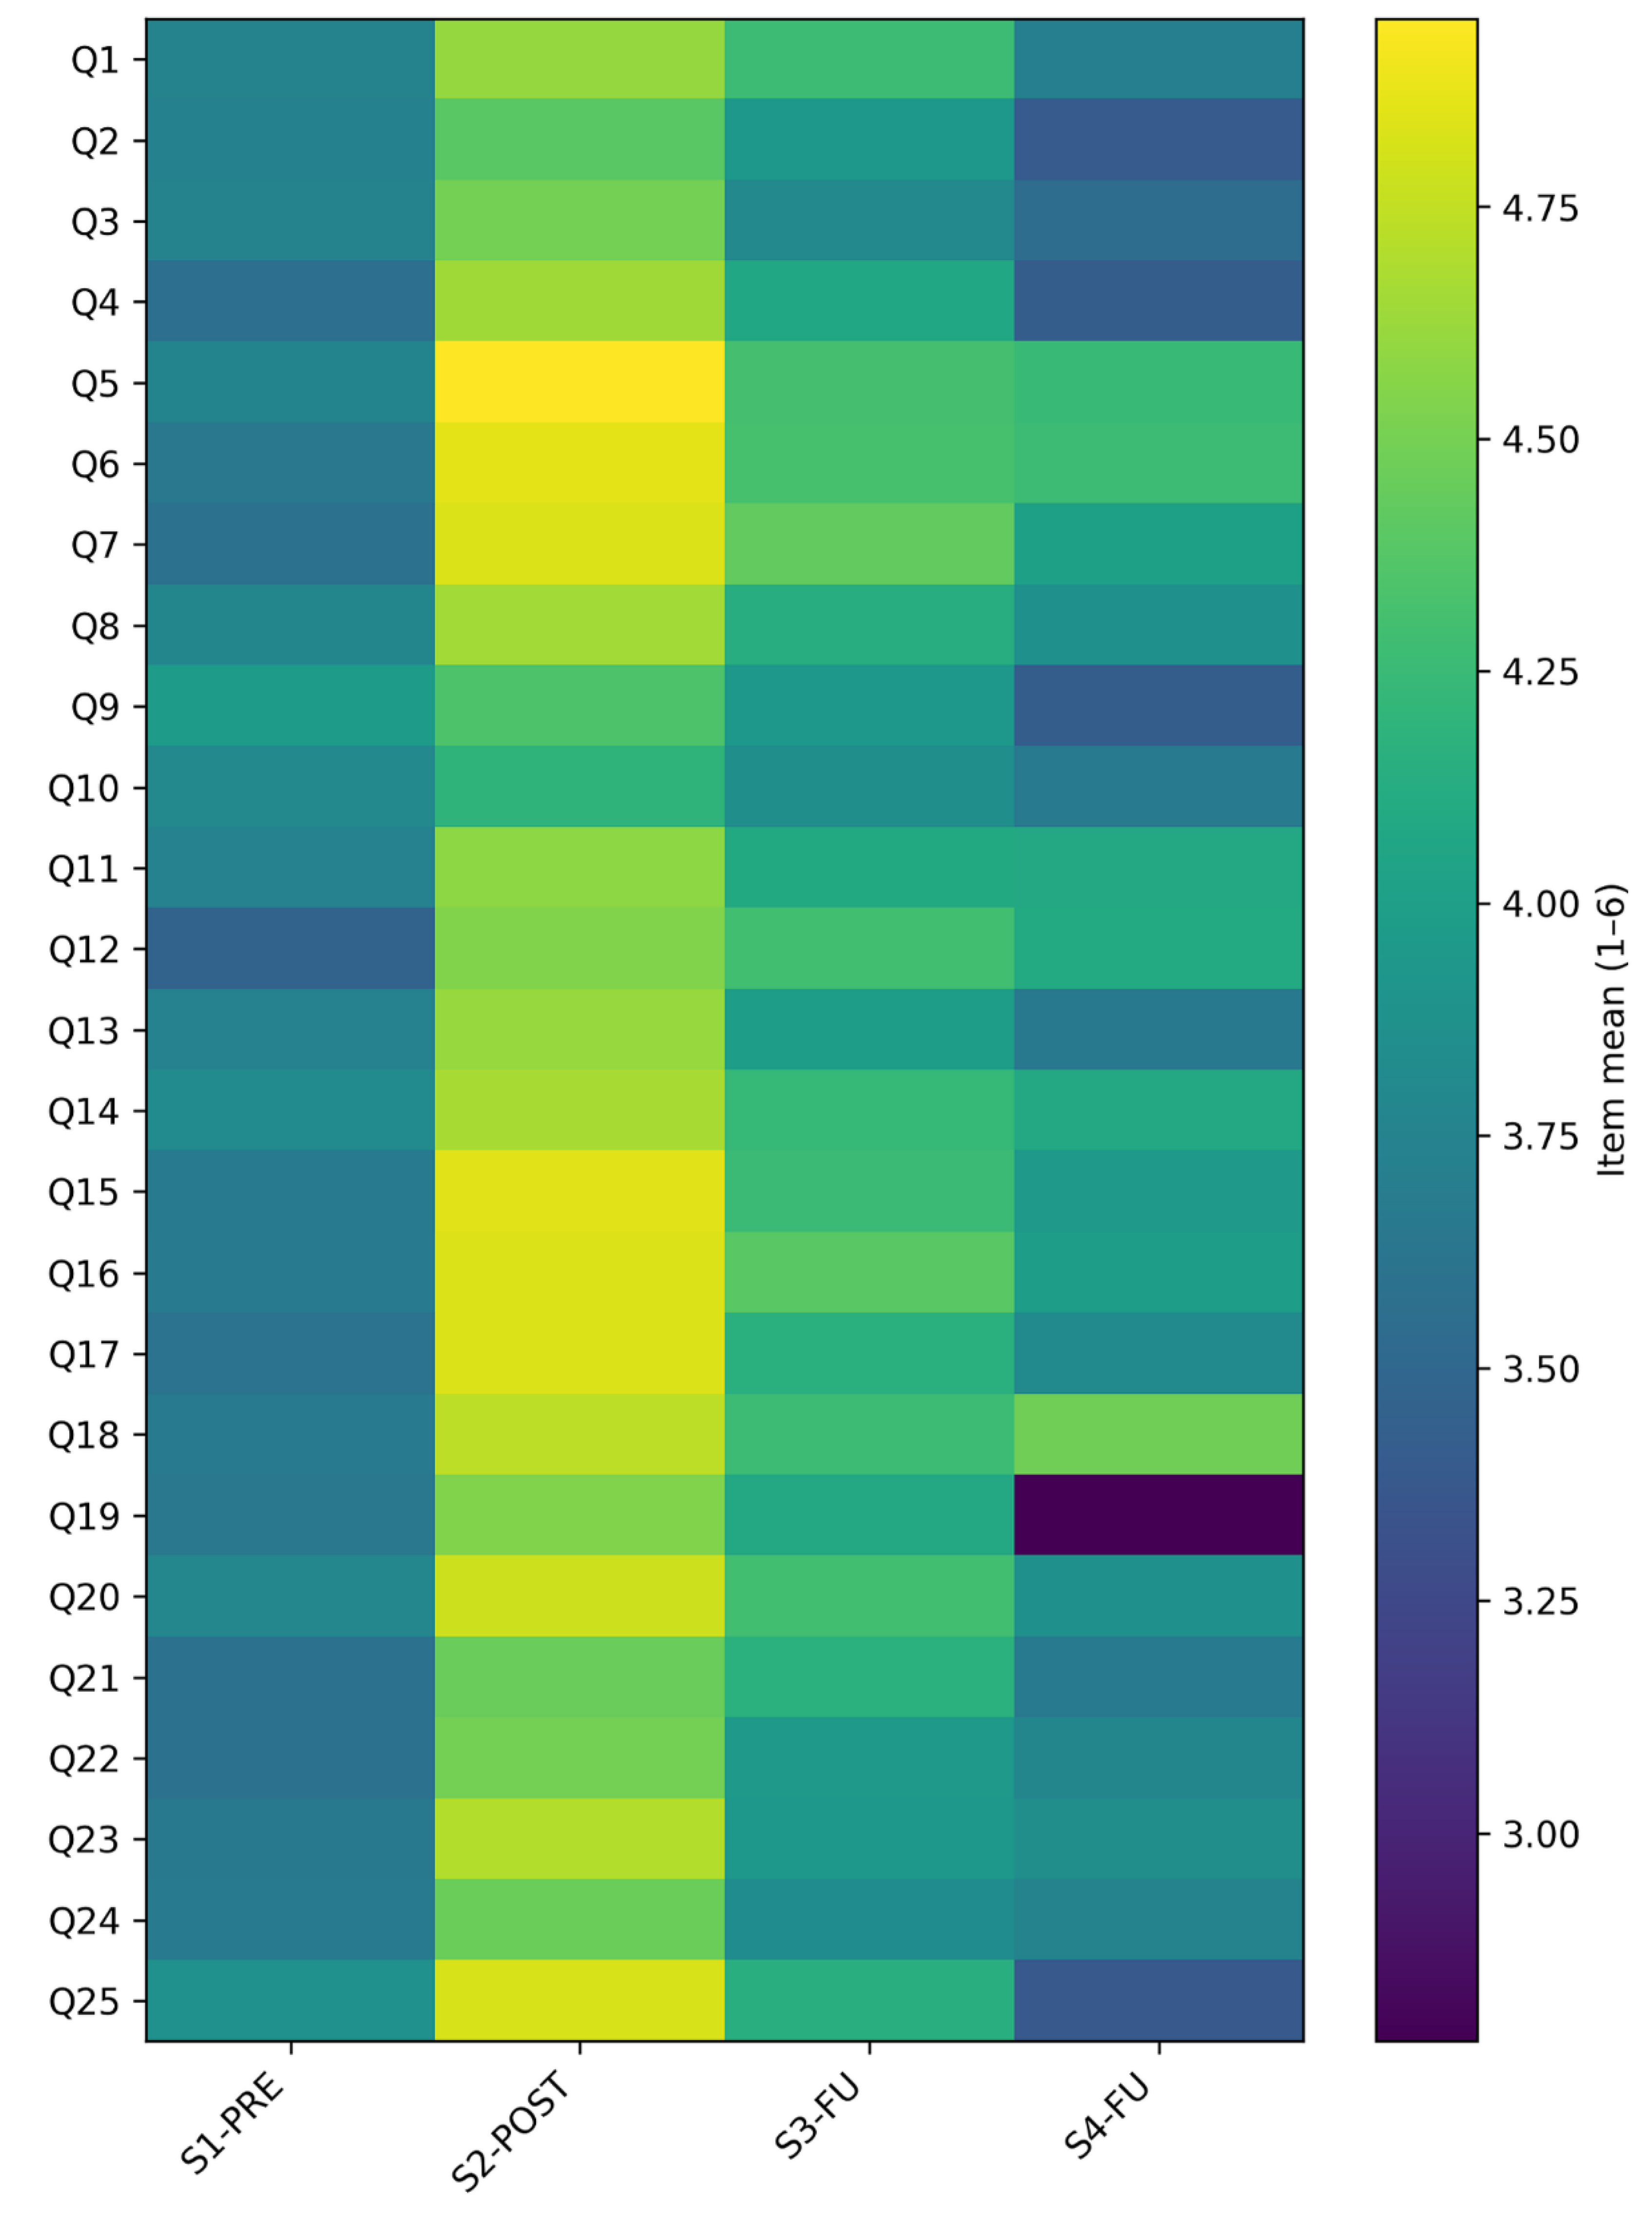
Figure 4.
Item-level mean differences between S4-DFU and S1-PRE (Delta = M S4-DFU minus M S1-PRE) for Q1–Q25 on a 1–6 response scale (complete cases: S1-PRE N = 221; S4-DFU N = 67). Bars represent Delta; error bars show 95% bootstrap CIs for Delta. Dots above bars indicate items with Holm-adjusted p < .05 for the S4 versus S1 item-wise contrasts (Mann–Whitney U tests with Holm correction).
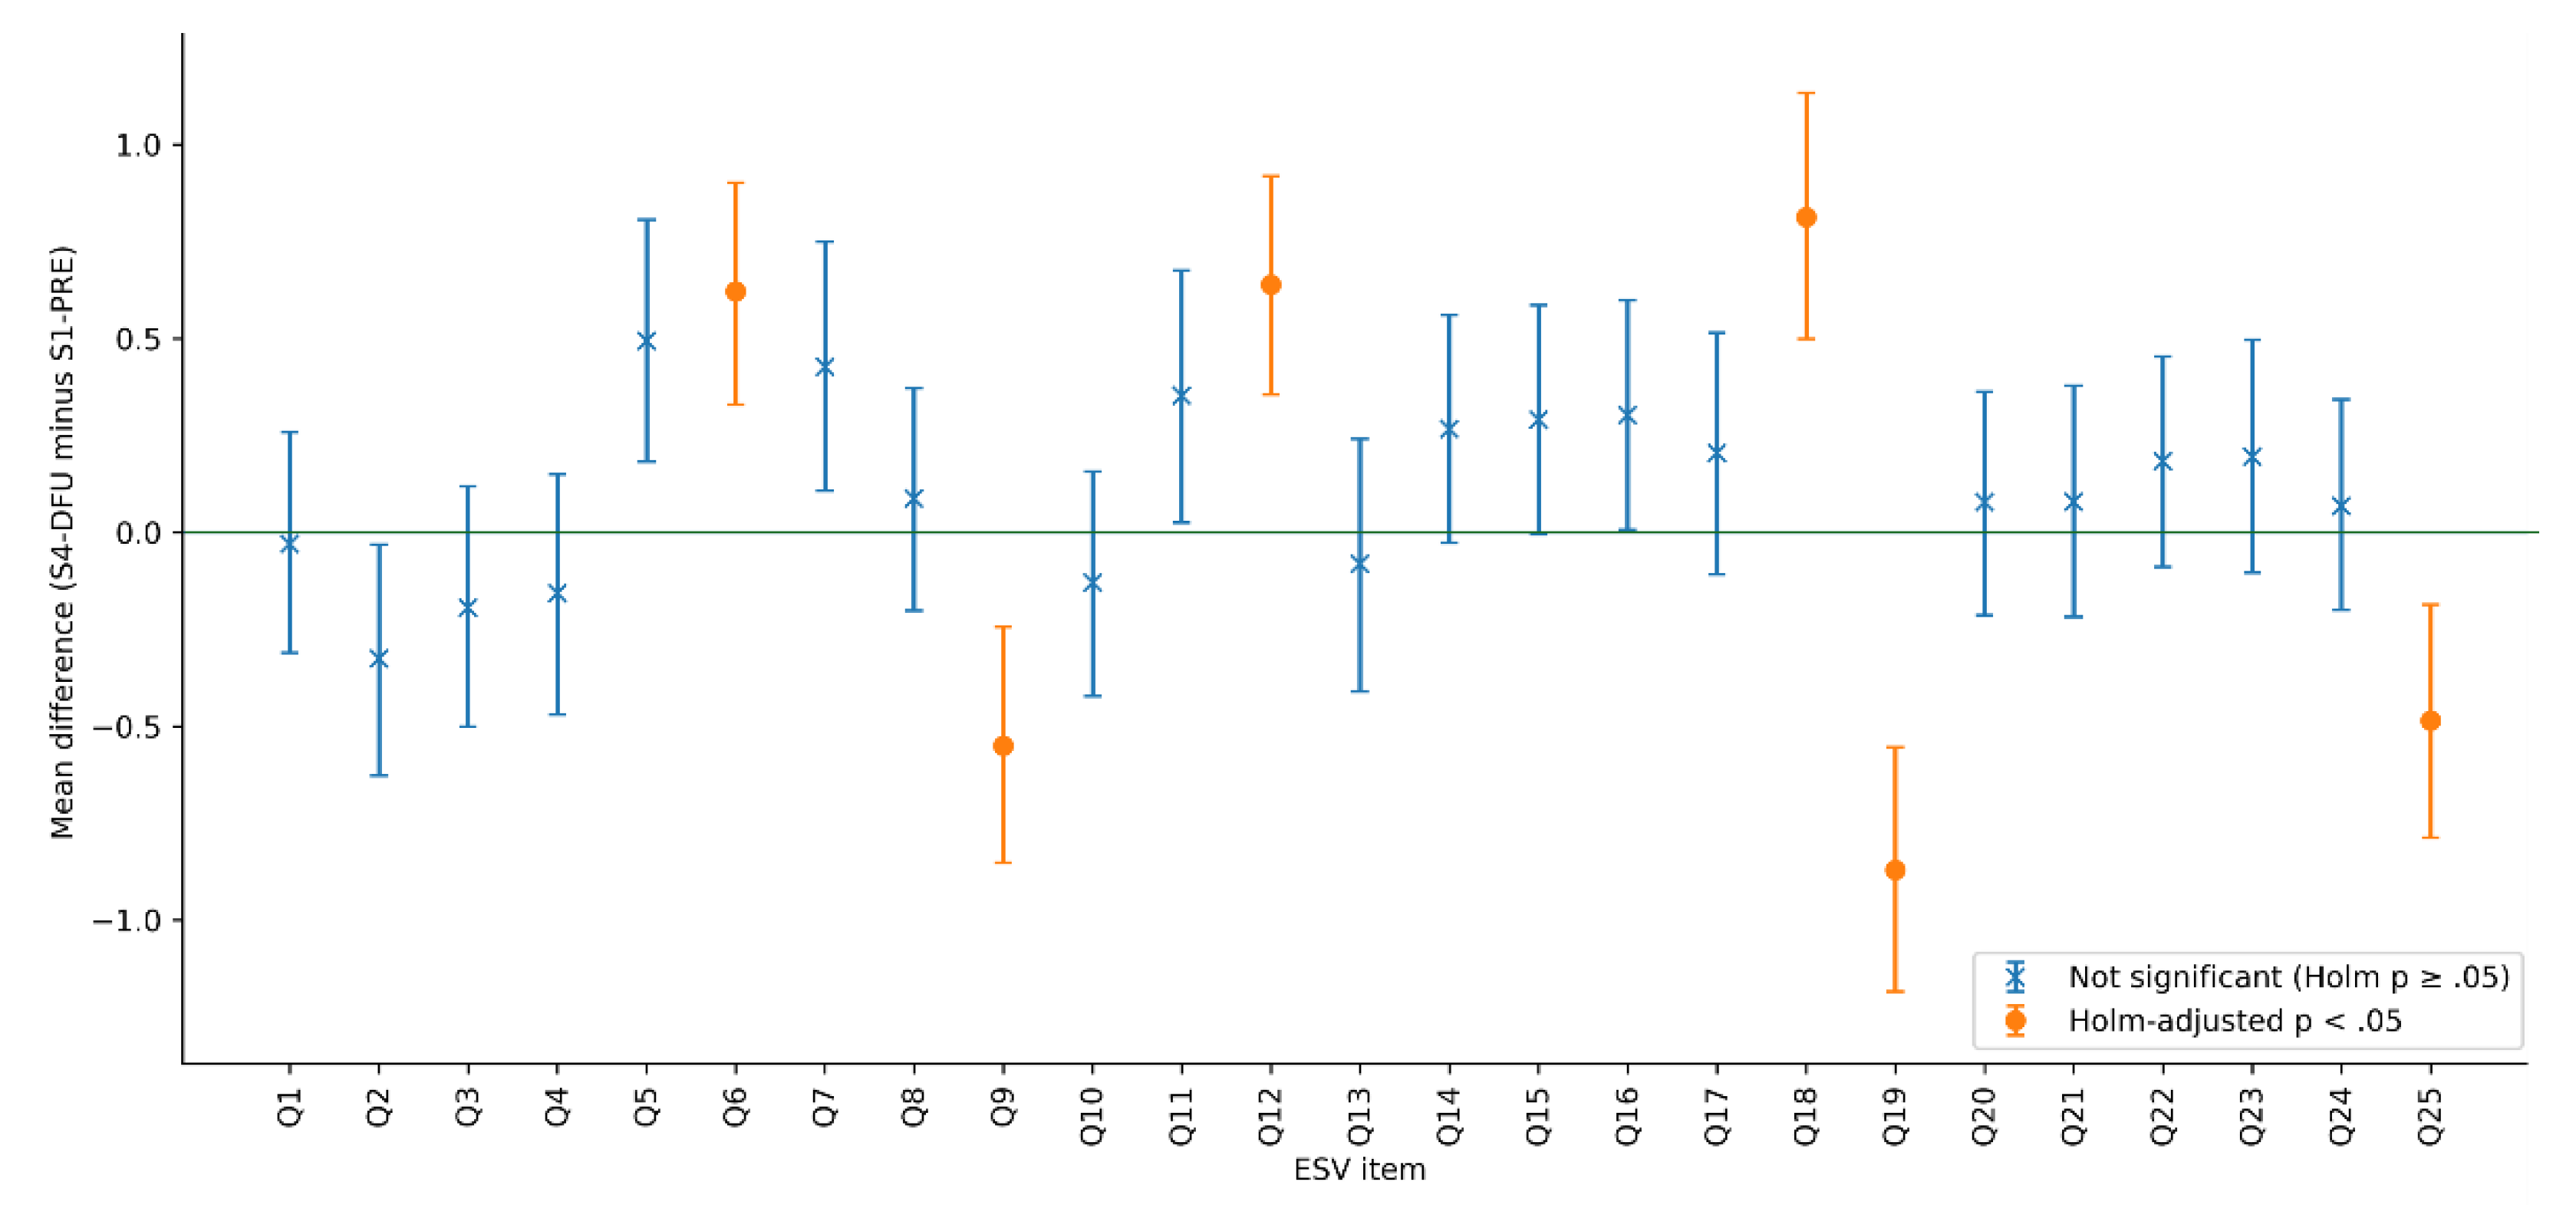
Table 1.
Student questionnaire series (S1-PRE, S2-POST, S3-FU, S4-DFU) and instrument structure. The table reports timing, wave-specific questionnaire characteristics, and the shared comparable block used for cross-wave trend inference (GCQuest ESV block, Q1–Q25; scale 1–6). Raw N and analytic N reflect the complete-case rule for Q1–Q25.
| Wave | Timing (relative) | Questionnaire form (version) | Raw N | Analytic n (complete case Q1–Q25) | Shared comparable block used for S1–S4 trend |
|---|---|---|---|---|---|
| S1-PRE | Pre-intervention baseline | GCQuest-S1PRE | 221 | 221 | GCQuest ESV (Q1–Q25; 1–6) |
| S2-POST | Immediate post-intervention | GCQuest-S2POST | 439 | 438 | GCQuest ESV (Q1–Q25; 1–6) |
| S3-FU | Follow-up | GCQuest-S3FU | 434 | 434 | GCQuest ESV (Q1–Q25; 1–6) |
| S4-DFU | Distant follow-up | GCQuest-S4DFU | 69 | 67 | GCQuest ESV (Q1–Q25; 1–6) |
Table 2.
ESV descriptives by wave (complete-case Q1–Q25). ESV is the participant-level mean of the 25-item GCQuest ESV block (scale 1–6; higher indicates stronger self-reported alignment with sustainability values). Mean CIs are bootstrap percentile intervals; proportion CIs are Wilson score intervals1. Thresholds (ESV ≥ 4.00; ESV ≥ 4.50) are reported as interpretability indicators.
| Wave | N total | N analytic | ESV M (95% CI) |
SD | MDN [Q1, Q3] |
% ESV ≥ 4.00 (95% CI) |
% ESV ≥ 4.50 (95% CI) |
|---|---|---|---|---|---|---|---|
| S1-PRE | 221 | 221 | 3.70 (3.63, 3.77) | 0.54 | 3.60 [3.32, 4.08] | 29.00% (23.40%, 35.30%) | 9.00% (5.90%, 13.60%) |
| S2-POST | 439 | 438 | 4.64 (4.59, 4.68) | 0.50 | 4.68 [4.44, 4.88] | 88.60% (85.30%, 91.20%) | 70.80% (66.40%, 74.80%) |
| S3-FU | 434 | 434 | 4.13 (4.09, 4.16) | 0.36 | 4.12 [4.00, 4.28] | 75.10% (70.80%, 79.00%) | 9.90% (7.40%, 13.10%) |
| S4-DFU | 69 | 67 | 3.79 (3.72, 3.86) | 0.30 | 3.84 [3.64, 4.02] | 34.30% (24.10%, 46.30%) | 0.00% (0.00%, 5.40%) |
1 Note: 95% CI for means obtained by bootstrap percentile; 95% CI for proportions obtained by Wilson score.
Table 3.
Pairwise comparisons of ESV across waves (Dunn tests with Holm correction). Z statistics and Holm-adjusted p values are reported for all pairwise contrasts following the Kruskal–Wallis omnibus test. Cliff’s delta is reported as an effect size, computed as first wave minus second wave (first − second), so negative values indicate higher ESV in the second wave.
| Comparison | Z | pHolm | Cliff’s delta2 |
|---|---|---|---|
| S1-PRE vs S2-POST | -19.44 | < 1e-82 | -0.783 |
| S1-PRE vs S3-FU | -7.86 | < 1e-13 | -0.490 |
| S1-PRE vs S4-DFU | -2.11 | 0.0345 | -0.171 |
| S2-POST vs S3-FU | 14.10 | < 1e-43 | 0.641 |
| S2-POST vs S4-DFU | 12.47 | < 1e-34 | 0.833 |
| S3-FU vs S4-DFU | 5.19 | < 1e-6 | 0.602 |
2 Note: Cliff’s delta is computed as first wave minus second wave (first – second); negative values indicate higher ESV in the second wave.
Table 4.
ESV items with significant change from S3-FU to S4-DFU (item-wise Mann–Whitney tests with Holm correction across 25 items). Ms are on the 1–6 scale; Delta M is S4 minus S3. Cliff’s delta is computed as S3 minus S4, so positive values indicate higher scores in S3-FU.
Table 4.
ESV items with significant change from S3-FU to S4-DFU (item-wise Mann–Whitney tests with Holm correction across 25 items). Ms are on the 1–6 scale; Delta M is S4 minus S3. Cliff’s delta is computed as S3 minus S4, so positive values indicate higher scores in S3-FU.
| Item | M S3 | M S4 | Delta M (S4 − S3) |
pHolm | Cliff’s delta (S3 − S4) |
|---|---|---|---|---|---|
| Q19 | 4.09 | 2.78 | -1.32 | < 1e-15 | 0.614 |
| Q25 | 4.15 | 3.39 | -0.76 | < 1e-7 | 0.421 |
| Q4 | 4.08 | 3.42 | -0.67 | < 1e-4 | 0.355 |
| Q1 | 4.26 | 3.72 | -0.55 | < 1e-4 | 0.340 |
| Q2 | 3.93 | 3.40 | -0.53 | < 1e-3 | 0.296 |
| Q20 | 4.29 | 3.87 | -0.43 | 0.002 | 0.277 |
| Q21 | 4.16 | 3.67 | -0.49 | 0.003 | 0.272 |
| Q9 | 3.94 | 3.42 | -0.52 | 0.004 | 0.268 |
| Q16 | 4.40 | 3.99 | -0.41 | 0.013 | 0.242 |
| Q17 | 4.16 | 3.81 | -0.35 | 0.021 | 0.232 |
| Q7 | 4.43 | 4.01 | -0.41 | 0.032 | 0.221 |
Table 5.
S4-DFU contextual indicators for XR/UX and Heritage Engagement (N = 67) 3.
| Measure | Statistic or category | Value |
|---|---|---|
| Heritage Engagement index (A.2.1 to A.2.5) | M (SD) | 3.78 (0.98) |
| Heritage Engagement index (A.2.1 to A.2.5) | MDN | 4 |
| Heritage Engagement index (A.2.1 to A.2.5) | Range (R) | 1 to 5 |
| Technology Usability index (TechUsability) | M (SD) | 3.03 (0.87) |
| Technology Usability index (TechUsability) | MDN | 3 |
| Technology Usability index (TechUsability) | R | 1 to 4 |
| Path map use (A.3.3) | Easy | 47/67 (70.10%) |
| Path map use (A.3.3) | Not easy | 12/67 (17.90%) |
| Path map use (A.3.3) | Not used | 8/67 (11.90%) |
| Path map use (A.3.3) | Difficulty or non-use | 20/67 (29.90%) |
| TechUsability distribution | Score 1 | 4/67 (6.00%) |
| TechUsability distribution | Score 2 | 12/67 (17.90%) |
| TechUsability distribution | Score 3 | 29/67 (43.30%) |
| TechUsability distribution | Score 4 | 22/67 (32.80%) |
3 Note: N = 67 corresponds to the S4-DFU analytic sample defined by complete cases for Q1 to Q25. Heritage Engagement is the sum of A.2.1 to A.2.5 (Yes = 1). TechUsability is the sum of A.3.2 and A.3.4 (Yes = 1) plus reverse-coded A.3.5 and A.3.6 (No = 1). Percentages are computed over N = 67.
Table 6.
Baseline-to-latest ESV descriptives (S1-PRE vs S4-DFU; complete-case Q1–Q25). ESV is the participant-level mean of Q1–Q25 (scale 1–6). Mean and median CIs are bootstrap percentile intervals; prevalence CIs are Wilson score intervals.
Table 6.
Baseline-to-latest ESV descriptives (S1-PRE vs S4-DFU; complete-case Q1–Q25). ESV is the participant-level mean of Q1–Q25 (scale 1–6). Mean and median CIs are bootstrap percentile intervals; prevalence CIs are Wilson score intervals.
| Wave | Analytic N | ESV M (95% CI) |
SD | MDN (95% CI) |
IQR | % ESV ≥ 4.00 (95% CI) | % ESV ≥ 4.50 (95% CI) |
|---|---|---|---|---|---|---|---|
| S1-PRE | 221 | 3.70 [3.63, 3.77] | 0.54 | 3.60 [3.56, 3.72] | 3.32–4.08 | 29.00% [23.40%, 35.30%] | 9.00% [5.90%, 13.60%] |
| S4-DFU | 67 | 3.79 [3.72, 3.86] | 0.30 | 3.84 [3.76, 3.92] | 3.64–4.02 | 34.30% [24.10%, 46.30%] | 0.00% [0.00%, 5.40%] |
Table 7.
Two-sample contrast estimates for ESV (S4-DFU minus S1-PRE). Estimates include mean and median differences, Hodges–Lehmann location shift, Mann–Whitney U (MWU), Cliff’s delta, and a Welch t-test sensitivity check, with 95% bootstrap intervals where applicable.
Table 7.
Two-sample contrast estimates for ESV (S4-DFU minus S1-PRE). Estimates include mean and median differences, Hodges–Lehmann location shift, Mann–Whitney U (MWU), Cliff’s delta, and a Welch t-test sensitivity check, with 95% bootstrap intervals where applicable.
| Metric | Estimate |
|---|---|
| Mean difference (S4 − S1) | 0.091 |
| 95% CI (bootstrap) for mean difference | [-0.009, 0.189] |
| 95% CI (Welch) for mean difference | [-0.010, 0.192] |
| Median difference (S4 − S1) | 0.240 |
| 95% CI (bootstrap) for median difference | [0.080, 0.320] |
| Hodges–Lehmann (S4 − S1) | 0.160 |
| 95% CI (bootstrap) Hodges–Lehmann | [0.040, 0.240] |
| Mann–Whitney U (two-sided) | U = 6141, p = 0.0345 |
| Cliff’s delta (S4 − S1) | 0.171 |
| 95% CI (bootstrap) Cliff’s delta | [0.034, 0.301] |
| Welch t-test (sensitivity) | t = 1.776, p = 0.077 |
Table 8.
Two-sample contrast estimates for ESV (S4-DFU minus S1-PRE). Estimates include mean and median differences, Hodges–Lehmann location shift, Mann–Whitney U (MWU), Cliff’s delta, and a Welch t-test sensitivity check, with 95% bootstrap intervals where applicable.
Table 8.
Two-sample contrast estimates for ESV (S4-DFU minus S1-PRE). Estimates include mean and median differences, Hodges–Lehmann location shift, Mann–Whitney U (MWU), Cliff’s delta, and a Welch t-test sensitivity check, with 95% bootstrap intervals where applicable.
| Threshold | S1-PRE | S4-DFU | Difference (S4 − S1), 95% CI |
|---|---|---|---|
| ESV ≥ 4.00 | 29.00% | 34.30% | 5.40 pp4 [-6.70 pp, 18.50 pp] |
| ESV ≥ 4.50 | 9.00% | 0.00% | -9.00 pp [-13.60 pp, -2.80 pp] |
4 Note: Percentual Point (pp).
Table 9.
Baseline-to-latest item-level contrasts (S1-PRE vs S4-DFU; item-wise Mann–Whitney tests with Holm correction across 25 items). Means are on the 1–6 scale; Δ is S4 minus S1. Cliff’s delta is computed as S4 minus S1, so positive values indicate higher scores in S4-DFU. The Qs are order by number).
| Item | Mean S1 | Mean S4 | Delta (S4 − S1) | pHolm | Cliff’s delta (S4 − S1) |
|---|---|---|---|---|---|
| Q6 | 3.65 | 4.27 | 0.622 | 0.047073 | 0.241 |
| Q9 | 3.97 | 3.42 | -0.550 | 0.035528 | -0.248 |
| Q12 | 3.47 | 4.10 | 0.638 | 0.017545 | 0.266 |
| Q18 | 3.67 | 4.48 | 0.812 | 0.002052 | 0.310 |
| Q19 | 3.65 | 2.78 | -0.871 | 0.000174 | -0.355 |
| Q25 | 3.87 | 3.39 | -0.485 | 0.047073 | -0.239 |
Disclaimer/Publisher’s Note: The statements, opinions and data contained in all publications are solely those of the individual author(s) and contributor(s) and not of MDPI and/or the editor(s). MDPI and/or the editor(s) disclaim responsibility for any injury to people or property resulting from any ideas, methods, instructions or products referred to in the content. |
© 2026 by the authors. Licensee MDPI, Basel, Switzerland. This article is an open access article distributed under the terms and conditions of the Creative Commons Attribution (CC BY) license.
Copyright: This open access article is published under a Creative Commons CC BY 4.0 license, which permit the free download, distribution, and reuse, provided that the author and preprint are cited in any reuse.


