Submitted:
15 February 2026
Posted:
16 February 2026
You are already at the latest version
Abstract
Objectives: Using high-performance liquid chromatography (HPLC) we developed and validated an in vitro assay for the quantitative determination of beta-site amyloid precursor protein cleaving enzyme 1 (BACE1) activity, supplementing limited current methodologies to assess the efficacy of BACE1 inhibitor compounds. A hexa-histidine tagged peptide substrate of BACE1 was used as the analyte for the determination of in vitro BACE1 activity; it was validated according to ICH guidelines. Methods: The HPLC analysis was performed on the Agilent 1290 Series Infinity II UHPLC System equipped with a Phenomenex Kinetex EVO C18 (100 × 3 mm) 5 µm column. The method was developed using a gradient program comprising of 10 % aqueous acetonitrile (0.02 M TFA) to 30% aqueous acetonitrile (0.02 M TFA) for 5 minutes at a flow rate of 0.6 ml/min. Results: The method showed linearity over the range of 14.92 to 72 µM with R^2=0.9997. The accuracy of the method in terms of mean recovery ranged between 96.62 to 98.38 %. The %RSD for intra- and inter-day precision were less than 5 %. Two commercial inhibitors, AZD3839 and OM99-2, were used to evaluate the performance of the method at their respective IC50, resulting in inhibition of 53.46 and 50.74 % respectively. The described method addresses the void for a practical and cheap alternative to quantitatively determine the activity of BACE1 compared to current commercially available detection assays. Conclusions: We have successfully developed a HPLC method to measure the inhibitory function of two commercial inhibitors of BACE1, indicating suitability of the method for the identification and characterisation of novel BACE1 inhibitors.
Keywords:
Alzheimer's disease
; beta-secretase 1
; enzyme inhibitor
; peptides
; high-performance liquid chromatography
1. Introduction
Amyloid precursor protein (APP) is a transmembrane protein involved in several critical cellular processes, including synaptic formation and repair, neural plasticity, and intracellular signalling [1]. Its proteolytic processing by beta-site amyloid precursor protein cleaving enzyme 1 (BACE1) has been the focal point of Alzheimer’s disease (AD) research due to its direct involvement in generating β-amyloid (Aβ) peptides [2]. This protease initiates the cleaving of APP at the β-site, producing Aβ, which aggregates into amyloid plaques a defining feature of AD. Amyloid plaques are closely linked to neurodegeneration and cognitive decline [3]. The widespread impact of AD, a progressive neurodegenerative disorder affecting millions globally, places significant emphasis on understanding the biochemical pathways contributing to its development. Beyond its clinical consequences, AD imposes a substantial economic and social burden, intensifying the urgent need for reliable methods to understand and modulate BACE1 activity in Aβ generation [4].
Beyond AD, dysregulation in protease activity, including that of BACE1, can extend to other diseases. Proteases, crucial in various physiological processes, can become pathogenic when regulation is disrupted. These disruptions often lead to activity-imbalance disorders, with impacts ranging from metabolic diseases to inflammatory and cardiovascular conditions [5]. Such diseases can present as hereditary or sporadic, demonstrating the complex nature of protease involvement in disease aetiology [6]. Therefore, the precise, high-throughput, and adaptable methods to study protease function, particularly BACE1, are critical for advancing AD research and broader therapeutic development across multiple disease domains, which forms the overall aim of this article.
Despite significant progress in protease research, current methodologies for characterizing protease interactions remain limited. Functional assays, which measure the impact on enzyme activity, are essential but are frequently complex, necessitating specialized instruments, skilled personnel, and considerable time. Enzyme-linked immunosorbent assays (ELISA) approaches are commonly used but are not without drawbacks, including high costs and operational complexity [7]. Current methodologies for protease activity assessment have certain drawbacks when applied to complex biological systems. Fluorescence-based assays like fluorescence immunoassays (FIA) and fluorescence resonance energy transfer (FRET) may encounter issues such as autofluorescence and dipole-dipole coupling interruptions, leading to potential false positives or negatives [8,9]. Assessment of BACE1 activity using FRET enables high sensitivity and specificity with the use of advanced materials, however, has fallbacks in the cost, complexity and limited protease accessibility due to addition of fluorescent labels [10]. Additionally, surface plasmon resonance (SPR) can measure BACE1 activity in real-time with high sensitivity and label free, however, has limited throughput and requires stringent optimization [11].
This variability underscores the need for a robust, time-efficient, and versatile method to bridge these challenges. This article aims to address this need by developing an innovative and efficient analytical method for evaluating BACE1 activity, facilitating advancements in protease-targeted therapeutic discovery. The proposed BACE1 activity assay, using reverse-phase high-performance liquid chromatography (RP-HPLC), based assay that enables the direct assessment of BACE1 activity. Unlike methods that require labelling or tagging, this assay is designed to measure enzyme activity without modifying biomolecules, thereby preserving native conditions and enhancing reliability. This approach builds on chromatographic techniques but introduces a streamlined and cost-effective framework adaptable for routine use. By providing a clear, functional characterization of protease activity, this RP-HPLC assay offers a robust alternative that can be integrated into high-throughput workflows with minimal resource investment. By optimizing this approach, we contribute a significant methodological advancement that facilitates the ease of use of HPLC in protease research. The broader significance of this study lies in promoting a simplified pathway for high-throughput protease activity assessment, which can be extended to other proteases with the adaptation of new liquid chromatography (LC) technologies. This work not only addresses a notable gap in current protease research but also lays the foundation for future integration of this technique into drug discovery pipelines.
2. Materials and Methods
2.1. Method Development
2.1.1. Preparation of Peptide Analyte and Inhibitors
The peptide analyte was prepared using microwave-assisted solid-phase peptide synthesis at Synpeptide Co., Ltd. (China). Peptide purity was assessed by high-performance liquid chromatography (HPLC) (Shimadzu Corporation) and freeze-dried and stored at -20 °C until further use.
2.1.2. Standards and Working Solutions
Biologically active recombinant BACE1 (AcroBiosystems, USA) was prepared in ultrapure water to a concentration of 6.81 µM (400 µg/mL), aliquoted and stored at -80 °C. For preparation of standard solutions for validation, an aliquot was heated to 70 °C for 10 min [12], aliquoted and stored at -80 °C. The activity of the heat-treated BACE1 was assessed and compared to the activity of the non-heat-treated sample in the method development.
The peptide analyte (HHHHHHKTEEISEVNLDAEFRHDSGY) was prepared in DMSO at a concentration of 50 mM and further diluted in 0.01 M acetate buffer (pH 4.5) to a final concentration of 1 mM in 0.02 M acetate buffer (pH 4.5). Stock solutions were aliquoted into single-use stocks and stored at -80 °C. Calibration standards were prepared in 0.02 M acetate buffer (pH 4.5) in the range of 14.92 µM to 72 µM using seven concentration levels, with 10 nM of heat-treated BACE1. Quality control standards at low (25.21 µM), medium (42.60 µM) and high (72 µM) concentrations were also prepared, with 10 nM heat-treated BACE1 [13].
2.1.3. Development of Chromatographic Conditions
Peptide analyte at 60 µM was used to determine optimal chromatographic conditions for peak shape and elution time. Acetonitrile and methanol were evaluated as mobile phases with 0.02 M TFA [v/v]. Formic acid (FA), phosphoric acid (PA) and trifluoroacetic acid (TFA) were evaluated as mobile phase additives, using mobile phase of acetonitrile and final concentration of additive at 0.02 M [v/v]. Flow rates and column temperatures were evaluated in a mobile phase, consisting of acetonitrile with 0.02 M TFA [v/v], from 0.6 mL/min to 1 mL/min and 20 °C to 40 °C, respectively.
2.1.4. Instrument
The Agilent 1290 Series Infinity II UHPLC System liquid chromatographic system used in method development and validation was equipped with a high-speed binary pump with an inbuilt degasser (model G7120A), a multisampler (model G7167B), a column thermostat (model G7116B) and a DAD detector (model G7117A). Software OpenLab CDS version 2.15.26 was used for instrument control and data processing and evaluation.
2.1.5. Development of Enzyme Assay Conditions
BACE1 enzyme assay was adapted from Yi et al. and altered to attain approximately 60% conversion of peptide analyte [14]. Reaction buffer, 0.02 M acetate buffer (pH 4.5), was used to dilute the peptide analyte to 60 µM. The peptide analyte was preheated in a protein LoBind® tube (Eppendorf, Germany) at 37 °C for 5 min prior to adding 10 nM of BACE1. The samples were incubated in an Eppendorf ThermoMixer®C for 90 min at 37 °C at 300 rpm. The assay was stopped with 10% [v/v] 3 M HCl, followed by centrifugation at 13,000 g for 10 min at 4 °C to pellet aggregated insoluble material. The supernatant was transferred to HPLC vials and loaded into the instrument for analysis.
2.1.6. Chromatographic Conditions
Chromatographic analysis was performed with a Phenomenex Kinetex EVO C18 5 µm, 100 x 3 mm and 100 Å analytical column (Torrance, CA, USA). The specific instrument settings are as follows: flow rate was set to 0.6 mL/min, injection volume set to 20 µl, column heater was set to 30 °C and UV detector set to 280 nm. Solvent A was prepared by adding 0.02 M TFA [v/v] to ultrapure water and, solvent B was prepared by adding 0.02 M TFA [v/v] to acetonitrile. Both mobile phases were prepared fresh daily. The solvent program was a gradient starting with 10% solvent B and linearly increasing to 30% solvent B in 5 min. The mobile phase was ramped to 100% solvent B for 3.5 min to clean the column, and then to 10% solvent B for equilibration prior to the next injection for a total run time of 17 min. Peptide analyte eluted at approx. 4 min.
2.2. Method Validation
2.2.1. Specificity
Specificity is the ability of the analytical method to distinguish between the analyte and other components that may be found in the sample matrix. Specificity and suitability of the matrix were determined by separately injecting the peptide analyte, BACE1 enzyme assay sample and reaction buffer onto the column. Chromatograms were assessed to identify interfering peaks that may affect quantitative determination of the peptide analyte.
2.2.2. Linearity
Linearity is related to the ability of an analytical method to produce results proportional to the concentration of the analyte. To evaluate linearity of the peptide analyte, sample buffer was spiked with the peptide analyte stock solution at concentrations of 14.92, 19.39, 25.21, 32.77, 42.60, 55.38 and 72.00 µM, over six different days (n = 6). The solutions were injected in triplicate onto the column, with a constant injection volume of 20 µL. Calibration curves of concentration versus peak area were plotted and evaluated by linear regression analysis.
The limits of detection and quantification (LoD and LoQ, respectively) were determined according to ICH guidelines [15]. The equations are as outlined below:
where σ is standard deviation (SD) of the y-intercept and S is the mean of the slope of the calibration curves.
LoD = 3.3σ / S
LoQ = 10σ / S
2.2.3. Accuracy
Accuracy of the assay method was evaluated by the determination of the recovery of analyte from spiked reaction buffer. Recovery was evaluated using the quality control standards at the three concentrations (25.21 µM, 42.60 µM, and 72 µM) where six replicates (n = 6) for each standard were prepared and analysed. The mean percent recovery of the standards was calculated for each QC level.
2.2.4. Precision
Precision of the proposed methods were evaluated by multiple measurements of the peptide analyte over two consecutive days with two different analysts. Repeatability (intra-day) was evaluated by assessing the relative standard deviation (RSD) of six replicates (n = 6) at 100% peptide analyte concentration. Similarly, intermediate precision (inter-day) of the method was evaluated on a second consecutive day with a different analyte, generating a total of 12 replicates (n = 12). Repeatability and intermediate precision were assessed by RSD, where the deviation should not exceed 5% [15,17].
2.2.5. Robustness
Robustness of the proposed method was determined by modifying two factors, flow rate and temperature. Robustness was assessed by altering the run parameter by 10% and measuring the recovery of the peptide analyte across three replicates (n = 3) at 100%. The robustness of the method to variations in temperature and flow rate were assessed by % change in recovery and RSD, where deviation should not exceed 5%.
2.3. Commercial Inhibitor Assay
AZD3839 (Sigma Aldrich, Australia) and OM99-2 (Anaspec, USA) were reconstituted in DMSO according to manufacturer’s recommendations, diluted in reaction buffer, aliquoted and stored at -20 °C. BACE1 activity assay conditions were identical to above, with one modification noted below. AZD3839 and OM99-2 were diluted to final working concentrations of 26.1 nM and 1.6 nM respectively, in reaction buffer and mixed with 10 nM BACE1 for 60 min pre-incubation. Pre-incubation conditions were the same as the assay conditions. The assay was then carried out as stated above.
3. Results
3.1. Method Development and Optimisation
The analytical method was developed over a series of trials to optimise mobile phase, run time and flow rate. Mobile phase screening was performed with a linear gradient starting at 10% solvent B to 100% in 30 min. Acetonitrile with 0.02 M TFA afforded the best peak resolution and shortest retention time over the other solvents and additives.
The run was reduced to 5 min with a gradient of 10% solvent B to 30%. Flow rate and temperature were investigated with the optimised run parameters, assessing peak shape for fronting or tailing and baseline for drift as a measure of optimal conditions. A flow rate of 0.6 mL/min and temperature of 30 °C gave the best peak shape and least amount of interference with integration of peak area from the baseline (Figure 1).
The enzyme assay was a modified protocol from Yi et al. following optimisation of incubation time, peptide analyte concentration and stopping the reaction. A 90 min incubation time displayed optimal processing of the peptide analyte, processing approximately 60% of the analyte. The reaction was successfully stopped by adjusting the pH of the sample with 3 M HCl.
3.2. Method Validation
3.2.1. Specificity
Comparison of the chromatograms in Figure 2 show no interfering peaks in the A) blank samples at the tR of the B) peptide analyte. The C) BACE1-treated sample shows the presence of two fragment peaks (2.535 min and 3.404 min), which are separate to the peptide analyte peak, also not interfering with quantitative determination of the analyte.
3.2.2. Linearity
Six calibration plots were constructed after analysis of seven peptide analyte samples in the range of 14.92 to 72 µM. Linearity of the calibration plot data was verified by linear regression analysis by plotting peak area against spiked concentration (Table 1). The limits of detection and quantification were calculated based on the standard deviation of the response and the slope of the standard curves. The regression coefficient (r2) values for the six calibration plots were found to be > 0.99 (Table 2). From the regression analysis of all six plots, a linear equation was obtained:
y = 1.5265x – 5.213, r2 = 0.9997
The regression coefficient for the linearity of the peptide analyte indicates a linear relationship between the concentration of the peptide analyte and the area under the peak.
3.2.3. Accuracy
Accuracy of the method was evaluated through spiking the reaction buffer with QC standards and analysing the recovery using the proposed method. The mean recovery was found to be between 96.62% and 98.38%, and the RSD was less than 5% for each standard (Table 3). The acceptance criteria for peptide recovery from sample matrix (i.e., 90-110% recovery) was met as was RSD of peptide recovery (i.e., < 5%), indicating the proposed method has good recovery of the peptide analyte [12].
3.2.4. Precision
Precision was evaluated by determining the RSD of repeatability (intra-day) and intermediate precision (inter-day) of samples at 100% peptide analyte concentration (60 µM) over two successive days with two different analysts. The RSD of repeatability and intermediate precision were between 1.4% and 2.1% (Table 4), which complied with the ICH guidelines (RSD < 5%) [15,16,17,18]. Therefore, the results showed that the method is precise within acceptable limits.
3.2.5. Robustness
Robustness of the method was evaluated by determining the change in recovery and retention time compared to normal run conditions. Temperature had the least effect on recovery and retention time, the change in recovery was less than 0.3% and time was less than 2% overall (Table 5). Flow rate had the largest effect on both recovery and retention time, affecting recovery by up to 13% and retention time over 4%. RSD for each group in both recovery and retention time was less than 1.
3.3. Commercial Inhibitor Assay
Commercially available inhibitors were assessed for their ability to limit BACE1 activity, and the ability of the HPLC analytical method developed here to determine this. The inhibitors were incubated with BACE1 for 60 min, allowing maximal effectiveness of the inhibitors. The area of the peak corresponding to the full-length peptide analyte (3.906 min) was measured for all treatments. The mean peak area of each inhibitor treatment was compared to the mean peak area of the BACE1-only control sample and % inhibition was determined (Table 6). AZD3839 and OM99-2 effectively inhibited BACE1, reducing activity by 53.46% and 50.74%, respectively.
4. Discussion
A reverse-phase HPLC method has been successfully developed and validated for analysis of BACE1 activity in vitro. The method was developed as a proof of concept to demonstrate the ease of measuring protease activity using HPLC. Measuring the activity of proteases using shortened peptide-length substrates is not novel, nor is it outdated, as many analytical techniques are sensitive enough to measure changes in full-length peptide concentration. In this work, the effect of commercial inhibitors of BACE1 was able to be successfully detected on a HPLC with UV-Vis detection. The peptide analyte used in the method was selected from an analytical method published using SPR for the detection of BACE1 activity in the presence of inhibitors [14]. The analyte was used unaltered with the intent of demonstrating the ability of using the same peptide in different analytical techniques. It was also noted that a poly-histidine addition may improve the separation of the two fragment peaks following BACE1 processing, where improved separation will confirm the presence of two peaks and therefore BACE1 activity. Without the poly-histidine addition, the fragments would be ten residues long with similar hydrophobicity and charge.
Optimisation of the method identified acetonitrile and TFA (0.2 M) as a suitable solvent system for best peak shape. Further optimisation was performed of run time, flow rate, gradient and column temperature. All parameters were selected based on the ability to integrate peaks without interference. During optimisation of temperature, an atypical increase in retention time (approximately 0.3 minutes) from 20 °C to 40 °C was seen (Figure 1b) and should be noted when using this method. The cause of this effect was not determined in this article. However, it is hypothesised that the increase in temperature may have led to the formation of small amyloid-like fibrils due to the aggregative nature of the Aβ portion of the analyte, propagated by the inclusion of the poly-histidine N-terminal [19].
The method was validated as guided by the ICH Harmonised Tripartite Guideline Q2(R1), in terms of specificity, linearity, limits of detection and quantification, accuracy and precision [15]. Limitations in flow rate and column temperature were identified whilst assessing robustness which may affect results if not suitably controlled for.
Specificity was assessed to confirm the absence of interfering peaks in samples. Assessment of chromatograms containing reaction buffer (i.e., blank), peptide analyte (i.e., standard) and BACE1-treated peptide analyte (i.e., sample) showed no co-eluting peaks at any point during development and at the validation step. Commercial inhibitors were also assessed for co-eluting peaks at the concentrations used in each assay and none were identified.
The method showed a linear range of the substrate from 14.92 µM to 72 µM, with low limits of detection and quantification, 2.40 µM and 7.26 µM respectively, indicating the lowest amount of analyte that can be detected and the lowest amount of analyte that can be determined with suitable precision. Linearity of the replicates over six days returned with a correlation coefficient of over 0.999 and a mean correlation coefficient from individual replicate days of 0.999. Elution time of the peptide analyte was determined from the mean of all runs over the six days, which was determined as 3.906 ( 0.022) min. Throughout the remainder of validation, the elution time varied < 0.5% (3.938 0.019 min).
Accuracy and precision of the method was determined to be reliable following repeat injections of the analyte over two separate days and ability to determine concentration through the linear equation obtained during linearity validation. The method demonstrated acceptable precision across the two days, with an RSD of less than 2.5%, and a mean recovery of 61.17 (1.25) µM. The accuracy of the method was determined by measuring the three QC levels across two days, and recovery for each QC level calculated from peak area. Mean recovery for all levels was greater than 96% with an RSD below 5%, displaying accuracy within the terms of the ICH guidelines.
Robustness of the analytical method was determined by deliberately altering method parameters to account for gross changes found in experiment-to-experiment variability. Flow rate and column temperature were altered by 10% and the precision was assessed. Column temperature had no significant effect on the recovery of peptide analyte or elution time, recovery varying less than 0.5% and elution time less than 2%. Flow rate had significant effects on the recovery and elution of the peptide analyte, with up to a 12.95% change in recovery and 4.48% change in elution time. Changes in flow rate are known to have effect on the elution profile of analytes and is accounted for in ICH guideline recommendations by explicitly stating that susceptibility to variation can occur and should be noted in method presentation with parameters to control the variation [20].
Once validated, the assay was tested with two commercial BACE1 inhibitors, OM99-2 and AZD3839, both effective in the inhibition of BACE1 in vitro at nanomolar concentrations [21,22]. The control inhibitors were used at the published inhibitor constant (Ki) to assess the precision of the method to identify 50% maximal inhibition of BACE1. Both control inhibitors successfully inhibited activity of BACE1, significantly reducing the activity by 50.74% (OM99-2) and 53.36% (AZD3839) in a non-competitive assay.
5. Conclusions
The method, which was successfully developed and presented here, was used to screen two commercial BACE1 inhibitors, OM99-2 and AZD3839, both effective inhibitors of BACE in vitro at nanomolar concentrations. The method was able to detect inhibition when using the commercial inhibitors at their published inhibitor constant (Ki), where both commercial inhibitors successfully reduced activity of BACE1 by 50.74% (OM99-2) and 53.36% (AZD3839) in a non-competitive assay. This proves the ability of the method to identify a reduction in BACE1 activity, and therefore it’s suitability as a screening tool for novel inhibitors against BACE1. Therefore, this inexpensive and readily accessible method will be of great benefit to all researchers in protease activity assays, but particularly for those researchers with limited funds and resources, contributing to improve the capability of research progress globally.
Author Contributions
Conceptualization, S.K. and C.S.; methodology, S.K. and B.W.; writing—original draft preparation, S.K.; writing—review and editing, B.W. and C.S. All authors have read and agreed to the published version of the manuscript.
Funding
This research received no external funding.
Data Availability Statement
The raw data supporting the conclusions of this article will be made available by the authors on request.
Conflicts of Interest
The authors declare no conflicts of interest.
Abbreviations
The following abbreviations are used in this manuscript:
| HPLC | High-performance liquid chromatography |
| BACE1 | Beta-site amyloid precursor protein cleaving enzyme 1 |
| ICH | International council for harmonisation |
| TFA | Trifluoroacetic acid |
| RSD | Relative standard deviation |
| APP | Amyloid precursor protein |
| AD | Alzheimer’s disease |
| Aβ | β-amyloid |
| ELISA | Enzyme-linked immunosorbent assay |
| FIA | Fluorescence immunoassay |
| FRET | Fluorescence resonance energy transfer |
| SPR | Surface plasmon resonance |
| RP-HPLC | Reverse phase high-performance liquid chromatography |
| LC | Liquid chromatography |
| FA | Formic acid |
| PA | Phosphoric acid |
| LoD | Limit of detection |
| LoQ | Limit of quantification |
| SD | Standard deviation |
| QC | Quality control |
| DMSO | Dimethyl sulfoxide |
| tR | Retention time |
References
- Cho, Y; Bae, HG; Okun, E; Arumugam, TV; Jo, DG. Physiology and pharmacology of amyloid precursor protein. Pharmacol Ther. 2022, 235, 108122. [Google Scholar] [CrossRef] [PubMed]
- Yuksel, M; Tacal, O. Trafficking and proteolytic processing of amyloid precursor protein and secretases in Alzheimer’s disease development: An up-to-date review. European Journal of Pharmacology 2019, 856, 172415. [Google Scholar] [CrossRef] [PubMed]
- Rahman, MM; Lendel, C. Extracellular protein components of amyloid plaques and their roles in Alzheimer’s disease pathology. Molecular Neurodegeneration 2021, 16(1), 59. [Google Scholar] [CrossRef] [PubMed]
- Nandi, A; Counts, N; Chen, S; Seligman, B; Tortorice, D; Vigo, D; et al. Global and regional projections of the economic burden of Alzheimer’s disease and related dementias from 2019 to 2050: A value of statistical life approach. EClinicalMedicine 2022, 51, 101580. [Google Scholar] [CrossRef] [PubMed]
- Slack, MA; Gordon, SM. Protease Activity in Vascular Disease. Arterioscler Thromb Vasc Biol. 2019, 39(10), e210–e8. [Google Scholar] [CrossRef] [PubMed]
- Famutimi, OG; Adebiyi, VG; Akinmolu, BG; Dada, OV; Adewale, IO. Trypsin, chymotrypsin and elastase in health and disease. Future Journal of Pharmaceutical Sciences 2024, 10(1), 126. [Google Scholar] [CrossRef]
- Alhajj, M; Zubair, M; Farhana, A. Enzyme Linked Immunosorbent Assay. In StatPearls; StatPearls Publishing: Treasure Island (FL).
- Terzapulo, X; Kassenova, A; Bukasov, R. Immunoassays: Analytical and Clinical Performance, Challenges, and Perspectives of SERS Detection in Comparison with Fluorescent Spectroscopic Detection. Int J Mol Sci. 2024, 25(4). [Google Scholar] [CrossRef] [PubMed]
- Lim, J; Petersen, M; Bunz, M; Simon, C; Schindler, M. Flow cytometry based-FRET: basics, novel developments and future perspectives. Cell Mol Life Sci. 2022, 79(4), 217. [Google Scholar] [CrossRef] [PubMed]
- Fan, J; Wei, X; Dong, H; Zhang, Y; Zhou, Y; Xu, M; et al. Advancement in Analytical Techniques for Determining the Activity of β-Site Amyloid Precursor Protein Cleaving Enzyme 1. Crit Rev Anal Chem. 2024, 54(6), 1797–809. [Google Scholar] [CrossRef] [PubMed]
- Yi, X; Chen, H; He, Y; Wang, J. Assay of Biomarkers for Alzheimer’s Disease by Surface Plasmon Resonance. Journal of Analysis and Testing 2024, 8(3), 251–61. [Google Scholar] [CrossRef]
- Wiesner, R; Scheller, C; Krebs, F; Wätzig, H; Oltmann-Norden, I. A comparative study of CE-SDS, SDS-PAGE, and Simple Western: Influences of sample preparation on molecular weight determination of proteins. Electrophoresis 2021, 42(3), 206–18. [Google Scholar] [CrossRef] [PubMed]
- Halde, S; Mungantiwar, A; Chintamaneni, M. Simple, precise and accurate HPLC method of analysis for nevirapine suspension from human plasma. Indian J Pharm Sci. 2011, 73(4), 416–21. [Google Scholar] [CrossRef] [PubMed]
- Yi, X; Hao, Y; Xia, N; Wang, J; Quintero, M; Li, D; et al. Sensitive and continuous screening of inhibitors of β-site amyloid precursor protein cleaving enzyme 1 (BACE1) at single SPR chips. Anal Chem. 2013, 85(7), 3660–6. [Google Scholar] [CrossRef] [PubMed]
- Q2(R1); Validation of Analytical Procedures: Text and Methodology. 2005.
- Penwell, A; Sharp, K; Mansour, M; Sammatur, L. Development and validation of an HPLC/UV assay for separation and quantification of peptide antigens from a liposomal vaccine delivery platform. J Pharm Biomed Anal. 2012, 66, 176–82. [Google Scholar] [CrossRef] [PubMed]
- Pinto, I; Cerqueira, C; Freitas, Z; Santos, E; do Carmo, F; Junior, E. Development and validation of an analytical method using High Performance Liquid Chromatography (HPLC) to determine ethyl butylacetylaminopropionate in topical repellent formulations. Brazilian Journal of Pharmaceutical Sciences 2017, 53. [Google Scholar] [CrossRef]
- Thompson, M; Ellison, SLR; Wood, R. Harmonized guidelines for single-laboratory validation of methods of analysis (IUPAC Technical Report). Pure and Applied Chemistry 2002, 74(5), 835–55. [Google Scholar] [CrossRef]
- Salazar, J; Samhan-Arias, AK; Gutierrez-Merino, C. Hexa-Histidine, a Peptide with Versatile Applications in the Study of Amyloid-β(1–42) Molecular Mechanisms of Action. Molecules 2023, 28(20). [Google Scholar] [CrossRef] [PubMed]
- Moldoveanu, SC; David, V. Chapter 2 - Parameters that Characterize HPLC Analysis; Moldoveanu, SC, David, V, Eds.; Elsevier: Essentials in Modern HPLC Separations, 2013; pp. 53–83. [Google Scholar] [CrossRef]
- Ghosh, AK; Shin, D; Downs, D; Koelsch, G; Lin, X; Ermolieff, J; et al. Design of Potent Inhibitors for Human Brain Memapsin 2 (β-Secretase). J Am Chem Soc. 2000, 122(14), 3522–3. [Google Scholar] [CrossRef] [PubMed]
- Jeppsson, F; Eketjäll, S; Janson, J; Karlström, S; Gustavsson, S; Olsson, LL; et al. Discovery of AZD3839, a potent and selective BACE1 inhibitor clinical candidate for the treatment of Alzheimer disease. J Biol Chem. 2012, 287(49), 41245–57. [Google Scholar] [CrossRef]
Figure 1.
Chromatograms of peptide analyte (60 µM) from method development: (a) assessing flow rate (0.6 – 1 mL/min) at 30 °C; (b) assessing column temperature (20 - 40 °C) at 0.6 mL/min. Note the x-axis has been shortened.
Figure 1.
Chromatograms of peptide analyte (60 µM) from method development: (a) assessing flow rate (0.6 – 1 mL/min) at 30 °C; (b) assessing column temperature (20 - 40 °C) at 0.6 mL/min. Note the x-axis has been shortened.
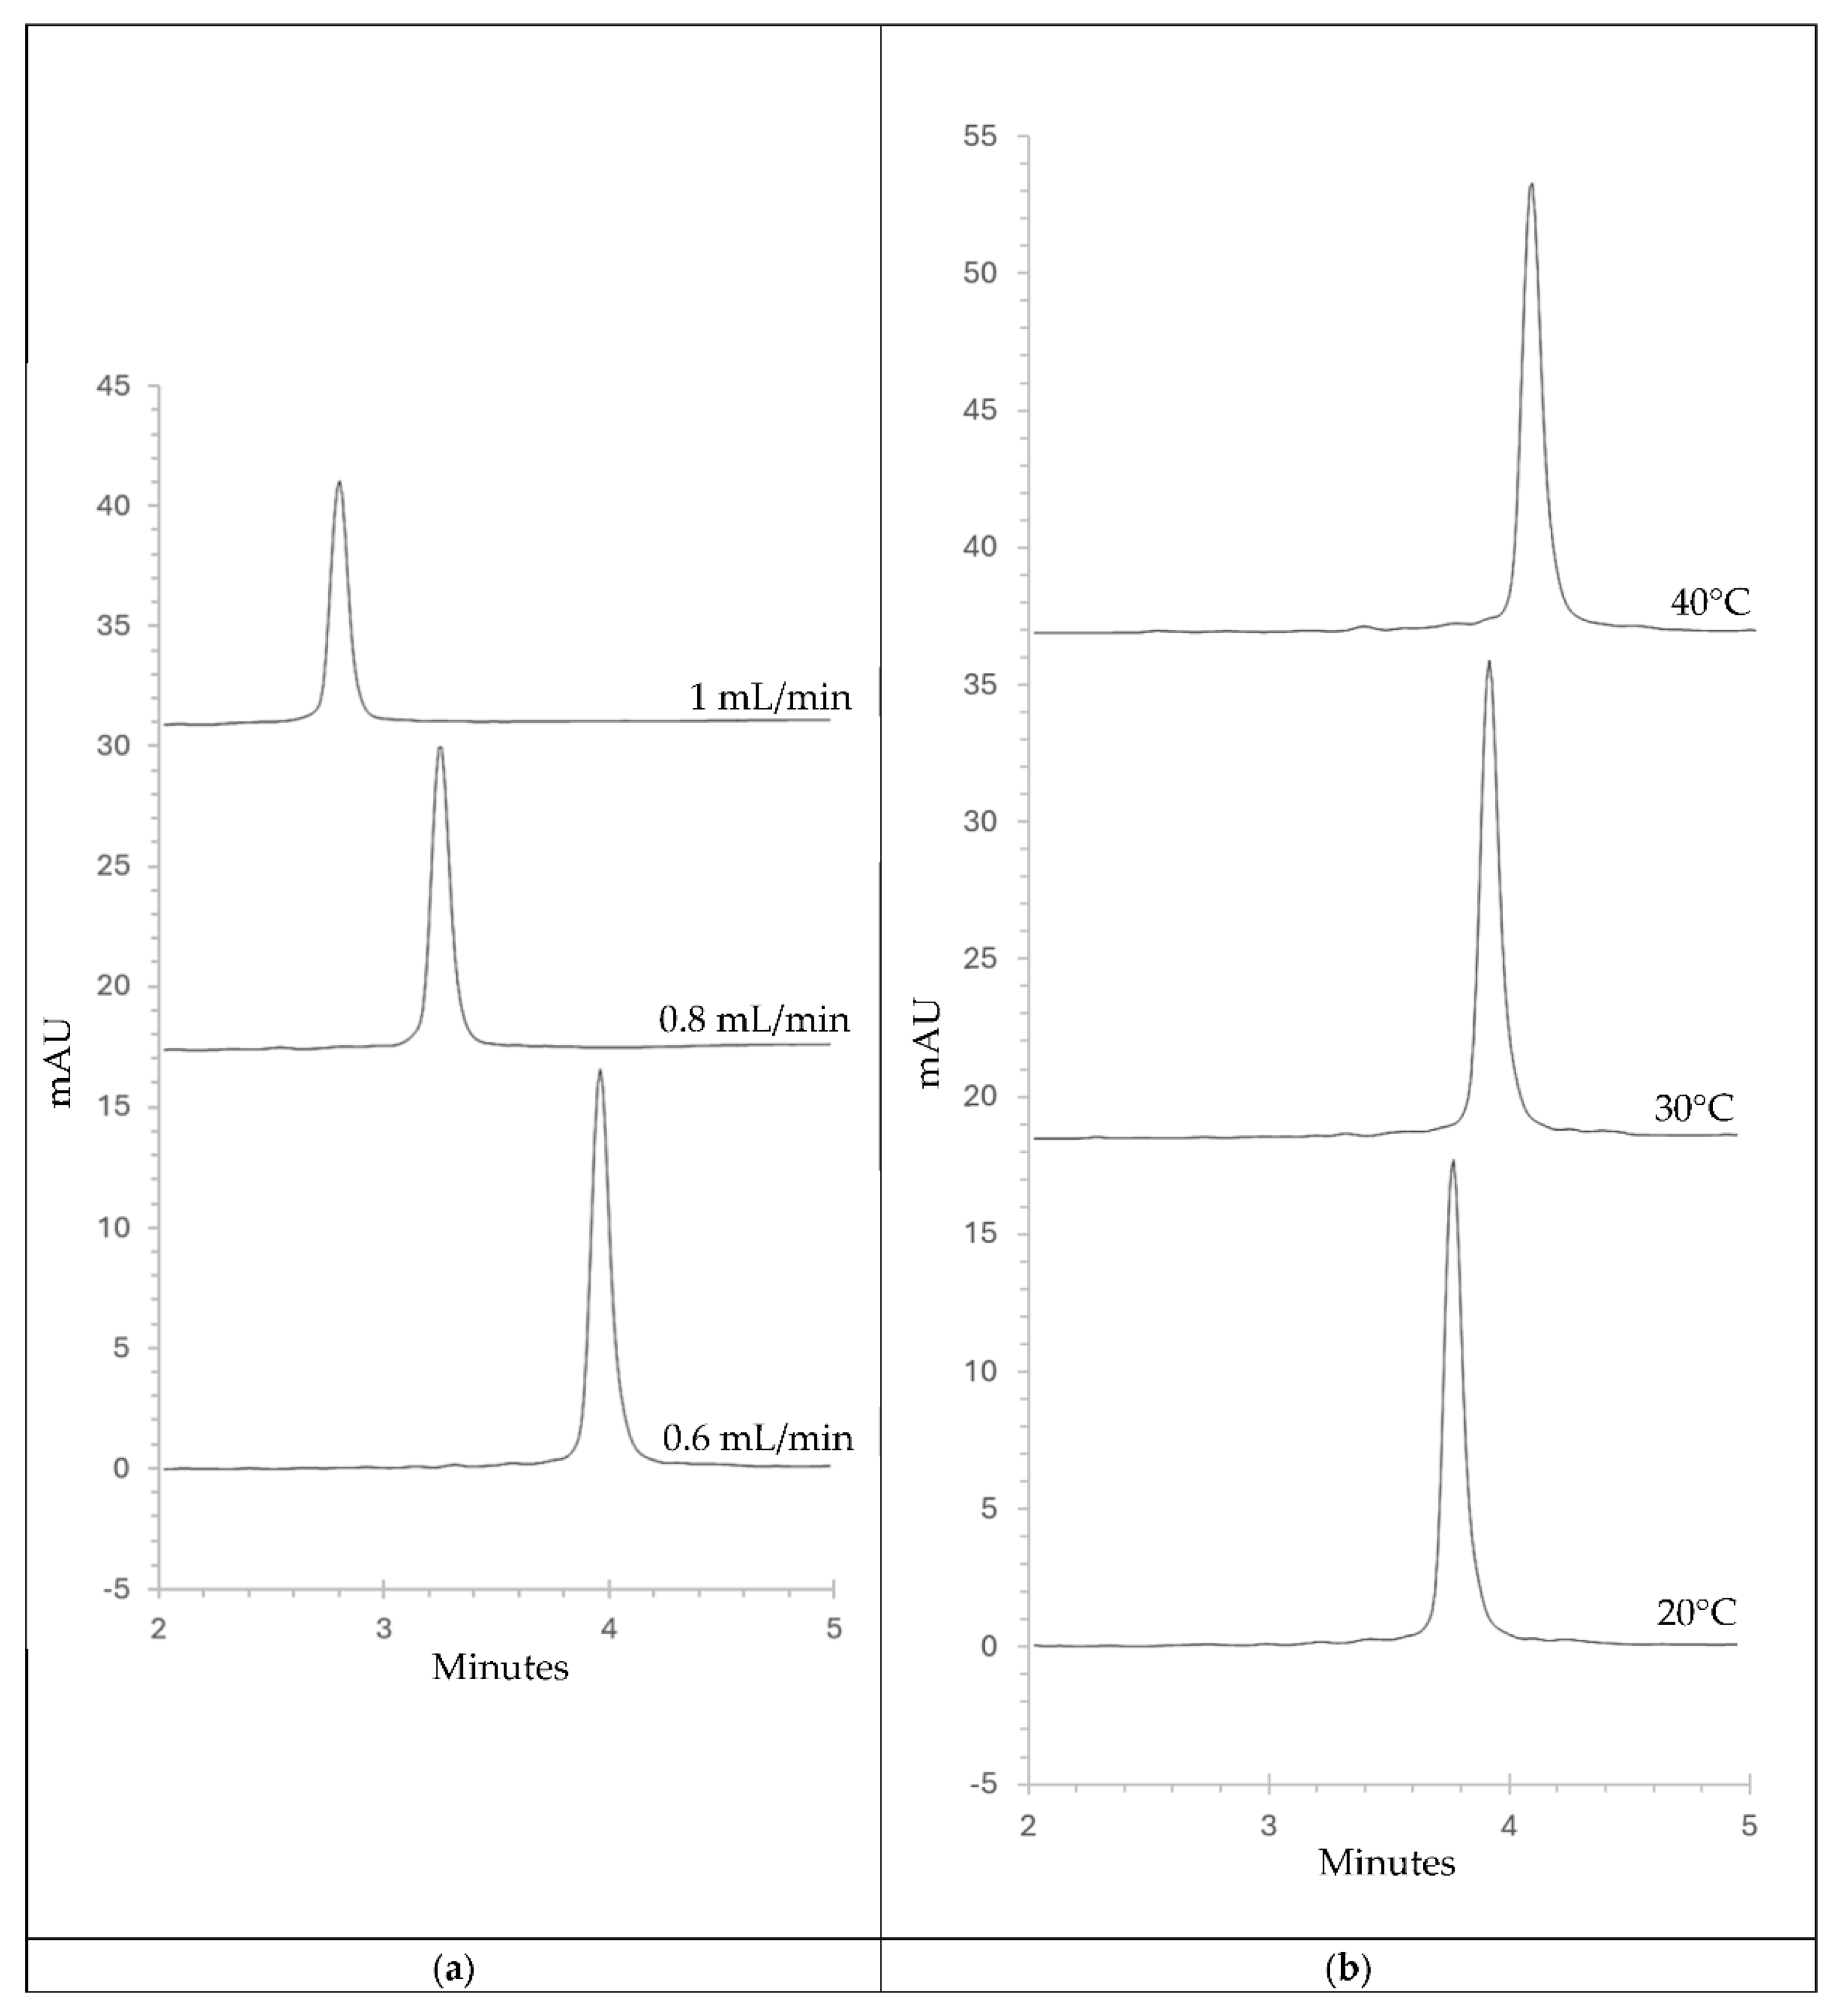
Figure 2.
Chromatograms displaying specificity of the developed HPLC method.
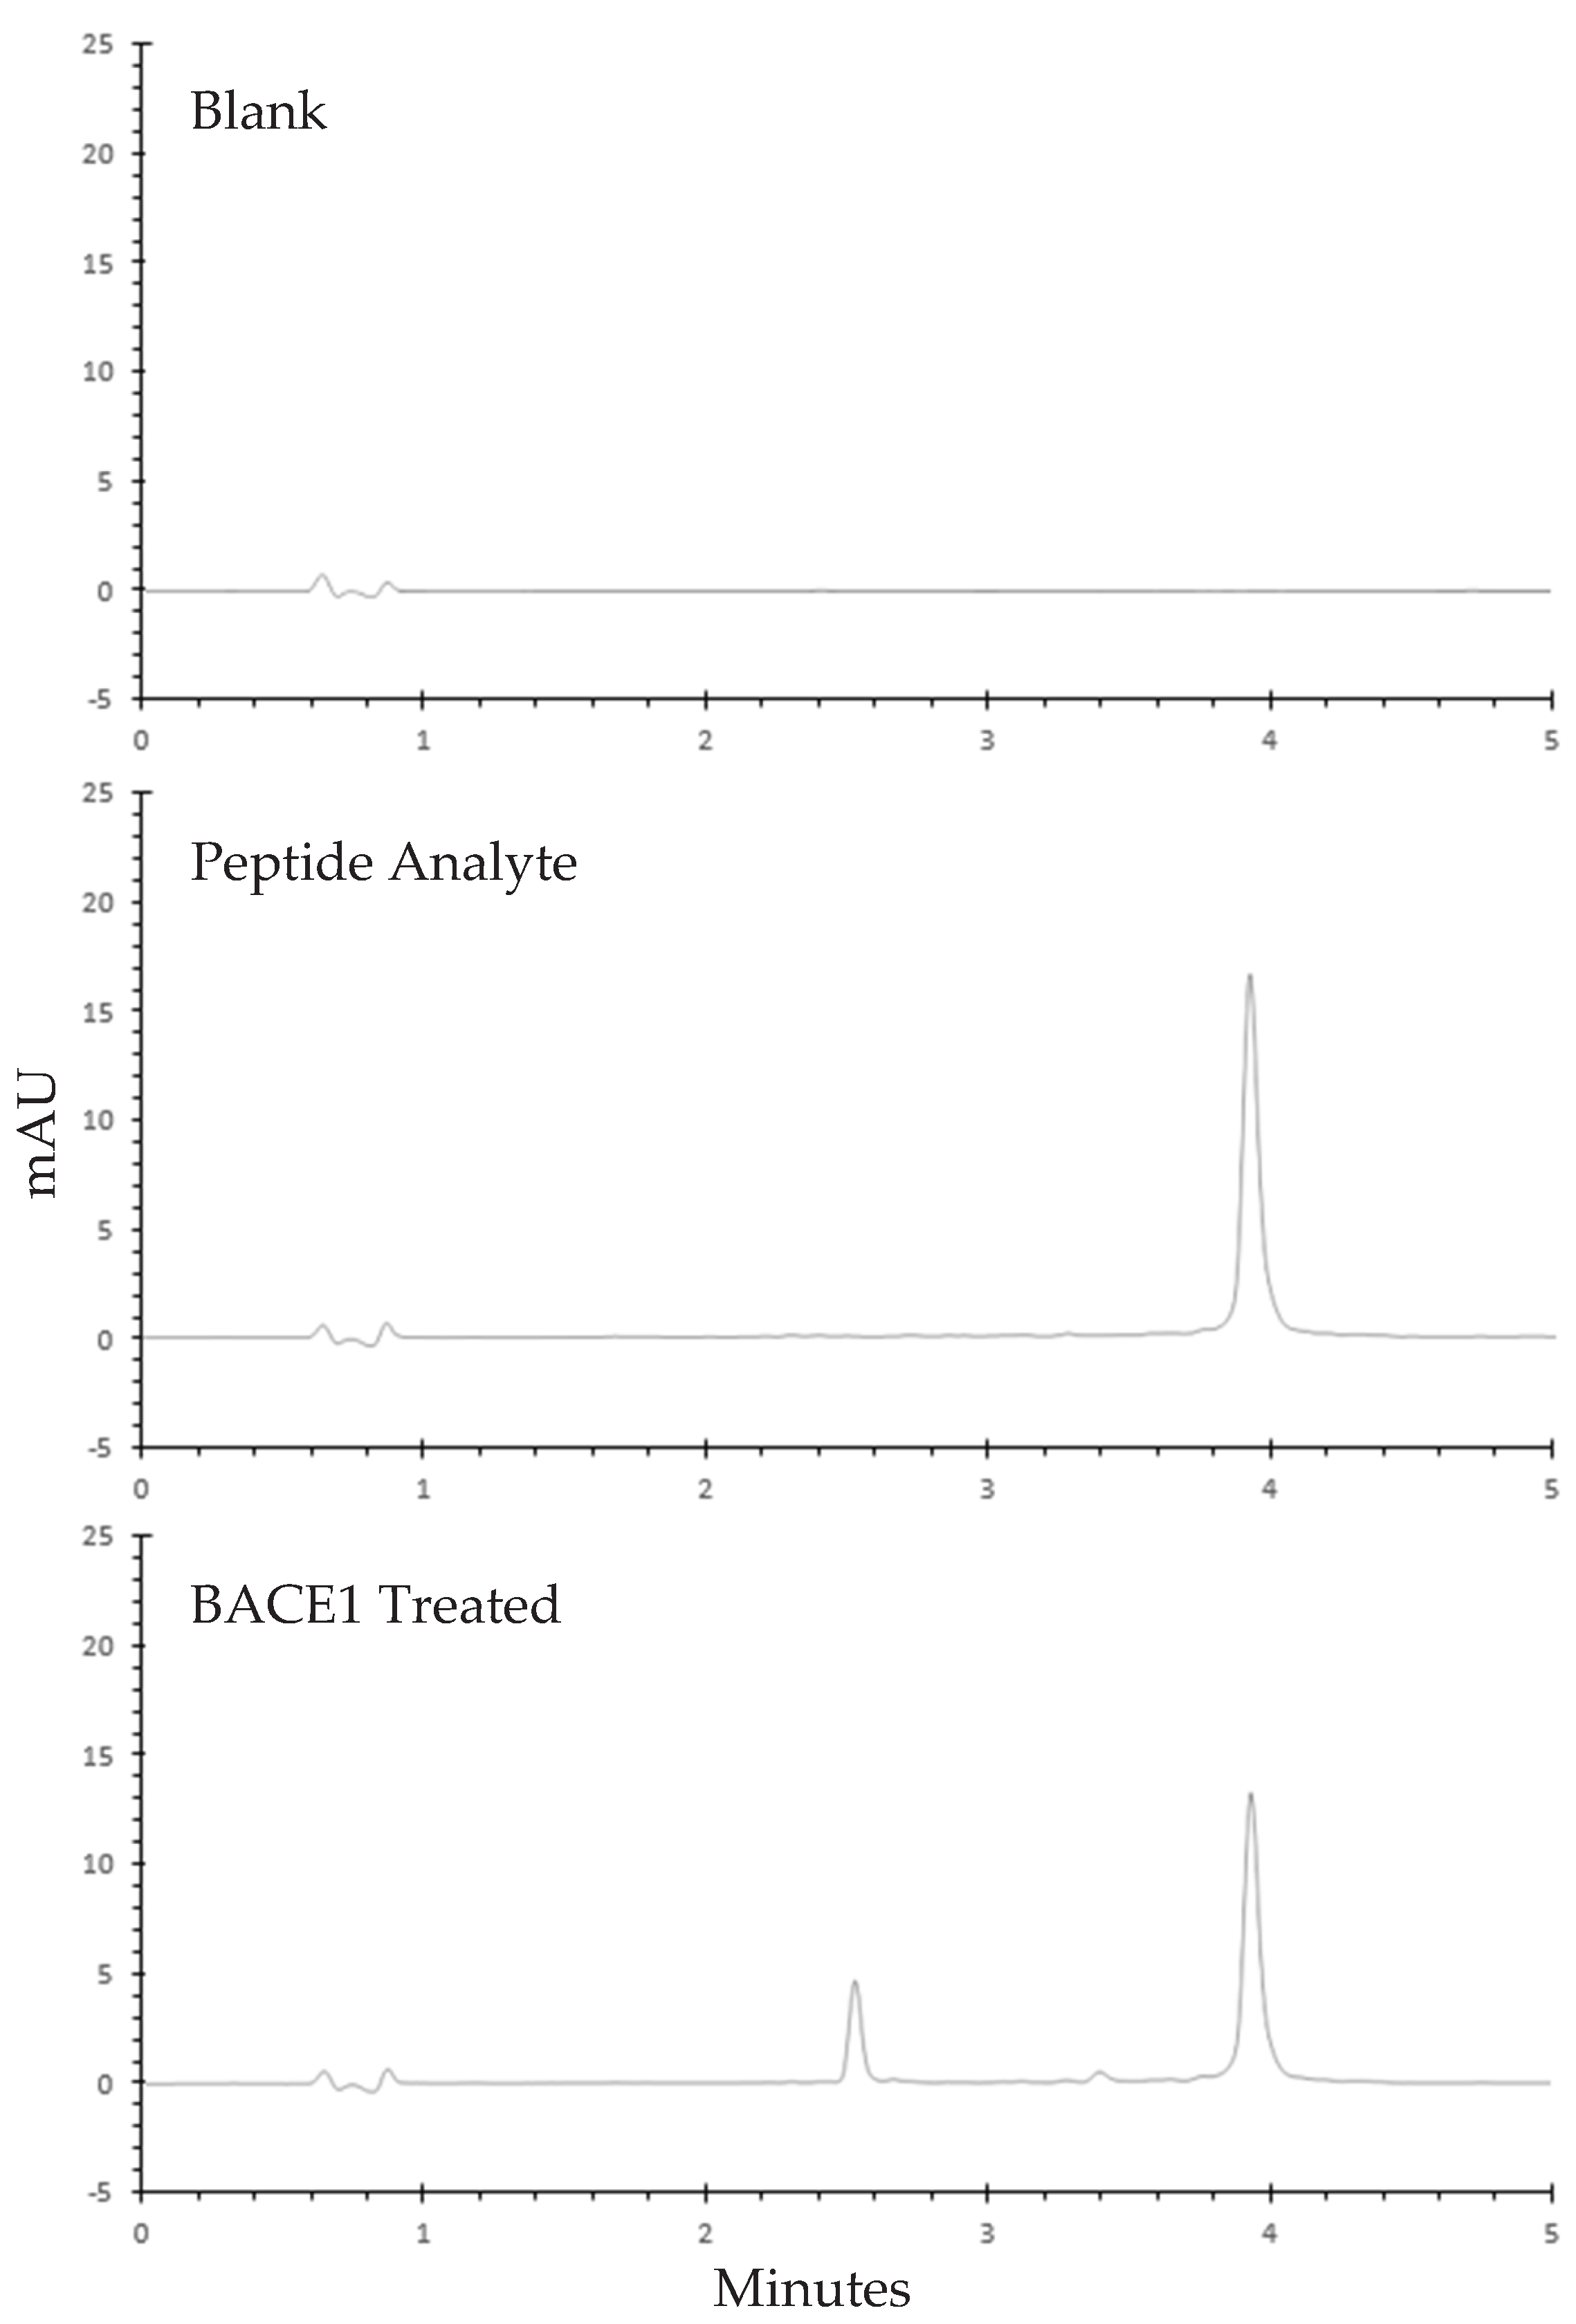

Table 1.
Linear regression data.
| Parameter | Value |
|---|---|
| Slope | 1.5265 |
| Intercept | -5.213 |
| Coefficient of determination (r2) | 0.9997 |
| Coefficient of correlation (r) | 0.9998 |
| Linear range (µM) | 14.92 – 72 |
| Limit of detection (µM) | 2.40 |
| Limit of quantification (µM) | 7.26 |
Table 2.
Calibration curve parameters and statistics.
| Curve no. or parameter | Slope | Intercept | Correlation Coefficient |
|---|---|---|---|
| 1 | 1.5512 | -4.9216 | 0.9998 |
| 2 | 1.4860 | -5.2224 | 0.9956 |
| 3 | 1.5446 | -6.2621 | 0.9998 |
| 4 | 1.5330 | -5.2946 | 0.9997 |
| 5 | 1.4711 | -3.2737 | 0.9997 |
| 6 | 1.5732 | -6.3036 | 0.9991 |
| Mean (n = 6) | 1.5265 | -5.2130 | 0.9990 |
| SD | 0.0397 | 0.0016 | |
| RSD (%) | 2.5979 | 0.1644 |
Table 3.
Recovery Data of the Proposed HPLC Method.
| QC Level (µM) | Recovery (%) | Mean Recovery (%) | RSD (%) |
|---|---|---|---|
| Low QC (25.21 µM) | 97.74 | 96.62 | 2.86 |
| 97.22 | |||
| 94.62 | |||
| 100.60 | |||
| 96.96 | |||
| 92.54 | |||
| Medium QC (42.60 µM) | 99.36 | 98.38 | 1.37 |
| 98.44 | |||
| 96.90 | |||
| 99.20 | |||
| 99.81 | |||
| 96.58 | |||
| High QC (72 µM) | 103.28 | 96.97 | 3.99 |
| 99.27 | |||
| 97.27 | |||
| 95.00 | |||
| 94.45 | |||
| 92.54 |
Table 4.
Precision Data of the Proposed HPLC Method.
| Sample | Day 1 Recovery (µM)* | Day 2 Recovery (µM)** |
|---|---|---|
| 1 | 63.88 | 60.21 |
| 2 | 61.06 | 59.03 |
| 3 | 61.19 | 61.06 |
| 4 | 61.78 | 59.62 |
| 5 | 61.78 | 61.32 |
| 6 | 62.24 | 60.80 |
| Repeatability | ||
| Mean Recovery | 61.99 | 60.34 |
| SD | 1.02 | 0.89 |
| RSD (%) | 1.65 | 1.47 |
| Intermediate Precision | ||
| Mean Recovery | 61.17 | |
| SD | 1.25 | |
| RSD (%) | 2.05 |
*Analyst 1. **Analyst 2.
Table 5.
Robustness of the Proposed HPLC Method.
| Parameter | Mean Recovery (µM) | % Change in Recovery | Mean Retention Time (min) | % Change in Retention Time |
|---|---|---|---|---|
| Temperature (30 °C) | ||||
| -10% | 59.93 | -0.12 | 3.97 | 1.60 |
| +10% | 59.84 | -0.27 | 3.90 | -0.15 |
| Flow Rate (0.6 mL/min) |
||||
| -10% | 67.77 | 12.95 | 4.07 | 4.25 |
| +10% | 54.62 | -8.96 | 3.73 | -4.48 |
Table 6.
Commercial Inhibitor Assay.
| Sample | Analyte Remaining (µM) | Change in Activity (%) | t-Test (BACE1) |
|---|---|---|---|
| OM99-2 | 39.77 | -50.74 | 5.24E-07 |
| AZD3839 | 40.86 | -53.36 | 2.89E-06 |
| BACE1 | 22.40 | ||
| APP | 58.83 |
Disclaimer/Publisher’s Note: The statements, opinions and data contained in all publications are solely those of the individual author(s) and contributor(s) and not of MDPI and/or the editor(s). MDPI and/or the editor(s) disclaim responsibility for any injury to people or property resulting from any ideas, methods, instructions or products referred to in the content. |
© 2026 by the authors. Licensee MDPI, Basel, Switzerland. This article is an open access article distributed under the terms and conditions of the Creative Commons Attribution (CC BY) license (http://creativecommons.org/licenses/by/4.0/).
Copyright: This open access article is published under a Creative Commons CC BY 4.0 license, which permit the free download, distribution, and reuse, provided that the author and preprint are cited in any reuse.


