Submitted:
12 February 2026
Posted:
14 February 2026
You are already at the latest version
Abstract
Mixograph properties represent important quantitative traits that are controlled by multiple genes and influenced by environmental factors. In this study, we conducted quantitative trait locuns (QTL) mapping for key Mixograph paraments using a recombinant inbred line (RIL) population derived from a cross between Yangxiaomai and Zhongyou 9507. Based on a high-density 55K genetic map, six stable QTLs were identified on chromosomes 1A, 1B, and 1D across four environments, with individual phenotypic variation explainined ranging from 2.26%-28.70%. . Among these, QTh.ahau-1A, QMt/QPa.ahau-1B, and QTw.ahau-1D.1 are potentially novel loci. Furthermore, four functional Kompetitive Allele-Specific PCR (KASP) markers were developed based on tightly linked SNPs and validated in 110 advanced breeding lines, confirming their significant association with the target traits and utility for marker-assisted selection (MAS) . Additionally, six candidate genes were predicted, which encoded proteins such as a hydroxyproline-rich glycoprotein, a CCCH-type zinc finger protein, protease,kinase, and a phosphoglucan water dikinase. Collectively, these findings provide valuable genetic loci, functional molecular markers, and candidate gene resources for improving wheat processing quality through MAS-based breeding.
Keywords:
wheat
; mixograph properties
; QTL mapping
; KASP marker
; marker-assisted selection
1. Introduction
Dough rheological properties are key indices for evaluating wheat flour quality, as they comprehensively reflect the mixing tolerance and viscoelasticity of dough, thereby directly influencing the quality of end-use wheat products [1,2].Internationally established instruments for measuring these properties include the Farinograph, Extensograph, Alveograph, and Mixograph. Among them, the Farinograph, Extensograph, and Alveograph typically require 300–350 g of flour per test and involve prolonged assay times, which limits their applicability for high-throughput screening and early-generation selection in breeding programs. In contrast, the Mixograph, developed in the 1930s, provides notable advantages including low sample consumption and rapid testing [3]. Parameters derived from Mixograph curves, such as mixing time, peak height, peak width, peak area, 8-min tail height, and 8-min tail width, provide key rheological indicators. Collectively,they offer a comprehensive profile of dough properties. Studies have demonstrated strong correlations between Mixograph parameters and those obtained from the Farinograph, Extensograph, and actual baking performance [4,5]. Consequently, the Mixograph has been extensively adopted in wheat breeding programs and quality assessment worldwide.
Mixograph properties are typical quantitative traits controlled by multiple genes and influenced by environmental factors. Their genetic dissection mainly relies on quantitative trait locus (QTL) mapping and genome-wide association studies (GWAS). Early QTL mapping efforts, primarily utlizing genetic populations such as recombinant inbred lines (RILs) or doubled haploids (DHs), led to the identification of multiple major loci parameters like controlling peak height and width on chromosomes 1A, 1B, 3A, and 4D [6,7]. ;Subsequent studies confirmed important loci on chromosomes 1B and 1D [8,9], while further work reported over a hundred loci associated with Farinograph and Mixograph parameters in DH populations [10]. With the application of high-density genetic maps, the precision of QTL mapping has been significantly improved. For instance, stable QTLs have been identified across environments, with the Glu-D1 locus explaining 27.1%-36.7% of the phenotypic variation for midline peak height, representing a core major locus [11]. The importance of other chromosomal regions such as Glu-A1, Glu-D1, 3B, and 6A has also been established [12,13].In recent years, the application of GWAS technology has greatly expanded the scope of identifying loci associated with Mixograph parameters. Although high-throughput SNP studies have revealed the widespread distribution and pleiotropy of loci controlling dough rheology, along with numerous population-specific markers and QTLs, key limitations persist. These include insufficient marker density, unstable QTL effects across environments, excessively large confidence intervals, and a lack of identified causal genes. Thus, the genetic architecture underlying Mixograph parameters requires further investigation.
In this study, an RIL population derived from a cross between Yangxiaomai and Zhongyou9507 was used. The wheat variety Zhongyou9507 demonstrated superior dough rheological properties and excellent processing quality. The landrace variety Yangxiaomai typically exhibits moderate end-use quality.The genetic basis of Mixograph parameters was dissected using a high-density 55K genetic map, related QTLs were identified, and corresponding high-throughput KASP markers, with the aim of providing practical molecular tools for marker-assisted selection (MAS) in wheat breeding.
2. Results
2.1. Phenotypic Variation of Mixograph Parameters
Phenotypic data of Mixograph parameters for parents and RIL lines planted during 2020-2022 were statistically analyzed. As shown in Table 1, Zhongyou 9507 exhibited higher values than Yangxiaomai in mixing time (MT), peak area (PA), 8-min tail height (TH), and 8-min tail width (TW) in E1,E2,E3,and E4(BLUP). In all environments, the above parameters of the RIL population showed a roughly normal distribution (Figure 1A–D), some lines showed over-parent genetics.The coefficient of variation (CV) for each trait across environments ranged from 0.04 to 0.39.Correlation analysis revealed extremely significant positive correlations among all traits across different environments (Figure 1E). The correlation coefficient between MT and PA was the highest (0.95-0.98) .
ANOVA results showed extremely significant differences (P < 0.01) in MT, PA, TH, and TW among genotypes, environments, and genotype-environment interactions (Table 2). The H2 of mixing time, peak area, 8-min tail height, and 8-min tail width were 0.90, 0.87, 0.77, and 0.74, respectively, indicating that these traits are mainly influenced by genetic factors (Table 2).
2.2. QTL Mapping Results
Six stable major QTLs associated with Mixograph properties were identified in the RIL population across four environments (E1-E4), distributed on chromosomes 1A, 1B, and 1D (Table 3). Individual QTLs explained 2.26%-28.70% of the phenotypic variation, with an average of 10.15%(Table S1).
Two major QTLs were detected on chromosome 1A. QMt.ahau-1A, associated with mixing time, was located between SNP markers AX-110911310 and AX-108914408, with a confidence interval of 109.5-110.5 cM, corresponding to a physical position of 513.62-514.56 Mb on the Chinese Spring reference genome (IWGSC v1.0). It was detected in both E2 and E3 environments, explaining 13.31%-17.36% of the phenotypic variation with additive effects of 0.22-0.24, and its favorable allele was derived from Zhongyou 9507. QTh.ahau-1A, associated with 8-min tail height, was located between SNP markers AX-109055961 and AX-111496677, corresponding to a physical position of 504.82-508.05 Mb. It was detected in both E2 and E4 environments, explaining 16.63%-21.13% of the phenotypic variation with additive effects of -1.15 to -1.06, and its favorable allele was derived from Yangxiaomai.
A major pleiotropic QTL controlling both MT and PA was detected on chromosome 1B. QMt.ahau-1B, associated with mixing time, was located between SNP markers AX-111503025 and AX-110519906, (168.5-172.0cM; physical position 551.72-552.48 Mb). It was detected in E1, E2, and E4, explaining 19.49%-28.70% phenotypic variation with additive effects of 0.30-0.45, and its favorable allele was derived from Zhongyou9507. QPa.ahau-1B, at the same position, explained 19.52%-23.92% of the phenotypic variation with additive effects of 11.52-16.85,with the favorable allele was also derived from Zhongyou 9507.
Two major QTLs for TW were detected on chromosome 1D. QTw.ahau-1D.1 was located between SNP markers AX-109827648 and AX-110069135 (166.5-167.5cM; physical position 374.05-375.94 Mb). It was detected in E1 and E2, explaining 7.73%-12.04% of the phenotypic variation with additive effects of -0.78 to -0.35, and its favorable allele was derived from Yangxiaomai. QTw.ahau-1D.2 was located between SNP markers AX-109079356 and AX-111804778(198.5-199.5cM; physical position 410.07-413.66 Mb). It was detected in E1, E3, and E4, explaining 4.09%-17.21% of the phenotypic variation with additive effects of 0.83-0.85, and its favorable allele was derived from Zhongyou 9507.
2.3. Effect Analysis of Stable Loci
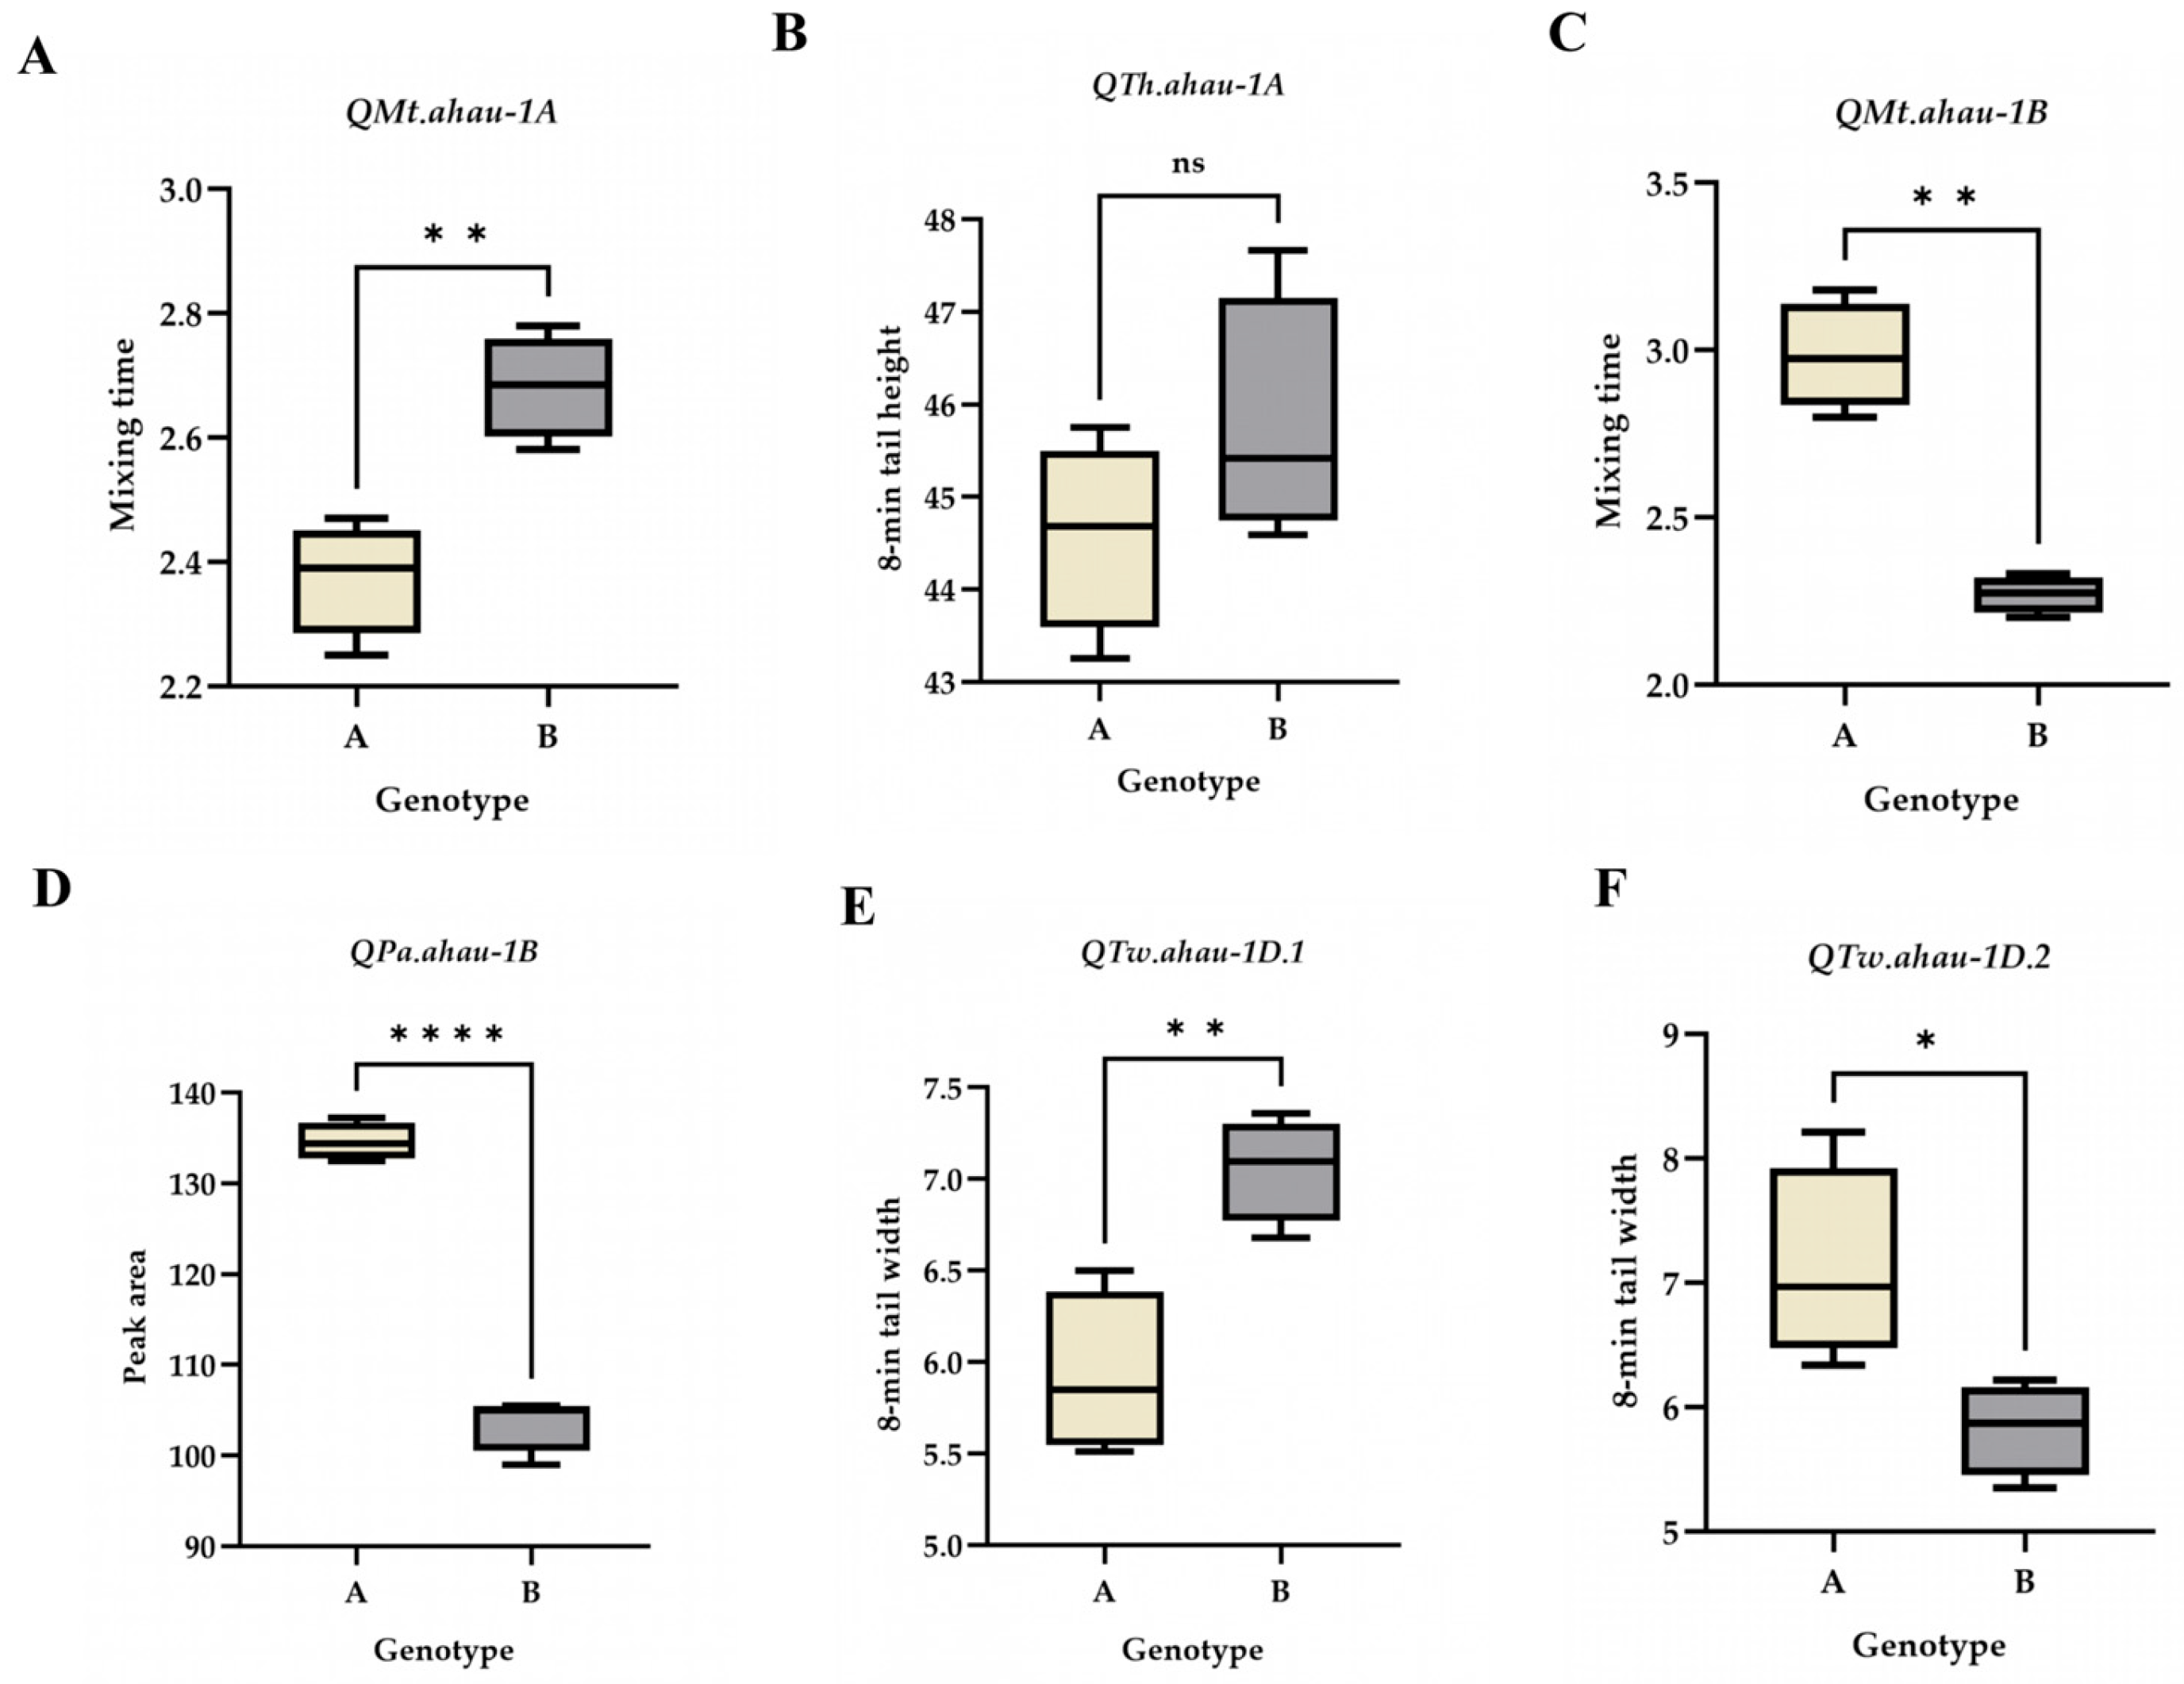
The favorable alleles of the identified QTLs significantly increased the values of their corresponding Mixograph traits. Specifically, lines carrying the favorable allele of QMt.ahau-1A showed a 8.50%-14.03% increase in MT (P<0.01); those carrying the favorable allele of QMt.ahau-1B exhibited a greater increased of 27.27%-40.71% (P<0.01).For TW, the favorable alleles of QTw.ahau-1D.1 and QTw.ahau-1D.2 increased the trait by 9.44%-24.73% (P<0.05) and 15.24%-31.99% (P<0.05), respectively. The favorable allele of QPa.ahau-1B led to a increase 26.20%-38.51% in PA (P<0.001); In contrast, the favorable allele of QTh.ahau-1A only increased TH by 1.30%–3.17%, which was not statistically significant.
Figure 2.
Effect Analysis of stable locis on Mixograph parameters of RIL population. *P<0.05,** P <0.01.
Figure 2.
Effect Analysis of stable locis on Mixograph parameters of RIL population. *P<0.05,** P <0.01.
2.4. Development and Validation of KASP Markers
To facilitate the marker-assisted selection of the identified QTLs, SNP markers tightly linked to QMt.ahau-1A, QMt.ahau-1B, and QTw.ahau-1D.1 were converted into KASP markers. Four KASP markers (QMt-1A-KASP, QMt-1B-KASP, QTw-1D.1-KASP-1, and QTw-1D. 1-KASP-2) were successfully developed (Table 4). The primes were designed using the onlie tool Polymarker, with allele-specific forward primers labeled with FAM or HEX fluorescent adapters.The phenotypic of different alleles were assessed using T-test and validated in a panel of 110 advanced breeding lines.
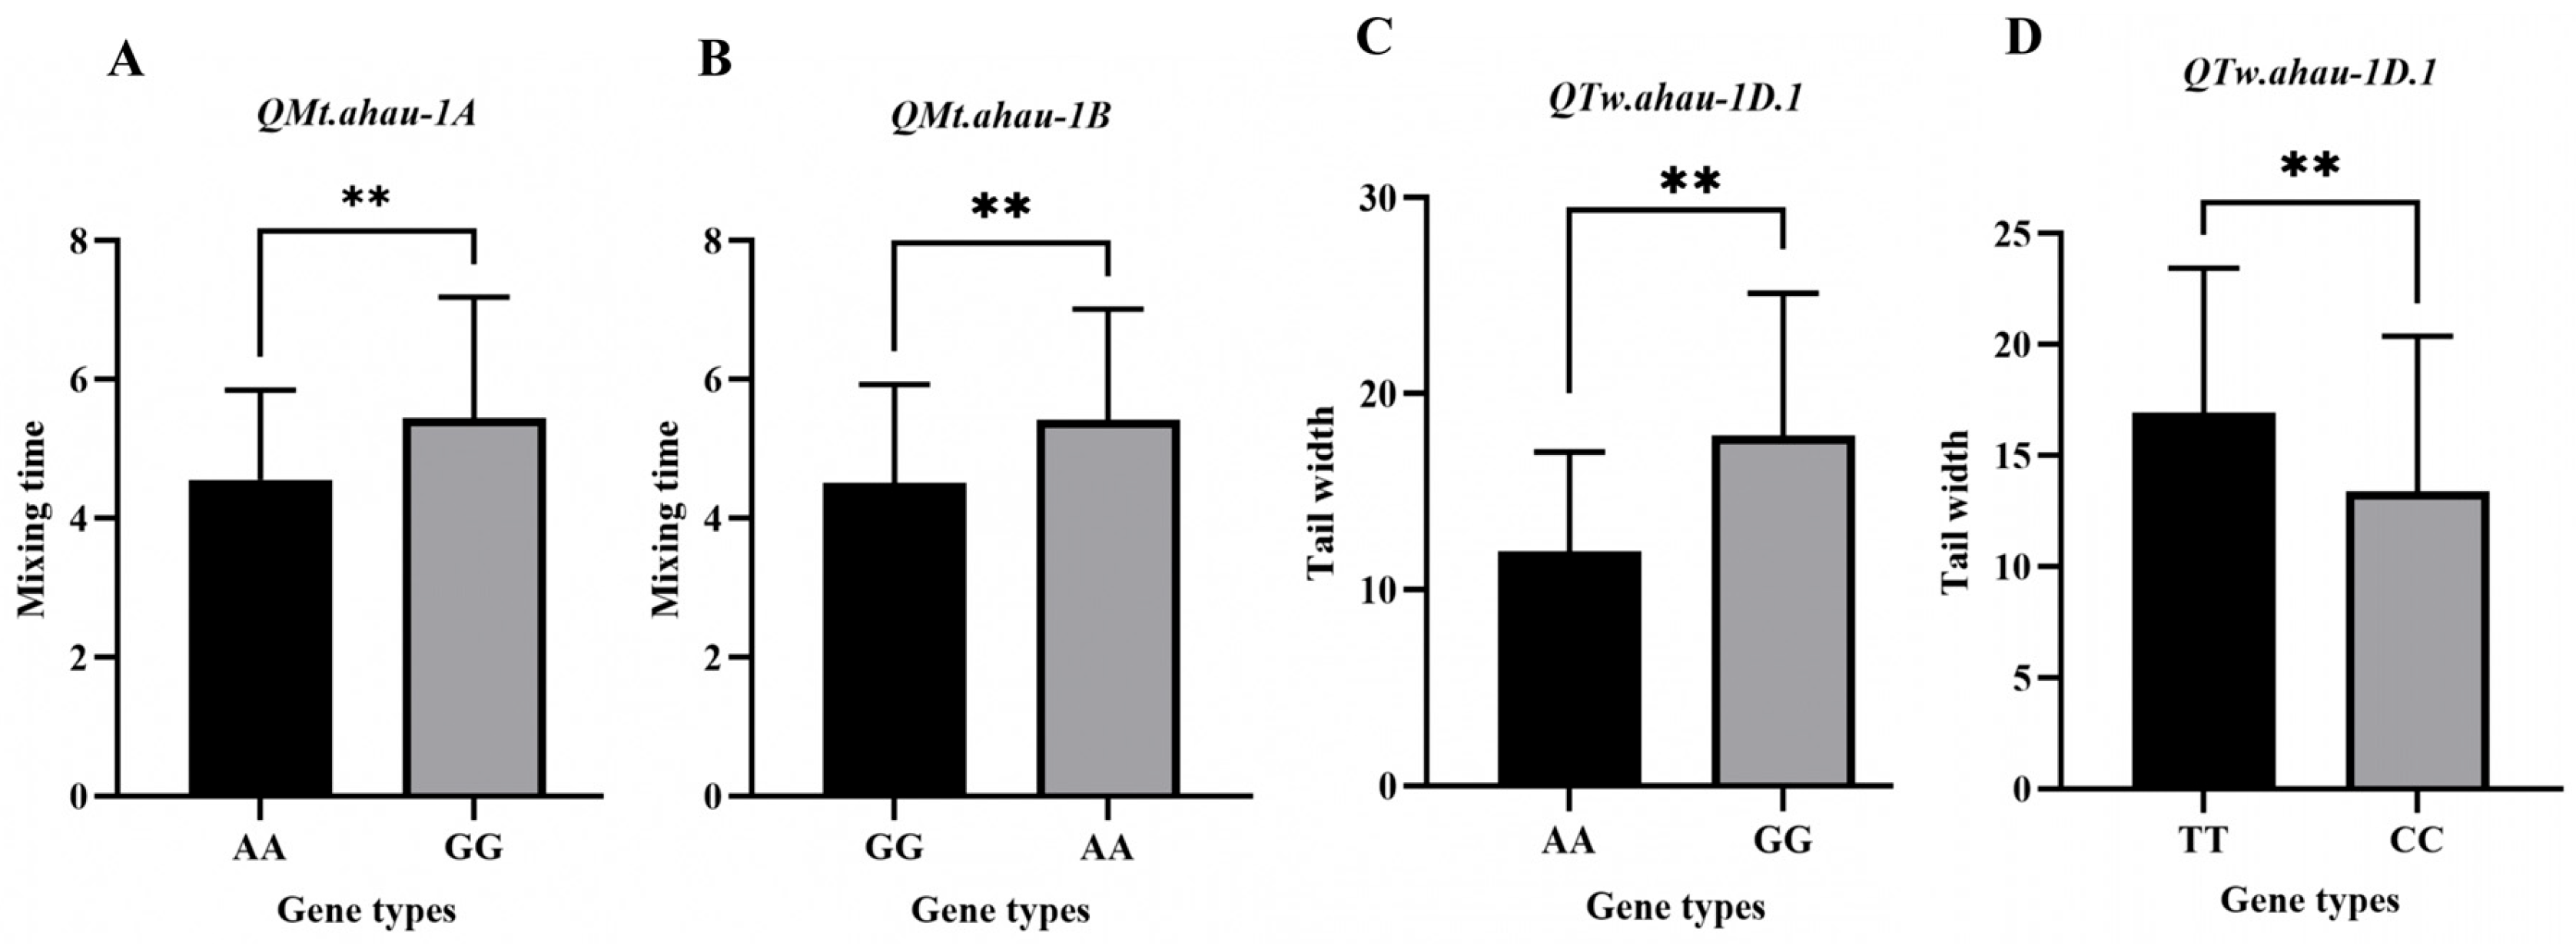
These markers were successfully deployed for genotyping in both the original RIL population and the panel of advanced breeding lines. They exhibited clear polymorphism, effectively distinguishing the two genotypes and the results were fully consistent with the original 55K SNP array data. Validation in the advanced lines confirmed the phenotypic effects of the favorable alleles (Table S2). Specifically, lines carrying the favorable allele of QMt-1A-KASP (n = 42) or QMt-1B-KASP (n = 55) showed a significantly higher average MT of approximately 5.4 min, which was 0.8 min greater than that of lines without the favarable allele. For TW, lines with the favarable allele of QTw-1D.1-KASP-1 (n = 54) and QTw-1D.1-KASP-2 (n = 50) had average values of 1 7.89 and 16.94, representing increases of 5.92 and 3.56, respectively, over lines carrying the alternative allele. These results robustly validate the utility of the developed KASP markers for distinguishing phenotypes relevant to wheat quality breeding.
Figure 3.
Effect analysis of alleles in high-generation inbred lines with KASP markers.
2.5. Prediction of Candidate Genes
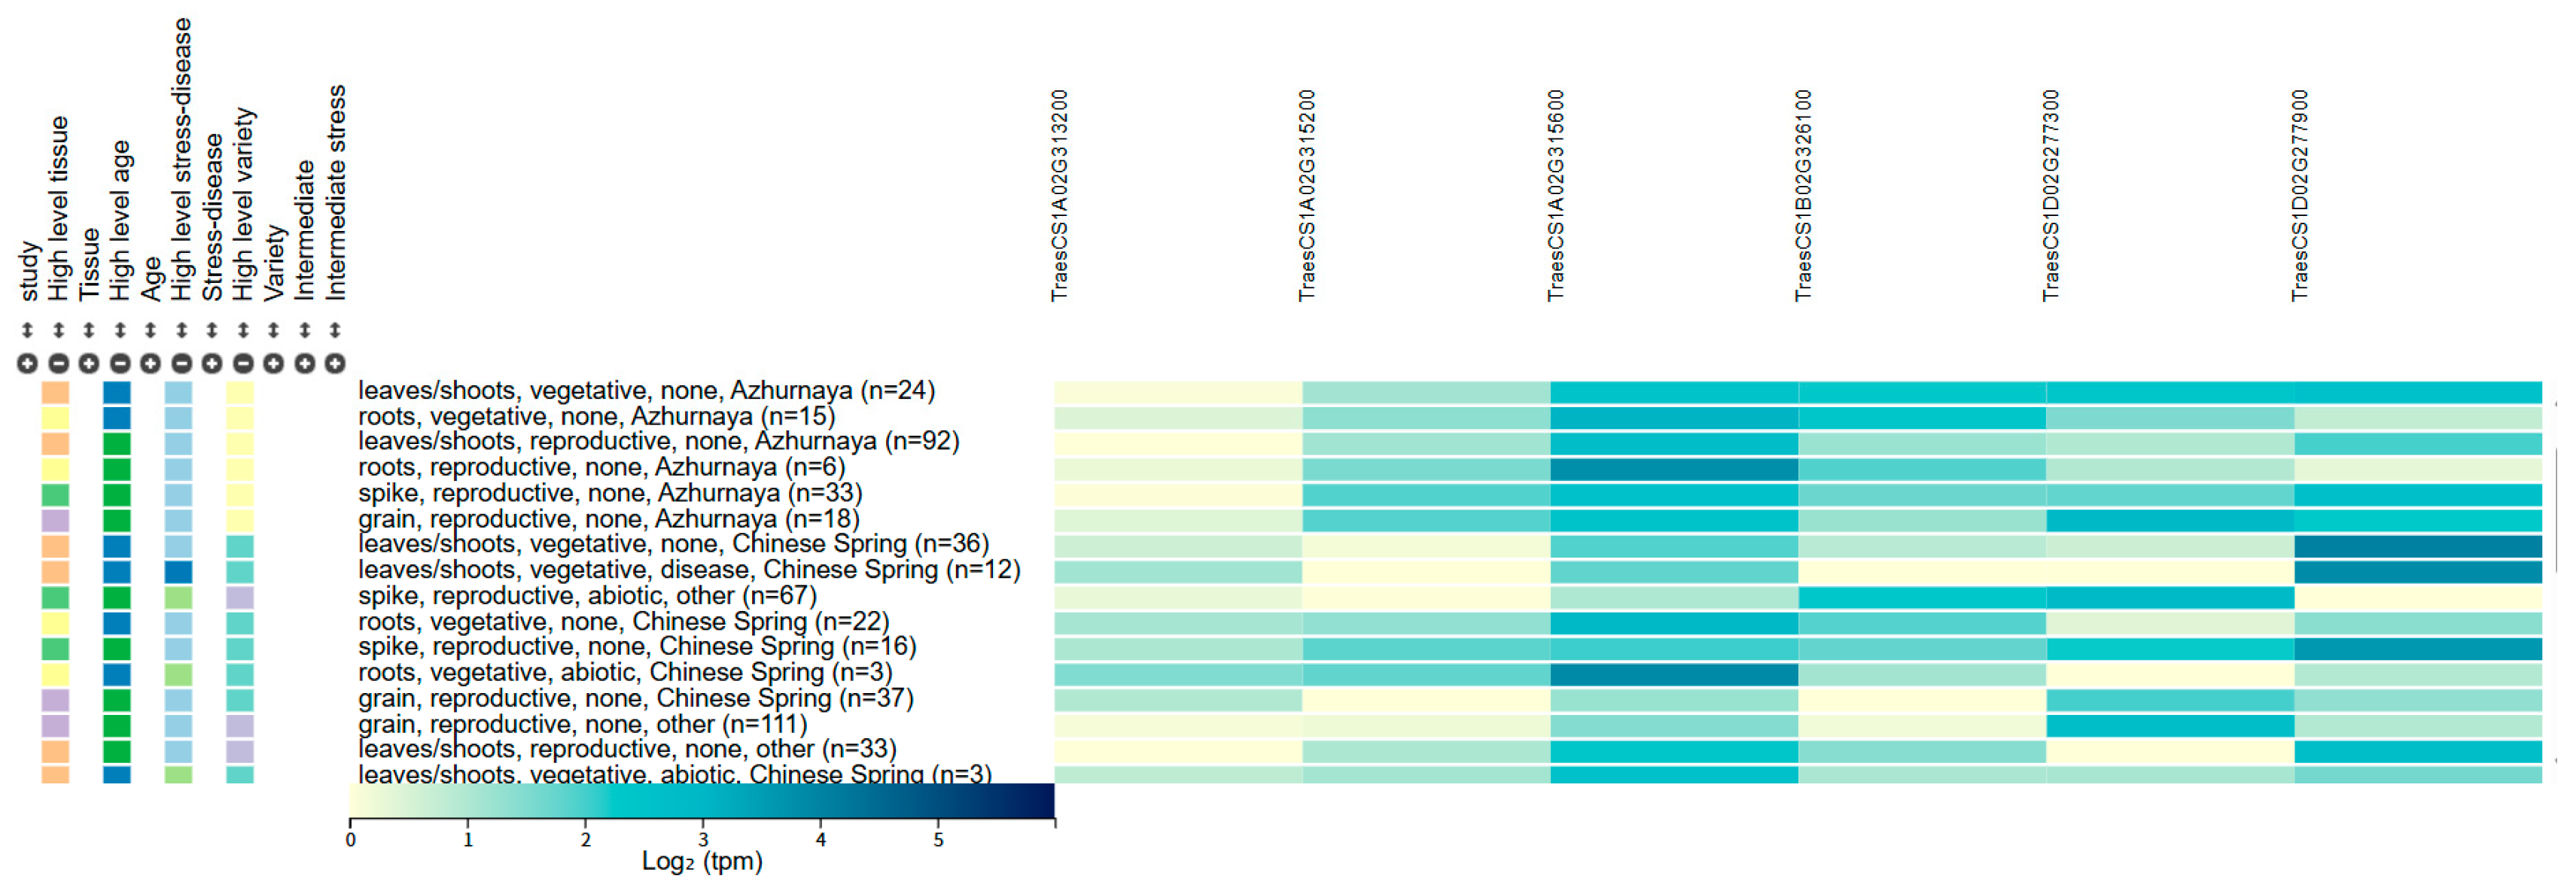
Within the physical intervals of the major QTLs QMt.ahau-1A, QMt/Pa.ahau-1B, QTw.ahau-1D.1, and QTw.ahau-1D.2, a total of 116 high-confidence genes were identified from the Chinese Spring reference genome. Based on their functional annotins and high expression levels in developing grains (as queried from public databases), six genes were prioritized as strong candidates. These encode proteins with diverse functions, including cell wall modification, transcription regulation, proteolysis, signal transduction, and starch metabolism. Among them, three candidate genes were located on chromosome 1A: TraesCS1A02G313200 (505.27 Mb) encoding a hydroxyproline-rich glycoprotein family protein, TraesCS1A02G315200 (506.55 Mb) encoding a CCCH domain zinc finger protein, and TraesCS1A02G315600 (507.08 Mb) encoding a protease-related family protein. TraesCS1B02G326100 (551.72 Mb) on chromosome 1B encodes a kinase family protein. Two candidate genes on chromosome 1D, TraesCS1D02G277300 (374.40 Mb) and TraesCS1D02G277900 (375.20 Mb), encode phosphoglucan water dikinase and TPR family protein, respectively(Table 5).
Figure 4.
Expression patern of the candidate genes from public database (http://wheat-expression.com/).
Figure 4.
Expression patern of the candidate genes from public database (http://wheat-expression.com/).
3. Discussion
The dough mixing property is a crucial indicator of the rheological changes during dough mixing and is primarily measured using Mixograph. Compared with the Farinograph and Extensograph, the Mixograph offers distinct advantages, including smaller sample requirements and faster testing speed. By recording the resistance during dough mixing, the Mixograph generates a mixing curve, from which key parameters such as mixing time, peak height, peak width, peak area, 8-min tail height, and 8-min tail width, can be derived. These parameters comprehensively reflect the dough’s plasticity, elasticity, viscosity, and mixing tolerance [2]. Mixograph parameters show highly significant correlations with core parameters measured by the Farinograph and Extensograph, making them valuable alternative indicators for wheat quality evaluation. In terms of processing quality, parameters like peak area and peak height exhibit high repeatability and are closely related to loaf volume, effectively predicting gluten strength and baking performance [4,5]. Combinations of different mixing parameters can also reflect the suitability of wheat for products such as noodles and steamed bread. As typical quantitative traits controlled by multiple genes, Mixograph parameters are influenced by both genotype and environment. Their QTL mapping is therefore essential for elucidating the genetic mechanisms underlying wheat quality traits.
3.1. Comparison with Known QTL Loci
The QTh.ahau-1A, associated with 8-min tail height, was stably detected across two environments. It is located at 504.82-508.05 Mb on chromosome 1A and explains an average of 20.38% of the phenotypic variation. This genomic interval is close to the positions of Glu-1Ax (TraesCS1A02G317311, Refv1.0 chr1A: 508.723-508.726 Mb) and Glu-1Ay (TraesCS1A02G466500LC, Refv1.0 chr1A: 508.924-508.925 Mb), which encode high-molecular-weight glutenin subunits (HMW-GS). The importance of this chromosomal region for mixograph traits is corroborated by prior studies. For instance, Jin et al. [15] conducted association analysis in 165 cultivars from the Huanghuai wheat region and identified a significant SNP locus for mixing time and 8-min tail width at 506.9 Mb on chromosome 1A, which falls within our mapped interval. Similarly, Kong et al. [16] perfom a GWAS on 768 wheat varieties and reported a locus (501.03-511.01 Mb) associated with gluten index and peak height, which partially overlaps with QTh.ahau-1A..
QMt.ahau-1A was stably detected in two environments, located at 513.62-514.56 Mb on chromosome 1A, with an average phenotypic variation explantion of 15.34% for mixing time. While multiple major QTLs associated with mixograph properties have been reported on chromosome 1A, such as those for peak height and peak width by James et al [17] and an SNP marker associated with mixing time and 8-min tail height reported by Guo et al. [18], the physical position of QMt.ahau-1A is distinct from these previously mapped regions.Therefore, QMt.ahau-1A is likely represents a novel locus.
QMt.ahau-1B and QPa.ahau-1B were identified as pleiotropic QTLs at 551.72-552.48 Mb on chromosome 1B, , explaining an average of 23.62% and 21.72% of the variation for mixing time and peak area, respectively.This region is located approximately 3-4 Mb away from the Glu-1Bx and Glu-1By genes encoding HMW-GS. Although a nearby SNP locus affecting mixing time and 8-min tail width were reported at 553.6 Mb [15], the interval identified here does not overlap with it, nor with other previously reported QTLs for similar traits on chromosome 1B, such as QMPT.sdau-1B (180.31 Mb) and QMPT1B.1-3(152.07Mb)[18].Therefore, QMt/QPa.ahau-1B is proposed to be a novel genetic locus.
The QTw.ahau-1D.2 locus for 8-min tail width was mapped to 410.07-413.06 Mb on chromosome 1D, a region that overlaps with the well-characterized Glu-D1 locus encoding high-molecular-weight glutenin subunits (HMW-GS). Previous studies have consistently reported significant effects of the Glu-D1 region on mixing time and peak-related traits [13,19]. Furthermore, a genome-wide association analysis identified an SNP locus for mixing time and tail width at 407.9–416.5 Mb on chromosome 1D, a region that encompasses Glu-D1x and Glu-D1y [15]. In contrast, QTw.ahau-1D.1 (374.05-375.94 Mb) resides in a distinct genomic interval and explains an average of 9.89% of the variation for 8-min tail width. To our knowledge, this region has not been previously linked to Mixograph properties, suggesting that QTw.ahau-1D.1 may represent a novel QTL.
All stable QTLs identified in this study are located on chromosomes 1A, 1B, and 1D. These chromosomes have been widely recognized as core genomic regions harboring major loci controlling Mixograph properties [7,9]. On chromosome 1A, the Glu-A1 locus has been repeatedly associated with parameters such as peak time and 8-min band height [16]. For chromosome 1B, multiple functional loci, including those within or adjacent to the Glu-B1 region, have been reported to influence mixing time, peak area, and other traits [16,18,19]. Notably, some of these loci exhibit pleiotropic effects and may form gene clusters gene clusters [19]. Chromosome 1D, particlarly theGlu-D1 locus, is a major focus of research due to its substantial and pleiotropic effects on numerous dough quality traits, including Mixograph parameters and Farinograph stability time [11,16,20]. The superior effect of the Glu-D1 5+10 subunit over the 2+12 subunit is well-established [18]. Furthermore, large-scale QTL and GWAS studies have consistently identified numerous significant lcoi on these chromosomes, undercoring their central role in determining dough mixing behavior [7,15,20]. The co-localization of the QTLs mapped in this study with these known critical regions reinforces the importance of group 1 chromosomes in the genetic control of wheat Mixograph properties.
3.2. Development of Molecular Markers for Major Loci QMt.ahau-1A, QMt.ahau-1B, and QTw.ahau-1D.1
Conventional breeding methods face limitations in selection efficiency for quality traits, primarily due to the technical difficulty, lengthy cycle, and cumbersome nature of field-based phenotyping [21]. The emergence of KASP technology provides a promising platform for MAS, owing to its economy, flexibility, and accuracy. In this study, four functional KASP markers (QMt-1A-KASP, QMt-1B-KASP, QTw-1D.1-KASP-1, QTw-1D.1-KASP-2) were successfully developed based on tightly linked SNP loci for the target loci. Validated in 110 advanced breeding lines confirmed that these markers can efficiently and accurately identify alleles associated with mixograph properties.This study successfully translates molecular markers into practical breeding tools, thus enhancing selection efficiency and predictability. However, the general applicability, stability, and predictive accuracy of these markers across genetically diverse wheat materials require further systematic validation. Therefore, multi-population and multi-environment trials are essential to fully evaluate their practical utility in marker-assisted selection (MAS).
3.3. Candidate Genes
Based on the Chinese Spring wheat genome, six candidate genes were identified within the target loci. Their functional annotations suggest direct or indirect roles in determining Mixograph traits. On chromosome 1A, three genes were prioritized. TraesCS1A02G313200 encodes a hydroxyproline-rich glycoprotein (HRGP), a structural cell-wall protein implicated in tissue stability and stress response, potentially influencing endosperm cell-wall properties and processing quality [22,23]. TraesCS1A02G315200 encodes a CCCH-type zinc finger transcription factor involved in growth and stress adaptation, which may regulate storage protein expression to balance dough strength and extensibility [24,25,26].TraesCS1A02G315600 encodes a protease-related family protein; such proteins, fundamental to protein turnover, could alter dough rheology by modulating gluten hydrolysis [27].On chromosome 1B, TraesCS1B02G326100 encodes a protein kinase. While crucial for signaling, few wheat kinases are functionally characterized [28]; it is hypothesized to influence grain development or storage protein synthesis. On chromosome 1D, analysis focused on the QTw.ahau-1D.1 locus, given the well-established role of HMW-GS genes nearby. TraesCS1D02G277300 encodes phosphoglucan water dikinase (PWD), a key starch metabolic enzyme. Its downregulation reduces starch phosphate, increases grain size and α-amylase activity [29], suggesting PWD coordinates starch synthesis and degradation to affect mixing behavior. TraesCS1D02G277900 encodes a TPR superfamily protein that mediates protein-protein interactions [30]; it may link gluten synthesis with starch metabolism to regulate mixograph properties.
4. Materials and Methods
4.1. Plant Materials and Field Experimental Design
The experimental material consisted of an F₆ RIL population derived from a cross between Yangxiaomai and Zhongyou 9507, which included 227 lines. Additionally, 110 advanced breeding lines were used as the validation materials for KASP markers. All materials were provided by Professor Xianchun Xia from Chinese Academy of Agricultural Sciences.
The RIL population was evaluated in multiple enviroments: Suixi, Anhui (E1) during the 2020-2021 growing season, and in Hefei, Anhui (E2) as well as Suixi, Anhui (E3) during the 2021-2022 growing season. Each line was sown in 2 rows of 2 meter (m) rows with a row spacing of 25 cm, using 30 seeds per row, and arranged in three replications. The 110 advanced breeding lines were planted in Xinxiang, Henan across the 2020-2021 and 2021-2022 growing seasons,following a completely randomized block design with three replications. Each plot consisted of six rows, each 4.5 m in length with a row spacing 0.2 m. All Field management practices were carried out in accordance with local standard protocols.
4.2. Phenotypic Measurement
After harvesting, wheat grains were air-dried and milled into flour using a Brabender Junior experimental mill (Germany), yielding a flour extraction rate of approximately 60%. Mixograph parameters including mixing time, peak area, 8-min tail height, and 8-min tail width were measured using a 10-g Mixograph (National Mfg. Co., USA) following the AACC 08-01 method.
4.3. Statistical Analysis of Phenotypic Data
Best Linear Unbiased Prediction (BLUP) values were calculated with the lme4 package in R software (https://www.r-project.org/). Both the environment-specific means and the BLUP values of phenotypic data were subsequently used for phenotypic and genetic analyses. Descriptive statistics and gene effect analyses were performed using GraphPad Prism software. Analysis of variance (ANOVA), correlation analysis, and calculation of broad-sense heritability (H²) were conducted using IciMapping v4.2. Finally, frequency distribution diagrams for each mixograph parameter across different environments were generated using Origin 2024.
4.4. Construction of Genetic Linkage Map and QTL Mapping
A previously published high-density genetic linkage map constructed with 55K SNP array data from the RIL population and parental lines [14] was employed for QTL analysis in this study. QTL mapping was conducted using the inclusive composite interval mapping (ICIM) method in IciMapping v4.2 software, with a significance LOD threshold set at 2.5. Putative QTLs with intervals less than 10 cM or sharing flanking markers were considered to represent the same locus. A major QTL were defined as one detected in at least two environments and explaining >10% of the phenotypic variance. Positive additive effects indicate that the trait increase originated from Zhongyou 9507, whereas negative effects correspond to alleles from Yangxiaomai.
4.5. Development and Validation of KASP Markers
Based on closely linked markers and the confidence intervals of the major QTLs, the corresponding flanking sequences were extracted from the WheatOmics database (http://202.194.139.32/). These sequences were subsequently submittted to the Polymarker website (http://www.polymarker.info/) for the design of KASP assays. Four sets of KASP primers, along with their common primers, were successfully designed and synthesized by Sangon Biotech (Shanghai) Co., Ltd. (https://store.sangon.com/). The PCR reaction was carried out in a 5 µL system containing: 2.0 µL of 2×KASP Master Mix, 0.0336 µL of the primer mix (a combination of two allele-specific forward primers and one common reverse primer at a final total concentration of 50 µM, mixed at a molar ratio of 2:2:5)), and 2 µL template DNA (50 ng/µL). Amplification was performed on a water bath PCR instrument (LGC Ltd.) with the following thermal profile: an initial denaturation at 94℃ for 15 min; 10 touchdown cycles of 94℃ for 20 s and 65℃-57℃ for 60 s (decreasing by 0.8℃ per cycle); followed by 35 cycles of 94℃ for 20 s and 57℃ for 60 s; and a final storage at 4℃ in the dark.
Genotyping of the 110 advanced breeding lines was performed using a 384-well plate format on a PHEstar instrument (BMG Labtech GmbH, Ortenberg, Germany). Following the fluorescence scan, the genotyping data were processed and analyzed using KLUSTER Caller software (LGC, Hoddesdon, UK) to visualize the allelic clusters and thereby validate the effectiveness of the markers and their associated QTLs.
4.6. Screening of Candidate Genes
To delineate the physical regions harboring the QTLs, the sequences of tightly linked molecular were aligned via BLAST to determine their genomic positions. Subsequently, high-confidence annotated genes within these target intervals were retrieved from the IWGSC RefSeq v1.1 genome assembly (https://wheat-urgi.versailles.inra.fr/). For the expression profiles across different tissues and development stages were further investigated using the publicy avaliable hexaploid wheat transcriptom database on the Wheat-expression website (https://www.wheat-expression.com/).
5. Conclusions
This study successfully identified six stable genetic loci associated with key mixograph parameters, including mixing time, peak area, 8-min tail width, and 8-min tail height were identified in an F6 RIL population derived from a cross between Yangxiaomai and Zhongyou 9507. These loci individually accounted for phenotypic variation ranging from 4.09%-28.70%.Among them, QTh.ahau-1A, QMt/QPa.ahau-1B, and QTw.ahau-1D.1 represent potentially novel loci, there by enhancing the genetic resources avaliable for wheat quality breeding. We further developed and preliminarily validated four practical KASP markers for marker-assisted selection. Six candidate genes were identified from the QTL regions. Future work should involve fine-mapping, multi-background marker validation, and functional studies. These findings provide essential genetic tools for enhancing mixograph properties in wheat breeding.
Supplementary Materials
The following supporting information can be downloaded at the website of this paper posted on Preprints.org.
Author Contributions
Conceptualization, C.X.M and Y.X.W.; methodology, Q.Q.Z.; formal analysis, Q.Q.Z., F.F.L. and X.D.; resources, W.X.C., and Y.L; data curation, F.F.L. and Y.X.L.; writing—original draft preparation, Q.Q.Z.; writing—review and editing, Q.Q.Z. and F.F.L. ; supervision, W.X.C. and H.Z. All authors have read and agreed to the published version of the manuscript.
Funding
This work was funded by National Key Research and Development Program of China(2023YFD1200404), Innovation Project of Bio-breeding Laboratory of Anhui Province (2025SWYZ0310), the China Agriculture Research System of MOF and MARA (CARS-3-2-14).
Data Availability Statement
Data are contained within the article and Supplementary Materials.
Conflicts of Interest
The authors declare no conflicts of interest.
References
- Wang, F.C.; Zhang, W.; Chen, W.Y. Mixograph and its application in the determination of wheat flour quality. Grain and Feed Industry. 2004, 12, 10-12.
- Sun, C.L.; Tian, J.C.; Zhang, Y.X. Application of texture analyzer in the evaluation of the wheat paste quality. Experiment Science and Technology. 2007, 5, 46-49.
- Mohamed,B.;,Abdullah, A.; Khaled,M.;Mohamed,M.;Mohamed,A.; Mohamed,M.;Mohamed,S.; Ibrahim, A. QTL analysis of farinograph and Mixograph related traits in spring wheat under heat stress conditions. Molecular Biology Reports.2020,47,5477-5486.
- Jiang, X.L.; Li, X.J.; Feng,S.V.;Hu,T.Z.;Ru,Z.G. Genetic variation of dough Mixograph characters and their relationships with other quality traits in wheat. Journal of Triticeae Crops.2013, 33, 806-811.
- Shen, X.Y.; Yan, J.; Chen, X.M.; Zhang,Y.;Li,H.L.;Wang,D.S.,He,Z.H.;Zhang,Y. Relationship of Mixograph parameters with farinograph and extensograph parameters,and bread-making quality traits. Acta Agronomica Sinica. 2010, 36, 1037-1043.
- James, C.N.; Cristina, A.; Flavio, B.; Patrick,L.F.Daisy,G. G.;Christine,J. B.;Roberto,J. P.;Marie,R.P.;Philippe,L.;Calvin,O. Q.; Mark,E. S.Quantitative trait locus analysis of wheat quality traits. Euphytica,2006, 149, 145-159.
- Morgan, E.S.; Ajay, K.;Shahryar,K.;Senay,S.;Mohammed,S.;Eder,E.M.;Phillip,E.M.;Edward,L.D.;Elias,E.;Blaine,S.;Steven,S.X.;Mohamed,M.A et al. New QTL alleles for quality-related traits in spring wheat revealed by RIL population derived from supernumerary×non-supernumerary spikelet genotupes. Theor. Appl. Genet. 2015, 128, 893-912.
- Huang,X.;Cloutier,S.;Lycar,L.;Radovanovic,N.;Humphreys,D.; Noll,J.;Somers,D.;Brown,P.Molecular detection of qtls for agronomic and quality traits in a doubled haploid population derived from two canadian wheats (Triticum aestivum L.).Theor. Appl. Genet.2006, 113, 753-766.
- Nelson,J. C.;Andreescu,C.; Breseghello,F.; Finney,P.L.;Gualberto,D.G.; Bergman,C.J.;Pena,R.J.;Perretant,M.R.;Leroy,P.;Qualset,C.O. Quantitative trait locus analysis of wheat quality traits. Euphytica, 2006, 149,145-159.
- Barakat, M.; Al-Doss, A.; Moustafa, K.; Motawei, M.; Alamri, M.; Mergoum, M.; Sallam, M.; Al-Ashkar, I. QTL analysis of farinograph and Mixograph related traits in spring wheat under heat stress conditions. Mol. Biol.2020, 47, 5477–5486.
- Chen, J.S. Construction of high denstiy genetic map of wheat (Triticum aestivum L.) and QTL analysis for quality and molecular marker exploration.Shandong Agricultural University, China,2015.
- Zheng, F.F.; Deng, Z.Y.; Shi, C.L.; Zhang, X.Y.; Tian, J.C. QTL mapping for dough mixing characteristics in a recombinant inbred population derived from a waxy × strong gluten wheat (Triticum aestivum L.). J. Integr. Agr. 2013, 12, 951–961.
- Deng,Z.; Tian,J.;Chen,F.;Li,W.;Zheng,F.; Chen,J.; Shi,C.; Sun,C.;Wang,S.; Zhang,Y. Genetic dissection on wheat flour quality traits in two related populations. Euphytica, 2015,203: 221-235.
- Xu, K.L. Identification of novel loci Qphs.ahau-5A and Qphs.ahau-6D for pre-harvest sprouting resistance in common wheat.Anhui Agricultural University, China, 2021.
- Jin, H.; Tian, Y.;Zhang,Y.;Zhang,R.;Zhao,H.B.;YangX.;Song,X.Z.;Dimitrov,Y.;Wu,Y.;Gao,Q.;Liu,J.D.;Zhang,J.M.;He,Z.H.Genome-wide association mapping of processing quality traits in common wheat (Triticum aestivum L.). Genes.2023, 14, 1816.
- Kong, X.S. Discovery of genetic loci controling wheat gluten quality and Mixograph parameters and identification of high quality germplasm.Shandong Agricultural University, China, 2022.
- James, C.N.;Cristina, A.;Flavio, B.;Patrick, L.F.;Daisy,G.G.;Christine,J.B.;Roberto,J.P.;Marie,R.P.;Philippe, L.;Calvin,O.Q.;Mark,E.S. Quantitative trait locus analysis of wheat quality traits. Euphytica.2006, 149, 145-159.
- Guo, H.; Fu, X.Y.; Ji, M.Q. Association analysis of dough mixing parameters using a natural population. Shandong Agricultural Sciences.2020, 52, 1-7.
- Yu,H.X.;An,Y.L.; Wang,A.P.;Guan,X.; Tian,J.C.; Ning,T.Y.; Fan.K.X.;Li,H.; Liu,Q.Q.;Wang, D.X.;Chen,J.S.Genetic dissection of the mixing properties of wheat flour (Triticum aestivum L.) using unconditional and conditional QTL mapping.J.Geonmics.2022,10:8–15.
- Sun,C.W.; Jing,Z.H.;Chen,X.Q.;Chen. J.H.; Shang,Q.Q.;Jin.H.;Jia.J,Z.;Ren.Y.; Zhao,L.; Gao,L.F.;He, Z.H.;Chen,F.Reconciliation of wheat 660K and 90K SNP arrays and their utilization in dough rheological properties of bread wheat.Journal of Advanced Research.2025,77: 1-13.
- Rasheed, A.; Hao, Y.F.; Xia, X.C.; Khan, A.; Xu, Y.B.; Varshney, R.K.; He, Z. H.Crop breeding chips and genotyping platforms: progress, challenges, and perspectives. Mol. Plant. 2017, 10, 1047–1064.
- Wu, H.; Graaf , B.; Mariani, C.; Cheung, A.Y. Hydroxyproline-rich glycoproteins in plant reproductive tissues: structure, functions and regulation. Cell. Mol. Life Sci. 2001, 58, 1418–1429.
- Showalter, A.M.; Keppler, B.D.; Liu, X.; et al. Bioinformatic identification and analysis of Hydroxyproline-rich glycoproteins in populus trichocarpa. BMC Plant Biol. 2016, 16, 229.
- Sun, A.L.; Li, Y.L.; He, Y.; Zou,X.X.;Chen,F.L.;Ji,R.Z.;You,C.Q.;Yu,K.Y.;Li,Y.;Xiao,W.J.;Guo,X.H.Comprehensive genome-wide identification, characterization, and expression analysis of CCHC-Type zinc ginger gene family in wheat (Triticum aestivum L.). Front. Plant Sci. 2022, 13, 892105.
- Wu, Z.M.; Shen, S.H.; Wang, Y.D.;Tao,W.Q.;Zhao,Z.Q.;Hu,X.L.;Yu,P. Genome-wide identification and expression analysis of the zinc finger protein gene subfamilies under drought stress in Triticum aestivum L. Plants,2022, 11, 2511.
- Ai, Q.; Pan, W.Q.; Zeng, Y.; Li,Y.H.;Cui,L.C.CCCH zinc finger genes in barley: genome-wide identification, evolution, expression and haplotype analysis. BMC Plant Biol. 2022, 22, 117.
- Chen, J.J.; Ouyang, Y.D.; Wang, L.;Xie,W.B.; Zhang,Q.F. Aspartic proteases gene family in rice: gene structure and expression, predicted protein features and phylogenetic relation. Gene. 2009, 442, 108-118.
- Wei, K.F.; Li, Y.X. Functional genomics of the protein kinase superfamily from wheat. Mol. Breed. 2019, 39, 141.
- Ral, J.P.;Bowerman, A.F.;Li, Z.Y.; Sirault,X.;Furbank,R.;Bloemsma,M.;Cavanagh,C.R.;Howitt,C.A.;Morell,M.K.Down-regulation of glucan, water-dikinase activity in wheat endosperm increases vegetative biomass and yield. Plant Biotech. J. 2012, 10, 871-882.
- Wei, K.F.; Han, P. Comparative Functional Genomics of the TPR Gene Family in Arabidopsis, Rice and Maize. Mol. Breed. 2017,37,152.
Figure 1.
Frequency distribution and correlation analysisof Mixograph parameters in RIL population.
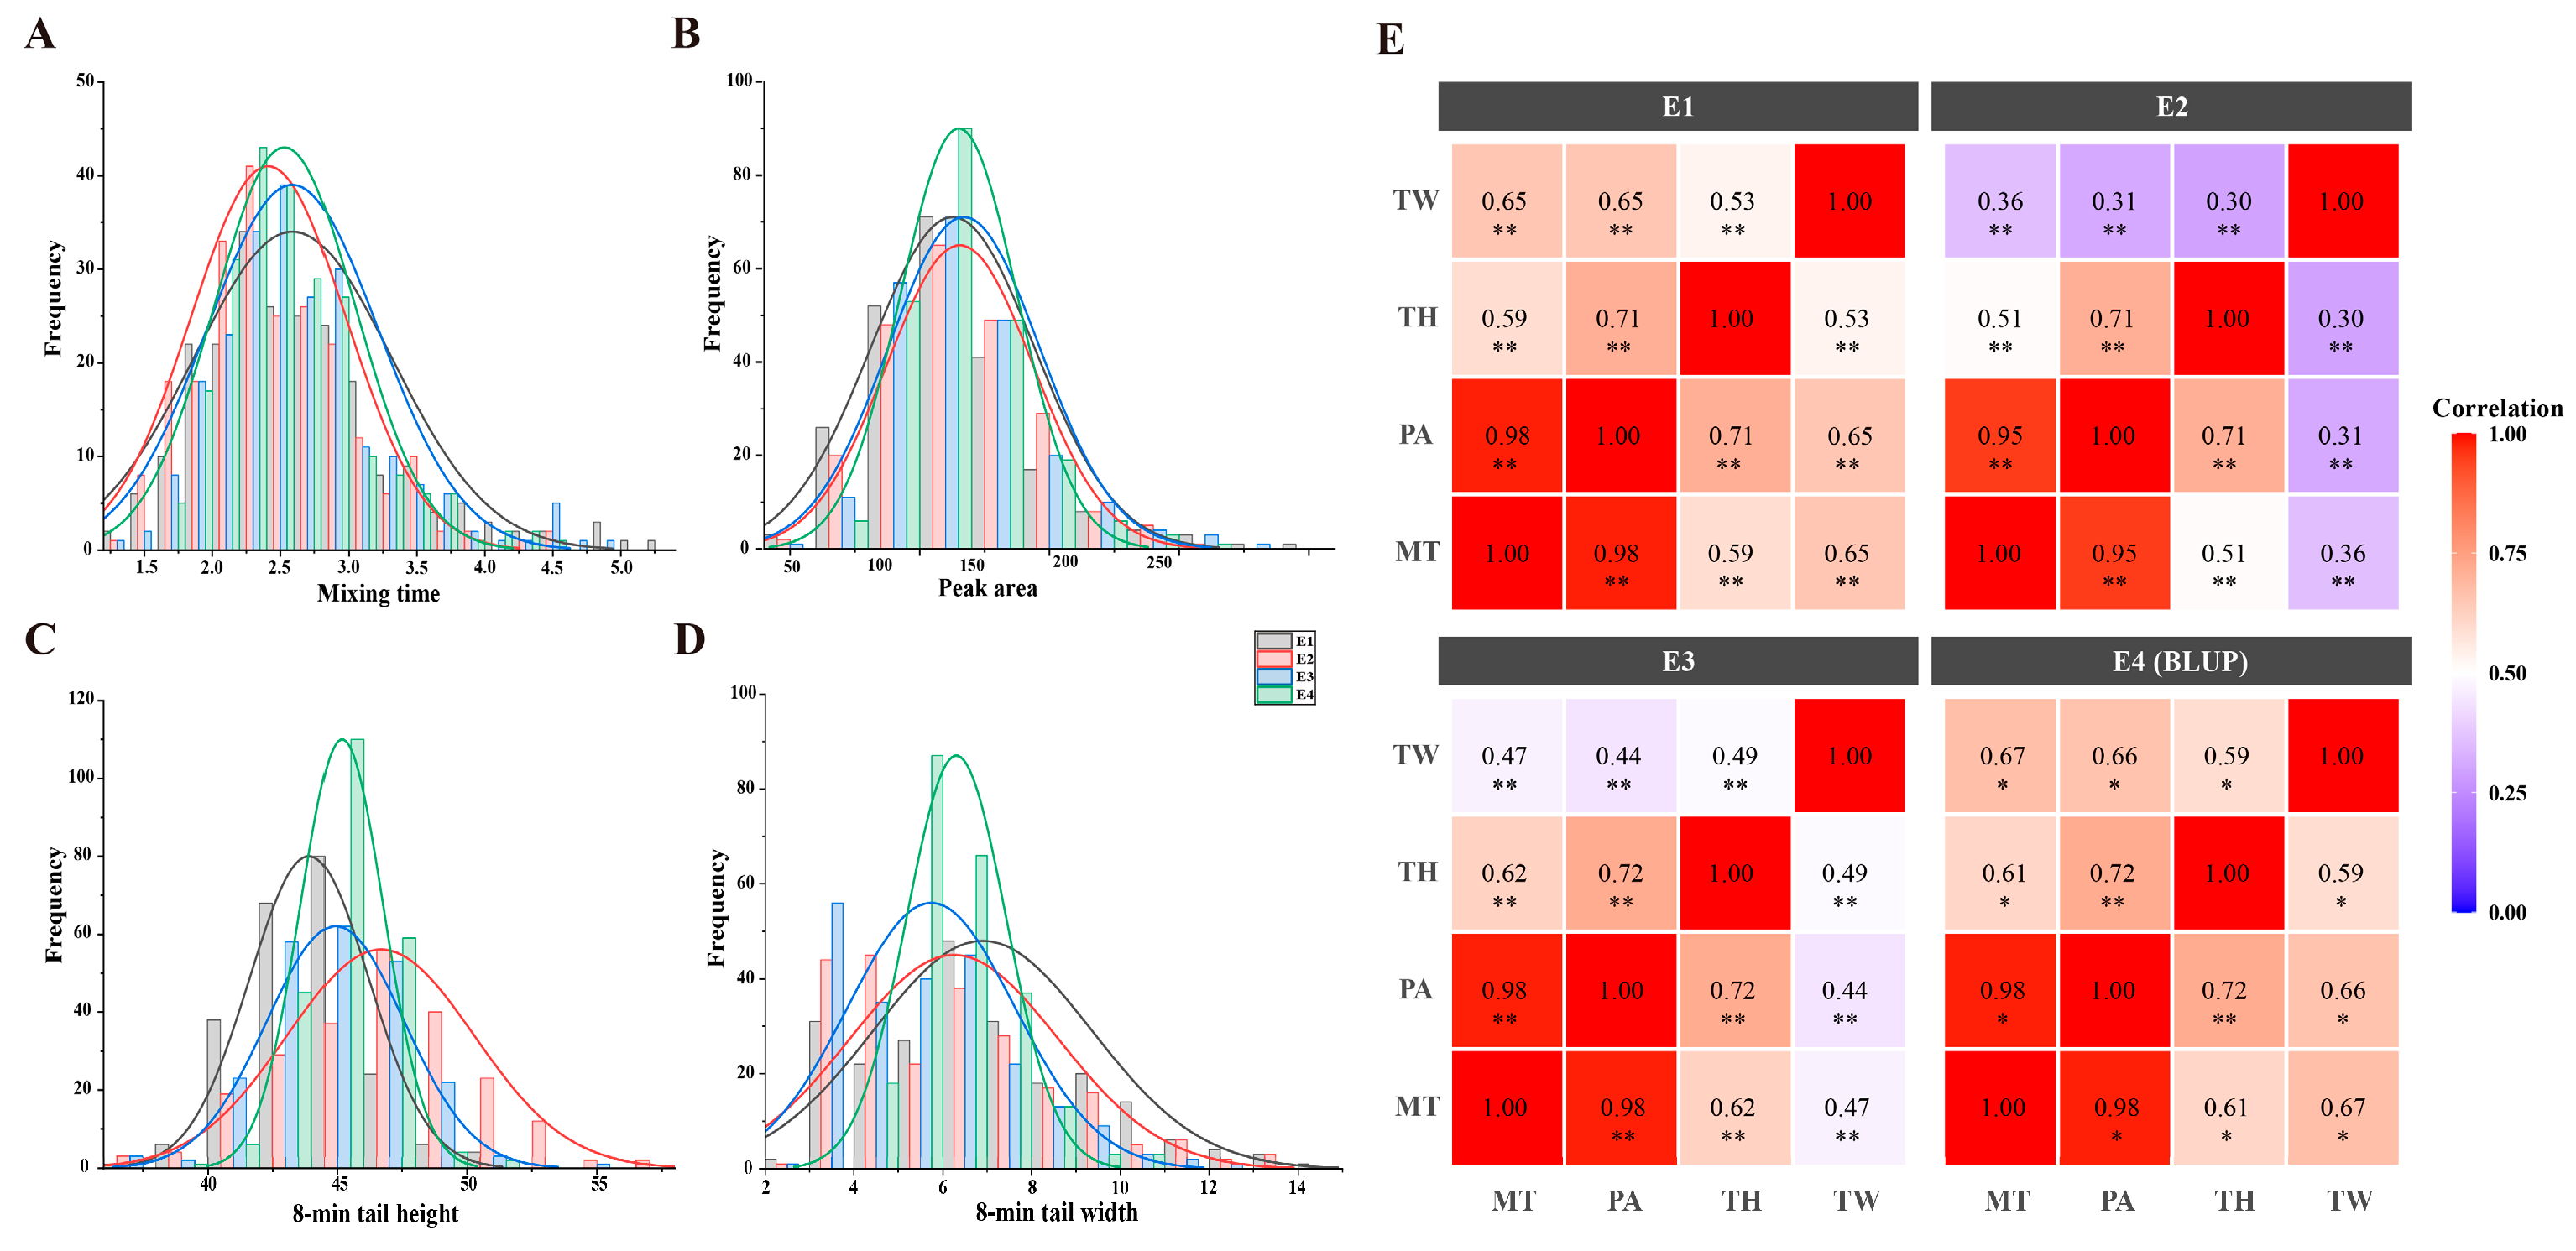

Table 1.
Phenotypic distribution of Mixograph parameters in wheat parents and their RIL populations.
Table 1.
Phenotypic distribution of Mixograph parameters in wheat parents and their RIL populations.
| Trait | Environment | Parents | RILs | ||||
| Zhongyou 9507 | Yangxiaomai | Minimum | Maximum | Mean | Cofficient of Variation | ||
| MT | 21SX (E1) | 4.4 | 2.1 | 1.3 | 5.2 | 2.6 | 0.28 |
| 22SX (E2) | 3.9 | 1.6 | 1.3 | 4.9 | 2.6 | 0.24 | |
| 22HF (E3) | 3.1 | 1.8 | 1.3 | 4.4 | 2.4 | 0.24 | |
| E4 (BLUP) | 3.8 | 1.8 | 1.6 | 4.4 | 2.5 | 0.2 | |
| PA | 21SX (E1) | 177.04 | 84.04 | 53.05 | 247.81 | 112.68 | 0.28 |
| 22SX (E2) | 180.49 | 75.11 | 58.96 | 239.54 | 117.03 | 0.25 | |
| 22HF (E3) | 139.03 | 79.58 | 56.12 | 205.98 | 115.45 | 0.24 | |
| E4 (BLUP) | 165.52 | 79.58 | 66.09 | 201.12 | 115.05 | 0.19 | |
| TH | 21SX (E1) | 43.63 | 41.12 | 37.93 | 51.81 | 43.91 | 0.05 |
| 22SX (E2) | 49.4 | 44.23 | 37.32 | 55.57 | 44.92 | 0.06 | |
| 22HF (E3) | 48.09 | 42.67 | 36.22 | 57.04 | 46.66 | 0.08 | |
| E4 (BLUP) | 47.04 | 42.67 | 39.56 | 50.12 | 45.16 | 0.04 | |
| TW | 21SX (E1) | 10.34 | 3.91 | 2.77 | 14.47 | 6.9 | 0.37 |
| 22SX (E2) | 5.89 | 5.67 | 2.59 | 12.53 | 5.74 | 0.33 | |
| 22HF (E3) | 6.71 | 4.79 | 2.59 | 17.07 | 6.28 | 0.39 | |
| E4 (BLUP) | 7.65 | 4.79 | 4.17 | 10.32 | 6.3 | 0.18 | |
MT:Mixing time;PA:Peak area;TH:8-min tail height;TW:8-min tail width.
Table 2.
ANOVA and H2 of Mixograph parameters in RIL population.
| Trait | Mean square | F-value | H² | ||||
| Genotype | Environment | G×E | Genotype | Environment | G×E | ||
| MT | 3.02 | 7.18 | 0.34 | 174.58** | 414.23** | 19.83** | 0.90 |
| PA | 6169.98 | 3304.69 | 885.31 | 24089.16** | 12902.33** | 3456.49** | 0.87 |
| TH | 46.98 | 1320.2 | 14.11 | 411.48** | 11562.92** | 123.59** | 0.77 |
| TW | 26.37 | 234.67 | 9.47 | 1916.38** | 17051.77** | 687.97** | 0.74 |
** P <0.01.
Table 3.
Analysis of stable QTLs for Mixograph parameters in RIL population.
| Trait | QTL | Flanking markers | Physical interval (Mb, IWGSC v1.0) | LOD value | Phenotypic variation explanation (PVE, %) | Additive effect | Environment |
| MT | QMt.ahau-1A | AX-110911310-AX-108914408 | 513.62-514.56 | 4.59 | 15.34 | 0.23 | E2/E3 |
| QMt.ahau-1B | AX-111503025-AX-110519906 | 551.72-552.48 | 21.23 | 23.62 | 0.39 | E1/E2/E4 | |
| TW | QTw.ahau-1D.1 | AX-109827648-AX-110069135 | 374.05-375.94 | 5.05 | 9.89 | -0.54 | E1/E4 |
| QTw.ahau-1D.2 | AX-109079356-AX-111804778 | 410.07-413.66 | 6.28 | 10.32 | 0.84 | E1/E3/E4 | |
| PA | QPa.ahau-1B | AX-111503025-AX-110519906 | 551.72-552.48 | 23.2 | 21.72 | 14.18 | E1/E4 |
| TH | QTh.ahau-1A | AX-109055961-AX-111496677 | 504.82-508.05 | 13.08 | 20.38 | -1.11 | E2/E4 |
MT:Mixing time;PA:Peak area;TH:8-min tail height;TW:8-min tail width.
Table 4.
Developed KASP Primer sequences based on major QTLs.
| KASP marker | SNP marker | FAM-compatible primers (5'-3') | HEX-compatible primers (5'-3') | Common primers (5'-3') |
| QMt-1A-KASP | AX-110911310-AX-108914408 | gcatgtcatcagcactgtgA | gcatgtcatcagcactgtgG | cctttctcacataTggcgcC |
| QMt-1B-KASP | AX-111503025-AX-110519906 | ccacaactttctgcctagctA | ccacaactttctgcctagctG | ttatgcggtCgaggatccG |
| QTw-1D.1-KASP-1 | AX-109827648-AX-110069135 | tcaacacTaaatgctccaaaaacaG | tcaacacTaaatgctccaaaaacaA | gcttgctaacctggaagatccG |
| QTw-1D.1-KASP-2 | AX-109827648-AX-110069135 | cttCgtccacgtccAttagT | cttCgtccacgtccAttagC | acacaagagcatgtaataccgG |
Table 5.
Candidate genes for Mixograph-related traits.
| Candidate Gene | Chromosome | Position | Annotation |
| (Mb) | |||
| TraesCS1A02G313200 | 1A | 505.27 | Hydroxyproline-rich glycoprotein family protein |
| TraesCS1A02G315200 | 1A | 506.55 | zinc finger CCCH domain protein |
| TraesCS1A02G315600 | 1A | 507.08 | Protease-related family protein |
| TraesCS1B02G326100 | 1B | 551.72 | Kinase family protein |
| TraesCS1D02G277300 | 1D | 374.40 | Phosphoglucan, water dikinase, chloroplastic |
| TraesCS1D02G277900 | 1D | 375.20 | Tetratricopeptide repeat (TPR)-like superfamily protein |
Disclaimer/Publisher’s Note: The statements, opinions and data contained in all publications are solely those of the individual author(s) and contributor(s) and not of MDPI and/or the editor(s). MDPI and/or the editor(s) disclaim responsibility for any injury to people or property resulting from any ideas, methods, instructions or products referred to in the content. |
© 2026 by the authors. Licensee MDPI, Basel, Switzerland. This article is an open access article distributed under the terms and conditions of the Creative Commons Attribution (CC BY) license (http://creativecommons.org/licenses/by/4.0/).
Copyright: This open access article is published under a Creative Commons CC BY 4.0 license, which permit the free download, distribution, and reuse, provided that the author and preprint are cited in any reuse.


