Submitted:
12 February 2026
Posted:
12 February 2026
You are already at the latest version
Abstract
Agricultural Commercialization Clusters (ACC) play a vital role in Ethiopia's agricultural and rural development initiatives, aimed at promoting sustainable livelihoods. This study examines the impacts of ACC practices on the livelihood diversification of rural households in South Ethiopia. Data was collected from 355 households, comprising 177 participants in Agricultural Commercialization Clusters (ACC) and 178 non-participants, using household surveys and qualitative insights from interviews and focus group discussions. Descriptive statistics and econometric modeling, including the Endogenous Switching Regression (ESR) approach, were used to assess the effects of Agricultural Commercialization Clusters (ACC) on livelihood diversification in South Ethiopia. The probit model identified critical determinants of agricultural commercialization cluster, such as education level, total land size, access to irrigation, and proximity to roads and markets. The ESR full information maximum likelihood (FIML) results showed that livelihood diversification was positively influenced by farmland size, access to agricultural extension services, and credit availability. For non-ACC participant households, engaging in ACC practices resulted in an 18.9% increase in livelihood diversification. The results suggest that ACC practices significantly enhance livelihood diversification in the region. In South Ethiopia, achievements of agricultural commercialization clusters significantly contribute to combating unemployment and are directly linked to the Sustainable Development Goals (SDGs), specifically SDG 1, 2, and 3. The study recommends that policymakers and development practitioners enhance access to extension services, credit, markets, roads, and irrigation infrastructure to strengthen livelihood diversification through ACC in South Ethiopia.
Keywords:
agricultural commercialization cluster
; livelihood diversification
; ESR
; households
; South Ethiopia
1. Introduction
The United Nations Sustainable Development Goals (SDGs) 2030, particularly Goals 1, 2, and 3, emphasize the transformation of agriculture from subsistence practices to entrepreneurial and commercial farming as a strategy to reduce poverty, improve food security, and promote sustainable economic development (Governors et al., 2020; Tilinti et al., 2025; Walsh et al., 2022; World Bank, 2022). In line with this global agenda, the Ethiopian government has prioritized agricultural commercialization clusters (ACC) as a key pillar for rural economic transformation and poverty alleviation, aiming to enhance productivity, market integration, and economic growth (FDRE Planning and Development Commission, 2021; Gomez y Paloma et al., 2020; Kamara et al., 2019; MOA, 2024). Governments and development agencies have promoted ACCs as mechanisms to enhance smallholder incomes, mitigate production and market risks, and strengthen rural development, with cluster farming recognized as a viable strategy in many developing countries (Dureti et al., 2023; Tabe-Ojong & Dureti, 2023).
Agricultural commercialization in Ethiopia seeks to modernize production systems, increase market orientation, and improve rural livelihoods by fostering sustainable growth (Dureti et al., 2023; Paul Jr Tabe-Ojong et al., 2021). Current development programs focus on promoting agricultural entrepreneurship, supporting non-farm and off-farm economic activities, and improving access to financial services and sustainability initiatives(MOA, 2024). Such interventions are essential for enabling smallholder farmers to increase productivity, diversify income sources, and enhance resilience to economic and environmental risks.
Agricultural commercialization cluster farming serves as a critical livelihood strategy for rural households in developing countries, including Ethiopia, contributing significantly to income generation and food security(Adem & Tesafa, 2020; Aweke et al., 2023; Habib, Rankin, et al., 2023; Alobo Loison, 2015; Ayele et al., 2021). Commercializing smallholder agriculture can stimulate investments in farm productivity, increase profitability, and enhance household incomes (Neme & Tefera, 2021; Tabe-Ojong & Dureti, 2023). Beyond on-farm benefits, livelihood diversification through engagement in non-farm activities is increasingly recognized as vital for reducing vulnerability to market fluctuations, price shocks, and climate-related risks).
Despite these benefits, empirical evidence on the relationship between ACC participation and livelihood diversification is mixed and context-dependent. While some studies indicate that ACCs enhance income-generating opportunities and market access (Kamara et al., 2019; Abera et al., 2021; Abebe et al., 2021; Lijalem Abebaw et al., 2023), others highlight potential vulnerabilities, including exposure to market risks and over-reliance on specific cash crops (Linderhof et al., 2019; Manjur, 2018; Mbewana & Kaseeram, 2024b). These inconsistencies underscore the need for context-specific research to understand the role of ACCs in supporting both agricultural and non-agricultural livelihood strategies.
This study aims to address these gaps by examining the impacts of agricultural commercialization clusters on household livelihood diversification in the Basketo Zone of South Ethiopia. The study further explores the factors that determine participation in ACCs and their influence on household income and livelihood strategies. Given the region’s diverse range of cash crops and market opportunities, understanding these dynamics is essential for informing policies and interventions aimed at improving smallholder livelihoods. By doing so, the study contributes to evidence-based strategies for promoting rural household income diversification, enhancing resilience, and supporting sustainable development in South Ethiopia.
2. Materials and Methods
2.1. Description of Study Areas
The study was conducted in the Basketo zone of the South Ethiopia Region, which is well-known for its high potential for crops, spices, and livestock production. Basketo zone is one of the region’s 12 zones, consisting of 31 (the smallest administrative unit in Ethiopia), and four urban kebeles. Its capital, Laska, is located 192 km from Wolaita Sodo and 312 km from Arbaminch. The zone is situated at 6° 20′ 30″ N, north latitude, and 36° 36′ 30″ E east longitude, respectively (Figure 1), with a total land area of 187,751 hectares. Basketo Zone Agriculture Department identifies three ecological zones: Woynadega (45%), Kola (54%), and Dega (1%). The elevation ranges from 800 to 1200 masl, with Kolla (warm tropical), Weynadega, which is moderately warm (1500-2300 masl), and Daega (above 2300 highland with cool climate). The majority of high-value crops (export crops) produced in the study area are sesame, teff, maize, coffee, ginger, and mung bean, and since 2004/5, sesame, ginger, teff, and mung bean have been produced under an agricultural commercialization cluster.
2.2. Sampling Technique and Sample Size
A multistage sampling approach was employed to select a representative sample of households. In the first stage, two ACC clusters (Gara and Angila) and two non-ACC clusters (Ganchire and Dabitsa) were purposefully selected. In the second stage, a total of eight kebeles were randomly chosen from the selected clusters, with two kebeles selected from each cluster. Representative households were then drawn from the selected kebeles. A comprehensive list of all smallholder farming households was obtained from the kebele agricultural offices and used as the sampling frame for the eight selected kebeles. In the final stage, households were stratified into two groups: those participating in ACC (treated group) and those not participating in ACC (control group). A total of 355 households were randomly selected from these strata.
The sample size was determined using the formula proposed by Kothari (2004), which provides a maximum size to ensure the desired precision. This formula is particularly appropriate for calculating sample sizes in relatively homogeneous populations. Since the study aimed to compare differences between ACC participants and non-participants, selecting an equal or nearly equal number of households from each stratum enhances efficiency (Kothari, 2004). Consequently, 177 households were selected from the ACC participant group and 178 households from the non-participant group. The representative sample sizes were determined using the following formula
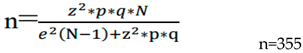 where, n is desired sample size; Z is the standard cumulative distribution that corresponds to the level of confidence with the value of 1.96; e is desired level of precision; p is the estimated proportion of an attribute present in the population with the value of 0.5 to get the desired minimum sample size of households at 95% confidence level and ±5% precision; q=1-p.
2.3. Data Types, Sources, and Collection Methods
The study was based on data obtained from both primary and secondary sources. Primary data were collected through face-to-face household surveys, key informant interviews (KII), and focus group discussions (FGD). The household survey questionnaire was designed to gather detailed information on household demographics, socio-economic characteristics, and livelihood-related activities. The questionnaire included both open- and closed-ended questions to ensure comprehensive coverage of information relevant to the study objectives. In-depth interviews were conducted with key officials, including the Zone Agriculture Department Head, District Agriculture Office Head, District ACC Coordinator, Zone Agriculture Extension Head, and heads of the Zonal and District Trade Offices. Focus group discussions were organized with Kebele Agriculture Office Heads, Kebele Managers, Cooperative Experts, and Cooperative Chairpersons to collect qualitative data related to the study topic.
2.4. Methods of Data Analysis
The data were analyzed using both descriptive and inferential statistical tools. In addition to conventional descriptive and inferential analyses, an econometric model, specifically the Endogenous Switching Regression (ESR), was employed.
The Simpson Diversity Index was used to measure income diversity because it considers both the number of income sources and the evenness of income distribution across these sources. The Simpson Index has been widely applied in similar studies on livelihood diversification (Alemu, 2023; Mbewana & Kaseeram, 2024a; Tilinti et al., 2025; Tyenjana & Taruvinga, 2019) and is favored for its straightforward calculation and suitability in evaluating household livelihood strategies (Abera et al., 2021; Das & Ganesh-Kumar, 2018; Habib, Rankin, et al., 2023; Kolog et al., 2024; Wondim, 2019). The SDI ranges from zero to one, where a value of zero indicates complete specialization (only one source of income, Pi = 1) and a value of one represents maximum diversification.
The general formula for calculating SDI is given as:
where SDI = Simpson’s Diversity Index, N indicates the total number of livelihood income sources, and Pi denotes the fraction of the ith income of a livelihood source. The SID value remains between 0 and 1. When the SID value is 0, this depicts the existence of non-diversification (specialization), and when it approaches 1, there is an expansion of livelihood diversification.
In this study, the SID model is expressed as:
where CCI= Cash crop income(activities linked with gross crop income from sesame, ginger, teff, vegetable sales), LVI= Livestock income(activities income from livestock and livestock products), NFI= Non-farm income(activities include non-agricultural incomes that can include wage employment, petty trade, small-scale non-farm production), OFI=Off-farm income (include activities linked with agriculture, such as wage employment for collecting coffee, sesame, cotton, ginger), OI= Other income sources(activities including working in road construction and maintenance, soil and water conservation) and THI = Total household income from all income sources.
2.5. Analytical Approach
In this study, to estimate the impacts of agricultural commercialization cluster on livelihood diversification of rural households, we employed Endogenous Switching Regression (ESR). When making an accurate impact assessment of participation in ACC on rural household livelihood diversification, the observable and unobservable characteristics of the ACC participant (treatment group) and non-ACC (control group) must be captured. However, most impact assessment approaches using non-experimental data (not randomly assigned) fail to capture observable and/or unobservable characteristics that affect participation and outcome variables. For instance, instrumental variables capture only unobserved heterogeneity, but the assumption is that the parallel shift of outcome variables can be considered as a treatment effect (Gidelew et al., 2025a, 2025b). In contrast, using regression models to analyze the impact of ACC or intervention using pooled samples of ACC and non-ACC might be inappropriate because it gives a similar effect on both groups (Abebe et al., 2021; Aweke et al., 2023).
A methodological approach that overcomes the aforementioned limitations is endogenous switching regression (ESR), which is the most commonly used method in impact analysis studies (Baharu, 2016; Danso-Abbeam et al., 2020; Gidelew et al., 2025a; Mbewana & Kaseeram, 2024a). In this study, we employed the parametric ESR to reduce the selection bias and ensure consistent results by capturing both the observed and unobserved heterogeneity that influences the outcome variables as well as the participation decision.
In the ESR model, separate household outcome equations for ACC participants and non-ACC participants are specified to account for the impact of participation in the two groups. The outcome regression equations for both ACC (regime 1) and non-ACC (regime 2) can be written as:
Regime1:Y1i=α1X1i+e1iifwi=1
Regime2:Y0i=α0X0i+e0iifwi=0
Yi = the outcome variable (SDI) in regimes 1 and 2, Xi = a vector of exogenous variables anticipated to have an impact on the outcome variables in the two groups. The difference between the actual SDI of the ACC participant (1) and the counterfactual SDI (Eq. 6) is used to calculate the Average Treatment effect on Treated (ATT).
ATT=E[y1i/Di=1]−E[y2i/Di=1
The treatment effect on the control group (ATU), which is calculated as follows, is used to measure how the ACC affects the SDI (livelihood diversification) of households that do not participate in the ACC:
ATU=E[y1i/Di=0]−E[y2i/Di=0]
To control for unobserved heterogeneity that may affect SDI outcomes for both ACC and non-ACC participant households, we calculate the base heterogeneity effect (BH) as computed as:
BH1=E[y1i/Di=1]−E[y2i/Di=0]
Similarly, the effect of base heterogeneity for the non-ACC participants is the difference is computed as:
BH2=E[y2i/Di=1]−E[y2i/Di=0]
Finally, the study analyzes whether the impact of agricultural commercialization cluster participants differs systematically between actual participants and non-participants (had they chosen to participate). This transitional heterogeneity effect (TH) is formally estimated as:
TH=ATT-ATU
The full information maximum likelihood (FIML) method is a more efficient method of estimating an endogenous switching regression model. The FIML method simultaneously estimates binary and continuous parts of the model to yield consistent standard errors.
2.6. Definition of Variables and Working Hypotheses
Dependent Variables
This study examines the determinants of livelihood diversification using a combination of livelihood assets to measure livelihood assets, including human, social, physical, financial, and natural assets. The dependent variable is the choice of livelihood strategy, is calculated by Simpson Diversity Index (SDI). Two non-mutually exclusive livelihood diversification (SDI), and ACC. When making a choice, a rational household head selects from these four alternatives to maximize utility.
In this study, 16 variables are proposed to explain the determinants of participation in diversified livelihood activities. Table 1 summarizes the anticipated relationships between the dependent variable and the independent variables.
3. Results
This section presents and discusses the findings of the study in two sub-sections. The first sub-section presents the descriptive results, while the second sub-section discusses the econometric model include Endogenous Switching regression (ESR) results.
3.1. Descriptive Results
Table 2 presents an overview of the continuous variables analyzed using descriptive statistics. Differences between ACC participants and non-ACC participants were assessed using an independent samples t-test. The mean age of respondents was 33.14 years for ACC participants and 41.63 years for non-ACC participants, with the difference significant at the 1% level. The average household farm size was larger among ACC participants, and this difference was also statistically significant at the 1% level. In contrast, non-ACC participants had a larger family size than ACC participants, with the mean difference again significant at the 1% level.
ACC participants owned more livestock, measured in TLU (9.02), compared to non-ACC participants (4.99), with the difference statistically significant at the 1% level. On average, ACC participants traveled more hours (4.82) to reach the nearest all-weather road than non-ACC participants (1.70), and this difference was significant at the 1% level. Conversely, ACC participants took fewer hours (3.51) to reach the nearest kebele agriculture office compared to non-ACC participants (3.92), and the difference was statistically significant at the 1% level. Furthermore, the mean distance to the nearest market differed significantly between the two groups at the 1% level.
Table 3 presents the descriptive statistics of the surveyed households and the dummy variables influencing household participation in ACC. The results reveal significant differences between ACC and non-ACC participant groups. Variables such as sex, education, access to extension services, and access to training, radio ownership, mobile ownership, and cooperative membership showed significant differences at the 1% level, whereas access to irrigation and access to credit were significant at the 5% level. The majority of households were male-headed, comprising 117 (32.96%) of ACC participants and 150 (42.25%) of non-ACC participants. Regarding education, 113 (31.83%) of non-ACC participants had no formal education, compared to 40 (11.27%) in the ACC group. In terms of access to extension services, 106 (29.86%) of ACC participants reported receiving support, whereas 96 (27.04%) of non-ACC participants did not. Access to training was higher among ACC households, with 100 (28.17%) reporting participation, compared to 71 (20.0%) among non-ACC households.
3.2. Income Sources of ACC and Non-ACC Rural Households
Rural households exhibit notable differences in their sources of income between ACC and non-ACC participants, as shown in Figure 2. ACC households earned an average of 65,181.2 ETB from cash crops, compared to 25,294.5 ETB for non-ACC households. Income from livestock was also higher among ACC households, averaging 32,281.8 ETB, while non-ACC households earned 13,343.9 ETB. These findings indicate that ACC households generate significantly higher income from cash crops and livestock. Conversely, non-ACC households obtained higher income from off-farm and non-farm activities.
3.3. Determinants of the Agricultural Commercialization Cluster
A probit regression model was employed to estimate the contribution of agricultural commercialization clusters to livelihood diversification in the study area. The analysis revealed significant results, with a Prob > chi² value of 0.000, indicating that the overall model is significant at the 1% level (Table 4). This finding underscores the strong relationship between participation in agricultural commercialization clusters and household livelihood diversification. Specifically, education, total farmland, access to irrigation, proximity to the nearest market, access to all-weather roads, and total livestock holdings were found to have significant positive effects on livelihood diversification.
In examining the factors influencing agricultural commercialization activities (ACC), several key variables were found to have both positive and negative effects. Education emerged as a significant positive determinant of ACC at the 1% level. Similarly, land size positively influenced ACC activities at the 5% level, indicating that larger land holdings facilitate diversification and market participation. Access to training also had a positive and significant effect on ACC at the 5% level, while access to extension services significantly supported ACC activities at the 1% level, highlighting the role of information and resources in promoting livelihood diversification. Additionally, access to irrigation was found to enhance participation in ACC activities at the 5% level. Distance to all weather roads and the number of total livestock (TLU) emerge as significant barriers to participation in ACC, reflecting systemic challenges at the 1%. Age also has a negative effect, particularly on ACC at the 1% level, suggesting that older individuals may face difficulties engaging in these livelihood strategies.
A key informant interview (KII) conducted with officials from the Zone Agriculture department has shown that:
There is a significant challenge due to a lack of market access and transport options, which limits their ability to diversify livelihood and reduces income. This state limits livelihood diversification, leading many farmers to rely on subsistence farming.
The participant in the focus group discussion (FGD) also confirmed that:
Lack of credit access, poor transport infrastructure, and insufficient market information severely restrict farmers from diversifying their livelihoods. These interconnected bottlenecks limit investment in new endeavors, increase costs, and hinder informed decision-making, ultimately preventing them from maximizing their income potential.
3.4. Impacts of the Agricultural Commercialization Cluster on Livelihood Diversification Strategies
This section outlines the factors influencing livelihood diversification strategies, which can be directly estimated from the ESR selection equation using the “movestay” command. It also discusses the impacts of the agricultural commercialization cluster on livelihood diversification strategies using the FIML endogenous switching regression model. The ESR model estimates three equations: the selection equation and the outcome equations for ACC and non-ACC households through full information maximum likelihood (FIML) estimation. The second stage of the ESR, which involves the estimates for equations and is addressed here, while the first stage was previously discussed. Furthermore, the likelihood-ratio tests for joint independence of the three equations for income (LR x2 = 16.36, p = 0.003) reveal joint dependence between the outcome and selection equations, meaning that the outcomes for ACC and non-ACC households are interlinked. The estimated results for household livelihood diversification for both ACC and non-ACC households are presented in Table 5.
For ACC participant households, factors such as the education status of the head of the household and access to credit are positively and significantly associated with higher livelihood diversification, while the sex of the household head is negatively associated. For non-ACC households, the gender of the household head and access to extension are positively associated with livelihood diversification. In contrast, the education status of the household head, total land size, and access to credit are negatively influencing livelihood diversification strategies. The regression results indicate that certain variables impact ACC and non-ACC households differently, highlighting heterogeneity between these groups.
After estimating the ESR model parameters, the predicted livelihood diversification for rural households under both actual and counterfactual conditions was calculated. Table 6 presents the actual and counterfactual livelihood diversification strategies of ACC and non-ACC. The ESR model result implies a significant difference in livelihood diversification strategies between the treatment and control groups. Specifically, 53.1% of non-ACC participants diversified their livelihood strategies, compared to 64.2% of ACC participants. This reveals that, if participants had decided not to participate in ACC, their average livelihood diversification would have decreased by 53.1%. On the other hand, if non-ACC participants had joined in ACC practices, their livelihood diversification increased by 49.6%. The impact of ACC on participants (ATT) indicated that their livelihood diversification would have been reduced by 11.1% lower had they not participated in the agricultural commercialization cluster. Similarly, for non-ACC participant households (ATU). If they participated in ACC practices, their livelihood diversification increased by 18.9%. The Transitional Heterogeneity effect (TH) was statistically significant, indicating that if non-ACC participants had engaged in ACC, they would have been 30.3% high livelihood diversification compared to the actual ACC participants. The above mentioned result suggests that there is a positive impact of ACC on increasing livelihood diversification for non-ACC participants if they had decided to participate.
4. Discussion
This study aimed to examine the impacts of agricultural commercialization clusters on livelihood diversification among rural households in the Basketo Zone, South Ethiopia. The findings indicate that education, total farmland, access to irrigation, proximity to the nearest market, access to all-weather roads, and total livestock holdings significantly and positively influence livelihood diversification. Conversely, the age of the household head was found to have a negative and significant effect on livelihood diversification, suggesting that younger households are relatively more engaged in agricultural activities compared to off-farm or non-farm activities. These results are consistent with previous studies that report higher participation of younger households in agricultural production (Abera et al., 2021; Asfir, 2016; Baharu, 2016; Danso-Abbeam et al., 2020; Dinku, 2018; Gebru et al., 2018). The result implies that older household heads are not capable of diversifying their livelihood, and older households are more experienced and well-established in agricultural activities, and more resistant to new technologies.
The education level of the household head has a considerable marginal impact on livelihood diversification and is a positive determinant. According to the findings, improving the level of education enhances the potential for diversifying one’s means of livelihood. The fact that educated people diversify their livelihood choices (Gebru et al., 2018; Ongachi & Belinder, 2025), the study aligns with earlier research (Baharu, 2016; Kassegn & Abdinasir, 2023; Kolog et al., 2024; Wondim, 2019), the fact that education improves households’ ability to make well-informed decisions about the selection of their livelihood, and the fact that educated people are more likely to be exposed and well-trained to go into additional livelihood-earning activities during the production year.
The result indicated that households’ farmland size significantly and positively determines livelihood diversification. Because land ownership provides farmers with more opportunities to engage in diverse agriculture and non-agriculture activities, it can ease access to credit and other resources needed for livelihood diversification. This finding is consistent with (Habib, Ariyawardana, et al., 2023; Khan et al., 2017; Kuwornu & et al., 2014), who state that farmland ownership increases the probability of crop and livestock production diversification, which increases the income of the households.
The study found that the distance to the nearest agriculture office for the household head negatively affected livelihood diversification. This relationship was statistically significant at a level of less than 1%. The negative coefficient indicated that when farmers are far from the agriculture office reduces the frequency and ease of access to essential information, agricultural extension services, which include information on new technologies and best practices, which can hinder farmers’ ability to diversify their livelihood. This finding aligns with the research conducted by (Danso-Abbeam et al., 2020; Ongachi & Belinder, 2025), who also demonstrate that a negative correlation between distance to the nearest agriculture office reduced exposure to training and skill development, which are essential for acquiring new skills and exploring alternative livelihood options.
The results indicate that irrigation has significant and positive impacts on livelihood diversification. This relationship was found to be statistically significant at a significance level of less than 1%. This positive relationship indicated that access to irrigation increased agricultural productivity and income by enabling multiple cropping periods and more stable farm income. This finding is consistent with the results of (Akudugu et al., 2021; Hasnip et al., 2002; Vhuyelwani et al., 2022), that irrigation boosts annual output and raises income, stimulating growth in the rural non-farm economy, creating new jobs and opportunities for livelihood diversification.
Distance to the nearest market affects livelihood diversification at a statistically significant level of less than 1% in the study area. The result shows that market access has a deep impact on farmers’ decisions, influencing their choice of livelihood diversification adoption. This finding aligns with the research conducted by (Muricho et al., 2015; Perosa et al., 2024), distance to the nearest market can act as a push factor, compelling households to diversify their income sources beyond agriculture; when it is difficult or costly, households seek alternative livelihood activities to reduce their expenses.
The result indicated that the distance to all weather roads significantly and positively affects livelihood diversification. This result implies that a positive coefficient indicates that distance to all weather roads eased access to production areas, reduced constraints in accessing the farms and products transportation. Similar studies also found that improved rural connectivity through all-weather roads can lead to long-term and sustained improvements in the living standards of rural populations, which leads to diversified livelihoods (Bauchi & State, 2025; Mei, 2022; Meja, 2022). This indicates that access to an all-season road is believed to significantly increase households’ welfare, as it can help rural populations access new job markets and social services (Mikou et al., 2019). Finally, the results reveal that the total livestock unit had a positive and significant effect on livelihood diversification at 1%. This indicates that households with large livestock can be a significant income diversification by engaging in activities such as dairy farming or small ruminant rearing to supplement their income. This finding is consistent with the results of (Abera et al., 2021; Adem & Tesafa, 2020; Ahmad et al., 2019), households with a large number of livestock can earn more income from livestock through proper employment and utilization of their natural, human, physical, and financial capital.
5. Conclusions
ACC is central to Ethiopia’s agricultural and rural development policies, aiming to promote sustainable livelihoods. This study examined the relationship between ACC practices and household livelihood diversification in South Ethiopia. Descriptive statistics revealed that on-farm and livestock production contributed the largest share of income for ACC participants, whereas non-ACC participants relied more heavily on off-farm and non-farm livelihood activities
The results indicated that education, total land size, access to irrigation, and proximity to all-weather roads positively influenced household income diversification, with significance at the 1% level. Access to extension services and distance to the main market also positively affected income diversification.
Further analysis using the probit regression model to identify determinants of ACC showed that education significantly and positively influenced participation in ACC at the 1% level. Land size positively affected ACC activities at the 5% level, suggesting that larger landholdings facilitate diversification and market participation. The ESR result indicated that access to irrigation had a positive and significant effect on ACC at the 5% level. Additionally, radio ownership enhanced participation in on-farm activities at the 1% level, highlighting the importance of access to market information in diversifying livelihood strategies. These findings indicate that ACC practices contribute significantly to household livelihood diversification in the study area.
The study’s findings have important policy implications for promoting rural household livelihood diversification through ACC initiatives. It is recommended that both the national and South Ethiopia regional governments support smallholder farmers through continuous training programs to expand ACC practices, thereby improving the living standards of households engaged in both ACC and non-ACC activities. In addition, comprehensive extension services, improved physical infrastructure such as roads and farmers’ training centers, enhanced access to market information, and strengthened service and input delivery institutions through government-community collaboration are essential to maximize the benefits for smallholder farmers. Supporting innovative agricultural technologies is also critical to sustainably transform the sector and enhance the quality of goods and services available to smallholder farmers. In conclusion, policymakers and practitioners should prioritize determinants such as access to extension services, improved infrastructure, and irrigation to improve rural household livelihood diversification through agricultural commercialization clusters in the study area.
Author Contributions
This article is part of a PhD dissertation of the lead author, F.G. (Firew Getachew), Conceptualization: F.G.; Methodology: F.G..; Formal analysis and investigation: F.G.; Writing—original draft preparation: F.G..; Writing-review and editing: F.G.., A.T (Admassu Tesso), A.H (Ashenafi Haile)., Resources; Supervision: ., A.T., A.H. All authors read and approved the final manuscript.
Funding
This research received no external funding.
Consent for Publication
All authors have reviewed and approved the final version of this manuscript for publication. They confirm that this work has not been published previously and is not under consideration for publication elsewhere.
Ethics Approval
This research does not involve any animal studies and the authors declare no conflicts of interest.
Informed Consent Statement
Informed consent was obtained from all subjects involved in the study.
Data Availability Statement
The original contributions presented in the study are included in the article; further inquiries can be directed to the corresponding author.
Conflicts of Interest
The authors declare no conflict of interest.
Abbreviations
The following abbreviations are used in this manuscript:
| ACC | Agricultural Commercialization Cluster |
| ATT | Average Treatment effect on Treated |
| ATU | Average Treatment effect on untreated |
| TH | Transitional Heterogeneity effect |
| ESR | Endogenous Switching Regression |
| SDI | Simpson Diversity Index |
| FIML | Full Information Maximum Likelihood |
References
- Abebe, T., Chalchisa, T., & Eneyew, A. (2021). The Impact of Rural Livelihood Diversification on Household Poverty: Evidence from Jimma Zone, Oromia National Regional State, Southwest Ethiopia. Scientific World Journal, 2021. [CrossRef]
- Abera, A., Yirgu, T., & Uncha, A. (2021). Determinants of rural livelihood diversification strategies among Chewaka resettlers’ communities of southwestern Ethiopia. Agriculture and Food Security, 10(1), 1–19. [CrossRef]
- Adem, M., & Tesafa, F. (2020). Intensity of income diversification among small-holder farmers in Asayita Woreda, Afar Region, Ethiopia. Cogent Economics and Finance, 8(1). [CrossRef]
- African Union. (2015). Report of the Commission on the African Union Agenda 2063. 5(Xxiv), 4–6. www.au.int.
- Ahmad, T. I., Nawaz, M. A., Bhatti, M. A., & Hussain, A. (2019). Livelihood Assets and Livestock Income: A Case of Mixed Farming Punjab-Pakistan. AgBioForum, 21(3), 15–22.
- Akudugu, M. A., Millar, K. K. N. D., & Akuriba, M. A. (2021). The livelihoods impacts of irrigation in western africa: The ghana experience. Sustainability (Switzerland), 13(10), 1–13. [CrossRef]
- Alemu, F. M. (2023). Measuring the intensity of rural livelihood diversification strategies, and Its impacts on rural households’ welfare: Evidence from South Gondar zone, Amahara Regional State, Ethiopia. MethodsX, 10(October 2022), 102191. [CrossRef]
- Asfir, S. S. (2016). Determinants of Rural Households Livelihood Strategies: Evidence from Western Ethiopia. Journal of Economics and Sustainable Development, 7(15), 103–109. www.iiste.org.
- Aweke, A., Tefera, T., Gezahegn, M., & Sileshi, M. (2023). Determinants of Household Choice of Livelihood Diversification Strategies in Selected Drought Prone Areas of the Southern Nations Nationalities and Peoples’ Region, Ethiopia. Agricultural Sciences, 14(10), 1375–1392. [CrossRef]
- Baharu, G. (2016). The Effect of Livelihood Diversification on Household Income: Evidence from Rural Ethiopia. International Journal of African and Asian Studies, 20, 1–12.
- Bauchi, F. P., & State, B. (2025). Impact of Constructing Roads in Rural Areas on Livelihood and Agricultural Development in Bauchi State. 11(2), 125–138. [CrossRef]
- Danso-Abbeam, G., Dagunga, G., & Ehiakpor, D. S. (2020). Rural non-farm income diversification: implications on smallholder farmers’ welfare and agricultural technology adoption in Ghana. Heliyon, 6(11). [CrossRef]
- Das, V. K., & Ganesh-Kumar, A. (2018). Farm size, livelihood diversification and farmer’s income in India. Decision, 45(2), 185–201. [CrossRef]
- Dinku, A. M. (2018). Determinants of livelihood diversification strategies in Borena pastoralist communities of Oromia regional state, Ethiopia. Agriculture and Food Security, 7(1), 1–8. [CrossRef]
- Dureti, G. G., Tabe-Ojong, M. P., & Owusu-Sekyere, E. (2023). The new normal? Cluster farming and smallholder commercialization in Ethiopia. Agricultural Economics (United Kingdom), 54(6), 900–920. [CrossRef]
- FDRE Planning and Development Commission. (2021). Ten Years Development Plan: A Pathway to Prosperity. Ten Years Development Plan: A Pathway to Prosperity, 2(ten years development plan.), 86.
- Gebru, G. W., Ichoku, H. E., & Phil-Eze, P. O. (2018). Determinants of livelihood diversification strategies in Eastern Tigray Region of Ethiopia. Agriculture and Food Security, 7(1), 1–9. [CrossRef]
- Gidelew, G. E., Alemu, B. A., & Kassie, K. E. (2025a). Assessing the impact of cluster farming on multidimensional food security : Evidence from rural households in Northwestern Ethiopia. Journal of Agriculture and Food Research, 19(December 2024), 101620. [CrossRef]
- Gidelew, G. E., Alemu, B. A., & Kassie, K. E. (2025b). The impact of cluster farming on multidimensional poverty reduction : evidence from Northwestern Ethiopia.
- Gomez y Paloma, S., Riesgo, L., & Louhichi, K. (2020). The Role of Smallholder Farms in Food and Nutrition Security. In The Role of Smallholder Farms in Food and Nutrition Security. Springer International Publishing. [CrossRef]
- Governors, H., Fund, I., Development, A., Meeting, G., Decade, U. N., Farming, F., Development, S., Declaration, U. N., Areas, R., Assembly, U. N. G., Change, C., States, I. M., Board, I. E., Forum, F., Hub, S., & Directors, I. C. (2020). Statement of the 2020 Farmers ’ Forum to the IFAD Governing Council. 1–4.
- Habib, N., Ariyawardana, A., & Aziz, A. A. (2023). The influence and impact of livelihood capitals on livelihood diversification strategies in developing countries: a systematic literature review. Environmental Science and Pollution Research, 30(27), 69882–69898. [CrossRef]
- Habib, N., Rankin, P., Alauddin, M., & Cramb, R. (2023). Determinants of livelihood diversification in rural rain-fed region of Pakistan: evidence from fractional multinomial logit (FMLOGIT) estimation. Environmental Science and Pollution Research, 30(5), 13185–13196. [CrossRef]
- Hasnip, N., Angood, C., Chancellor, F., Morrison, J., & Smith, L. (2002). Contribution of irrigation to sustaining rural livelihoods: Nepal case study. HR Wallingford, March, 84. https://www.idrc.ca/en/research-in-action/improving-irrigation-smallholder-farmers-mozambique.
- Kamara, A., Conteh, A., Rhodes, E. R., & Cooke, R. A. (2019). The relevance of smallholder farming to african agricultural growth and development. African Journal of Food, Agriculture, Nutrition and Development, 19(1), 14043–14065. [CrossRef]
- Kassegn, A., & Abdinasir, U. (2023). Determinants of rural households’ livelihood diversification strategies: In the case of north Wollo zone, Amhara National Regional State, Ethiopia. Cogent Economics and Finance, 11(1). [CrossRef]
- Khan, W., Tabassum, S., & Ansari, S. A. (2017). Can Diversification of Livelihood Sources Increase Income of Farm Households? — A Case Study in Uttar Pradesh. Agricultural Economics Research Review, 30(conf), 27. [CrossRef]
- Kolog, J. D., Asem, F. E., Mensah-Bonsu, A., & Atinga, R. A. (2024). Determinants of livelihood diversification in an integrated agricultural and non-agricultural livelihood system in Ghana. Scientific African, 26(August), e02413. [CrossRef]
- Kuwornu, J. K. M., &. M. D. (2014). Farm Householdsâ€TM Livelihood Diversification into Agro-processing and Non-agro-processing Activities: Empirical Evidence from Ghana. Information Management and Business Review, 6(4), 191–199. [CrossRef]
- Lijalem Abebaw, Birru, W. T., & Alemu, D. (2023). Determinants of Commercializing Crop Outputs of Smallholder Farmers in West Gojjam. East African Journal of Sciences, 17(I), 19–32.
- Linderhof, V., Janssen, V., & Achterbosch, T. (2019). Does agricultural commercialization affect food security: The case of crop-producing households in the regions of Post-Reform Vietnam? Sustainability (Switzerland), 11(5). [CrossRef]
- Manjur, K. (2018). Crop commercialization and smallholder farmer’s livelihood in Tigray region. 7(9), 314–322. [CrossRef]
- Mbewana, V., & Kaseeram, I. (2024a). The determinants of livelihood diversification among small-scale rural farmers in Alfred Nzo and King Cetshwayo District, South Africa. Cogent Economics and Finance, 12(1). [CrossRef]
- Mbewana, V., & Kaseeram, I. (2024b). The determinants of livelihood diversification among small-scale rural farmers in Alfred Nzo and King Cetshwayo District, South Africa. Cogent Economics & Finance, 12(1). [CrossRef]
- Mei, X. (2022). Rural Road Can Improve Farmers ’ Livelihoods. 4–5. [CrossRef]
- Meja, M. (2022). Impact of Agricultural Inputs Use on Productivity of Major Crops in Southern Ethiopia. Research Square, September(October), 0–30. [CrossRef]
- Mikou, M., Rozenberg, J., Koks, E., Fox, C., & Peralta Quiros, T. (2019). Assessing Rural Accessibility and Rural Roads Investment Needs Using Open Source Data. Assessing Rural Accessibility and Rural Roads Investment Needs Using Open Source Data, February. [CrossRef]
- MOA. (2024). Federal Democratic Republic of Ethiopia - Agriculture and Rural Development Policy. 15–17.
- Muricho, G., Kassie, A., & Obare, G. (2015). Determinants of Market Participation Regimes among Smallholder Maize Producers in Kenya. International Conference of Agricultural Economists, 1–20. https://ageconsearch.umn.edu/record/212515/files/Muricho-Determinants of Market Participation Regimes among Smallholder Maize Producers-731.pdf.
- Neme, A. A., & Tefera, T. L. (2021). a Review on Commercialization of Smallholder Agricultural Producers and Its Impacts on Household Livelihoods. Evidence From Ethiopia Context. Journal of Agribusiness and Rural Development, 59(1). [CrossRef]
- Ongachi, W., & Belinder, I. (2025). Agricultural extension as a pathway to livelihood diversification and sustainable development in rural communities: a systematic review. BMC Agriculture, 1(1), 1–14. [CrossRef]
- Paul Jr Tabe-Ojong, M., Mausch, K., Paul Tabe Ojong, M. J., & Hauser, M. (2021). Article in The Journal of Development Studies · February 2022 Agricultural Commercialisation Increase Asset and Livestock Accumulation on Smallholder Farms in Ethiopia. [CrossRef]
- Perosa, B. B., Bicudo da Silva, R. F., & Batistella, M. (2024). Market Access and Agricultural Diversification: An Analysis of Brazilian Municipalities. Land, 13(1), 1–13. [CrossRef]
- Tabe-Ojong, M. P., & Dureti, G. G. (2023). Are agro-clusters pro-poor? Evidence from Ethiopia. Journal of Agricultural Economics, 74(1), 100–115. [CrossRef]
- Tilinti, B., Negash, M., Asfaw, Z., & Woldeamanuel, T. (2025). Homegarden agroforestry practices and their effect on income diversification in Dello Mena and Harena Buluk districts, southeastern Ethiopia. Agroforestry Systems, 99(2), 1–19. [CrossRef]
- Tyenjana, A., & Taruvinga, A. (2019). Determinants of Rural on-Farm Livelihoods Diversification. Journal of Agribusiness and Rural Development, 54(4).
- Vhuyelwani, R., Mudzielwana, A., Mafongoya, P., & Mudhara, M. (2022). An Analysis of Livelihood-Diversification Strategies among Farmworker Households : A Case Study of the Tshiombo. Agriculture, 12, 1866.
- Walsh, P. P., Banerjee, A., & Murphy, E. (2022). The UN 2030 Agenda for Sustainable Development. Sustainable Development Goals Series, Part F2740, 1–12. [CrossRef]
- Wondim, A. K. (2019). Determinants and challenges of rural livelihood diversification in Ethiopia: Qualitative review. Journal of Agricultural Extension and Rural Development, 11(2), 17–24. [CrossRef]
- World Bank. (2022). Building Physical Public Infrastructure. World Bank Annual Report.
Figure 1.
Map of the study area. Source: Developed by the author (2025).
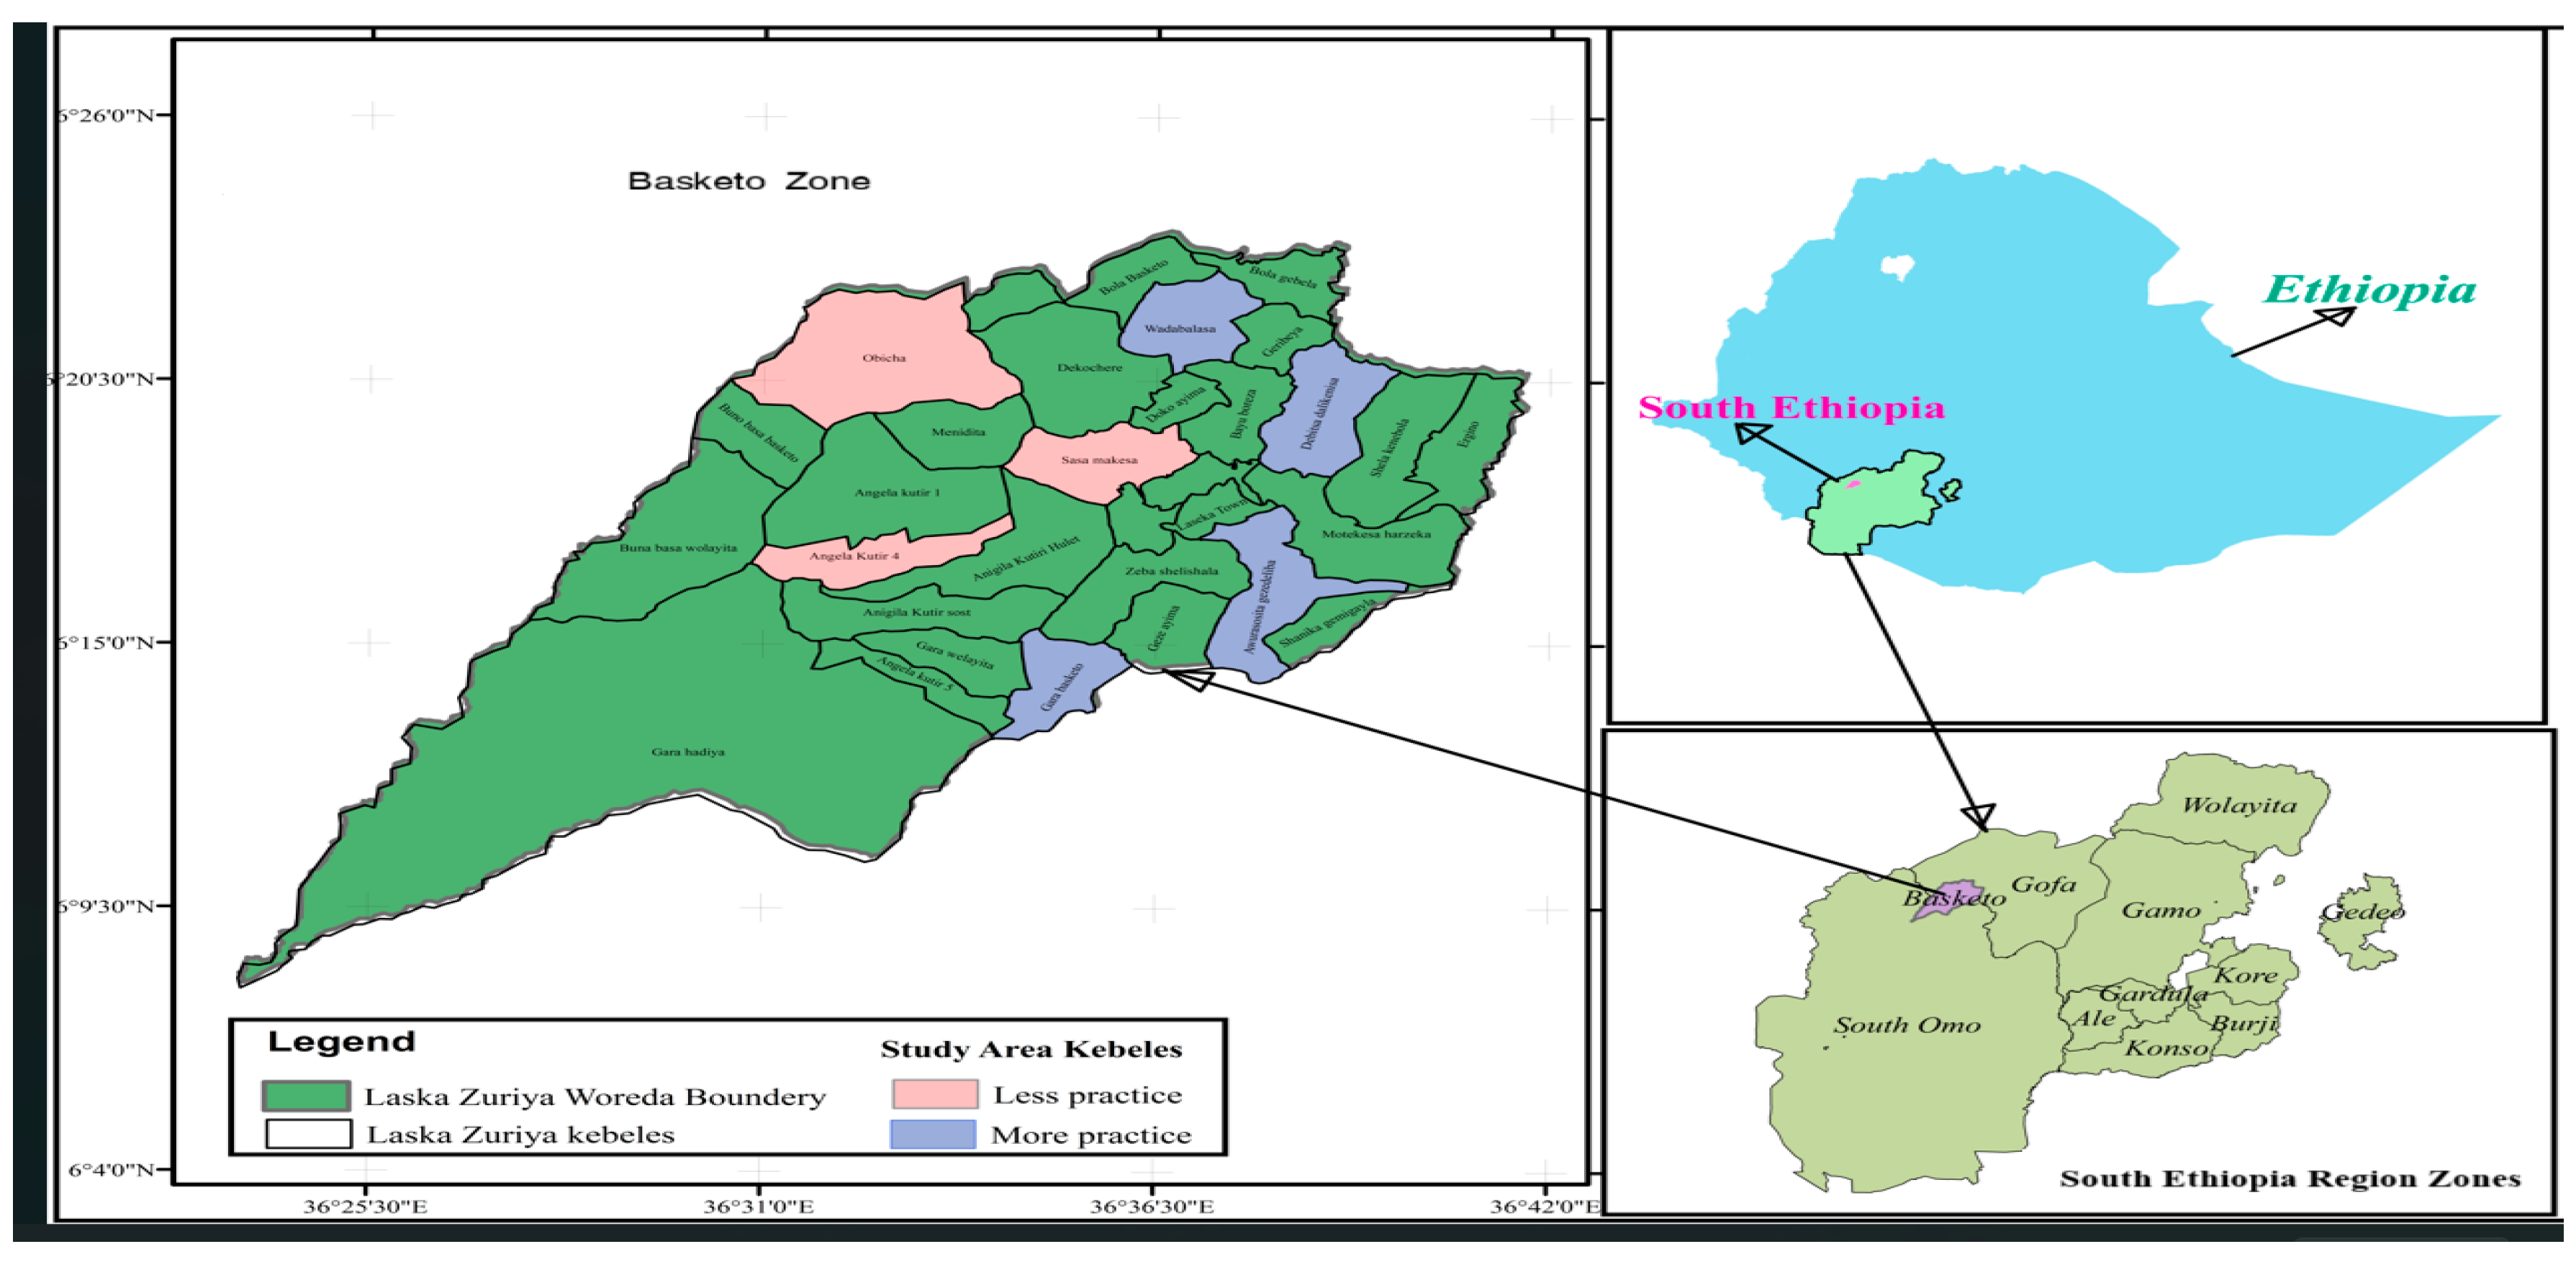
Figure 2.
Income sources of ACC and non-ACC rural households. Source: Computed from our survey data (2025).
Figure 2.
Income sources of ACC and non-ACC rural households. Source: Computed from our survey data (2025).
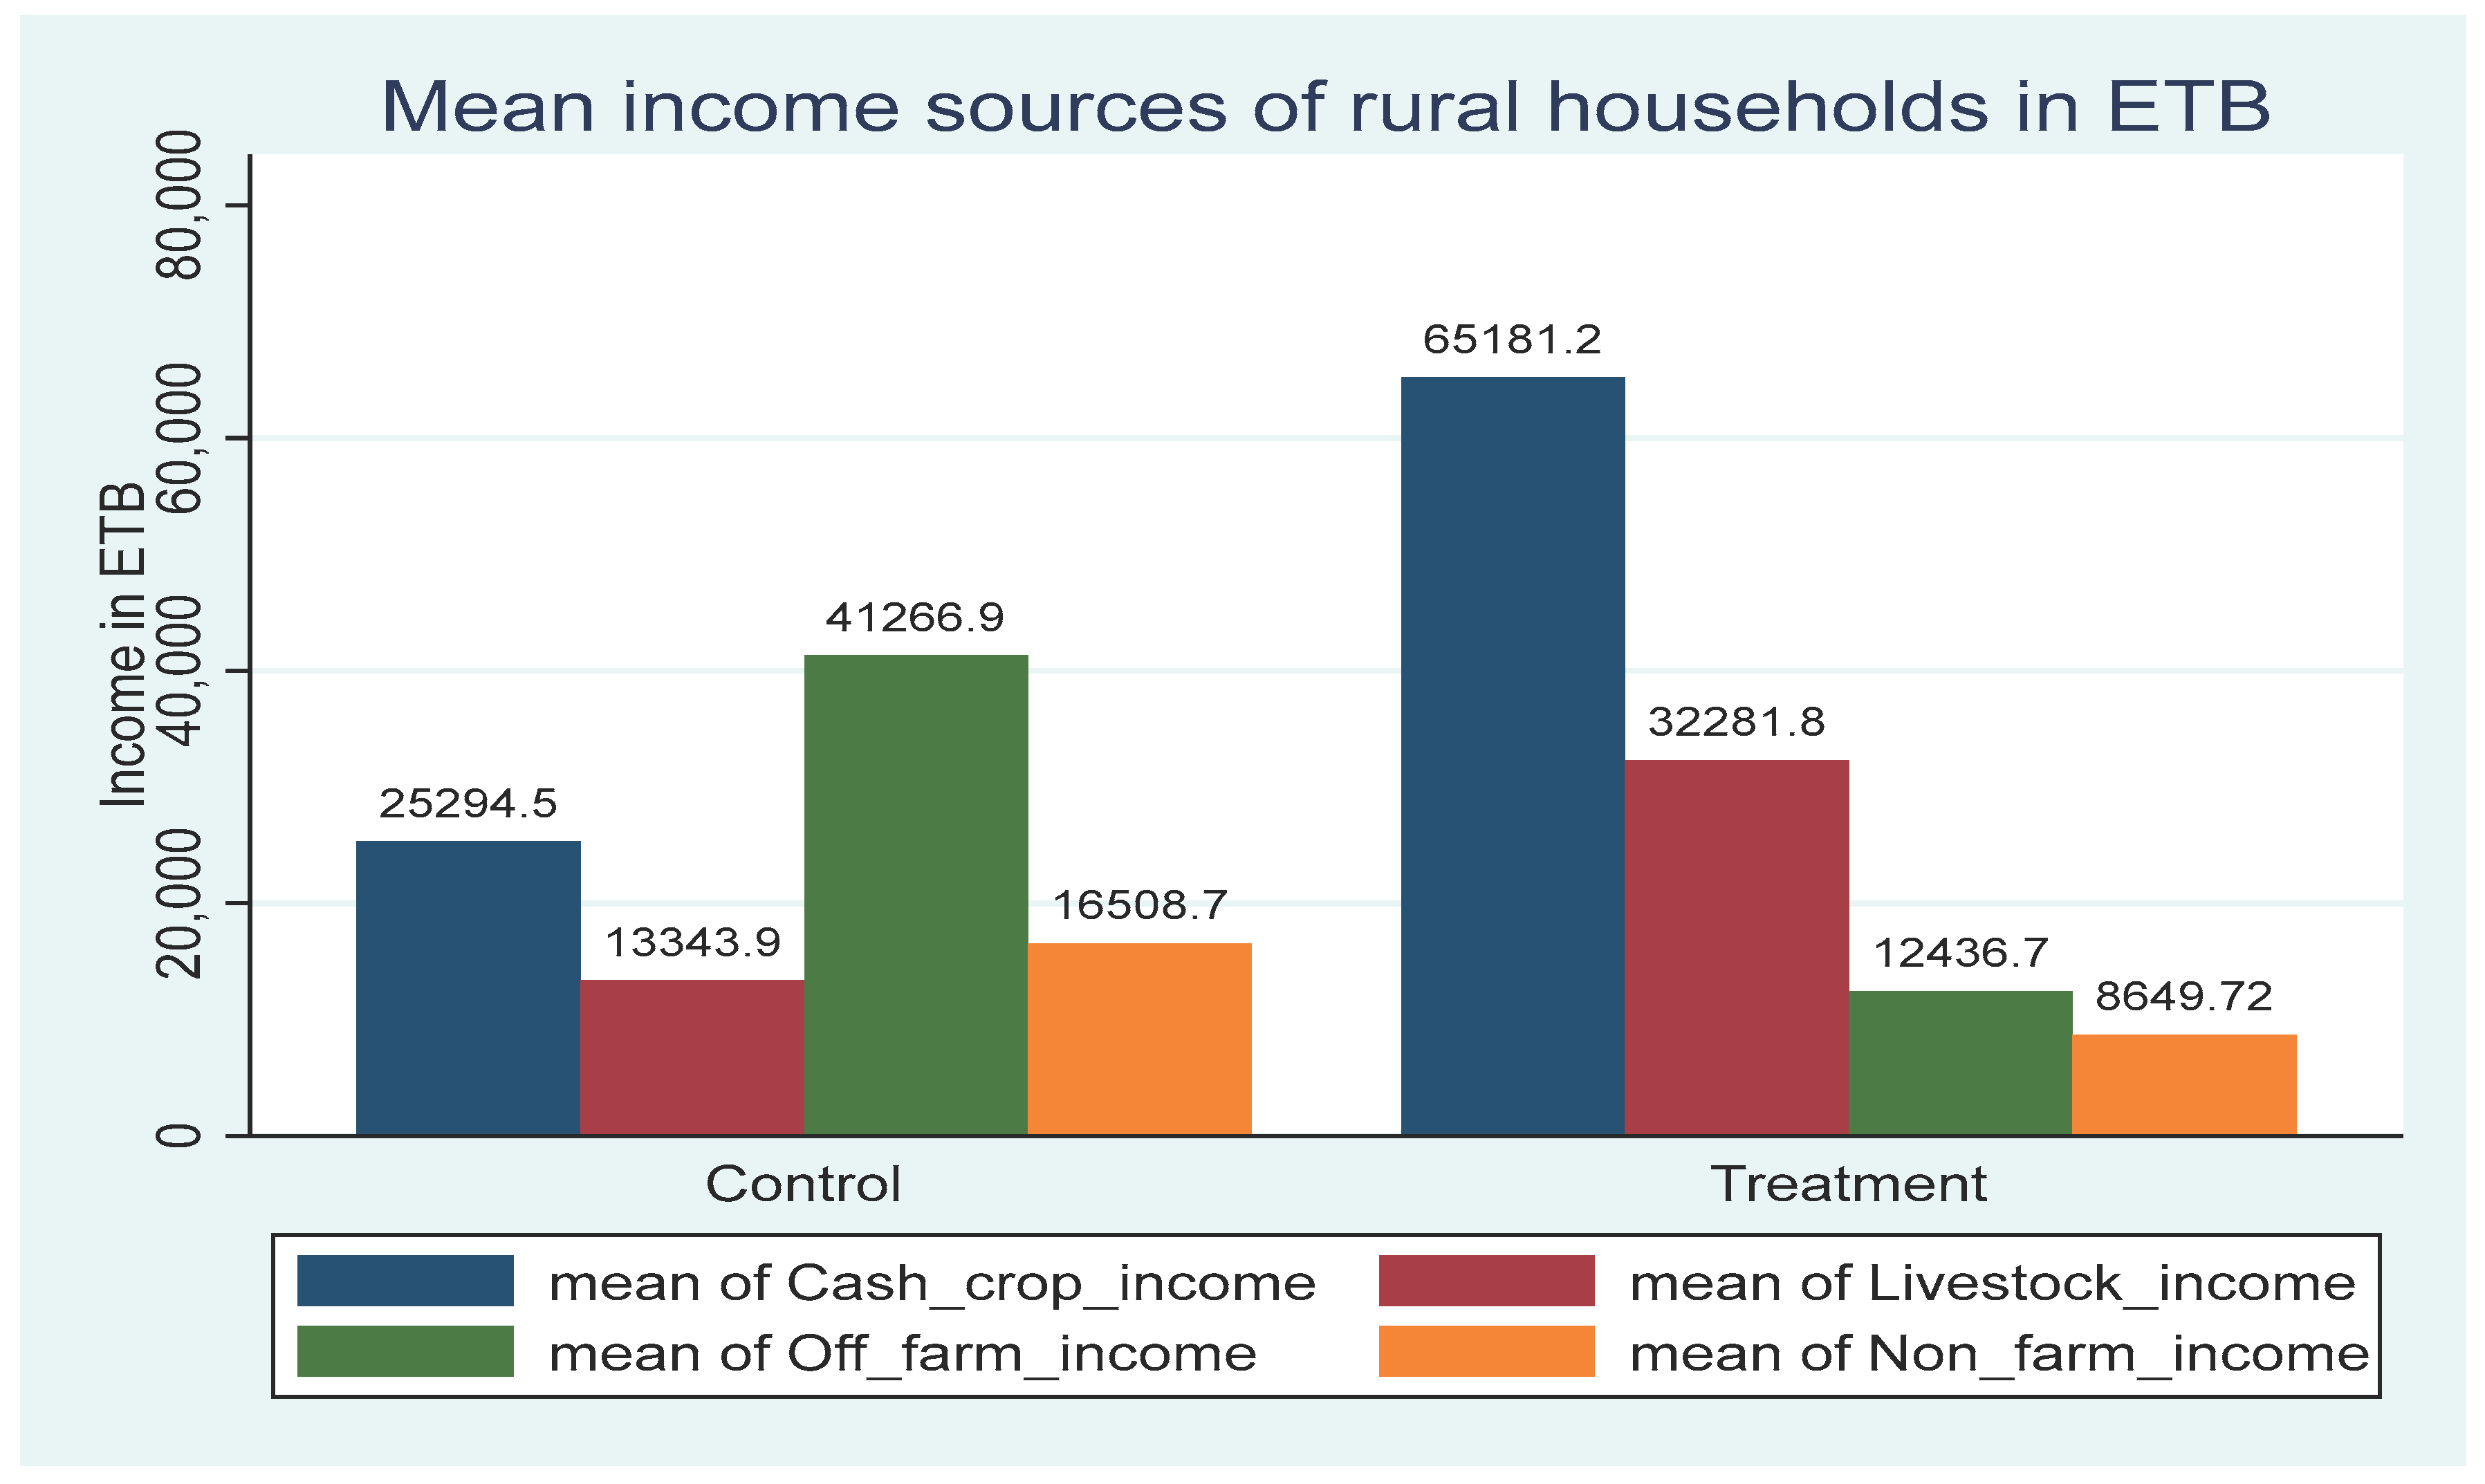

Table 1.
Description and measurement of variables used in ESR.
| Variables | Types | Description |
|---|---|---|
| Dependents variable | ||
| Participate in an ACC |
Dummy | Households that participated in ACC are coded as 1; 0 otherwise. |
| Simpson’s Diversity Index(SDI) | Continues | Composite index computed to measure livelihood diversification |
| Covariates | ||
| Sex of HH | Dummy | Households with a male head are coded 1; 0 otherwise |
| Age HH | Continuous | Household head age in years |
| Education of HH | Dummy | Households with a literate household are coded 1, 0 otherwise |
| Total farmland | Continues | Total farmland size (hectares) |
| Total household | Continues | The total number of family members in the household |
| Access to extension | Dummy | Households with access to extension are coded 1, 0 otherwise |
| Access to training | Dummy | Households with access to training are coded 1; 0 otherwise |
| Distance to nearest office | Continuous | Distance to the nearest kebele agriculture office in hours |
| Access to irrigation | Dummy | Households with access to irrigation are coded 1; 0 otherwise |
| Radio ownership | Dummy | Households with access to radio are coded 1, 0 otherwise |
| Mobile phone ownership | Dummy | Households with a phone to training are coded 1, 0 otherwise |
| Distance to nearest market | Continuous | Distance to nearest market in hours |
| Distance to all-weather road | Continuous | Distance to all weather roads in hours |
| Livestock (TLU) | Continuous | Livestock holdings in tropical livestock unit (TLU) |
| Access to credit | Dummy | Households with access to credit are coded 1, 0 otherwise |
| Cooperative membership | Dummy | Households with a member of a cooperative are coded 1; 0 otherwise |
Table 2.
Descriptive statistics results for continuous variables.
| Characteristics | ACC Participation | Total | t value | ||||
|---|---|---|---|---|---|---|---|
| ACC | NACC | ||||||
| (n=177) | (n=178) | (n=355) | |||||
| Mean | Std | Mean | Std | Mean | Std | ||
| Age | 33.14 | 5.83 | 41.63 | 5.84 | 37.40 | 7.21 | 13.69*** |
| Farm land (Ha) | 1.65 | .940 | 1.07 | .68 | 1.36 | .870 | -6.63*** |
| Total household | 5.70 | 2.05 | 6.41 | 1.88 | 6.06 | 2.00 | 3.38*** |
| Distance to market(Hr.) | 3.66 | 2.11 | 2.70 | 1.62 | 3.18 | 1.94 | -4.82*** |
| Distance to all weather road(Hr.) | 4.82 | 4.00 | 1.70 | 1.34 | 3.29 | 2.61 | -8.78*** |
| Livestock ownership (TLU) | 9.04 | 4.51 | 4.99 | 4.10 | 7.00 | 4.76 | -8.86*** |
| Distance to Kebele Agri-office(Hr.) | 3.51 | 1.34 | 3.92 | 1.33 | 3.72 | 1.35 | 2.87*** |
Source: Computed from our survey data (2025). *** and ** indicate the level of significance at 1 and 5 percent, respectively.
Table 3.
Descriptive statistics results for dummy variables.
| Variables | Category | ACC Participation | χ2 value (P-value) |
|
|---|---|---|---|---|
| ACC(177) | NACC(178) | |||
| N (%) | N (%) | |||
| Gender | Male | 117(32.96) | 150(42.25) | 0.000 |
| Female | 60(16.90) | 28(7.89) | ||
| Education | Illiterate | 40(11.27) | 113(31.83) | 0.000 |
| Literate | 137(38.59) | 65(18.31) | ||
| Access to extension service | Yes | 106(29.86) | 82(23.10) | 0.007 |
| No | 71(20.00) | 96(27.04) | ||
| Access to training | Yes | 100(28.17) | 71(20.00) | 0.002 |
| No | 77(21.09) | 107(30.14) | ||
| Access to irrigation | Yes | 87(24.51) | 66(18.59) | 0.027 |
| No | 90(25.35) | 112(31.55) | ||
| Radio ownership | Yes | 88(24.79) | 45(12.69) | 0.000 |
| No | 89(25.07) | 133(37.46) | ||
| Mobile ownership | Yes | 110(30.99) | 78(21.97) | 0.002 |
| No | 67(18.87) | 100(28.17) | ||
| Access to credit | Yes | 105(29.58) | 83(23.38) | 0.022 |
| No | 72(20.28) | 95(26.76) | ||
| Cooperative membership | Yes | 119(33.52) | 82(23.10) | 0.000 |
| No | 58(16.34) | 96(27.04) | ||
Source: Computed from our survey data (2025) *** and ** indicate the level of significance at 1 and 5 percent, respectively.
Table 4.
Probit regression results of determinants of the agricultural commercialization cluster.
| Variables | Coef. | St.Err. | p-value |
|---|---|---|---|
| Gender | -.424 | .203 | .037 |
| Age | -.051 | .017 | .002 |
| Education | .998 | .183 | .000 |
| Total land size | .249 | .117 | .034 |
| Total household | .016 | .045 | .726 |
| Access to extension | -.035 | .186 | .852 |
| Access to training | .375 | .182 | .040 |
| Distance to nearest office | -.077 | .066 | .248 |
| Access to irrigation | .364 | .181 | .045 |
| Radio ownership | .003 | .192 | .989 |
| Mobile ownership | .301 | .184 | .102 |
| Distance to the main market | .111 | .047 | .019 |
| Distance to all weather roads | .110 | .028 | .000 |
| Total livestock unit | .069 | .020 | .001 |
| Access to credit | .206 | .194 | .289 |
| Member of a cooperative | -.227 | .203 | .262 |
Source: Computed from our survey data (2025).
Table 5.
Predictors used to estimate the treatment and outcome variable of the endogenous switching regression model.
Table 5.
Predictors used to estimate the treatment and outcome variable of the endogenous switching regression model.
| Variables | Outcome Model | ||
|---|---|---|---|
| Selection model | ACC participant | NACC participant | |
| Gender | -.434(.190)** | -.122(.051)** | .160(0.052)*** |
| Age | -.046(.015)*** | .002(.005) | .005(.004) |
| Education | .868(.169)*** | .174(.061)*** | -.211(.040)*** |
| Total land size | .283(.106)*** | -.048(.027) | -.063(.028)** |
| Total household | .034(.041) | .003(.012) | .007(.010) |
| Access to extension | -.168(.173) | .062(.053) | .127(.040)*** |
| Access to training | .416(.169)** | .057(.050) | -.054(.038) |
| Distance to nearest office | -.063(.06) | -.016(.017) | .015(.014) |
| Access to irrigation | .354(.164)** | -.048(.050) | .074(.038) |
| Radio ownership | .074(.173) | .019(.050) | .007(.043) |
| Mobile ownership | .292(.163) | .031(.050) | .004(.039) |
| Distance to the main market | .058(.043) | .016(.012) | .019(.011) |
| Distance to all weather roads | .114(.026)*** | .013(.007) | .009(.008) |
| Total livestock unit | .051(.019)*** | -.012(.006) | .013(.005)** |
| Access to credit | .237(.168) | .115(.051)** | -.163(.043)*** |
| Member of a cooperative | -.106(.178) | -.024(.056) | .034(.043) |
| Sigma_1 | 0.018 | 0.226 | 0.298 |
| Sigma_2 | 0.025 | 0.277 | 0.376 |
| rho_1 | 0.048 | -0.975 | -0.754 |
| rho_2 | 0.106 | 0.476 | 0.927 |
LR test of indep. eqns. chi2 (1) = 16.36 Prob > chi2 = 0.003, Wald chi2 (16) =92.01, Prob > chi2 = 0.00.
Table 6.
ESR model results of the Impact of ACC on livelihood diversification of rural households.
| Decision stage to ACC | Treatment effect | ||
|---|---|---|---|
| ACC participant | NACC participant | ||
| ACC | a=.642(.011) | c=.531(.015) | ATT=-.111*** |
| NACC | d=.496(.113) | b=.685(.012) | ATU= -.189*** |
| Heterogeneity Effect | BH1= .146 | BH2=-.157 | TH=.303*** |
Source: Computed from our survey data (2025). *** p<.01, ** p<.05, * p<.1.
Disclaimer/Publisher’s Note: The statements, opinions and data contained in all publications are solely those of the individual author(s) and contributor(s) and not of MDPI and/or the editor(s). MDPI and/or the editor(s) disclaim responsibility for any injury to people or property resulting from any ideas, methods, instructions or products referred to in the content. |
© 2026 by the authors. Licensee MDPI, Basel, Switzerland. This article is an open access article distributed under the terms and conditions of the Creative Commons Attribution (CC BY) license (http://creativecommons.org/licenses/by/4.0/).
Copyright: This open access article is published under a Creative Commons CC BY 4.0 license, which permit the free download, distribution, and reuse, provided that the author and preprint are cited in any reuse.


