
Submitted:
11 February 2026
Posted:
12 February 2026
You are already at the latest version
Abstract
This study analyzed the lipid profiles of Hippocampus abdominalis via untargeted lipidomics coupled with enzymatic hydrolysis, and further compared its lipid content, composition, molecular species, and fatty acid positional distribution with those of the currently farmed Hippocampus erectus. Triglyceride (TG) was the dominant lipid class in both species, while H. abdominalis exhibited higher phospholipid (PL) levels, with elevated docosahexaenoic acid (DHA) and eicosapentaenoic acid (EPA) in TG. DHA was evenly distributed at the sn-1,3 and sn-2 positions in H. abdominalis but concentrated at sn-1,3 in H. erectus, whereas EPA localized at sn-1,3 in both species. H. abdominalis also had higher DHA in phosphatidylcholine (PC) and phosphatidylethanolamine (PE) (mainly at sn-1) and abundant alkoxy ether PLs. This work fills research gaps in lipid profiling of these commercially cultured seahorses, characterizing interspecific differences in lipid molecular species and fatty acid positional distribution in key lipids (TG, PC, PE), and provides a fundamental basis for seahorse species identification and functional lipid development.
Keywords:
the farmed seahorse
; lipid profile
; untargeted lipidomics
; fatty acid positional distribution
; Hippocampus abdominalis
1. Introduction
Seahorses are rare marine bony fishes with substantial culinary and medicinal potential [1,2]. Currently, seahorses in major Asian regions are primarily traded as traditional medicinal materials, while a small fraction are marketed as ornamental marine fishes [3]. Accordingly, aquaculture has emerged as a crucial solution to meet the edible and medicinal demand for seahorses [4]. Notably, Hippocampus abdominalis and H. erectus have been commercially cultivated on a global scale [5,6].
Numerous studies have demonstrated that seahorses not only contain beneficial nutrients such as proteins and minerals [7,8] but also rich in unsaturated fatty acids [9,10], including omega-3 long-chain unsaturated fatty acids such as docosahexaenoic acid (DHA, 22:6n-3) and eicosapentaenoic acid (EPA, 20:5n-3) [11]. These compounds exhibit significant biological activities in combating cardiovascular and cerebrovascular diseases as well as neurodegenerative disorders [12]. To date, there have been literature reports on the lipid profiles of H. erectus [13], while no literature has yet reported the lipid profiles of H. abdominalis that has been successfully cultivated on a large scale. Thus, the analysis of H. abdominalis lipid profiles and the comparison with those of other seahorse species have become an urgent issue to address.
Notably, current lipid analysis of seahorse has primarily focused on lipid profiling, with few studies investigating the fatty acid positional distribution of their major molecular species. Importantly, the positional structure of triglyceride (TG) and phospholipid (PL) can affect the in vivo absorption and metabolism of lipids, which in turn influences their biological activity and function [14,15]. Furthermore, the enzymatic method is the most effective and rapid approach for identifying the structure of common lipid molecules [16]. Thus, identifying the fatty acid positional distribution of major lipids in seahorses is also a key topic in seahorse lipid analysis.
In this study, an analytical strategy integrating untargeted lipidomics and immobilized enzyme hydrolysis was used to systematically characterize the lipid profiles and the fatty acid positional distribution of major lipid molecular species in two major cultured seahorse species, Hippocampus abdominalis and Hippocampus erectus. By examining interspecific differences in lipid content, composition, and structure, this research fills a vital knowledge gap on seahorse nutrition and enables a deeper understanding of their health functions and reliable lipid profiling.
2. Materials and Methods
2.1. Materials
Two seahorse species, designated as Hippocampus abdominalis and H. erectus respectively, were donated by Weihai Yinze Biotechnology Co., Ltd., a Convention on International Trade in Endangered Species of Wild Fauna and Flora (CITES) and national aquatic wildlife protection law-compliant facility licensed for large-scale seahorse artificial breeding. The seahorses used in our research are in full compliance with the basic principles specified for seahorses intended for scientific research purposes under CITES Appendix II. Rearing conditions for both species were strictly standardized and monitored, including dissolved gas concentrations, light intensity, water temperature, and tank hygiene. The Juveniles were fed Artemia nauplii, while adults were given a diet of opossum shrimp. Upon maturity, 100 individuals of each species (1:1 male-to-female ratio, which is consistent with the roughly equal proportion of males to females in consumption, as well as the typical ratio observed under aquaculture conditions.) were randomly sampled from separate same-batch culture tanks. Following guidelines approved by the Institutional Animal Care and Use Committee (IACUC), seahorses were humanely euthanized via overdose anesthesia with tricaine methanesulfonate (MS-222). Euthanized specimens were rinsed thoroughly with 0.22 μm-filtered seawater to remove surface mucus and exogenous impurities, then blotted dry. Each seahorse species was further assigned to three subgroups and subjected to frozen transportation at –20 °C to the laboratory. Subsequently, the samples were freeze-dried with a Scientz-18N freeze dryer (Ningbo Xinzhi Co., Ltd., China), ground into a fine powder, and processed for subsequent lipid extraction and analysis.
2.2. Reagents
Chloroform, methanol, hydrochloric acid, and sodium hydroxide used in this study were all of reagent grade and purchased from Sinopharm Chemical Reagent Co., Ltd. (Shanghai, China). n-Hexane, isopropanol, acetonitrile, and ammonium formate were of chromatographic grade and purchased from Sigma-Aldrich (St. Louis, Missouri, USA). Thin-layer chromatography (TLC) silica gel plates were provided by Yantai Huayang New Material Technology Co., Ltd. (Yantai, China), and the triglyceride (TG) assay kit (Cat. No.: A020-1-1) was purchased from Nanjing Jiancheng Bioengineering Institute (Nanjing, China).
2.3. Lipid Extraction and Purification
The extraction of total lipids from seahorses was performed with appropriate modifications based on the Folch method [17]. Briefly, a specified mass of dried H. abdominalis and H. erectus powder was mixed with 10 volumes (m/v) of extraction solvent (chloroform: methanol = 2:1, v/v), respectively. Butylated hydroxyanisole (BHA) was added to the chloroform-methanol extraction solution at a concentration of 100 μg/mL to prevent lipid oxidation. After multiple processing steps, the lower organic phase was collected and concentrated under reduced pressure to remove organic solvents, yielding total seahorse lipids. Subsequently, column chromatography was performed to isolate the triglyceride (TG), phosphatidylcholine (PC), and phosphatidylethanolamine (PE) fractions. Specifically, 10 g of total lipids were loaded onto a silica gel column (packed with 60 g of silica gel; internal diameter = 2 cm). Pure dichloromethane was initially adopted as the eluent, and triglycerides eluted at the third column volume (CV). The eluted fractions were subsequently identified via thin-layer chromatography (TLC). After the complete collection of all neutral lipid fractions, phospholipid components were eluted using a dichloromethane/methanol mixture (5:1, v/v), from which phosphatidylethanolamine (PE) and phosphatidylcholine (PC) were sequentially isolated. The purities of all the aforementioned substances, as determined by an Evaporative Light Scattering Detector (ELSD), were all above 90%. These samples were then frozen and stored at -20 °C for subsequent analysis.
2.4. Analysis of Fatty Acid Compositions
TG were quantified using a commercial assay kit (Cat. No. A020-1-1, Nanjing Jiancheng Bioengineering Institute). Phospholipids (PL) were determined via the molybdenum blue colorimetric method [18]. Briefly, sample solutions were prepared with chloroform-methanol (2:1, v/v) as the solvent, followed by digestion with perchloric acid. The inorganic phosphorus content in the samples was then measured, and phospholipid content was calculated by multiplying the measured inorganic phosphorus content by a conversion factor of 25.
The total lipids, as well as the samples separated by silica gel column chromatography, were individually placed into methylation reagents (hydrochloric acid: methanol = 1:5, v/v), homogenized, and reacted in a metal bath at 90 °C for 3 hours, with homogenization performed every 30 minutes during the reaction. After cooling, n-hexane was added for extraction. Once the mixture was allowed to stand and separate into layers, 1 mL of the supernatant was collected and dried by nitrogen blowing. The dried sample was then re-dissolved in 50 μL of n-hexane and used for subsequent gas chromatography analysis [19].
The GC system was set as follows: An Agilent 7820A Gas Chromatograph with a capillary column (AE. FFAP; 30 m × 0.32 mm × 0.25 μm film thickness); The gas chromatography detector employed was a Flame Ionization Detector (FID). The detector and injector temperatures were maintained at 250 °C and 240 °C, respectively. The column temperature program was programmed as follows: initial temperature of 170 °C, ramped up to 240 °C at a rate of 3 °C/min, and then held isothermally at 240 °C for 35 minutes. High-purity nitrogen was used as the carrier gas, with a constant flow rate of 1.0 mL/min. The total runtime for a single sample analysis was 48.5 minutes [20].
2.5. Ultra High Performance Liquid Chromatography-Tandem Mass Spectrometry (UPLC-MS) Analysis
For lipid profile analysis, a high-resolution orbitrap mass spectrometer (UPLC-Q-Orbitrap) coupled with an ACQUITY UPLC BEH C18 column (2.1 mm × 100 mm, 1.7 μm) was used. The system included a UPLC module from Waters Corporation (Milford, Massachusetts, USA) and an electrospray ionization (ESI) source from Thermo Fisher Scientific (Waltham, Massachusetts, USA). Mobile phase A consisted of acetonitrile/water (60:40, v/v) containing 10 mmol/L ammonium formate, and mobile phase B was isopropanol/acetonitrile (90:10, v/v). The gradient elution program was as follows: initial conditions (100% A); linear increase to 32% B over 1.5 min; further increase to 85% B by 15.5 min; rapid ramp to 97% B within 0.1 min, held for 2.4 min; then decreased to 32% B within 0.1 min, held for 1.9 min. Curtain Gas (Cur) was set to 35 psi; the flow rates of both Gas 1 (GS1) and Gas 2 (GS2) were configured to 55 psi; Ion Source Voltage/Float (ISVF) was adjusted to 5500/-4500 V; Ion Source Temperature (TEM) was maintained at 350 °C; Declustering Potential (DP) was set to 80 V; Entrance Potential (EP) was set to 10 V; and Collision Cell Exit Potential (CXP) was set to 15 V. Quantitative analysis of total ion current (TIC) chromatograms was performed using Lipid Search Launcher 4.2.21 software (Thermo Fisher Scientific) [21].
2.6. Determination of Fatty Acid Positional Distribution
To determine the positional distribution of fatty acids in TG, PC and PE, 2 mg of the sample was placed into each centrifuge tube separately. Then 40 mL of 95% ethanol was added, followed by the addition of Novozym 435 lipase. The hydrolysis was terminated after 12 hours of reaction, followed by the separation of immobilized enzymes from enzymatic hydrolysates. The resulting mixture was heated at 95 °C for 10 minutes under a nitrogen atmosphere to inactivate residual enzyme activity, and then dried and concentrated in a nitrogen environment prior to high-performance thin-layer chromatography (TLC) separation. The TG enzymatic hydrolysates were treated by the solvent system of petroleum ether, diethyl ether and acetic acid at a volume ratio of 85:15:1 (v/v/v), and TG (Rf=0.87) and MG (Rf=0.25) were obtained. The PC and PE enzymatic hydrolysates were treated by the solvent system of chloroform, methanol and water at a volume ratio of 65:25:4 (v/v/v), respectively, and PC (Rf=0.56), PE (Rf=0.84), LPC (Rf=0.27) and LPE (Rf = 0.33) were obtained. Finally, the target bands were scraped off and subjected to fatty acid composition analysis.
2.7. Statistical Analysis
Triplicate experiments were conducted for both the quantitative analysis of lipid molecules and the determination of lipid class composition, while triplicate measurements were performed for fatty acid component analysis. All data in the figures are expressed as the mean ± standard error of the mean (SEM). Statistical analysis was performed using one-way analysis of variance (ANOVA), followed by Tukey’s post-hoc test to identify significant differences between groups. Differences were considered statistically significant at p < 0.05 and marked with different letters. Orthogonal Partial Least Squares-Discriminant Analysis (OPLS-DA), heatmap analysis, and volcano plot generation were carried out using the free online data analysis platform Metware Cloud (https://cloud.metware.cn).
3. Results
3.1. Lipid Content and Lipid Class Composition
As shown in Supplementary Figure S1, the lipid extraction yield of H. abdominalis (76.4 mg/g dry weight) was higher than that of H. erectus (69.1 mg/g dry weight), indicating that H. abdominalis exhibited a higher lipid content. The fatty acid content of the total lipids of Hippocampus abdominalis and Hippocampus erectus were analyzed using gas chromatography (GC) through comparison with the mixed standard chromatogram (Figure. S2), with the results summarized in Table 1. For H. abdominalis, 16 fatty acids with carbon chain lengths ranging from C14 to C22 were identified, with major components including C16:0, C16:1, C18:0, C18:1, C20:5n-3 (EPA), and C22:6n-3 (DHA). Saturated fatty acids (SFA) accounted for 38.9% of its total lipids (predominantly C16:0 at 23.1%, C18:0 at 9.6%,and C14:0 at 3.6%), while 10 unsaturated fatty acid (UFA) species contributed 61.1% (monounsaturated fatty acids (MUFA) at 29.9%, mainly C18:1 at 20.8% and C16:1 at 7.4%;
Figure 1.
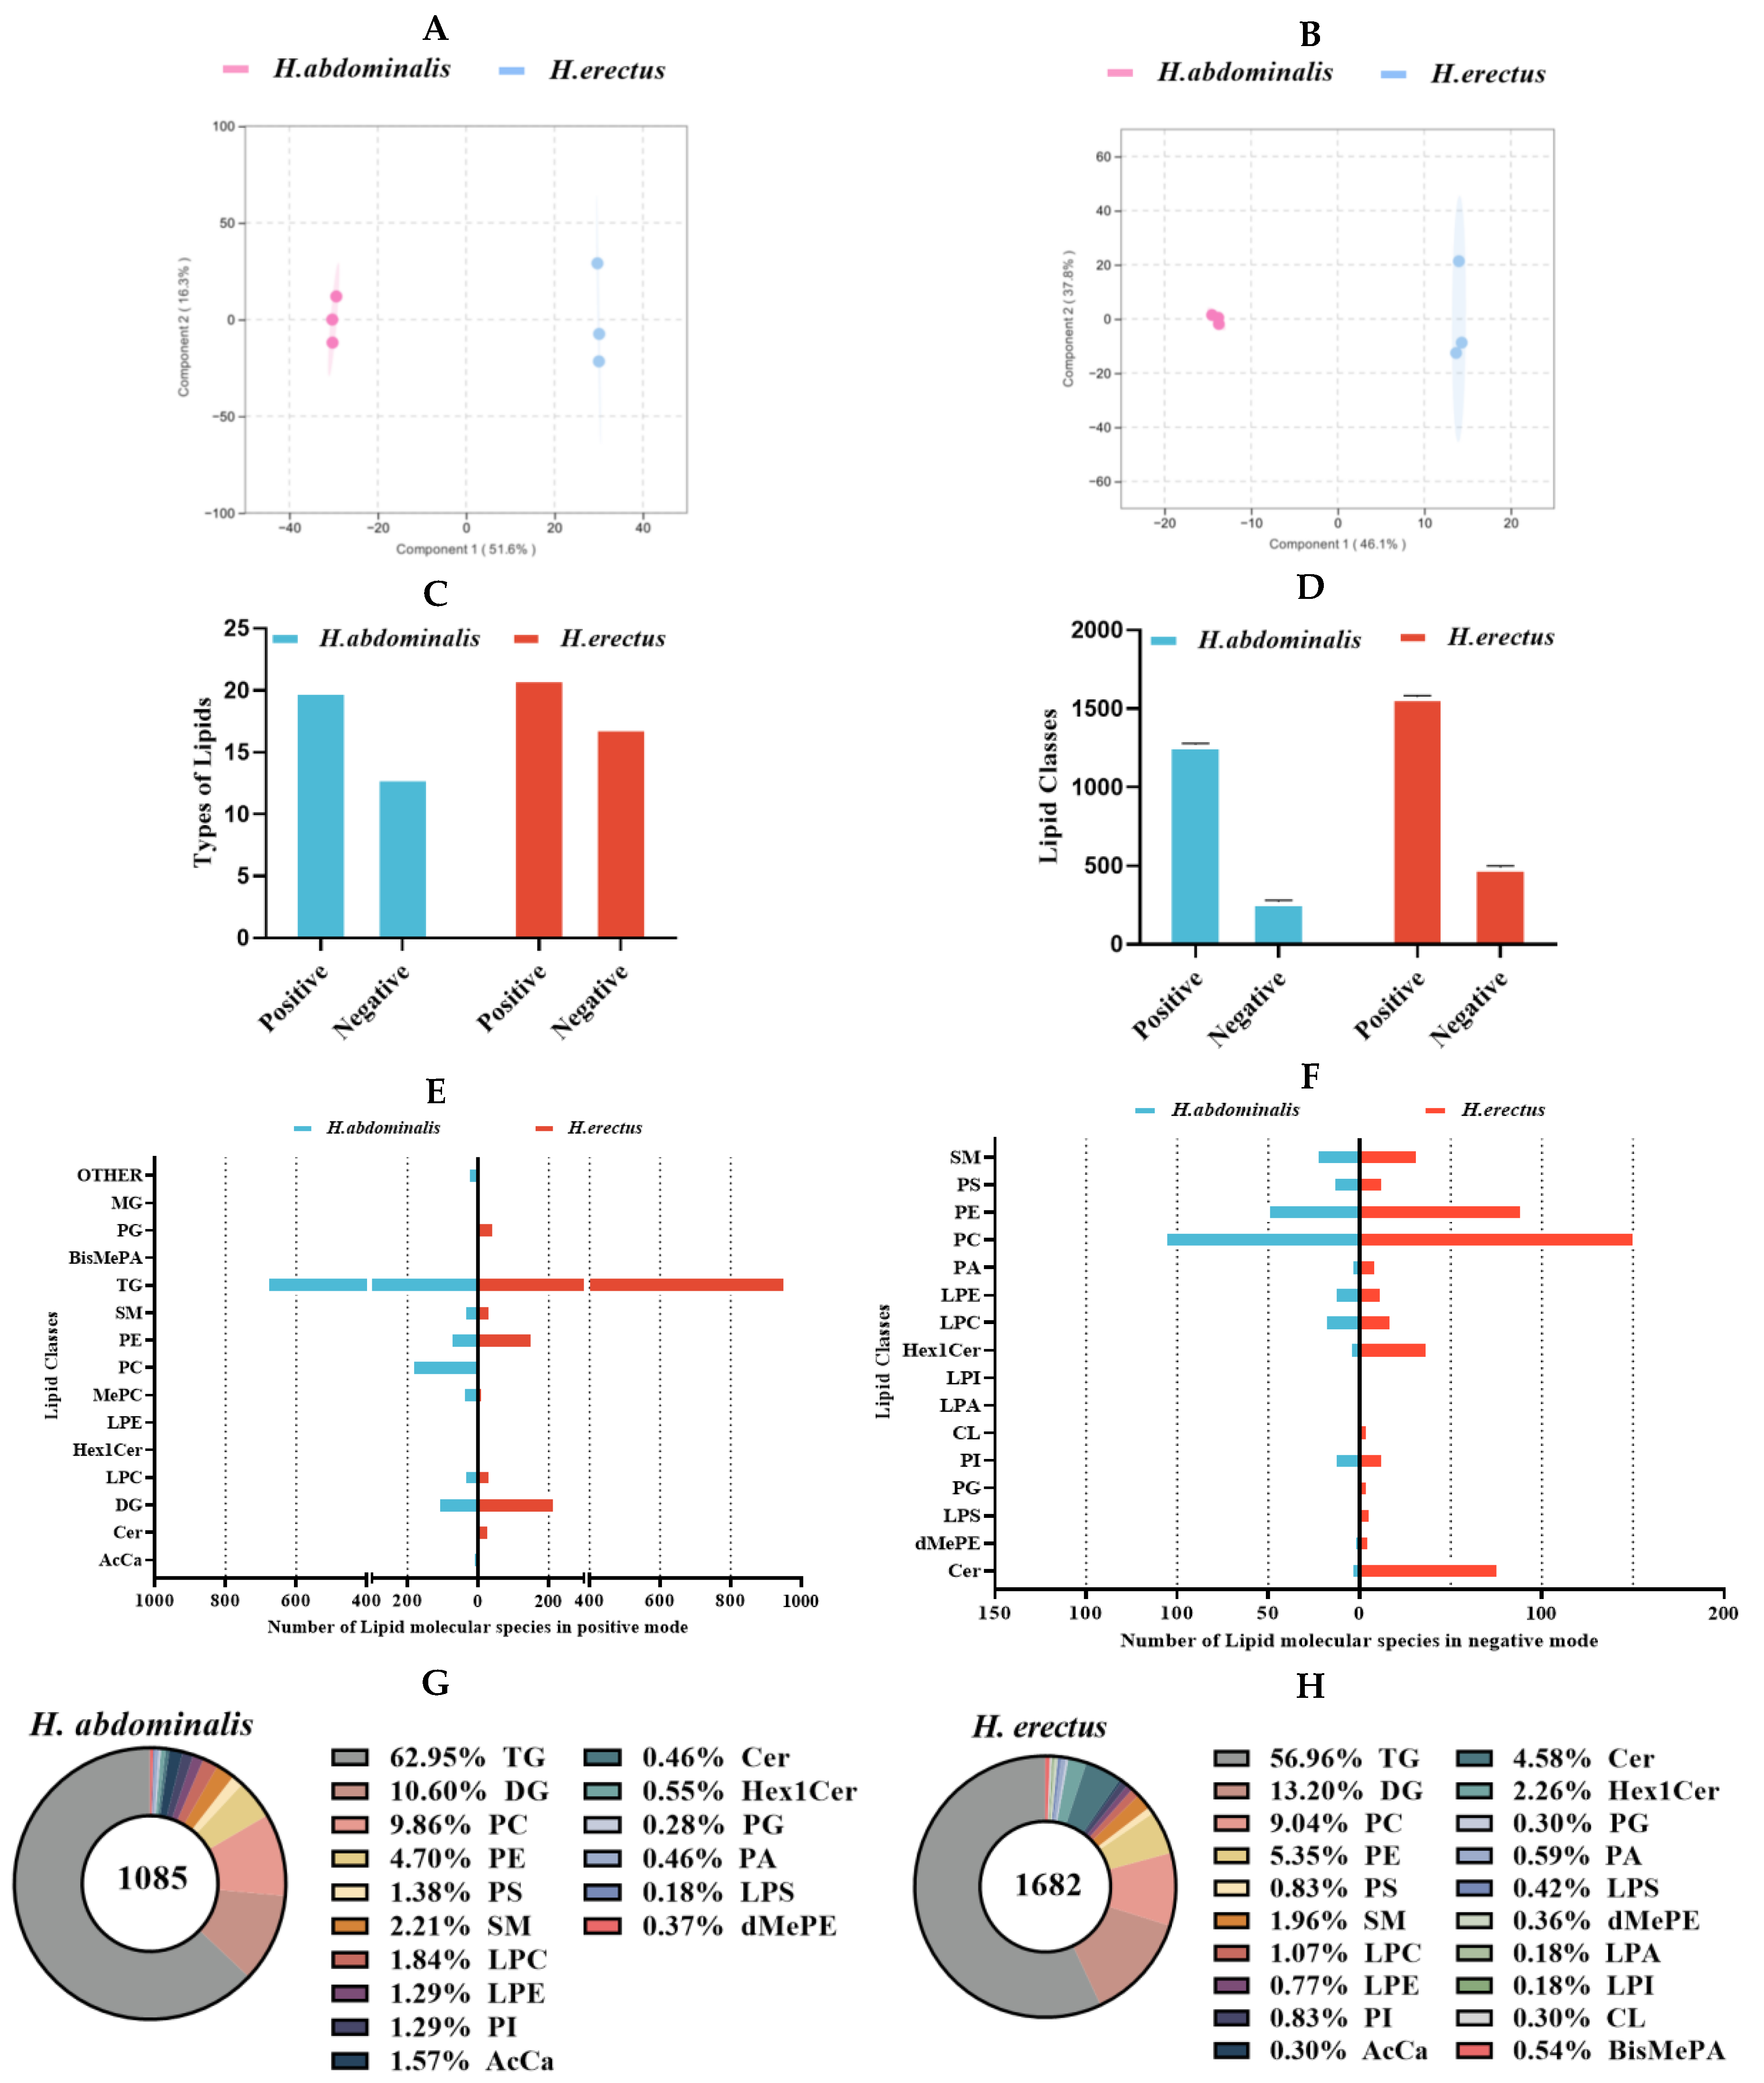
Orthogonal Partial Least Squares-Discriminant Analysis (OPLS-DA) of lipidomics data from H. abdominalis and H. erectus in positive mode (A) and negative mode (B); Types of lipids (C) and number of lipid classes (D) of the two Hippocampus species under different ion modes; Number of lipid molecules in different lipid classes in positive mode lipidomics (E) and negative mode lipidomics (F); The lipid classes and the relative ratio of lipid species number in H. abdominalis (G) and H. erectus (H). BisMePA for Bis(methoxyethyl)phosphatidylethanolamine, Cer for Ceramide, CL for Cardiolipin, dMePE for Dimethylethanolamine Phosphatidylethanolamine, Hex1Cer for Monoglucosylceramide, LPA for Lysophosphatidic Acid, LPC for Lysophosphatidylcholine, LPE for Lysophosphatidylethanolamine, LPI for Lysophosphatidylinositol, LPS for Lipopolysaccharide, PA for Phosphatidic Acid, PI for Phosphatidylinositol, SM for Sphingomyelin polyunsaturated fatty acids (PUFA) at 31.3%, dominated by DHA at 14.37% and EPA at 8.3%. For H. erectus, the major fatty acids were C16:0 (27.4%), C18:1 (15.6%), C18:0 (11.0%), C16:1 (8.5%), and C14:0 (7.6%), with SFA, MUFA, and PUFA accounting for 50.4%, 24.1%, and 25.6% of total lipids, respectively. The UFA content of H. abdominalis (59.4%) was higher than that of H. erectus (49.6%), and the total DHA + EPA content of both species was higher than that of H. kelloggi.
Figure 1.
Orthogonal Partial Least Squares-Discriminant Analysis (OPLS-DA) of lipidomics data from H. abdominalis and H. erectus in positive mode (A) and negative mode (B); Types of lipids (C) and number of lipid classes (D) of the two Hippocampus species under different ion modes; Number of lipid molecules in different lipid classes in positive mode lipidomics (E) and negative mode lipidomics (F); The lipid classes and the relative ratio of lipid species number in H. abdominalis (G) and H. erectus (H). BisMePA for Bis(methoxyethyl)phosphatidylethanolamine, Cer for Ceramide, CL for Cardiolipin, dMePE for Dimethylethanolamine Phosphatidylethanolamine, Hex1Cer for Monoglucosylceramide, LPA for Lysophosphatidic Acid, LPC for Lysophosphatidylcholine, LPE for Lysophosphatidylethanolamine, LPI for Lysophosphatidylinositol, LPS for Lipopolysaccharide, PA for Phosphatidic Acid, PI for Phosphatidylinositol, SM for Sphingomyelin polyunsaturated fatty acids (PUFA) at 31.3%, dominated by DHA at 14.37% and EPA at 8.3%. For H. erectus, the major fatty acids were C16:0 (27.4%), C18:1 (15.6%), C18:0 (11.0%), C16:1 (8.5%), and C14:0 (7.6%), with SFA, MUFA, and PUFA accounting for 50.4%, 24.1%, and 25.6% of total lipids, respectively. The UFA content of H. abdominalis (59.4%) was higher than that of H. erectus (49.6%), and the total DHA + EPA content of both species was higher than that of H. kelloggi.
3.2. Differences in TG Molecular Species Between Two Seahorse Species and Fatty Acid Positional Distribution in TG
According to Figure. S3 TG was the major component of seahorse lipids, with H. erectus (26.7%) having a slightly lower TG content than H. abdominalis (29.5%). Phospholipids (PL) accounted for 9.2–12.3% of total lipids, with H. abdominalis showing a higher PL content than H. erectus. Then the lipid components of the two seahorse species were analyzed by means of lipidomics. Preliminary findings indicated that there were differences between them through comparison with the Total Ion Chromatogram (TIC) profiles under the two modes (Figure. S4–S5). OPLS-DA results (Figure. 1A and B) revealed significant differences in lipid molecular characteristics between the two species. In positive ion mode, the number of lipid types was comparable between them, but H. erectus had more lipid types in negative ion mode. From the perspective of lipid classes (Figure. 1D–H), H. erectus exhibited significantly more lipid classes in both ion modes. After data integration, TG was identified as the predominant lipid class, representing 63.0% of lipids in H. abdominalis and 57.0% in H. erectus. Notably, H. abdominalis lacked LPA, LPI, CL, and BisMePA, with PC (9.9%) and PE (4.7%) as the primary PL components; H. erectus had a lower PC proportion (9.0%) but a higher PE proportion (5.4%).
A total of 408 significantly different TG lipid species were identified between the two seahorse species (Figure. 2A), with 231 upregulated and 177 downregulated in H. abdominalis relative to H. erectus. Differential TG species screened by |log₂ fold change| > 1 and VIP score > 1 were visualized via volcano plots (Figure. 2B), and 25 of the top 20 most abundant TG species in each seahorse showed significant interspecific differences. H. abdominalis had 683 detected TG molecular species, while H. erectus had 958 (Figure. 1E). The most abundant TG species in both seahorses almost all contained C20:5 or C22:6 (Figure. 2C and D). The proportion of C22:6-containing lipid species was approximately 38% in both, while higher levels of C22:6-containing lipids (e.g., TG(C16:0/C20:5/C20:6) at 4.3%) and slightly higher levels of C20:5-containing lipids (e.g., TG(C18:1/C20:5/C20:5) at 3.9%) than H. erectus (dominant C22:6-containing the proportion of C20:5-containing species w- as significantly higher in H. abdominalis (52.6%) than in H. erectus (42.9%) (Figure. 2E). H. abdominalis had substantially lipid TG(C14:0/C22:6/C22:6) at 1.9%; dominant C20:5-containing lipid TG(C18:3/C20:4/C20:5) at 3.6%) (Figure. 2F, 2G 2I, 2J). Enzymatic hydrolysis results (Table S1, Figure. 2H and K) showed that in H. abdominalis, C22:6 was distributed at both sn-1,3 (7.2%) and sn-2 (8.5%) positions of TG, while in H. erectus, C22:6 was predominantly at sn-1,3 positions (6.2%). C20:5 was concentrated at sn-1,3 positions in both, with a higher content in H. abdominalis (7.2%) than in H. erectus (3.3%).
3.3. Differences in PL Molecular Species Between Two Seahorse Species
For PL components, 44 differential PC species were identified between the two seahorses (Figure. 3A), with 42 upregulated and 2 downregulated in H. abdominalis. Ten differential PE species were detected (Figure. 3B), all upregulated in H. abdominalis. Volcano plots visualized these differential species (Figure. 3C). Among the top 10 most abundant
PC and PE species in each seahorse, 15 PC and 15 PE species showed significant inters pe-
Figure 2.
Analysis of differential triglycerides in H. abdominalis and H. erectus. The volcano plot (A). Differential lipid species were selected out by using the criteria of P Value |log2FoldChange|>1, VIP score>1 in the volcano plot (n=3). The lipid thermograms (B) of 25 triglycerides in two kinds of Hippocampus were screened by relative content and significance. Relative abundances of the top 20 TG lipid molecular species in TG from H. abdominalis (C) and H. erectus (D) under positive mode; The ratio of the number of TG molecular species containing C22:6 and C20:5 from the two seahorse species (E); The relative abundance of top 20 lipid molecules containing C22:6 in TG from H. abdominalis (F) and H. erectus (G); Fatty acids intra-positional composition of C22:6 in TG of the two Hippocampus species (H); The relative abundance of top 20 lipid molecules containing C20:5 in TG from H. abdominalis (I) and H. erectus (J); Fatty acids intra-positional composition of C20:5 in TG of the two Hippocampus species (K). Values are expressed as mean ± standard error of the mean (SEM). The number of independent biological replicates is n = 3 for each group.
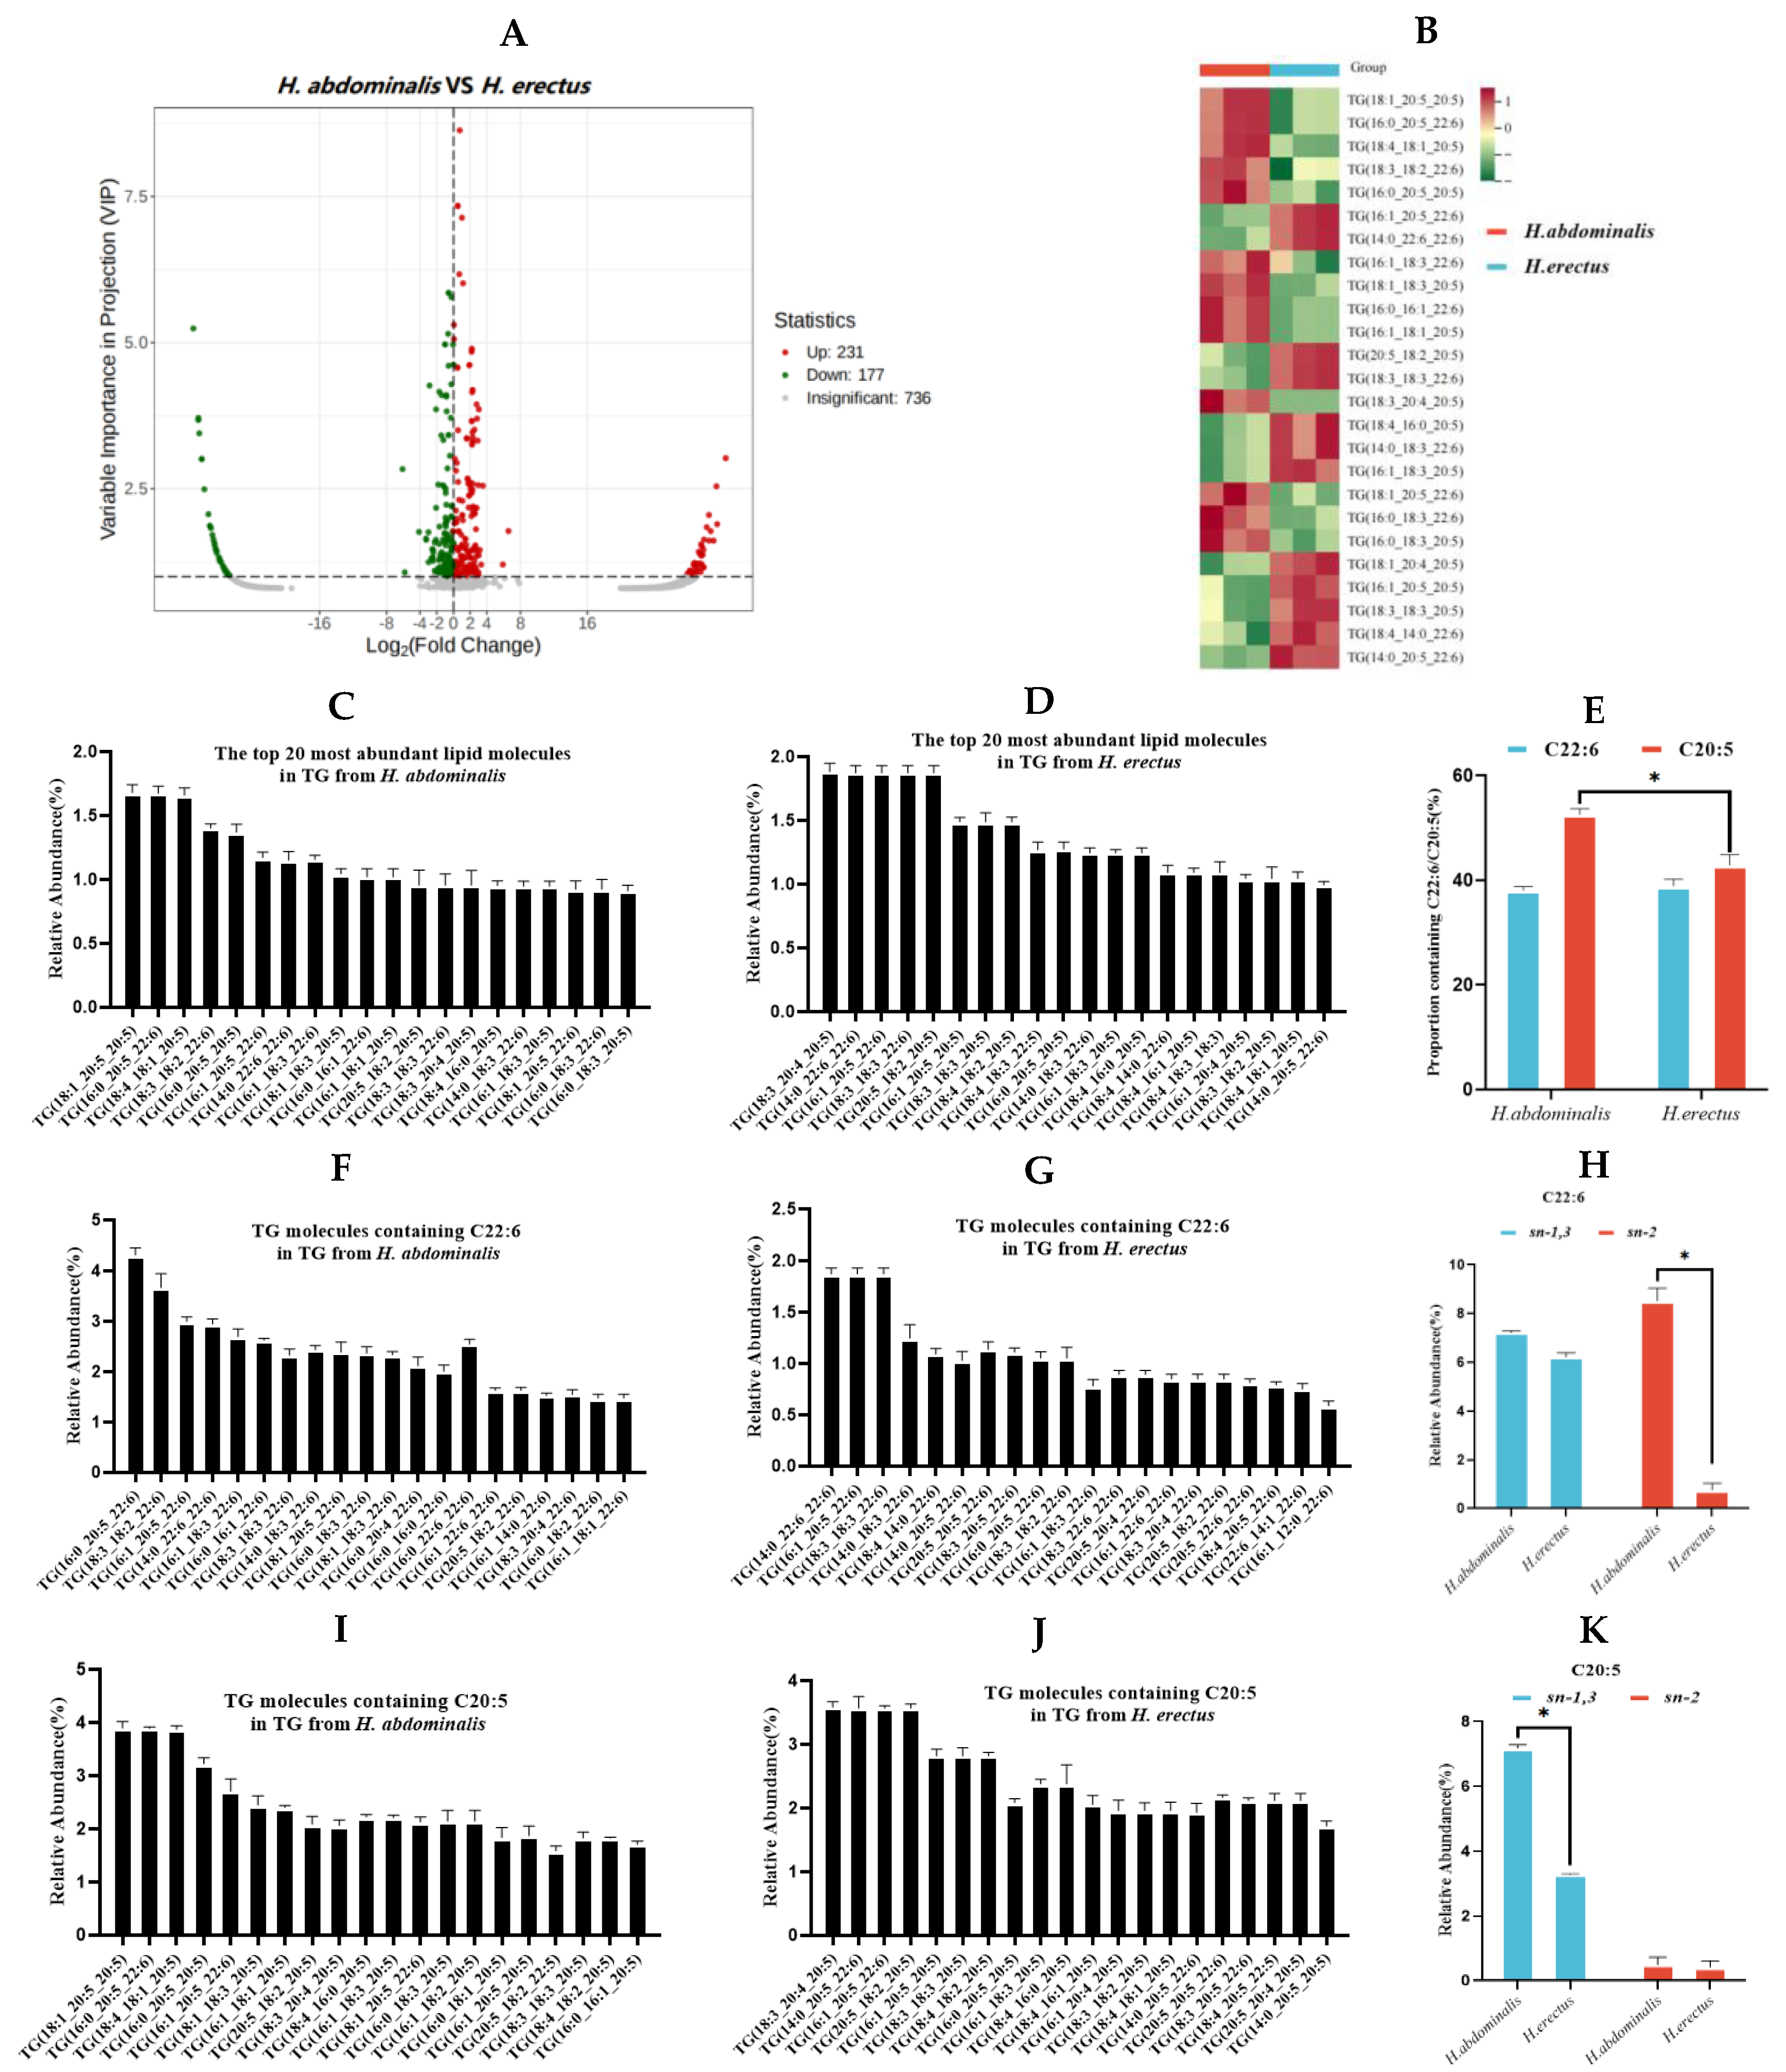
Figure 3.
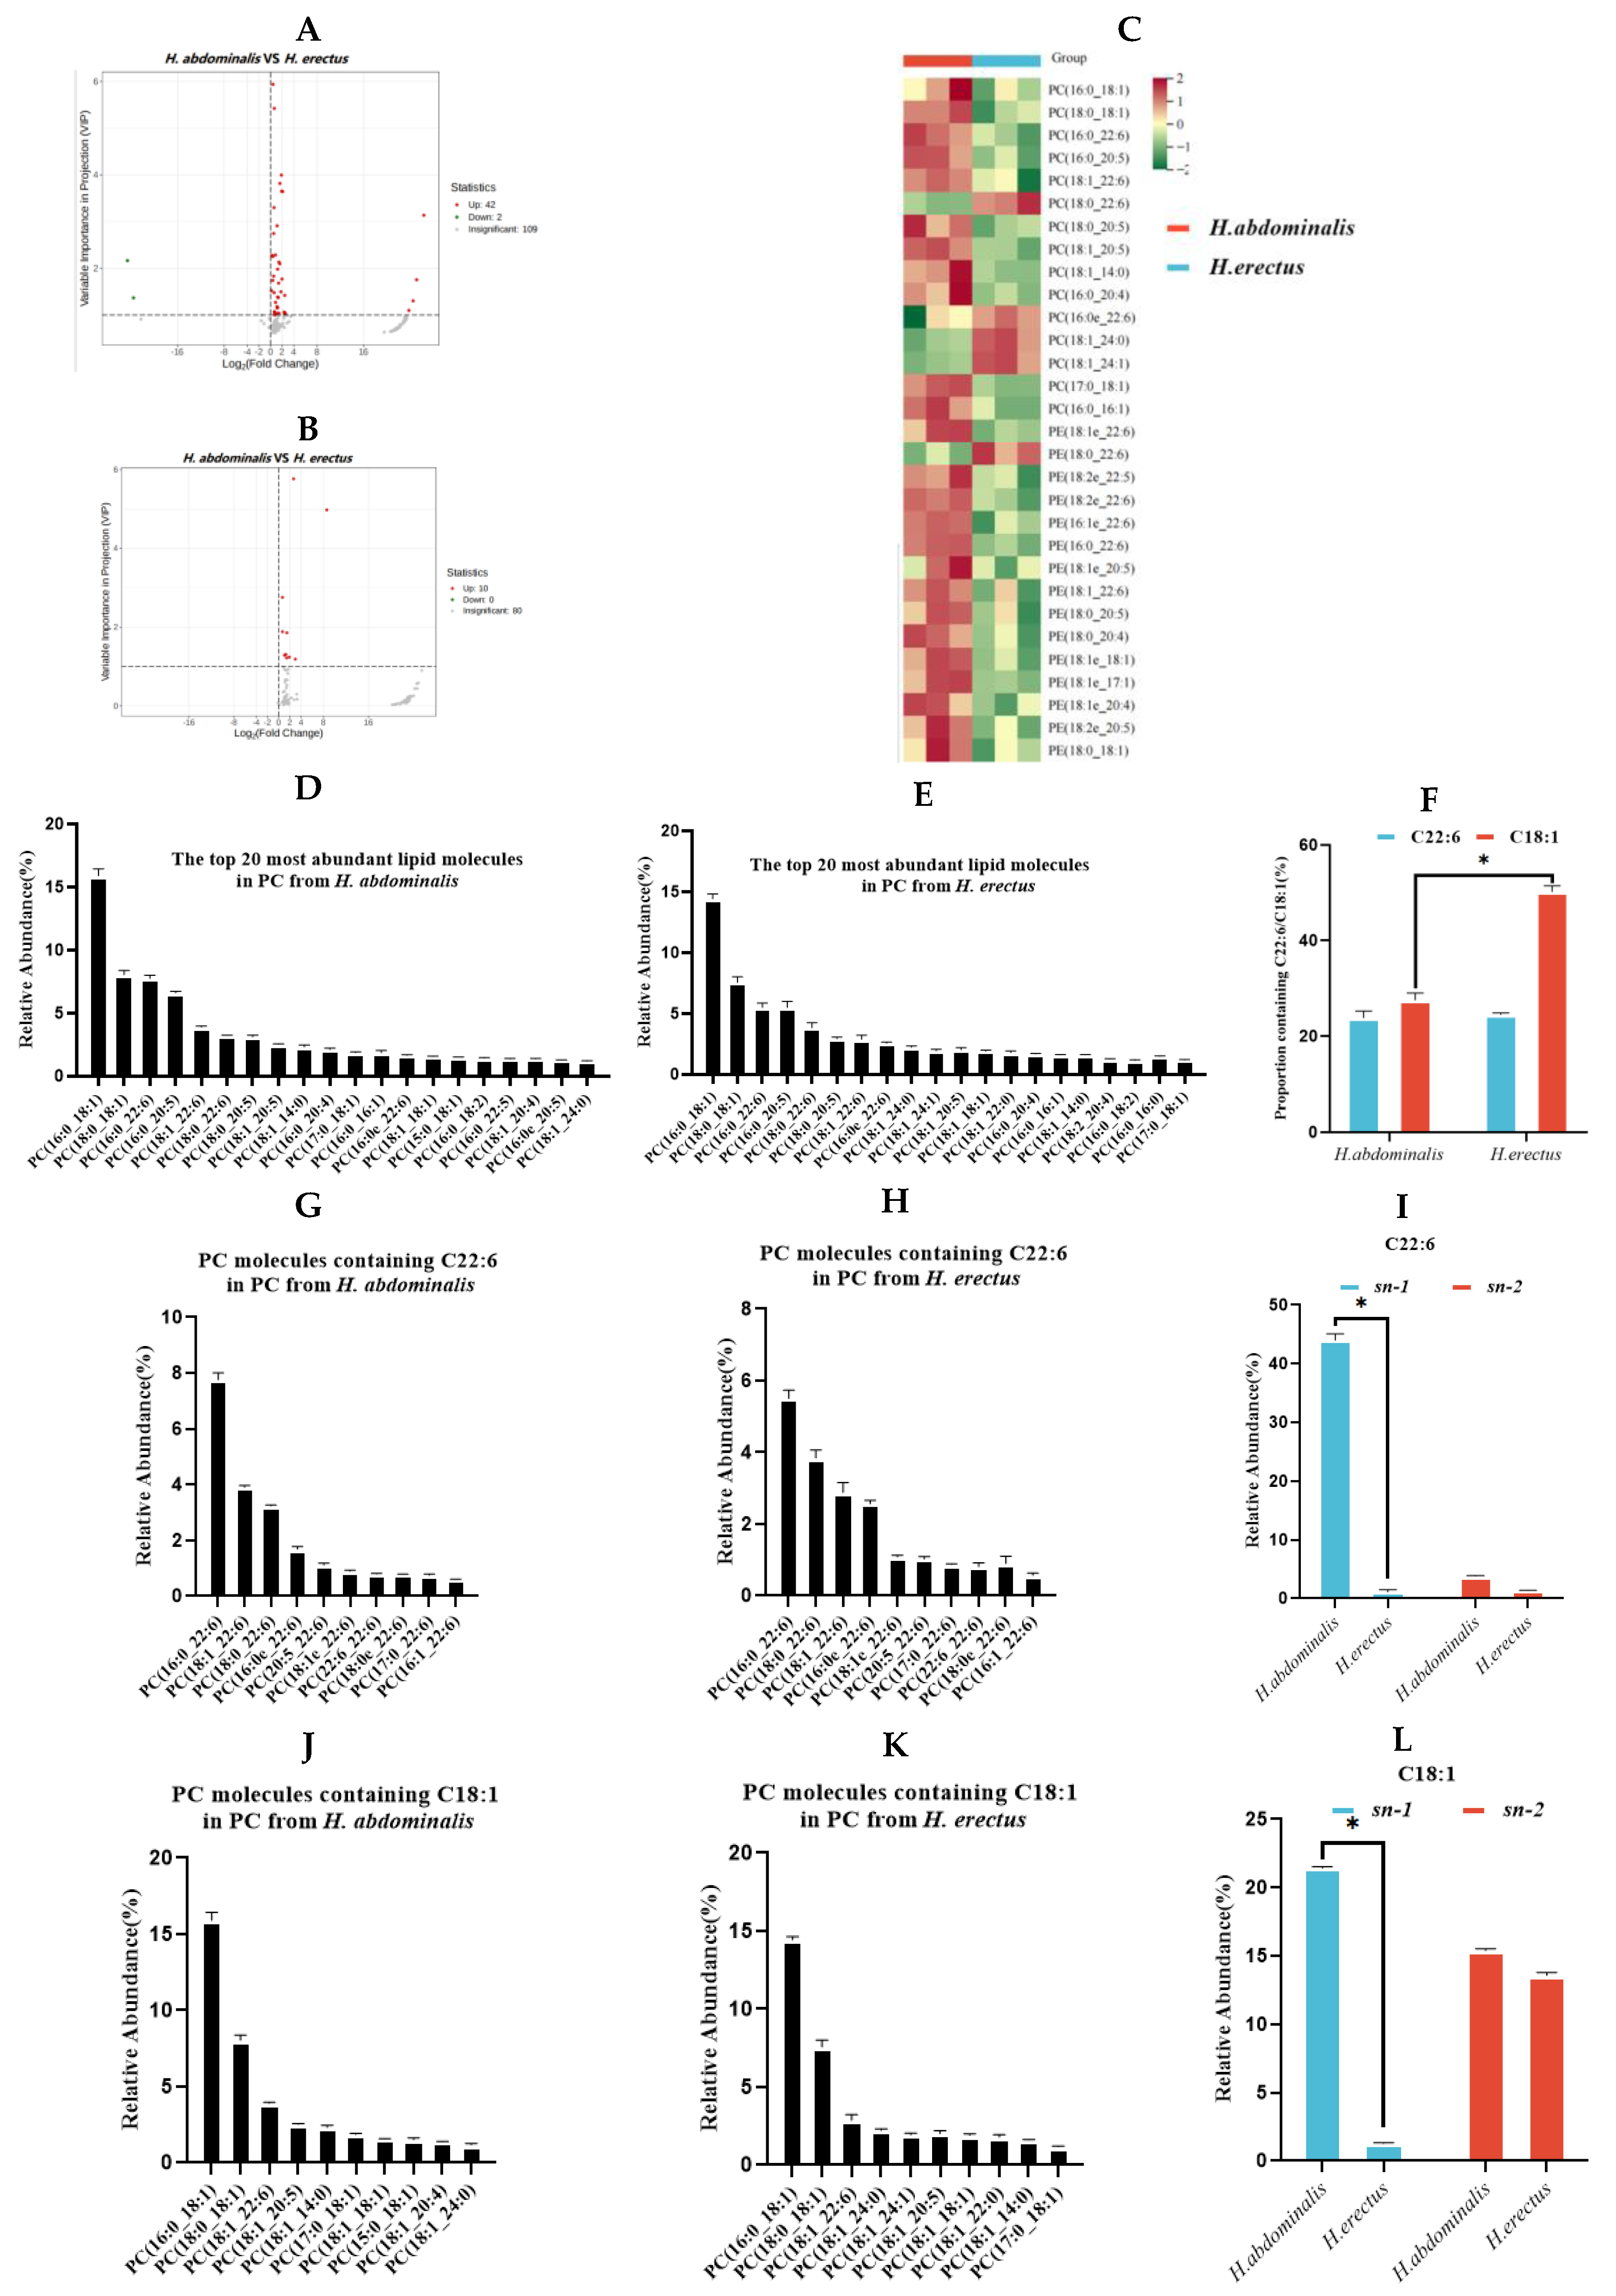
Analysis of differential PC (A) and PE (B) in H. abdominalis and H. erectus. Differential lipid species were selected out by using the criteria of P Value |log2FoldChange|>1, VIP score>1 in the volcano plot (n=3). The lipid thermograms (C) of 15 kinds of PC and 15 kinds of PE in the two kinds of Hippocampus were screened by relative content and significance. Relative abundances of the top 20 PC lipid molecular species in PC from H. abdominalis (D) and H. erectus (E) under positive mode; The ratio of the number of PC molecular species containing C22:6 and C18:1 from the two seahorse species (F); The relative abundance of top 20 lipid molecules containing C22:6 in PC from H. abdominalis (G) and H. erectus (H); Fatty acids intra-positional composition of C22:6 in PC of the two Hippocampus species (I); The relative abundance of top 20 lipid molecules containing C18:1 in PC from H. abdominalis (J) and H. erectus (K); Fatty acids intra-positional composition of C18:1 in PC of the two Hippocampus species (L). Values are expressed as mean ± standard error of the mean (SEM). The number of independent biological replicates is n = 3 for each group cific differences, with most being more abundant in H. abdominalis. H. abdominalis had 51 PE molecular species, compared to 90 in H. erectus (Figure. 1F).
Figure 3.
Analysis of differential PC (A) and PE (B) in H. abdominalis and H. erectus. Differential lipid species were selected out by using the criteria of P Value |log2FoldChange|>1, VIP score>1 in the volcano plot (n=3). The lipid thermograms (C) of 15 kinds of PC and 15 kinds of PE in the two kinds of Hippocampus were screened by relative content and significance. Relative abundances of the top 20 PC lipid molecular species in PC from H. abdominalis (D) and H. erectus (E) under positive mode; The ratio of the number of PC molecular species containing C22:6 and C18:1 from the two seahorse species (F); The relative abundance of top 20 lipid molecules containing C22:6 in PC from H. abdominalis (G) and H. erectus (H); Fatty acids intra-positional composition of C22:6 in PC of the two Hippocampus species (I); The relative abundance of top 20 lipid molecules containing C18:1 in PC from H. abdominalis (J) and H. erectus (K); Fatty acids intra-positional composition of C18:1 in PC of the two Hippocampus species (L). Values are expressed as mean ± standard error of the mean (SEM). The number of independent biological replicates is n = 3 for each group cific differences, with most being more abundant in H. abdominalis. H. abdominalis had 51 PE molecular species, compared to 90 in H. erectus (Figure. 1F).
3.4. Molecular Species and Positional Distribution of Fatty Acids in PC
The most abundant PC species in both seahorses almost all contained C22:6 or C18:1 (Figure. 3D–E). The proportion of C22:6-containing PC species was slightly lower in H. abdominalis (23.8%) than in H. erectus (24.5%), while the proportion of C18:1-containing PC species was significantly lower in H. abdominalis (27.5%) than in H. erectus (50.2%) (Figure. 3F). H. abdominalis had higher levels of C22:6-containing PC species (e.g., PC(C16:0/C22:6) at 7.8%) and slightly higher levels of C18:1-containing PC species than H. erectus (PC(C16:0/C22:6) at 5.5%) (Figure. 3G–H, 3J–K). The most abundant PC species in both as PC(C16:0/C18:1), with relative contents of 15.9% (H. abdominalis) and 14.4% (H. erectus). Enzymatic hydrolysis results (Table S2, Figure. 3I and 3L) showed that PC in H. abdominalis had high DHA content (44.0% at sn-1 position), while DHA content in H. erectus was approximately 1% at both sn-1 and sn-2 positions. C18:1 in H. abdominalis was primarily at sn-1 (21.4%), while in H. erectus, C18:1 content at sn-1 (15.1%) and sn-2 (13.6%) were similar.
3.5. Molecular Species and Positional Distribution of Fatty Acids in PE
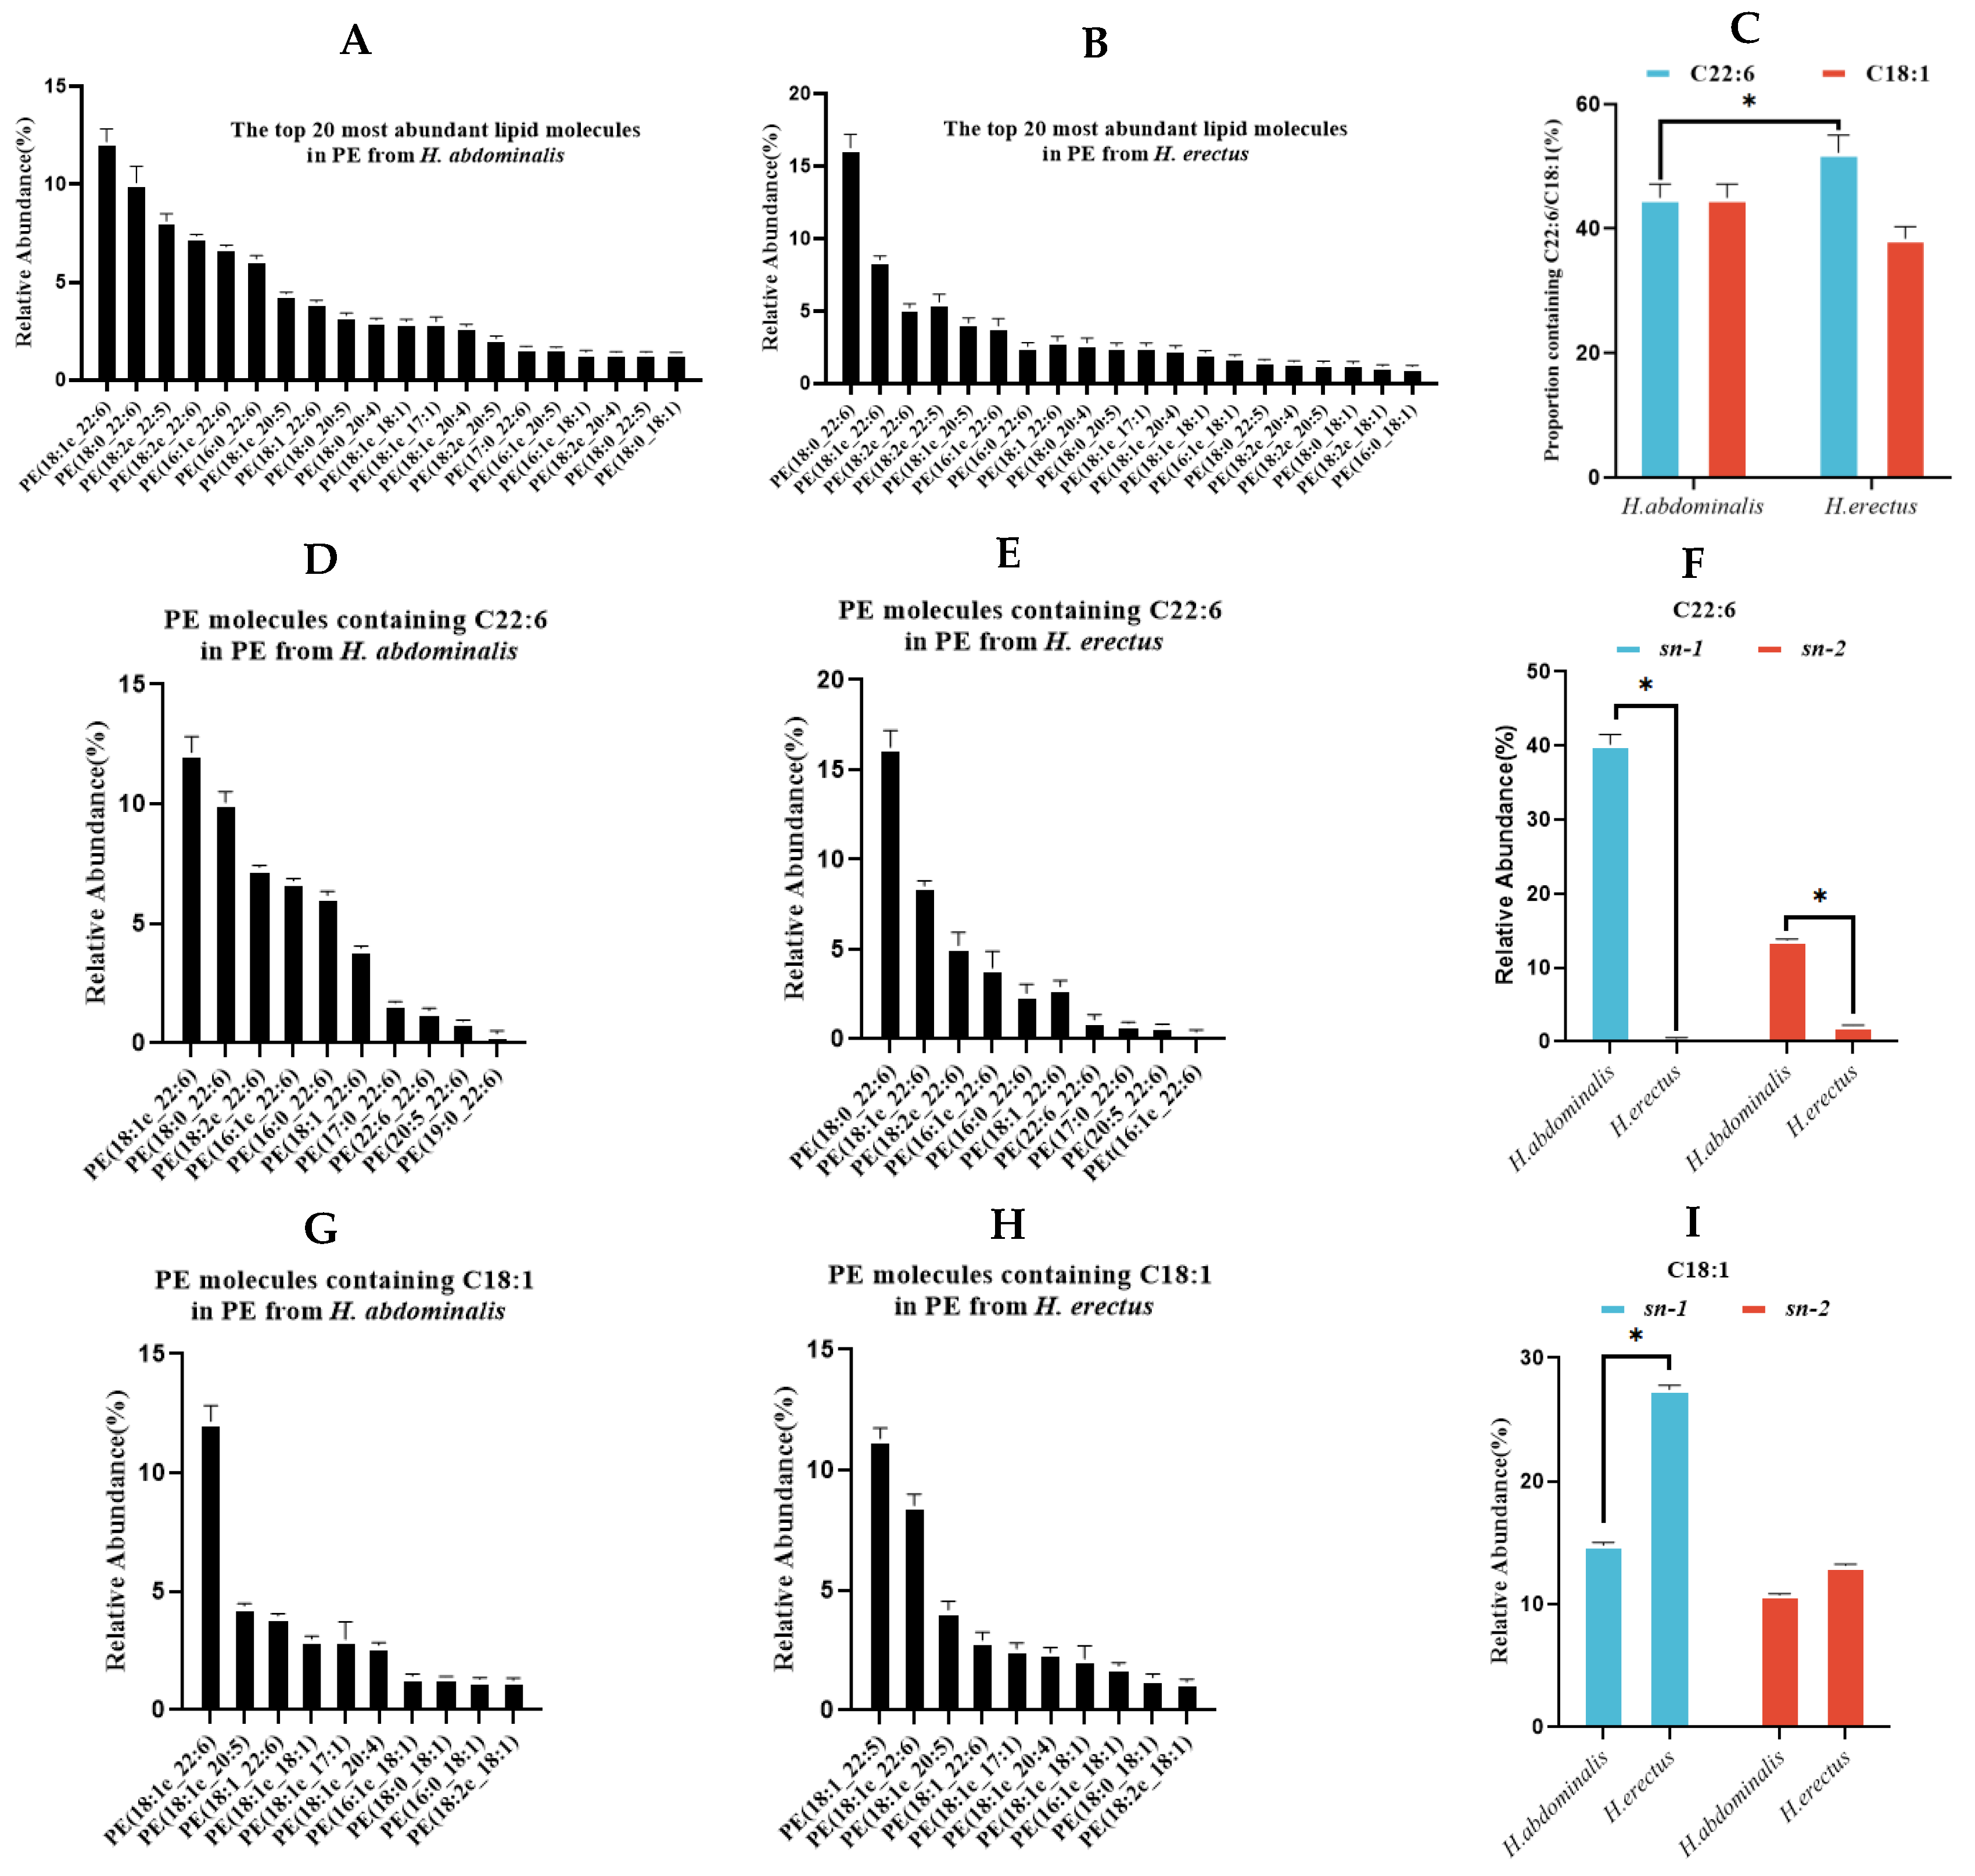
The most abundant PE species in both seahorses almost all contained C22:6 or C18:1 (Figure. 4A–B). The proportion of C22:6-containing PE species was lower in H. abdominalis (44.9%) than in H. erectus (52.2%), while the proportion of C18:1-containing PE species was higher in H. abdominalis (44.9%) than in H. erectus (38.4%) (Figure. 4C). H. abdominalis had a significantly higher abundance of alkoxy ether phospholipid PE, such as PE(C18:1e/C22:6) (12.2%), PE(C18:2e/C22:6) (7.4%), and PE(C18:1e/C20:5) (4.4%) (Figure. 4D–E, 4G–H). Enzymatic hydrolysis results (Table S3, Figure. 4F and 4I) showed that PE in H. abdominalis had high DHA content (40.2% at sn-1, 13.72% at sn-2), while DHA content in H. erectus was below 2.5% at sn-2. C18:1 in H. abdominalis was relatively evenly distributed between sn-1 (14.8%) and sn-2 (10.8%), while in H. erectus, C18:1 content was higher at sn-1 (27.4%) than at sn-2 (13.2%).
4. Discussion
The present study systematically characterized the lipid composition, molecular species, and fatty acid positional distribution of two seahorse species (H. abdominalis and H. erectus), revealing significant interspecific differences that may be attributed to variations in their habitats and species-specific metabolic characteristics [22,23]. These differences highlight the superior nutritional value and functional potential of H. abdominalis compared to H. erectus. In terms of lipid class composition, both seahorse species showed TG as the predominant lipid class, which is consistent with the lipid profile of many deep-sea fish [24]. Notably, the two seahorse species were relatively abundant in the diversity of their DG molecular species, a phenomenon that might be associated with the hydrolysis
Figure 4.
Relative abundances of the top 20 PE lipid molecular species in PE from H. abdominalis (A) and H. erectus (B) under positive mode; The ratio of the number of PE molecular species containing C22:6 and C18:1 from the two seahorse species; The relative abundance of top 20 lipid molecules containing C22:6 in PE from H. abdominalis (D) and H. erectus (E); Fatty acids intra-positional composition of C22:6 in PE of the two Hippocampus species (F); The relative abundance of top 20 lipid molecules containing C18:1 in PE from H. abdominalis (G) and H. erectus (h); Fatty acids intra-positional composition of C18:1 in PE of the two Hippocampus species (I). Values are expressed as mean ± standard error of the mean (SEM). The number of independent biological replicates is n = 3 for each group of TG catalyzed by TG lipase within the organisms during transportation and storage. Furthermore, The higher UFA content (especially DHA and EPA) in H. abdominalis (61.1%) compared to H. erectus (49.6%) is a key finding, as PUFAs like DHA and EPA are well-documented for their beneficial effects on human health, including lowering blood lipids and alleviating atherosclerosis [25]. The total DHA + EPA content of both seahorses was higher than that of H. kelloggi [26], further confirming seahorses as a valuable source of these essential fatty acids.
The OPLS-DA results demonstrated distinct lipid molecular characteristics between the two species, with H. erectus possessing more lipid types, particularly in negative ion mode. This difference may be related to the ionization properties of lipids: triglycerides are effectively ionized in positive ion mode, while phospholipids (with negatively charged phosphate groups) form stable [M-H]⁻ or [M+HCOO]⁻ ions in ESI negative mode, facilitating their detection [27,28]. The higher relative proportion of PC in H. abdominalis (9.9% vs. 9.0% in H. erectus) is noteworthy, as PC is a critical component of cell membranes and plays important roles in lipid metabolism. The analysis of TG molecular species revealed 408 differential species between the two seahorses, with H. abdominalis showing higher levels of DHA- and EPA-containing lipids. The enrichment of DHA and EPA in the major TG species of both seahorses, even at moderate overall proportions in total lipids, indicates targeted accumulation of these PUFAs, which is consistent with findings in some marine fish species [29]. Furthermore, we focus primarily on the differences in fatty acids at the sn-1,3 and sn-2 positions of TG. The rationale behind this focus is that triglycerides in the digestive tract are preferentially hydrolyzed by pancreatic lipase into sn-2 monoacylglycerol prior to absorption. The experimental results demonstrated that the positional distribution of fatty acids in TG further amplifies the nutritional superiority of H. abdominalis in that DHA is enriched at the sn-2 position (8.5%) a position with higher fatty acid absorption efficiency while the EPA content at the sn-1,3 positions is significantly higher than that in H. erectus. This distinct positional distribution pattern facilitates the more efficient exertion of DHA and EPA’s nutritional benefits [30].
For phospholipids, H. abdominalis showed upregulation of most differential PC and PE species, despite having fewer total PE molecular species than H. erectus. The high abundance of alkoxy ether phospholipid PE in H. abdominalis (e.g., PE(C18:1e/C22:6)) is particularly significant, as these lipids possess superior oxidation resistance and are associated with multiple nutritional function [31,32]. The positional distribution of fatty acids in PC and PE also contributes to the higher lipid absorption efficiency of H. abdominalis in that DHA is highly concentrated at the sn-1 position of PC (44.0%) and PE (40.2%), while the even distribution of C18:1 in PE may further optimize lipid metabolism [33].
Collectively, these results indicate that H. abdominalis may possess superior nutritional value to H. erectus from the aspect of lipid and thus holds greater potential for the development of lipid-derived functional ingredients and precision nutrition products [34]. The distinct lipid profiles of the two seahorse species furnish a scientific foundation for their targeted application in the food and pharmaceutical industries. Given that the present study is constrained by the lack of quantitative analysis of lipid molecular species, future research could focus on conducting in-depth quantitative investigations to clarify the precise lipid composition of the two seahorse species, as well as evaluating the in vitro and in vivo biological activities of these target lipids.
5. Conclusions
This study clarified the lipid differences between two farmed seahorse species, Hippocampus abdominalis and Hippocampus erectus, by comparing their lipid content, composition, molecular species, and fatty acid positional distribution and using untargeted lipidomics combined with enzymatic hydrolysis. Of these lipids, triglyceride (TG) were the major lipid class in both species. Interestingly, H. abdominalis had higher levels of phospholipids (PL) than H. erectus. Specifically, the content of docosahexaenoic acid (DHA) and eicosapentaenoic acid (EPA) in the TG of H. abdominalis was higher than that in H. erectus. Moreover, DHA in H. abdominalis was evenly distributed at the sn-1,3, and sn-2 positions, while in H. erectus, DHA was mainly distributed at the sn-1,3 positions. In contrast, EPA was concentrated at the sn-1,3 positions in both seahorse species. Additionally, the DHA content in phosphatidylcholine (PC) and phosphatidylethanolamine (PE) of H. abdominalis was much higher than that in H. erectus, and this DHA was mainly concentrated at the sn-1 position. Notably, H. abdominalis also contained a large amount of alkoxy ether phospholipids. This study addresses the existing research gaps in the lipid profiles of two commercially viable large-scale cultured seahorse species. Specifically, it characterizes the interspecific differences in lipid molecular species, as well as the difference, in fatty acids at distinct positions of the major molecular species (i.e., TG, PC, and PE. These findings provide a fundamental basis for the species identification and development of functional lipids derived from seahorses.
Supplementary Materials
The following supporting information can be downloaded at: 10.5281/zenodo.18428464, Figure. S1 Lipid Extraction Yield of the Two Seahorse Species (mg/g dry weight); Figure. S2 The mixed standard of the FAME GC chromatograms; Figure. S3 The relative abundance of triglycerides (TGs) and phospholipids (PLs) in Hippocampus abdominalis and Hippocampus erectus; Figure. S4 Schematic diagram of Total Ion Chromatogram (TIC) of two seahorse species under positive ion mode; Figure S5 Schematic diagram of Total Ion Chromatogram (TIC) of two seahorse species under negative ion mode. Table S1: Fatty acids intra-positional composition in TG of the two Hippocampus species; Table S2: Fatty acids intra-positional composition in PC of the two Hippocampus species. Table S3: Fatty acids intra-positional composition in PE of the two Hippocampus species.
Author Contributions
TianXi Bi: Writing - Original Draft, Software, Data curation. Dandan Wang: Methodology. Xiaoming Jiang: Project administration. Yi Shao: Formal analysis. Lu Zhang, Tingting Lin: Validation. Yu-Ming Wang: Supervision, Funding acquisition. Taher Abdelnaby: Conceptualization. TianTian Zhang, Chengcheng Wang: Writing - review & editing. All authors have read and agreed to the published version of the manuscript.
Funding
This research was supported by National Key Research and Development Program of China (No. 2024YFD2401603), the National Natural Science Foundation of China (No. 22408357), the Taishan Scholars Program (No. tstp20240812), Leading the Charge with Open Competition Project of the State Key Laboratory of Marine Food Processing and Safety Control (No. 20250101), and Youth Innovation Team Program of Universities in Shandong Province (No. 2023KJ040).
Institutional Review Board Statement
Not applicable.
Data Availability Statement
The data sets used and/or analyzed during the current study are available from the corresponding author upon request.
Conflicts of Interest
The authors declare no conflicts of interest.
Abbreviations
The following abbreviations are used in this manuscript:
| BisMePA | Bis(methoxyethyl)phosphatidylethanolamine |
| Cer | Ceramide |
| CL | Cardiolipin |
| CITES | Convention on International Trade in Endangered Species of Wild Fauna and Flora |
| DHA | Docosahexaenoic Acid |
| dMePE | Dimethylethanolamine Phosphatidylethanolamine |
| EPA | Eicosapentaenoic Acid |
| Hex1Cer | Monoglucosylceramide |
| IACUC | Institutional Animal Care and Use Committee |
| LPA | Lysophosphatidic Acid |
| LPC | Lysophosphatidylcholine |
| LPE | Lysophosphatidylethanolamine |
| LPI | Lysophosphatidylinositol |
| LPS | Lysophosphatidylserine |
| PA | Phosphatidic Acid |
| PC | Phosphatidylcholine |
| PE | Phosphatidylethanolamine |
| PG | Phosphatidylglycerol |
| PI | Phosphatidylinositol |
| PL | Phospholipid |
| SEM | Standard Error of the Mean |
| SM | Sphingomyelin |
| TG | Triglyceride |
References
- Kumaravel, K.; Ravichandran, S.; Balasubramanian, T.; Sonneschein, L. Seahorses – A source of traditional medicine. Natural Product Research 2012, 26((24)), 2330–2334. [Google Scholar] [CrossRef]
- Camins, E.; Stanton, L.M.; Correia, M.; Koldewey, S.J.; Vincent, H.J.; Amanada, C.J. Advances in life-history knowledge for 35 seahorse species from community science. Journal of Fish Biology 2024, 104((5)), 1548–1565. [Google Scholar] [CrossRef] [PubMed]
- Loh, T.L.; Tewfik, A.; Aylesworth, L.; Phoonsawat, R. Species in wildlife trade: Socio-economic factors influence seahorse relative abundance in Thailand. Biological Conservation 2016, 201, 301–308. [Google Scholar] [CrossRef]
- Dias, T.L.; Rosa, I.L.; Baum, J.K. Threatened Fishes of the World: Hippocampus erectus Perry, 1810 (Syngnathidae). Environmental Biology of Fishes 2002, 65((3)). [Google Scholar] [CrossRef]
- Kodagoda, Y.K.; Liyanage, D.S.; Omeka, W.K.M.; Kwon, H.; Hwang, S.D.; Lee, J. Molecular characterization, expression, and functional analysis of cystatin B in the big-belly seahorse (Hippocampus abdominalis). Fish & shellfish immunology 2022, 124, 442–453. [Google Scholar]
- Zhang, Y.Y.; Ryu, B.M.; Qian, Z.J. A Review - Biology, Aquaculture and Medical Use of Seahorse, Hippocampus spp. Annual Research & Review in Biology 2017, 14((5)), 1–12. [Google Scholar] [CrossRef]
- Ko, J.; Wan, Q.; Bathige, S.D.N.K.; Lee, J. Molecular characterization, transcriptional profiling, and antibacterial potential of G-type lysozyme from seahorse (Hippocampus abdominalis). Fish & Shellfish Immunology 2016, 58, 622–630. [Google Scholar]
- Cui, X.; Zhao, X.; Li, J.; Li, Z.; Ren, X.; Zhao, Y.; Fu, X.; Li, X. Advances in the Global Distribution, Chemical Constituents, and Pharmacology of Hippocampus, a Traditional Marine Chinese Medicine. Frontiers in Marine Science 2021, 8. [Google Scholar] [CrossRef]
- Feng, B.Y.; Zhang, H.; Zhang, D.Y.; Luo, Y.H.; Yang, H.; Lin, J.; Li, L.Y.; Qiu, X.Z.; Qiu, F.Y.; Ye, L.S.; et al. Comprehensive biochemical analysis and nutritional evaluation of fatty acid and amino acid profiles in eight seahorse species (Hippocampus spp.). Heliyon 2024, 10((12)), e33220. [Google Scholar] [CrossRef]
- Kim, Q.S.K. Purification of a peptide from seahorse, that inhibits TPA-induced MMP, iNOS and COX-2 expression through MAPK and NF-κB activation, and induces human osteoblastic and chondrocytic differentiation. Chemico-Biological Interactions 2010. [Google Scholar]
- Lin, Q.; Lin, J.; Lu, J.; Li, B. Biochemical Composition of Six Seahorse Species, Hippocampus sp., from the Chinese Coast. Journal of the World Aquaculture Society 2010, 39((2)), 225–234. [Google Scholar] [CrossRef]
- Che, H.; Zhou, M.; Zhang, T.; Zhang, L.; Wang, Y. Comparative study of Phosphatidylcholine rich in DHA or EPA on Alzheimer’s Disease and the possible involved mechanisms in CHO-APP/PS1 cell and SAMP8 mice. Food & Function 2017, 9((1)). [Google Scholar]
- Ge, L.; Lu, W.; Wu, H.; Liang, J.; Liao, J.; Cheng, K.; Zeng, X.X.; Wang, S.W.; Wang, Z.; Mao, P.; et al. Functional lipid diversity and novel oxylipin identification for interspecies differentiation and nutritional assessment of commercial seahorse (Hippocampus) using untargeted and targeted lipidomics. Food Chemistry 2025, 473, 143117. [Google Scholar] [CrossRef] [PubMed]
- Liu, Y.; Guo, Y.; Sun, Z.; Jie, X.; Li, Z.; Wang, J.; Wang, Y.; Xue, C. Production of Structured Triacylglycerols Containing Palmitic Acids at sn-2 Position and Docosahexaenoic Acids at sn-1, 3 Positions. Journal of Oleo Science 2015, 64((11)), 1227–1234. [Google Scholar] [CrossRef]
- Wu, F.J.; Xue, Y.; Liu, X.F.; Xue, C.H.; Wang, J.F.; Du, L.; Takahashi, K.; Wang, Y.M. The protective effect of eicosapentaenoic acid-enriched phospholipids from sea cucumber Cucumaria frondosa on oxidative stress in PC12 cells and SAMP8 mice. Neurochemistry International 2014, 64, 9–17. [Google Scholar] [CrossRef]
- Turon, F.; Bachain, P.; Caro, Y.; Pina, M.; Graille, J. A direct method for regiospecific analysis of TAG using α-MAG. Lipids 2002, 37((8)), 817–821. [Google Scholar] [CrossRef]
- Folch, J. A simple method for the isolation and purification of total lipides from animal tissues. J Bid Chem 1957, 226. [Google Scholar] [CrossRef]
- Tosi, E.A.; Cazzoli, A.F.; Tapiz, L.M. Phosphorus in oil. Production of molybdenum blue derivative at ambient temperature using noncarcinogenic reagents. Journal of the American Oil Chemists Society 1998, 75((1)), 41–44. [Google Scholar] [CrossRef]
- Zhao, Y.C.; Shi, H.H.; Wang, C.C.; Yang, J.Y.; Xue, C.H.; Jiang, X.M.; Chen, G.D.; Zhang, T.T.; Wang, Y.M. The enrichment of eggs with docosahexaenoic acid and eicosapentaenoic acid through supplementation of the laying hen diet. Food chemistry 2021, 346, 128958. [Google Scholar] [CrossRef]
- Lingyu; Zhang; Dan; Wang; Min; Wen; Lei; Du; Changhu; Xue. Rapid modulation of lipid metabolism in C57BL/6J mice induced by eicosapentaenoic acid-enriched phospholipid from Cucumaria frondosa. Journal of Functional Foods 2017. [Google Scholar]
- Wang, D.D.; Cui, X.Y.; Li, X.Y.; Wang, C.C.; Xue, C.H.; Yanagita, T.; Zhang, T.T.; Wang, Y.M. Lymphatic absorption characteristics of eicosapentaenoic acid -enriched phosphoethanolamine plasmalogen and its gastric and intestinal hydrolysates. Food Chemistry 2025, 463 (Pt 4), 1414. [Google Scholar]
- Hodson, L.; Gunn, P.J. The regulation of hepatic fatty acid synthesis and partitioning: The effect of nutritional state. Nature Reviews Endocrinology 2019, 15((12)), 689–700. [Google Scholar] [CrossRef] [PubMed]
- Gherasim, A.; Arhire, L.I.; Nita, O.; Popa, A.D.; Graur, M.; Mihalache, L. The relationship between lifestyle components and dietary patterns. Proc Nutr Soc 2020, 79((3)), 311–323. [Google Scholar] [CrossRef] [PubMed]
- Parzanini, C.; Parrish, C.C.; Hamel, J.-F.; Mercier, A.; Loor, J.J. Functional diversity and nutritional content in a deep-sea faunal assemblage through total lipid, lipid class, and fatty acid analyses. PLoS One 2018, 13((11)). [Google Scholar] [CrossRef] [PubMed]
- Chong, S.Y.; Wang, X.; Van Bloois, L.; Huang, C.; Yu, X.; Sayed, N.; Zhang, S.; Ting, H.J.; Thiam, C.H.; Lim, S.Y.; et al. Liposomal docosahexaenoic acid halts atherosclerosis progression. European Heart Journal 2022, 43 (Supplement_2). [Google Scholar] [CrossRef]
- Feng, B.-Y.; Zhang, H.; Zhang, D.-Y.; Luo, Y.-H.; Yang, H.; Lin, J.; Li, L.-Y.; Qiu, X.-Z.; Qiu, F.-Y.; Ye, L.-S.; et al. Comprehensive biochemical analysis and nutritional evaluation of fatty acid and amino acid profiles in eight seahorse species (Hippocampus spp.). Heliyon 2024, 10, 12. [Google Scholar] [CrossRef]
- Khan, M.J.; Codreanu, S.G.; Goyal, S.; Wages, P.A.; Robinson, R.A.S. Evaluating a targeted multiple reaction monitoring approach to global untargeted lipidomic analyses of human plasma. Rapid Communications in Mass Spectrometry 2020, 34, 22. [Google Scholar] [CrossRef]
- Yu, X.; Li, L.; Wang, H.; Song, G.; Wang, J.; Li, S.; Wang, Y.; Shen, Q. Lipidomics study of rainbow trout (Oncorhynchus mykiss) and salmons (Oncorhynchus tshawytscha and Salmo salar) using hydrophilic interaction chromatography and mass spectrometry. Lwt 2020, 121. [Google Scholar]
- Lu, F.S.H.; Nielsen, N.S.; Timm-Heinrich, M.; Jacobsen, C. Oxidative Stability of Marine Phospholipids in the Liposomal Form and Their Applications. Lipids 2011, 46((1)), 3–23. [Google Scholar]
- Hachem, M.; Nacir, H.; Picq, M.; Belkouch, M.; Bernoud-Hubac, N.; Windust, A.; Meiller, L.; Sauvinet, V.; Feugier, N.; Lambert-Porcheron, S.; et al. Docosahexaenoic Acid (DHA) Bioavailability in Humans after Oral Intake of DHA-Containing Triacylglycerol or the Structured Phospholipid AceDoPC((R)). Nutrients 2020, 12((1)). [Google Scholar]
- Maji, D.; Lu, J.; Sarder, P.; Schmieder, A.H.; Cui, G.; Yang, X.; Pan, D.; Lew, M.D.; Achilefu, S.; Lanza, G.M. Cellular Trafficking of Sn-2 Phosphatidylcholine Prodrugs Studied with Fluorescence Lifetime Imaging and Super-resolution Microscopy. other 2018, 1((2)). [Google Scholar] [CrossRef]
- Liu, Y.J.; Jiao, C.; Tao, Z.; Li, X.; Li, P.; Lu, M.; Ye, Z.; Du, Y.; Du, R.; Zhang, W. Early-Life Gut Microbiota Governs Susceptibility to Colitis via Microbial-Derived Ether Lipids. Research 2023, 6. [Google Scholar] [CrossRef]
- Funari, S. Effects of oleic acid and its congeners, elaidic and stearic acids, on the structural properties of phosphatidylethanolamine membranes. Journal of Lipid Research 2003, 44((3)), 567–575. [Google Scholar] [CrossRef]
- Dinicolantonio, J.J.; O’Keefe, J.H. The Importance of Marine Omega-3s for Brain Development and the Prevention and Treatment of Behavior, Mood, and Other Brain Disorders. Nutrients 2020, 12((8)), 2333. [Google Scholar] [CrossRef]

Table 1.
Relative abundance and content of fatty acids in two Hippocampus species.
| Fatty Acids | H. abdominalis | H. erectus | ||
|---|---|---|---|---|
| Relative Abundance (%) | Contents (mg/g Total Lipids) | Relative Abundance (%) | Contents (mg/g Total Lipids) | |
| C14:0 | 3.59±0.04 | 18.18±0.08 | 7.64±0.06 | 39.89±1.9 |
| C16:0 | 23.07±0.1 | 116.76±0.43 | 27.37±0.09 | 159.61±1.04 |
| C16:1 | 7.39±0.02 | 37.42±0.34 | 8.46±0.06 | 49.33±0.45 |
| C17:0 | 1.76±0.01 | 8.93±0.06 | 2.14±0.04 | 12.47±0.21 |
| C18:0 | 9.64±0.11 | 48.79±0.9 | 11.01±0.06 | 64.19±0.59 |
| C18:1 | 20.79±0.01 | 105.24±0.76 | 15.62±0.08 | 91.08±0.16 |
| C18:2n-6 | 2.91±0.06 | 14.72±0.33 | 1.68±0.07 | 9.82±0.39 |
| C18:3n-6 | 0.41±0.01 | 2.1±0.06 | 1.05±0.04 | 6.15±0.26 |
| C18:3n-3 | 2.21±0.02 | 11.21±0.17 | 0.6±0.04 | 3.51±0.21 |
| C20:2 | - | - | 3.16±0.09 | 18.45±0.59 |
| C20:0 | 0.39±0.01 | 1.96±0.04 | 1.04±0.06 | 6.05±0.36 |
| C20:4n-6 | 2.86±0.02 | 14.47±0.22 | - | - |
| EPA | 8.33±0.1 | 42.14±0.18 | 8.03±0 | 46.85±0.2 |
| C22:0 | 0.42±0.01 | 2.11±0.09 | 1.16±0.04 | 6.78±0.26 |
| C22:2 | 0.17±0 | 0.85±0.02 | 1.36±0.08 | 7.93±0.44 |
| DHA | 14.37±0.06 | 72.71±0.69 | 9.66±0.11 | 56.3±0.41 |
| ∑SFA | 38.87±0.06 | 196.73±1.41 | 50.36±0.14 | 288.99±2.22 |
| ∑MUFA | 28.19±0.12 | 142.65±1.25 | 24.08±0.07 | 140.41±0.29 |
| ∑PUFA | 31.26±0.03 | 158.19±1.02 | 25.56±0.11 | 149.01±0.51 |
| ∑PUFA n-3 | 24.91±0.09 | 126.05±0.65 | 18.29±0.12 | 106.66±0.39 |
| ∑PUFA n-6 | 6.18±0.06 | 31.29±0.55 | 2.74±0.04 | 15.97±0.26 |
| ∑UFA | 59.44±0.15 | 300.84±2.27 | 49.64±0.14 | 289.42±0.45 |
| EPA+DHA | 22.69±0.09 | 114.84±0.53 | 17.69±0.1 | 103.15±0.22 |
Values are mean ± SEM (n = 3).
Disclaimer/Publisher’s Note: The statements, opinions and data contained in all publications are solely those of the individual author(s) and contributor(s) and not of MDPI and/or the editor(s). MDPI and/or the editor(s) disclaim responsibility for any injury to people or property resulting from any ideas, methods, instructions or products referred to in the content. |
© 2026 by the authors. Licensee MDPI, Basel, Switzerland. This article is an open access article distributed under the terms and conditions of the Creative Commons Attribution (CC BY) license.
Copyright: This open access article is published under a Creative Commons CC BY 4.0 license, which permit the free download, distribution, and reuse, provided that the author and preprint are cited in any reuse.


